mean, median, mode & range
DESCRIPTION
Mean, Median, Mode & Range. Outlier. An outlier is a data item that is much higher or much lower than items in a data set. 1, 2, 5, 27, 3, 4. Definition. Mean – the average of a group of numbers. 2, 5, 2, 1, 5. Mean = 3. BACK. Mean is found by evening out the numbers. 2, 5, 2, 1, 5. - PowerPoint PPT PresentationTRANSCRIPT

Mean, Mean, Median, Median, Mode Mode
& Range& Range

Outlier
• An outlier is a data item that is much higher or much lower than items in a data set.
• 1, 2, 5, 27, 3, 4

Definition
• MeanMean – the average of a group of numbers.
2, 5, 2, 1, 5Mean = 3Mean = 3
BACK

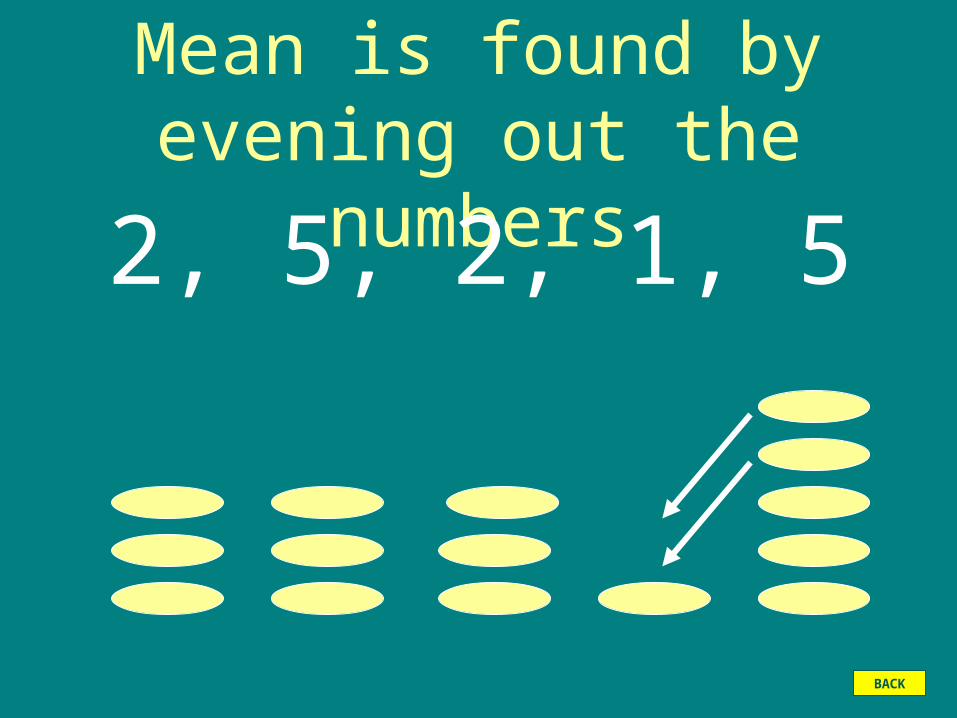
Mean is found by evening out the numbers
2, 5, 2, 1, 5
BACK
Mean is found by evening out the numbers
2, 5, 2, 1, 5
BACK

Mean is found by evening out the numbers
2, 5, 2, 1, 5mean = 3
BACK

How to Find the Mean of a Group of Numbers
• Step 1 – Add all the numbers.
8, 10, 12, 18, 22, 26
8+10+12+18+22+26 = 96
BACK

How to Find the Mean of a Group of Numbers
• Step 2 – Divide the sum by the number of addends.
8, 10, 12, 18, 22, 26
8+10+12+18+22+26 = 96 How many addends are there?
BACK

How to Find the Mean of a Group of Numbers
• Step 2 – Divide the sum by the number of addends.
6)96 sum# of addends1
636
6
63BACK

Definition
• MedianMedian – the middle number in a set of ordered numbers.
1, 3, 7, 10, 13Median = 7Median = 7
BACK

How to Find the Median in a Group of Numbers
• Step 1 – Arrange the numbers in order from least to greatest.
21, 18, 24, 19, 27
18, 19, 21, 24, 27
BACK

How to Find the Median in a Group of Numbers
• Step 2 – Find the middle number.
21, 18, 24, 19, 27
18, 19, 21, 24, 27
BACK

How to Find the Median in a Group of Numbers
• Step 2 – Find the middle number.
18, 19, 21, 24, 27
This is your median number.
BACK

How to Find the Median in a Group of Numbers
• Step 3 – If there are two middle numbers, find the mean of these two numbers.
18, 19, 21, 25, 27, 28
BACK

How to Find the Median in a Group of Numbers
• Step 3 – If there are two middle numbers, find the mean of these two numbers.
21+ 25 = 46
2) 46 23 median
BACK

What is the median of these numbers?
16, 10, 7
10
7, 10, 16
BACK

Definition• ModeMode – the number that
appears most often in a set of numbers.
1, 1, 3, 7, 10, 13Mode = 1Mode = 1
BACK

How to Find the Mode in a Group of Numbers
• Step 1 – Arrange the numbers in order from least to greatest.
21, 18, 24, 19, 18
18, 18, 19, 21, 24
BACK

How to Find the Mode in a Group of Numbers
• Step 2 – Find the number that is repeated the most.
21, 18, 24, 19, 18
18, 18, 19, 21, 24
BACK

Definition• RangeRange – the difference between
the greatest and the least value in a set of numbers.
1, 1, 3, 7, 10, 13Range = 12Range = 12
BACK
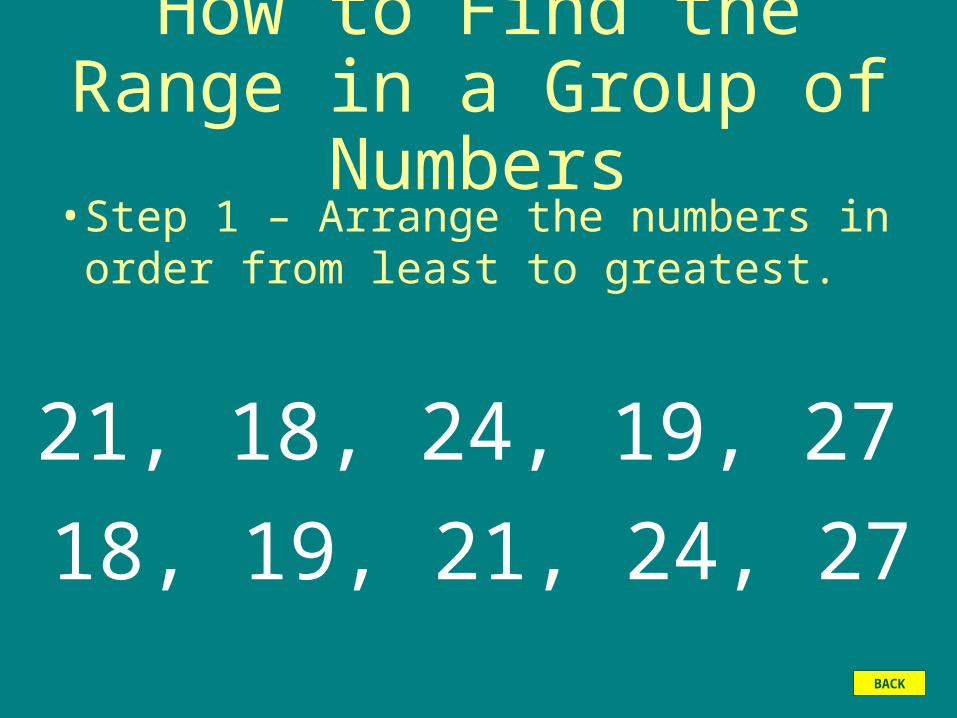
How to Find the Range in a Group of Numbers
• Step 1 – Arrange the numbers in order from least to greatest.
21, 18, 24, 19, 27
18, 19, 21, 24, 27BACK

How to Find the Range in a Group of Numbers
• Step 2 – Find the lowest and highest numbers.
21, 18, 24, 19, 27
18, 19, 21, 24, 27
BACK

How to Find the Range in a Group of Numbers
• Step 3 – Find the difference between these 2 numbers.
18, 19, 21, 24, 27
27 – 18 = 9The range is 9
BACK

4, 8, 8, 19, 29
What is the range?
29, 8, 4, 8, 19
29 – 4 = 25
BACK

What is the range?
22, 21, 27, 31, 21, 32
32 – 21 = 11
21, 21, 22, 27, 31, 32
BACK

What is the range?
31, 8, 3, 11, 19
31 – 3 = 28
3, 8, 11, 19, 31
BACK

What is the range?
23, 7, 9, 41, 19
41 – 7 = 34
7, 9, 23, 19, 41
BACK

17, 18, 19, 21, 24,26, 27The lower quartile (LQ) is the median of the lower half of the data.
The LQ is 18.The upper quartile (UQ) is the median of the upper half of the data. The UQ is 26.
The interquartile range is UQ-LQ
81826 BACK

BACK
13,15,18,19,22,25
Even amounts divide in 2 equal halves.
L.Q. U.Q.
71522 Range ileInterquart

Key SkillsUse data to construct a histogram.
Jose bowled 11 games: 172, 152, 168, 157,143, 175,144, 164, 142, 172, 168.
Histogram:
TRY THIS
Bowling scores
00.5
11.5
22.5
33.5
140's 150's 160's 170's

Find the median
76, 78, 82, 87, 88, 88, 89, 90, 91, 95
88
Find the median of this segment
82
76,78, 82
1st quartile
Find the median of this segment.
90
88, 89,90
3rd quartile

76, 78, 82, 87, 88, 88, 89, 90, 91, 95
Now for the box and whisker
65 70 75 80 85 90 95
Minimum End of 1st quartile
Median End of 3rd quartile
Maximum
100 105

Find the median
142, 143, 144, 152, 157, 164, 168, 168, 172, 172 175.
164
Find the median of this segment
144
142, 143, 144
1st quartile
Find the median of this segment.
172
168, 168, 172
3rd quartile


Mean, Mean, Median, Median, Mode Mode
& Range& Range
BACK