meadwestvaco 8_12q07earningsslides_final
TRANSCRIPT

SECOND QUARTER 2007 EARNINGSJohn A. Luke, Jr.Chairman and CEO
James A. BuzzardPresident
E. Mark RajkowskiSenior Vice President and CFO
August 1, 2007
2
Forward-Looking Statements
Certain statements in this document and elsewhere by management of the company that are neither reported financial results nor other historical information are “forward-looking statements”within the meaning of the Private Securities Litigation Reform Act of 1995. Such information includes, without limitation, the business outlook, assessment of market conditions, anticipated financial and operating results, strategies, future plans, contingencies and contemplated transactions of the company. Such forward-looking statements are not guarantees of future performance and are subject to known and unknown risks, uncertainties and other factors which may cause or contribute to actual results of company operations, or the performance or achievements of each company, or industry results, to differ materially from those expressed or implied by the forward-looking statements. In addition to any such risks, uncertainties and other factors discussed elsewhere herein, risks, uncertainties and other factors that could cause or contribute to actual results differing materially from those expressed or implied for the forward-looking statements include, but are not limited to, events or circumstances which affect the ability of MeadWestvaco to realize improvements in operating earnings expected from the company’s cost reduction initiative; competitive pricing for the company’s products; changes in raw materials pricing; energy and other costs; fluctuations in demand and changes in production capacities; changes to economic growth in the United States and international economies; government policies and regulations, including, but not limited to those affecting the environment and the tobacco industry; the company’s continued ability to reach agreement with its unionized employees on collective bargaining agreements; the company’s ability to execute its plans to divest or otherwise realize the greater value associated with its forestlands; adverse results in current or future litigation; currency movements; and other risk factors discussed in the company’s Annual Report on Form 10-K for the year ended December 31, 2006, and in other filings made from time to time with the SEC. MeadWestvaco undertakes no obligation to publicly update any forward-looking statement, whether as a result of new information, future events or otherwise. Investors are advised, however, to consult any further disclosures made on related subjects in the company’s reports filed with the SEC.
3
John A. Luke, Jr.Chairman and Chief Executive Officer

4
Second Quarter Highlights
2Q07 vs. 2Q06
Sales $1.7 billion
Profit from Primary Segments $149 million 20%
9%
• Strong price/mix and productivity gains in mill-based businesses
• Optimizing consumer packaging platform; targeting commercial success
• Calmar performing well
• Solid quarter for Consumer & Office Products
5
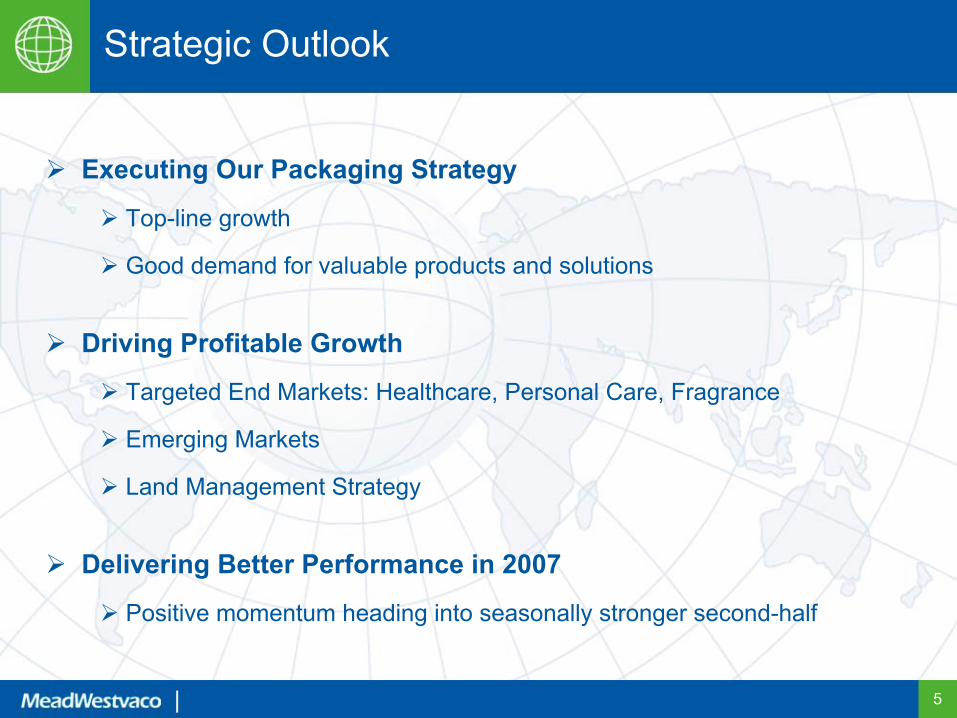
Strategic Outlook
Executing Our Packaging Strategy
Top-line growth
Good demand for valuable products and solutions
Driving Profitable Growth
Targeted End Markets: Healthcare, Personal Care, Fragrance
Emerging Markets
Land Management Strategy
Delivering Better Performance in 2007
Positive momentum heading into seasonally stronger second-half
6
James A. BuzzardPresident
7
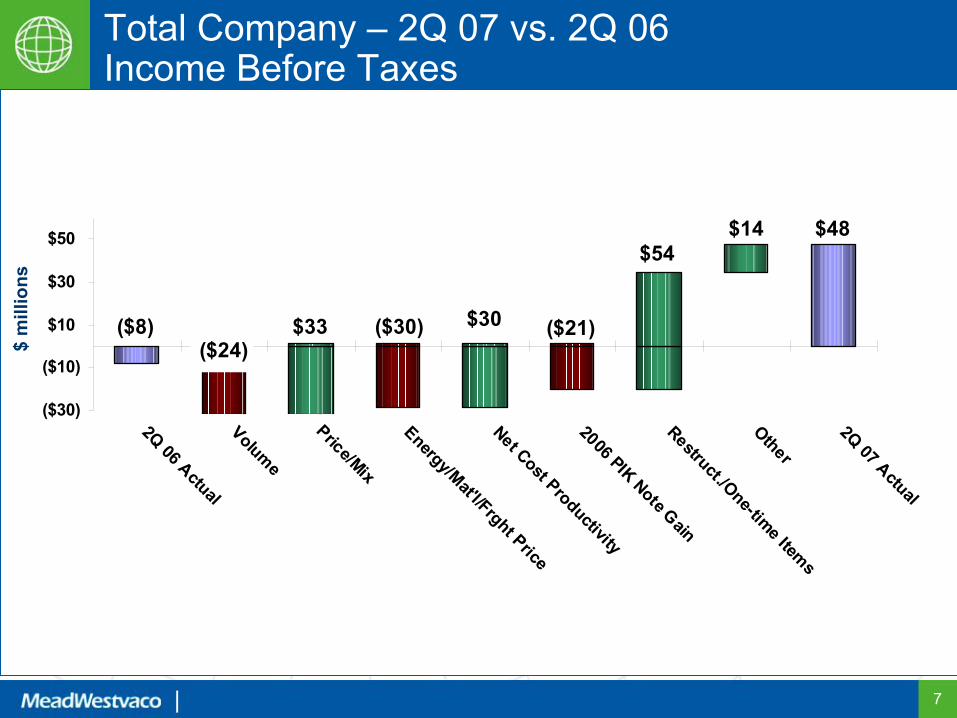
Total Company – 2Q 07 vs. 2Q 06Income Before Taxes
($8) ($24)
$33 ($30) $30
$14$54
($21)
$48
($30)
($10)
$10
$30
$50
2Q 06 ActualVolume
Price/Mix
Energy/Mat'l/Frght Price
Net Cost Productivity2006 PIK Note GainRestruct./One-time Items
Other
2Q 07 Actual$
mill
ions

8
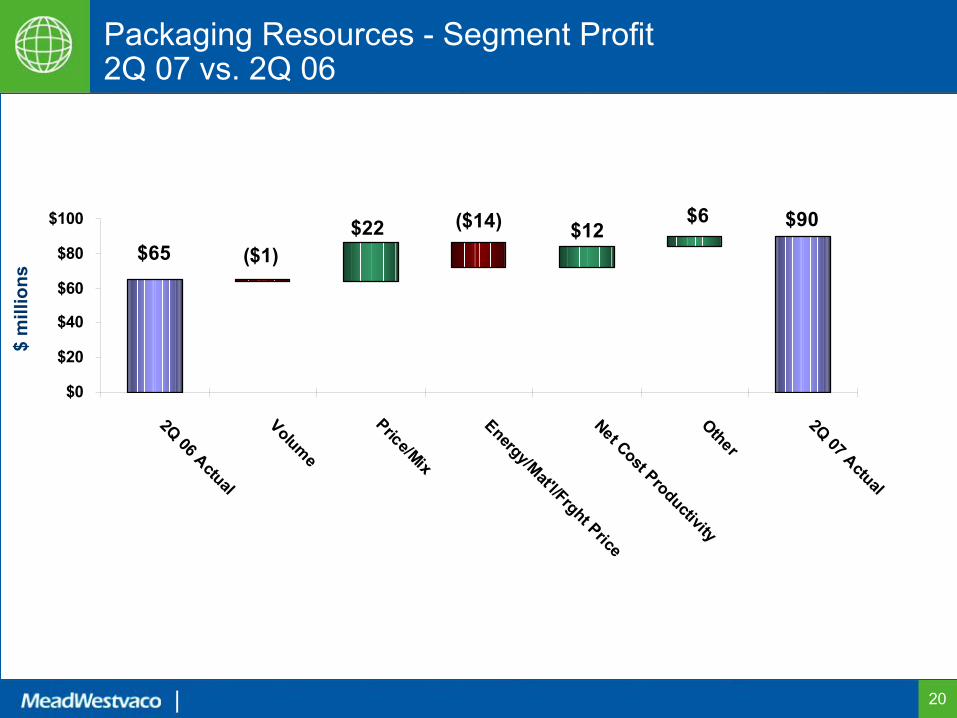
Packaging Resources
2Q07 vs. 2Q06
Segment Sales $773 million
Segment Profit $90 million 38%
3%
• Strong pricing across grades and higher productivity more than offset higher input costs, mostly raw materials, and slightly lower volume.
• Volume strength in high-value tobacco and aseptic grades offset by declines in other lower value grades
• Q3 Outlook – Expect solid year-over-year segment profit improvement in Q3 from modest volume growth and continued gains in price/mix and productivity partially offset by higher input costs

9
2Q07 vs. 2Q06
Segment Sales $595 million
Segment Profit $24 million
Consumer Solutions
4%
• Sales increase primarily due to addition of Calmar
• Cost savings and the addition of Calmar more than offset declines in volume, mostly due to market-related declines in global media, lower price/mix and higher input costs, mostly raw materials
• Profitability improvement in beverage and healthcare driven by better pricing and cost savings
• MeadWestvaco Calmar continues to perform well
• Q3 Outlook – Modest year-over-year growth due to stronger beverage, healthcare, and specialty media packaging, solid performance in spray and dispenser business, and impact of productivity initiatives already in place. Expect continued market-related volume declines in media driven by CD music.
19%

10
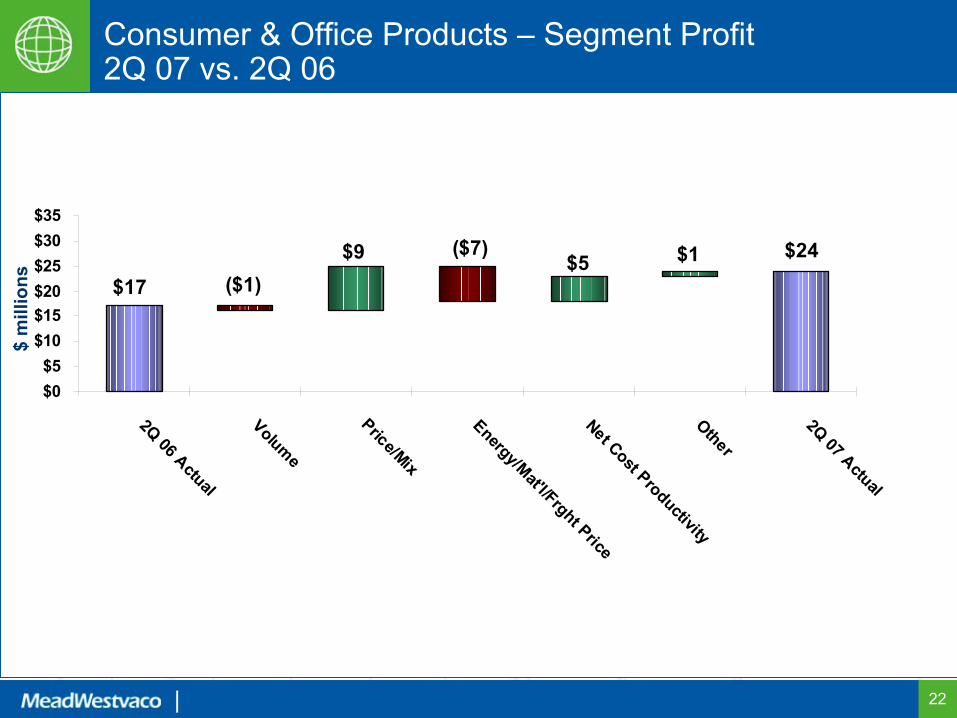
Consumer & Office Products
• Increased profitability due to improved productivity and mix, partially offset by higher input costs, mostly raw materials
• Solid early shipments for North American Back-to-School season.
• Q3 Outlook – Segment profit similar to prior year. Continued benefits from improved product mix partially offset by lower overall volumes and higher costs for raw materials.
2Q07 vs. 2Q06
Segment Sales $267 million
Segment Profit $24 million 41%
3%
11
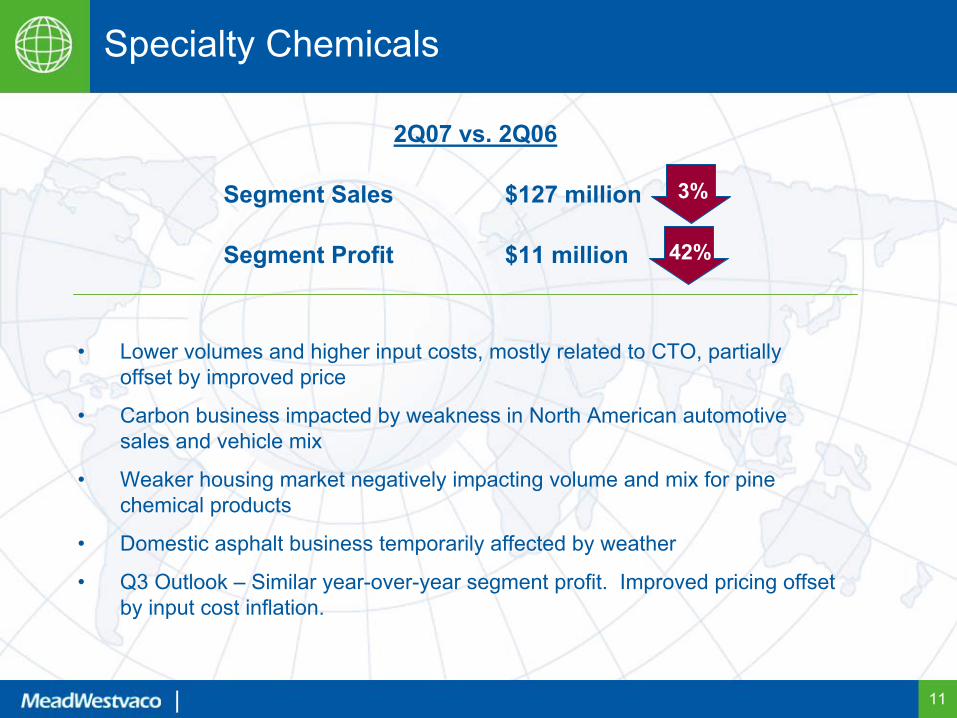
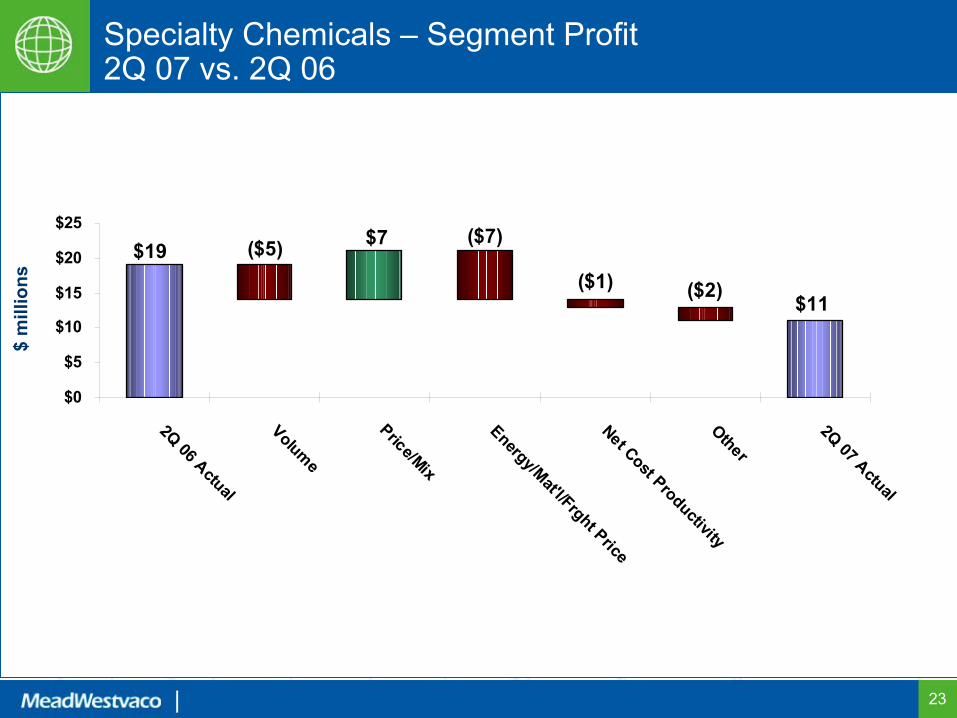
Specialty Chemicals
• Lower volumes and higher input costs, mostly related to CTO, partially offset by improved price
• Carbon business impacted by weakness in North American automotive sales and vehicle mix
• Weaker housing market negatively impacting volume and mix for pine chemical products
• Domestic asphalt business temporarily affected by weather
• Q3 Outlook – Similar year-over-year segment profit. Improved pricing offset by input cost inflation.
2Q07 vs. 2Q06
Segment Sales $127 million
Segment Profit $11 million 42%
3%
12
E. Mark RajkowskiSenior Vice President and CFO

13
Key Financial Information
(In millions, pre-tax) 2Q 2007 2Q 2006 Change
Sales 1,706$ 1,570$ 9%Adjusted Gross Margin 1 310 278 12%Adjusted SG&A 2 205 198 4%Profit from Primary Segments 3 149 124 20%Adjusted EBIT 4 116$ 83$ 40% Adjusted Gross Margin % 18.2% 17.7% 50 bps
Adjusted SG&A % 12.0% 12.6% (60) bps
1 Adjusted gross margin excludes restructuring charges and one-time costs of $1.7 million and $25.7 million for the second quarter ended 2007 and 2006, respectively. 2 Adjusted SG&A expense excludes restructuring charges and one-time costs of $14.7 million and $35.6 million for the second quarter ended 2007 and 2006, respectively.
4 Adjusted EBIT excludes restructuring charges and one-time costs of $16.4 million and $70.1 million for the second quarter ended 2007 and 2006, respectively. Adjusted EBIT also excludes a gain on the sale of a PIK note of $21.1M in the second quarter ended 2006. Adjusted EBIT also excludes interest income of $3.7 million and $8.1 million in 2007 and 2006, respectively. Adjusted EBIT includes remaining portion of Other Income/(Expense) after exclusion of interest expense.
3 Profit from primary segments defined as the sum of the segment profits of the company's primary business segments (Packaging Resources, Consumer Solutions, Consumer and Office Products, and Specialty Chemicals) and excludes Corporate and Other profit/(loss).
14
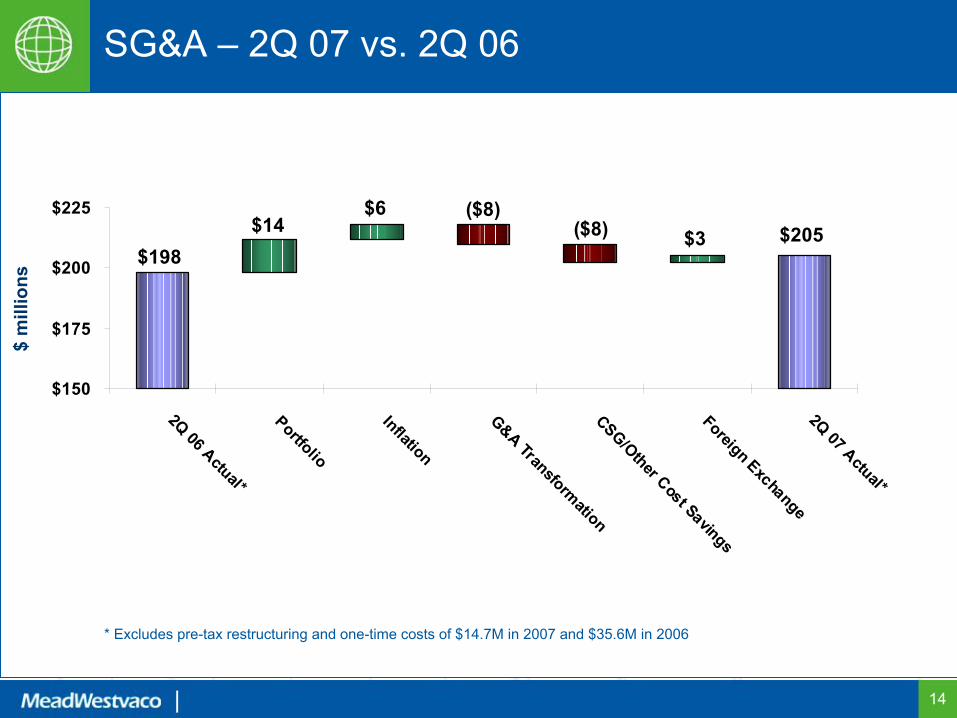
SG&A – 2Q 07 vs. 2Q 06
* Excludes pre-tax restructuring and one-time costs of $14.7M in 2007 and $35.6M in 2006
$205 $3($8) ($8) $6
$14 $198
$150
$175
$200
$225
2Q 06 Actual*
Portfolio
Inflation
G&A TransformationCSG/Other Cost SavingsForeign Exchange2Q 07 Actual*
$ m
illio
ns

15
Appendix
16
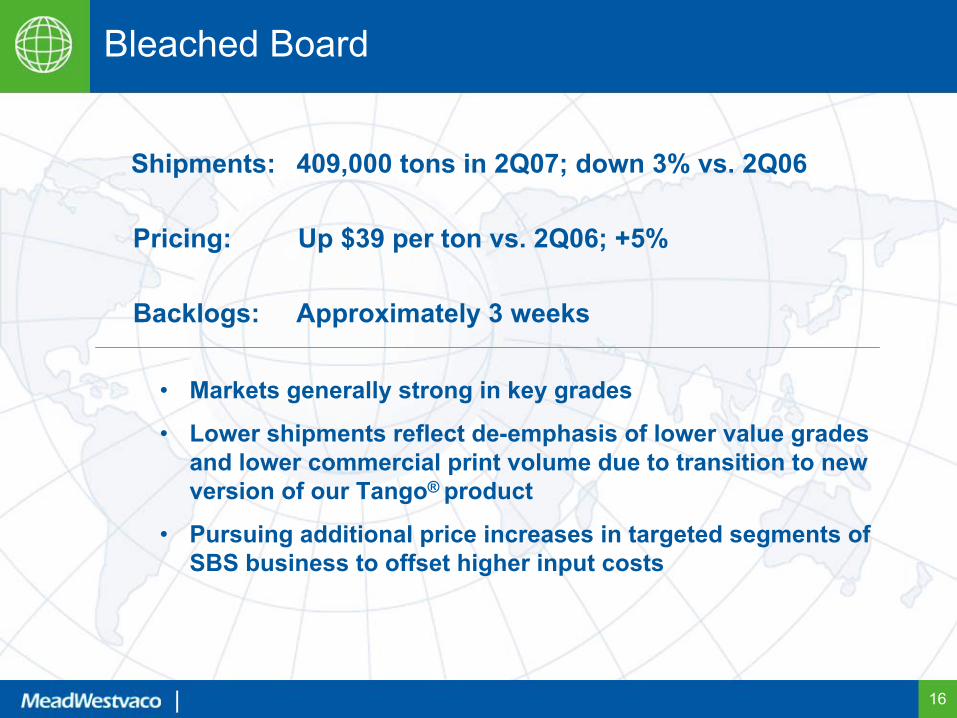
Bleached Board
• Markets generally strong in key grades
• Lower shipments reflect de-emphasis of lower value grades and lower commercial print volume due to transition to new version of our Tango® product
• Pursuing additional price increases in targeted segments of SBS business to offset higher input costs
Shipments: 409,000 tons in 2Q07; down 3% vs. 2Q06
Pricing: Up $39 per ton vs. 2Q06; +5%
Backlogs: Approximately 3 weeks
17
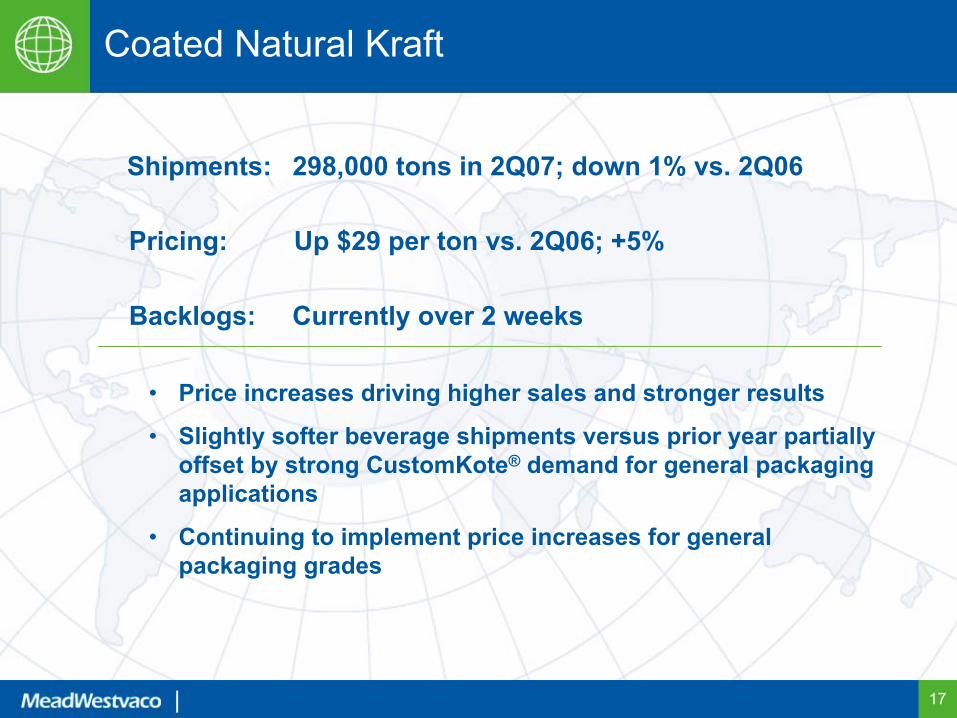
Coated Natural Kraft
Shipments: 298,000 tons in 2Q07; down 1% vs. 2Q06
Pricing: Up $29 per ton vs. 2Q06; +5%
Backlogs: Currently over 2 weeks
• Price increases driving higher sales and stronger results
• Slightly softer beverage shipments versus prior year partially offset by strong CustomKote® demand for general packaging applications
• Continuing to implement price increases for general packaging grades

18
Unbleached Kraft Paperboard
• Strong pricing improvements for export linerboard
• Pricing and backlog outlook remain strong for all grades
• Volume increases due to strength in export linerboard and general packaging grades
Shipments: 207,000 tons in 2Q07; up 6% vs. 2Q06
Pricing: Up $21 per ton vs. 2Q06; +4%
Backlogs: Currently at 4 weeks
19
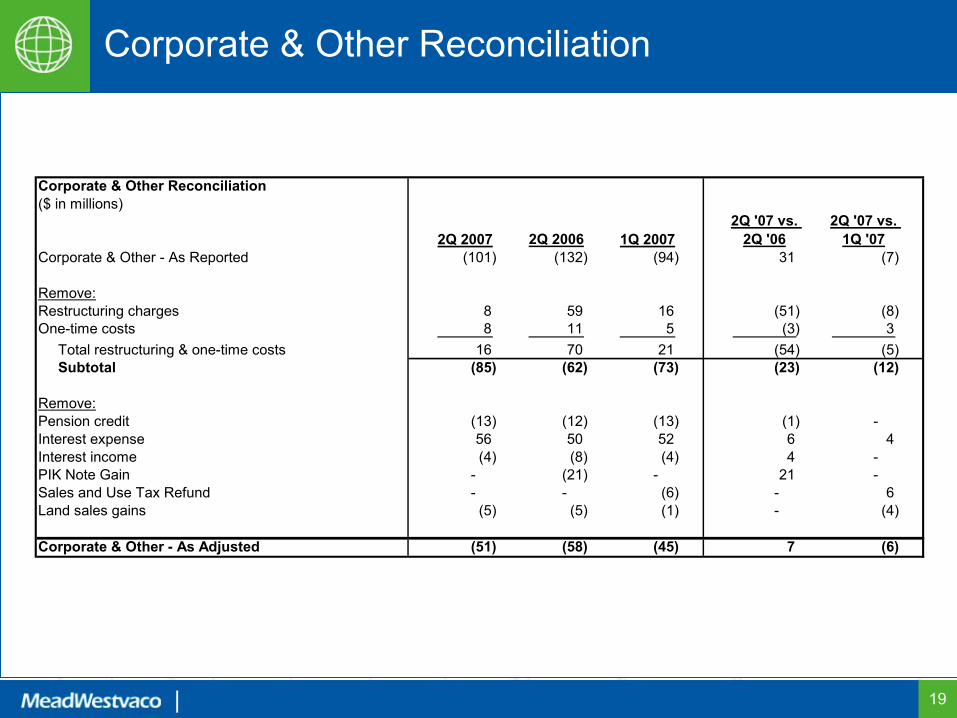
Corporate & Other Reconciliation
Corporate & Other Reconciliation($ in millions)
2Q 2007 2Q 2006 1Q 20072Q '07 vs.
2Q '062Q '07 vs.
1Q '07Corporate & Other - As Reported (101) (132) (94) 31 (7)
Remove:Restructuring charges 8 59 16 (51) (8) One-time costs 8 11 5 (3) 3 Total restructuring & one-time costs 16 70 21 (54) (5) Subtotal (85) (62) (73) (23) (12)
Remove:Pension credit (13) (12) (13) (1) - Interest expense 56 50 52 6 4 Interest income (4) (8) (4) 4 - PIK Note Gain - (21) - 21 - Sales and Use Tax Refund - - (6) - 6 Land sales gains (5) (5) (1) - (4)
Corporate & Other - As Adjusted (51) (58) (45) 7 (6)
20
Packaging Resources - Segment Profit2Q 07 vs. 2Q 06
($14) $90 $6 $12
($1) $22
$65
$0
$20
$40
$60
$80
$100
2Q 06 Actual
Volume
Price/Mix
Energy/Mat'l/Frght PriceNet Cost ProductivityOther
2Q 07 Actual
$ m
illio
ns

21
Consumer Solutions – Segment Profit2Q 07 vs. 2Q 06
$ m
illio
ns
$23
($2)
($17)
($4)
$12 $24
$12
$0$5
$10$15$20$25$30$35
2Q 06 Actual
Volume
Price/Mix
Energy/Mat'l/Frght PriceNet Cost ProductivityOther
2Q 07 Actual
22
Consumer & Office Products – Segment Profit2Q 07 vs. 2Q 06
$17
$9 ($1)
($7) $5 $24 $1
$0$5
$10$15$20$25$30$35
2Q 06 Actual
Volume
Price/Mix
Energy/Mat'l/Frght PriceNet Cost ProductivityOther
2Q 07 Actual
$ m
illio
ns
23
Specialty Chemicals – Segment Profit2Q 07 vs. 2Q 06
$19 $7($5) ($7)
($1) $11 ($2)
$0
$5
$10
$15
$20
$25
2Q 06 Actual
Volume
Price/Mix
Energy/Mat'l/Frght PriceNet Cost ProductivityOther
2Q 07 Actual
$ m
illio
ns