meadowlands environmental research institute
TRANSCRIPT

New Jersey Meadowlands Commission
Meadowlands EnvironmentalResearch Institute
New Jersey
Screening Level Ecological RiskAssessment of Contamination in WetlandsConsidered for Restoration in Hackensack
Meadowlands District
Final Report
Photo courtesy of NJMC/MERI
ENSR InternationalMarch 2004
ENSR Job # 08508-321
This Project was funded by an U.S. Environmental Protection Agency WetlandsProtection State Development Grant (Agreement No. CD98256301-1).

March, 2004iJ:\Project\meri\Report\revisedreport\Report_Final.doc
TABLE OF CONTENTS
TABLE OF CONTENTS....................................................................................................................................... I
LIST OF TABLES...............................................................................................................................................IV
LIST OF FIGURES.............................................................................................................................................VI
LIST OF ACRONYMS.......................................................................................................................................VII
1.0 INTRODUCTION........................................................................................................................................1-1
2.0 SAMPLING PROGRAM ............................................................................................................................2-1
2.1 SAMPLING DESIGN OVERVIEW .............................................................................................................2-12.2 STUDY AREA .......................................................................................................................................2-12.3 SEDIMENT SAMPLING LOCATIONS ........................................................................................................2-22.4 SAMPLE COLLECTION METHODS..........................................................................................................2-4
2.4.1 Sediment for Bulk Chemistry Analysis and Toxicity Testing .......................................................2-42.4.2 Sediments for Benthic Analysis ....................................................................................................2-4
2.5 FIELD MEASUREMENTS........................................................................................................................2-52.6 BENTHIC SAMPLE ANALYSIS METHODS ................................................................................................2-52.7 SEDIMENT CHEMICAL ANALYSIS METHODS...........................................................................................2-52.8 SEDIMENT TOXICITY TESTING METHODS ..............................................................................................2-6
2.8.1 Test Organisms.............................................................................................................................2-62.8.2 Negative Control Sediment...........................................................................................................2-72.8.3 Test Sediments .............................................................................................................................2-72.8.4 Overlying Water ............................................................................................................................2-82.8.5 General Testing Protocol ..............................................................................................................2-8
3.0 RESULTS ...................................................................................................................................................3-1
3.1 FIELD MEASUREMENTS........................................................................................................................3-13.2 BENTHIC COMMUNITY COMPOSITION....................................................................................................3-13.3 BULK SEDIMENT CHEMISTRY ...............................................................................................................3-6
3.3.1.1 2003 Sediment Sampling ..................................................................................................................... 3-63.3.1.2 Historic Sediment Sampling ................................................................................................................. 3-6
3.4 TOXICITY TESTING.............................................................................................................................3-103.4.1 Toxicity Testing Results..............................................................................................................3-113.4.2 Application and Uncertainty of Sediment Toxicity Tests............................................................3-11
4.0 ECOLOGICAL RISK ASSESSMENT .......................................................................................................4-1
4.1 INTRODUCTION ....................................................................................................................................4-14.1.1 SLERA Guidance and Organization.............................................................................................4-1

March, 2004iiJ:\Project\meri\Report\revisedreport\Report_Final.doc
4.1.2 Organization of the SLERA ..........................................................................................................4-24.2 PROBLEM FORMULATION .....................................................................................................................4-3
4.2.1 Selection of Ecological Receptors................................................................................................4-44.2.1.1 Wetlands Habitats of Interest ............................................................................................................... 4-44.2.1.2 Ecological Receptors of Interest........................................................................................................... 4-44.2.1.3 Species of Special Interest................................................................................................................... 4-64.2.1.4 Selected Representative Ecological Receptors ................................................................................... 4-7
4.2.2 Selection of Exposure Pathways..................................................................................................4-84.2.2.1 Sources of Contaminants ..................................................................................................................... 4-94.2.2.2 Exposure Pathways.............................................................................................................................. 4-9
4.2.3 Identification of COPCs...............................................................................................................4-104.2.3.1 Approach for Identifying COPCs ........................................................................................................ 4-104.2.3.2 Results of COPC Selection ................................................................................................................ 4-11
4.2.4 Development of the Conceptual Site Model (CSM)...................................................................4-124.2.5 Selection of Biological Endpoints to be Assessed.....................................................................4-12
4.3 ANALYSIS OF EXPOSURE AND EFFECTS..............................................................................................4-134.3.1 Development of Exposure Point Concentrations (EPCs)..........................................................4-144.3.2 Wetland Vegetation Receptor Evaluation ..................................................................................4-144.3.3 Aquatic and Benthic Receptor Evaluation..................................................................................4-15
4.3.3.1 Comparison to Sediment Benchmarks............................................................................................... 4-164.3.3.2 Comparison to Surface Water Quality Criteria ................................................................................... 4-174.3.3.3 Critical Body Residue Benchmark Comparison ................................................................................. 4-17
4.3.4 Wildlife Receptor Exposure Analysis .........................................................................................4-184.3.4.1 Food Chain Modeling ......................................................................................................................... 4-194.3.4.2 Comparison to Wildlife Toxicity Reference Values and Benchmarks ................................................ 4-19
4.4 RISK CHARACTERIZATION ..................................................................................................................4-204.4.1 Endpoint # 1 – Protection of aquatic wetland plant species ......................................................4-214.4.2 Endpoint # 2 - Protection of Estuarine Benthic Macroinvertebrate Receptors .........................4-22
4.4.2.1 Sediment Screening Analysis............................................................................................................. 4-224.4.2.2 Critical Body Residues (CBRs) .......................................................................................................... 4-23
4.4.3 Endpoint #3 - Protection of Estuarine Surface Water Receptors ..............................................4-244.4.4 Endpoint # 4 - Protection of Semi-Aquatic Wildlife Receptors ..................................................4-25
4.4.4.1 Mink .................................................................................................................................................... 4-254.4.4.2 Muskrat............................................................................................................................................... 4-264.4.4.3 Mallard................................................................................................................................................ 4-264.4.4.4 Great blue heron................................................................................................................................. 4-26
4.5 UNCERTAINTY ...................................................................................................................................4-264.5.1 Uncertainty Associated with Site Characterization ....................................................................4-274.5.2 Uncertainty Associated with Analyte Screening/Selection Process..........................................4-284.5.3 Uncertainty Associated with Exposure Assessment..................................................................4-294.5.4 Uncertainty Associated with Ecological Effects .........................................................................4-304.5.5 Uncertainty Associated with Risk Characterization ...................................................................4-30
4.6 SLERA RISK CONCLUSIONS .............................................................................................................4-32
5.0 WILDLIFE RISK CURVES.........................................................................................................................5-1

March, 2004iiiJ:\Project\meri\Report\revisedreport\Report_Final.doc
5.1 CONSTRUCTION OF THE WILDLIFE RISK CURVES..................................................................................5-15.2 RISK CURVES FOR WETLAND WILDLIFE RECEPTORS............................................................................5-2
6.0 RELATIONSHIPS BETWEEN BENTHIC COMMUNITY, CONTAMINANTS, AND TOXICITY.............6-1
6.1 BENTHIC COMMUNITY AND SEDIMENT TOXICITY ...................................................................................6-16.2 BENTHIC COMMUNITY AND SEDIMENT CHEMISTRY................................................................................6-26.3 ANALYSIS CONCLUSIONS.....................................................................................................................6-2
7.0 UNCERTAINTY AND LIMITATIONS........................................................................................................7-1
8.0 CONCLUSIONS.........................................................................................................................................8-1
9.0 REFERENCES CITED...............................................................................................................................9-1
APPENDIX A: FIELD LOG, CHAIN OF CUSTODY SHEETS, PHOTO LOG
APPENDIX B: LABORATORY DATA REPORTS
APPENDIX C: B-H LABORATORY TOXICITY TESTING REPORT
APPENDIX D: COVE CORPORATION BENTHIC ANALYSIS REPORT
APPENDIX E: SCREENING LEVEL ECOLOGICAL RISK ASSESSMENT SUPPORTING DATA
APPENDIX F: NJMC/MERI DATABASE REPORT

March, 2004ivJ:\Project\meri\Report\revisedreport\Report_Final.doc
LIST OF TABLES
Table 2-1. Methods for Laboratory MeasurementsTable 3-1. Field Measurements of Water Quality at the time of Sediment Sampling September 15 - 17,
2003 Table 3-2. Invertebrate taxa found in sediment samples collected from Kearny Marsh and Riverbend
Marsh in September 2003. Table 3-3. Community parameters for recent Kearny and Riverbend Marsh samples and for historical
samples collected at Secaucus High School, Oritani, and Mill Creek marshes. Table 3-4. Dominance tables for Kearny and Riverbend Marshes. Table 3-5. Summary of species and total counts found at five marshes, Kearny, Mill Creek, Oritani,
Riverbend, and Secaucus High School Marshes.Table 3-6. General Sediment Chemistry For Five NJ Meadowlands MarshesTable 3-7. Sediment Chemistry Summary Statistics For Five NJ Meadowlands MarshesTable 3-8. Summary of Survival and Growth Data – 28-Day (H. azteca) and 10-Day (N.
arenaceodentata) Whole Sediment Toxicity Test - Saline Conditions.Table 3-9. Summary of Survival and Growth Data – 28-Day (H. azteca) and 10-Day (C. tentans) Whole
Sediment Toxicity Test - with MHRW.Table 4-1. Assessment and Measurement EndpointsTable 4-2. Sediment Summary Statistics Across All Wetlands for Selected COPCsTable 4-3. Sediment and Soil Benchmark Screening Values Table 4-4a. Phytotoxicity Screening - All 2003 Study WetlandsTable 4-4b. Historic Data Summary - Comparison to Phytotoxicity CriteriaTable 4-5a. Sediment Benchmark Screening - Kearny Freshwater Marsh Table 4-5b. Sediment Benchmark Screening - Oritani Marsh Table 4-5c. Sediment Benchmark Screening - Riverbend Marsh Table 4-5d. Sediment Benchmark Screening - Sawmill Creek Marsh Table 4-5e. Sediment Benchmark Screening - Secaucus High School MarshTable 4-6. Metals Surface Water Screening ValuesTable 4-7. Historic Inorganic Surface Water Screening - All WetlandsTable 4-8. Uptake Factors and Modeled Tissue ConcentrationsTable 4-9. Selected Critical Body Residues Compiled from Literature Table 4-10. Comparison of Modeled Invertebrate Tissue Concentrations to Selected Critical Body
ResiduesTable 4-11. Exposure Parameters For Wildlife ReceptorsTable 4-12. Toxicity Reference ValuesTable 4-13. Summary Of Modeled Total Daily Dose (TDD) and Toxicity Reference Values (TRVs) for
Wildlife ReceptorsTable 4-14. Summary of Maximum Ecological Effect Quotients – SedimentTable 4-15. Summary of Severe Effect Level Maximum Ecological Effect Quotients

March, 2004vJ:\Project\meri\Report\revisedreport\Report_Final.doc
Table 4-16. Summary Of Potential Risks To Wildlife - Maximum ExposureTable 5-1. Percentile Concentrations for COPCs Included in Wildlife Risk CurvesTable 5-2. Modeled Tissue Concentrations For Wetland Receptors – Wildlife Risk CurvesTable 5-3. Summary Of Potential Risks To Wildlife At Multiple ConcentrationsTable 5-4. Summary Of Potential Risks To Wildlife At Multiple Concentrations - No Surface Water
ContributionTable 5-5. Evaluation of the Impact of Surface Water on Risk to Mink and HeronTable 6-1. Screening Risk Quotients for Five Marshes

March, 2004viJ:\Project\meri\Report\revisedreport\Report_Final.doc
LIST OF FIGURES
Figure 2-1. Ecological Risk Assessment Study Sites in the Hackensack Meadowlands DistrictFigure 2-2. Riverbend Wetland Preserve Marsh Sediment Sampling LocationsFigure 2-3. Secaucus High School Marsh Sediment Sampling LocationsFigure 2-4. Sawmill Creek Wildlife Management Area Sediment Sampling LocationsFigure 2-5. Oritani Marsh Sediment Sampling LocationsFigure 2-6. Kearny Freshwater Marsh Sediment Sampling Locations.Figure 4-1. U.S. EPA Superfund Ecological Risk Assessment ProcessFigure 4-2. Conceptual Site Model – Meadowlands Wetland Risk AssessmentFigure 5-1. Wildlife Risk Curve for ArsenicFigure 5-2. Wildlife Risk Curve for CadmiumFigure 5-3. Wildlife Risk Curve for ChromiumFigure 5-4. Wildlife Risk Curve for CopperFigure 5-5. Wildlife Risk Curve for LeadFigure 5-6. Wildlife Risk Curve for MercuryFigure 5-7. Wildlife Risk Curve for ZincFigure 5-8. Wildlife Risk Curve for Alpha ChlordaneFigure 5-9. Wildlife Risk Curve for 4,4-DDEFigure 5-10. Wildlife Risk Curve for Total PAHsFigure 5-11. Wildlife Risk Curve for Total PCBsFigure 5-12 Variation in Arsenic HQs With and Without Surface Water ContributionFigure 5-13 Variation in Lead HQs With and Without Surface Water ContributionFigure 5-14 Variation in Zinc HQs With and Without Surface Water ContributionFigure 5-15 Variation in tPCB HQs With and Without Surface Water ContributionFigure 6-1. Whole Sediment Toxicity Test and COPC Low Effect Level (LEL) Ecological EffectsQuotient (EEQ)Figure 6-2. Benthic Diversity/Evenness and COPC Ecological Effects Quotient (EEQ)Figure 6-3. Benthic Density/Number of Species and COPC Ecological Effects Quotient (EEQ)

March, 2004viiJ:\Project\meri\Report\revisedreport\Report_Final.doc
AKNOWLEDGEMENTS
This Project was funded by an U.S. Environmental Protection Agency Wetlands Protection StateDevelopment Grant (Agreement No. CD98256301-1). The ENSR project team wishes to thank the NJMeadowlands Commission and Meadowlands Environmental Research Institute for their support andcontributions to this project.

March, 2004viiiJ:\Project\meri\Report\revisedreport\Report_Final.doc
LIST OF ACRONYMS
°C Degrees CentigradeAFDW Ash Free Dry Weight As ArsenicASTM American Society of Testing and MaterialsAUF Area Use FactorAWQC Ambient Water Quality Criteria BAF Bioaccumulation FactorCBR Critical Body ResidueCd CadmiumCOC Chain-Of-Custody COPC Chemicals Of Potential Concern Cr ChromiumCSM Conceptual Site Model Cu CopperDQA Data Quality Assessment DQO Data Quality ObjectiveED Exposure DurationEEQ Environmental Effects QuotientEPC Exposure Point ConcentrationERA Ecological Risk AssessmentERED Environmental Residue Effects Database ER-L Effects Range-Low ER-M Effects Range-Median GC/MS Gas Chromatography/ Mass Spectrometry GIS Geographical Information Service H’ Shannon-Wiener Diversity Indices Hg MercuryHQ Hazard Quotient ID Identification IRM Information Resource Management J’ Pielou’s Evenness KFM Kearny Marsh L Least LCS Laboratory Control SampleLCV Lowest Chronic ValueLEL Low Effect LevelLOAEL Low Observed Adverse Effect Levels LOEL Lowest Observed Effect Levels M Moderate MERI Meadowlands Environmental Research InstituteMS/MSD Matrix Spike/Matrix Spike DuplicateNi NickelNJMC New Jersey Meadowlands CommissionNOAEL No Observed Adverse Effect Levels NOED No Observable Effects Dose ORM Oritani Marsh ORNL Oak Ridge National Laboratory PAH Polynuclear Aromatic Hydrocarbons

March, 2004ixJ:\Project\meri\Report\revisedreport\Report_Final.doc
Pb LeadPBT Persistent, Bioaccumulative, ToxicPCB Polychlorinated Biphenyls PE Performance Evaluation PEC Probable Effect Concentration PRG Potential Remedial GoalsPML Protective Media LevelPT Proficiency Testing QA Quality AssuranceQA/QC Quality Assurance/Quality ControlQAM Quality Assurance ManagerQAPP Quality Assurance Project PlanQC Quality ControlRBM Riverbend Marsh RPD Relative Percent Difference RUF Root Uptake FactorS Severe SAW Sawmill Creek Wildlife Management AreaSCV Secondary Chronic ValueSEL Severe Effect LevelSHS Secaucus High School Marsh SLERA Screening-Level Ecological Risk Assessment SOP Standard Operating ProcedureSQL Sample Quantitation Limit TDD Total Daily Dosage TEC Threshold Effect ConcentrationTOC Total Organic Carbon TRVs Toxicity Reference Values U.S. EPA U.S. Environmental Protection AgencyUSACE U.S. Army Corps of EngineersWMA Wildlife Management Area Zn Zinc

March, 2004xJ:\Project\meri\Report\revisedreport\Report_Final.doc
EXECUTIVE SUMMARY
The NJMC owns or manages approximately 3400 acres of wetlands (Figure 1), and is activelyacquiring more wetlands for preservation and/or restoration. The objective of this Project is to assessthe ecological risks from contamination at these sites to help guide decisions about restoration of thesesites and to build capacity to comprehensively assess additional wetlands in the future. The Projectincluded the development of a database of historic data, a screening level ecological risk assessment(SLERA) for several trophic levels, development of rapid assessment curves based on food webmodeling, and efforts to correlate contaminant concentrations with measures of benthic communityhealth and laboratory measured toxicity.
The objective of this Project is to assess the ecological risks from contamination at the Meadowlandswetlands to help guide decisions about restoration of these wetlands and to develop a capacity toassess additional wetlands which may be considered for acquisition or restoration.
A sampling program was completed to supplement existing data available from previous recent wetlandstudies. Five study wetland were selected for sampling based on a review of historic data, and includedKearny Freshwater Marsh (KFM), Oritani Marsh (ORM), Riverbend Marsh Wetland Preserve (RBM),Sawmill Creek Wildlife Management Area (SAW), and Secaucus High School Marsh (SHS). Samplinglocations are identified in the table below. Samples were collected for toxicity testing and bulkchemistry analysis. Samples were also collected at RBM and KFM for benthic community analysis, asno benthic data had been previously collected for these wetlands. The sediment samples wereanalyzed for total metals (cadmium, Cd; chromium, Cr; copper, Cu; mercury, Hg; lead, Pb; nickel, Ni;zinc, Zn; arsenic, As), pesticides, polychlorinated biphenyls (PCB’s), polynuclear aromatichydrocarbons (PAHs), total organic carbon (TOC), grain size, % moisture and pH by the MERILaboratory (Cd, Cr, Cu, Fe, Pb, Ni, Zn, Hg, grain size) and AccuTest Laboratory (all other parameters).Toxicity testing included both 28-day and 10-day growth and survival tests. Study design and methodswere detailed in a Quality Assurance Project Plan (QAPP) that was approved by U.S. EnvironmentalProtection Agency (U.S. EPA) prior to sampling.
Location DescriptionRBM-01 In open water 30’ wide area bounded by common reed (Phragmites australis)
and punctuated by Spartina alterniflora hummocks.RBM -02 In mosquito ditch, 6-8’ wide and bounded by thickly growing PhragmitesSHS -01 Along the main channel within the marshSHS -02 Along the main channel within the marshSHS -03 Along the main channel within the marshSAW -01 Northeast side of channel (roughly 80’ wide) approximately 1500 feet from
confluence with the Hackensack RiverSAW -02 Open water area near western spur of NJ TurnpikeORM -01 In a tidal creek along the southwest border of the marsh

March, 2004xiJ:\Project\meri\Report\revisedreport\Report_Final.doc
Location DescriptionORM -02 In a tidal pool along the southeast side of the marshKFM -01 Along western edge of the marsh near cattails and loosestrifeKFM -02 In middle of the wetland in open waterKFM -03 Near the railroad bed at the northern end of the site near islands of Phragmites.
The following provides a brief summary of key conclusions drawn from this project:
Benthic Community
The benthic community found at Riverbend included faunal elements that are typical of high estuarine,low salinity marshes throughout the eastern United States. There is no evidence of pollution or stress-related indicator species. The benthic community at Kearny Marsh appeared to be impoverished.More than 55 benthic taxa have been identified from the five marshes for which benthic data areavailable. All of these taxa observed during the current Project and past studies are commonly found inestuarine systems. The most commonly represented groups included 12 insects, 12 polychaetes, 8amphipods, 5 isopods, 4 gastropods, and 3 bivalves. Density, diversity, and evenness variedconsiderably within the wetlands sampled as part of past studies (Mill Creek, Oritani, and SecaucusHigh School marshes) with an order of magnitude difference in density between locations in a givenwetland. Previous studies included sampling of mudflats, tidal creeks, marsh plain, ponded/openwater, channels, high marsh, and mosquito ditches. Samples collected as part of this study wereprimarily located in open water, mosquito ditches, and/or channels. The diversity of habitat typesmakes comparison among the wetlands more difficult.
Toxicity Testing
Toxicity testing results were mixed. None of the test sediments produced 100% mortality. As might beexpected, there were differences in survival and growth between the 28-day and 10-day test results.Survival and growth were not always similar (e.g., diminished survival and growth in the same sample).The 28-day mean survival rate for SAW-01, RBM-01, and SHS-01 were less than and significantlydifferent than those for the negative control. RBM-01 exhibited greater than 50% mortality for the 28-day test, while greater than 50% mortality was reported for ORM-02 and SHS-01 in the 10-day tests.More than 25% mortality was observed for SAW-01, ORM-01, RBM-02, and SHS-01 during the 28-daytests and for samples from ORM-01, RBM-02, and SHS-02 for the 10-day test. However the survival inRBM-02 and SHS-02 were not significantly different from the control. All samples from Kearny Marshshown significantly lower growth than the control for the 10-day test. This same pattern was notevident in the 28-day test. Survival was not significantly different from the control for any of thesamples in the 28-day test, but was significantly different in KFM-01 for the 10-day test. SHS-02 andSHS-03 sediments showed no significant difference in survival or growth from the controls in either the28-day or 10-day tests.

March, 2004xiiJ:\Project\meri\Report\revisedreport\Report_Final.doc
Screening Level Ecological Risk Assessment (SLERA)
Evaluation of sediment quality in the five study wetlands indicated widespread exceedance of benthos-based sediment screening values for metals in all wetlands, with the exception of chromium and iron inKearny and Oritani Marshes. Several of the metals are also known to bioaccumulate (cadmium,chromium, mercury). The pesticides 4,4’-DDE and alpha-chlordane were selected as Contaminants OfPotential Concern (COPCs) since their maximum concentrations provided the greatest exceedancesamong detected pesticides (e.g., DDT and related fractions). The pesticide 4,4’-DDE is distributedwidely throughout the wetlands, whereas alpha-chlordane was detected in Kearny Marsh. PAHs wereselected as they are a widely distributed contaminant in the wetlands and many of the individual PAHfractions were above the screening level, as was the cumulative total PAHs (tPAHs). PCBs weredetected, primarily as Aroclor 1248, 1254, and 1260, and were retained as a COPC due to concernregarding their levels and inherent bioaccumulative properties and potential adverse effects on higherwildlife. Similar results were observed for data from previous wetland studies, however the magnitudeof exceedance was typically much greater for sediment data from past studies.
Evaluation of sediment quality in the five study wetlands indicated widespread exceedance ofphytotoxicity-based sediment screening values. Organic contaminants do not exceed the availablebenchmarks for tPAHs and tPCBs. No phytotoxicity values were available for the pesticides.Comparison of the metals to available phytotoxicity screening benchmark values indicated widespreadexceedances for the metals with the exceptions of cadmium and iron. Similar results were observedfor data from previous wetland studies.
Four representative wildlife species were evaluated using a maximum Hazard Quotient (HQ). Foodweb models indicate potential concern regarding maximum exposure of all COPCs except chromium,alpha-chlordane, 4,4’-DDE, and tPAHs for the mink, and all COPCs except arsenic, alpha-chlordane,and tPAHs for the heron. The results for muskrat indicate potential concern regarding exposure ofarsenic (HQ = 2.55) and mercury (HQ = 1.47), however the magnitude of the HQ suggests only a slightpotential for risk. The results of the food web models for mallard indicate potential concern regardingexposure of mercury (HQ = 1.47), but not other COPCs.
Wildlife Risk Curves
Wildlife risk curves were developed for the four target receptor species, by modeling the total daily doseover a range of sediment and water concentrations. Sediment data from the current Project as well aspast studies were pooled and 25th, 50th, 75th and 100th percentile concentrations were calculated foreach COPC. Historic water quality data were also pooled, and similar percentile concentrations forwater concentrations determined. These sediment and water concentrations were then input into thefood web models resulting in the prediction of four corresponding total daily doses (TDD) for eachCOPC and receptor species. These predicted TDDs were then compared to Toxicity ReferenceValues (TRVs) to calculate a Hazard Quotient. The calculated HQs were then plotted against the

March, 2004xiiiJ:\Project\meri\Report\revisedreport\Report_Final.doc
sediment concentrations to form the wildlife risk curves. These curves allow for the analysis of therange of potential ecological risk that may result over the observed range of sediment concentrations inthe Meadowlands wetlands.
The wildlife risk curves indicate that the potential risk associated with different COPCs differssignificantly in magnitude and pattern of risk with increasing sediment concentrations and that thesepatterns also differ depending on the receptor/trophic pathway involved. In some cases the level ofestimated risk is so low for some receptor-COPC combinations that it is near zero. In general, greaterrisk are predicted for the piscivores (heron, mink) than for the herbivores (mallard, muskrat) over themajority of the COPCs, with the mink having the highest HQs and the mallard the lowest. Higher risksare associated with the metals than with the organic COPCs. For most COPCs (cadmium, chromium,copper, mercury, zinc, alpha-chlordane, 4,4’-DDE, tPCBs), the risk levels rise slightly as sedimentconcentrations rise from 25th to 75th percentile, with a large increase as the 100th percentile isreached. Comparison of the median (50th percentile) HQ indicates that little or slight risk (HQ < 2)would be predicted for most COPCs under average sediment and surface water concentrations withthe exception of arsenic.
Relationships Between Benthic Community, Contaminants, and Toxicity
No clear and definitive relationships emerge between sediment toxicity or sediment chemistry andbenthic community parameters. The lack of obvious relationship may be caused by a number offactors including physical habitat, water chemistry, and potential overestimation of risk from sedimentchemistry, and differences between the sensitivity of test organisms and indigenous populations tosediment contaminants. Likewise, it is possible that the sample sites selected reflect only a smallsegment along the continuum of sediment contaminant concentrations.
This Project aimed to development methods that would support rapid assessment of potentialecological risk in wetlands that NJMC might be considering for acquisition, management or restoration.The findings of the study point to the need for additional work to improve the predictive capacity ofwildlife risk curves as well as screening for benthic/aquatic life risk.
March, 20041-1J:\Project\meri\Report\revisedreport\Report_Final.doc
1.0 INTRODUCTION
The Hackensack Meadowlands District that encompasses more than 30 square miles, and containsabout 8,400 acres of open space, wetlands (mostly brackish tidal marshes) and waterbodies located ina heavily urbanized and industrialized setting. These 8,400 acres were rezoned for conservationbecause of the Master Plan developed by the New Jersey Meadowlands Commission (NJMC, a NewJersey State agency). As a result of activities such as development, dredging, draining, mosquitocontrol, landfilling, and industrial pollution, wetlands have been modified and contaminated to varyingdegrees. Contaminants such as pesticides, polychlorinated biphenyls (PCBs), polynuclear aromatichydrocarbons (PAHs) and heavy metals have been detected in wetlands. These contaminants,particularly bioaccumulative ones, may pose risks to fish and wildlife feeding and reproducing in thewetlands.
The NJMC owns or manages approximately 3,400 acres of wetlands, and is actively acquiring morewetlands for preservation and/or restoration. The NJMC and others have conducted baseline studiesof several marshes in the Meadowlands that included chemical analyses of water and sediments/soilsand biologic inventories. These sites range from areas that are relatively clean to areas that may havehigh concentrations of contaminants. Some of these wetlands have already been restored; others arecurrently or potentially under consideration for restoration. Restoration includes activities such asrestoration of appropriate hydrology, the creation of biological habitats, the control of invasive plantspecies, and the reintroduction of native marsh vegetation.
The objective of this Project is to assess the ecological risks from contamination at the Meadowlandswetlands to help guide decisions about restoration of these wetlands and to build capacity tocomprehensively assess additional wetlands in the future. ENSR International with theNJMC/Meadowlands Environmental Research Institute (MERI) undertook this project. Specificobjectives of the project are to:
1. Develop a geographic database of the chemical and biological data that has already been collectedduring environmental assessments of several marshes in Meadowlands;
2. Apply U.S. EPA screening level ecological risk assessment (SLERA) for each contaminantdetected at each marsh and identify contaminants of potential concern (COPCs) for additional foodweb modeling to determine if animals at several trophic levels using the marshes may be at risk;
3. Apply the procedure over a range of concentrations representative of the Meadowlands for eachcontaminant for the same set of animals to develop “standard curves” relating sedimentcontaminant concentration to a measure of ecological risk; this may be used to quickly estimateecological risk in future assessments;

March, 20041-2J:\Project\meri\Report\revisedreport\Report_Final.doc
4. Correlate benthic diversity with sediment contaminant concentrations to look for biologic affects ofcontamination;
5. Conduct sediment toxicity tests to test the validity and predictive power of ecological risk screening.
This report documents the work completed and major findings of the project. Section 2.0 describes thesampling program and methods employed in sample analysis. Section 3.0 documents the results offield measurements, benthic community analysis, sediment chemistry, and toxicity testing. Section 4discusses the results of ecological risk assessment and the development of risk curves to allow forprediction of potential toxicity. Section 5.0 discusses the development of risk curves to aid in rapidassessment of potential risk. Section 6.0 provides a qualitative discussion of interrelationshipsbetween benthic community composition, sediment chemistry and whole sediment toxicity testing.Uncertainty and limitations of the analyses and conclusions are discussed throughout the report andare summarized in Section 7.0. Project conclusions are provided in Section 8.0. A list of acronymsused throughout this document is provided on page vii.

March, 20042-1J:\Project\meri\Report\revisedreport\Report_Final.doc
2.0 SAMPLING PROGRAM
2.1 Sampling Design Overview
The purpose for the sample collection is to provide the NJMC/MERI with data that can be used toassess the ecological risks from contamination at sites in the Meadowlands. These assessments willhelp guide decisions about restoration and build capacity to comprehensively assess additionalwetlands in the future. Samples were collected for toxicity testing, bulk chemistry analysis and benthiccommunity analysis. Design and methods were detailed in a Quality Assurance Project Plan (QAPP)that was approved by U.S. Environmental Protection Agency (U.S. EPA) prior to sampling. Samplingand analyses were completed in accordance with this approved QAPP.
2.2 Study Area
NJMC owns and manages a number of wetland areas including Kearny Freshwater Marsh (KFM),Oritani Marsh (ORM), Riverbend Marsh Wetland Preserve (RBM), Sawmill Creek Wildlife ManagementArea (SAW), Secaucus High School Marsh (SHS), Skeetkill Marsh (SM), Harrier Meadows (HM), MillCreek (MC), and 8-Day Swamp (8-Day). Five wetlands of interest were identified for sampling basedon a review of available data. These wetlands include Kearny Freshwater Marsh (KFM), Oritani Marsh(ORM), Riverbend Marsh Wetland Preserve (RBM), Sawmill Creek Wildlife Management Area (SAW),and Secaucus High School Marsh (SHS). Brief descriptions are provided in the following sectionsbased on the descriptions and summaries provided in Hackensack Meadows, New Jersey,Biodiversity: A Review and Synthesis (Hudsonia, 2002). Additional information on each of theindividual wetlands is available on the NJMC/MERI “Digital Meadowlands” electronic database.
Kearny Freshwater Marsh (KFM)
Kearny Freshwater Marsh is an approximately 311 acres (ac) marsh bounded by the defining uplandridge to the west, NJ transit Boonton Line and the Belleville Turnpike to the north, the Transco pipelineto the east, and the abandoned railroad to the south.. It provides a freshwater to slightly brackish (meansalinity of 1.8 ppt; HMDC, 2002) environment. The marsh was formerly dominated by common reed(Phragmites australis), but when a pumping station on the Hackensack River was retired, runoff (andpoorly maintained culverts) caused the water level in this area to risk, slowly killing the once dominantPhragmites. The site is now mostly open water with islands of vegetation. Dominant wetland speciesinclude common reed, broad-leaved cattail (Typha latifolia), purple loosestrife (Lythrum salicaria), rosemallow (Hibiscus palustris), and marsh fleabane (Pluchea odorata). In the open water environmentsduckweed (Lemna minor), water shield (Brasenia schreberi), arrow arum (Peltandra viriginica),pickerelweed (Pontederia cordata) and white (Nymphaea odorata) and yellow-water lily (Nuphar spp.)are found. (Hudsonia, 2002). This marsh is the historic and current site of important rookeries forblack-crowned and yellow-crowned night-herons, respectively (Kane and Gibbons, 1997).

March, 20042-2J:\Project\meri\Report\revisedreport\Report_Final.doc
Oritani Marsh (ORM)
Oritani Marsh is a 225-acre triangle of the Berry’s Creek Marsh bounded by NJ Transit Bergen Line,Berry Creek Canal and the western spur of the NJ Turnpike. Part of this site is tidally influenced withmost tidal areas with mosquito control ditches. Its flora is dominated by thickly growing Phragmites,although stands of saltmeadow cordgrass (Spartina patens) still persist. Other important speciesinclude cattails, spikerush (Eleocharis spp.), and marsh-marigold (Caltha palustris) (Hudsonia, 2002).
Riverbend Marsh Wetlands Preserve (RBM)
Riverbend Marsh Wetland Preserve is an estuarine marsh of 58 ac located along the eastern side ofthe Hackensack River in the southeast portion of Secaucus. It is adjacent to Malanka Landfill in SouthSecaucus. The site is dominated by common reed, but has patches of high marsh vegetation includingsaltmeadow cordgrass, spikegrass, (Distichlis spicata) and glasswort (Salicornia sp.) (Hudsonia, 2002).
Secaucus High School Marsh (SHS)
The Secaucus High School Marsh is a small portion (38 ac) of a once much larger estuarine marshland
located along the eastern side of the Hackensack River in the northern portion of Secaucus. This
marsh is dominated by a Phragmites monoculture, except along the Hackensack where small patches
of Spartina sp. are present (TAMS, 2001a).
Sawmill Creek Wildlife Management Area (SAW)
Sawmill Creek Wildlife Management Area is a large (741 ac) complex of estuarine marsh andmudflat/open water located between the western spur of the New Jersey Turnpike and the HackensackRiver in Kearny and Lyndhurst. The marsh vegetation is dominated by saltmarsh cordgrass (Spartinaalterniflora), saltmeadow cordgrass, and common reed (Hudsonia, 2002). This state-protected wetlandis a prime site for migrant and over-wintering waterfowl.
2.3 Sediment Sampling Locations
Figure 2-1 presents the wetland study areas that include one freshwater and eight estuarine marshesowned or managed by NJMC. These wetlands include: Secaucus High School Marsh (SHS), OritaniMarsh (ORM), Riverbend Marsh Wetlands Preserve (RBM), Sawmill Creek Wildlife Management Area(SAW), Kearny Freshwater Marshes (KFM), Mill Creek (MC). Skeetkill Marsh (SM), and HarrierMeadow (HM). The sediment sampling locations selected for analysis included locations in SecaucusHigh School Marsh (SHS), Oritani Marsh (ORM), Riverbend Marsh Wetlands Preserve (RBM), SawmillCreek Wildlife Management Area (SAW), and Kearny Freshwater Marshes (KFM). The two sediment
March, 20042-3J:\Project\meri\Report\revisedreport\Report_Final.doc
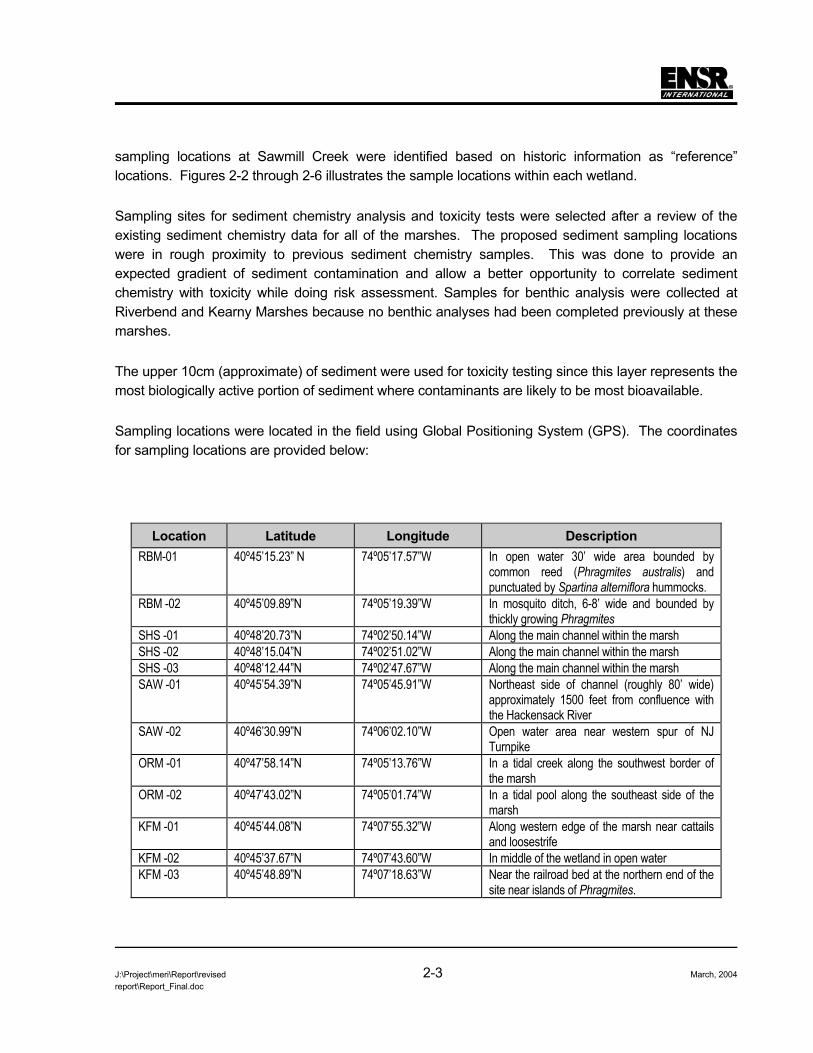
sampling locations at Sawmill Creek were identified based on historic information as “reference”locations. Figures 2-2 through 2-6 illustrates the sample locations within each wetland.
Sampling sites for sediment chemistry analysis and toxicity tests were selected after a review of theexisting sediment chemistry data for all of the marshes. The proposed sediment sampling locationswere in rough proximity to previous sediment chemistry samples. This was done to provide anexpected gradient of sediment contamination and allow a better opportunity to correlate sedimentchemistry with toxicity while doing risk assessment. Samples for benthic analysis were collected atRiverbend and Kearny Marshes because no benthic analyses had been completed previously at thesemarshes.
The upper 10cm (approximate) of sediment were used for toxicity testing since this layer represents themost biologically active portion of sediment where contaminants are likely to be most bioavailable.
Sampling locations were located in the field using Global Positioning System (GPS). The coordinatesfor sampling locations are provided below:
Location Latitude Longitude DescriptionRBM-01 40º45’15.23” N 74º05’17.57”W In open water 30’ wide area bounded by
common reed (Phragmites australis) andpunctuated by Spartina alterniflora hummocks.
RBM -02 40º45’09.89”N 74º05’19.39”W In mosquito ditch, 6-8’ wide and bounded bythickly growing Phragmites
SHS -01 40º48’20.73”N 74º02’50.14”W Along the main channel within the marshSHS -02 40º48’15.04”N 74º02’51.02”W Along the main channel within the marshSHS -03 40º48’12.44”N 74º02’47.67”W Along the main channel within the marshSAW -01 40º45’54.39”N 74º05’45.91”W Northeast side of channel (roughly 80’ wide)
approximately 1500 feet from confluence withthe Hackensack River
SAW -02 40º46’30.99”N 74º06’02.10”W Open water area near western spur of NJTurnpike
ORM -01 40º47’58.14”N 74º05’13.76”W In a tidal creek along the southwest border ofthe marsh
ORM -02 40º47’43.02”N 74º05’01.74”W In a tidal pool along the southeast side of themarsh
KFM -01 40º45’44.08”N 74º07’55.32”W Along western edge of the marsh near cattailsand loosestrife
KFM -02 40º45’37.67”N 74º07’43.60”W In middle of the wetland in open waterKFM -03 40º45’48.89”N 74º07’18.63”W Near the railroad bed at the northern end of the
site near islands of Phragmites.

March, 20042-4J:\Project\meri\Report\revisedreport\Report_Final.doc
2.4 Sample Collection Methods
The vessel used to access the sampling sites was a 21’ Privateer with a 115 Hp engine. The Privateerwas used at high tide to ensure water levels were high enough to enter and exit. Sampling in KearnyMarsh was conducted using a 14-foot aluminum skiff with a 15 horsepower engine. The latitude andlongitude of each location was recorded using a Trimble ProXRS Global Positioning System (GPS)unit.
2.4.1 Sediment for Bulk Chemistry Analysis and Toxicity Testing
Sediment samples were collected using an Ekman Dredge (6” x 6” x 6”) affixed to an approximatelyfive-foot long pole. Sediment was placed in a decontaminated stainless steel bowl and a stainless steelspoon was used to homogenize and transfer sediment to collection jars. Latex gloves were wornduring transfer procedure. Samples to be analyzed at the MERI lab were placed in widemouth glass 2liter containers, labeled on the lid and jar, and immediately placed in coolers with wet ice. Samples tobe analyzed by Accutest Laboratories were placed in 8 ounce glass amber bottles, labeledappropriately and chilled. Both lab sample containers were wrapped in bubble wrap prior to coolerplacement. Samples for toxicity testing were placed in 3-gallon plastic buckets supplied by B-HLaboratories, labeled on the lid and container, sealed, and stored appropriately on deck. Sampleswere chilled upon return to shore due to large sized of container.
A duplicate sample was collected at location KFM-SD-03. At the end of each day, sediment sampleswere delivered to Accutest, Inc. and MERI laboratory for analysis (see Appendix A for Chain of Custody(COCs) forms). A rinseate blank was collected at Sampling Station KFM-SD-02 to determine thepotential transfer of contaminants from sampling equipment to the samples. Six one-liter, amber jarswere filled and one plastic container with HNO3 was filled with lab supplied deionized water using theEkman. The sample was transferred to a stainless steel bowl with a spoon and placed in containerssupplied by Accutest.
Decontamination of gear (e.g., Ponar/Ekman, stainless steel spoons, stainless steel bowls) wasinitiated after collections were completed at each site. The Ekman and Ponar were rinsed clean withsite water between each sample to avoid cross contamination of samples. Latex gloves were wornduring decontamination. Jaws of both Ekman and Ponar, once decontaminated, were sealed shutduring transfer to the next site/station.
2.4.2 Sediments for Benthic Analysis
. Sediment samples for benthic analysis were collected with a stainless steel petite Ponar/Ekman grabsampler in triplicate per ENSR Standard Operating Procedures 5204. Samples were collected at RBM-01, RBM-02, KFM-01, and KFM-02. Benthic samples were sieved in the field using a 500-micron mesh

March, 20042-5J:\Project\meri\Report\revisedreport\Report_Final.doc
sieve. The Ponar or Ekman was rinsed with site water for each sample to ensure that the wholesample was placed in the sieve. Buckets were also rinsed with site water when transferred to the sieveworkstation. The sieve workstation consisted of a milk crate used as a pedestal with a galvanizedsteam washtub placed on top. The sample was transferred to the sieve and gently rinsed with sitewater. Site water was placed in the tub prior to sieving. Sieving was conducted in a gentle swirlingmotion until all but particles larger than 500 microns remained. Samples were then placed in plasticwide mouth containers and labeled on lid and container. Benthic samples were preserved with 10%buffered formalin.
2.5 Field Measurements
Field measurements, including temperature, salinity, dissolved oxygen (DO), DO%, turbidity, OxidationReduction Potential (ORP), specific conductivity and pH were recorded using a Hydrolab Mini SondeWater Quality Multiprobe Sensorflex Parameter Expansion System. Water parameters were measuredat the water’s surface at each location and were recorded on the attached data logs (Appendix A).Other parameters recorded included weather, sampling start and stop times, tide levels and names ofsurveyors.
2.6 Benthic Sample Analysis Methods
Cove Corporation performed Benthic lab analyses. Voucher specimens were collected as part of thisanalysis. The raw data, a list of the vouchers, and the QC Report prepared by Cove is included inAppendix D.
Using the data provided by Cove Corporation, ENSR completed an analysis of the benthic communityby constructing dominant species lists, calculating of Shannon-Wiener Diversity Indices (H’), andPielou’s Evenness (J’) for each assessment site sampled by ENSR (Riverbend Marsh and KearnyMarsh).
2.7 Sediment Chemical Analysis Methods
The sediment samples were analyzed for total metals (cadmium, Cd; chromium, Cr; copper, Cu;mercury, Hg; lead, Pb; nickel, Ni; zinc, Zn; arsenic, As), pesticides, polychlorinated biphenyls (PCB’s),polynuclear aromatic hydrocarbons (PAHs), total organic carbon (TOC), grain size, % moisture and pHby the MERI Laboratory (Cd, Cr, Cu, Fe, Pb, Ni, Zn, Hg, grain size) and AccuTest Laboratory (all otherparameters). Table 2-1 summarizes the laboratory methods used for sample analysis. Analyses wereperformed in accordance with the Quality Assurance Project Plan developed for the project andapproved by U.S. EPA (ENSR, 2003).

March, 20042-6J:\Project\meri\Report\revisedreport\Report_Final.doc
2.8 Sediment Toxicity Testing Methods
Whole sediment toxicity testing was conducted on sediment samples collected from twelve locations inthe Hackensack Meadowlands. These included samples from Kearny Freshwater Marsh (KFM),Oritani Marsh (ORM), Riverbend Marsh Wetland Preserve (RBM), Sawmill Creek Wildlife ManagementArea (SAW), and Secaucus High School Marsh (SHS). With the exception of Kearny Marsh, themarshes sampled were estuarine with moderate salinity. As such, different test conditions (e.g., salinityof overlying water and/or test organism) were used to perform the toxicity tests for the freshwater andestuarine samples. Whole sediment toxicity testing was conducted 1 through 29 October 2003 usingthe amphipod, Hyalella azteca (H. azteca). Whole sediment toxicity testing was conducted 3 through13 October 2003 using the freshwater midge, Chironomus tentans (C. tentans). Whole sedimenttoxicity testing was conducted 12 through 22 October 2003 using the marine annelid, Neanthesarenaceodentata (N. arenaceodentata). The sediment samples were collected by ENSR personnel andtransported to B-H Laboratories’ Spring City, Pennsylvania laboratory. The objective of this testing wasto determine chronic toxicity of the sediments to H. azteca, C. tentans and N. arenaceodentata.
All testing was conducted in accordance with the QAPP (ENSR, 2003) and individual testing SOPsdeveloped by B-H Laboratories (provided in Appendix I of the QAPP). The testing procedures areconsistent with those outlined in:
Ingersoll, C.G., G.T. Ankley, G.A. Burton, F.J. Dwyer, R.A. Hoke, T.J. Norbert-King and P.V.Winger. 1994. Methods for Measuring the Toxicity and Bioaccumulation of Sediment-associated Contaminants with Freshwater Invertebrates. EPA/600/R-94/024. U.S. EPA Officeof Research and Development, Duluth, MN,
ASTM. 1995. Standard Test Methods for Measuring the Toxicity of Sediment-AssociatedContaminants with Fresh Water Invertebrates. E1706-95. American Society for Testing andMaterials, Philadelphia, PA; and
ASTM. 1994. Standard Guide for Conducting Sediment Toxicity Tests with Marine andEstuarine Polychaetous Annelids.E1611-94. American Society for Testing and Materials,Philadelphia, PA.
The following provides a brief overview of the basic methods employed. A detailed discussion ofmethods is provided the toxicity testing report prepared by B-H Laboratories (Appendix C).
2.8.1 Test Organisms
Amphipod, Hyalella azteca (10-ppt; representative of salinity observed in the sampled wetlands):Immature H. azteca (13-days old) used in testing were obtained from Aquatic Research Organisms(ARO), a commercial culture facility located in Hampton, New Hampshire. This species is arepresentative invertebrate and a United States Environmental Protection Agency (EPA) accepted test

March, 20042-7J:\Project\meri\Report\revisedreport\Report_Final.doc
organism. The amphipods used for testing were hatched on 18 September 2003 and held at the culturefacility until shipment on 30 September 2003. The amphipods were acclimated to a salinity 10-ppt priorto shipping to B-H Laboratories Biological Services Division.
Amphipod, Hyalella azteca (moderately-hard reconstituted water; surrogate for freshwater): Same asfor Freshwater amphipod (10 ppt) treatment, except the amphipods were placed in a plastic cubitainerwith moderately-hard reconstituted water and shipped overnight to B-H Laboratories.
Larval Midge, Chironomus tentans: C. tentans larvae (14-days old) used in testing were obtained fromAquatic Research Organisms (ARO), a commercial culture facility located in Hampton, NewHampshire. This species is a representative invertebrate and United States Environmental ProtectionAgency (EPA) accepted test organism. Prior to shipping, the amphipods were fed rabbit pellets duringacclimation and holding at ARO. Midge larvae (14-days old) were placed in a plastic cubitainer withmoderately hard re-constituted water and shipped overnight to B-H Laboratories’ Biological ServicesDivision in Spring City, Pennsylvania.
Marine Annelid, Neanthes arenaceodentata: N. arenaceodentata (two to three weeks old) used intesting were obtained from California State University at Long Beach, a non-commercial culture facilitylocated in Long Beach, California. This species is a representative invertebrate and U.S. EPA acceptedtest organism. Annelids were placed in a plastic cubitainer with 25-ppt seawater and shipped overnightto B-H Laboratories’ Biological Services Division in Spring City, Pennsylvania.
2.8.2 Negative Control Sediment
Sediment to be used as the negative controls was collected from Blue Marsh Reservoir, a site known toexhibit minimal toxicity, located in Lower Heidelberg, Pennsylvania. The sediment was collected on 25September 2003 and transported to the Spring City laboratory. The sediments were collected from acove south of the boat launch. The sediments were collected approximately five-feet from the shorelinein two-feet of water.
2.8.3 Test Sediments
ENSR International, Inc. personnel, collected sediments on 15 through 17 September 2003. at RBM -01, RBM -02, SHS -01, SHS -02, SAW -01, SAW -02, SAW -03, ORM- 01, ORM -02, KFM -01, KFM -02, and KFM-SD-03. Sites no(s). SAW-SD-01 and SAW-SD-02 were designated as referencesediments. Sediment samples were picked up in Lyndhurst, NJ by B-H Laboratories’ personnel andtransported to B-H Laboratories’ Spring City office on 15, 16 and 17 October 2003. Chain-of-Custodyforms accompanied all sediments. All sediments were stored at 1° to 4.4°C in their original containerswhen not being used. Sediments were warmed to test temperature prior to test initiation. Prior to use,

March, 20042-8J:\Project\meri\Report\revisedreport\Report_Final.doc
the sediments were homogenized and sieved through a No. 6 (3.35-mm) stainless steel sieve toremove large pebbles, stones, twigs, plant clumps, and indigenous macroinvertebrates.
2.8.4 Overlying Water
Reconstituted water: Reconstituted water was prepared in accordance to procedures outlined inEPA/600/R-99/064 to be used as acclimation and overlying water for the toxicity tests. Water wasdecanted through a mixed bed de-ionizing system (U. S. Filter, Inc.) consisting of carbon, mixed resin-bed and membrane filters. A 190-liter Nalgene tank was filled with about 150-liters of de-ionized water.In a five-gallon bucket of de-ionized water, 9.5-grams of CaSO4 and 9.5-grams CaCl2 was mixed intosolution by vigorously aerating for 30-minutes or until the salts dissolve. Into a second 5-gallon bucketof de-ionized water, 5.7-grams of MgSO4, 18.2-grams of NaHCO3 and 0.76-grams KCl was mixed byaerating for 30-minutes or until the salts dissolve. The two five-gallon aliquots were added to the 150-liters of de-ionized water and the volume was brought to 190-liters with de-ionized water.Reconstituted water was aerated for at least 24-hours prior to use.
Salt Water (10-ppt and 25-ppt): Natural seawater was collected at the Manasquan Inlet in Brielle, NewJersey. The seawater was collected on 24 September 2003 by B-H laboratories personnel. Salinity ofwater collected at this NJDEP approved site was 32 ppt at the time of sampling. The 10-ppt and 25-pptseawater was prepared by filtering the natural seawater through a 0.5-µm polypropylene string-woundcartridge filter. The natural seawater was adjusted to 10-ppt or 25-ppt by incremental additions of de-ionized water. The water was aerated for 24-hours. After aerating for 24 hours, the salinity wasmeasured and the salinity was adjusted either by adding additional seawater or de-ionized water toachieve the target salinity. The water was aerated an additional 24-hours prior to use as acclimation oroverlying water. Natural 10-ppt salt water was prepared in 190-liter batches.
2.8.5 General Testing Protocol
Sediment toxicity tests were conducted in chambers that were placed in a temperature-controlledenvironmental chamber. Test chambers were 300-mL or 1000-mL high-form lip-less Kimax beakers.Prior to testing, sediment samples were prepared as described above. An appropriate volume ofhomogenized sediment and overlying water was placed into each test chamber on day –1 (day beforetest initiation). Eight replicate chambers were tested for each of the sediments. After an overnightsettling period, the water quality (e.g., pH, alkalinity, conductivity, temperature, dissolved oxygen) of theoverlying water were determined and organisms were added in an unbiased manner to each testchamber. Organisms in the test chambers were fed with the appropriate amount and type of food (perthe testing protocols). Water renewals were accomplished by siphoning off the old solution andreplacing it with fresh overlying water renewed overlying water twice daily (A.M. and P.M.). Testchambers were not aerated as water renewal maintains sufficient dissolved oxygen. Any deadorganisms observed during the renewal process were removed and recorded. Appropriate water

March, 20042-9J:\Project\meri\Report\revisedreport\Report_Final.doc
quality measurements (e.g., dissolved oxygen, temperature, pH, ammonia) were taken and recordedas described in the testing protocols.
The tests were terminated at the end of 10-days or 28-days, depending on the test. Survivingorganisms within each replicate were collected with a U.S. Standard No. 50 stainless steel sieve. Theorganisms were counted, rinsed with de-ionized water and transferred as a group to pre-weighed pans.The number of surviving organisms was recorded. Organisms were dried and each pan containingorganisms was weighed on an Ohaus Model AP250D Plus analytical balance. The total organism dryweight was divided by the number of surviving organisms to obtain the average organism weight perreplicate.

March, 20043-1J:\Project\meri\Report\revisedreport\Report_Final.doc
3.0 RESULTS
The results of benthic sampling, bulk sediment chemistry and toxicity testing are described in thisSection. The results presented in this section support assessment and analyses discussed in Sections4.0 through 6.0 of this report.
3.1 Field Measurements
Field measurements taken at the time of sediment collection for benthos and chemical analysis andtoxicity testing included temperature, salinity, conductivity, dissolved oxygen, pH, oxidation reductionpotential (ORP), and total dissolved solids. Table 3-1 provides a summary of field measurementstaken. Water temperature at the time of sampling ranged from 19.7 °C to 25.3 °C. As is evident fromthe salinity measurements ranging from 0.9 ppt to 1.3 ppt, the Kearny Marsh (KFM) samples werecollected in an area with low salinity (near freshwater to slightly brackish). Salinities at other locationsranged from 5.6 ppt to 14.3 ppt. Dissolved oxygen supersaturation was observed at Kearny Marsh(KFM) and one of the Oritani Marsh sampling locations. Elsewhere dissolved oxygen ranged from 2.2to 5.9 mg/L. The pH ranged from 6.95 to 8.66 S.U., and was greatest at those sampling locationswhere dissolved oxygen supersaturation was evident. These combined results suggest significantphotosynthetic activity at those locations. ORP ranged from 286 to 358 millivolts, and was generallylower at the freshwater sampling locations. Total dissolved solids ranged from 1.1 to 1.5 g/L at KearnyMarsh, and from 6.3 to 15.5 g/L at the other sampling locations.
3.2 Benthic Community Composition
Invertebrates identified from sediment samples collected at Kearny and Riverbend marshes inSeptember 2003 are shown in Table 3-2. A total of five taxa were found in the six samples collected atKearny Marsh, including immature chironimids and oligochaetes which each might contain severalspecies. The remaining taxa, the sand fly Culicoides sp., the amphipod Gammarus palustris, and thenereid polychaete Laeonereis culveri, all typical estuarine species, were present in very low numbers.Density (? = 2827 ind./ m2), diversity (0.52), and evenness (0.26) were all very low at this site (Table 3-2).
The benthic fauna at Riverbend Marsh was richer in species than at Kearny Marsh and displayedgreater diversity and evenness. The density of animals was very great with up to 10 times as manyindividuals per square meter (> 30,000 ind./ m2) at Riverbend Marsh than at Kearny Marsh or threeother marshes, Secaucus High School, Oritani, and Mill Creek, sampled previously by others, whoseparameters are given in Table 3-3. Riverbend Marsh was one of the most diverse studied with adiversity of H’> 2. Diversities of only a few samples at Mill Creek Marsh exceeded this value. Animportant factor that may contribute to some of the observed differences between the various marshesis the types of habitats sampled. Previous studies included sampling of mudflats, tidal creeks, marsh

March, 20043-2J:\Project\meri\Report\revisedreport\Report_Final.doc
plain, ponded/open water, channels, high marsh, and mosquito ditches. Samples collected as part ofthis study were primarily located in open water, mosquito ditches, and/or channels.
In addition to the fauna found at Kearny Marsh, organisms at Riverbend Marsh included the burrowinganemone, Edwardsia elegans, six additional polychaete species, three additional amphipod species,two isopods, one bivalve, Macoma balthica, and one snail, Spurwinka salsa. All of these taxa arecommon inhabitants of estuarine systems.
Dominant species at Kearny and Riverbend Marshes are shown in Table 3-4. Oligochaetes were thedominant taxon at Kearny Marsh and the second-most common taxon at Riverbend. The snail,Spurwinkia salsa, was the dominant at Riverbend. This gastropod species was found in all six samplescollected at Riverbend but was absent from Kearny Marsh and had not been seen at the historicalsamples collected at Mill Creek, Oritani, or Secaucus High School Marshes (Tams, 2001a; LouisBerger, 2001; HMDC, 1997). Benthos sampling data for Sawmill Creek and Eight-day marshes wereavailable but not used in these comparisons. Sawmill Creek data were from 1987 and deemed to oldto provide useful comparison to current benthos sample or comparison to sediment chemistry collectedduring this study. Data for Eight-day swamp (Weis and Weis, undated) were not identified to similartaxonomic levels as other data, and the dates of sample collection were unknown. The insect taxaChironomidae pupae/larvae and Culicoides sp. (by density) ranked second and third at Kearny Marshand fifth and seventh at Riverbend. Polychaetes Laeonereis culveri and Hobsonia florida ranked thirdand fourth at Riverbend Marsh.
Table 3-5 gives a summary of species found both at Kearny and Riverbend in 2003 and at the historicalsites visited in 1997 and 2000. Approximately, 55 taxa have been identified from the five marshes.This is an approximate number as several of the taxa might actually be the same species (i.e. Cyathuraand Cyathura polita) and other taxa probably are comprised of several species (i.e. Chironomidae andOligochaeta). All of these taxa are those commonly found in estuarine systems. The most commonlyrepresented groups include 12 insects, 12 polychaetes, 8 amphipods, 5 isopods, 4 gastropods, and 3bivalves. Chironomids were dominant in the Secaucus High School samples, while copepods and acommon polychaete were dominant in the Oritani marsh samples, and Mill Creek samples weredominated by an amphipod, chironomids, and a common polychaete. A description of some of themore common and interesting species, especially polychaetes follows.
Spurwinkia salsa (Pilsbry, 1905) was the dominant benthic invertebrate found at Riverbend Marshin September 2003. This deposit feeding gastropod snail inhabits high marsh pools from Maine toConnecticut and possibly to the DELMARVA peninsula in salinities of 0-29‰. This is a euryhalinesnail endemic to the upper reaches of estuaries (Davis et al., 1982). Habitats include tidal marshcreeks and pools, intertidal marsh turf below mean highwater level, and shallow subtidal waters ofchannels and embayments bordered by tidal marshes. S. salsa can live in brackish marsheswhere salinities are always below 20‰ and often drops to 0‰ in spring, as well as in Spartina saltmarshes at or near their furthest reaches up the estuary (i.e. inland) where seasonal salinities

March, 20043-3J:\Project\meri\Report\revisedreport\Report_Final.doc
range broadly (0-20‰)(Davis et al. 1962). In Maine and Massachusetts, as in the Meadowlands,they were found living in association with aquatic insects and euryhaline estuarine endemics ofmarine origin, such as, Hobsonia florida, Manayunkia aestuarina, Marenzellaria viridis, Gammarussp., Cyathura polita, midge larvae, and oligochaetes.
Laeonereis culveri (Webster, 1879). Laeonereis culveri found at both Kearny and Riverbendmarshes, is an estuarine polychaete that is distributed from Connecticut to the Gulf of Mexico.The species occurs in low saline estuarine habitats including tidal flats, sandy shoals, andmarshes and is highly adapted to survive in such environments. Mazurkiewicz (1975) studied thelarval development and ecology of L. culveri. Females deposit their eggs within their mucoidtubes. Development is entirely benthic with planktonic larvae never observed. Larvae were foundin the upper 2 cm of flocculent sediment on tidal flats from June to September in Connecticut.Laboratory experiments suggest that at 22ºC, development from fertilized eggs to the 20-setigerjuvenile stage takes approximately 45 days. This is a stage of development where most of theadult morphology is present. A total of 190 days is needed to develop to the 80-setiger stage orone where sexual maturity might be indicated. Adults died after spawning, so success of theannual reproductive cycle will dictate status of the adults in the benthic communities the followingyear. Some observations of larval behavior by Mazurkiewicz (1975) suggest that L. culveri larvaehave some capability of selecting favorable sediments in which to live. He noted that if overlyingwater becomes foul, the larvae assume a swim-crawl mode and move to more favorableconditions. Klesch (1970) conducted a less comprehensive study of L. culveri in Texas. He foundthat the species had a biannual spawning in contrast to the annual summer spawning inConnecticut waters. It is likely that populations in New Jersey marshes are more similar to theConnecticut pattern.
Hobsonia florida (Hartman, 1951), found at Mill Creek, Oritani, and Riverbend marshes, is one ofthe most common estuarine polychaetes occurring in intertidal and subtidal muds from Maine toFlorida; the species is also known from the Pacific Northwest. The species forms part of theinfauna in salt marshes, estuaries, and river mouths, often in high densities. H. florida is found in awide range of salinities from <1‰ to 30‰ with other common estuarine invertebrates (Pettibone,1977). The species has been known under several names including Amphicteis gunneri floridus,A. floridus, and Hypaniola grayi Pettibone, 1953, and H. florida. The current classification of thespecies and referral to Hobsonia was by Banse (1979). H. florida is small, 8-15 mm long and livesin tubes consisting of mud, sand, and bits of animal and plant debris (Zottoli, 1974). The larvaldevelopment was described by Zottoli (1974). Working in New Hampshire, he found that spawningoccurred from late May to early September. The eggs were released into the tube of the femaleand developed there to the 2-setiger stage in about 2 days, after which they left and continued todevelop in the mud. Approximately 36 days were required for development to proceed to 18setigers or the juvenile stage.

March, 20043-4J:\Project\meri\Report\revisedreport\Report_Final.doc
Heteromastus filiformis (Claparède, 1864). This species is a widespread benthic infaunalpolychaete that often inhabits intertidal muds and is subject to low oxygen conditions. The speciesis not typically found in marsh communities and only one specimen (at Riverbend) was found inthe five marshes tabulated in Table 3-5.
Manayunkia aestuarina (Bourne, 1883) is a small (1-3 mm) tube-dwelling sabellid polychaeteknown from intertidal and subtidal muds in Europe and North America. Among the five marshescompared in Table 3-5, this species was found only at Riverbend Marsh where it ranked sixth inabundance. The species is a surface deposit feeder, using cilia on its tentacles to gather sedimentparticles. On the east coast of the North America, the species ranges from Maine to theCarolinas. Bell (1982) reported on the biology and ecology of this species from a South Carolinasalt marsh. She found that the species attained its highest densities in the fall, with lesser peaksin winter and spring; densities were lowest in winter months. In Boston Harbor, Massachusetts,Trueblood et al., (1994) reported highest densities in August and September with no distinct peaksin other seasons. This suggests that northern populations are more seasonal than southernpopulations. Bell (1982) noted that embryos and juveniles were present year round, suggestingmore or less continuous reproduction. For a small species, the eggs are large, sexes areseparate, fertilization is by transfer of spermatophores, and the development is entirely within thetubes of the females.
Nereis succinea (Frey and Leuckart, 1847). This is one of the most common nereids in thenorthern hemisphere and the subject of numerous physiological, embryological (as Nereis limbata)and ecological investigations are reviewed by Pettibone (1963). The species is euryhaline andwell known from all three coasts of the United States, and was found at Oritani Marsh. It rangesfrom the high intertidal to shallow subtidal depths, but is most common in the mid-intertidal range.The species occurs in estuaries and embayments in a wide variety of habitats including sand,mud, or among rocks. Individuals construct U-shaped burrows, which they frequently abandon,forming new ones. Adults undergo complete heteronereid metamorphosis and swarm to thesurface of the water in large numbers. There are distinct morphological differences betweenmales and females. There is evidence of lunar synchrony in the spawning cycle during the periodsof the new moon from June to September. Males are smaller and faster moving than females andusually appear earlier in the evening than the females. Males swim in rapid, narrowing circlesaround the females shedding sperm. This stimulates the females to release eggs. Adults die afterspawning. Eggs are about 140 µm in diameter and develop into planktotrophic larvae.Metamorphosis to bottom crawling forms occurs at the 4-6 setiger stage. Some aspects of thebiology were reviewed by Pettibone (1963) but there is an extensive literature on the species.
Streblospio benedicti (Webster, 1879). Streblospio benedicti is one of the most common spionidpolychaetes occurring in intertidal mud flats in eastern North America. The species is verycommon in salt marshes where it inhabits silt-encrusted tubes and feeds from surface sedimentsand nearbottom water with its prehensile palps. In the present study, this species was found at

March, 20043-5J:\Project\meri\Report\revisedreport\Report_Final.doc
Oritani and Riverbend Marshes. The reproduction and larval development has been studiedextensively for S. benedicti (Blake and Arnofsky, 1999). Females brood embryos in dorsalpouches from which larvae are eventually released into the plankton. Two distinct forms of larvaldevelopment have been described. In the first, larvae are released into the plankton where theyremain for up to 45 days feeding on phytoplankton. In the second, the larvae are released fromthe pouches at a much later stage of development; they do not feed, and settle shortly thereafter.Both types of development are known from the eastern United States. Dauer (1984) has describedthe feeding morphology and behavior of this important species.
Marenzellaria viridis (Verrill, 1873). This species is believed to be native to the northeasternUnited States, but has been introduced into northern Europe and most recently San FranciscoBay. The species was formerly known as Scolecolepides viridis. Maciolek (1984) revised thenomenclature. In the present study, M. viridis was found only at Oritani Marsh where it was thesecond most common taxon. The species is capable of building dense populations in softsediments from the intertidal to shallow subtidal. The adults and larvae are tolerant of very lowsalinities and thus well suited to colonizing high estuarine habitats such as marshes and back bayenvironments. This salinity tolerance also accounts for its dispersal to Europe by ballast watertransport. George (1966) described the larval development based on specimens from NovaScotia. The eggs are relatively large (200-260 µm) and spawned directly into seawater where theyare fertilized and develop as planktotrophic larvae. Development to settling juveniles takes about45 days.
Boccardiella ligerica (Ferroniére, 1898). Boccardiella ligerica is a widely distributed species that isopportunistic in sediments overlain with waters of very low salinity including near freshwater. Indata compiled for the five marshes in Table 3-5, B. ligerica was found only in Riverbend Marsh.The species was redescribed by Blake and Woodwick (1971) (as Boccardia) and has beenreported from all three coasts of North America. Little is known concerning its biology. As part ofa recent study of estuarine tributaries in South Carolina, the species was one of the dominantspecies (ENSR, unpublished reports).
The benthic community found at Riverbend includes faunal elements that are typical of high estuarine,low salinity marshes throughout the eastern United States (Pettibone, 1963, 1977; Zottoli, 1974;Mazurkiewicz, 1975; Maciolek, 1984). As indicated in the comments for indicator species, all areadapted to these environments. The current sampling provided minimal evidence of pollution or stress-related indicator species such as the polychaetes Capitella capitata (none observed) or, possibly,Polydora cornuta (one individual observed in two of the replicates at RBM-02). Polydora cornuta wasobserved in Mill Creek in 1997 (pers. Comm. Brett Bragin, 2003).
The benthic community at Kearny Marsh appears to be impoverished and is possibly impacted by thehigh contaminant loads. This statement is tempered, however, by the fact that the species compositionof the insects was not determined.

March, 20043-6J:\Project\meri\Report\revisedreport\Report_Final.doc
3.3 Bulk Sediment Chemistry
3.3.1.1 2003 Sediment Sampling
Bulk sediments were analyzed for metals (cadmium, Cd; chromium, Cr; copper, Cu; mercury, Hg; lead,Pb; nickel, Ni; zinc, Zn; arsenic, As), pesticides, polychlorinated biphenyls (PCB’s), polynucleararomatic hydrocarbons (PAHs), total organic carbon (TOC), grain size, % moisture and pH. Table 3-6provides the results for general sediment chemistry for the individual samples analyzed. Chemistrydata for the individual samples is provided in Appendix E, Table E-1. Table 3-7 provides summarystatistics (minimum and maximum) for each of the five wetlands from which samples were taken. Forthe purposes of summary statistics, only detected concentrations are considered in the minimum andmaximum statistics. When a contaminant was not detected (ND) in any sample summary statistics areidentified as Not Applicable (NA), however if a contaminant was detected at one sample location andnot another, one half of the analytical detection limit was used for any non-detect concentrations in thecalculation of summary statistics.
Maximum and mean concentrations of total PAHs were greatest in Riverbend Marsh and were lowestin the Secaucus High School Marsh. Few pesticides were detected in any of the marshes. Chlordane(alpha (cis)-) was detected only in the Kearny Marsh while 4,4'-DDE was detected in all marshes.Other detected pesticides included 4,4'-DDD, 4,4'-DDT and methoxychlor. Of the seven PCB aroclorsanalyzed, three were not detected in any of the marshes (aroclor 1016, 1221, and 1232). Aroclor 1242was detected only in Riverbend Marsh. Aroclors 1248 and 1258 were detected in all of the marshes.Maximum and Mean total PCB concentrations were greatest in Oritani Marsh and lowest in SecaucusHigh School Marsh. All the metals analyzed were detected in all the marshes sampled. With theexception of iron and lead, the greatest maximum concentrations were observed in Oritani Marsh.These data were used in the Screening Level Ecological Risk Assessment (SLERA) presented inSection 4.0.
3.3.1.2 Historic Sediment Sampling
A number of studies, which included wetland sediment sampling and analysis, and in most casescomparison to applicable aquatic life criteria have been performed on the Meadowlands Wetlands.These studies included the following wetlands:
Kearny Marsh - Langan EES (1999)
Oritani Marsh - Louis Berger (2001)
Secaucus High School Marsh – TAMS (2001a)
Skeetkill Creek Marsh – ECI (1997)

March, 20043-7J:\Project\meri\Report\revisedreport\Report_Final.doc
Riverbend Wetland Preserve – TAMS (2001b)
Mill Creek Wetland – HMDC (1997)
Eight-Day Swamp – Weis, J. and P. Weis (undated)
Harrier Meadows – ECI (1997)
Data from these studies were used to support this project and are provided in Appendix E. The numberof sampling sites, depth of sediment samples, parameters analyzed, detection limits, and methods ofreporting varied between the various studies. For consistency all data were compared to estuarinesediment benchmark values; primarily from effects range-low (ER-L) (Long et al., 1995). Additionalsediment benchmark sources included the low effect levels (LELs) from the Ontario Ministry of theEnvironment (OMOE) (Persaud et al., 1996) if no ER-L was available for a given contaminant. Thefollowing provides a brief summary of pertinent observations regarding the reported sediment chemistrydata for each study:
Riverbed Wetland Preserve (TAMS, 2001b):
Samples were collected from 15 locations at multiple depths (0-6”, 6-12”, 12-18”, 0-24”composite). Two field duplicate samples were collected and analyzed.
Samples were analyzed for volatile organic compounds (VOCs), semi-volatile components(SVOCs), pesticides, PCBs, metals, cyanide, particle size, percent solids, pH, total petroleumhydrocarbons (TPH), and total organic carbon.
Detection limits for SVOCs and certain pesticides often exceeded the applicable screeningcriteria.
Total organic carbon concentrations ranged from 38,000 to 190,000 mg/kg.
Where detected, 4,4-DDT, aroclor-1248, aroclor-1260, chromium, copper, lead, mercury,nickel, and zinc exceeded the applicable screening criteria in a majority of samples.
Secaucus High School Wetlands Mitigation (Tabs, 2001a)
Samples were collected from 8 locations at multiple depths (0-6”, 6-36”). Two field duplicatesamples were collected and analyzed.
Samples were analyzed for SVOCs, pesticides, PCBs, metals, cyanide, particle size, percentsolids, total petroleum hydrocarbons (TPH), and total organic carbon.
Detection limits for some SVOCs and certain pesticides often exceeded the applicablescreening criteria.
Total organic carbon concentrations ranged from 21,000 to 160,000 mg/kg.
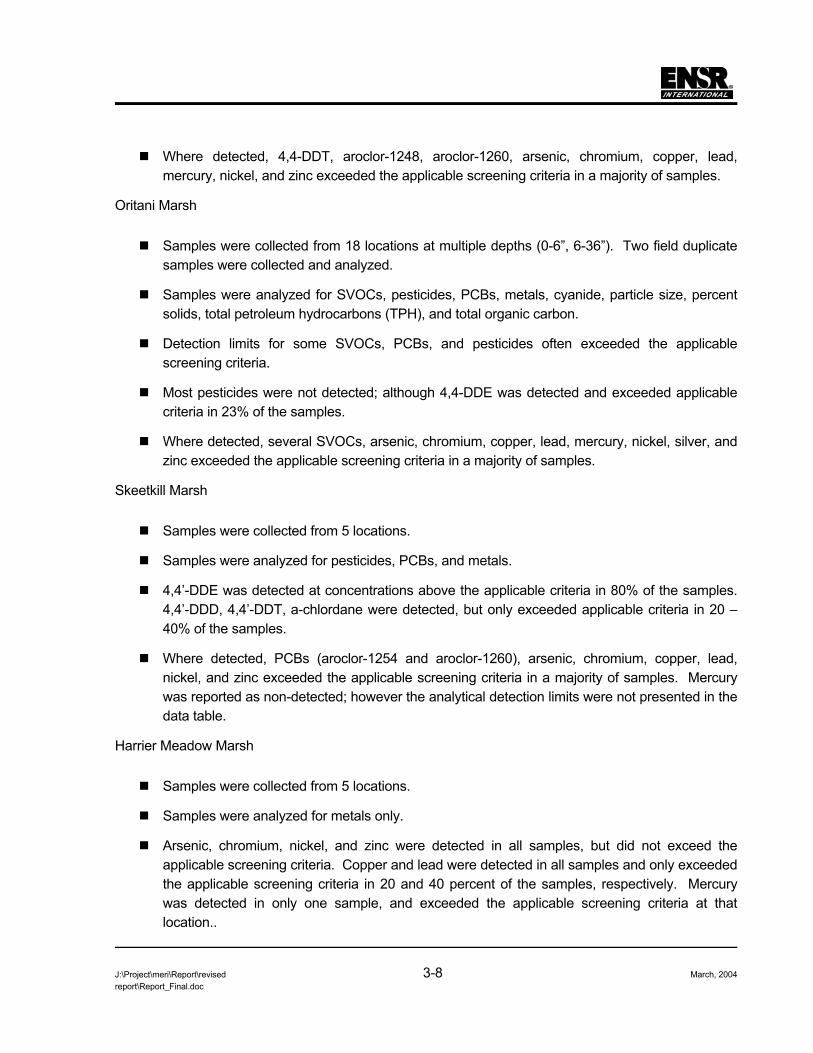
March, 20043-8J:\Project\meri\Report\revisedreport\Report_Final.doc
Where detected, 4,4-DDT, aroclor-1248, aroclor-1260, arsenic, chromium, copper, lead,mercury, nickel, and zinc exceeded the applicable screening criteria in a majority of samples.
Oritani Marsh
Samples were collected from 18 locations at multiple depths (0-6”, 6-36”). Two field duplicatesamples were collected and analyzed.
Samples were analyzed for SVOCs, pesticides, PCBs, metals, cyanide, particle size, percentsolids, total petroleum hydrocarbons (TPH), and total organic carbon.
Detection limits for some SVOCs, PCBs, and pesticides often exceeded the applicablescreening criteria.
Most pesticides were not detected; although 4,4-DDE was detected and exceeded applicablecriteria in 23% of the samples.
Where detected, several SVOCs, arsenic, chromium, copper, lead, mercury, nickel, silver, andzinc exceeded the applicable screening criteria in a majority of samples.
Skeetkill Marsh
Samples were collected from 5 locations.
Samples were analyzed for pesticides, PCBs, and metals.
4,4’-DDE was detected at concentrations above the applicable criteria in 80% of the samples.4,4’-DDD, 4,4’-DDT, a-chlordane were detected, but only exceeded applicable criteria in 20 –40% of the samples.
Where detected, PCBs (aroclor-1254 and aroclor-1260), arsenic, chromium, copper, lead,nickel, and zinc exceeded the applicable screening criteria in a majority of samples. Mercurywas reported as non-detected; however the analytical detection limits were not presented in thedata table.
Harrier Meadow Marsh
Samples were collected from 5 locations.
Samples were analyzed for metals only.
Arsenic, chromium, nickel, and zinc were detected in all samples, but did not exceed theapplicable screening criteria. Copper and lead were detected in all samples and only exceededthe applicable screening criteria in 20 and 40 percent of the samples, respectively. Mercurywas detected in only one sample, and exceeded the applicable screening criteria at thatlocation..

March, 20043-9J:\Project\meri\Report\revisedreport\Report_Final.doc
Mill Creek Marsh
Samples were collected from 28 locations.
Samples were analyzed for pesticides, PCBs, total petroleum hydrocarbons, cyanide, phenol,and metals.
4,4’-DDE, 4,4’-DDT were detected in 35 and 40 percent of the samples, respectively.Approximately 20 percent of the DDT concentrations exceeded applicable criteria, while only 2percent exceeded the applicable screening criteria for DDE.
Aroclor-1254 was detected in 65 percent of the samples, and exceeded the applicablescreening criteria in 61 percent of the samples (95 of samples were aroclor-1254 wasdetected).
Nickel and silver were detected in all samples at concentrations above applicable criteria.Mercury was not detected in 10 percent of the samples, and exceeded applicable screeningcriteria in 77 percent of the samples. Chromium, copper, lead, and zinc were detected in allsamples, and in 83 to 90 percent of the samples.
Eight-day Marsh
Samples were collected from 17 locations at one centimeter depth intervals (1 to up to 32centimeters below the sediment surface).
Samples were analyzed for selected metals only (mercury, arsenic, cadmium, chromium,copper, lead and zinc).
Sediment concentrations of mercury and copper exceeded the applicable screening criteria atall sampling locations within the upper 4 centimeters of the sediment. Less than 9 percent ofthe samples from the upper 4 centimeters were below the screening criteria for chromium.Approximately 95 percent of samples from the upper 4 centimeters exceeded the cadmiumscreening criteria, and 98 percent of samples from the upper 4 centimeters exceeded criteriafor arsenic, lead, and zinc.
Sediment criteria were exceeded for the seven metals at all depths sampled at eleven of theseventeen sampling locations (65%).
A pattern of increase concentration with sample depth was evident for several metals at somelocations with concentrations as much as 10 times higher in the deeper sediments. However,this pattern did not appear to be consistent for a given sampling location, or for any givenmetal.
Detection limits for PAHs in several of the studies (Oritani, Riverbend, Mill Creek, Secaucus HighSchool) were greater than the applicable screening criteria and nearly ten time higher than those used

March, 20043-10J:\Project\meri\Report\revisedreport\Report_Final.doc
in the current study, making meaning full comparisons difficult. The same was true for PCB andpesticide detection limits in the Oritani, Riverbend, and Secaucus High School studies. VOCs weretypically below detection limits in those wetland studies where analyzed.
Concentrations of metals were consistently lowest at Harrier Meadows, and greatest at Eight-dayswamp and Kearny Marsh. Riverbend, Kearny, Oritani and Secaucus High School marshes weresampled as part of historic studies as well as the current project. Only surface samples were collectedas part of this Project, therefore comparisons to historic studies are limited to surface sediment data (0– 6 inches) from the historic studies. A comparison of data between these studies reveals that in mostcases, concentrations of metals for this Project were typically within the range of historically reportedvalues. Exceptions include cadmium at Riverbend and Oritani marshes, and chromium, lead, and zincin Oritani Marsh where concentrations reported in this Study were greater than those reportedhistorically as well as for mercury at Secaucus High School marsh which was less than theconcentrations previously reported. Where metal concentrations observed during this Project werewithin the range of those previously observed, maximum concentrations were lower than thosereported, in some cases by several times or several orders of magnitude (e.g., chromium in KFMreporting a maximum concentration of 49 mg/kg for this Project versus 5950 mg/kg for the historicstudy; and 280 mg/kg versus 1400 mg/kg at SHS; arsenic at RBM of 16.1 mg/kg versus 84 mg/kg;mercury in KFM of 0.52 mg/kg for this study versus 152 mg/kg from the previous study). In othercases, the maximum concentrations between this Project and past studies were similar.
Comparisons were not made for PAHs, PCBs or pesticides given the issues associated with elevateddetection limits for the past studies which analyzed for these contaminants.
3.4 Toxicity Testing
Toxicity tests were completed on whole sediment samples collected from various wetlands. Samplesites were the same as those for bulk chemistry discussed in the previous subsection. With theexception of Kearny Marsh, all wetlands sampled were estuarine. Tests included a 28-day test usingH. azteca (for both estuarine and freshwater sediment samples), and 10-day tests using C. tentans forfreshwater sediment samples and N. arenaceodentata for estuarine sediment samples. Results arecompared to a negative control. Negative control sediments are sediments known to produce at least90% survival. Sawmill Creek (SAW) was identified as a reference site based on information suppliedby NJMC/MERI. However, as noted in the bulk chemistry results as well as the toxicity results below,the SAW-01 and SAW-02 samples did not reflect an “unimpaired” condition. Given the nature of theMeadowlands today, it is unlikely that an “unimpaired” condition exists in the Meadowlands. As such,all test results are compared to the negative control rather than using the “reference” samples forcomparison.

March, 20043-11J:\Project\meri\Report\revisedreport\Report_Final.doc
3.4.1 Toxicity Testing Results
Tables 3-8 and 3-9 present the results for the 28-day and 10-day toxicity tests for estuarine andfreshwater sites, respectively. Each table presents both percent survival and mean weight per testorganism at test initiation. Detailed results are provided in Appendix C of this report. Because mortalityof some individuals throughout the testing period may provide greater availability of food for theremaining individuals, biomass is normalized to the number of organisms at test initiation. Biomass (asa measure of growth) is presented in Tables 3-8 and 3-9.
The negative control exhibited a 90% mean survival rate for the 28-day toxicity test for estuarineconditions. The 28-day mean survival rate for SAW-01, RBM-01, and SHS-01 were less than andsignificantly different than those for the negative control. Biomass was 0.54 mg for the negativecontrol, but was greatest in ORM-02 (0.99 mg) and SAW-01 (1.02 mg). RBM-01 exhibited the lowestsurvival (36.25%) and lowest biomass (0.33 mg) among the 28-day test samples. Biomass for theRBM-01 sample was significantly different from that of the negative control. In the Kearny Marsh 28-day tests run with reconstituted water (freshwater condition), there was no significant differencebetween the test samples and the negative control for either survival or biomass.
Mean survival in the 10-day test negative control for estuarine conditions was 92.5%. Percent survivalin ORM-01, ORM-02, RBM-01, and SHS-01 were lower than and significantly different from thenegative control. The RBM-01 sample exhibited the lowest mean survival at 25%. Survival was lessthan 56% for the above samples. Mean biomass in the negative control was 0.33 mg. Biomass inSAW-01 and RBM-02 were lower and significantly different from the negative control. Mean biomass inother samples were less than the negative control, but were not statistically significantly different fromthe negative control. The survival rate for the freshwater test samples were all above 75%, and onlythe KFM-01 was less than and significantly different from the negative control. However, biomass waslower and significantly different from the negative control for all the Kearny Marsh test samples.
3.4.2 Application and Uncertainty of Sediment Toxicity Tests
Toxicity tests with sediments have evolved into an important tool in the evaluation of sediment quality.Unlike chemical analyses or biological community assessments, from which the toxicity of sedimentcontaminants can only be inferred, toxicity tests provide direct empirical evidence of the biologicalconsequences of exposure to contaminated sediment. Toxicity studies can be a critical component inassessing real-world ecological risk since the physical and chemical characteristics of sediments play asignificant role in the bioavailability of contaminants. High concentrations of organic carbon, forexample, may reduce the bioavailability of some materials (e.g., copper). Conversely, very low levelsof organic carbon may increase bioavailability, but may also result in poor habitat (and thus lessexposure), particularly if the substratum is highly consolidated with few interstitial spaces suitable forbenthic organisms.

March, 20043-12J:\Project\meri\Report\revisedreport\Report_Final.doc
Like all toxicity tests, a sediment toxicity study is a unique scientific investigation, the goal of which is tocontrol all variables except the test medium, or sediment. As such, each toxicity test will be somewhatdifferent than all previous and succeeding tests. This is true even if variables such as test chambers,temperature, lighting, and overlying water remain the same. Each set of tests used a different batch oforganisms that may be of slightly different age and/or of slightly different health than other batches.New batches of food may also be of slightly different quality than previous batches. Variability amongtests is, therefore, to be expected. In addition, even within a given test and treatment, the responses ofindividual replicates can vary substantially. It is not unusual to have low survival or growth in one ortwo replicates while the other replicates from the same sediment show a much better response. Theresulting variance contributes to uncertainty in interpreting toxicity test results. Clearly defined results(e.g., 100% mortality) are easy to interpret, but responses that cluster around the threshold of statisticalsignificance are more difficult to describe and complicate risk assessments and/or mitigation plans. Forthat reason, toxicity test results that show only marginal responses should be interpreted with cautionand reviewed in light of the other legs of a Sediment Triad – chemical analyses and biologicalcommunity assessments.
Toxicity testing was completed in accordance with the QAPP and associated SOPs with someexceptions.
Hyalella azteca were 13-days old at initiation. The B-H Laboratories standard operatingprocedure for the Hyalella azteca test (ATL/SEDHACHR.050) states that organisms will be 7-8days old for a 28-day test. Organism age is within range for a 10-day test (7-14 days); there isno EPA-mandated age range for a 28-day test. Since all organisms were within the same agerange, this deviation from the SOP probably did not affect test outcome.
Chironomus tentans was 14-days old at test initiation. The report states that the organismswere 2nd to 3rd instar, which is the target metamorphic stage of C. tentans at test initiation.However, the USEPA sediment testing manual (page 43) states that organisms 12.5 days oldor older are probably 4th instar. Without head capsule measurements, or another acceptablemethod of determining instar, it cannot be determined if organisms were of the correct stage atinitiation. Older organisms have been found to be less sensitive to some toxicants. This couldbe a deviation that might reduce the sensitivity of test organisms to the test sediment.
Dry weight for amphipods and chironomids should be determined at 60 to 90°C, rather than100°C. However, drying at 100°C is more typical for other toxicity tests and since all organismswere dried at the same temperature, this deviation should not have any effect on test outcome.
Sediments were screened to remove large material (e.g., large pebbles, stones, twigs and plantclumps) and homogenized prior to subsampling for toxicity test replicates. However, as wetlandsediments likely include un-decomposed or partially decomposed plant material, it is possible thatcontaminants may not be equally distributed in the whole sediment sample. This may result invariability among the replicates.

March, 20043-13J:\Project\meri\Report\revisedreport\Report_Final.doc
A discussion of potential relationships between sediment chemistry, benthic community, and the abovedescribed toxicity testing is provided in Section 6.0.

March, 20044-1J:\Project\meri\Report\revisedreport\Report_Final.doc
4.0 ECOLOGICAL RISK ASSESSMENT
4.1 Introduction
As part of the evaluation of the ecological health of the Meadowlands wetlands of interest, ENSR usedsediment and surface water quality data from the NJMC/MERI wetland database (See Appendix F;(Langan EES, 1999; Louis Berger, 2001; TAMS, 2001a; TAMS, 2001b; ECI, 1997a; ECI, 1997b;HMDC, 1997; Weis, J. and P. Weis, undated) as well as data collected as part of this study to performa screening-level ecological risk assessment (SLERA). The purpose of the SLERA was to provide aconservative evaluation of the potential risks to ecological receptors posed by constituents in sedimentsand surface water in the wetlands under consideration, and to identify wetland area and chemicals ofpotential concern (COPCs) which warrant further investigation. The SLERA followed U.S. EPAguidance on ecological risk assessments (U.S. EPA, 1997). Food web modeling results from theSLERA were also used to generate the standard curves for rapid risk assessment described in Section5.0. The approach and content of the SLERA were described in the approved Quality AssuranceProject Plan for Meadowlands Wetland Ecological Risk Assessment Project, Revision 1 (ENSR, 2003).
4.1.1 SLERA Guidance and Organization
The SLERA for this project was conducted using methods adapted from relevant risk guidance,including the following:
Framework for Ecological Risk Assessment (U.S. EPA, 1992);
Intermittent “ECO Update” Bulletins of U.S. EPA; and
Ecological Risk Assessment Guidance for Superfund: Process for Designing and ConductingEcological Risk Assessments (Interim Final) (U.S. EPA, 1997).
In should be noted that there are some significant differences between the formal process outlined bythe Ecological Risk Assessment Guidelines for Superfund (ERAGS) (USEPA, 1997) and this project.These differences are summarized below:
The results of the Meadowland ERA project are to be used for planning and risk managementdecisions rather than as ecological risk assessment conducted under the Superfund (CERCLA)program;
The ERAGS guidance provides a methodology to investigate a hazardous waste site at whichthe contaminants of potential concern (COPCs) may or may not be fully characterized.ERAGS directs an inclusive, conservative approach by which a large universe of contaminantsis initially considered and conservatively screened in the SLERA to see which contaminants

March, 20044-2J:\Project\meri\Report\revisedreport\Report_Final.doc
require further investigation in the Baseline Ecological Risk Assessment (BERA). Based on theresults of the SLERA, a potentially large number of contaminants may be brought forward intothe BERA, including those based on exceedance of a media-based benchmark and those dueto a lack of appropriate screening values. Final decisions regarding which contaminants areconsidered COPCs are made in the BERA. This is done to assure that all chemicals from allpotentially liable responsible parties (PRPs) are accounted for and to assure that remediationwill address all unacceptable chemical-based risks;
In contrast, this project, while relying on the ERAGS as a useful guidance document for anecological risk assessment framework, is not driven by the same regulatory program, hasdifferent objectives, and is confined by available budget for this study. In this case, this projectis intended to conduct a pragmatic assessment of potential ecological risk, based mostly onavailable historic data and knowledge of historical impacts, with limited supplemental sedimentand benthic sampling, and a defined budget. The output of the ecological risk assessment willprovide NJMC/MERI with a better understanding of the relative levels of risk for a variety ofreceptors over a gradient of sediment contaminant concentrations.
The ERAGS anticipate completion of all eight steps of the U.S. EPA’s eight-step process for ecologicalrisk assessment under Superfund toward the end of site cleanup. This SLERA compares to Steps 1and 2 of U.S. EPA’s eight-step process for ecological risk assessment under Superfund (Figure 4-1).As noted above, the objective here is to develop tools useful in planning and decision-making ratherthan remediation of the wetlands. Should additional investigation be warranted to achieve the projectobjectives, such work would be scoped and addressed in future phases of work.
4.1.2 Organization of the SLERA
The SLERA is organized into the three following major sections suggested by U.S. EPA's Frameworkfor Ecological Risk Assessment (U.S. EPA, 1992). These sections are Problem Formulation, Analysis,and Risk Characterization. A brief description of the content and purpose of these sections are givenbelow.
1) Problem Formulation — provides the basis for decisions regarding the scope and objectives ofthe risk assessment. Information is collected and evaluated to develop a conceptual site model(CSM) of the site, in which the contaminants and potential exposure pathways are initiallyidentified. This planning step contributes to the following processes:
definition of risk assessment objectives of the SLERA;
brief description of the of the Meadowlands wetlands and ecological receptors;
brief description of contaminant sources and affected media;
identification of chemical contaminants to be evaluated as COPCs;

March, 20044-3J:\Project\meri\Report\revisedreport\Report_Final.doc
selection of potential receptors and receptor pathways;
selection of assessment and measurement endpoints; and
formalization of these selections via development of a CSM.
2) Analysis of Exposure and Effects — quantifies the magnitude, frequency, type, and duration ofexposures of ecological receptors to COPCs at the site. Information is collected to:
describe the statistical treatment of the environmental media data and selection of theexposure point concentrations (EPCs) to be evaluated;
discuss the bioavailability of chemicals in the species' exposure media [Note: chemicalsassumed to be 100% bioavailable for purposes of this SLERA] ;
select the benchmarks to be used to relate chemical concentrations in the relevantenvironmental media to potential adverse ecological effects; and
provide details on the assumptions and exposure factors to be used in the evaluation of wildlifereceptors.
3) Risk Characterization — synthesizes the exposure and effects information to estimate theprobability for and extent of adverse ecological effects, identifies uncertainty factors and evaluatespotential effect on risk characterization findings, and identified potential data gaps. Data andsupporting scientific judgments and/or modeling results are interpreted, so that:
qualitative and quantitative statements about potential ecological risk can be advanced;
sources of uncertainty are identified and the influence estimated;
the site's potential to pose adverse ecological risk to biota and habitats can be determined;
COPCs and/or exposure pathways that need to be further evaluated are identified.
The SLERA is organized in the following manner: Introduction (Section 4.1), Problem Formulation(Section 4.2), Analysis of Exposure and Effects (Section 4.3), Risk Characterization including adiscussion of uncertainty (Section 4.4), and Summary and Conclusions (Section 4.5). References areprovided in Section 9.0. Additional supporting data calculations and correspondence are contained inthe Appendices.
4.2 Problem Formulation
Problem formulation is the initial systematic planning phase of the ecological risk assessment process.It provides the basis for the approach and methodology to be used as well as defining the specificscope and objectives of the risk evaluation. The problem formulation phase includes sitecharacterization, identification of potential ecological receptors of interest, identification of potential

March, 20044-4J:\Project\meri\Report\revisedreport\Report_Final.doc
exposure pathways for those receptors, identification of contaminants to be further evaluated, selectionof assessment and measurement endpoints, and development of the CSM for the SLERA.
4.2.1 Selection of Ecological Receptors
Figures 2-2 through 2-6 illustrate the sampling locations within each wetland area. The Meadowlandswetland study area includes one freshwater and eight estuarine marshes. As described in Section 2.2,the focus of the SLERA is based on information and data from one freshwater and four estuarinewetlands. As part of the problem formulation, available documentation was reviewed to brieflycharacterize the habitat and receptors available within these wetlands. Sources of potential informationthat were consulted included:
Previous wetland studies and reports conducted or sponsored by NJMC/MERI (see listprovided in Section 3.3.1.2);
NJMC/MERI “Digital Meadowlands” electronic database;
NJ DEP Geographical Information Service (GIS) maps;
USGS topographic quadrangle maps;
Hudsonia, Ltd. 2002. Hackensack Meadowlands, New Jersey, Biodiversity: A Review andSynthesis. Prepared for Hackensack Meadowlands Partnership. August 2002; and
other available site reports, maps, and information.
The following sections provide an overview of the wetlands of interest and the ecological receptors(plants, birds, mammals, fish, and invertebrates) which reside there. Much more extensivedocumentation is available in a variety of reports, documents, and databases at the NJMC/MERIwebsite (http://cimic.rutgers.edu/meri/).
4.2.1.1 Wetlands Habitats of Interest
The five wetlands (See Section 2.1) selected for this assessment and include Kearny FreshwaterMarsh (KFM), Oritani Marsh (ORM), Riverbend Marsh Wetland Preserve (RBM), Sawmill Creek WildlifeManagement Area (SAW), and Secaucus High School Marsh (SHS).
4.2.1.2 Ecological Receptors of Interest
Potential ecological receptors of interest for this project include both aquatic communities (fish, benthicinvertebrates) and wildlife receptors (birds, mammals). A brief summary of the receptor classes andsome of the important species are given below.

March, 20044-5J:\Project\meri\Report\revisedreport\Report_Final.doc
Fish Community
The fish community in the Meadowlands wetlands is comprised of species adapted to the range ofeuryhaline conditions found in the tidal estuarine and freshwater wetlands and includes both residentand migrant (transient) species. An extensive fish survey and species inventory was conducted over atwo year study in 1987-1988, which found 34 species (HMDC, 1989). The more abundant andcommonly occurring fish were mummichog (Fundulus heteroclitus), Atlantic silverside (Menidiamenidia), inland silverside (Menidia beryllina), white perch (Morone americana), blueback herring(Alosa aestivalis), Atlantic tomcod (Microgadus tomcod), brown bullhead (Ictalurus nebulosus),pumpkinseed (Lepomis gibbosus), American eel (Anguilla rostrata), bay anchoy (Anchoa mitchilli),striped killifish (Fundulus majalis) and striped bass (Morone saxatalis). The catch was greatlydominated by mummichog (85-91% of total catch) with silverside species, and white perch alsocommon. Another fish survey and inventory is currently being completed (Bragin et al., in prep) whichwill update the species list for the wetllands and adjacent Hackensack River and several of itstributaries. The lower Hackensack River system has been declared Essential Fish Habitat by theNational Marine Fisheries Service (NMFS) for red hake, black sea bass, Atlantic butterfish, and threeflounder species (Day et al.,, 1999)
Aquatic Invertebrates
Aquatic invertebrates were sampled as part of the sampling and inventory survey conducted over 1987-1988 (HMDC, 1989). More recent studies (2000 – 2001) have also been completed for many of themarshes. Aquatic and epibenthic forms included several shrimp species; including mysid (Neomysisamericana), grass (Palaemonetes pugio), and sand (Crangon septemspinosa), as well as severalspecies of amphipods. A large number of blue crab (Callinectes sapidus) were taken as werepolychaetes, oligochaetes, and mollusks. White-fingered mud crab (Rhitropanopeous harrissii) andfiddler crab (Uca pugilator) were also present. Aquatic insect larvae, midges (particularly Chironomidaeand Ceratopogonidae) and mosquito (Aedes spp.) were found in abundance in many areas within themarshes.
Birds
Bird inventories have identified 260 bird species known to occur in the Meadowlands, includingresident, migrant (spring and fall), breeding (summer) and wintering birds (Hudsonia, 2002). Thisdiversity is due to the wide range of habitats afforded by the interspersed freshwater and brackishwetlands with upland and residual forested areas. Waterfowl and shorebirds also occur in largenumbers during seasonal migration periods.
Common resident wetland-associated nesting bird species include swamp sparrow (Melospirzageorgiana), savannah sparrow (Passerculus sandwichensis), red-winged blackbird (Agelaiusphoeniceus), and marsh wren (Cistothorus palustris). Waterfowl species that are typically observed

March, 20044-6J:\Project\meri\Report\revisedreport\Report_Final.doc
include Canada goose (Branta canadensis), American black duck (Anas rubripes), mallard (Anasplatyrhynchos), canvasback (Aythya valisineria), greater scaup (Aythya marila), gadwall (Anasstrepera), ruddy duck (Oxyura jamaicensis), green-winged teal (Anas crecca), and northern pintail(Anas acuta). Wading birds that are common to the Meadowlands include black-crowned night-heron(Nycticorax nycticorax), American bittern (Botaurus lentiginosus), glossy ibis (Plegadis falcinellus),great egret (Casmerodius albus), green heron (Butorides striatus), least bittern (Ixobrychus exilis),snowy egret (Egretta thula), great blue heron (Ardea herodias), and yellow-crowned night-heron(Nyctanassa violacea) (Hudsonia, 2002).
Mammals
Mammal surveys conducted in the late 1980 – early 1990 indicated that about 20 species of mammalswere observed in the Meadowlands. These included those found primarily in the primary wetland areasas well as those found along adjacent/abutting road and rail beds, pipeline corridors, landfills, and otherelevated areas (Hudsonia, 2002). The muskrat (Ondatra zibethicus) is probably the most importantmammal species in the marshes. Other rodent species include white-footed mouse (Peromyscusleucopus), meadow jumping mouse (Zapidus hudsonius), meadow vole (Microtus pennsylvanicus),house mouse (Mus musculus), Norway rat (Rattus norvegicus), woodchuck (Marmota monax), easternchipmunk (Tamis striatus), and eastern grey squirrel (Sciurus carolinensis). Other mammals includedmasked shrew (Sorex cinerus), eastern mole (Sqalopus aquaticus), eastern cottontail (Sylvilagusfloridanus), raccoon (Procyon lotor), opossum (Didelphis virginiana), striped skunk (Mephitis mephitis),red fox (Vulpes vulpes), mink (Mustela vison), little brown bat (Myotis lucifugus) and white-tailed deer(Odocoileus virginianus).
4.2.1.3 Species of Special Interest
The presence of federally or state-listed species (i.e., threatened/endangered species or species ofspecial concern) in the Meadowlands was assessed. No federally listed threatened or endangeredspecies are currently known to occur in the Meadowlands (Hudsonia, 2002). However, a number ofstate-listed species are potentially present. Based on the New Jersey Department of EnvironmentalProtection (NJDEP) Natural Heritage program listing in October 2001, 42 species potentially present inthe Meadowlands were listed as endangered and threatened species or were listed as rare species;including 33 bird, 3 amphibian, 1 reptile, 2 fish and 3 plant species (Hudsonia, 2002). According to theNJMC Master Plan (NJMC, 2003), twelve endangered, threatened or declining species of birds, onesuch reptile (wood turtle), and seven such plant species have been sighted within the MeadowlandsDistrict.

March, 20044-7J:\Project\meri\Report\revisedreport\Report_Final.doc
4.2.1.4 Selected Representative Ecological Receptors
These species are likely to occur in the Hackensack Meadowlands wetlands and may forage on preyspecies at several trophic levels in the area, including vegetation, fish, and shellfish (e.g., fiddler crab).The factors considered in the selection of the ecological receptors included: (1) potentially exposed tochemical stressors in surficial media at the site; (2) presumed to play key roles in site ecosystems; (3)have complex life cycles that include sensitive life stages; and (4) conservatively representative of therange of trophic levels in food webs and food chains in the Hackensack Meadowlands. The selectedreceptors included wetland vegetation, benthic macroinvertebrates, mallard duck, muskrat, great blueheron, and mink.
Wetland Vegetation
The vegetation found in the estuarine (ORM, RBM, SAW, SHS) and freshwater (KFM) tidal wetlandsfound in the Meadowlands was selected as a receptor community. This includes the assemblage ofcommon plants found in these areas, including, but not restricted to: saltmeadow and saltmarshcordgrass (Spartina), common reed (Phragmites), cattail (Typha), loosestrife (Lythrum), spikerush(Eleocharis), and spikegrass (Distichlis). For a fuller listing of species see description of wetlandsprovided in Section 2.2. Evaluation of this receptor community assesses the potential influence ofsediment quality on the overlying plant community.
Benthic Macroinvertebrates
[Benthic macroinvertebrates in the tidal wetlands were selected as a receptor community. This is adiverse community that includes macroinvertebrates in the water column (shrimp species), epifaunal(crab species), and in-faunal (midge larvae). Evaluation of this receptor community assesses thepotential influence of sediment quality on the benthic macroinvertebrate community health.
Mallard (Anas platyrynchos)
This surface feeding duck was selected as a representative avian herbivore species for evaluation ofpotential risks associated primarily with sediment exposure in the wetlands. The mallard is a commonsurface feeding duck that inhabits freshwater and saltwater ponds and wetlands. They feed mainlyaquatic plants, often filtering through soft mud for the seeds (U.S. EPA, 1993a,b). The mallard is amigratory bird, but may be present in the study area during a majority of the year. Mallards arerecreationally hunted and were selected to allow the evaluation of an herbivorous exposure pathway forthe aquatic sites.

March, 20044-8J:\Project\meri\Report\revisedreport\Report_Final.doc
Muskrat (Ondatra zibethicus)
The muskrat was selected as a representative mammalian herbivore wildlife species for evaluation ofpotential risks associated primarily with sediment exposure in the wetlands. The muskrat is a commonmammal that inhabits ponds, streams, swamps, and a variety of other aquatic habitats. They feedmainly on the roots and basal portions of aquatic plants, but may also consume shoots, bulbs, tubers,stems, and leaves (U.S. EPA, 1993a,b). Selection of the muskrat allows evaluation of an herbivorousexposure pathway.
Great Blue Heron (Ardea herodias)
The great blue heron was selected as a representative avian carnivore for the evaluation of potentialrisks associated with exposure to sediment and surface water contaminants within the wetlands. Greatblue herons inhabit a variety of freshwater and marine areas, including marshes, lakes, streams, andwetlands. While fish are the preferred prey, herons will also consume amphibians, reptiles,crustaceans, insects, birds and mammals (U.S. EPA, 1993a,b). Many herons migrate south during thecoldest months in the northeast, leaving in October or November and returning in February or April(U.S. EPA, 1993a,b), although great blue herons are reported to remain in the area year round.Selection of the great blue heron allows evaluation of a piscivorous exposure pathway in the aquaticsystems.
Mink (Mustela vison)
The mink was selected as a representative mammalian carnivore species for evaluation of potentialrisks associated with sediment and surface water exposure in wetlands. It is sensitive to PCBs andsimilar chemicals, and it serves as a bioindicator of mercury pollution in aquatic habitats. It wasselected to evaluate the exposure of compounds in surface water and sediment due to its associationwith aquatic habitats and its opportunistic feeding habits which include fish, amphibians, crustaceans,shorebirds, insects, small mammals (e.g. shrews), and other prey items that may bioaccumulatecompounds from sediments. The mink is the most abundant and widespread carnivorous mammal inNorth America. They feed on aquatic prey such as fish, frogs and invertebrates. Mink are active year-round and are found in a variety of aquatic habitats including rivers, streams, lakes, and swamps (U.S.EPA, 1993a, U.S. EPA, 1993b). Selection of the mink allows evaluation of a piscivorous exposurepathway for the aquatic sites.
4.2.2 Selection of Exposure Pathways
Potential complete exposure pathways for ecological receptors were identified through documents andmaps. Exposure pathways for several groups of ecological receptors were identified as potentiallyrelevant. Each exposure pathway includes a potential source of COPC, an environmental medium

March, 20044-9J:\Project\meri\Report\revisedreport\Report_Final.doc
(surface water, hydric soil or sediment), and a potential exposure route. Following U.S. EPA guidance,incomplete routes of exposure were not evaluated in the SLERA. This approach is used to focus therisk evaluation on exposure pathways that are considered to be potentially complete and for whichthere are adequate data pertaining to the receptors, exposure, and toxicity for completion of the riskanalysis. The selected exposure pathways are discussed below.
4.2.2.1 Sources of Contaminants
For the Meadowlands wetlands, the sources of contaminants are due to the historical and current landuse activities in the Meadowlands. The Meadowlands were widely used for waste and fill disposalduring a period from the late nineteenth century through current times. In addition to these disposalactivities, there was significant alteration of the hydrological and drainage patterns of the wetlands, dueto the building of embankments for roads and railways, agriculture, residential encroachment, andmosquito control projects. The soils and sediments have been impacted by direct dumping anddischarges as well as by stormwater runoff and groundwater leachate from bordering areas. Inaddition, the wetlands are susceptible to any spills or releases to the Hackensack River. Furthermore,pollutants entering Newark Bay from the polluted Passaic River, Arthur Kill, and New York Bay may betransported upstream into the Hackensack River through tidal activity.
Currently, there are approximately 2,500 acres of solid waste landfills in the Meadowlands and sevenNational Priority List (NPL) sites within 2 miles (Hudsonia, 2002). There are also numerous (50+)active industrial discharges, two power generating plants, three sewage treatment plants, and anumber of combined sewer overflows, and emergency overflows within the Meadowlands District. Allof these current and legacy discharges have led to on-going challenges to the water and sedimentquality in the Meadowlands wetlands. Due to the widespread nature of the contamination, the range ofpotential contaminants includes heavy metals, PAHs and other hydrocarbons, PCBs, and other organicchemicals and the affected media include surface water, hydric soils, and sediments.
4.2.2.2 Exposure Pathways
As part of the SLERA, it is necessary to identify and select exposure pathways through whichecological receptors may be potentially affected by relevant media at the site. The SLERA riskevaluation focused on the exposure pathways for which (1) there was a complete exposure pathwaybetween affected media and ecological receptor, (2) the chemical exposures were the highest andmost likely to occur and (3) there were adequate data pertaining to the receptors, exposure pathways,and toxicity for completion of risk analyses. Based on evaluation of the site media and ecologicalreceptors, the following complete ecological exposure pathways were evaluated in the SLERA:
Direct contact of sediment/hydric soil by wetland vegetation;
Direct contact and ingestion of sediment by benthic invertebrates (e.g., shellfish);

March, 20044-10J:\Project\meri\Report\revisedreport\Report_Final.doc
Direct contact with sediment and surface water by aquatic vertebrates (i.e., fish); and
Ingestion of contaminated prey items (plants, prey species ) by vertebrate wildlife receptors(e.g., birds and mammals)
Not all exposure pathways will be evaluated. For example, the inhalation pathway, while complete, wasnot considered, due to the nature of the contaminants (not a large number of volatile chemicals) andthe difficulty of finding toxicity reference values for this pathway. For depiction of the selected exposurepathways refer to Conceptual Site Model (CSM) (Figure 4-2).
4.2.3 Identification of COPCs
As noted above, the historic and current land uses have led to the introduction of a wide spectrum ofchemicals into the surface water and sediments in the Meadowlands wetlands. Chemical contaminantsunder consideration are based on previous sampling and analytical data collected within theMeadowlands wetlands study areas. In general, these include priority pollutants (e.g., heavy metals,organics, other) for both surface water and sediment. Some ancillary data (e.g., total organic carbon,hardness) is also available for some wetlands for consideration in the SLERA. Available qualifiedchemical data identified in the NJMC/MERI database were evaluated. Data contained in theNJMC/MERI database were considered sufficiently validated for purposes of the SLERA unlessotherwise noted. The specific data that were used in the SLERA are described in Section 4.3.
4.2.3.1 Approach for Identifying COPCs
As noted earlier (Section 4.1), U.S. EPA’s guidance (U.S. EPA, 1997) directs an inclusive, conservativeapproach by which the entire universe of contaminants at a site is initially considered andconservatively screened in the SLERA to see which contaminants require further investigation in theBERA. In contrast, the Meadowlands SLERA project, while relying on the U.S. EPA guidance as auseful guidance document for an ecological risk assessment framework, is conducting a pragmaticassessment of potential ecological risk, based mostly on available historic data, with limitedsupplemental sediment and benthic sampling, and a defined budget. The results of the SLERA will beused for risk management decisions and not to direct regulatory compliance and/or cleanup activities.
Screening level analysis for benchmarks protective of benthic communities and wetland vegetationwere completed for all detected sediment and surface water contaminants. However, it wasconsidered appropriate to limit full evaluation (i.e., food web modeling and development of risk curves)to a limited sub-set of the potential COPCs. Based on contractual constraints a maximum of 10COPCs could be examined as part of food web modeling, however an eleventh COPC was added toaccommodate the key contaminants of concern. These Meadowlands-wide COPCs were selectedfrom among the list of contaminants which exceeded the screens for aquatic, benthic, and vegetationreceptors for the Meadowlands wetlands of interest. Chemicals that did not have an exceedance of any

March, 20044-11J:\Project\meri\Report\revisedreport\Report_Final.doc
media benchmark in the wetlands sampled in 2003 were eliminated from further investigation. Thosechemicals that exceeded benchmarks were considered for selection as COPCs, but not all chemicalsexceeding benchmark were selected as COPCs. Details of the screening of contaminants againstbenchmarks for protection of aquatic, benthic and plant receptors are provided in Section 4.3.2 and4.3.3. The final selection of Meadowlands-wide COPCs was based on a number of factors including:
distribution and magnitude of the sediment benchmark exceedances with focus on the fivewetlands of interest – Kearny Freshwater Marsh (KFM), Oritani Marsh (ORM), RiverbendMarsh Wetland Preserve (RBM), Sawmill Creek Wildlife Management Area (SAW), andSecaucus High School Marsh (SHS);
the contaminant concentration relative to reference/background data;
distribution of COPCs between major contaminant classes (i.e., metals, organics, persistentbioaccumulation (i.e., accumulation in an organism as a result of uptake) or and toxic (PBT)chemicals);
potential for biomagnification (accumulation to higher concentrations at higher trophic levelsthough dietary accumulation); and,
best professional judgement (BPJ) (this included consideration of exceedance in otherMeadowlands wetlands including Skeetkill Marsh, Harrier Meadows Marsh, Kearny Marsh(estuarine component), and other locations).
To support the identification of COPCs to carry forward into the risk assessment, particularly the foodweb modeling, comparison was made between sediment screening benchmarks and contaminantsdetected in the 2003 sediment sampling in the Meadowlands wetlands of interest. Two sets ofcomparison were made: (1) between sediment concentrations and sediment screening benchmarksprotective of benthic invertebrates (see Section 4.3.3), and (2) between sediment concentrations andsediment screening benchmarks protective of vegetation (see Section 4.3.2). COPCs were selectedusing data from these analyses as well as the other factors described above.
4.2.3.2 Results of COPC Selection
Based on this evaluation, eleven chemicals were carried forward into the food web modeling asMeadowlands-wide COPCs including:
seven heavy metals (arsenic, cadmium, chromium, copper, lead, mercury, zinc);
two pesticides (alpha-chlordane, 4,4’-DDE);
polychlorinated biphenyls (evaluated as total PCBs); and
polynuclear aromatic hydrocarbons (evaluated as total PAHs).

March, 20044-12J:\Project\meri\Report\revisedreport\Report_Final.doc
Refer to Sections 4.3.2 and 4.3.3 for screening analyses used to support the COPC selection.
4.2.4 Development of the Conceptual Site Model (CSM)
The end product of the problem formulation step is the development and refinement of the CSM. TheCSM for the Site describes the origin, fate, transport, exposure pathways, and receptors of concern.The ecological CSM graphically portrays a series of working hypotheses regarding how the COPCsmight pose hazards to the ecosystem and ecological receptors at the site. The SLERA focuses onthose pathways for which (1) chemical exposure are the highest and most likely to occur; and (2) thereare adequate data pertaining to the receptors, exposure pathways, and ecotoxicity.
The CSM for the Meadowlands wetlands is presented in Figure 4-2. The CSM indicates thatcontaminants enter the Meadowlands wetlands from historic and current sources (e.g., landfills,industrial areas, transportation corridors) via spills, releases, surface erosion and stormwater runoff, aswell as groundwater discharge to the wetlands. These chemicals may also be transported to thewetlands by tidal flushing from contaminant sources (both upstream and downstream) within theHackensack River watershed as well as sources from outside the watershed. The affected media arethe sediments, hydric soils, and surface water. Exposure to ecological receptors in the wetlands tothese media occurs from direct contact, ingestion or root uptake and indirectly from ingestion of plantmaterial or fish and benthic invertebrate prey tissue. As shown in Figure 4-2, the SLERA evaluated fishand benthic invertebrates, aquatic plants, semi-aquatic mammalian and avian herbivores, and semi-aquatic mammalian and avian piscivores.
4.2.5 Selection of Biological Endpoints to be Assessed
As part of the CSM, ecologically-based assessment and measurement endpoints relevant to theprotection of natural resources at the Meadowlands wetlands were developed (Table 4-1). Assessmentendpoints describe the characteristics of an ecosystem that have an intrinsic environmental value thatis to be protected (i.e., protection of warmwater fish community; no potential risk to endangeredspecies). Typically, assessment endpoints and receptors are selected for their potential exposure,ecological significance, economic importance, and/or societal relevance (Table 4-1).
Because assessment endpoints often cannot be measured directly, a set of surrogate endpoints(measurement endpoints) are generally selected for ecological risk assessment that relate to theassessment endpoints and have measurable attributes (e.g., comparison of media concentration toscreening benchmarks, results of food web models). These measurement endpoints provide a metricfor evaluating potential effects of chemicals on the ecosystem components at risk.
The measurement and assessment endpoints evaluated in the SLERA are presented in Table 4-1.These endpoints were selected to (1) provide an evaluation of relevant analytical data; (2) provide a

March, 20044-13J:\Project\meri\Report\revisedreport\Report_Final.doc
risk characterization integrating several trophic levels; and (3) serve as the basis for refinement ofCOPCs that may, if appropriate, be used in further tier(s) of ecological risk assessment. The broadnature of assessment endpoints proposed for this project is appropriate for a SLERA. However, suchassessment endpoints may need to be refined if further assessment (e.g., BERA) were pursued.
The four assessment endpoints selected for the SLERA were:
Assessment Endpoint #1 - Protection and maintenance of wetland plant community;
Assessment Endpoint #2 - Protection and maintenance of estuarine sediment-associatedaquatic receptors (benthic invertebrate communities);
Assessment Endpoint #3 - Protection and maintenance of estuarine surface water aquaticreceptors (invertebrate and fish communities); and
Assessment Endpoint #4 - Protection and maintenance of a vertebrate wildlife community.
The four measurement endpoints corresponding to the above assessment endpoints were:
Measurement Endpoint #1 - Comparison of contaminant concentrations in the sediment, toscreening benchmarks for wetland plant receptors.
Measurement Endpoint #2 - Comparison of contaminant concentrations in the sediment tosediment benchmarks for estuarine benthic receptors.
Measurement Endpoint #3 - Comparison of estuarine surface water concentrations to chronicambient water quality criteria or similar conservative benchmarks. Screening of sediment isalso used to assess this endpoint.
Measurement Endpoint #4 –Comparison of the total daily dose (TDD) estimated using anexposure or food web model to a Toxicity Reference Value (TRV) to estimate potential risk.The selected semi-aquatic receptors in the estuarine water area were two birds (mallard, greatblue heron) representing herbivorous and carnivorous feeding habitats and two mammals(muskrat and mink) representing herbivorous and carnivorous feeding habitats, respectively.Fish are addressed as prey items for carnivorous wildlife receptors.
4.3 Analysis of Exposure and Effects
The analysis portion of the SLERA is based on the CSM developed in Problem Formulation. Thepurpose of this section is to quantify the magnitude, frequency, type, and duration of exposures byecological receptors to site contaminants. Information is collected to define chemical sources andchemical partitioning among environmental abiotic media and organisms; estimate the bioavailability ofcontaminants in the relevant exposure media; and attempt to relate chemical concentrations in therelevant environmental media to the potential to produce adverse ecological effects.

March, 20044-14J:\Project\meri\Report\revisedreport\Report_Final.doc
The ecological exposure assessment involves the identification of potential exposure pathways and anevaluation of the magnitude of exposure of identified ecological receptors. The ecological effectsassessment describes the potential adverse effects associated with the identified contaminants toecological receptors and reflects the type of assessment endpoints selected. The methods that wereused to identify and characterize ecological exposure and effects are described in the followingsubsections.
4.3.1 Development of Exposure Point Concentrations (EPCs)
The COPCs identified in Section 4.2.3.2 based on sediment screening (see Sections 4.3.2 and 4.3.3)are listed in Table 4-2, along with their minimum, maximum, and arithmetic mean concentration amongthe sediment samples.
For benchmark screening and food web modeling in the SLERA, the maximum exposure pointconcentration (EPC) was established as a conservative “worst-case” estimate of exposure forecological receptors. The EPCs represent the contaminant concentration in various media (e.g., water,sediment, prey) to which various receptors may be exposed. Qualified sediment data from the fivewetlands of interest was considered for this portion of the task. Available surface water data fromprevious wetland studies (Langan EES, 1999; Louis Berger, 2001; TAMS, 2001a; HMDC, 1997) wereused as a surrogate for surface water COPC exposure. If a contaminant was not detected in aparticular wetland, it was not included in the summary statistics for that wetland.
For ecological effects based screening for communities, the maximum detected concentration in eachmedia from individual wetlands was the evaluated EPC. For the food web modeling, data from allwetlands was pooled and summary statistics calculated to determine EPCs. The maximumconcentration of each constituent in each media (sediment and surface water) was used as the EPC inthe food webs. To calculate the average, a value of one-half the sample quantitation limit (SQL) wasassigned to all samples in which a contaminant was not detected.
4.3.2 Wetland Vegetation Receptor Evaluation
To evaluate the assessment endpoint developed for vegetation receptors, analytical chemistry resultswere compared to benchmark screening values. Maximum detected sediment/hydric soilconcentrations from each wetland were compared against soil screening value derived for theprotection of plant species. As recommended in NJAC 7:26E-3.11 (Technical Requirements for SiteRemediation: Site Investigation – Ecological Evaluation), Contaminant Hazard Reviews compiled bythe U.S. Fish and Wildlife Service and documents published by the Oak Ridge National Laboratory(ORNL) (Opresko, et al., 1993; Efroymson, et al., 1997) were reviewed. Phytotoxicity benchmarks forthe detected contaminants were identified in Toxicological Benchmarks for Screening Potential

March, 20044-15J:\Project\meri\Report\revisedreport\Report_Final.doc
Contaminants of Concern for Effects on Terrestrial Plants (Efroymson, et al., 1997) and are provided inTable 4-1.
Evaluation of sediment quality in the five wetlands of interest indicated widespread exceedance ofphytotoxicity-based sediment screening values (Table 4-4a). Based on this comparison, it can be seenthat the organic contaminants do not exceed the available benchmarks for tPAHs and tPCBs. Nophytotoxicity values were available for the pesticides, but by their very design, pesticides are not likelyto be particularly harmful to vegetation. Based on these factors, it is possible to eliminate the organicCOPCs from further investigation.
Comparison of the metals contaminants to available phytotoxicity screening benchmark valuesindicated widespread exceedances for the metals with the exceptions of cadmium and iron. Cadmiumwas below the benchmark in a majority of the samples and there was no phytotoxicity benchmark foriron. The remaining metals exceeded the benchmarks with the largest relative magnitude ofexceedance exhibited by chromium and the lowest by copper and nickel.
Previous studies did not compare reported sediment concentrations to applicable phytotoxicity criteria.Therefore, historic data from previous wetland studies were compared to similar phytotoxicity screeningcriteria (Table 4-4b). Issues associated with elevated analytical detection limits for pesticides, PAHsand PCBs, preclude meaningful comparison with phytotoxicity criteria and current sampling efforts forthese contaminant classes.
Maximum and mean sediment metal concentrations from previous wetland studies were compared tothe phytotoxicity criteria used in this Project. Maximum copper, lead, and mercury concentrationsexceeded applicable phytotoxicity criteria for all previous wetlands studied. Mean and maximumarsenic, cadmium, chromium, nickel, and zinc concentrations exceeded the criteria for all but one ortwo of the wetlands sampled. Mean concentrations for mercury exceeded the criteria in all wetlandssampled, while mean copper and lead concentrations exceeded the criteria in all but one wetlandsampled. The magnitude of exceedance was greatest for mercury and lowest for nickel. Eight-dayswamp and Kearny Marsh exhibited this greatest magnitude of exceedance for the metals analyzed,while Harrier Meadows reported the lowest magnitude of exceedance for the metals analyzed.
The characterization of the potential risk identified in this section is described in Section 4.4.1.
4.3.3 Aquatic and Benthic Receptor Evaluation
A number of measurement endpoints were used to evaluate the assessment endpoints developed foraquatic and benthic receptors. The effects-based screening focused on the surface water and hydricsoils/sediments collected from within the wetlands and compared the maximum detectedconcentrations against appropriate screening values. Analytes exceeding these conservative

March, 20044-16J:\Project\meri\Report\revisedreport\Report_Final.doc
screening values were retained and most selected for more detailed assessment in the food webmodels.
4.3.3.1 Comparison to Sediment Benchmarks
As recommended in NJAC 7:26E-3.11, estuarine sediment benchmark values were obtained primarilyfrom effects range-low (ER-L) and effects range-median (ER-M) values from Long et al. (1995).Additional sediment benchmark sources included the low effect levels (LELs) and severe effect levels(SELs) from the Ontario Ministry of the Environment (OMOE) (Persaud et al., 1996), and consensus-based Threshold Effect Concentrations (TECs) and Probable Effect Concentration (PECs)(MacDonald et al., 2000). Where appropriate, sediment screening values were adjusted to reflect theexposure area-specific total organic carbon (TOC) content. Historic sediment data were reviewed todetermine the appropriate TOC value (downloaded from http://cimic.rutgers.edu/ecorisk/; Langan EES,1999; Louis Berger, 2001; TAMS, 2001a, b)). Approximately 100 TOC measurements from four of thewetlands (nothing from Sawmill) were identified, ranging from 1.2% to 76% with a median of 5.1%.Therefore, 5% TOC was selected as an appropriate wetland concentration. Use of this relatively lowTOC value results in lower screening values than if a higher TOC value were used, and hencecontributes to the conservativeness of the screening. When available, estuarine sediment screeningvalues were selected before freshwater values. Selected benchmarks are provided in Table 4-1.
Evaluation of sediment quality in the five wetlands of interest indicated widespread exceedance ofbenthos-based sediment screening values for metals in all wetlands, with the exception of chromiumand iron in KFM and ORM (Tables 4-5a and 4-5b). Several of the metals are also known tobioaccumulate (cadmium, chromium, mercury). Chromium was included at the specific request ofNJMC/MERI staff to allow evaluation of site-specific chromium tissue samples derived from an on-going research effort. Iron was not selected as a COPC due to its ubiquity in the natural environment,the low level of exceedance of sediment benchmark (2X), and its role as an essential element. Nickel,although found at levels exceeding screening benchmarks, was not selected based on BPJ, sinceexperience with SLERA in other wetland environments indicates that it is usually not very bioavailableand other metals are more likely to contribute to upper trophic level risk.
The pesticides 4,4’-DDE and alpha-chlordane were selected since their maximum concentrationsexceeded the benchmark values by the greatest amount among detected pesticides (e.g., DDT andrelated fractions). The two pesticides differ in that 4,4’-DDE is distributed widely throughout thewetlands, whereas alpha-chlordane was detected in KFM. PAHs were selected as they are a widelydistributed contaminant in the wetlands and many of the individual PAH fractions were above thescreening level, as was the cumulative total PAHs (tPAHs). PCBs were detected, primarily as Aroclor1248, 1254, and 1260, and were retained due to concern regarding their levels and inherentbioaccumulative properties and potential adverse effects on higher wildlife.

March, 20044-17J:\Project\meri\Report\revisedreport\Report_Final.doc
Historic data from previous wetland studies were also compared to similar screening criteria (seeSection 3.3). Screening results generally identified similar contaminants as exceeding applicablescreening criteria. Issues associated with elevated analytical detection limits for pesticides, PAHs andPCBs, preclude meaningful comparison with current sampling efforts for these contaminant classes.As noted in Section 3.3, sediment metal concentrations observed in this Project for wetlands sampledas part of previous studies were typically within the range of observed values from these previousstudies. However, in many cases the maximum observe metal concentrations from previous studieswere several times to several orders of magnitude higher than those reported for this Project.
The characterization of the potential risk identified in this section is described in Section 4.4.2.
4.3.3.2 Comparison to Surface Water Quality Criteria
Surface water analytical results available from previous wetland studies (Langan EES, 1999; LouisBerger, 2001; TAMS, 2001a; HMDC, 1997) were compared against federal Ambient Water QualityCriteria (AWQC) (U.S. EPA, 2002) or 2002 New Jersey Surface Water Quality Standards (NJAC 7:9b).When these values were not available, other sources were consulted. These included: secondarychronic values (SCVs), lowest chronic values (LCVs) from Oak Ridge National Laboratory (ORNL)(Suter and Tsao, 1996), and Ecological Screening Levels derived by U.S. EPA Region 5 (U.S. EPA,2003). When available, estuarine values were selected before freshwater values. The selected surfacewater quality benchmarks are provided in Table 4-6.
Table 4-7 provides a comparison of average and maximum surface water concentrations for Secaucus,Sawmill, Kearny, and Oritani Marshes to the selected screening values. This comparison indicated thatwhere data was available, the maximum EPC for all the metal COPCs - arsenic, cadmium, copper,chromium, lead, mercury, and zinc exceeded the screening value and needed to be further considered.No organic surface water data was identified during the review.
The characterization of the potential risk identified in this section is described in Section 4.4.3.
4.3.3.3 Critical Body Residue Benchmark Comparison
Organisms may experience adverse effects from chemicals that bioaccumulate or biomagnify. Adverseeffects may include reproductive impairment, reduced growth, mortality, or behavioral changes. Thebioaccumulation factors used in the food web modeling to estimate tissue concentrations (body burden)in prey items (e.g., wetland invertebrates) are provided in Table 4-8. Comparing estimated ormeasured body burden (tissue concentration) to Critical Body Residues (CBRs) taken from thescientific literature can be used to assess potential risk. CBRs are literature-derived tissueconcentrations that are thought to represent toxicological thresholds and can be used to evaluatepotential impacts to communities.

March, 20044-18J:\Project\meri\Report\revisedreport\Report_Final.doc
To evaluate potential impacts to resident crab/shellfish species, predicted invertebrate tissueconcentrations modeled as prey items in the food web, were compared against CBRs identified in thescientific literature. For the evaluation of CBRs, whole body No Observable Effects Dose (NOED)values were selected as the primary CBR value. NOEDs were obtained from the U.S. Army Corps ofEngineers’ Environmental Residue Effects Database (ERED)(http://www.wes.army.mil/el/ered/index.html). ERED is available to the public and allows the user to setvariables (i.e., habitat, species, chemical, age) and query the database from selected peer-reviewedliterature. ERED searches were completed during November and December 2003. CBRs for marineinvertebrate species (i.e., crabs, mussels, urchins) were selected preferentially.
The CBRs for mortality, growth and reproduction for marine invertebrates are summarized in Table 4-9.These CBRs were used for comparison with the model-predicted tissue concentrations in the fiddlercrab (Table 4-10). The model-predicted tissue concentrations in fiddle crab exceeded the maximumCBRs for six of the eleven COPCs. However, model-predicted tissue concentrations of chromium weresubstantially greater than measured tissue concentrations in blue crab (Callinecte sapidus) from theMeadowlands wetlands (Konsevick and Reidel, 1993). Konsevick and Reidel (1993) documentedchromium concentrations ranging from 0.18 to 10.5 mg/kgdw. Assuming 80% moisture content, thesevalues would equate to 0.9 to 52.5 mg/kgww, while the model predicted concentration of chromium was198.7 mg/kgww. This suggests that the model assumptions are highly conservative and likelyoverestimate contaminant body burden in prey species.
4.3.4 Wildlife Receptor Exposure Analysis
The process of assessing exposure for wildlife receptors in the study area involved estimating thepotential dosage for each relevant potentially complete exposure route, and summing these estimatesto derive an expected total daily dosage (TDD) for each receptor. The extent of exposure depends onfactors such as the type of food consumed, feeding rates, habitat preference, and home range. Thefood web models for this SLERA were developed to evaluate the following two potentially completeexposure pathways:
Incidental ingestion of surface water and sediment; and
Ingestion of contaminated prey items.
Food web modeling was used to evaluate potential risks due to COPCs in sediment and surface waterto the following representative mammalian and avian wildlife species: mallard (Anas platyrhynchos);muskrat (Ondatra zibethicus); great blue heron (Ardea herodias); and mink (Mustela vison). Thesereceptors are described in Section 4.2.1.2 g.

March, 20044-19J:\Project\meri\Report\revisedreport\Report_Final.doc
4.3.4.1 Food Chain Modeling
In general, exposure assumptions (body weights, food ingestion rates, relative consumption of fooditems, etc.) for each of these species were obtained from the EPA’s Wildlife Exposure FactorsHandbook, Volumes I and II (U.S. EPA, 1993a, 1993b). The exposure factors used in the food webmodeling are provided in Table 4-11.
To estimate potential exposure to these wildlife receptors from contaminants in surface water andhydric soil, a TDD was estimated for each species. The TDD calculation considers the followingfactors:
maximum concentrations of the COPCs in the food items that the species would consume;
estimated amounts of abiotic media (e.g., hydric soil) that the target species would incidentallyingest;
the relative amount of different food items in its diet, body weight;
exposure duration (ED);
species-specific areas use factors (AUFs), which were defined as the ratio of the organismshome range to the site surface area);
and food ingestion rates.
Prey items for wildlife species evaluated in the food web exposure models include fish, invertebrates,and plants. In the absence of site-specific tissue data, tissue concentrations for COPCs in prey itemswere estimated using literature-derived biota-sediment accumulation factors (BSAFs), root uptakefactors (RUFs), and bioaccumulation factors (BAFs) obtained from U.S. EPA sources, when available(i.e., U.S. EPA, 1999). The uptake and bioaccumulation factors used in the food web modeling toestimate tissue concentrations in prey items were provided previously in Table 4-8.
4.3.4.2 Comparison to Wildlife Toxicity Reference Values and Benchmarks
Toxicity Reference Values (TRVs) were determined for each COPC for avian and mammalianreceptors. The TRV relates the dose of a respective COPC from oral exposure with an adverse effect.The selected TRVs represent a threshold for sub-lethal effects to wildlife receptors. Sub-lethal effectsare defined as measurement endpoints related to impairment of reproduction, growth, or survival. Ingeneral, ecological exposure to compounds is more likely to result in potential sub-lethal effects, ratherthan lethal effects. Ecotoxicological literature values, generally no observed adverse effect levels(NOAELs), were obtained from Sample et al. (1996). Studies which used the site-specific target wildlifereceptors (e.g., mink) were preferentially selected and cited. When studies for these species were notavailable, studies using alternative species were used. Adjustment factors were used to scale NOAELs

March, 20044-20J:\Project\meri\Report\revisedreport\Report_Final.doc
for surrogate test species to an equivalent NOAEL for receptor species using the body weight ratioalgorithms of Sample et al. (1996). The absence of toxicity information for a COPC will be discussed aspart of the uncertainty analyses. TRV benchmarks used to assess potential risk to wildlife receptors areprovided in Table 4-12.
Modeled Total Daily Dose (TDD) for each COPC and target wildlife receptor is summarized in Table 4-13. These modeled TDDs are compared to applicable reference criteria in the next section. Detailsregarding individual components of the TDD are described in Appendix E Tables E8 – E12. Asillustrated in Table 4-13, the comparison of modeled TDD for each wildlife receptor to its respectiveTRV reveals that TRVs are exceeded for the mink and heron for all COPC metals except chromium inthe case of the mink and arsenic for the heron. Muskrat and mallard TDD for mercury only marginallyexceeded the applicable TRV. For organic COPCs, the only TRVs exceeded were for PCBs in themink, and PCBs and DDE in the heron. No organic COPC TRVs were exceeded for the muskrat ormallard.
Exposure estimates were not calculated for historic sediment data. However, such data wereincorporated into food web modeling for the development of wildlife risk curves, as described in Section5.0. The risk curves provided in Section 5.0 provide insight into the relationship between risk (asexpressed by a Hazard Quotient) and modeled total daily dose over a range of sediment and waterconcentrations.
Characterization of the risk associated with the exposures identified in this section is provided inSection 4.4.4.
4.4 Risk Characterization
This section presents the risk characterization for ecological receptors potentially exposed to surfacesoil and sediment at the Meadowlands wetlands of interest. The ecological risk characterizationsummarizes the results of the ecological effects evaluation (Section 4.3), considers potential sources ofuncertainty (Section 4.5), and provides interpretation of the ecological significance of findings. Theresults of the SLERA risk analysis were analyzed and interpreted to determine the likelihood of adverseenvironmental effects, and to determine whether a conclusion of no significant risk could be reached foreach of the four assessment endpoints evaluated. The results of these efforts were interpreted interms of potential current ecological risk and to provide directions for future decision-making (e.g.,about the potential for the restoration of wetlands) in the Meadowlands.
Risk results for the four assessment endpoints are presented and discussed. Two general approachesfor ecological risk characterization were employed.

March, 20044-21J:\Project\meri\Report\revisedreport\Report_Final.doc
Sediment and surface water concentrations in excess of conservative screening values wereidentified and the level of exceedance, as measured by the ratio of the EPC to the screeningvalue or Environmental Effects Quotient (EEQ), identified and discussed. When the EEQ wasless than one, it was assumed that exposure to the COPC would not be associated withadverse effects to single receptors. When the EEQ was greater than one, the potential for riskcould not be excluded; and
Potential risks to the representative vertebrate wildlife species associated with ingestion (asdetermined using food web models) were evaluated using the hazard quotient (HQ) approach.The HQ was calculated for each receptor/COPC pair by dividing the estimated Total Daily Dose(TDD) by the corresponding TRV. When the HQ was less than one, it was assumed thatexposure to the COPC would not be associated with adverse effects to single receptors (i.e.,inhibited growth, reproduction and survival of the individual organism) or wildlife populations.When the HQ was greater than one, this indicated that there was a potential for adverse effectsto a receptor because of COPC exposure (or that the potential for risk could not be excluded).
Where the potential for risk exists (or could not be excluded) the ecological significance of these resultsis discussed. The results of the SLERA are described and summarized on the based of the fouridentified assessment endpoints of the CSM (see Figure 4-2). The results of each assessmentendpoint are reviewed and discussed with regard to potential adverse risks posed to receptors. Whereapplicable, the cumulative effects of multiple measurement endpoints for an assessment endpoint(Section 4.2.5) will be discussed.
Results of the risk characterization of each of these assessment endpoints are summarized below.
4.4.1 Endpoint # 1 – Protection of aquatic wetland plant species
Assessment Endpoint #1 was the protection of plant communities in Meadowlands wetlands of interest.The single measurement endpoint was the comparison of the hydric soil/sediment contaminantExposure Point Concentrations (EPCs) to appropriate phytotoxicity-based screening values fordetected contaminants as described in Section 4.3.2. Data were compared against selectedphytotoxicity benchmarks in Tables 4-4a and 4-4b. Risk to wetland vegetation was characterized usingEEQs, which are the ratio of the EPC to the screening value (Tables 4-14a and 4-14b for the currentstudy and historic studies, respectively). Where the calculated EEQ is less than one, it is assumed norisk exists for that particular receptor.
The exposure and effects assessment (Section 4.3.2) indicated that phytotoxicity benchmarks wereexceeded for all metals at least once in all the studied wetlands. Comparison of the maximumsediment values for the 2003 study wetlands indicated that chromium had the highest EEQ (509.5) andcopper (1.8) the lowest. Similar results were evident for the historically studied wetlands; however themagnitude of EEQs were an order of magnitude higher (EEQ for chromium = 6745; EEQ for copper =18.2). In contrast, based on the calculated EEQs for the 2003 study wetlands (Table 4-14a), it can be

March, 20044-22J:\Project\meri\Report\revisedreport\Report_Final.doc
seen that no risk exists for organic contaminants (EEQ < 1 for tPAHs and tPCBs). No risk was evidentfor PCBs for historically studied wetlands; and no qualified data was available to assess tPAHconcentrations for the historic studies. As mentioned in Section 4.3.2, pesticides were assumed not beof a concern for vegetation. Based on these factors, it is possible to eliminate the organic COPCs fromfurther investigation for wetland plants.
While some of the EEQs are elevated, the magnitude of the exceedance does not necessarily correlatedirectly with adverse effects. Further evaluation of the significance of the sediments is limited since nowell-recognized soil severe effect level (SEL) benchmark concentrations have been established forplants. Recall, that comparison to SELs (when available), which reflect adverse impact in at least 50%of the studies examined, can provide additional insight as to the severity of potential risk.
It is important to note that while chemicals are typically eliminated because the have not exceeded ascreening level benchmark, the exceedance of that benchmark by a COPC does not necessarily signifyactual ecological risk, but does preclude a finding of no potential for risk. While there may be aconservative presumption of risk, in practice it indicates that the COPC needs to be furtherinvestigated, usually with special attention to site-specific factors and confirmation through other lines ofevidence (e.g., field measures of plant community health) before adverse ecological risk can beconcluded.
4.4.2 Endpoint # 2 - Protection of Estuarine Benthic Macroinvertebrate Receptors
Assessment Endpoint #2 was the protection of macroinvertebrate receptors in the estuarine sedimentsin the Meadowlands wetlands of interest. The two measurement endpoints used for this assessmentendpoint were comparison of maximum EPC to estuarine screening values and the comparison of bodyburden to critical body residues (CBRs).
4.4.2.1 Sediment Screening Analysis
The exposure and effects assessment (Section 4.3.3) indicated that benthos-based sedimentscreening values were exceeded for all metals in all the studied wetlands. The single measurementendpoint was the comparison of the maximum EPC to estuarine sediment screening values, asexpressed by a calculated EEQ (Table 4-14a). The calculated EEQs based on the maximum EPC forsediment were greater than one for all COPCs, and ranged from 81.3 (tPCBs) to 2.0 (tPAHs). Basedon this evaluation, the COPCs exceeded the screening values and would need to be furtherconsidered. Table 4-14b summarizes EEQs for qualified historic wetland study data. Maximum EEQsfor the historic wetland data were greater than 10.0 for all COPCs except alpha-chlordane, and weretypically an order of magnitude greater than those observed in the 2003 study wetlands.

March, 20044-23J:\Project\meri\Report\revisedreport\Report_Final.doc
To gain additional insight into the potential magnitude or risk represented by the concentrations in thewetlands of interest, the maximum hazard quotients were compared to severe effect level benchmarks(e.g., ER-M or SEL values from Long et al., 1995 or Persaud et al., 1996). These severe or probableeffect levels are concentrations of COPC typically found in association with degraded or impactedbenthic communities. This comparison is shown in Table 4-15. It shows that the 4,4’-DDE, tPAH,arsenic, cadmium, and copper do not exceed the SELs for the 2003 study wetlands, while alpha-chlordane (EEQ = 1.3) chromium (1.4) and lead (2.6) slightly exceeded the SELs. Those COPCs thatsignificantly exceed the SEL benchmarks in the 2003 study wetlands included mercury (8.7), tPCBs(10.3) and zinc (16.8).
Maximum sediment concentrations from the historic wetland studies data exceeded the SELs for allmetals, as well as PCBs. The disparity in the results between the current study wetlands and thosesampled as part of historic studies is not easily explained. Data were rechecked against original dataelectronic data files to ensure that the discrepancy was not associated with a unit-conversion error orother data entry error. No errors were found. Maximum metal concentrations in the historic studieswere all for samples from Eight-day Swamp and Kearny Marsh. Only maximum concentrations forcopper and zinc were co-located at the same sampling location in Eight-day Swamp. Concentrationsreported for both of these wetlands range over several orders of magnitude, suggesting that theelevated concentrations are not likely a result of misreported units in the original data sets. Acomparison of 25th, 50th, and 75th percentile concentrations between the 2003 study wetlands andthose for the historic wetland studies reveals concentrations that are much more closely alignedtypically differing by less than a factor of 2. Maximum concentrations for the 2003 study wetlands werein most cases within a factor of 2 of the 75th percentile concentrations from prior studies. Some of theobserved differences between maximum concentrations from this study and historic studies may reflectthe actual differences in environmental concentrations within and among the various wetlands.
Using data from the 2003 study wetlands, tPCBs, mercury and zinc should be considered as potentialrisk “drivers” (i.e., chemicals that are more likely to be responsible for community impacts) for theMeadowlands wetland systems. These same COPCs would also be identified as primary risk driversusing the 75th percentile concentrations from historic studies. Use of maximum historic concentrationswould suggest that chromium and cadmium may also be important risk drivers.
4.4.2.2 Critical Body Residues (CBRs)
The potential impact of sediment concentrations on a crustacean species (i.e., fiddler crab) wasevaluated. Although not found in many of the Meadowlands wetlands, fiddler crabs were used as torepresent a key guild and prey category for higher trophic level wildlife. The fiddler crab was selectedsince it is a common estuarine species, is in direct contact with the sediments (e.g., burrowingactivities) and is appropriate surrogate for the blue crab, for which data on site-specific tissue residuesof chromium are available; thus allowing a site-specific check of body residues predicted by the food

March, 20044-24J:\Project\meri\Report\revisedreport\Report_Final.doc
web modeling. Evaluation of the potential ecological risk to this organism by sediment provides anindirect measure of potential prey availability for the mink and heron receptors.
The potential ecological risk posed by wetland sediment concentrations to invertebrate omnivores wasassessed by comparison of modeled fiddler crab tissue concentrations to CBRs (see Section 4.3.3.3)associated with adverse effects to other marine invertebrates (Table 4-10).
Comparison of the modeled invertebrate tissue concentration to the range of literature values of tissueconcentrations associated with adverse ecological effects indicates that the modeled concentrationstypically exceed the lowest levels of the effect range and often the upper bounding values as well. Inparticular, modeled values of arsenic, copper, chromium, lead, zinc, and 4,4’-DDE would indicatepotential concern. Modeled values of cadmium, PAHs, alpha-chlordane, and tPCBs are within therange of effects. Only the predicted concentrations of mercury are well below those identified in theliterature as being problematic.
As is discussed further in the Uncertainty Section (see below), the use of uptake factors to estimate thepotential tissue concentration only provides an approximate estimate. The use of site-specific tissuesamples is far preferable because tissues integrate the combined effects and variability of localizedpopulations, habitats, substrates, and COPC bioavailability (both in surface water and sediment). Inmost cases, it is expected that modeled tissue concentrations are more likely to overestimateexposure. This appears to be the case for the Meadowlands wetlands. For example the range andmean of chromium in blue crab from Sawmill Creek (SAW) and Berry Creek wetlands (ORM is part ofthis wetland complex) were 0.9 to 10.5 and 6.9 mg/kg, respectively (note: MERI tissue data wasconverted to wet weight basis)(Konsevick and Reidel, 1993). These Meadowlands wetland specifictissue residues are far below the modeled concentration of 199 mg/kg, by from 1 to 2 orders ofmagnitude. This comparison indicates that further investigation of ecological risk at the Meadowlandswetlands may wish to consider collection of site-specific tissue samples to reduce the amount ofuncertainty and provide a better approximate of potential risk.
4.4.3 Endpoint #3 - Protection of Estuarine Surface Water Receptors
Assessment Endpoint #3 was the protection of estuarine fish and aquatic invertebrate (water columnand benthic) receptors in the Meadowlands wetlands of interest. The single measurement endpointwas the comparison of the surface water EPC to estuarine surface water screening values, chronicAmbient Water Quality Criteria (AWQC) for marine waters as provided in NJAC 7:9b (Table 4-7). Thesurface water EPC was based on pooled data taken from several previous water quality samplingefforts (Langan EES, 1999; Louis Berger, 2001; TAMS, 2001a; HMDC, 1997). Both the number ofmeasured parameters and their detection limits varied between efforts, which adds considerableuncertainty to their interpretation. However, they do provide an indication of which chemicals in thesurface water are likely to be elevated relative to others and provide an approximate indication ofpotential risk.

March, 20044-25J:\Project\meri\Report\revisedreport\Report_Final.doc
The EEQ for all the metal COPCs - arsenic, cadmium, copper, chromium, lead, mercury, and zinc weregreater than one indicating a potential risk for aquatic life (fish and invertebrates) and needed to befurther considered. Several COPCs were elevated substantially over the screening criteria, especiallylead (EEQ = 63.0) and copper (EEQ = 248.4). The maximum concentration contributing to the copperEEQ was 700 µg/L and the maximum concentration contributing to the lead EEQ was 510 µg/L, bothreported in Secaucus High School Marsh (SHS) (Tams, 2001). These maximum concentrations wereobserved a one of four sampling locations within the marsh, with the three remaining samples from thiswetland showed non-detection for copper and lead. Likewise, these reported SHS maximumconcentrations are an order of magnitude greater than concentrations reported in other wetlands.While, these data may be suspect, EEQs for these contaminants would still exceed 30 if the nextgreatest concentration were used. The EEQ values are conservatively based on the total metal andnot the dissolved fraction (which was not available for many locales) and likely overestimate potentialrisk (see discussion of uncertainty in Section 4.5). NJDEP Surface Water Quality Standards includetranslators for total metals concentrations, which depending on the metal would equate the dissolvedmetal concentration with 84 – 99% of the total metal concentration.
4.4.4 Endpoint # 4 - Protection of Semi-Aquatic Wildlife Receptors
Assessment Endpoint #4 was protection and maintenance of semi-aquatic wildlife populations of avianand mammalian receptors. The potential risk posed to wildlife receptors (avians and mammals) wasevaluated for site-related contaminants in environmental media in the estuarine environment (surfacewater, sediment, prey food items). Four representative species were evaluated using a maximumHazard Quotient (HQ) (Table 4-16). As described in Section 4.3.4, total daily dosage (TDD) or theamount of each COPC that a receptor would intake on a daily basis via the identified exposurepathways was estimated using food web models. These calculated TDDs were then compared toToxicity Reference Values (TRVs). No observed adverse effect levels (NOAELs) were selected as theTRVs for this assessment (Section 4.3.4). A HQ was calculated by dividing the TDD by the TRV foreach COPC and receptor. Where the HQ is less than 1.0, risk is assumed to be absent. Where the HQis greater than 1.0, there is a potential for risk, and further investigation may be required to furtherassess the potential risk.
The selected semi-aquatic receptors in the estuarine water area were two birds (mallard, great blueheron) and two mammals (muskrat, and mink) representing herbivorous and carnivorous feedinghabitats, respectively. The results are discussed below by wildlife receptor.
4.4.4.1 Mink
The mink represents exposure to a semi-aquatic mammalian carnivore. The results of the food webmodels for the mink indicate potential concern regarding maximum exposure of all COPCs exceptchromium, alpha-chlordane, 4,4’-DDE, and tPAHs (Table 4-16). The exceeded HQs range from HQ =

March, 20044-26J:\Project\meri\Report\revisedreport\Report_Final.doc
2.03 (lead) to HQ = 443 (mercury). Further evaluation of this receptor and its potential exposurepathways of concern are warranted.
4.4.4.2 Muskrat
The muskrat represents exposure to a semi-aquatic mammalian herbivore. The results of the food webmodels for muskrat indicate potential concern regarding maximum EPC exposure of arsenic (HQ =2.55) and mercury (HQ = 1.47) (Table 4-16). All other contaminants had HQs < 1 and do not pose apotential concern to this receptor. Further evaluation of this receptor and its potential exposurepathways of concern are warranted, but the level of potential risk is perceived to be slight, even underhighly conservative assumptions.
4.4.4.3 Mallard
The mallard represents potential COPC exposure to a semi-aquatic avian herbivore. The results of thefood web models for mallard indicate potential concern regarding maximum EPC exposure of mercury(HQ = 1.47). All other COPCs had HQs < 1 and do not pose a potential concern to this receptor (Table4-16). Further evaluation of this receptor and its potential exposure pathways of concern arewarranted, but the level of potential risk is perceived to be slight, even under highly conservativeassumptions.
4.4.4.4 Great blue heron
The Great blue heron represents exposure to a semi-aquatic avian omnivore. The results of the foodweb models for the heron indicate potential concern regarding maximum EPC exposure of all COPCsexcept arsenic, alpha-chlordane, and tPAHs (Table 4-16). The exceeded HQs ranging from HQ = 1.9(copper) to HQ = 1,190 (mercury). Further evaluation of this receptor and its potential exposurepathways of concern are warranted.
4.5 Uncertainty
Uncertainty is introduced into the SLERA in several places throughout the process. Every time anassumption is made, some level of uncertainty is introduced into the risk assessment. This isparticularly true for this SLERA, where the conservative assumptions are designed to provide anextremely conservative (maximum) exposure term to the receptors; with the presumption being that ifno potential risk is indicated under such stringent conditions, there is unlikely to be risk under anyforeseeable circumstances. However, it is important to remember that the finding of potential riskunder the maximum exposure scenario does not, in itself, indicate that ecological risk is present underactual site-specific conditions. To evaluate the potential influence of the conservative assumptions, thecritical assumptions are examined and risk results compared to scenarios for which more realistic site-

March, 20044-27J:\Project\meri\Report\revisedreport\Report_Final.doc
specific factors are evaluated. In accordance with U.S. EPA guidance (U.S. EPA, 1989), the potentialmajor sources of uncertainty associated with the risk characterization process are identified and thepotential influence on the risk results considered.
There are many potential sources of uncertainty in the risk assessment process; some are moreimportant than others. Some of the sources of uncertainty in the SLERA are common to both aquaticand terrestrial assessments, while other refer to specific endpoints. Some major areas of uncertaintyfor the Meadowlands SLERA include:
Site Characterization (e.g., the level of site characterization, the quality of the analytical data);
Selection of Analytes (e.g., use of chronic toxicity, sensitivity of receptors);
Exposure Assessment (e.g., assumptions about the frequency, duration, and magnitude ofexposure for the receptors);
Ecological Effects (e.g., the availability and potential range of dose-response data); and
Risk Characterization (interpretation of the significance of risk results to local species andcommunities).
The significance of background or local conditions for the aquatic environment is also considered.These various uncertainties were assessed and considered as to whether they potentially over orunder-estimate risk for this site. Discussions of selected sources of uncertainty are given below.
4.5.1 Uncertainty Associated with Site Characterization
The environmental media (surface water, sediment) in the Meadowlands wetlands of interest wereconsidered sufficiently but not well-characterized for purposes of the SLERA. Data was available for thesediment in the selected wetlands of interest and were the basis of EPCs for the SLERA. The surfacewater EPC was based on pooled data taken from several prior water quality sampling efforts. Both thenumber and type (total vs. dissolved) of measured water quality parameters and their detection limitsvaried between efforts. The surface water data was used in estimating the EPCs of prey items(macroinvertebrates and fish). In estimating the EPCs, it was necessary to assume that the analyticalchemistry results accurately reflect the exposure conditions within the wetlands of interest. Thisincludes several standard assumptions:
Sampling locations within the wetlands were assumed to represent contaminant concentrationswithin the entire wetland;
Variability due to sampling and analytical analysis was assumed to be less than normalvariability;

March, 20044-28J:\Project\meri\Report\revisedreport\Report_Final.doc
Concentrations reported in the analytical results were assumed to be representative of thewhole medium sample.
If these assumptions were not met, the collected samples could either over- or underestimatethe true exposure and potential for risk to ecological receptors. In one case (i.e., KFM), a singlesediment sample is the basis for potential ecological concern regarding alpha-chlordane.
Surface water data were taken directly from the NJMC/MERI environmental database and are not co-located in time and spatial coordinates with the 2003 sediment sampling. The surface water data isassumed to provide adequate characterization of the media and may or may not reflect current siteconditions. Surface water sampling was beyond the scope of this project.
4.5.2 Uncertainty Associated with Analyte Screening/Selection Process
The initial selection of contaminants was based on comparison of a maximum value to a conservativecriterion or benchmark (often based on protection of a sensitive species not found on-site). Thismethod of selection results in establishing a conservative "worst-case" estimate of potential ecologicalrisk, which may not accurately portray actual ecological risks expected by on-site species. On-sitespecies will encounter a variable spectrum of environmental conditions by averaging exposure throughutilization of the site as opposed to being restricted to areas of the highest contamination (i.e.,"hotspots"). The usefulness of the conservative-based screening is to identify wetlands and/or mediawhere no adverse ecological effects would be expected under the worst case and which can then beeliminated from further consideration.
The aquatic risk assessment used toxicity values based on chronic effects from the NJ WQS or U.S.EPA to analyze the potential for ecological risk to estuarine communities. Chronic toxicity values wereused as screening benchmarks because it was assumed that surface water and sediment indicatorspecies would experience continuous, chronic exposure. The assumption of chronic exposure may berealistic for the sediment-associated species, but may be relatively conservative for the surface waterspecies. Differential species sensitivity to the contaminants may result in the screening benchmarksbeing underestimates or, more likely, overestimates of potential acute and chronic toxicity for manyaquatic organisms.
The use of total metals for estimating exposure in surface water samples is likely to be a conservativeestimate of metal bioavailability. Current U.S. EPA guidance indicates that the dissolved fraction ofmetals is more appropriate for comparison to water quality standards (U.S. EPA, 2002). The use oftotal metals for screening purposes would tend to overestimate potential ecological risk to aquaticreceptors.
For many some COPCs, appropriate media-specific screening values were not available and thesecontaminants were conservatively carried forward in the SLERA (e.g., phytotoxicity benchmarks for
March, 20044-29J:\Project\meri\Report\revisedreport\Report_Final.doc
organics). Since the contaminants that were not screened out were included in as contaminants in thefood webs, this uncertainty extends into the food web models.
4.5.3 Uncertainty Associated with Exposure Assessment
Considerable uncertainty exists with the exposure assessment for the ecological receptors. Thisuncertainty exists for the community receptors and individual wildlife receptors. These were consideredseparately for wildlife receptors in the terrestrial the aquatic ecosystems.
Exposure to aquatic and semi-aquatic receptors has considerable uncertainty due to exposureduration, habitat use factors, and bioavailability of sediments. These are described below.
Chronic toxicity values were used as screening benchmarks for aquatic receptors because it wasassumed that ecological receptors would experience continuous, chronic exposure. Exposure in theaquatic environment is unlikely to be continuous for many fish species in the riverine and estuarinehabitat, as they are generally transitory and are likely to move in and out of the regions of theHackensack River adjacent to the Meadowlands. In addition, the fishery and macroinvertebrate habitatis considered degraded due to many factors within the wetlands and Hackensack River watershedincluding physical habitat (dredging and filling), current and historic dumping, landfilling, leachate oftoxics, restricted or impounded flows, local non-point sources, and downstream tidally dispersed,hazardous waste-impacted surface water and sediment.
The potential exposure of several semi-aquatic receptors would be significantly reduced due to thelarge sizes of their home ranges. The use of a conservative assumption of Exposure Duration (ED) =1.0 and Area Use Factor (AUF) = 100% would overestimate the potential risk to semi-aquaticreceptors. The insertion of more realistic habitat use factors would significantly reduce potentialexposure, particularly for the piscivores.
The bioavailability of several sediment contaminants, especially metals, may be overestimated. It hasbeen shown that acid volatile sulfides (AVS) have a high binding capacity for divalent metals (e.g., Cr,Cu, Pb, Ni, Zn) in sediments, thereby reducing or eliminating the bioavailability to sediment-associatedreceptors. AVS concentrations are high in anaerobic sediment environments; such is likely to exist inthe tidal wetlands of the Hackensack River and its tributaries, since they contain highly organicallyenriched sediments where biological demand is likely to be high. Therefore, AVS concentrations in theestuarine sediments may reduce the potential risk to sediment receptors in the wetlands. Thisinformation was not available for the SLERA, so 100% bioavailability was conservatively assumed.

March, 20044-30J:\Project\meri\Report\revisedreport\Report_Final.doc
4.5.4 Uncertainty Associated with Ecological Effects
The dose-response values used for the several species were extrapolated from data on similar speciesbecause no direct dose-response information was available for the representative species. Thisextrapolation involved conservative assumptions for several factors including allometric scaling,application of safety factors, and use of NOAELs; thus, it is likely that the scaled dose-response valueschosen will result in overestimates of the potential for adverse effects.
A major source of uncertainty in the application of the hazard quotient method is the availability and/orsource of toxicity data used for benchmark concentrations (e.g., NOAEL or LOAEL). Typically, thelowest data points among the available ecotoxicological database were conservatively selected as thescreening benchmark concentrations. The lowest data point observed in the laboratory may not berepresentative of the actual toxicity which might occur in the environment. Using the lowest reportedchronic toxicity data point as a benchmark concentration (as was done in this assessment with aNOAEL-based TRV) is a very conservative approach, especially when there is a wide range in reportedtoxicity values for the relevant species.
Another source of uncertainty is the estimate of uptake and/or bioaccumulation from environmentalmedia into plants and wildlife. In an ecological risk assessment context, the best data to estimatebioaccumulation of contaminants in tissues will always be site-specific data. Ideally, plant and animaltissues should be collected from multiple areas within the contaminated site and from reference areas(preferable at locations where soil or sediment samples are also collected). In the absence of site-specific tissue data, uptake factors (UFs) or models may be used to estimate tissue concentrations, butmay under or overestimate potential exposure. As indicated by the comparison of site-specific resultsof the tissue residues for chromium in blue crab vs. that modeled for invertebrates for food web models,the U.S. EPA-approved uptake factors used likely overestimate potential exposure.
4.5.5 Uncertainty Associated with Risk Characterization
Extrapolation of the potential for community, population, or ecosystem effects from the examination ofone or more representative species is a major source of uncertainty for both the aquatic and terrestrialanalyses. The underlying assumption is that potential effects on one representative species areconsistent with the effects on similar species and representative of the potential for effects on theparticular ecosystem being investigated. It is assumed that if the representative species were notaffected, the potential for ecosystem-level effects are also unlikely.
The representative species were chosen to evaluate potentially high exposure to environmental mediaat the site, resulting from trophic level, habitat preferences, or limited home range. The effect of theseassumptions may be to overestimate the potential for adverse ecological effects to other species.

March, 20044-31J:\Project\meri\Report\revisedreport\Report_Final.doc
It should be recognized that ecological risk typically considers potential risk to communities orpopulations. It is difficult to predict how an adverse effect on an individual organism might affect theecosystem as a whole. If adverse effects are predicted for an individual, it does not necessarily meanthat the community, population or ecosystem will be similarly affected. Even if one subset of theecosystem is impacted in a localized area, it may not be a perceptible impact to the overall ecosystem(e.g. loss of individual fish may not affect resident population) is highly unlikely to affect residentpopulations at the Site. However, in some cases, particularly for threatened/endangered species orspecies of special concern, (e.g., great blue heron) the loss of individual organisms may mean aconclusion of unacceptable ecological risk at the site.
A number of interpretation approaches for HQ values have been proposed and should be considered inevaluating the ecological significance of HQs to populations and communities (e.g., Barnthouse et al.,1982, Barnthouse et al., 1986; U.S. EPA, 1 1988, 1992; Suter, 1993). For example, calculated HQvalues should be sorted into the three categories according to the following thresholds and ecologicalreceptors. These are identified below along with interpretation of the level of ecological risk concernassociated with HQ values as follows
A: HQ >10 for risk to common species, or HQ >1.0 for risk to protected species
-> Recommended for additional risk investigation (i.e., ERA Tier 2) to reduce uncertainty or toconsider potential effects of remediation; probable concern for potential ecological risk
B: HQ >1.0 to 10 for risk to common species, or HQ ~1.0 (e.g., 0.9 to 1.1) for risk to protectedspecies
-> Considered for additional risk investigation (i.e., ERA Tier 2); possible concern for potentialecological risk.
C: HQ <1.0 for risk to common species, or HQ <1.0 for risk to protected species.
-> Not considered for additional risk investigation; negligible concern for ecological risk.
For interpretation of Category "A" HQs, the traditional HQ threshold of 1.0 is changed to 10.0 forcommon species because the appropriate assessment endpoint is at the population level where anadverse effect on a single individual of the population is not expected to be ecologically significant, andbecause the effect of applying multiple conservative assumptions tends to overestimate potential risk.The threshold of 1.0 is retained for protected species where the loss of an individual is assumed tohave an adverse effect on survival of the species. The level of ecological risk concern associated withthe three sets of HQ values may be interpreted as follows:
March, 20044-32J:\Project\meri\Report\revisedreport\Report_Final.doc
Several elements should be considered in a weight-of-evidence approach to assess the ecologicalsignificance of the calculated HQ values for measurement endpoints in Categories A and B. Thesefactors include the magnitude of calculated risk, the concurrence of multiple measurement endpoints,the “weight” of the measurement endpoint; and the status of the receptor (threatened, endangered, orcommon species).
In summary, target levels of risk for ecological receptors are site-specific and should reflect theecological significance of the risk. The threshold between acceptable and unacceptable risk isdependent upon the assessment endpoints (which should reflect risk management) and theuncertainties associated with the exposure concentration or dose and the effects concentration or dose.
4.6 SLERA Risk Conclusions
A SLERA was conducted for the Meadowlands wetlands to evaluate their potential to pose adverseecological risk to ecological communities and wildlife receptors. Aquatic communities and wildlifereceptors at the Meadowlands wetlands were evaluated. Four assessment endpoints were selected toprovide a wide spectrum of potential exposures and receptors.
Surface water aquatic receptors, sediment-associated benthic receptors, and semi-aquatic wildlifereceptors were evaluated in the Meadowlands wetlands. Potential risks evaluated included directcontact to environmental media (surface water, sediments) and bioaccumulative effects (food items).For purposes of this SLERA, the COPCs evaluated were limited to 11 contaminants including sevenheavy metals (arsenic, cadmium, chromium, copper, lead, mercury, zinc), two pesticides (alpha-chlordane, 4,4’-DDE), tPCBs, and tPAHs.
All assessment endpoints were evaluated using conservative assumptions in the selection ofcontaminant concentration, exposure terms, screening benchmarks, and ecological effects. Under thisconservative screening approach and using conservative assumptions for food web modeling, potentialecological risk was indicated for the four assessment endpoints. These results indicate that furtherecological risk investigation or remedial activities may be warranted.
Due to these conservative maximum exposure assumptions, there is a great deal of uncertaintyassociated with the risk estimates. The sources and potential influences of this uncertainty weredescribed and the results of this conservative screen were further evaluated to provide a betterinterpretation of the potential risk at the Site. It is likely that alternative assumptions or using site-specific factors may lead to a significantly lesser degree of potential risk.

March, 20044-33J:\Project\meri\Report\revisedreport\Report_Final.doc
The results of the SLERA are also further extrapolated as the standard risk curves described in Section5.0, and in a qualitative analysis of benthic community composition as a function of sediment chemistryand toxicity in Section 6.0.
March, 20045-1J:\Project\meri\Report\revisedreport\Report_Final.doc
5.0 WILDLIFE RISK CURVES
Using the results of the SLERA for the Meadowlands wetlands of interest (Section 4.0), the food webmodels were used to generate “wildlife risk curves” for selected COPCs for four ecological receptors(mallard, heron, muskrat, mink). The wildlife risk curves relate the predicted HQs (HQ = food webmodeled TDD/TRV) for a particular sediment concentration and receptor species to different sedimentand water COPC concentrations (i.e., 25th, 50th, 75th, and 100th percentile concentrations calculatedfrom pooled data). These curves are intended to allow NJMC/MERI to quickly evaluate sediment datacollected in the future as to potential ecological risk implications.
5.1 Construction of the Wildlife Risk Curves
As noted previously, the Meadowlands-wide COPCs were arsenic, cadmium, chromium, copper, lead,mercury, zinc, alpha-chlordane, 4,4’-DDE, tPAHs and tPCBs Sediment data for each COPC werepooled from the wetland sites sampled as part of this study and in surficial (0 – 6”) samples collectedduring previous studies (Langan EES, 1999; Louis Berger, 2001; TAMS, 2001a; TAMS, 2001b; ECI,1997a; ECI, 1997b; HMDC, 1997; Weis, J. and P. Weis, undated). Surface water data available fromprevious wetland studies (Langan EES, 1999; Louis Berger, 2001; TAMS, 2001a; HMDC, 1997) werealso pooled for each COPC. .
The pooled sediment data was used generate a frequency distribution curve to identify the 25th, 50th,75th and 100th percentile sediment concentration values for each COPC. These values are presentedin Table 5-1.
Surface water data used for calculation of percentile distribution for metals COPCs were based onpooled data taken from previous wetland studies that included water quality sampling efforts (seeAppendix E, Table E2). Since there were no available surface water quality data for organic COPCs,organic COPC concentrations were predicted based from potential dissociation from the sediments(see Appendix E, Table E12 for details of the equilibrium partitioning calculation). For example, the 25th
percentile for surface water concentration for tPCBs was based on the predicted concentrationdissociating from the 25th percentile sediment concentration. For calculation purposes a site-specificsediment TOC value of 5% was used. This value represents the median values (range of 1.2% to 76%)of approximately 100 TOC measurements from four wetlands (KFM, ORM, RBM, SHS) (Langan EES,1999; Louis Berger, 2001; TAMS, 2001a, 2001b). The representative surface water values arepresented in Table 5-1. Analogously, the 25th prey (fish) concentration was based on bioaccumulationfrom the 25th percentile surface water concentration.
These surface water and sediment percentile concentrations were input into the food web models usingthe exposure parameters and assumptions described in Section 4.3, to provide estimates ofconcentrations in media and forage or prey items (Table 5-2). Using these media and estimated forage

March, 20045-2J:\Project\meri\Report\revisedreport\Report_Final.doc
or prey COPC concentrations, HQs were calculated for the wildlife receptors (i.e., mallard, great blueheron, muskrat, mink) corresponding to the 25th, 50th, 75th, and 100th percentile concentrations.
5.2 Risk Curves for Wetland Wildlife Receptors
The results of the food web models and HQs generated using the percentile media and preyconcentrations (Table 5-2) are presented in Table 5-3. Hazard quotients (HQ = modeled total dailydose divided by the applicable TRV) are provided for the four wildlife receptors of interest. All HQsgreater than 1.0 are shown in bold-italic text in the table. HQs developed for a range of concentrations(Table 5-3) provides a better characterization of the potential range of risk posed by site COPCs thanthat afforded by consideration of just the maximum EPC (Table 4-16).
To more easily understand the pattern of potential risk from the distribution of sediments at theMeadowlands wetlands of interest, the HQ values were plotted against sediment concentrations todevelop a series of wildlife risk curves for the COPCs. These risk curves are presented for metals inFigure 5-1 through 5-7, for pesticides in Figures 5-8 and 5-9, for tPAHs (Figure 5-10), and for tPCBs(Figure 5-11). The risk curves for all four wildlife receptors are displayed on the same figure for eachCOPC.
In these curves, the risk HQ is calculated for the four media concentrations corresponding to the 25th,50th, 75th, and 100% concentrations and the curves represent interpolation of the expected risk atintermediate media concentrations. Note that there is no attempt to predict HQs for mediaconcentrations lower than the 25th percentile.
Inspection of these risk curves (Figures 5-1 through 5-11) indicates that the potential risk associatedwith different COPCs differs significantly in magnitude and pattern of risk with increasing sedimentconcentrations and that these patterns also differ depending on the receptor/trophic pathway involved.In some cases the level of estimated risk is so low for some receptor-COPC combinations that it isvirtually indistinguishable from the X-axis. As will be discussed later, some of the COPC curves arealso significantly affected by the influence of the surface water concentration.
Several points can be made in general for these wildlife risk curves. In general, greater risk arepredicted for the piscivores (heron, mink) than for the herbivores (mallard, muskrat) over the majority ofthe COPCs, with the mink having the highest HQs and the mallard the lowest. Higher risks areassociated with the metals than the organic COPCs. For most COPCs (cadmium, chromium, copper,mercury, zinc, alpha-chlordane, 4,4’-DDE, tPCBs), the risk levels rise slightly as sedimentconcentrations rise from 25th to 75th percentile, with a large increase as the 100th percentile is reached.Comparison of the median (50th percentile) HQ indicates that little or slight risk (HQ < 2) would bepredicted for most COPCs under average sediment and surface water concentrations with theexception of arsenic.

March, 20045-3J:\Project\meri\Report\revisedreport\Report_Final.doc
Since the COPC exposure includes contributions from both sediment and surface water, the potentialrelative contribution of each media was investigated for selected COPCs. It will be recalled that thesurface water concentrations of metals were derived from the NJMC/MERI database from a number ofprevious water quality surveys and the organic surface water concentrations were predicted based ondissociation from sediment. Since this is a large source of uncertainty, the amount of risk predicted ifthis source was removed by setting the surface water concentrations used in modeling to zero. Theresulting HQ values absent the influence of surface water concentrations are shown in Table 5-4. Aside-by-side comparison of risk with and without the water contribution (the calculated percentileconcentrations) is provided for the heron and mink in Table 5-5. Figures 5-12 through 5-15 display thesame comparison for the two piscivores for arsenic, lead, zinc, and tPCBs, respectively.
It can be seen that for lead, there is little influence of the surface water COPCs, since the majority ofthe risk is due to the sediment or invertebrate ingestion (Figure 5-13). For the other three, the influenceof the water has a significant effect on risk, particularly at the 100th percentile (maximum)concentrations. For some COPCs (arsenic (Figure 5-12); tPCBs (Figure 5-15)), greater effect is shownin the HQ for the mammalian receptor (mink), whereas, for zinc, the avian receptor (heron) showsgreater effect (Figure 5-14).
These comparisons indicate that the wildlife risk curves are very sensitive to the surface waterconcentration for some COPCs. As discussed earlier (see Section 4.5), the total fraction was used forthe EPC for the surface water metals. This suggests that additional sampling of the surface water in theMeadowlands wetlands of interest using the dissolved fraction and/or with “clean” metal samplingmethods is likely to refine and potentially, significantly reduce the estimated risk for the wildlifereceptors. An alternative to this re-sampling would be to use the median surface water values as abackground risk for all receptors independent of sediment concentrations.

March, 20046-1J:\Project\meri\Report\revisedreport\Report_Final.doc
6.0 RELATIONSHIPS BETWEEN BENTHIC COMMUNITY, CONTAMINANTS, ANDTOXICITY
The initial scope for the project planned that a Sediment Quality Triad analysis be performed using thebiology, toxicity, and sediment chemistry data. The Sediment Quality Triad concept was introduced byLong and Chapman (1985), Chapman (1986), and Chapman et al. (1986) as a means to link biologicaldegradation to chemical contamination. Typically, the triad consists of using the results of sedimentchemistry, toxicity testing, and benthic community structure, although other parameters have also beenused. The triad may be used to determine the extent of pollution-induced degradation, to identifyproblem areas of sediment contamination, and possibly to make predictions about where degradationmight occur based on levels of existing contamination.
For use of this method it is desirable that the three data components be collected concurrently to avoidintroduction of error associated with temporal differences. The scope of this project, however, waslimited to collection of benthic samples at only two of the five marshes for which sediment chemistryand toxicity data were collected. Historic benthic community analysis was available for the other threemarshes, but was not paired with complete sediment chemistry and toxicity testing data. Given theavailable budget for this initial project, it was decided that historic benthic data would be used wherepossible to support a Sediment Quality Triad analysis.
The key element in applying the Sediment Quality Triad is the availability of data for appropriatereference stations and test stations that reflect a wide range of perceived conditions (ENSR, 2001). Inthis case reference stations should reflect unimpaired baseline conditions. As noted in previoussections, while it was initially anticipated that Sawmill Creek would serve as an appropriate referencecondition, the sediment chemistry and toxicity testing results indicate that this marsh does not representunimpaired conditions. Because the three types of data were not available from an appropriatereference station, it is not possible to apply the classic Triad analysis to the current data set from theMeadowlands. Moreover, due to the sediment quality and toxicity results from Sawmill Creek,standardization of other location’s results to the “reference” location would likely led to erroneousconclusions. Therefore, in lieu of that analysis, a brief qualitative summary comparing the benthicinfaunal community parameters with toxicity and sediment chemistry results follows.
6.1 Benthic Community and Sediment Toxicity
Infaunal samples collected at Riverbend Marsh in September 2003 showed extremely high densities ofinfauna as well as higher diversity, evenness, and species number than found in most historicalsamples collected at Secaucus H.S., Oritani, and Mill Creek marshes. Nevertheless, survival for boththe amphipod Hyalella azteca (28 days at 10 ppt) and the polychaete Neanthes arenaceodentata (10days at 25 ppt), in sediments from RBM-01 were significantly (α=0.05) lower than survival in thenegative control sediment (Table 3-8). In a comparison of the two stations sampled at Riverbend,

March, 20046-2J:\Project\meri\Report\revisedreport\Report_Final.doc
survival at RBM-01 was less than at RBM-02 for both the H. azteca (45% less) and N. arenaceodentata(58% less) test organisms. Infaunal samples collected at the individual stations did not differ indiversity, evenness, or number of taxa, although the density and total number of organisms was higherat the RBM-01 location than at RBM-02.
Infaunal samples collected at Kearny Marsh in September 2003 showed low densities of infaunacompared to Riverbend Marsh. However, the density of infauna was greater than that observed forSecaucus High School, Oritani and Mill Creek Marshes. The diversity, evenness, and species numberwas within the range observed in historical samples collected at Oritani, Secaucus High School, andMill Creek marshes. The 28-day survival for each of the test sediment sites was not significantlydifferent from the negative control. Likewise while the 10-day test survival was lower than the negativecontrol for all samples, only KFM-01 was significantly different from the control.
Growth data for the 28-day and 10-day tests showed mixed results. For the 28-day test mean weight(normalized to number of organisms at test initiation) was greater than the negative control for all testsediments except RBM-01. Weights for the test sediments were consistently lower than the negativecontrol for all sites except RBM-01, ORM-02, and SHS-02 for the 10-day test. Sediments from SAW-01 and RBM-02 exhibited significantly lower growth than the negative control.
6.2 Benthic Community and Sediment Chemistry
A cumulative Ecological Effect Quotient (EEQ) was calculated to serve as a means of comparingbenthic diversity with sediment chemistry results. The EEQ is calculated by dividing the observedmaximum detected concentration for each COPC by the corresponding screening criteria (i.e., LEL) foreach contaminant, and summing the ratios for each sampling location. Using the EEQ allows forcomparisons to a single number rather than a large number of individual contaminants. Recognizingthat different contaminant classes may pose different risk, separate EEQs were also calculated formetals and PCBs. Figure 6-1 illustrates the toxicity testing results (survival and growth) againts thecumulative EEQ. No clear relationship between contaminant levels (as expressed by EEQ) andmeasured toxicity is evident.
Figures 6-2 and 6-3 illustrate the EEQs and benthic community parameters. Historic data wereincluded in this analysis where all chemical contaminants measured were consistent with those in the2003 study and for which paired benthic data was available. Again there is not obvious relationshipbetween the benthic community measures and sediment contaminant concentrations.
6.3 Analysis Conclusions
No clear and definitive relationships emerge between sediment toxicity or sediment chemistry andbenthic community parameters. At some locations the results appear to support the premise of lower

March, 20046-3J:\Project\meri\Report\revisedreport\Report_Final.doc
diversity, evenness and density is evident where sediment contaminant levels are elevated. However,there are an equal number of locations that did not appear to follow this pattern. A variety of factorsmay contribute to these conclusions. For example, hydrology, water chemistry and physical habitatmay be more significant factors in defining benthic community structure and composition. Past studiesas well as the current project sampling effort have sampled multiple habitat types (e.g., mudflats,channels, open water, high marsh, marsh plain, etc.) which introduce inherent variability in communitycomposition because of habitat type alone. Hence differences in physical habitat type, habitatstructure/quality or water chemistry not addressed under this project may impact benthic communities,and would not be reflected in the toxicity tests or sediment chemistry performed. Alternatively,observed toxicity may be the result of compounds not measured. However, more likely, the use ofEEQs calculated using maximum concentration and Lowest Effects Level (LEL) and/or differencesbetween total concentration and bioavailable concentrations may overestimate potential risk and maskany true relationships.

March, 20047-1J:\Project\meri\Report\revisedreport\Report_Final.doc
7.0 UNCERTAINTY AND LIMITATIONS
As noted in Section 2.0, the work completed for this project was completed in accordance with aQuality Assurance Project Plan (QAPP). This section presents a discussion of key issues relative touncertainty and limitations of the data and conclusions.
Sediment Sampling and Field Measurements
Sediment sampling and handling and field measurements were completed in accordance withthe QAPP, and results were in conformance with the quality control requirements.
GPS coordinates recorded for Kearny Marsh sampling location KFM-01 deviated from theactual field location (as indicated by field sampling personnel). The location of this samplingstation was moved to reflect the actual approximate sampling location.
Benthic Sample Analysis
Benthic sample analysis was completed in accordance with the QAPP, and results were inconformance with the quality control requirements.
Analytical Testing
Sediment sample chemical analysis was completed in accordance with the QAPP, and resultswere in conformance with the data quality objectives.
Toxicity Testing
Toxicity testing was completed in accordance with the QAPP and associated SOPs with someexceptions.
- Hyalella azteca were 13-days old at initiation. The B-H Laboratories standard operatingprocedure for the Hyalella azteca test (ATL/SEDHACHR.050) states that organisms willbe 7-8 days old for a 28-day test. Organism age is within range for a 10-day test (7-14days); there is no EPA-mandated age range for a 28-day test. Since all organisms werewithin the same age range, this deviation from the SOP probably did not affect testoutcome.
- Chironomus tentans was 14-days old at test initiation. The report states that theorganisms were 2nd to 3rd instar, which is the target metamorphic stage of C. tentans attest initiation. However, the USEPA sediment testing manual (page 43) states thatorganisms 12.5 days old or older are probably 4th instar. Without head capsulemeasurements, or another acceptable method of determining instar, it cannot be

March, 20047-2J:\Project\meri\Report\revisedreport\Report_Final.doc
determined if organisms were of the correct stage at initiation. Older organisms havebeen found to be less sensitive to some toxicants. This could be a deviation that mightreduce the sensitivity of test organisms to the test sediment.
- Dry weight for amphipods should be determined at 60 to 90°C, rather than 100°C.However, drying at 100°C is more typical for other toxicity tests and since all organismswere dried at the same temperature, this deviation should not have any effect on testoutcome.
- Chironomid dry weights should also be determined at 60 to 90°C. However, as long as allorganisms were dried at the same temperature, this deviation should not impact testresults.
Sediments were screened to remove large material (e.g., large pebbles, stones, twigs and plantclumps) and homogenized prior to subsampling for toxicity test replicates. However, aswetland sediments likely include un-decomposed or partially decomposed plant material, it ispossible that contaminants may not be equally distributed in the whole sediment sample. Thismay result in variability among the replicates.
Screening Level Ecological Risk Assessment (SLERA) and Standard Risk Curves
Uncertainty associated with the SLERA is described in detail in Section 4.4.2, including the implicationsof various assumptions and sources of uncertainty that are summarized below:
The environmental media (surface water, sediment) in the Meadowlands wetlands of interestwere considered sufficiently but not well-characterized for purposes of the SLERA. Data wasavailable for the sediment in the selected wetlands of interest and were the basis of ExposurePoint Concentrations (EPCs) for the SLERA.
Surface water data were taken directly from the NJMC/MERI environmental database and arenot co-located in time and spatial coordinates with the 2003 sediment sampling.
EPCs estimation assumes that the analytical chemistry results accurately reflect the exposureconditions within the wetlands of interest.
Screening against benthic and wetland vegetation benchmarks was used to select COPCs forfurther analysis. For purposes of this SLERA, the COPCs evaluated were limited to 11contaminants including seven heavy metals (arsenic, cadmium, chromium, copper, lead,mercury, zinc), two pesticides (alpha-chlordane, 4,4’-DDE), tPCBs, and tPAHs.
Selection of COPCs was based, in part, on comparison of a maximum value to a conservativecriterion or benchmark (often based on protection of a sensitive species not found on-site).

March, 20047-3J:\Project\meri\Report\revisedreport\Report_Final.doc
Use of maximum values provides for a conservative "worst-case" estimate of potentialecological risk, which may not accurately portray actual ecological risks expected by on-sitespecies.
The aquatic risk assessment used toxicity values based on chronic effects to analyze thepotential for ecological risk to estuarine communities.
The sensitivity of different species to the contaminants may result in underestimates oroverestimates of potential acute and chronic toxicity for many aquatic organisms.
The use of total metals for estimating exposure in surface water samples is likely to be aconservative estimate of metal bioavailability.
For many some COPCs, appropriate media-specific screening values were not available andthese contaminants were conservatively carried forward in the SLERA (e.g., phytotoxicitybenchmarks for organics).
The surface water EPC was based on pooled data taken from individual wetland studies. Boththe number and type (total vs. dissolved) of measured water quality parameters and theirdetection limits varied between efforts.
Potential risks evaluated included direct contact to environmental media (surface water,sediments) and bioaccumulative effects (food items). It was assumed that other completeexposure pathways do not significantly contribute to risk.
The potential exposure of several semi-aquatic receptors would be significantly reduced fromthat used in the food web modeling (i.e., that a receptor would spend 100% of their time undermaximum exposure conditions) due to the large sizes of their home ranges.
The bioavailability of several sediment contaminants, especially metals, may be overestimated.It has been shown that acid volatile sulfides (AVS) have a high binding capacity for divalentmetals (e.g., Cr, Cu, Pb, Ni, Zn) in sediments, thereby reducing or eliminating the bioavailabilityto sediment-associated receptors.
The dose-response values used for the several species were extrapolated from data on similarspecies because no direct dose-response information was available for the representativespecies. This extrapolation involved conservative assumptions for several factors includingallometric scaling, application of safety factors, and use of NOAELs; thus, it is likely that thescaled dose-response values chosen will result in overestimates of the potential for adverseeffects.
Using the lowest reported chronic toxicity data point as a benchmark concentration (as wasdone in this assessment with a NOAEL-based TRV) is a very conservative approach,especially when there is a wide range in reported toxicity values for the relevant species.

March, 20047-4J:\Project\meri\Report\revisedreport\Report_Final.doc
The estimate of uptake and/or bioaccumulation from environmental media into plants andwildlife is another source of uncertainty. Site specific tissue data was not available. In theabsence of site-specific tissue data, uptake factors (UFs) or models are used to estimate tissueconcentrations.
Extrapolation of the potential for community, population, or ecosystem effects from theexamination of one or more representative species assumes that potential effects on onerepresentative species are consistent with the effects on similar species and representative ofthe potential for effects on the particular ecosystem being investigated.
The representative species were chosen to evaluate potentially high exposure to environmentalmedia at the site and may overestimate the potential for adverse ecological effects to otherspecies.
Ecological risk typically considers potential risk to communities or populations. If adverseeffects are predicted for an individual, it does not necessarily mean that the community,population or ecosystem will be similarly affected.
The standard risk curves were developed using the food web models. The uncertaintiesassociated with these models (described above), are carried through to the standard riskcurves.
The standard risk curves are very sensitive to the surface water concentration for someCOPCs. Surface water sampling was beyond the scope of this project. Therefore, historicwater quality data was pooled and maximum concentrations were selected for us in food webmodeling.
Analysis of Relationships Between Benthic Community, Contaminants, and Toxicity
The analysis of relationships between benthic community composition, contaminantconcentrations and whole sediment toxicity incorporates the uncertainty (described above)associated with each of these contributing elements.
The data necessary to complete a Sediment Quality Triad analysis was not available, as noadequate reference samples were available.
The weight of evidence analysis relies in part on historic data. For example, historic benthicdata was used for all locations except Riverbend and Kearny Marshes. The actual location ofsample collection may vary from those used for sediment chemistry and toxicity testing as partof this study. Likewise, use of this data assumes that the benthic community observed severalyears ago is representative of that which might be observed at the sediment sampling locationsused in this study.

March, 20048-1J:\Project\meri\Report\revisedreport\Report_Final.doc
8.0 CONCLUSIONS
The following provides a brief summary of key conclusions drawn from this project:
Benthic Community
The benthic community found at Riverbend includes faunal elements that are typical of highestuarine, low salinity marshes throughout the eastern United States. There is no evidence ofpollution or stress-related indicator species such as the polychaetes Capitella capitata or,possibly, Polydora cornuta.
The benthic community at Kearny Marsh appears to be impoverished and is possibly impactedby the high contaminant loads. This statement is tempered, however, by the fact that thespecies composition of the insects was not determined.
More than 55 taxa have been identified from the five marshes for which benthic data areavailable. All of these taxa observed during the current Project and past studies are commonlyfound in estuarine systems. The most commonly represented groups include, 12 insects, 12polychaetes, 8 amphipods, 5 isopods, 4 gastropods, and 3 bivalves.
Density, diversity, and evenness varied considerably within the wetlands sampled as part ofpast studies (Mill Creek, Oritani, and Secaucus High School marshes) with an order ofmagnitude difference in density between locations in a given wetland.
Previous studies included sampling of mudflats, tidal creeks, marsh plain, ponded/open water,channels, high marsh, and mosquito ditches. Samples collected as part of this study wereprimarily located in open water, mosquito ditches, and/or channels.
Toxicity Testing
Toxicity testing results were mixed. None of the test sediments produced 100% mortality. Asmight be expected, there were differences in survival and growth between the 28-day and 10-day test results. Survival and growth were not always similar (e.g., diminished survival andgrowth).
The 28-day mean survival rate for SAW-01, RBM-01, and SHS-01 were less than andsignificantly different than those for the negative control. RBM-01 exhibited greater than 50%mortality for the 28-day test, while greater than 50% mortality was reported for ORM-02 andSHS-01 in the 10-day tests.
More than 25% mortality was observed for SAW-01, ORM-01, RBM-02, and SHS-01 during the28-day tests and for samples from ORM-01, RBM-02, and SHS-02 for the 10-day test.However the survival in RBM-02 and SHS-02 were not significantly different from the control.

March, 20048-2J:\Project\meri\Report\revisedreport\Report_Final.doc
All samples from Kearny Marsh shown significantly lower growth than the control for the 10-daytest. This same pattern was not evident in the 28-day test. Survival was not significantlydifferent from the control for any of the samples in the 28-day test, but was significantly differentin KFM-01 for the 10-day test.
SHS-02 and SHS-03 sediments showed no significant difference in survival or growth from thecontrols in either the 28-day or 10-day tests.
Screening Level Ecological Risk Assessment (SLERA)
Evaluation of sediment quality in the five wetlands of interest indicated widespread exceedanceof benthos-based sediment screening values for metals in all wetlands, with the exception ofchromium and iron in Kearny and Oritani Marshes. Several of the metals are also known tobioaccumulate (cadmium, chromium, mercury).
The pesticides 4,4’-DDE and alpha-chlordane were selected as COPCs since their maximumconcentrations provided the greatest exceedances among detected pesticides (e.g., DDT andrelated fractions). The pesticide 4,4’-DDE is distributed widely throughout the wetlands,whereas alpha-chlordane was detected in Kearny Marsh.
PAHs were selected as they are a widely distributed contaminant in the wetlands and many ofthe individual PAH fractions were above the screening level, as was the cumulative total PAHs(tPAHs).
PCBs were detected, primarily as Aroclor 1248, 1254, and 1260, and were retained as a COPCdue to concern regarding their levels and inherent bioaccumulative properties and potentialadverse effects on higher wildlife.
Evaluation of sediment quality in the five wetlands of interest indicated widespread exceedanceof phytotoxicity-based sediment screening values. Organic contaminants do not exceed theavailable benchmarks for tPAHs and tPCBs. No phytotoxicity values were available for thepesticides. Comparison of the metals to available phytotoxicity screening benchmark valuesindicated widespread exceedances for the metals with the exceptions of cadmium and iron.
All assessment endpoints were evaluated using conservative assumptions in the selection ofcontaminant concentration, exposure terms, screening benchmarks, and ecological effects.Under this conservative screening approach and using conservative assumptions for food webmodeling, potential ecological risk was indicated for the four assessment endpoints. Theseresults indicate that further ecological risk investigation may be warranted.
Due to these conservative maximum exposure assumptions, there is a great deal of uncertaintyassociated with the risk estimates. The sources and potential influences of this uncertaintywere described and the results of this conservative screen were further evaluated to provide abetter interpretation of the potential risk at the Site. It is likely that alternative assumptions orusing site-specific factors may lead to a significantly lesser degree of potential risk.

March, 20048-3J:\Project\meri\Report\revisedreport\Report_Final.doc
Four representative species were evaluated using a maximum Hazard Quotient (HQ). Foodweb models indicate potential concern regarding maximum exposure of all COPCs exceptchromium, alpha-chlordane, 4,4’-DDE, and tPAHs for the mink, and all COPCs except arsenic,alpha-chlordane, and tPAHs for the heron. The results for muskrat indicate potential concernregarding exposure of arsenic (HQ = 2.55) and mercury (HQ = 1.47), however the magnitude ofthe HQ suggests only a slight potential for risk. The results of the food web models for mallardindicate potential concern regarding exposure of mercury (HQ = 1.47), but not other COPCs.
Wildlife Risk Curves
The wildlife risk curves indicate that the potential risk associated with different COPCs differssignificantly in magnitude and pattern of risk with increasing sediment concentrations and thatthese patterns also differ depending on the receptor/trophic pathway involved. In some casesthe level of estimated risk is so low for some receptor-COPC combinations that it is near zero.
In general, greater risk are predicted for the piscivores (heron, mink) than for the herbivores(mallard, muskrat) over the majority of the COPCs, with the mink having the highest HQs andthe mallard the lowest.
Higher risks are associated with the metals than with the organic COPCs.
For most COPCs (cadmium, chromium, copper, mercury, zinc, alpha-chlordane, 4,4’-DDE,tPCBs), the risk levels rise slightly as sediment concentrations rise from 25th to 75th percentile,with a large increase as the 100th percentile is reached.
Comparison of the median (50th percentile) HQ indicates that little or slight risk (HQ < 2) wouldbe predicted for most COPCs under average sediment and surface water concentrations withthe exception of arsenic.
Relationships Between Benthic Community, Contaminants, and Toxicity
Sufficient appropriate data was not available to support a classic Sediment Quality Triadanalysis. Therefore a qualitative analysis was provided.
No clear and definitive relationships emerge between sediment toxicity or sediment chemistryand benthic community parameters. The lack of obvious relationship may be caused by anumber of factors including physical habitat, water chemistry, potential overestimation ofpotential risk from sediment chemistry, and differences between the sensitivity of testorganisms and indigenous populations to sediment contaminants.

March, 20049-1J:\Project\meri\Report\revisedreport\Report_Final.doc
9.0 REFERENCES CITED
Banse, K. 1979. Ampharetidae (Polychaeta) from British Columbia and Washington. Canadian Journalof Zoology 57 (8): 1543-1552.
Barnthouse, L., D.L. DeAngelis, R.H. Gardner, R.V. O’Neill, G. W Suter and D.S. Vaughan, 1982.Methodology for Environmental Risk Analysis. ORNL/TM-8167. Oak Ridge NationalLaboratory, Oak Ridge, TN.
Barnthouse, L.W. and G.W. Suter. 1986. (eds.) User’s manual for ecological risk assessment ORNL-6251. Oak Ridge National Laboratory, Oak Ridge, TN.
Bell, S.S. 1982. On the population biology and meiofaunal characteristics of Manayunkia aestuarina(Polychaeta: Sabellidae: Fabricinae) from a South Carolina salt marsh. Estuarine, Coastal andShelf Science 14:215-221.
Blake, J.A. and K.H. Woodwick. 1971. A review of the genus Boccardia Carazzi (Polychaeta:Spionidae) with descriptions of two new species. Bulletin of the Southern California Academy ofSciences 70: 31-42.
Blake, J.A. and P.L. Arnofsky. 1999. Reproduction and larval development of the spioniformPolychaeta with application to systematics and phylogeny. Hydrobiologia 402:57-106.
Chapman, P.M. 1986. Sediment quality criteria from the sediment quality triad: an example.Environmental Toxicology and Chemistry 5:957-964.
Chapman, P.M., R.N. Dexter, S.F. Cross, and D.G. Mitchell. 1986. A field trial of the sediment qualitytriad in San Francisco Bay. NOAA Technical Memorandum NOS OMORMA 25. pp. 134.
Dauer, D.M. 1984. Functional morphology and feeding behavior of Streblospio benedicti (Polychaeta:Spionidae). In: Hutchings, P.A. (ed.) Proceedings of the First International PolychaeteConference, Sydney. Linnaean Society of New South Wales. Pp. 418-429.
Davis, G.M., M. Mazurkiewicz and M. Mantachie. 1982. Spurwinkia: Morphology, systematics, andecology of a new genus of North American marshland Hydrobiidae (Mollusca: Gastropoda).Proceedings of the Academy of Natural Sciences of Philadelphia 134:143-177.

March, 20049-2J:\Project\meri\Report\revisedreport\Report_Final.doc
Day, C., J. Staples, R. Russell, G. Nieminen, and A. Milliken. 1999. Hackensack MeadowlandsNational Wildlife Refuge: A presentation for a new establishment. U.S. Fish and WildlifeService, New Jersey Field Office, Pleasantville, NJ.
ECI. 1997. Harrier Meadows, Assessment of Subsurface Soil Contamination. Prepared byEnvironmental Connection, Inc., August 1997.
ECI. 1997. Skeetkill Creek Marsh: Preliminary Assessment of Soil Contaminants. Prepared byEnvironmental Connection, Inc., March 1997.
Efroymson, R.A., M.E. Will, G.W. Suter II and A.C. Wooten, 1997. Toxicological Benchmarks forScreening Potential Contaminants of Concern for Effects on Terrestrial Plants: 1997 Revision,Environmental Sciences Division, Oak Ridge National Laboratory, Oak Ridge, TN, ES/ER/TM-85/R3.
ENSR, 2001. Sediment Quality Triad Report. Long Island Sound Dredged Material Disposal EIS. FinalReport submitted to the U.S. Environmental Protection Agency, Region I, Boston, MA and theU.S. Army Corps of Engineers, New England District. 30 pp. + Appendices.
George, J.D. 1966. Reproduction and early development of the spionid polychaete Scolecolepidesviridis (Verrill). Biological Bulletin 130:76-93
Hackensack Meadowlands Development Commission (HMDC). 1987. Species Lists of OrganismsFound in the Hackensack Meadowlands: Vascular Plants – Mammals. Lyndhurst, NJ. May1987.
Hackensack Meadowlands Development Commission (HMDC). 1989. Inventory of FisheriesResources of the Hackensack River within the jurisdictional Boundary of the HackensackMeadowlands Development Commission from Kearny, Hudson County, to Ridgefield, BergenCounty, New Jersey. Division of Environmental Operations. Lyndhurst, NJ. May 1989.
HMDC. 1997. Mill Creek Wetlands Mitigation Site Baseline Monitoring Program, Soil and SedimentAnalysis. Prepared by Hackensack Meadowlands Development Commission, June 1997.
Hudsonia, Ltd. 2002. Hackensack Meadowlands, New Jersey, Biodiversity: A Review and Synthesis.Prepared for Hackensack Meadowlands Partnership. August 2002.
Klesch, W.L. 1970. The reproductive biology and larval development of Laeonereis culveri Webster(Polychaeta: Nereidae). Contributions to Marine Science 15:71-85.

March, 20049-3J:\Project\meri\Report\revisedreport\Report_Final.doc
Konsevick, E. and G. Reidel. 1993. Accumulation of Chromium in Blue Crabs (Callinectes sapidus)from the Hackensack River, Hudson County, New Jersey.
Langan EES. 1999. Sediment and Water Sampling Report, Kearny Marsh, Kearny NJ. Prepared byLangan Engineers and Environmental Services, Elmwood Park, NJ, June 1999
Long, E.R. and P.M. Chapman. 1985. A sediment quality triad: measures of sediment contamination,toxicity and infaunal community composition in Puget Sound. Marine Pollution Bulletin16(10):405-415.
Long, E.R., D.D. MacDonald, S.L. Smith, and F.D. Calder. 1995. Incidence of Adverse BiologicalEffects Within Ranges of Chemical Concentrations in Marine and Estuarine Sediments.Environmental Management. Vol. 19, No. 1, p. 81-97.
Louis Berger. 2001. Oritani Marsh Mitigation Site - Baseline Studies. Prepared by The Louis BergerGroup, Inc., February 2001.
MacDonald, D.D., Ingersol, C.G. and T.A. Berger. 2000. Development and Evaluation of Consensus-BasedSediment Quality Guidelines for Freshwater Ecosystems. Arch. Environ. Contam. Toxicol. 39:20-31.
Maciolek, N.J. 1984. New records and species of Marenzellaria Mesnil and Scolecolepides Ehlers(Polychaeta: Spionidae) from Northeastern North America. In: Hutchings, P.A. (ed.)Proceedings of the First International Polychaete Conference, Sydney. Linnaean Society ofNew South Wales. Pp. 48-62.
Mazurkiewicz, M. 1975. Larval development and habits of Laeonereis culveri (Webster) (Polychaeta:Nereidae). Biological Bulletin 149:186-204.
NJMC. 2003. New Jersey Meadowlands Commission Master Plan.http://www.hmdc.state.nj.us/masterplan/index.html
Opresko, D.M., B.E. Sample, and G.W. Suter, 1993. "Toxicological Benchmarks for Wildlife". OakRidge National Laboratory, Oak Ridge, TN. September 1993. ES/ER/TM-86/R1.
Persaud, D., R. Jaagumagi, and A. Hayton. 1996. Guidelines for the Protection and Management ofAquatic Sediment Quality in Ontario, Ontario Ministry of the Environment, Queen's Printer forOntario; 23 pp.
Pettibone, M.H. 1963. Marine polychaete worms of the New England region. Bulletin of the UnitedStates National Museum 227, Part 1. 356 pp.

March, 20049-4J:\Project\meri\Report\revisedreport\Report_Final.doc
Pettibone, M.L. 1977. The synonymy and distribution of the estuarine Hypaniola florida (Hartman) fromthe east coast of the United States (Polychaeta: Ampharetidae). Proceedings of the BiologicalSociety of Washington 90: 205-208.
Sample B.E., D.M. Opresko and G.W. Suter II, 1996. "Toxicological Benchmarks for Wildlife". Oak RidgeNational Laboratory, Oak Ridge, TN. ES/ER/TM-86/R3.
Suter, G.W. II, and C.L. Tsao, 1996. Toxicological Benchmarks for Screening Potential Contaminants ofConcern for Effects on Aquatic Biota: 1996 Revision, Environmental Sciences Division, Oak RidgeNational Laboratory, Oak Ridge, TN, ES/ER/TM-96/R2.
Suter. G.W. 1993. Ecological Risk Assessment. Lewis Publishers, Boca Raton, FL.
TAMS. 2001a. Secaucus High School Wetlands Mitigation Site Baseline Studies: Sampling Analyses ofSurface water and Sediment. Prepared by TAMS Consultants, Inc, March 2001
TAMS. 2001b. Riverbend Wetland Preserve: Sampling and Analyses of Sediment. Prepared by TAMSConsultants, Inc, June 2001.
Trueblood, D.D., E.D. Gallagher, and Diane M. Gould. 1994. Three stages of seasonal succession onthe Savin Hill Cove mudflat, Boston Harbor. Limnology and Oceanography 39: 1440-1454.
U.S. EPA, 1989. "Risk Assessment Guidance for Superfund: "Environmental Evaluation Manual";Volume 2; EPA/540/1-89/002; December, 1989.
U.S. EPA, 1999. Screening Level Ecological Risk Assessment Protocol for Hazardous WasteCombustion Facilities. EPA/530/D-99/001A. December, 1999.
U.S. EPA. 2003. USEPA Region 5 Ecological Screening Levels. Revision August 2003. Available at:http://www.epa.gov/reg5rcra/ca/edql.htm
U.S. EPA. 1988. Review of Ecological Risk Assessment Methods. Office of Policy, Planning andEvaluation. Washington, D.C. EPA/230-10-88-041.
U.S. EPA. 1992. Framework for ecological risk assessment. Risk Assessment Forum, Washington,D.C. EPA/630/R-92/001.
U.S. EPA. 1993a. Wildlife Exposure Factors Handbook. Vols. I. Office of Research and Development,Washington, D.C. EPA/600-R/R-93/187a,187b.

March, 20049-5J:\Project\meri\Report\revisedreport\Report_Final.doc
U.S. EPA. 1993b. Wildlife Exposure Factors Handbook. Vols. II. Office of Research andDevelopment, Washington, D.C. EPA/600-R/R-93/187a,187b.
U.S. EPA.1997. Ecological Risk Assessment Guidance for Superfund, Process for Designing andConducting Ecological Risk Assessments (Interim Final). U.S. Environmental ProtectionAgency, Office of Solid Waste and Emergency Response, Office of Emergency and RemedialResponse. EPA 540/R-97/006. June, 1997.
U.S.EPA, 2002. National Recommended Water Quality Criteria: 2002. Office of Water. EPA 822-R-02-047. November 2002.
Weis, J. and P. Weis. undated. Benthic Communities and Metal Contamination in Eight-Day Swamp, Abrackish Marsh in the Hackensack Meadowlands of New Jersey,
Yuhas, C. 2001. Benthic Communities in Spartina Alterniflora and Phragmites Australis dominated saltmarshes. May 2001.
Zottoli, R.A. 1974. Reproduction and larval development of the ampharetid polychaete Amphicteisfloridus. Transactions of the American Microscopical Society 93:78-89.