mdec’s perspective on creative multimedia – the next ... · mdec’s perspective on creative...
TRANSCRIPT
1
MDEC’S PERSPECTIVE ON CREATIVE
MULTIMEDIA – THE NEXT BOOMING
INDUSTRY
Kamil Othman
Vice President, Creative Multimedia Division
Multimedia Development Corporation
6 May 2014
Penang Creative Industry Conference & Showcase (PCICS), 2014
Equatorial Hotel, Penang
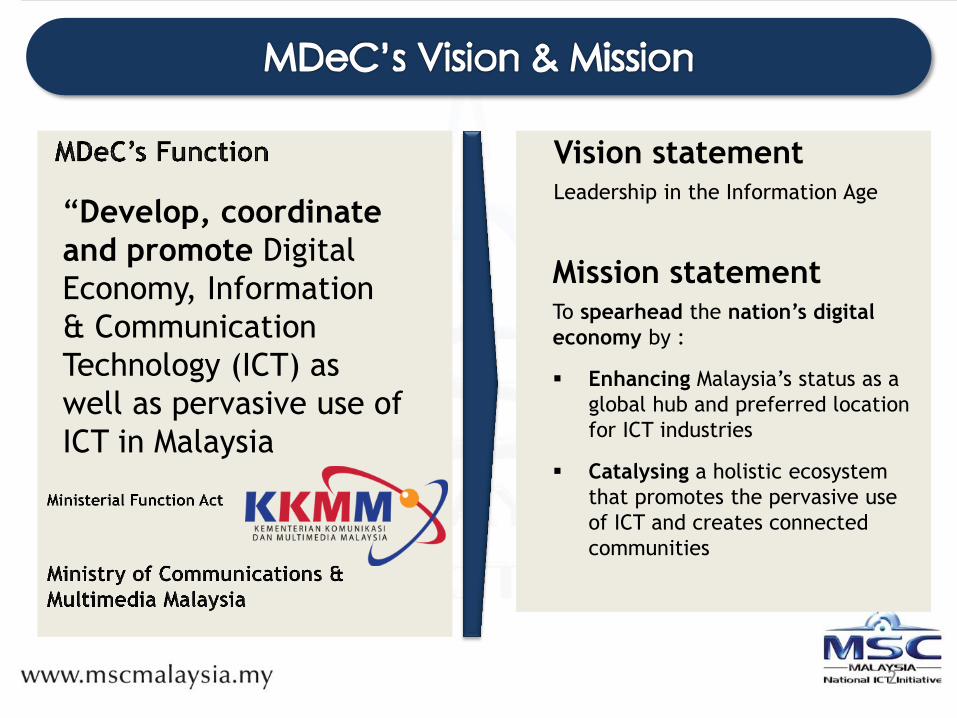
“Develop, coordinate
and promote Digital
Economy, Information
& Communication
Technology (ICT) as
well as pervasive use of
ICT in Malaysia
2
Mission statement To spearhead the nation’s digital
economy by :
Enhancing Malaysia’s status as a
global hub and preferred location
for ICT industries
Catalysing a holistic ecosystem
that promotes the pervasive use
of ICT and creates connected
communities
Vision statement Leadership in the Information Age

1,764 companies 309 companies 241 companies

4
Entertainment Medical
Tourism
Animation & VFX
Games and Digital Comics
Mobile Content and
Apps
E-Publishing &
Interactive Media
INDUSTRY CREATES PRODUCTS AND SERVICES
TECHNOLOGY ENABLES INNOVATION AND PRODUCTION OF CONTENT
Development Pre-
Production Production Post-
Production
Marketing , Distribution & Licensing
Light Stage Technology
2D / 3D/CGI 3D Stereoscopic
Motion Graphics Motion Capture Cloud Rendering
Serious Games Digital
Compression
Religion and Cultural
Design & Architecture
Education/Training
Defence
Govt Services
Oil & Gas
Construction
Virtual & Augmented
Reality
Film & TV Content
Cross-industry applications

5
Presented below is the Revenue of total Creative Multimedia industry revenue for
2011 and Forecast for Year 2017
Summary - Industry Revenues
Executive Summary
Creative Multimedia Industry Revenues
1.8
Overall Industry Size:
RM 13.422 Billion
In 2011
Overall Industry Size:
RM 23.847 Billion
In 2017
CAGR: +10.05%
RM
Millio
n
681
150
1,714
280
-
500
1,000
1,500
2,000
2,500
3,000
FILM TV GAMING MOBILE CONTENT
6- Yr CAGR:
+11%
6- Yr CAGR:
+17%
4,788 7,803 8,030
13,823
-
5,000
10,000
15,000
2011 2017 6- Yr CAGR:
+10% 6- Yr CAGR:
+9%
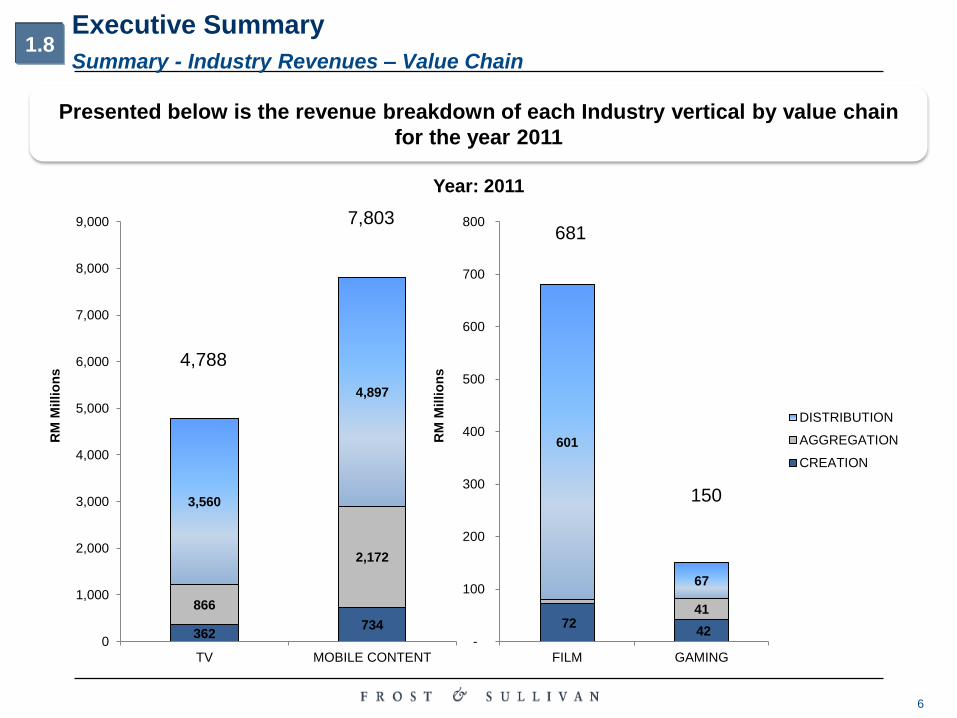
6
Presented below is the revenue breakdown of each Industry vertical by value chain
for the year 2011
Summary - Industry Revenues – Value Chain
Executive Summary
72 42
41
601
67
-
100
200
300
400
500
600
700
800
FILM GAMING
RM
Millio
ns
DISTRIBUTION
AGGREGATION
CREATION
362 734
866
2,172
3,560
4,897
0
1,000
2,000
3,000
4,000
5,000
6,000
7,000
8,000
9,000
TV MOBILE CONTENT
RM
Millio
ns
Year: 2011
1.8
4,788
7,803 681
150
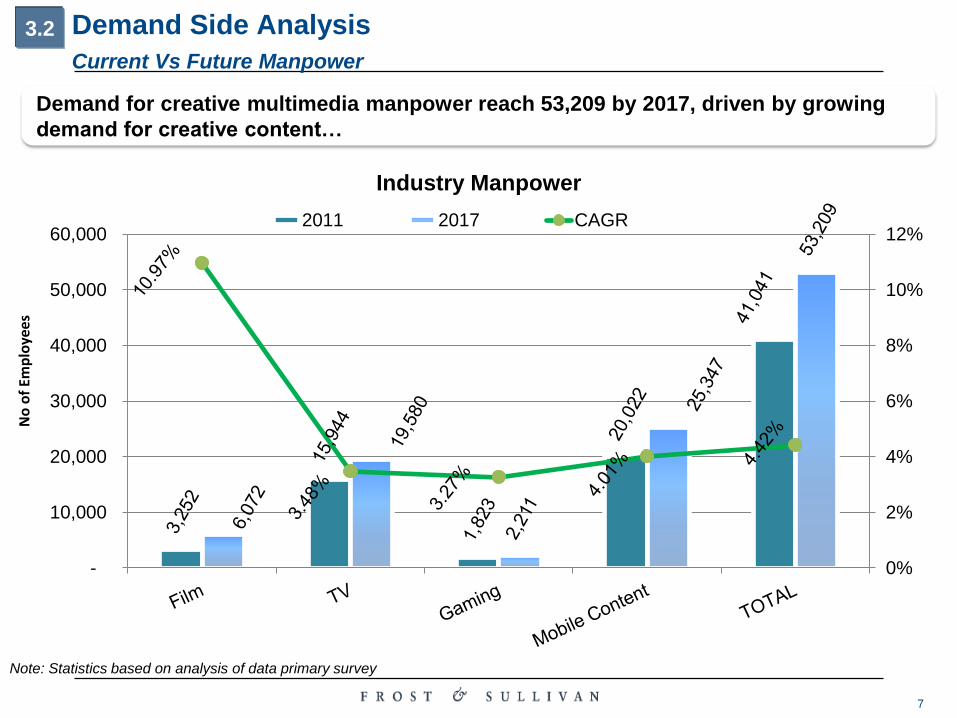
7
Demand Side Analysis
Current Vs Future Manpower
Demand for creative multimedia manpower reach 53,209 by 2017, driven by growing
demand for creative content…
0%
2%
4%
6%
8%
10%
12%
-
10,000
20,000
30,000
40,000
50,000
60,000
Industry Manpower
2011 2017 CAGR
No
of
Emp
loye
es
3.2
Note: Statistics based on analysis of data primary survey

8
Demand Side Analysis
Current Vs Future Manpower
Mobile content, film and TV sectors have high revenue to employee ratios due to
greater levels of automation 2
09
,31
7
30
0,2
98
82
,12
5
38
9,7
21
28
2,3
04
410,1
13
12
6,6
45
54
5,3
59
Film TV Gaming Mobile Content
Productivity
2011 2017
Note:
Efficiency measured based on revenue per employee ratio
3.2
Note: Statistics based on analysis of data primary survey
In the future, improvements in efficiency is to be driven by
a. Technological advancements, b. Skillset enhancements, c. Greater ease of distribution
Mobile content has the highest Productivity because distribution through Mobile operators is the most automated amongst the 4
Industry Verticals

Development of the Creative
Industry In MSC Malaysia
1- Policies & Legislation
2 - Funding & Incentives
3- Market Access, Distribution & Delivery
8-Enterprise Development
7-Infrastructure
5-Talent & Skills Development
9-Generate, Amass & Monetize
IP Inventory
4- IP Protection
9
6-R&D and Technology
STRENGTHEN THE INDUSTRY’S BUILDING BLOCKS

OUR SUPPORT TO INDUSTRY….
10
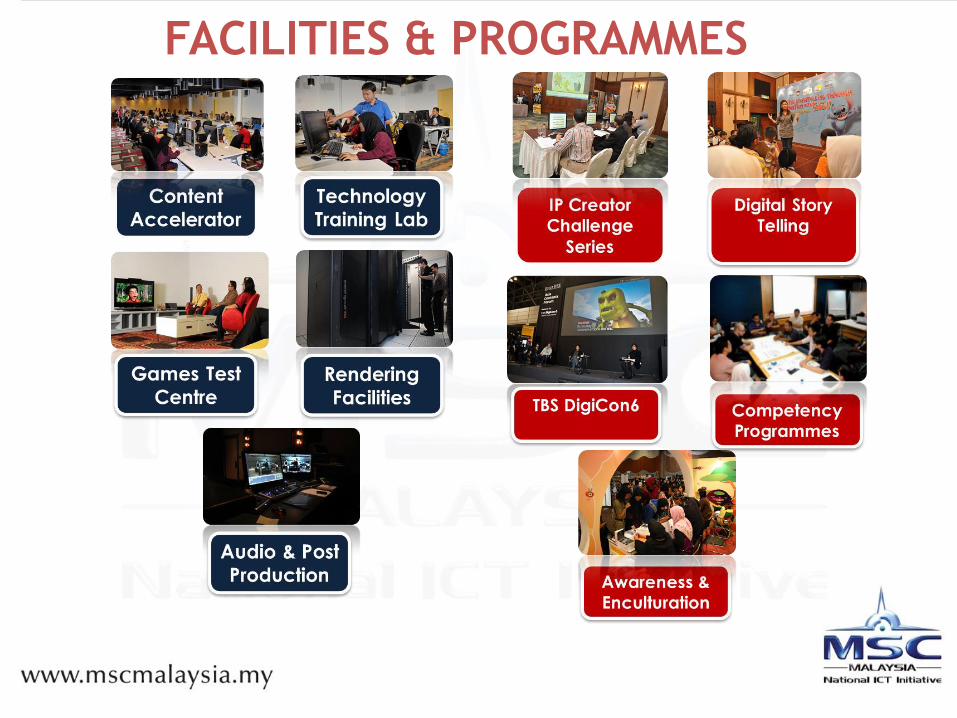
FACILITIES & PROGRAMMES

52 companies
Games
and
Digital
Comics
104 companies
Animation
54 companies
Mobile
Content,
Apps and
New Media
99 companies
Film, TV
and VFX

Codemasters (UK)
Games
Mobile
Smilegate (KOR) Polygon Pictures
(JPN)
Digital Frontier (JPN) Bloomberg (USA) Al Jazeera (QAT)
Animation
Animation
TV
Games
TV
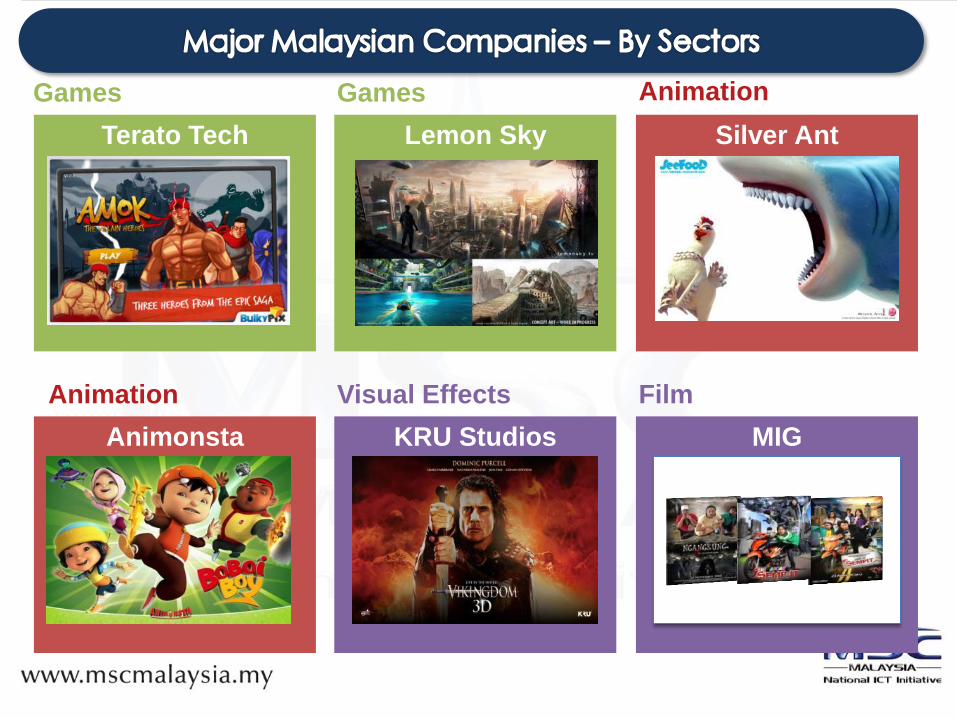
Terato Tech
Games
Mobile
Lemon Sky Silver Ant
Animonsta KRU Studios MIG
Animation
Animation
Visual Effects
Games
Film
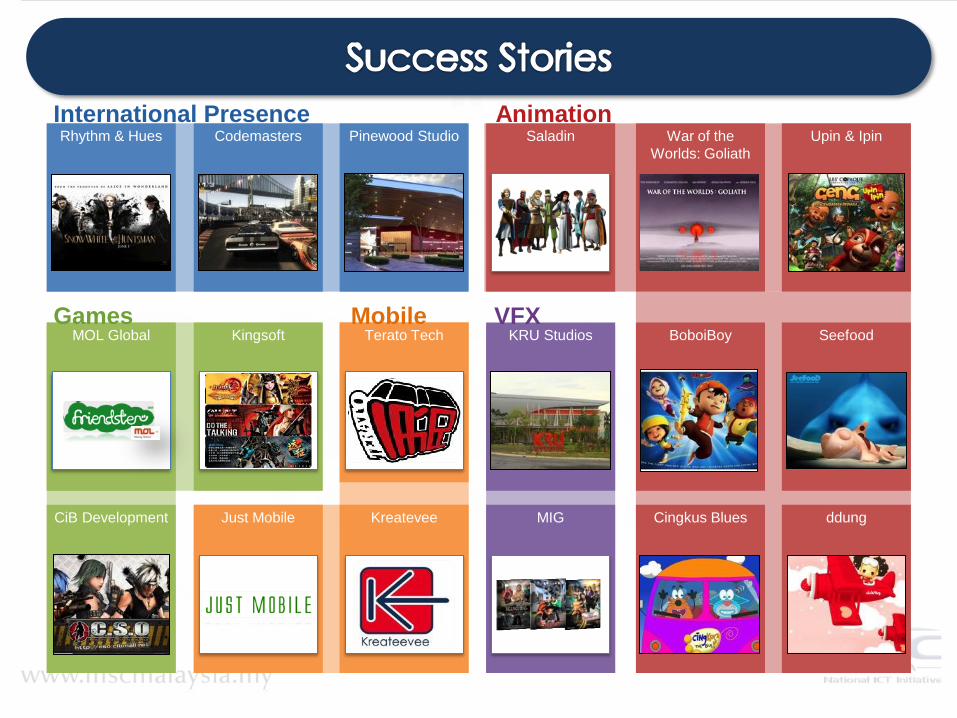
Just Mobile
Terato Tech
Rhythm & Hues
MOL Global
CiB Development
Codemasters
Kingsoft
Pinewood Studio
Kreatevee
Saladin
KRU Studios
MIG
War of the
Worlds: Goliath
BoboiBoy
Cingkus Blues
Upin & Ipin
Seefood
ddung
International Presence Animation
Games Mobile VFX

IP Creator Challenge Series
Competency & Mentorship
Programmes
Public Awareness &
Enculturation
Digital Story Telling
TBS DigiCon6
Creative Industry Lifelong
Learning (CILL)

The MSC Malaysia Creative Content Centre (MaC3) was established in June 2009 to:
1. Provide facilities and access to technology
and resources for content entrepreneurs
2. Develop talent through training and mentoring
3. Launch Malaysia as a leading provider of creative digital content
Content Accelerators
Technology Training Lab
Games Test Centre
Rendering Facilities Audio and Post Production
MAC3 is the nucleus in the
development of the creative
digital content industry in
Malaysia. It is to help and
inspire artists, scientists and
the general public in the
opportunities in content
creation and
commercialization ”
“
BoboiBoy
Mask Master
Vektor 58
Jellyfish Eyes
Some Productions
Rendered @MaC3

• The MaC3 Fund (formerly known as MaC3 Co-Pro Fund) was
launched in 2009 to fund innovative local companies develop,
produce and co-produce creative multimedia content
• Funds offered are: Development Fund, Production Fund and
Co-Production Fund
• Offered to Malaysian incorporated companies with majority
Malaysian shareholding
• Areas: Animation, Game, Digital Film with VFX components,
Beyond Entertainment), High-end Technology Deployment
and Digital Music
To date, RM 58 million has been awarded.
RM 30 million on offer in 2013.
MaC3 Fund Development | Production | Co-Production
Buzzy Bee
BBoing
Chuck
Chicken
Some MaC3 Fund Recipients

North America
South America
Africa
UK
France
Rome Qatar
Indonesia
Australia
Korea
Japan
Thailand
Singapore
India
Hong Kong
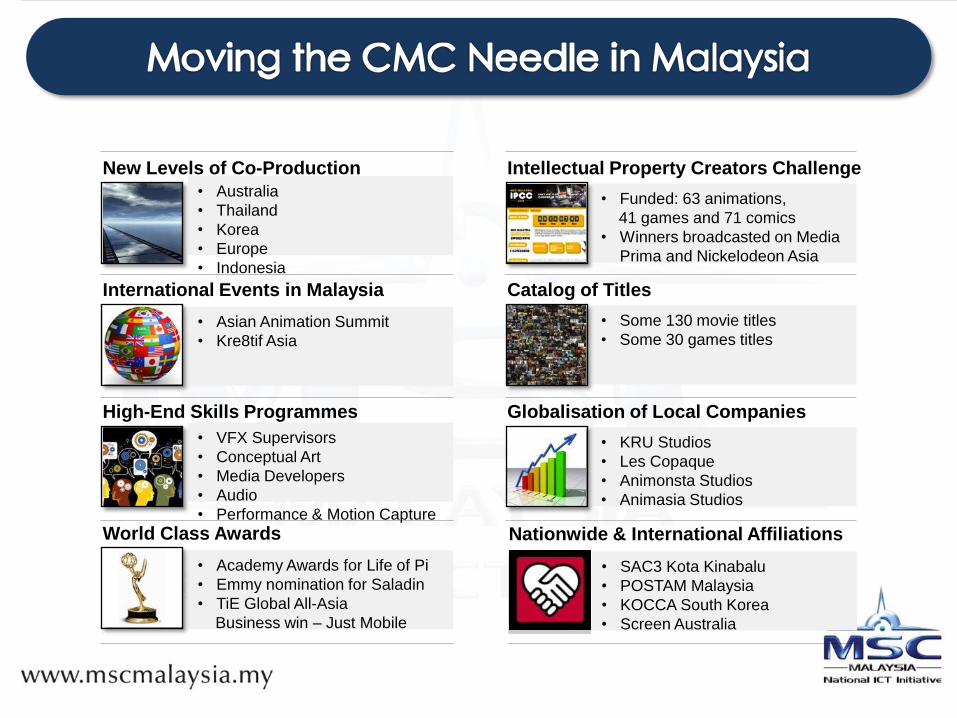
New Levels of Co-Production
• Australia
• Thailand
• Korea
• Europe
• Indonesia
International Events in Malaysia
• Asian Animation Summit
• Kre8tif Asia
High-End Skills Programmes
• VFX Supervisors
• Conceptual Art
• Media Developers
• Audio
• Performance & Motion Capture
World Class Awards
• Academy Awards for Life of Pi
• Emmy nomination for Saladin
• TiE Global All-Asia
Business win – Just Mobile
Intellectual Property Creators Challenge
• Funded: 63 animations,
41 games and 71 comics
• Winners broadcasted on Media
Prima and Nickelodeon Asia
Catalog of Titles
• Some 130 movie titles
• Some 30 games titles
Globalisation of Local Companies
• KRU Studios
• Les Copaque
• Animonsta Studios
• Animasia Studios
Nationwide & International Affiliations
• SAC3 Kota Kinabalu
• POSTAM Malaysia
• KOCCA South Korea
• Screen Australia

National Creative Industry
Policy
(NCIP/ DIKN)
National Key Economic Area
Communication, Content &
Infrastructure (NKEA/CCI)
1. Aims to enhance capacity
and capability: To create
original locally produced
content and at the same
time develop a
competency to provide
content related services to
the regional market.
2. Target in year 2020:
Incremental GNI impact –
RM35.7 billion with
additional 43,163 jobs.
1. To spur creative activities
in the country as an
economic generator
2. To promote the
development of the three
major sectors which are
the Creative Multimedia,
Arts & Culture and Cultural
Heritage
IP Funding
1.
Market
Access 2.
Strategic
Alliances 3.
Skills
Developmen
t Digital
Media
Zones
5.
4.

MSC Malaysia Bill of
Guarantees
Film In Malaysia Incentive
(FIMI)
1. 30% cash rebate on all
Qualifying Malaysian
Production Expenditure
(QMPE)
2. Applicable to Production
and/or Post Production
activities
3. For TV series and films,
both live action and
animated
1. Zero corporate income tax
for up to 10 years
2. Investment Tax Allowance
for up to 5 years
3. No restriction on foreign
ownership of the company
4. No restriction on hiring of
foreign knowledge workers

Future Focus For Malaysia’s Creative Content Industry
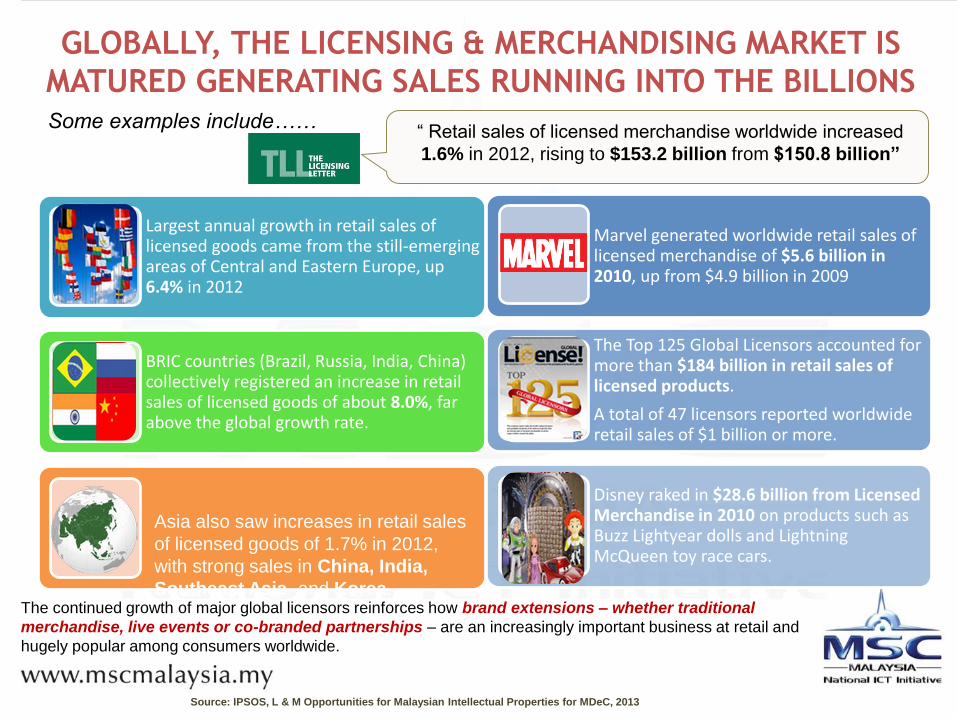
GLOBALLY, THE LICENSING & MERCHANDISING MARKET IS
MATURED GENERATING SALES RUNNING INTO THE BILLIONS Some examples include……
Largest annual growth in retail sales of licensed goods came from the still-emerging areas of Central and Eastern Europe, up 6.4% in 2012
BRIC countries (Brazil, Russia, India, China) collectively registered an increase in retail sales of licensed goods of about 8.0%, far above the global growth rate.
Marvel generated worldwide retail sales of licensed merchandise of $5.6 billion in 2010, up from $4.9 billion in 2009
The Top 125 Global Licensors accounted for more than $184 billion in retail sales of licensed products.
A total of 47 licensors reported worldwide retail sales of $1 billion or more.
Disney raked in $28.6 billion from Licensed Merchandise in 2010 on products such as Buzz Lightyear dolls and Lightning McQueen toy race cars.
The continued growth of major global licensors reinforces how brand extensions – whether traditional
merchandise, live events or co-branded partnerships – are an increasingly important business at retail and
hugely popular among consumers worldwide.
Asia also saw increases in retail sales
of licensed goods of 1.7% in 2012,
with strong sales in China, India,
Southeast Asia, and Korea.
“ Retail sales of licensed merchandise worldwide increased
1.6% in 2012, rising to $153.2 billion from $150.8 billion”
Source: IPSOS, L & M Opportunities for Malaysian Intellectual Properties for MDeC, 2013

• The traditional value chain :
L&M TRENDS: REINVENTION
Dooodolls was
produced as
characters and
merchandised.
Now moving into
the content space
of producing
digital games
Focus on characters and merchandising
these character without a content format
Marketing content for free to establish market
base for L&M
Thomas & Friends markets its
content for free to media
platforms to create a
substantial market base. Main
revenue generation from
L&M.
Reversing the value chain,
producing merchandises prior to the
release of content
Ironman 3 merchandises
were available in retail
stores even before the
movie premiered
Produce IP
Market on traditional platform:
broadcasting, publishing etc
Merchandising
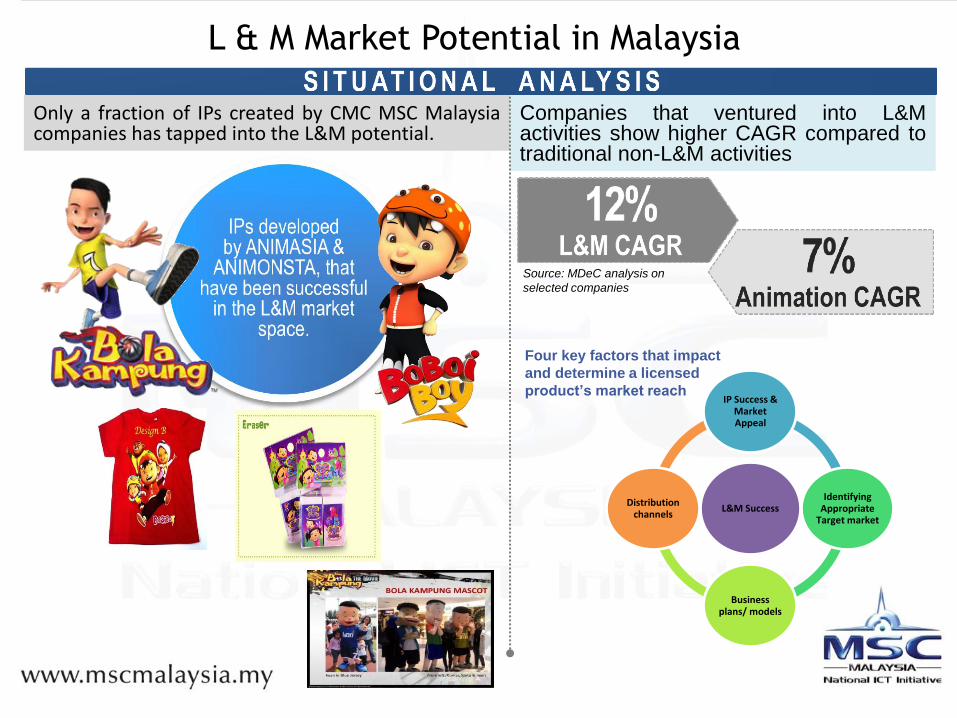
Only a fraction of IPs created by CMC MSC Malaysia companies has tapped into the L&M potential.
L & M Market Potential in Malaysia
Companies that ventured into L&M activities show higher CAGR compared to traditional non-L&M activities
L&M Success
IP Success & Market Appeal
Identifying Appropriate
Target market
Business plans/ models
Distribution channels
Four key factors that impact
and determine a licensed
product’s market reach
Source: MDeC analysis on
selected companies

Gaming industry in Malaysia is in its infancy, RM31 mil was generated from own IPs;
which constitutes to about 20% of overall gaming revenues
IP Statistics
2.3 Gaming
150
31
-
20
40
60
80
100
120
140
160
TotalRevenues
Revenuesfrom Own
IP
RM
Mil
lio
n
Revenues
22.44%
13.41%
0.00%
5.00%
10.00%
15.00%
20.00%
25.00%
Cost of First IP/Revenue
Cost ofSubsequent IP/
Revenue
Cost of IPs/Revenue Year: 2011
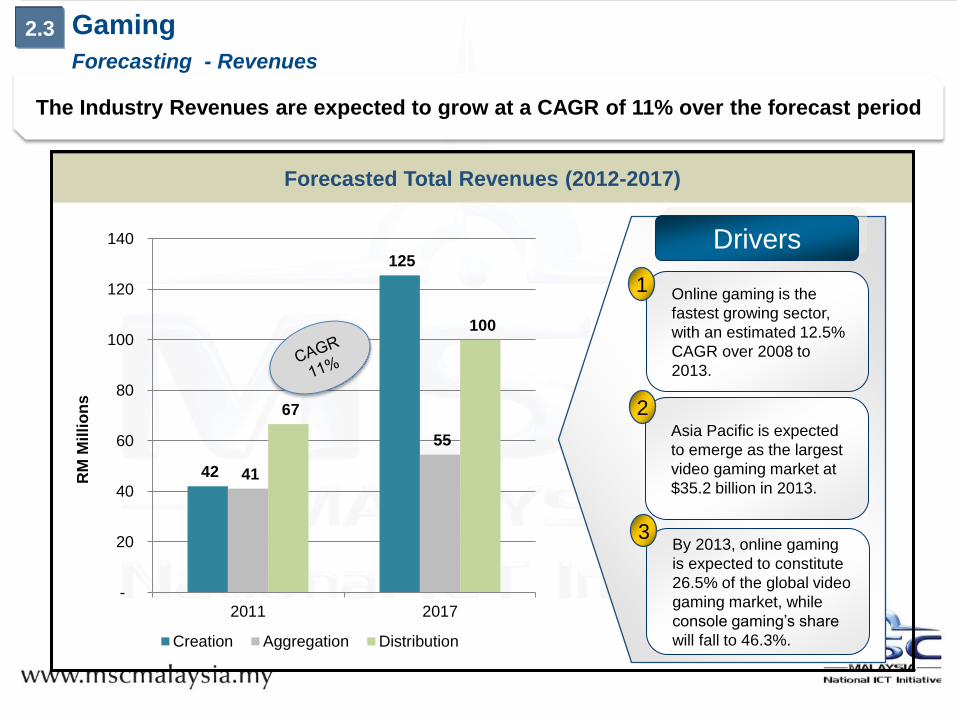
Forecasted Total Revenues (2012-2017)
The Industry Revenues are expected to grow at a CAGR of 11% over the forecast period
By 2013, online gaming
is expected to constitute
26.5% of the global video
gaming market, while
console gaming’s share
will fall to 46.3%.
3
Drivers
Asia Pacific is expected
to emerge as the largest
video gaming market at
$35.2 billion in 2013.
2
Online gaming is the
fastest growing sector,
with an estimated 12.5%
CAGR over 2008 to
2013.
1
Forecasting - Revenues
2.3 Gaming
42
125
41
55
67
100
-
20
40
60
80
100
120
140
2011 2017
RM
Milli
on
s
Creation Aggregation Distribution

Sources: Factiva, ISI Emerging Markets,
Business Insights
Asia Pacific is expected to emerge as the
largest video gaming market at $35.2
billion in 2013.
3
Trends and
Developments
Online gaming is the fastest growing
sector, with an estimated 12.5% CAGR
over 2008 to 2013.
2
Console gaming remains the largest
segment of the regional video gaming
market, with a market value of $40.7
billion.
1
2.3 Gaming
Regional Trends
A regional perspective of the Gaming industry.
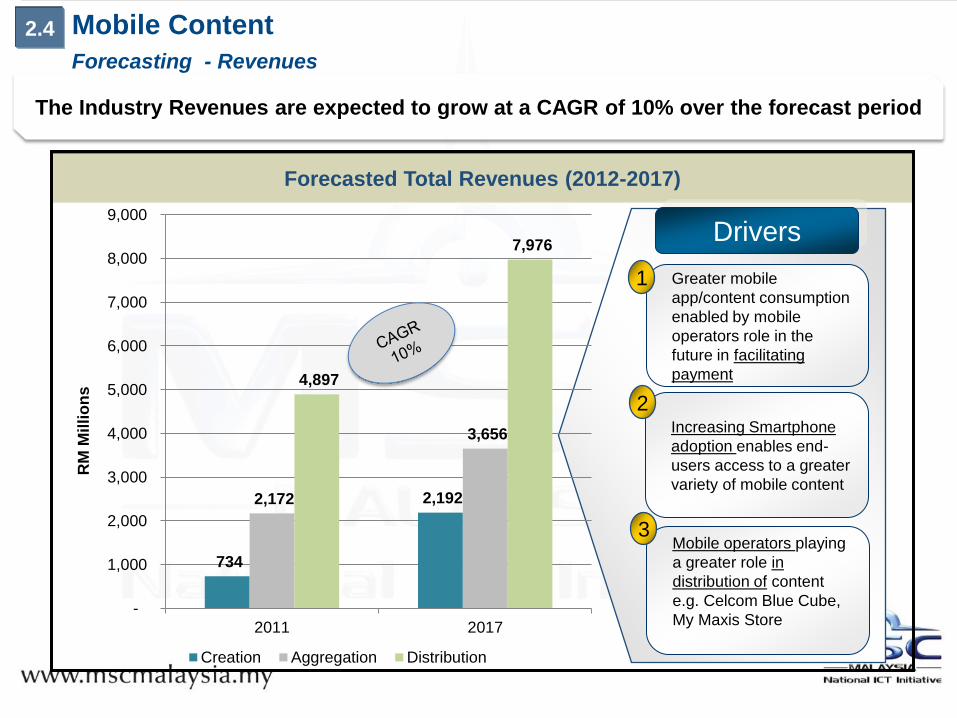
Forecasted Total Revenues (2012-2017)
The Industry Revenues are expected to grow at a CAGR of 10% over the forecast period
Mobile operators playing
a greater role in
distribution of content
e.g. Celcom Blue Cube,
My Maxis Store
3
Drivers
Increasing Smartphone
adoption enables end-
users access to a greater
variety of mobile content
2
Greater mobile
app/content consumption
enabled by mobile
operators role in the
future in facilitating
payment
1
Forecasting - Revenues
Mobile Content 2.4
734
2,192 2,172
3,656
4,897
7,976
-
1,000
2,000
3,000
4,000
5,000
6,000
7,000
8,000
9,000
2011 2017
RM
Milli
on
s
Creation Aggregation Distribution

Forecasted Total Manpower (2012-2017)
Forecasting - Manpower
2.4 Mobile Content
3,030
6,465
8,699
10,463
8,293 8,419
0
2000
4000
6000
8000
10000
12000
2011 2017
Creation Aggregation Distribution
Manpower will grow at rate of 4.01% and Revenue per employee will grow at rate of
5.76% between 2012 and 2017
Lower growth in
distribution manpower
driven by technology
efficiency and declining
role of mobile companies
in content distribution
3
Drivers
More aggregation
manpower to support the
growing content
consumption (e.g. mobile
content portals e.g. Play
Store, BBC News App)
2
Greater content creation
activities due to
technology driven growth
in demand (e.g. smart
phones enable greater
content consumption)
1

MSC Malaysia ICON Program is a
collaboration between Nokia, MSC
Malaysia and Cradle Fund which aims
to provide support to the developer
community and encourage digital
content development in Malaysia.
1
Asia is the biggest market for
applications, accounting for 37% of
global downloads although North
American users spent the most money.
3
Trends and
Developments
Data revenue in Japan will reach $43.5
billion and monthly data average
revenue per user will be $27.1 in 2014,
with data revenue surpassing voice
revenue.
2
Regional Trends
A regional perspective of the Mobile Content Industry.
Mobile Content 2.4
