mchp data quality framework - university of...
TRANSCRIPT

MCHP Data Quality Framework Manitoba Centre for Health Policy
Version – 5/22/2018
Authors: Mahmoud Azimaee Mark Smith Lisa Lix Tyler Ostapyk Charles Burchill Justine Orr

2 MCHP Data Quality Framework
This document is produced and published by the Manitoba Centre for Health Policy (MCHP). It is also available in PDF format on our website at: http://www.umanitoba.ca/faculties/medicine/units/chs/departmental_units/mchp/protocol/media/Data_Quality_Framework.pdf Information concerning this framework or any other report produced by MCHP can be obtained by contacting: Manitoba Centre for Health Policy Dept. of Community Health Sciences Faculty of Medicine, University of Manitoba 4th Floor, Room 408 727 McDermot Avenue Winnipeg, Manitoba, Canada R3E 3P5 Email: [email protected] Phone: (204) 789-3819 Fax: (204) 789-3910 How to cite this document: Azimaee M, Smith M, Lix L, Ostapyk T, Burchill C, Orr J. MCHP Data Quality Framework. Winnipeg, Manitoba, Canada:
Manitoba Centre for Health Policy, University of Manitoba; 2018. http://umanitoba.ca/faculties/medicine/units/
chs /departmental_units/mchp/protocol/media/Data_Quality_Framework.pdf

3 MCHP Data Quality Framework
Table of Contents
Introduction .................................................................................................................................... 4
1 - The MCHP Data Quality Report ................................................................................................. 6
1.1 - SAS Data Quality Macros ........................................................................................................ 6
2 - Acquisition Level Data Quality Assessment ............................................................................... 7
2.1 – Accuracy ................................................................................................................................. 7
2.1.1 - Completeness .............................................................................................................. 7
2.1.2 - Correctness .................................................................................................................. 7
2.1.3 - Evaluating Accuracy at MCHP ...................................................................................... 9
2.2 - Internal Validity ..................................................................................................................... 13
2.2.1 - Internal Consistency .................................................................................................. 13
2.2.2 - Temporal Consistency (Stability across Time) ........................................................... 14
2.2.3 - Linkability ................................................................................................................... 16
2.3 - External Validity .................................................................................................................... 20
2.3.1 - Identifying Units of Analysis ...................................................................................... 20
2.3.2 - Level of Agreement with the Literature and Available Reports ................................ 20
2.4 - Timeliness ............................................................................................................................. 20
2.4.1 - Time to Acquisition .................................................................................................... 20
2.4.2 - Time to Release.......................................................................................................... 20
2.4.3 - Currency of Documentation ...................................................................................... 20
2.5 - Interpretability ...................................................................................................................... 21
2.6 - Value ..................................................................................................................................... 21
2.6.1 - Usage ......................................................................................................................... 21
2.6.2. - User Satisfaction ....................................................................................................... 21
3 - Dealing with Problems in the Data .......................................................................................... 22
3.1 - Imputation .................................................................................................................... 22
Appendix A: The Data Management Process Diagram ................................................................. 23
Appendix B: The Data Quality Process Diagram ........................................................................... 24
Bibliography .................................................................................................................................. 25

4 MCHP Data Quality Framework
“Good decisions require good data.”
Introduction
Data collected for various administrative purposes is not always of the best quality for research.
Although source agencies often conduct their own quality evaluations, these assessments are unlikely to
investigate the data’s potential for research use. Multiple other factors affect the research quality of
administrative data including the knowledge and experience of data collection staff, the standards and
requirements in practice in various work environments, and simply the level of staff distraction on a
given day. Use of poor quality data can impede the research process and lead to false conclusions,
resulting in the development of programs and policies based on inaccurate or incomplete information.
For this reason, it is important to determine the quality of data before decisions are made.
Due to restrictions on when data can be accessed at MCHP, the process of assessing data quality is
divided into two phases. In the first phase, which involves working only with one particular set of data
files, certain tests are performed by acquisition staff. This is referred to as Acquisition Level analysis. All
new repository data at MCHP are evaluated at this level before being installed. This allows Data
Management staff to identify problems, document potential issues, and improve the quality of data
before it is made available to programmers and researchers. In the second phase, links between data
files can occur. At MCHP this is only possible if the analysis takes place within the context of a research
project that has received appropriate ethical and Privacy Committee approvals. In this phase analysis
concerning Agreement with other databases, Consistency, Measurement Error, and Level of Bias can be
implemented.
This framework is a living document that focusses on the formalized process of acquisition level data
quality evaluation at MCHP. It is informed by current practices at MCHP as well as “a scoping review of
existing [data quality] frameworks” 1 and includes both a general description of the techniques and tools
used to evaluate data quality at MCHP and the aim of these tools and techniques. While this document
focusses solely on the first phase of Data Quality Evaluation (the Acquisition phase), a summary of both
Data Quality Evaluation approaches is provided on the following page.
1 Lix et al., A Systematic Investigation of Manitoba’s Provincial Laboratory Data, 13.

5 MCHP Data Quality Framework
Acquisition Level Quality Assessment
o Accuracy
Completeness: Rate of Missing values, Geographic Coverage
Correctness: Invalid codes, Invalid dates, Out of range, Outliers and Extreme
Observations
o Internal Validity
Internal Consistency
Stability across time: Trend Analysis for core elements
Cross-Walk linkage
PHIN Validity: check-digit analysis
Linkability: Percentage of records that can be linked with other databases
Agreement Analysis: Using kappa statistics to check consistency of the data
with the registry for sex and date of birth.
o External Validity
Identifying Units of Analysis (Person, Places, …)
Level of Agreement with the Literature and Available Reports
o Timeliness
Time to Data Release
Time to Data Acquirement
Documentation Currency
o Interpretability
Availability and Quality of Documents, Policies and Procedures, Formats Libraries,
Metadata, Data Model Diagrams
o Value
Usage
User Satisfaction
Research Level Quality Assessment
o Accuracy (when a special data quality study e.g. a re-abstraction study, has been done)
Completeness: Under- or Over- Coverage rate
Measurement Error
o Reliability
Level of Agreement with Other Databases

6 MCHP Data Quality Framework
Data Quality at the Acquisition Level
Acquisition level data quality evaluation includes the assessment of accuracy, internal validity, external validity,
timeliness, and interpretability. Each assessment aims to evaluate the usability of the data and is measured by one
or more indicators2. Using these indicators as guides, macros have been developed to generate summary data for
Data Quality Reports, automating and further formalizing MCHP’s Data Quality Evaluation Process.
1 - The MCHP Data Quality Report
The MCHP Data Quality Report is loosely based on the VODIM (Valid, Other, Default, Invalid, Missing) concept3 and
uses CIHI’s suggested indicators along with other indicators uniquely designed for MCHP data. These indicators and
their relation to the Data Quality report and Data Quality evaluation at MCHP are outlined below. Data Quality
reports are generated for the following intended purposes:
1. Utilization by internal data management staff, as part of the quality assurance process, and the
director of that team as an accountability mechanism.
2. Consultation by users of the data including programmers and researchers.
3. To improve the permanent documentation record for this dataset (step 5 in the data management
template).
4. As reference for any research projects bringing in new data.
1.1 - SAS Data Quality Macros To keep pace with the large amount of incoming data at MCHP, a series of SAS macros have been developed. These macros facilitate the automatic generation of data quality reports which are then reviewed by MCHP’s Data Management group and data providers. In order to encourage collaboration between various organizations and the further development of Data Quality software, these macros have been licensed under a GNU General Public License. The following framework provides a general description of the quality assessments carried out by these macros and the MCHP Data Acquisition team. For a detailed description of each macro and examples of how they are run at MCHP see the Data Quality Macros Manual. For downloadable and distributable copies of these macros please see the Data Quality section of the MCHP website.
2 Lix et al., A Systematic Investigation of Manitoba’s Laboratory Data, 14. 3 UK’s National Health Services, Data Quality Report for Independent Sector NHS funded treatment Q1 – Q2 2007/08 (Leeds, England: NHS Information Centre, 2008).

7 MCHP Data Quality Framework
2 - Acquisition Level Data Quality Assessment
2.1 – Accuracy “Accuracy is the degree to which the data correctly describe the phenomenon they were designed to measure (Arts et al., 2002) or the degree to which data reflect the truth (Iron and Manuel 2007)4”. This refers to both the completeness of data (absence of missing values), and its correctness with reference to external tables and other sources of documentation. MCHP has used CIHI standards as a guide for both the testing and reporting of data element5 accuracy.
2.1.1 - Completeness Missing values include blank fields for character variables, periods for numeric variables, and coded missing values. The magnitude of missing values should be identified and reported for all data elements. This type of evaluation is important since, “if selected sub-groups are missing from a database because of exclusions based on age, stage/type of disease, or geography… the databases will result in incomplete estimates of the target outcome (e.g. incidence or prevalence)6. MCHP uses the following rating for missing values:
In addition to missing values, completeness of the data can also be measured by examining database exclusions.7. It is important that the population for which the data is expected be clearly defined and understood, as the coverage of data can reveal potential data quality issues.8 If particular populations are not reported in the data based on geography or other characteristics, the data will result in incomplete estimates of the target outcome.9
2.1.2 - Correctness
Correctness refers to the presence of invalid codes and dates in data and values that are out of range or represent outliers. In order to determine whether values are invalid, documentation and familiarity with the data is required. The different types of invalid values are described below.
Invalid codes: Values of all character variables that do not correspond to the formats (based on codebook documentation).
4 Lix et al., A Systematic Investigation of Manitoba’s Laboratory Data, 15. 5 Canadian Institute for Health Information, The CIHI Data Quality Framework 2009 (Ottawa: CIHI, 2009). Accessed on March 13, 2013 at http://www.cihi.ca/CIHI-ext-portal/pdf/internet/DATA_QUALITY_FRAMEWORK_2009_EN. 6 Lix et al., A Systematic Investigation of Manitoba’s Laboratory Data, 15. 7 Ibid. 8 CIHI, The CIHI Data Quality Framework 2009, 27. 9 Ibid.
MCHP Rating Item Response Rate
None or minimal < 5%
Moderate 5-30%
Significant > 30%

8 MCHP Data Quality Framework
Invalid dates: Date values that fall outside of a possible or established range. For example, a living person born in the 1500’s or a person who died in 9999. At MCHP, invalid dates can be fixed using internal or external imputation (See the Imputation section).
Out of range: Values for all non-character variables that fall outside of the valid range (based on the original documentation from the source agencies).
CIHI Suggested Rating
Invalid Values (code/date/out of range) (%)
Minimal or none Less than 2% Moderate 2% to 5% Significant Greater than 5% to 100%
Outliers and Extreme observations for all numeric variables. The following excerpt by Don Edwards captures the approach to outlier detection adopted by MCHP:
OUTLIER DETECTION PHILOSOPHY10
The term "outlier" is not formally defined. An outlier is simply an unusually extreme value for a variable, given the statistical model in use. What is meant by "unusually extreme" is a matter of opinion, but the operative word here is "unusual"; some extremes are to be expected in any data set. It must also be emphasized, and will be demonstrated, that the "outlier" notion is model-specific: a particular value for a variable might be highly unusual under, say, a linear regression model, but not unusual at all in a model without the regressor. So, outlier detection is part of the process of checking the statistical model assumptions, a process that should be integral to any formal data analysis.
"Elimination of outliers" should not be a goal of data quality assurance. Many ecological phenomena naturally produce extreme values, and to eliminate these values simply because they are extreme is tantamount to pretending that the phenomenon is "well-behaved" when it is not. To mindlessly or automatically do so is to study a phenomenon other than the one of interest. The elimination of data contamination is the appropriate phrasing of this data quality assurance goal. Data contamination occurs when a process or phenomenon other than the one of interest affects a variable's value. If this contamination is undetectable at observation time, it can usually only be detected if it produces an outlying value. Hence, the detection of outliers is an intermediate step in the elimination of contamination. Once the outlier is detected, attempts should be made to determine if some contamination is responsible. This would be a very labor-intensive, expensive step if outliers were not by definition rare. Note also that the investigation of outliers can in some instances be more rewarding than the analysis of the "clean" data: the discovery of penicillin, for example, was the result of a contaminated experiment. If no explanations for a severe outlier can be found, one approach is to formally analyze the data both with and without the outlier(s) and see if conclusions are qualitatively different.
At MCHP the goal is to detect and count the number of potential outliers for numeric variables and report this in a Data Quality Report. Suggested methods for detecting outliers from Ron Cody’s Data Cleaning Techniques using SAS are listed below:11
1. Standard Deviation: Observations outside of Mean +/- 2*SD will be counted as outliers
10 Edwards, Don. Data Quality Control/Quality Assurance (Columbia: University of South Carolina, 1998), Accessed March 13, 2013 at http://www.ecoinformatics.org/pubs/guide/edwards.fv4.htm.
11 Cody, Ron. Cody’s Data Cleaning Techniques Using SAS, 2nd ed. (Cary, N.C.: SAS Institute, 2008).
9 MCHP Data Quality Framework
2. Trimmed Standard Deviation: Observation outside of MeanTrimmed10% +/- 2*1.49*SDTrimmed10% 3. Interquartile Range: Observation outside of (Q1 – k*IQR , Q3 + k*IQR)
Where:
Mean is the mean of entire observations
SD is the standard deviation of entire observations
MeanTrimmed10% is the mean of middle 10% of observations
SDTrimmed10% is the standard deviation of middle 10% of observations
Q1 is the first quartile of entire observations
Q3 is the third quartile of entire observations
IQR is the interquartile range of entire observations
k is a multiplier.
The first two methods require an assumption of normality, but the third method is a more non-parametric approach which makes its application more general. Consequently the Interquartile Range (k=2.5) is recommended for detecting outliers.
2.1.3 - Evaluating Accuracy at MCHP
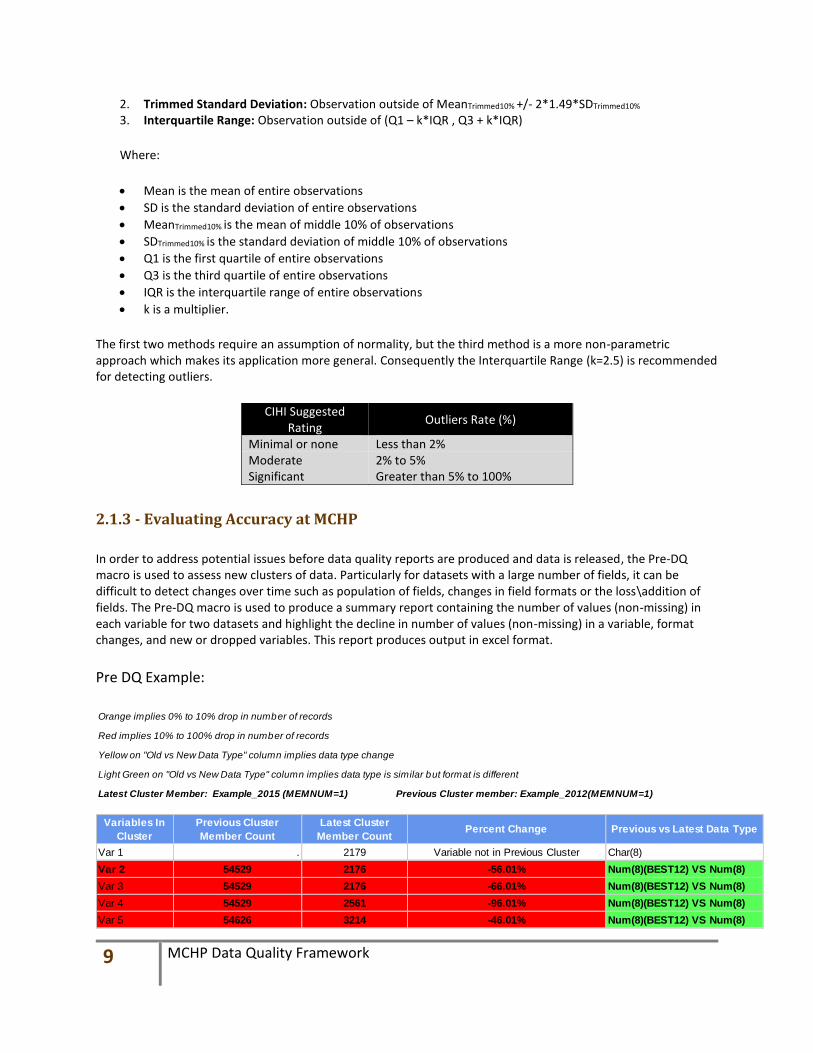
In order to address potential issues before data quality reports are produced and data is released, the Pre-DQ macro is used to assess new clusters of data. Particularly for datasets with a large number of fields, it can be difficult to detect changes over time such as population of fields, changes in field formats or the loss\addition of fields. The Pre-DQ macro is used to produce a summary report containing the number of values (non-missing) in each variable for two datasets and highlight the decline in number of values (non-missing) in a variable, format changes, and new or dropped variables. This report produces output in excel format.
Pre DQ Example:
Orange implies 0% to 10% drop in number of records
Red implies 10% to 100% drop in number of records
Yellow on "Old vs New Data Type" column implies data type change
Light Green on "Old vs New Data Type" column implies data type is similar but format is different
Latest Cluster Member: Example_2015 (MEMNUM=1) Previous Cluster member: Example_2012(MEMNUM=1)
Variables In
Cluster
Previous Cluster
Member Count
Latest Cluster
Member CountPercent Change Previous vs Latest Data Type
Var 1 . 2179 Variable not in Previous Cluster Char(8)
Var 2 54529 2176 -56.01% Num(8)(BEST12) VS Num(8)
Var 3 54529 2176 -66.01% Num(8)(BEST12) VS Num(8)
Var 4 54529 2561 -96.01% Num(8)(BEST12) VS Num(8)
Var 5 54626 3214 -46.01% Num(8)(BEST12) VS Num(8)
CIHI Suggested Rating
Outliers Rate (%)
Minimal or none Less than 2% Moderate 2% to 5% Significant Greater than 5% to 100%
10 MCHP Data Quality Framework
After data is installed completeness and correctness are assessed at MCHP using the META, INVALID CHECK, and VIMO macros. VIMO is an acronym for Valid, Invalid, Missing Outlier, and is loosely based on a similar data quality assessment conducted by the UK’s National Health Service.12 These macros produce output that can be used to generate the following tables/charts. Outlier, valid, and missing values are reported along with a summary of responses and descriptive statistics for each field. Areas that appear to be incomplete or inaccurate are flagged so they can be further examined by Data Management staff. Data completeness is also assessed by examining geographical coverage. Geographical coverage is calculated by mapping the Manitoba postal codes for a particular database and reporting the percentage of records by the forward sortation area (FSA), regions with the same first three postal characters. An automated SAS based initiative is currently underway to complete this new quality measure.
12 Lix et al., A Systematic Investigation of Manitoba’s Laboratory Data, 15.

11 MCHP Data Quality Framework
VIMO Table Example:
Dataset Label: Example Table Records: 2356
Dataset Name: Example_2015 Period: 2002-2015
None or Minimal
< 5%
Moderate
5-30%
Significant
> 30%
Unknown
or N/A
= No variance or 100% missing value
Legend for comment column
Blank = variables have not been tested (no formats have been specified for the variables)
✓ = Variables have been tested against the associated formats and no invalid values found
Type Variable Name Variable Label Valid Invalid Missing Outlier Min Max Mean Median STD Comment
ID Var 1 Label Var 1 95.00 2.40 2.60
Nu
m
Var 2 Label Var 2 100.00 .00 .00 0 10 5 5 2.5
Var 3 Label Var 3 82.74 17.26 ✓
Var 4 Label Var 4 89.00 11.00 ✓
Var 5 Label Var 5 100.00 .00 ✓
Var 6 Label Var 6 98.45 1.55
Var 7 Label Var 7 96.32 3.68 0, 4 ✓
Var 8 Label Var 8 35.87 64.13
Var 9 Label Var 9 28.98 70.02
Var 10 Label Var 10 99.45 .55 .00 Unknown (290 Invalid Obs. in total)
Var 11 Label Var 11 100.00 .00
Var 12 Label Var 12 40.20 59.60 .00 RT (964 Invalid Obs. in total)
Var 13 Label Var 13 60.63 39.37 ✓
Var 14 Label Var 14 .02 99.98
Var 15 Label Var 15 .50 99.50
Var 16 Label Var 16 .75 99.25 ✓
Var 17 Label Var 17 80.00 20.00 ✓
Var 18 Label Var 18 99.80 .20 .00 (3456 Invalid Obs. in total)
Var 19 Label Var 19 86.36 13.64 ✓
Var 20 Label Var 20 98.78 1.22 2011-02-11 2011-02-11
Var 21 Label Var 21 75.36 24.64 2005-10-31 2014-03-31 5 invalid obs. out of [2013-01-01, 2014-12-31] range
Var 22 Label Var 22 45.00 55.00 2011-02-11 2012-09-20
Var 23 Label Var 23 53.21 46.71 2011-02-11 2012-09-20
Var 24 Label Var 24 99.99 .01 .00 2002-04-08 2011-02-12
Var 25 Label Var 25 32.62 10.00 57.38 2002-04-09 2011-02-12
Var 26 Label Var 26 23.98 76.02 2002-04-10 2011-02-15
Var 27 Label Var 27 79.85 20.15 2011-02-11 2014-03-31 23 invalid obs. out of [2013-01-01, 2014-12-31] range
Var 28 Label Var 28 .00 100.00 2008-09-30 2014-03-31 150 invalid obs. out of [2013-01-01, 2014-12-31] range
SUPPRESSED
N, Y, Unknown
N, Y, DK
0, 1
2, 4, 5, 3, 1
HSC, CGH, GGH, SOH, VGH, SBH
0, 1
1
Y6J7K7, H8M9R0, 9H6G4F…
ST, TG, TF, RT
Date
Top 10 Observed Values
Legend (Potential Data Quality Problems) :
2, 3
N,Y
N,Y
SUPRRESSED
0,1,2,3,4
Ch
ar
5

12 MCHP Data Quality Framework
0% 10% 20% 30% 40% 50% 60% 70% 80% 90% 100%
Var 1
Var 2
Var 3
Var 4
Var 5
Var 6
Var 7
Var 8
Var 9
Var 10
Var 11
Var 12
Var 13
Var 14
Var 15
Var 16
Var 17
Var 18
Var 19
Var 20
Var 21
Var 22
Var 23
Var 24
Var 25
Var 26
Var 27
Var 28
IDN
um
Char
Date
Example_2015
Valid Invalid Missing Outlier

13 MCHP Data Quality Framework
2.2 - Internal Validity
Internal Validity relates to the assessment of the internal consistency of the data (e.g. do the values of various data elements relate consistently to one another). Indicators of validity include internal consistency, temporal consistency (trend analysis or changes in data elements over time), and linkability (the ability of two files to link using common keys or identifiers). Methods for detecting and reporting the quality of each of these measures are discussed below.
2.2.1 - Internal Consistency
Internal consistency can be measured through numeric agreement or the logical relationships between fields13. The internal logic of the data can be used to determine if values make sense. Examples include a 70-year-old woman having a baby, a man having a caesarean section, a 4-year old with an occupation or a hospital with 50 nurses listing a total salary budget of less than $1 million a year.14
CIHI Suggested Rating
Degree of Inconsistency (%)
Minimal or none Less than 2% Moderate 2% to 5% Significant Greater than 5% to 100%
2.2.1a - Assessing Internal Consistency at MCHP
MCHP’s VALIDATION macro can be used to perform internal consistency checks based on pre-defined criteria. For
example, parameters can be written that will check for inconsistencies in the reporting of pregnancy in the
following dataset and generate the error table below.
Obs Admitdt Sepdt Sex Preg Age
1 25 APR 2011 27 APR 2011 2 1 23
2 26 JAN 2011 25 JAN 2011 2 0 11
3 14 AUG 2010 19 AUG 2010 1 1 34
4 7 AUG 2010 12 AUG 2010 1 0 36
Validation Check for Data Consistency
Count Error Message Condition
3 Pregnant Man Sex =’1’ and Preg=’1’
13 Lix et al., A Systematic Investigation of Manitoba’s Laboratory Data, 16. 14 CIHI, The CIHI Data Quality Framework 2009, 46.
14 MCHP Data Quality Framework
2.2.2 - Temporal Consistency (Stability across Time)
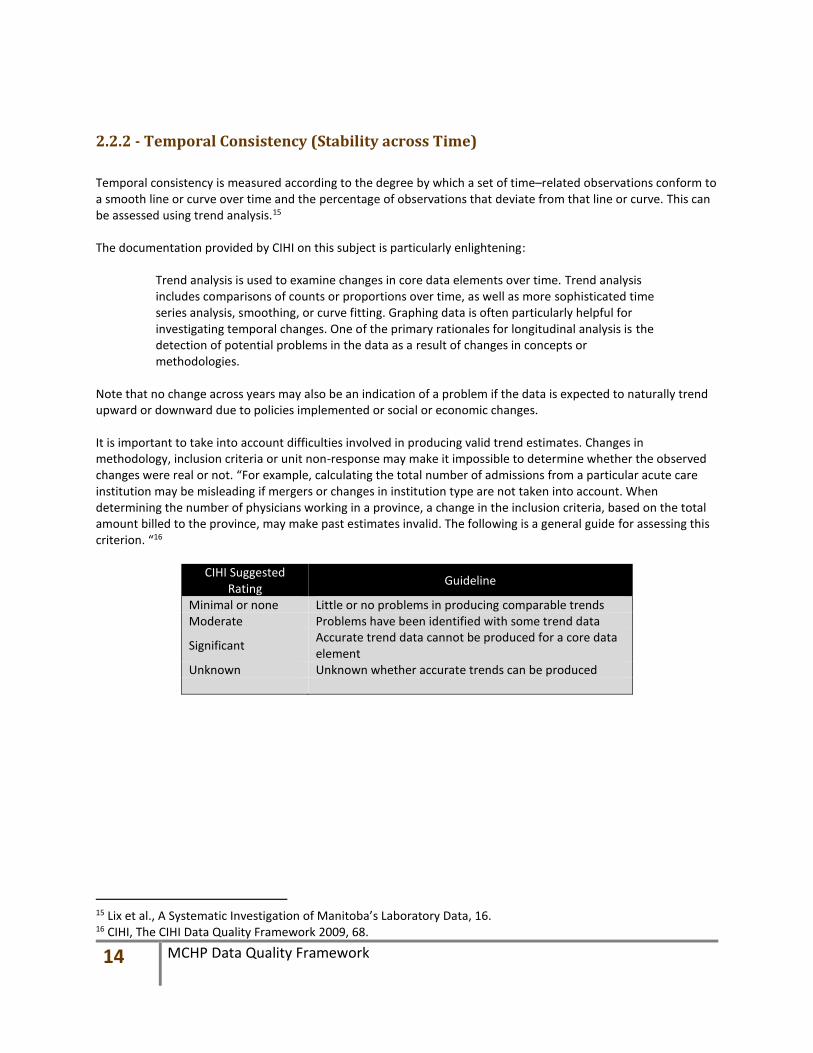
Temporal consistency is measured according to the degree by which a set of time–related observations conform to a smooth line or curve over time and the percentage of observations that deviate from that line or curve. This can be assessed using trend analysis.15 The documentation provided by CIHI on this subject is particularly enlightening:
Trend analysis is used to examine changes in core data elements over time. Trend analysis includes comparisons of counts or proportions over time, as well as more sophisticated time series analysis, smoothing, or curve fitting. Graphing data is often particularly helpful for investigating temporal changes. One of the primary rationales for longitudinal analysis is the detection of potential problems in the data as a result of changes in concepts or methodologies.
Note that no change across years may also be an indication of a problem if the data is expected to naturally trend upward or downward due to policies implemented or social or economic changes. It is important to take into account difficulties involved in producing valid trend estimates. Changes in methodology, inclusion criteria or unit non-response may make it impossible to determine whether the observed changes were real or not. “For example, calculating the total number of admissions from a particular acute care institution may be misleading if mergers or changes in institution type are not taken into account. When determining the number of physicians working in a province, a change in the inclusion criteria, based on the total amount billed to the province, may make past estimates invalid. The following is a general guide for assessing this criterion. “16
CIHI Suggested Rating
Guideline
Minimal or none Little or no problems in producing comparable trends Moderate Problems have been identified with some trend data
Significant Accurate trend data cannot be produced for a core data element
Unknown Unknown whether accurate trends can be produced
15 Lix et al., A Systematic Investigation of Manitoba’s Laboratory Data, 16. 16 CIHI, The CIHI Data Quality Framework 2009, 68.
15 MCHP Data Quality Framework
2.2.2a - Assessing Temporal Consistency at MCHP
2.2.2ai - Trend Analysis
At MCHP, a SAS macro that can perform a trend analysis for core data elements has been developed. Fields
such as the number of hospital admissions or discharges, length of stay, number of tests, fees associated with
the physician visits, etc. can be summarized in counts or sums by fiscal year. The macro fits a series of
common models and selects the model with the minimum mean square error (MSE), estimates studentized
residuals for each observation (with the current observation deleted), and flags significant observations as
potential outliers. The macro can also detect repeated observations with the exact same value (indicating no
change over time) and will flag these as potential problems. This analysis is described in more detail below
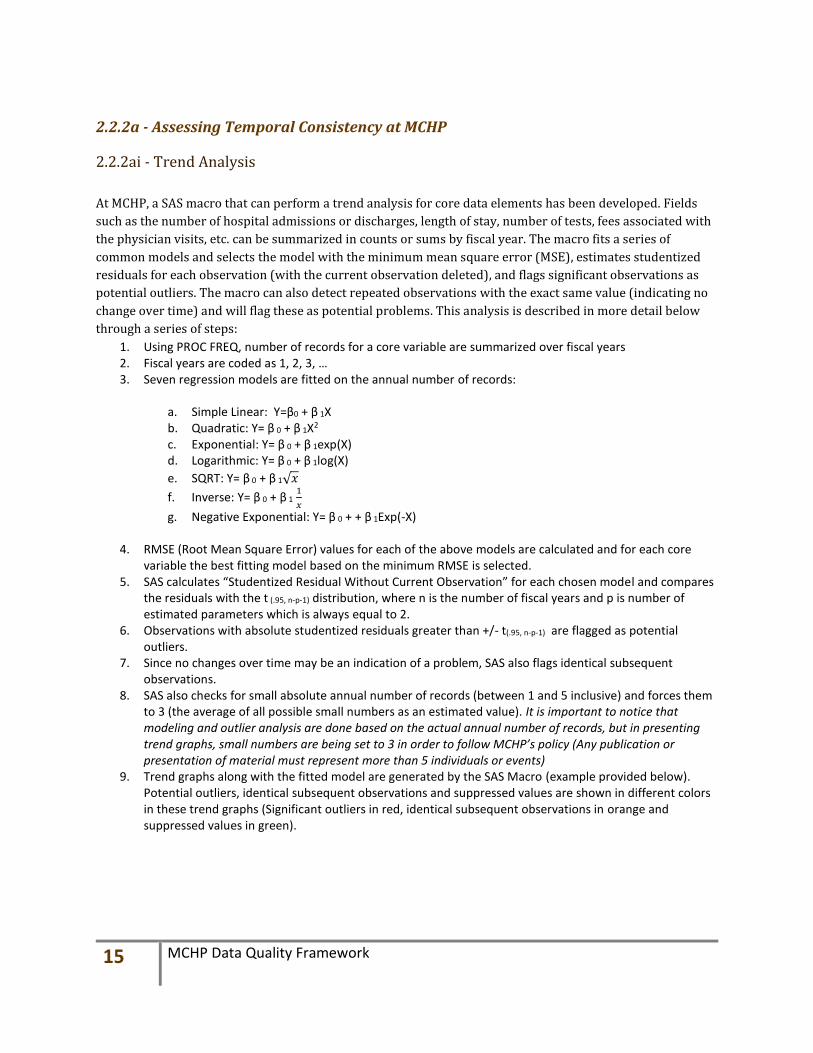
through a series of steps: 1. Using PROC FREQ, number of records for a core variable are summarized over fiscal years 2. Fiscal years are coded as 1, 2, 3, … 3. Seven regression models are fitted on the annual number of records:
a. Simple Linear: Y=β0 + β 1X b. Quadratic: Y= β 0 + β 1X2 c. Exponential: Y= β 0 + β 1exp(X) d. Logarithmic: Y= β 0 + β 1log(X)
e. SQRT: Y= β 0 + β 1√𝑥
f. Inverse: Y= β 0 + β 1 1
𝑥
g. Negative Exponential: Y= β 0 + + β 1Exp(-X)
4. RMSE (Root Mean Square Error) values for each of the above models are calculated and for each core variable the best fitting model based on the minimum RMSE is selected.
5. SAS calculates “Studentized Residual Without Current Observation” for each chosen model and compares the residuals with the t (.95, n-p-1) distribution, where n is the number of fiscal years and p is number of estimated parameters which is always equal to 2.
6. Observations with absolute studentized residuals greater than +/- t(.95, n-p-1) are flagged as potential outliers.
7. Since no changes over time may be an indication of a problem, SAS also flags identical subsequent observations.
8. SAS also checks for small absolute annual number of records (between 1 and 5 inclusive) and forces them to 3 (the average of all possible small numbers as an estimated value). It is important to notice that modeling and outlier analysis are done based on the actual annual number of records, but in presenting trend graphs, small numbers are being set to 3 in order to follow MCHP’s policy (Any publication or presentation of material must represent more than 5 individuals or events)
9. Trend graphs along with the fitted model are generated by the SAS Macro (example provided below). Potential outliers, identical subsequent observations and suppressed values are shown in different colors in these trend graphs (Significant outliers in red, identical subsequent observations in orange and suppressed values in green).

16 MCHP Data Quality Framework
2.2.2aii - Executive Summary
When new data is acquired a data quality report is generated. This report can then be compared to reports from
previous years. An Executive Summary is written by Data Acquisition staff to summarize the year-over-year
difference in the data. For example, for a new year of hospital data an Executive Summary may indicate:
Changes to the size of the population or coverage (adding or subtracting hospitals for example)
New variables added
Variables dropped
Changes to existing variables
Quality differences between the current and previous year
2.2.3 - Linkability
2.2.3a - Cross-walk Linkage Linkability is defined as the ability to link two files using common keys or elements. At MCHP, a record is considered linkable if the record’s personal health information number (PHIN) is coded as “individual specific” based on the following table.

17 MCHP Data Quality Framework
PHIN Types
Ind
ivid
ual
Sp
ecif
ic
PH
INs
0 MH, verified against concurrent registries
1 MH, redirected to this SCRPHIN from FILEPHIN
2 MCHP, modified sibling's SCRPHIN
3 MCHP, assigned SCRPHIN from Registry
6 MCHP, MH PHIN Not known at MCHP at ACQDT R
eco
rd S
pec
ific
PH
INs
4 MCHP, assigned a database specific SCRPHIN
5 MCHP, DB Person ID was not included in crosswalk process
7 HCN is not Manitoba Resident
8 Missing, unspecified or MH SCRPHIN invalid
9 System, not individual SCRPHIN
2.2.3ai - Cross-Walk Linkage Assessment at MCHP
Tests to determine the status of a PHIN in the dataset are performed at the time the data is acquired by MCHP using the LINK and LINKYR macros. These macros generate output by analyzing the dataset PHIN against the registry PHIN which can be used to create the following charts:
Cross-Walk Linkage
Linkability
PHIN Types
DatasetT ota l Number of
Records
Number of Linkable
Records% Linkable Records
Number of Linkable
Individua ls
Example_20022005 2986 2496 83.59 2025
Example_20052009 1456 1403 96.35 1398
Example_20092014 897 789 87.95 782
FILEPHINT YPE Example T able 1 Example T able 2 Example T able 3
0 MH verified against concurrent registries 83.59 96.35 87.95
4 MCHP db specific ScrPHIN - No MH found 16.41 3.65 12.05

18 MCHP Data Quality Framework
60
65
70
75
80
85
90
95
100%
Percentage of Linkable Records
Dataset 1 Dataset 2 Dataset 3 Dataset 4
2.2.3b - Agreement
Because many linkages are based on probabilistic matches, consistency can be tested using kappa statistics to evaluate agreement for sex and date of birth with registry files (this evaluation is only possible for records with individual specific PHINs).
CIHI Suggested Rating
Degree of Discrepancy with Registry (%)(Separate tables for sex and date of birth)
Minimal or none 0.81 <= Kappa <= 1.00 Moderate 0.50 <= Kappa <= 0.80 Significant Less than 0.50
2.2.3ai - Agreement Evaluation at MCHP
At MCHP agreement is assessed using the AGREEMENT macro. This macro generates output that provides the
following details:

19 MCHP Data Quality Framework
Agreement Analysis
Data Set
Degree of Consistency
with Registry - SEX
Degree of Consistency with Registry
- Date of Birth
Comments
Table 1 0.87 0.84
Table 2 0.75 0.68
Table 3 0.9 0.91
Table 4 0.95 0.93
Table 5 0.47 0.51
2.2.3c - Referential Integrity
Referential integrity refers to the linkability of records between tables within a given database. Identifying orphan
values (foreign or primary keys that are not present in a corresponding table) can help Data Management staff to
recognize potential problems in the data that may affect analysis.
2.2.3ci - Referential Integrity Assessment at MCHP
The referential integrity of the database is assessed using the REFERENTIAL INTEGRITY macro. The following tables
demonstrate sample output from this macro:
PRIMARY KEY: CLIENT_VISIT_GUID
Primary Table Duplicate Missing Total Records
CLIENT_2014 124 (x2) 0 108347
1 (x3)
FOREIGN KEY: CLIENT_VISIT_GUID
Primary Table ORPHAN VALUES Total Records
STATUS_2014 399 29876125
PROVIDER_2014 400 6123543
NACRS_2014 188 583465
CONSULTS_2014 111 171534

20 MCHP Data Quality Framework
2.3 - External Validity
2.3.1 - Identifying Units of Analysis
“External validity of data can sometimes be quantified by comparison with a “gold standard,” that is, an external
data source that contains error-free information about the measure or construct under investigation. Sensitivity,
specificity, positive and negative predictive values, and likelihood ratio statistics are used to quantify validity. In
the absence of a gold standard or when the gold standard contains measurement error, validity can be quantified
using specialized statistical models such as latent class models (Bernatsky et al., 2005)” 17.
2.3.2 - Level of Agreement with the Literature and Available Reports
Literature, reports, and general knowledge of the data can also be used to assess external validity. For example, in
Home Care data higher rates of use among populations recently discharged from the hospital and populations
awaiting admission to a nursing home would be expected. In Family Services data, individuals and families
receiving income security payments would be expected to be concentrated in postal code areas with low mean
household incomes. If the data differs from these findings this may indicate a data quality issue exists.
2.4 - Timeliness
Timeliness refers primarily to how up-to-date the data are at the time of release. At MCHP currency of data is
evaluated using three measures: time to acquisition, time to data release and currency of documentation.
2.4.1 - Time to Acquisition
The gap between the last reference date in the data and the date the data was acquired at MCHP is an external
delay. The variable ACQDT (acquire date) which is a required field in all SPDS data files can be used to calculate this
delay.
2.4.2 - Time to Release
The gap between the date that data was acquired at MCHP and the date the data is being released for MCHP users
is an internal delay.
2.4.3 - Currency of Documentation
Documentation currency refers to the time between data installation and the availability of data quality
documentation.
12 Lix et al., A Systematic Investigation of Manitoba’s Laboratory Data, 16.

21 MCHP Data Quality Framework
2.5 - Interpretability
“Changes in program inclusion criteria, data collection methods, or reporting criteria may confound an analyst or
researcher’s ability to identify data quality problems”18. For this reason, the quality of historical and concurrent
documentation for each data file is also important. Certain values or codes, increases or decreases in the total
number of records, and outliers may be falsely marked as data quality issues as a result of poor documentation
(e.g. undocumented changes to formats, valid ranges, or eligibility criteria). Interpretability is defined as the ease
with which the user is able to understand and utilize the data properly.19 Only with the support of proper
documentation is it possible to establish whether a data quality problem truly exists.
2.6 - Value The value of data can be defined by how well it serves its intended purpose and meets the needs of current and
future users.20 This is measured at MCHP by examining the quantity of use and user satisfaction.
2.6.1 - Usage
Usage of MCHP data is monitored via automatic Metadata Repository visit counting in Microsoft SharePoint.
Counts are tracked by database but also by job category (data management, analyst, research) which may also
reflect the usefulness of the data. In addition the number of data access applicants can be counted, as well as the
number of publications per database.
2.6.2. - User Satisfaction
MCHP has developed satisfaction survey to be periodically distributed to users of the Metadata Repository, where
data quality reports are kept.
The Metadata Repository also contains a blog for each dataset in which users can share information on the quality
of data. Blog comments can be assessed for satisfaction and issues pertaining to data use. Feedback mechanisms
are also being developed to establish a communication line between data providers and the MCHP data
management team. The underlying goal of this feedback mechanism will be to improve data quality and increase
the usability of data.
18 Lix et al., A Systematic Investigation of Manitoba’s Laboratory Data, 17. 19 Australian Bureau of Statistics, “ABS Data Quality Framework,” (Canberra, Australia: Australian Bureau of Statistics, 2009). Accessed on April 24, 2015 at http://www.abs.gov.au/AUSSTATS/abs@ .nsf/Latestproducts/1520.0Main%20Features1May%202009?opendocument&tabname=Summary&prodno=1520.0&issue=May%202009&num=&view=. 20 CIHI, The CIHI Data Quality Framework 2009, 76.

22 MCHP Data Quality Framework
3 - Dealing with Problems in the Data
3.1 - Imputation
Imputation is the process of determining and assigning replacement values for incorrect or missing data.21
Imputations can be either internally or externally derived. An internal imputation is the process of replacing
incorrect or missing data using information from the dataset being assessed. In external imputation, replacement
values are taken from other datasets. At MCHP external imputation is only permitted for data files in the same
domain. For example, missing SEX values in the Medical Claims files may be imputed using the Manitoba Registry
because both databases are part of the ‘Manitoba Health’ domain. However, the same imputation for Manitoba
Schools data would not be allowed because it falls under a different domain (Education). Imputations may only be
applied where there is strong and convincing evidence. All imputations must also be clearly documented.
21 CIHI, The CIHI Data Quality Framework 2009, 45.

Appendix A: The Data Management Process Diagram
6. Release Data to Programmer(s) and Researcher(s)
Meet with programmer(s) and researcher(s) to present data structure and content
5. Document Data
Including original documents, data model diagram, SPDS data dictionary, history, file variations and structural changes, revisions and common problems and data quality report, where available
4. Evaluate Data Quality
Test the installed data using standardized protocol
Identify solutions to address deficiencies in data quality
Prepare data quality report for addition to standard documentation
3. Apply SAS Programs
Apply Normalization or De-normalization as requiredNormalization can be defined as the practice of optimizing table structures
by eliminating redundancy and inconsistent dependency
Apply data field and SAS format
standards
Install on SPD server(This includes indexing, sorting and clustering)
Create Metadata
If there is a problem, liaise with the source
agency
2. Become Familiar with Data Structure and Content
Review provided documentationIf required, create a data model for the
original dataIf receiving test data, test it and send
feedback to the source agency
1. Formulate the Request and Receive the DataCheck the data
sharing agreements
Liaise with the source agency to acquire available data, data model diagram, data dictionary, documentation about historical changes in data content,
format, and structure, data quality reports
Prepare the data request
letter
Receive the data and associated documentation

Appendix B: The Data Quality Process Diagram

Bibliography
Aitken, Alexis et al., Handbook on Improving Quality by Analysis of Process Variables, ed. Nia Jones and
Daniel Lewis, (European Commission EUROSTAT). Accessed on March 13, 2013 at http://epp.eurostat.ec.europa.eu/portal/page/portal/quality/documents/HANDBOOK%20ON%20IMPROVING%20QUALITY.pdf.
Arkady Maydanchink, Data Quality Assessment, (Bradley Beach, NJ: Technics Publications, cop.
2007).
Australian Bureau of Statistics, “ABS Data Quality Framework,” (Canberra, Australia: Australian Bureau of Statistics, 2009). Accessed on March 13, 2013 at http://www.abs.gov.au/AUSSTATS/abs@ .nsf/Latestproducts/1520.0Main%20Features1May%202009?opendocument&tabname=Summary&prodno=1520.0&issue=May%202009&num=&view=.
Australian Bureau of Statistics, Data Fitness: A guide to keeping your data in good shape, (Canberra,
Australia: Australian Bureau of Statistics, 2010). Accessed on March 13, 2013 at http://www. nss.gov.au/nss/home.nsf/0/c8805e7ccc865da3ca2575b4002024ed/$FILE/DataFitness%20A4%20Brochure%20single%20pages.pdf.
Bergdahl, Mats et al, Handbook on Data Quality Assessment Methods and Tools, ed. Manfred Ehling and
Thomas Korner (Wiesbadan: European Commission EUROSTAT, 2007). Accessed on March 13, 2013 at http://epp.eurostat.ec.europa.eu/portal/page/portal/quality/documents/HANDBOOK %20ON%20DATA%20QUALITY%20ASSESSMENT%20METHODS%20AND%20TOOLS%20%20I.pdf.
Canadian Institute for Health Information, The CIHI Data Quality Framework 2009 (Ottawa: CIHI, 2009).
Accessed on March 13, 2013 at http://www.cihi.ca/CIHI-ext-portal/pdf/internet/DATA_QUALITY_ FRAMEWORK_2009_EN.
Cody, Ron. Cody’s Data Cleaning Techniques Using SAS, 2nd ed. (Cary, N.C.: SAS Institute, 2008). Edwards, Don. Data Quality Control/Quality Assurance (Columbia: University of South Carolina, 1998),
Accessed March 13, 2013 at http://www.ecoinformatics.org/pubs/guide/edwards.fv4.htm Gary Freedman, Building a Data Quality Management Framework for Ontario, (Ontario: Health Results
Team for Information Management MOHLTC 2006). Herzog, Thomas N. et al., Data Quality and Record Linkage Techniques, (Guildford: Springer London
Boulder: NetLibrary,Inc., 2007). Lix et al., A Systematic Investigation of Manitoba’s Provincial Laboratory Data (Winnipeg: MCHP, 2012),
13. Accessed March 13, 2013 at http://mchp-appserv.cpe.umanitoba.ca/reference/cadham_ report_WEB.pdf
Hong, SP. Data Quality Macro Document (Winnipeg, Manitoba: Manitoba Centre for Health Policy,
2013.). http://umanitoba.ca/faculties/medicine/units/community_health_sciences/departmental _units/mchp/protocol/media/DQ_macro_diagram.pdf
Public Health Agency of Canada, PHAC Data Quality Framework, (Ottawa, ON: Public Health Agency of
Canada, 2009). UK’s National Health Services, Data Quality Report for Independent Sector NHS funded treatment Q1 –
Q2 2007/08 (Leeds, England: NHS Information Centre, 2008)