mcb bank limited · mcb - arif habib savings & investments limited holding: 51.33% ... mcb bank...
TRANSCRIPT

Presented by:Hammad KhalidHead Investor Relations, Financial Reporting & Taxation
MCB Bank LimitedInvestors Briefing Financial Performance AnalysisMarch 31, 2017
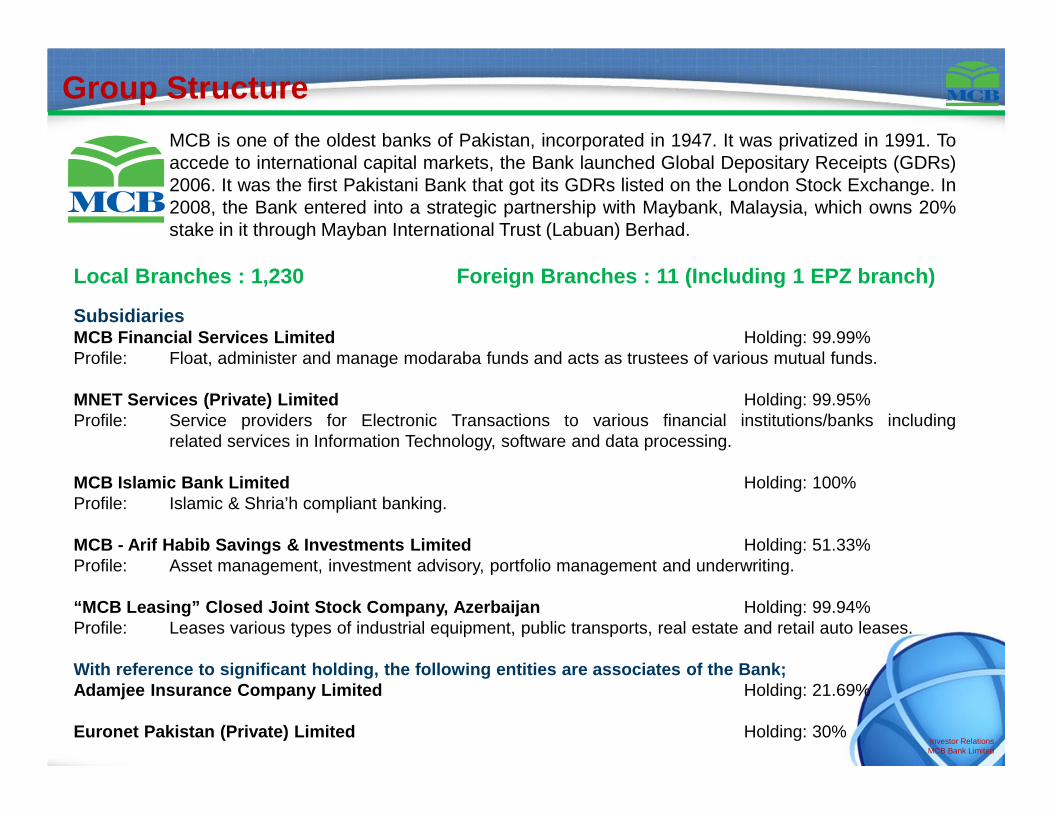
MCB is one of the oldest banks of Pakistan, incorporated in 1947. It was privatized in 1991. Toaccede to international capital markets, the Bank launched Global Depositary Receipts (GDRs)
in 2006. It was the first Pakistani Bank that got its GDRs listed on the London Stock Exchange. In2008, the Bank entered into a strategic partnership with Maybank, Malaysia, which owns 20%stake in it through Mayban International Trust (Labuan) Berhad.
Local Branches : 1,230 Foreign Branches : 11 (Including 1 EPZ branch)
SubsidiariesMCB Financial Services Limited Holding: 99.99%Profile: Float, administer and manage modaraba funds and acts as trustees of various mutual funds.
MNET Services (Private) Limited Holding: 99.95%Profile: Service providers for Electronic Transactions to various financial institutions/banks including
related services in Information Technology, software and data processing.
MCB Islamic Bank Limited Holding: 100%Profile: Islamic & Shria’h compliant banking.
MCB - Arif Habib Savings & Investments Limited Holding: 51.33%Profile: Asset management, investment advisory, portfolio management and underwriting.
“MCB Leasing” Closed Joint Stock Company, Azerbaijan Holding: 99.94%Profile: Leases various types of industrial equipment, public transports, real estate and retail auto leases.
With reference to significant holding, the following entities are associates of the Bank;Adamjee Insurance Company Limited Holding: 21.69%
Euronet Pakistan (Private) Limited Holding: 30%
Group Structure
Investor RelationsMCB Bank Limited

Bank forLife
MARKET LEADERSHIP
> Amongst top 3 Banks in Pakistan
> Maintain first-mover’s advantage in new businesses
> Socially Responsible Organization
> Strong Brand Recognition
PEOPLE FOCUS
providing customers’ need based solutions in
> Trade Finance
> Collection & Payments Business
> Commodity Business> Middle Markets
> Specialized sales to Financial Institutions
RISK DISCIPLINE
> Pro-active Risk-Portfolio Management
> Conscientious approach to NPL recoveries
> Policies & operations aligned with risk philosophy
> Robust capital & liquidity management > Effective risk-management based on Compliance
& Internal Audit results & IT Governance
PRODUCTS & SERVICES
> Continuous & sustainable earnings growth
> Customer centricity in sales & service
> Efficient mechanism for service delivery
> Maintain & identify new competitive advantages
Strategic pillars
Investor RelationsMCB Bank Limited

One of the largest Commercial Bank in Pakistan
Financial Strength Domestic and International footprint
Assets PKR 1,247 bn(US$ 11.9 bn)
Deposits PKR 819 bn(US$ 7.8bn)
RoA 2.14%
RoE 20.70%
Profit before Tax PKR 9.4 bn(US$ 90 mn)
Advances (Gross) PKR 372 bn(US$ 3.5 bn)
Market capitalization PKR 253 bn(US$ 2.4 bn)
Domestic Branches 1,230
Associates
Adamjee Insurance Company Limited
Euronet Pakistan (Pvt) Limited
Subsidiaries
MCB Financial Services
MNET Services (Private) Limited
MCB - Arif Habib Savings and Investments Limited
"MCB Leasing" Closed' Joint Stock Company
MCB Islamic Bank Limited
Foreign Branches
11(Sri Lanka : 8, Bahrain : 1, EPZ : 1,
UAE : 1) 1 Rep Office in Dubai
Investor RelationsMCB Bank Limited
No. of accounts 6.5 mn # of ATMs 1,204
Highest Credit Rating by PACRA Long Term AAA [triple A] and Short Term A1+ [A one plus]
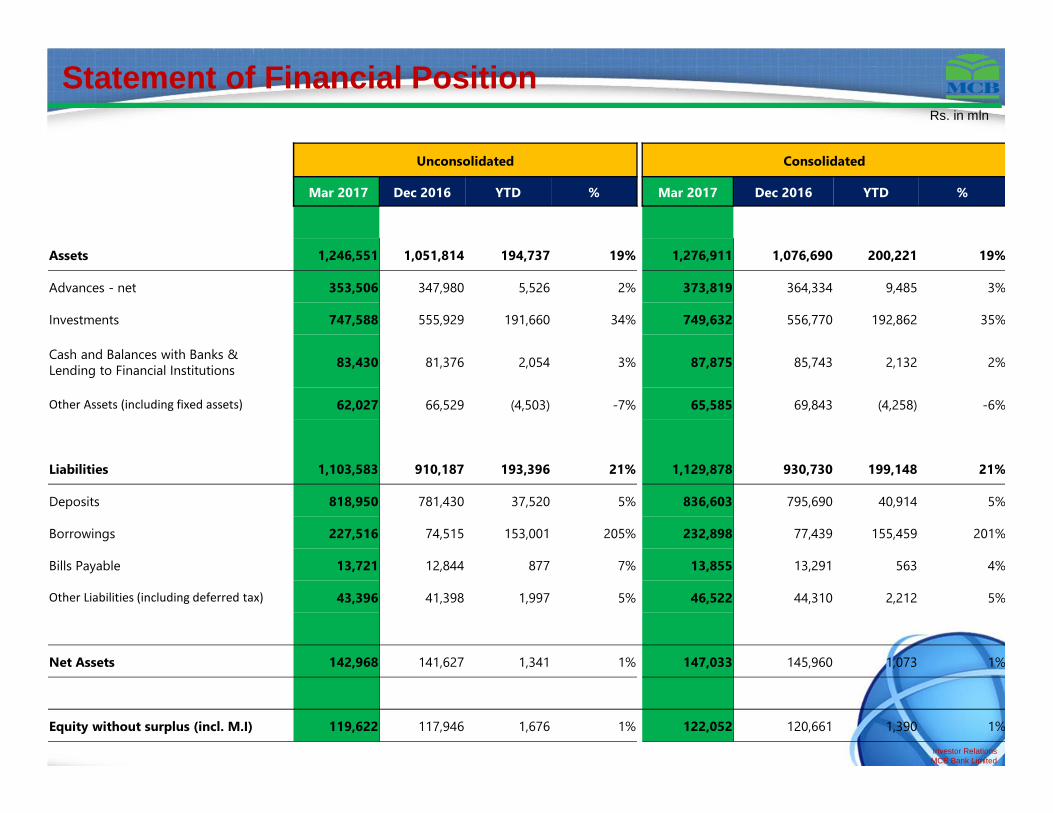
Rs. in mln
Statement of Financial Position
Investor RelationsMCB Bank Limited
Unconsolidated Consolidated
Mar 2017 Dec 2016 YTD % Mar 2017 Dec 2016 YTD %
Assets 1,246,551 1,051,814 194,737 19% 1,276,911 1,076,690 200,221 19%
Advances - net 353,506 347,980 5,526 2% 373,819 364,334 9,485 3%
Investments 747,588 555,929 191,660 34% 749,632 556,770 192,862 35%
Cash and Balances with Banks & Lending to Financial Institutions
83,430 81,376 2,054 3% 87,875 85,743 2,132 2%
Other Assets (including fixed assets) 62,027 66,529 (4,503) -7% 65,585 69,843 (4,258) -6%
Liabilities 1,103,583 910,187 193,396 21% 1,129,878 930,730 199,148 21%
Deposits 818,950 781,430 37,520 5% 836,603 795,690 40,914 5%
Borrowings 227,516 74,515 153,001 205% 232,898 77,439 155,459 201%
Bills Payable 13,721 12,844 877 7% 13,855 13,291 563 4%
Other Liabilities (including deferred tax) 43,396 41,398 1,997 5% 46,522 44,310 2,212 5%
Net Assets 142,968 141,627 1,341 1% 147,033 145,960 1,073 1%
Equity without surplus (incl. M.I) 119,622 117,946 1,676 1% 122,052 120,661 1,390 1%
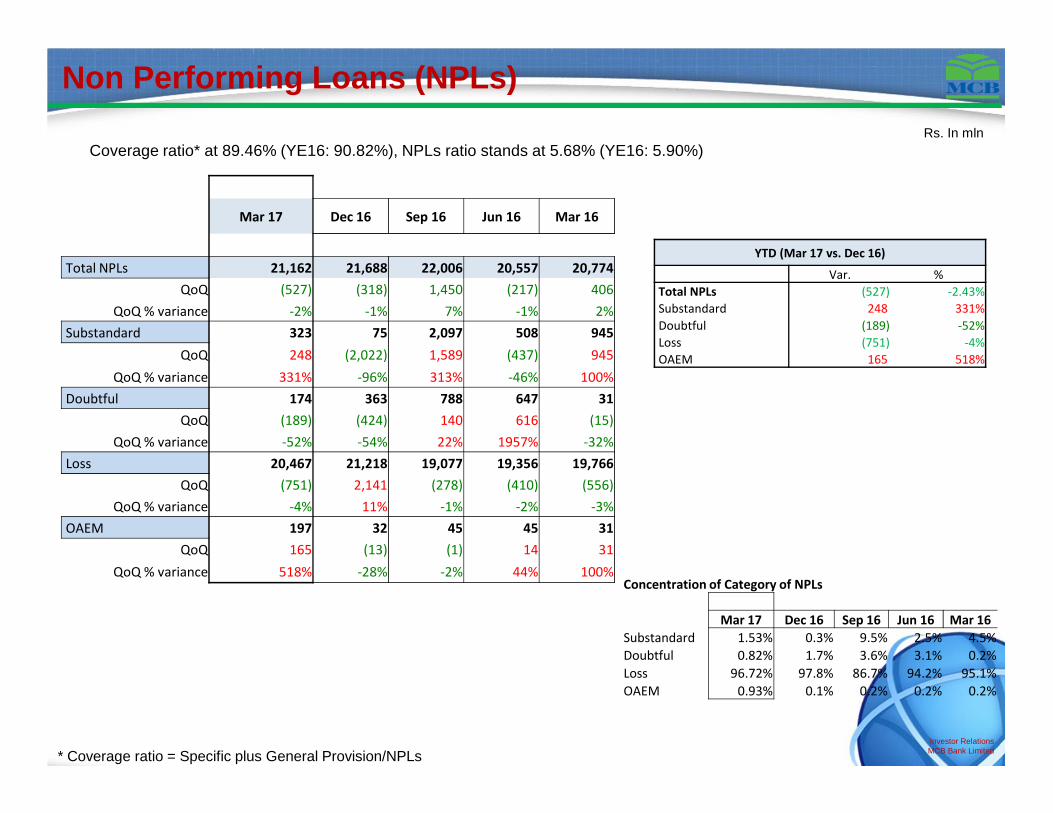
* Coverage ratio = Specific plus General Provision/NPLs
Non Performing Loans (NPLs)
Investor RelationsMCB Bank Limited
Rs. In mlnCoverage ratio* at 89.46% (YE16: 90.82%), NPLs ratio stands at 5.68% (YE16: 5.90%)
Mar 17 Dec 16 Sep 16 Jun 16 Mar 16
Total NPLs 21,162 21,688 22,006 20,557 20,774
QoQ (527) (318) 1,450 (217) 406
QoQ % variance -2% -1% 7% -1% 2%
Substandard 323 75 2,097 508 945
QoQ 248 (2,022) 1,589 (437) 945
QoQ % variance 331% -96% 313% -46% 100%
Doubtful 174 363 788 647 31
QoQ (189) (424) 140 616 (15)
QoQ % variance -52% -54% 22% 1957% -32%
Loss 20,467 21,218 19,077 19,356 19,766
QoQ (751) 2,141 (278) (410) (556)
QoQ % variance -4% 11% -1% -2% -3%
OAEM 197 32 45 45 31
QoQ 165 (13) (1) 14 31
QoQ % variance 518% -28% -2% 44% 100%Concentration of Category of NPLs
Mar 17 Dec 16 Sep 16 Jun 16 Mar 16
Substandard 1.53% 0.3% 9.5% 2.5% 4.5%
Doubtful 0.82% 1.7% 3.6% 3.1% 0.2%
Loss 96.72% 97.8% 86.7% 94.2% 95.1%
OAEM 0.93% 0.1% 0.2% 0.2% 0.2%
YTD (Mar 17 vs. Dec 16)
Var. %
Total NPLs (527) -2.43%
Substandard 248 331%
Doubtful (189) -52%
Loss (751) -4%
OAEM 165 518%

Rs. In mln
Investments
Investor RelationsMCB Bank Limited
Increase of Rs. 149.70B in Market Treasury Bills and increase of Rs. 44.61B in Pakistan Investment Bonds.
Mar 2017 Dec 2016 Var. % var. Mar 2016 Var. % var.
Treasury Bills 447,088 297,386 149,702 50% 226,248 220,840 98%
Pakistan Investment Bonds 244,742 200,132 44,610 22% 338,105 (93,363)
-28%
TFCs, Debentures, Bonds and Certificates 5,970 5,977 (7) 0% 5,941 29 0%
Other government securities 2,864 6,377 (3,512) -55% 2,837 27 1%
Shares in Listed, Unlisted Co.s & Mutual funds 20,113 19,077 1,036 5% 17,645 2,468 14%
Sukuks Bonds & Treasury Bonds (Sri Lanka) 364 36 328 902% 83 281 341%
Subsidiaries & Associated Undertakings 11,601 11,691 (90) -1% 11,772 (172) -1%
Investments at cost 732,741 540,675 192,066 36% 602,630 130,111 22%
Prov for diminution in value of investments(1,764)
(1,887) 123 7%(2,534)
770 -30%
Surplus on revaluation of securities 16,611 17,140 (529) -3% 22,701 (6,090)
-27%
Investments at revalued amount - net of
provision747,588 555,929 191,660 34% 622,797 124,791 20%

Source: System Deposits, State Bank of Pakistan. In the absence of domestic numbers of peer banks, total deposits base has been used in the computation.
Deposits
Rs. in mln
Investor RelationsMCB Bank Limited
Volume Mix Volume Mix Volume Mix Volume Mix Volume Mix
Deposits - Volume 818,950 781,430 754,885 755,434 721,930
Current deposits 318,132 39% 298,032 38% 288,869 38% 301,322 40% 274,974 38%
Savings deposits 454,369 55% 437,519 56% 422,381 56% 411,309 54% 406,644 56%
Term Deposits 46,448 6% 45,879 6% 43,635 6% 42,803 6% 40,312 6%
CASA 772,502 94.33% 735,550 94.13% 711,250 94.22% 712,631 94.33% 681,619 94.42%
Variance YoY QoQ YoY QoQ YoY QoQ YoY QoQ YoY QoQ
Current deposits 16% 7% 16% 3% 11% -4% -1% 10% 6% 7%
Savings deposits 12% 4% 11% 4% 4% 3% 1% 1% -2% 3%
CASA 13% 5% 13% 3% 7% 0% 0% 5% 1% 5%
Term Deposits 15% 1% 0% 5% -8% 2% -21% 6% -37% -12%
Total Deposits 13% 5% 12% 4% 6% 0% -1% 5% -2% 4%
YTD QoQ YTD QoQ YTD QoQ YTD QoQ YTD QoQ
37,520 37,520 84,625 26,545 58,080 (549) 58,629 33,504 25,125 25,125
Market Share (Domestic) QoQ QoQ QoQ QoQ QoQ
Industry 11,170,035 -0.29% 11,202,886 6.59% 10,510,703 0.45% 10,463,967 8.50% 9,644,264 -0.32%
MCB 797,617 5% 760,419 3% 736,152 0% 738,341 4% 707,845 4%
Share 7.14% 6.79% 7.00% 7.06% 7.34%
Q2 16 Q1 16Q1 17 Q4 16 Q3 16

Rs. In mln
Profit and Loss Statement
Investor RelationsMCB Bank Limited
Unconsolidated Consolidated
Mar 2017 Mar 2016 +/- % Mar 2017 Mar 2016 +/- %
Mark-up Income 17,320 17,614 (294) -2% 17,716 18,015 (299) -2%
Mark-up Expense 7,585 6,289 1,296 21% 7,736 6,411 1,325 21%
Net Mark-up Income 9,735 11,325 (1,590) -14% 9,980 11,604 (1,624) -14%
Non Interest Income 5,184 2,958 2,226 75% 5,149 3,055 2,094 69%
Total Income 14,919 14,283 636 4% 15,129 14,659 470 3%
Non Mark-up Expense 6,326 5,675 651 11% 6,850 5,997 853 14%
admin expenses 6,174 5,539 635 11% 6,696 5,848 847 14%
PF reversal (75) (75) - 0% (75) (75) - 0%
other charges 227 211 16 8% 230 224 5 2%
Share of Undertaking - - - - 194 228 (34) -15%
Profit before Provisions 8,593 8,608 (16) 0% 8,473 8,889 (416) -5%
Provisions (880) (466) (414) 89% (878) (431) (447) 104%
against Investments (123) - (123) - (123) - (123) 0%
against loans & advances (757) (466) (291) 63% (755) (431) (324) 75%
Profit before Tax 9,473 9,074 399 4% 9,351 9,320 31 0%
Taxation 3,326 3,057 269 9% 3,421 3,171 250 8%
Profit after Tax 6,147 6,017 130 2% 5,930 6,148 (219) -4%

* Coverage ratio is based on specific plus general provision** Coverage ratio based on specific provision (excld. GP) plus benefit of liquid securities Net revenue= net markup income + non-markup income
Key Performance Ratios
Investor RelationsMCB Bank Limited
BV ROA ROEEPS
(annualised)CAR ADR
Infection
ratio
Coverage
ratio*
Coverage
(incl. benefit
of liquid
sec)**
Non-
markup/Total
Rev
Mar 2017 107.47 2.14% 20.70% 22.09 18.12% 45.48% 5.68% 89.46% 97.55% 34.75%
Dec 2016 105.97 2.13% 18.94% 19.67 19.33% 47.05% 5.90% 90.82% 98.76% 27.04%
Sep 2016 105.23 2.35% 20.18% 20.88 19.94% 46.69% 6.24% 81.84% 89.76% 26.02%
Jun 2016 103.23 2.05% 18.78% 19.25 18.54% 47.67% 5.71% 86.49% 96.75% 20.57%
Mar 2016 102.79 2.35% 21.15% 21.62 18.15% 44.22% 6.51% 86.91% 95.72% 20.71%
Dec 2015 101.69 2.63% 23.21% 22.95 19.43% 46.29% 6.32% 90.37% 99.82% 25.14%
Sep 2015 101.20 2.74% 24.55% 24.22 20.13% 45.67% 6.40% 85.16% 94.08% 25.56%
June 2015 99.21 2.68% 24.92% 24.33 19.02% 43.52% 6.36% 84.98% 93.59% 26.90%
Mar 2015 99.19 3.25% 29.13% 28.43 19.54% 43.96% 6.70% 85.36% 93.87% 29.84%
Dec 2014 96.05 2.78% 23.83% 21.85 20.41% 46.83% 6.80% 85.62% 94.00% 22.93%
Sep 2014 94.09 2.87% 23.93% 21.71 20.46% 46.24% 7.12% 84.62% 95.11% 22.98%
June 2014 91.68 2.79% 23.53% 21.07 20.22% 44.19% 7.29% 85.60% 94.15% 20.29%
Mar 2014 89.15 2.68% 22.44% 19.81 21.09% 43.45% 8.26% 85.66% 94.23% 21.49%
Dec 2013 87.39 2.72% 23.09% 19.31 22.25% 42.41% 8.68% 85.74% 94.66% 22.78%
Sep 2013 86.81 3.03% 24.70% 20.58 24.77% 41.98% 10.17% 84.28% 92.65% 23.09%
June 2013 85.05 3.08% 25.91% 21.36 23.96% 40.08% 10.12% 86.92% 95.42% 23.70%
Mar 2013 82.68 3.02% 25.51% 20.73 22.54% 46.37% 9.41% 88.97% 97.22% 19.47%
Dec 2012 79.85 2.91% 24.59% 18.57 22.24% 48.14% 9.74% 89.23% 87.55% 18.30%

Best Bank Led Mobile Money Transfer Program 2010
Winner – Best Presented Annual Accounts 2014
1st Runner Up Best Presented Annual Report Awards 2013 –Category Private Sector Banks2nd Runner Up Best Presented Annual Report Awards 2012–
Category Private Sector BanksJoint 2nd runner-up in the banking
sector - Best Presented Accounts and Corporate Governance Disclosure
Awards 2010
2012: Ranked 624, 2011: Ranked 606, 2010: 621
Country Ranking: 3rd highest among the local Top 5
Ranked among the Top 25 Companies in Pakistan
Strongest Bank in Pakistan 2014Strongest Bank in Pakistan 2010
“Winner -Best Corporate Report Award 2015 – Banking Sector”
Winner” - Best Corporate Report Award 2014“Winner” - Best Corporate Report Award 2013 “Winner” - Best Corporate Report Award 2012
“‘Runner-up” Best Corporate Report Award 2011“Winner - Best Corporate Report Award 2010“Winner - Best Corporate Report Award 2009
Best Commercial Bank – Pakistan 2012
Most Stable Bank of the year 2014Best Bank of the year 2013 – Large Bank
Most Stable Bank of the year 2013Investor Relations Award 2011: Runner-up
Best Bank of the Year 2011Most Stable Bank of the Year 2011
Triple A Country AwardsBest Domestic Bank – Pakistan 2014: 2013: 2012:
Best Bank – Pakistan 2014
Best bank in Pakistan - 2016Euromoney Awards for Excellence 2012:Best Bank in Pakistan 2011, 2008, 2003-
2005, 2001, 2000Best Bank in Asia 2008
The QFC Asian Banker Leadership Achievement Award 2010
CSR Business Excellence Award 2012: Best Media Coverage
Best Domestic Bank in Pakistan: 2014; 2009, 2008, 2006, 2005 &
2004
Best bank in Pakistan - 2016Best bank in Pakistan - 2015
Best bank forCorporate Finance & Capital market
Development - 2016
International Recognition Awards / Accolades

ThankyouFor further details on MCB Bank Limited, please visit www.mcb.com.pk
For any query/comments/feedback, please e-mail [email protected]
MCB Bank Limited