mca-yates research project 534
TRANSCRIPT
8/2/2019 Mca-Yates Research Project 534
http://slidepdf.com/reader/full/mca-yates-research-project-534 1/34
1
Report No. 1924 October 2006
MARITIME & COASTGUARD AGENCY
Research Project 534Stability Criteria for Large Sailing Yachts
Final Report
EXECUTIVE SUMMARY
This report describes a review of the sailing vessel stability requirements of the Large Yacht Code, andconsiders the validity of their application to modern, very large yachts.
The size of the largest yachts appears to be increasing, and is far beyond the scope of the database used indeveloping the method of assessment and criteria. Some designers of these vessels have experienceddifficulties in complying with the stability criteria, and have put forward arguments in favour of arelaxation of the requirements.
A study of the fleet was made, with stability data on a substantial sample of yachts provided by designers.The various parameters that affect stability under sail were examined, to determine any trends associatedwith size. This exercise concluded with the finding that, in general, the relationship between heeling
moment and righting moment does not tend to vary with size, so that there is no justification for relaxingthe requirements for larger yachts on the basis of size alone.
The Wolfson Unit has conducted wind tunnel tests on many large yachts, and a database of test resultswas compiled to search for variations of heeling moment coefficient with size or rig type. Differences inthe performance of different rig types could be identified, but no trends of heeling moment variation withsize were found. Additional wind tunnel tests were conducted to confirm the assumptions regarding themaximum heeling moments that can be generated.
In depth discussions with designers and rig suppliers enabled a review of design methods, design loadingsand failure modes of rigs. It was concluded that rigs may be assumed to be sufficiently strong to transmitsufficient heeling moment to the yacht to result in a knockdown. Similarly, discussions providedinformation on the sail handling systems, their capabilities and their limitations. Anecdotal reports of specific incidents by designers and captains supported the majority view that automated sail handlingsystems should not be relied upon as a fail safe means of limiting the angle of heel in an emergency, whenstuck unexpectedly by a severe gust or squall.
In most cases there appears to be no justification for relaxing the existing criteria. It is recognised,however, that some vessels may have very high initial stability and/or small rigs, such that it wouldrequire unreasonably high wind speeds to cause a capsize. For such cases a criterion is proposed suchthat, if the anticipated wind speed to cause knockdown is greater than 40 knots, the range of stability maybe less than 90 degrees. This is similar to the Code requirement for multihulls.
8/2/2019 Mca-Yates Research Project 534
http://slidepdf.com/reader/full/mca-yates-research-project-534 2/34
2
CONTENTSPage
1 Introduction..................................................................................................................................... 3 2 Background ..................................................................................................................................... 3 3 Work Programme ............................................................................................................................ 3 4 Compilation of a Database............................................................................................................... 3 5 Consultation with Industry............................................................................................................... 4 6 Variation of Stability with Size ........................................................................................................ 4 7 Variation of Heeling Moment with Size and rig type ........................................................................ 6 8 Wind Speeds Required to Cause Knockdown or Capsize................................................................ 10 9 Demands on Large Yachts ............................................................................................................. 12 10 Failure Modes of Modern Materials and Structures ........................................................................ 13 11 Safety Mechanisms and Systems.................................................................................................... 14 12 Incident Reports ............................................................................................................................ 15 13 Operational Restrictions for Non-Compliance................................................................................ 15 14 Consultation with Regulators......................................................................................................... 16
15 Summary of Findings .................................................................................................................... 16 16 Recommendations ......................................................................................................................... 17 17 References..................................................................................................................................... 18
8/2/2019 Mca-Yates Research Project 534
http://slidepdf.com/reader/full/mca-yates-research-project-534 3/34
3
1 INTRODUCTION
Over the last ten years, the physical size of the largest sailing yachts has grown significantly, taking themwell beyond the size of vessels considered during development of the stability requirements incorporatedin the Large Commercial Yacht Code. For some current projects designers are experiencing difficulty in
attaining the requirements. It is unclear whether this is a function of individual design or is inherent in thesize of the vessels, and thus whether the Code needs to address stability and safety of very large sailingyachts in a different manner.
A preliminary study was conducted in 2004 to advise the MCA on the scale of the problem, and the scopeof the research that might be conducted to develop revisions to the Code, if appropriate. That study wasdesignated TA10/03 and was described in Wolfson Unit report 1740/02 dated June 2004.
This report describes the subsequent phase of the work, which addressed the issues in more detail. Thework was commissioned by a letter from Susan Nash of MCA, ref. MSA 10/9/199, dated September2005.
2 BACKGROUND
The stability requirements of the Code were developed by the Wolfson Unit in 1989. A full description of the work was described in the report to the Department of Transport, Ref 1, and a more concisedescription was presented as a paper, Ref 2. Originally the requirements were developed for the Code of Practice for sail training ships between 7 and 24 metres load line length. For this purpose the WolfsonUnit considered stability information on a range of sailing yachts and sailing ships. The database includedyachts principally in the range 7 to 24 metres, with a few examples up to 34 metres, and ships of up to 40metres in length.
The same stability requirements were included in the original large yacht Code, which applies to yachts inexcess of 24 metres. Some yachts up to 90 metres are now being built in accordance with the Code, and
so the validity of its application is in doubt.
The Code was revised and reissued in 2005, and this later version frequently is referred to as LY2. Thesame stability requirements for sailing monohulls were incorporated, and additional requirements wereintroduced for sailing multihulls.
3 WORK PROGRAMME
A list of objectives was defined, and an outline programme of work suggested, by the MCA. These aresummarised briefly in the following list:
1. Confirm and expand the database assembled during the scoping study.
2. Investigate the variation of stability and heeling moment parameters with size and rig type, usingwind tunnel data for a variety of large sailing yacht rigs.3. Conduct a limited study of the failure modes of modern materials and structures and their effects on
stability and safety.4. Investigate whether modern safety mechanisms and systems affect the requirement for survival of a
knockdown.5. Engage in discussions with other regulators for the purpose of peer review of the proposals.
4 COMPILATION OF A DATABASE
A database of sailing yachts in excess of 35 metres, built over the last 35 years, was compiled for thescoping study. This was expanded to include yachts delivered since that work was conducted, and some
examples of yachts under construction. Because of the short time interval between these two studies, theadditions to the database did not influence the general findings of the scoping study. For completeness,some Figures from that study are reproduced in this report with the additional data included.
8/2/2019 Mca-Yates Research Project 534
http://slidepdf.com/reader/full/mca-yates-research-project-534 4/34
4
Figure 1 presents the length of yachts in relation to the year they were delivered, and it is clear that themaximum size of yachts has increased significantly since 1999, until which time the maximum lengthwas under 60 metres. Figure 2 shows the distribution of the fleet in terms of length overall anddemonstrates that, although yachts are approaching 100 metres, the number of yachts over 50 metresremains small.
5 CONSULTATION WITH INDUSTRY
During this study, and the previous scoping study, designers, builders and captains were circulated withrequests for information and opinions relevant to the subject. Publicity for the project was obtained bypublication of an article in the periodical The Yacht Report, which is a highly respected publication withan extensive circulation among industry professionals. Appeals for information were sent directly todesigners and builders, and discussions took place with designers, builders and others, through meetings,telephone calls, and correspondence.
Only a small number of design offices have direct experience of very large sailing yachts. During thissecond phase of the work, particularly detailed discussions took place with five of the designers and twoof the builders who are most active, and have most experience, in the large sailing yacht industry. Otherindividuals with whom discussions or correspondence took place included captains, mast manufacturers,riggers and rigging systems manufacturers, sail makers, winch manufacturers, classification societies, andother regulatory authorities.
The first appeal resulted in considerable assistance with the collection of stability data, while the laterdiscussions concentrated on gathering opinions on the subject. These varied considerably, and this reportattempts to represent the range of opinions, and incorporate them where appropriate.
6 VARIATION OF STABILITY WITH SIZE
The size at which the stability requirements of the Code start to influence the design to a significantextent is variable, and depends upon a number of parameters. All designers are aware of the constraints
imposed by the Code, but most do not regard them as a problem because they consider the rationalebehind the criteria to be valid. Others find that the Code conflicts with other requirements of the project,and compromises the result. Of the seven designers and builders of very large yachts that gave detailedinformation, two designers and one builder have experienced severe difficulties with compliance in thecase of specific designs, and these experiences have led to strong views that the requirements of the Codeare unduly conservative. Subsequent design experience has led to a softening of this view in one case.
Some designers who have experienced difficulty with the criteria have identified particular characteristicsthat have an influence on the compliance:o Performance orientated design. Owners seek performance and are attracted to forms that resemble
those of modern racing yachts.o Low displacement/length ratio. Light displacement is good for performance but may result in low
ballast ratio and a relatively high KG. Weight growth during the design or building phases may resultin reduction of ballast to maintain the design draft, accentuating the problem.
o High beam/draft ratio. Wide beam provides good initial stability and sailing performance, and aspacious interior.
o Low freeboard/beam ratio. The popular style for sailing yachts is for a single deck of accommodationbelow the main deck. The depth of this accommodation remains roughly constant regardless of thesize of the yacht, because it is dependent on headroom requirements.
o Low superstructure height and volume. For reasons of styling and performance, superstructures tendto comprise a single deck, and large areas of open main deck facilitate sail handling.
o High performance, high aspect ratio rig, with mast height greater than yacht length.o Lifting ballasted keel or unballasted centreboard. Shallow hull draft enables access to a wide range of
ports with the keel raised.Most of these characteristics are recognisable as being desirable in terms of performance, and contributeto good stability at low angles of heel. Unfortunately they are detrimental to stability at large heel angles.
8/2/2019 Mca-Yates Research Project 534
http://slidepdf.com/reader/full/mca-yates-research-project-534 5/34
5
Some of these performance related features, one might expect to be size dependent. For example, lightdisplacement is desirable for small yachts because they need to operate in the semi-planing or planingregime to achieve high speeds. Very large yachts can operate in the displacement mode at speeds inexcess of 20 knots, and so the need to strive for light displacement should be less critical. The variation of displacement with length is presented in Figure 3. The graph is plotted on the basis of length cubed and itis clear that most yachts fit a linear relationship. There are two notable exceptions, one of which wasdesigned and built as a racing yacht.
Figure 4 shows that the relationship between beam and length is particularly dependent on the keelconfiguration for the very large yachts. For yachts below 50 metres there appears to be little differencebetween the beams of fixed and lifting keel yachts. Above 50 metres the yachts with lifting keels havesignificantly higher beams for a given length. The wide beam provides stability at normal sailing heelangles and reduces the need for a high ballast ratio, but such a combination provides less stability at largeangles than narrow beam with a high ballast ratio.
The beam/length ratios are presented in Figure 5. There is a distinct trend of decreasing beam/length withincreasing length for the fixed keel yachts, but a constant value is maintained among the largest yachts
with lifting keels. The initial stability is proportional to the product of the length and the cube of thebeam, divided by the displacement. It is therefore proportional to the square of the beam. Figure 6presents the ratio of the square of the beam to the waterline length, and shows that, despite the decreasingbeam/length ratio, there is considerable scatter but no trend with length for the fixed keel yachts. For thelifting keel yachts the ratio increases with length, demonstrating an increasing reliance on beam ratherthan ballast for the larger lifting keel yachts.
Figure 7 presents four stability parameters, and their variation with length. It appears from these data thatthere may be a trend for increasing GM and maximum GZ with size, but this does not extend to thelargest yachts in the database. In fact, study of a selection of yachts of about 10 metres overall lengthshowed that their maximum GZ values lie in the range 0.5 to 1.0 metres, which is similar to the values forthe much larger yachts featured here. The apparent variation with size for the smaller yachts in this
database is thought to be the result of greater scatter in the smaller vessel data, rather than a real trend.GM and GZ are not non-dimensional parameters and might be expected to increase with the size of thevessel. The fact that they do not increase with size might be the result of KG increasing with size at ahigher rate than simply in proportion to the length, but is considered more likely to be the direct result of the reduction in the beam/length ratio illustrated in Figure 5.
The righting moment therefore does not increase with size as a result of increasing GZ, but it doesincrease as a result in increasing displacement. The righting moment, therefore, tends to increase inproportion with the length cubed.
The range of stability is highly variable, between 80 and 180 degrees, and many of the large yachts have arange just above 90 degrees, perhaps as a result of the Code requirements. Two examples have very largeranges of stability, one is a modernised and refitted J-Class racing yacht, and the other a recent highperformance cruising yacht. To obtain such large ranges of stability, watertight integrity is assumed at allangles of heel. Some of the very large yachts have substantial superstructures and, if they are of adequatestrength and watertight integrity, their inclusion in the stability calculations is acceptable. Such additionalbuoyancy, which becomes immersed at large angles, provides considerable righting moment and is likelyto result in positive stability at 90 degrees heel. One yacht has a range of stability substantially less than90 degrees, and was approved for operation under the Code in 2003 on the basis of an alternative methodof assessment, and alternative criteria. No trend was found in the variation of range of stability with yearof build.
In the event of being pinned down by a squall for a prolonged period, the effective range is limited to thecritical downflooding angle. This tends to be around 60 degrees for the large yachts and, again, this maybe the result of the Code requirements.

8/2/2019 Mca-Yates Research Project 534
http://slidepdf.com/reader/full/mca-yates-research-project-534 6/34
6
7 VARIATION OF HEELING MOMENT WITH SIZE AND RIG TYPE
7.1 Performance tests dataWind tunnel tests have been conducted by the Wolfson Unit in support of the design of sailing rigs for awide range of yachts and sailing ships. Data from such tests were used to create a database of lift, drag
and centre of effort values. While some data were unsuitable for consideration, 75 data points have beencollated, encompassing maximum lift, maximum heeling force and maximum drag values. In some cases,more than one data point was derived from one model, because different rig options or sail combinationshad been tested.
The data represent yachts ranging in length from 8m to 91m on the waterline, with one, two or threemasts. The rig configurations varied, including –
• Bermudan sloops• Gaff cutters• Ketches• Staysail schooners• Square rigger• Innovative and non-traditional
Figure 8 to Figure 10 present the variations in the number of masts, main mast height and sail area withvessel length. Data from the general database have been included with the wind tunnel test samples onthese plots to maximise the definition of the trends. It appears that twin mast rigs become practical atlengths above 25 metres, and 3 mast rigs above 40 metres, but there is considerable overlap in each case.Mast heights tend to be roughly proportional to the length of the yacht, although there appear to be somepractical limits as might be expected. For larger yachts, structural considerations and operationalrequirements, such as bridge heights, restrict the mast height in many cases. A common height limitappears to be about 63 metres, which corresponds to Panama canal restrictions but, where this isexceeded, the linear relationship with length may be maintained.
Figure 10 demonstrates that sail areas tend to increase roughly in proportion with the square of the length,and shows that the transition from a single to a multi-mast rig enables greater sail area to be carried.These data do not include the areas of downwind sails such as spinnakers, which might increase the totalarea by over 50%.
Equations 1 to 4 below define the non-dimensional coefficients and the relationship between theaerodynamic lift and drag forces and the boat heeling and driving forces. The aerodynamic forces arereferred to the wind frame of reference, while the driving and heeling forces are defined with respect tothe vessel frame of reference.
Heeling force coefficient, AV
H C F HF 2
21 ρ= Equation 1
Non-dimensional centre of effort height, MAST F
M EH Height H
H C
1⋅= Equation 2
Heeling moment coefficient, EH HF HM C C C ⋅= Equation 3
Heeling and driving force coefficients( ) ( )
( ) ( )ββ
ββ
cossin
sincos
D L DF
D L HF
C C C
C C C
−=
+=Equation 4
Where β is the apparent wind angle.
8/2/2019 Mca-Yates Research Project 534
http://slidepdf.com/reader/full/mca-yates-research-project-534 7/34
7
Figure 11 to Figure 13 present the variations of non dimensional heeling force, centre of effort height andheeling moment against the vessel length, derived from the wind tunnel tests. For some projects, the plotsinclude data for a number of rig configurations or sail combinations, so that several data points have acommon length. They show that there is no discernable trend in the variation of heeling force or heelingmoment coefficient with length, and the maximum values remain constant in all cases. One data pointexceeds the general maximum in each case, and this is for an unconventional square rig. In general, thedifference between the aerodynamic centre of effort and the geometric centre of the sail area was within3% of the mast height.
Figure 14 presents typical lift and drag data to illustrate their variation with apparent wind angle. At lowwind angles the lift force component dominates, and at large angles this reduces towards zero and it is thedrag of the sails that is the major component. With the appropriate sine or cosine factor, these combine toproduce the driving and heeling forces and, for the latter, give the characteristic curve shown in Figure15. This shows the variation in wind heeling force with apparent wind angle, and the range of valuesfound within the database. The spread of maximum heeling force measured for a given sail and mastconfiguration depends upon the efficiency of the rig, and this includes factors such as the aspect ratio of the rig, relative positioning and overlaps of the sails, and the windage of the mast and rigging. The
database includes the results of tests analysed at different times using slightly different techniques, andthe sail area may be either developed surface area or projected area. Such area calculation differencescould account for 5% difference in the results.
The effects of different numbers of masts are shown in Figure 16. Single mast rigs have the potential toproduce a larger heeling force coefficient, compared to multi-mast rigs, with the maximum occurring atapproximately 35°. As the number of masts increases, the maximum force coefficient decreases, and theangle at which it occurs increases up to 50° apparent wind angle for a three mast rig. It should be borne inmind that these are mean curves derived from a number of vessels, and comparisons between individualyachts might not yield the same results.
The effects of different rig types are illustrated in Figure 17, which presents data for a square rigger and a
staysail schooner, both of which have three masts. These curves have been derived from a large numberof rigs, but it is possible that novel and atypical sail plans or rigging styles may produce data beyond thebounds shown in Figure 15. The overall maximum heeling force coefficient generated, as presented inFigure 15, ranges from 1.4 to 2.2, but the majority of results were close to the mean, or “best fit”, line.The limits were only reached for extreme and atypical configurations.
7.2 Comparison with Conventional AssumptionsA value for the heeling force coefficient of 1.2 frequently is assumed in sailing vessel stability and rigdesign calculations, and it is interesting to note that these data reveal many cases where this is exceededby a significant margin. There are a number of factors that contribute to this difference.
Conventional analysis assumes a beam wind on flat sails, and a coefficient 1.2 might be appropriate in
such circumstances. These data demonstrate that the maximum coefficient may be higher at otherheadings, and with real sails that are designed to deliver much higher aerodynamic efficiency than flatpanels.
The measured coefficients are based on the forces generated by the sails alone, because the hull andsuperstructure forces are deducted in the wind tunnel measurement and analysis process. This contrastswith conventional stability assessments, where the profile areas of the hull and superstructures frequentlyare included. This will account for part of the difference between the coefficients because the forcecoefficients for the hull and superstructure will be about 1. The overall effect of using a lower coefficientwith the total area will depend on the relative magnitudes of the hull and sail areas.
In some cases these wind tunnel data may provide an optimistic value of the lift that can be generated bythe sails, because the model sails can be sheeted harder than on the full size yacht, but they show thatthere is the potential for heeling force coefficients much greater than 1.2 to be generated.
8/2/2019 Mca-Yates Research Project 534
http://slidepdf.com/reader/full/mca-yates-research-project-534 8/34
8
In the wind tunnel, the heeling moment is defined about the waterline, whereas for stability assessment itis normal to take moments about half the draft, or the centroid of the underwater profile, because theheeling couple is due to the aerodynamic force on the sails reacted by the hydrodynamic force on the hulland keel. The wind tunnel instrumentation measures the moment and the force directly, deriving the leverfrom those two measurements, and so the heeling force values presented here remain valid whenconsidering the longer lever for stability purposes.
7.3 Maximum Heeling MomentsTo extend the existing performance test database, tests to produce as large a wind heeling moment aspossible were conducted on a sloop rigged model. This model was provided by Hoek Design, and isshown in Figure 18. The tests were conducted in March 2006 in the low speed section of No1 wind tunnelat the University of Southampton.
The model was rigged as for performance tests, but rather than optimising the drive force for each windheading, constant sail settings were maintained over a range of wind angles. In general, upwind sheetingangles were used, where the sails were pulled in tight. The turntable on which the model was mountedwas then rotated through a range of apparent wind angles, and the forces and moments recorded at eachangle. All data were scaled in the same manner as the performance data, accounting for wake blockageand downwash angles. The maximum heeling force produced with sails set for optimum performance atapparent wind angles of 25° and 45°, which are representative of upwind sailing angles, are presented inFigure 19. These are overlaid on the optimum curve derived from the usual performance testing, with thesails adjusted for each heading. For both of the fixed sheeting cases, a small increase in the wind anglefrom the optimum produced a small drop in heeling force, and then, as the wind angle increased further,the heeling force remained relatively constant up to a beam reach with 90° apparent wind angle. Thecentre of effort for optimum and non-optimum sail sets is also presented, on the lower graph in Figure 19.The centre of effort does not vary significantly with the sail setting or the apparent wind angle, so theheeling moment will behave in a very similar way to the heeling force.
This result is representative of a high performance single mast rig, designed to perform well at very low
apparent wind angles. This is where the dominant component is the lift force, which the sails are designedto maximise. If the wind heading is increased without adjusting the sails, the lift decreases and the dragincreases rapidly, because the sail is stalled and the flow is separated. The results for this rig show that themaximum heeling force produced by a non optimum sail setting, even when stalled, is less than themaximum possible with an optimum setting. These measurements with sails sheeted hard but the wind onthe beam represent the case of a vessel sailing to windward, then struck by a gust from abeam, which isrecognised as a particularly hazardous scenario, but does not necessarily represent the maximum heelingmoment.
When the current method of assessment was developed, heeling moment data were obtained from windtunnel tests on two models, a 3 masted barque and the 3 masted staysail schooner shown in Figure 20.Tests were conducted to obtain the maximum heeling moment and determine its variation with heel angle.
This was achieved by sheeting the sails to suit an upwind heading, of 35 degrees apparent wind angle inthis case. The model was then rotated through a range of wind angles, as for the recent tests. The modelwas also progressively heeled to measure the moment at a range of angles. The schooner model was alsotested for performance purposes. Samples of the performance data are presented on Figure 21, togetherwith the data obtained for the purposes of developing the method of stability assessment. In theseperformance tests, the sails were sheeted to the optimum configuration for each apparent wind angle, andthen the model was rotated upwind until the sails were luffed and downwind until they were beginning tostall.
Figure 21 provides a good illustration of the effects of sheeting and wind angle on a multi-mast cruisingyacht. The heeling force associated with the optimum sail settings is shown by a line passing through theoptimum data points. A second line shows the maximum heeling force that might be generated by oversheeting the sails, which might occur with careless or inexperienced sail trimming. This line has beendrawn through the data points obtained at the heading where the sails were clearly beginning to stall, sono sail trimmer would over sheet to a greater extent than this. Although greater heeling moments are
8/2/2019 Mca-Yates Research Project 534
http://slidepdf.com/reader/full/mca-yates-research-project-534 9/34
9
unlikely to be generated by over sheeting, they might result from an unexpected gust from a greater windangle than the mean wind. The third line represents this scenario, with relatively high heeling forcesgenerated with winds on the beam. At low wind angles the optimum sail settings do not generate thehighest heeling force, as was the case for the sloop rig. The multi-mast rig has a lower aspect ratio, and acascade of 8 sails compared with the sloop’s 2. The large number of slots in this complex configurationmay enable the rig to develop relatively high lift forces at angles where the sloop rig sails would stall, asis the case with an aeroplane wing utilising slots to delay stall during take off and landing. The maximumforce coefficient is greater than for the single mast rig, perhaps for the same reason, but the measurementof sail area, and degree of overlap, may be a factor.
The force coefficient for the sails fully eased, to the point where they are flogging, is also presented onFigure 19. The potential range of forces that may be generated therefore lies between the uppermost curveand the line labelled “sails flogging”. When sailing at small apparent wind angles, the heeling force maybe reduced by about 50% by fully easing the sheets. When sailing at greater apparent wind angles thesails are eased in order to obtain optimum performance, and so the reduction possible by fully easing thesheets is reduced. At an apparent wind angle of 50 degrees, fully eased sheets reduce the heeling force by25%.
7.4 Consideration of Wind GradientIt may be argued that, because of the wind gradient associated with the atmospheric boundary layer, largeyachts experience greater wind speeds because of their higher rigs. Under normal sailing conditions thesail plan and sheeting are adjusted to suit the wind conditions being experienced. If a vessel has aparticularly high rig, and therefore is experiencing greater wind speeds than a smaller yacht sailingnearby, this is equivalent to the larger yacht operating in a slightly stronger wind and the crew will adjustthe sails accordingly. Since the selection and adjustment of the sails is in the hands of the crew, notdetermined by the calculation of predicted heeling moments, the effects of wind gradient on steady sailingconditions are of no relevance to safety. It is the gusts and squalls that pose a threat in terms of stability,and their characteristics are such that the normal wind gradient is likely to be eliminated.
Gusts are generated as a result of the turbulence in the atmospheric boundary layer. Where there is avelocity gradient there is greater energy at higher altitudes than at sea level, and the level of turbulence isrelated to this difference, so that the potential strength of gusts at low altitude are dependent on the energyavailable at higher altitudes. The gusts therefore generally reduce the local wind gradient by increasingthe velocity at low altitude, and gust factors close to sea level potentially may be greater than at higheraltitudes where the mean wind is greater.
A squall is a small scale weather system that can have a local wind speed many times that of the ambientmean wind. The extent of squalls in terms of the horizontal and vertical dimensions is highly variable, andthe direction of the local wind may have a vertical downward component. The normal wind gradient isnot likely to be present within a squall.
7.5 Summary and ImplicationsThese data provide no evidence that the maximum heeling moment coefficients vary with size. Themaximum heeling force coefficient typically has a value of about 2, and the centre of effort height is closeto the centroid of sail area. This is considerably greater than the value of 1.2, which is often assumed intraditional methods of stability assessment, although different methods of analysis account for a smallproportion of the difference.
Different rigs behave differently in terms of the effects of sail sheeting and heading. While highperformance rigs have the potential to develop high heeling forces at their optimum sail settings whenbeating to windward, multi-mast cruising rigs may be more vulnerable to over sheeting and the effects of encountering an unexpected gust on the beam.
The heeling moment is the product of the coefficient, the square of the wind speed, the centre of effortheight and the sail area. The wind speed is independent of vessel size, while the product of centre of effortheight and sail area is proportional to the cube of the length. These data indicate, therefore, that the windheeling moment can be assumed to increase in proportion to the length cubed.

8/2/2019 Mca-Yates Research Project 534
http://slidepdf.com/reader/full/mca-yates-research-project-534 10/34
10
Wind gradient effects are not considered to be of relevance in the scenarios likely to be hazardous to asailing yacht.
8 WIND SPEEDS REQUIRED TO CAUSE KNOCKDOWN OR CAPSIZE
8.1 Example YachtsThe reasoning behind the minimum requirements is that a yacht with a range of stability of at least 90degrees is likely to recover from a knockdown, whereas one with a lower range might not. Calculationswere conducted to estimate the wind speeds that might be required to capsize example yachts which haveranges of stability less than 90 degrees.
The basis of the existing method of assessment, and provision of information, is that there are an infinitenumber of combinations of sail area, sheeting, heading and wind speed that can result in a particular windheeling moment. Prediction of heeling moment is discarded in favour of monitoring of the heelingmoment by monitoring the heel angle. Armed with the wind tunnel data described above, however, wecan attempt some predictions of the wind speeds that might result in knockdown to a particular angle, or
capsize, of a particular yacht.
Stability data and a sail plan were available for only one large yacht that has a range of stability less than90 degrees. In order to increase the number of examples, two other yachts for which stability data and sailplans were available were considered, with their stability curves adjusted to reduce the range.
The stability curves for the three yachts are presented in Figure 22. Yacht A represents the yachtoperating with a range of stability of 80 degrees in its worst operational condition, which is its arrivalcondition. Yacht B has a range of stability in excess of 90 degrees, and the GZ curve for the actual yachtis shown with a broken line on the plot. It is quite possible that another yacht could be constructed with asimilar hull shape, rig and centre of gravity, so that the GZ curve up to 30 or 40 degrees would be thesame, giving the same sailing performance, but with a different deck and superstructure arrangement sothat the large angle stability would be different. This hypothetical yacht is represented by the solid line. Arange of stability of 80 degrees has been assumed. The third example, yacht C, has been derived in asimilar way, taking an existing yacht and assuming a reduced freeboard to derive a GZ curve with a rangeof 80 degrees.
8.2 Upwind Sailing ScenarioIn each case the wind speed required to capsize the yacht, assuming an upwind sailing condition, has beenderived as follows:
The heel angle resulting from a steady wind heeling moment corresponds to the intersection of therighting and heeling arm curves, so the heeling arm at the point of capsize is defined where the heelingarm curve is tangential to the GZ curve. The heeling arm curve is defined by the formula:
( )1.30θ cos θHAHA =
The heeling moment is the product of the heeling arm and the displacement, and
)(V0.5HM 2hullhullhullsailssailssails C h AC h A += ρ
Where: ρ is the density of airV is the apparent wind speedAsails is the area of the full upwind sail plan, including sail overlapshsails is the height of the centroid of the sail plan above half the draftCsails is the maximum sail heeling force coefficient, assumed to be 1.75Ahull is the profile area of the hull and superstructures
8/2/2019 Mca-Yates Research Project 534
http://slidepdf.com/reader/full/mca-yates-research-project-534 11/34
11
hhull is the height of the centroid of the hull and superstructure area above half the draftChull is the hull heeling force coefficient, assumed to be 1.0
These value of the sail force coefficient was selected on the basis of Figure 11, Figure 12 and Figure 15.It represents common maximum values derived from a wide range of model tests.
For these three example yachts, A, B and C, the wind speeds required to capsize would be 28, 29 and 37knots respectively. The corresponding heeling arm curves are shown on the plots. Although full sailwould not be retained if the wind increased to such speeds, it is possible that a gust or squall could causea sudden increase. The maximum likely gust factor is 1.4 times the mean wind speed, resulting in twicethe wind force. The heeling arm curves corresponding to mean winds, assuming that this gust factor hadgiven rise to the capsizing moments, are included on the plots, and enable potential capsizing scenarios tobe envisaged.
In the case of yacht A, a steady wind of 20 knots would result in a heel angle of 15 degrees. A gust factorof 1.4, increasing the wind speed to 28 knots, would result in capsize. This is a quite reasonable scenario,and suggests a relatively low level of safety. Although these values have been derived from specific
assumptions regarding sails set and the force coefficients, any sail and wind combination on this yachtthat results in a steady heel angle of 15 degrees, renders the yacht vulnerable to capsize in a strong gust.This relationship between steady heel angle and capsize is a function of the GZ curve shape alone. Thisangle of 15 degrees corresponds to the minimum requirement for the maximum recommended steady heelangle to prevent downflooding in gusts. The yacht does not pass the range of stability criterion and is onthe margin with regard to the heel angle criterion.
In the case of yacht B, a steady wind of 21 knots would result in a heel angle of 19 degrees. A gust factorof 1.4, increasing the wind speed to 29 knots, would result in capsize. Although the wind speed requiredto capsize is similar to that of yacht A, it is somewhat safer because the steady wind heeling angle wouldbe 19 degrees in this case, and the yacht is likely to sail at lower angles most of the time.
By the same reasoning, yacht C is safer again, being able to sail at steady angles up to 25 degrees withoutrisk of capsize in a gust, and requiring 37 knots of wind to capsize.
Easing the sheets in this scenario might enable the heeling moment to be reduced by up to 50%, asindicated by Figure 19. This would enable reduction of the gust heeling moment back to its mean windlevel, if the sails were fully eased and flogging, and could be eased to this extent sufficiently quickly.
If the possibility of squalls is considered, the gust factors are not limited to 1.4. Squalls with high windspeeds may occur during periods of light winds. A squall of 40 knots during a period with a mean windspeed of 12.5 knots would give a gust factor of 3.2, and a 10 fold increase in the heeling force. It is quitepossible, therefore, that a 30 or 40 knot squall could capsize one of these yachts, if it strikes unexpectedlywhen a large sail area is set and sheeted for upwind sailing, regardless of the wind speed that prevailedprior to the squall. Easing the sheets might not provide sufficient reduction in the heeling moment in aparticularly strong squall. Such squalls can occur in any season in light or moderate winds.
The benefits of a range of stability greater than 90 degrees are demonstrated by Figure 23. Here, thecurves for yacht C are shown again, together with wind heeling curves corresponding to much higherwind speeds. In the assumed scenario, the yacht with a range of 80 degrees would be capsized by wind of 37 knots, but the actual yacht, with a range well in excess of 90 degrees, cannot be capsized by windheeling. The curves show that, if the wind speed increases by fixed increments, the increase in heel anglebecomes progressively smaller. A yacht may be knocked down and pinned at a large heel angle but,provided significant downflooding can be prevented, it should retain a positive righting moment that willright the yacht after the gust or squall has passed.
In practice, the relationship between heeling and righting moments is unlikely to fit this theory preciselyat 90 degrees. The range of stability will benefit from the buoyancy of rigging, masts and other structuresabove the deck, but be degraded by any movement of loose items of equipment to the leeward side. The

8/2/2019 Mca-Yates Research Project 534
http://slidepdf.com/reader/full/mca-yates-research-project-534 12/34
12
heeling moment curve is based on the assumption that the wind vector is horizontal, but this may not bethe case in a squall, and any downward component will increase the heeling moment at large angles of heel. As a yacht recovers from a knockdown to 90 degrees, the stability is likely to be affected by ingressof water to the hull and spars, the latter having potential to degrade the stability dramatically. Thesefactors are too variable to be considered for regulatory purposes, and so the range requirement of 90degrees was selected in recognition of the theory, and the assumption that other factors will balance out.
8.3 Off Wind Sailing ScenarioIf the yacht is sailing on an off wind heading, the sails heeling force coefficient would be considerablylower than the value 1.8 assumed for the upwind scenario. The sail area carried might be considerablygreater than the normal upwind configuration. Maximum downwind sail areas may be 50% to 80%greater than the full upwind sail plan, although the largest sails would be of light material and probablywould fail in a very strong gust. When sailing off wind, the heeling moment is low and the transversestability is less important than the longitudinal stability in terms of sailing performance. The yacht speedreduces the apparent wind speed to significantly less than the true wind speed, for example running beforethe wind at a speed of 12 knots in a wind speed of 25 knots results in an apparent wind speed of only 13knots. These large sail areas therefore may be maintained in relatively strong winds.
A gust or squall would be unlikely to pose a threat to stability because, as Figure 15 shows, the heelingforce coefficient is likely to be less than 0.5.
There may be a danger, however, if the yacht suffers a broach. Consider the scenario of a yacht sailing ata heading with an apparent wind angle of 150 degrees, when a broach reduces this to 90 degrees.Reducing the apparent wind angle will have two effects. The apparent wind speed will increase to equalthe true wind speed, and this may be twice the apparent wind speed. This will result in the wind forceincreasing by a factor of 4. The second effect will be that the heeling moment coefficient will increase.Inspection of Figure 19 shows that, for that yacht, the heeling force coefficient would increase from 0.25at 150 degrees to about 0.75 at 90 degrees, a three-fold increase. The latter value was derived from anextrapolation of the “sails flogging” line to 90 degrees. The lower graph of that Figure shows that the
centre of effort height would remain roughly constant. The heeling moment therefore might increase bythe product of these factors, a total factor of up to 12. The consequences of such an increase are likely tohave dramatic implications for the stability and safety of the yacht, and for the integrity of the sails andrig. Experienced crews are aware of this potential danger, and exercise prudence when setting sails forsailing downwind in strong conditions.
If the broach is induced following an encounter with a gust or squall, the combined factor will be theproduct of the gust factor and that described above, further increasing the level of hazard.
9 DEMANDS ON LARGE YACHTS
The types of yacht assessed under the MCA Code range from sedate motor sailers to high performancecruising yachts, and racing yachts converted for charter or fast cruising, and their use is equally variable.Many large yachts are used primarily as platforms for entertainment, and as such may not be sailed instrong winds, rough conditions, or at maximum performance. This is less common for sailing yachts thanfor motor yachts, however, and many sailing yachts are designed to satisfy an owner’s desire for highperformance. These may be sailed hard by their owners and crews. There are many prestige regattas forvery large yachts, where competition may be at a high level, and interest in these is increasing. At onesuperyacht regatta in 2006 there were 30 entries between 24 and 55 metres, 19 of them over 35 metres.
It has been argued that a particular yacht may not be sailed in conditions where a stability incident ispossible, but this is not a simple criterion to be applied in a regulatory framework. When a yacht changeshands the nature of its use may change, and the level of risk may increase as a result.
8/2/2019 Mca-Yates Research Project 534
http://slidepdf.com/reader/full/mca-yates-research-project-534 13/34
13
10 FAILURE MODES OF MODERN MATERIALS AND STRUCTURES
10.1 Rig DesignYacht designers, rig designers and rig manufacturers use various approaches to determine the structuralrequirements. The performance requirements, hull type, rig type, and classification society requirements
may have an influence on the design process, but the variations tend to apply to the details of the loadcases or the criteria applied, rather than the fundamentals of the process. A standard starting point in rigdesign is the maximum righting moment of the yacht, supplemented with a safety factor. This representsthe maximum transverse loading on the rig, and enables the rig structure to remain intact if subjected to awind strength and sail combination that combine to result in a heeling moment that is sufficient to cause aknockdown.
For multi-mast rigs, the individual mast structures are designed to transmit a proportion of the heelingmoment, and so the load case for each mast will be based on a proportion of the maximum rightingmoment. Each mast may not be expected to withstand 100% of the maximum moment, but it will bedesigned to withstand a moment greater than the maximum divided by the number of masts. For example,on a 3 mast rig, the foremast may be designed to take 70% of the maximum moment, while 60% may be
used for the mizzen. Overall, therefore, the rig strength will be adequate to transmit heeling momentsgreater than the maximum righting moment, if the sail area is distributed between the masts.
Other load cases to be considered include running before the wind, when a relatively large sail area maybe carried in a given wind speed, because the heeling moment is low. This may be hazardous if there is asudden shift in wind direction, or if the yacht broaches, because the heeling moment may increase to anunacceptable level and result in a knockdown. The risk may be judged to be acceptable by the captain,however, and the rig therefore must be designed to withstand very high loads with the wind from astern.
Sailing or motoring into rough seas will result in high fore and aft rig loads, particularly if bow slammingoccurs. Such shock loading does not appear to be a design criterion, but design strength is well above thefatigue limit. Such loads have been the cause of component failure, perhaps because of faulty componentsor fittings, or inadequate maintenance.
For a conventional stayed rig, the design case for the mast assumes the most likely failure mode to beEuler buckling of the mast panels in compression. The design buckling load is based on the load due tothe selected maximum righting moment, plus the load due to the shrouds and halyards, plus a safetyfactor.
A recent development in rig design, facilitated by advances in composite materials, is for large unstayedmasts. It is possible for the design loads to be met with an unstayed structure that is very flexible, butsuch a characteristic is undesirable so stiffness criteria then govern the design process. For this reason,unstayed rigs are likely to have a greater margin of safety in relation to the maximum righting moment of the yacht.
Multihulls have special characteristics that influence the design. The very wide shroud base is an assetbecause it enables the rig to be supported with lower shroud tensions, and the buckling loads therefore arereduced. The very high stability enables very high sail loads to be carried, and requires higher factors of safety because, if struck by a gust, the yacht will not heel significantly to reduce the sail loads. For thisreason, multihull rigs are likely to have a greater margin of safety than monohull rigs, but the relationshipbetween rig strength and maximum righting moment is unlikely to be a design criterion.
In cases of very high stability in relation to the rig size, it is possible that the wind speed required togenerate a heeling moment equal to the maximum righting moment would be an unrealistic value,perhaps 150 knots. The designer might then use a lower wind speed as the basis of the rig design,
probably something well below 100 knots. In such a case it is quite possible that the rig would fail beforea knockdown occurred, but it would not be possible for a regulator to determine the wind speed requiredfor failure. There would be uncertainties associated with the failure loading, the failure mechanism, andthe residual moment of any part of the rig left standing.
8/2/2019 Mca-Yates Research Project 534
http://slidepdf.com/reader/full/mca-yates-research-project-534 14/34
14
It is often suggested that rigs might be designed to fail at some specified loading below that which mightresult in a knockdown. Weak links or “fuses” in the rigging have been proposed as a means of dictatingthe failure mode in extreme circumstances. The variety of load cases described above indicate thedifficulties that such an approach would need to address, and all of the designers consulted agreed that itis not possible to design a rig to fail in a particular way. A scenario that might result in the highestoperational loading of the rig is if attempting to beat off a lee shore in strong wind conditions, when ayacht might be pressed to relatively large heel angles in rough seas. The combined wind loading andwave induced forces might exceed any predetermined maximum safe steady loading, and loss of the rig insuch circumstances is likely to be disastrous.
There appear to be many reasons why rigs are unlikely to fail before a knockdown occurs. There havebeen many examples of failed rigs, but the majority are on racing yachts, where safety factors areminimised in the desire for low rig weight and maximum stability. Failures on cruising yachts are usuallyidentified as faulty components or fittings, or poor maintenance, rather than inadequacies of the basicdesign.
10.2 Classification Society Requirements for RigsThe MCA Code requires that masts and spars should comply with Classification Society requirements.The few Classification Societies that have rules for rig structures adopt different approaches.
Traditionally, many sailing ship rigs were designed in accordance with “Rules for the Masting andRigging of Sailing Ships” developed by Germanischer Lloyd. These comprise tabulations of the requiredsizes of components of traditional rigs. They are unlikely to be of relevance to the design of a modern rig,where contemporary configurations and materials demand different approaches. Germanischer Lloyd nowoffers a comprehensive rig design and approval service, and employs facilities for a global finite elementanalysis of the complete rig. Traditionally, the maximum righting moment was used to define thetransverse load case, but in some large yachts this has been superseded by the use of a maximum “safeheel angle”, which may be around 20 or 30 degrees. This is an angle specified by the designer, with the
agreement of Germanischer Lloyd, and must be greater than that detailed as the maximum recommendedsailing angle in the yacht’s sailing operations manual. Whilst this suggests that the rig may be vulnerableif subjected to loads equivalent to the maximum righting moment, the safety factor applied is likely to begreater than the difference between the maximum righting moment and that at the safe heel angle. Thus,although the rig is not designed to handle, on a regular basis, the loads required to capsize the yacht, it islikely to be strong enough to withstand them on an isolated occasion. Other load cases that are consideredinclude downwind sailing, and motoring into head seas. More details of their methods are described inRef 3.
Lloyds Register has rules for sailing passenger ships which sometimes are applied to large yachts. Itapplies rules considering both operational and survival load cases. For the operational cases the designerspecifies maximum wind speeds for full sail and reefed configurations, and these are expected to be in
excess of 25 and 40 knots respectively. The survival case assesses the bare poles configuration in a windof 122 knots. Lloyds specify safety factors to be applied in each case to the mast and standing rigging.More details of the process, and the reasoning behind it, are given in Ref 4.
Rig designs for the largest yachts are complex systems requiring detailed analysis. They are unlikely to besuitable for assessment using standard tabulations, and these examples demonstrate that the classificationsocieties involved are taking the problems of rig engineering very seriously in order to provide aprofessional approval service.
11 SAFETY MECHANISMS AND SYSTEMS
Modern developments in rig systems enable the loads and structures to be monitored to ensure that they
maintain their performance and safety during the life of the yacht. Load cells, strain gauged componentsand fibre optic systems can be incorporated in various ways, and the heel angle remains a very reliablemeans of determining the overall rig loading. Multihulls do not heel to significant angles, so it is commonfor the rig loading to be monitored with load cells in the stays. These systems are designed to monitor the
8/2/2019 Mca-Yates Research Project 534
http://slidepdf.com/reader/full/mca-yates-research-project-534 15/34
15
rig loadings for the purposes of maintaining structural integrity and performance, and are not designed toprovide information on sudden increases in rig loading to which the crew might respond.
Some modern sail handling systems are designed to ease sheets when the sheet load, or the heel angle,exceeds some preset limit. With such systems working efficiently, it is expected that the yacht will notheel to large angles under wind loading.
Most large modern yachts are equipped with captive sheet winches, and these are designed to handle thevery high loads associated with large sails. Loads up to 20 tonnes can be handled in some cases, anddevelopments are under way to increase this capability up to 30 tonnes. It would be impractical toconfigure such winches to release the sheets when the loads exceed a pre-set limit, so they need to pay outthe sheets in a controlled way using a powered mechanism.
Some designers have full confidence in these automated systems, and cite them as one of the principlefactors in the case for relaxing the stability requirements. Others appreciate the value of modern sailhandling systems under normal operating conditions, but do not regard them as providing a fail safemeans of avoiding knockdown. There is some concern that the crew may become accustomed to relying
on the winch systems to respond to gusts, to the extent that they might pay inadequate attention to theweather conditions. There are a number of scenarios that have been cited as examples of equipmentfailure, and some where failure might potentially occur.
1. The response rate of a winch may be too slow to ease a sheet sufficiently in an encounter with asudden gust or unexpected squall.
2. A system may rely on generators that may fail, or will not operate at large heel angles.3. A sail furling system may not operate when under extreme wind loading.4. The head of a furling sail may be shackled to the mast, so that it cannot be lowered in the event of
failure of the furling system, as one hoisted by a halyard might be.5. A partially furled sail cannot be lowered in the event of failure of the furling system.
12 INCIDENT REPORTSNo documented reports of serious stability incidents to yachts approved under the MCA Code werefound. Some anecdotal evidence was heard, relating to knockdown incidents with very large yachts, butrequests for detailed information were not granted.
Large yachts are the pride of their owners, designers and builders, and are valuable assets in the resaleand charter markets. It is understandable that there is a general unwillingness to discuss incidents whichmight damage the reputation of a yacht.
The lack of incident reports is a good indication that disastrous events are extremely rare, or perhaps non-existent, but it does not provide evidence that serious events do not occur. The anecdotal accounts
included a wide range of incidents, on yachts up to 75 metres in length. The causes of the incidentsincluded knockdown by a gust or squall, knockdown following a broach, difficulty in lowering sails whenheavily loaded, and power failure leading to steering or sail handling problems. Serious downfloodingwas notably absent from these reports, and this may be the principle distinction between anuncomfortable or alarming incident, and a disastrous one.
13 OPERATIONAL RESTRICTIONS FOR NON-COMPLIANCE
Some large motor or sailing yachts which have encountered difficulties in complying with various MCACode requirements have been certificated for operation within restricted areas, or distance from a safehaven.
This is appropriate for some Code requirements. For example, if a yacht does not comply with thedamage stability requirements, restricting operation to within 60 miles of a safe haven increases thelikelihood of successful evacuation of the crew and guests in the event of a damage or flooding incident.

8/2/2019 Mca-Yates Research Project 534
http://slidepdf.com/reader/full/mca-yates-research-project-534 16/34
16
It may be inappropriate in the case of failure to comply with the intact stability requirements. Largeyachts are very capable of operating in severe seastates without danger of capsize. Their stability is likelyto be greater than that of motor yachts of similar size because of their requirement to carry sail. They areunlikely to be in danger from breaking waves because of their large size. They are, therefore, likely tosurvive rough conditions in the open ocean with little danger, and this is no justification to limit theircruising range.
If they cannot comply with the sailing yacht stability requirements it is because they are relativelyvulnerable to a knockdown from which they may not recover, either because of downflooding or a lack of stability at large angles. Such a knockdown might be the result of an unexpected encounter with a severesquall, and proximity to land does not reduce the probability of such an event.
If a yacht cannot recover from a knockdown the result will be sinking as a result of downflooding, or totalinversion, although the latter is considered to be unlikely. Survival rates for such incidents are extremelylow because there is little time available to escape from the accommodation, raise the alarm, or gathersurvival equipment or clothing. Survival is likely to be dependent on successful deployment of liferafts,probably by automatic release mechanisms. These have been shown to be problematic on fishing vessels
where liferafts and their painters may become fouled by structures above the deck, masts and rigging.Such problems may be greater on a sailing yacht than on a fishing vessel. Proximity to land will enable arelatively fast response of any rescue effort, but will not ensure that personnel will survive a disastrousknockdown event.
14 CONSULTATION WITH REGULATORS
Approaches were made to a number of regulatory authorities and classification societies. The responsefrom national administrations generally was disappointing, but information was obtained regarding themethods used by the US Coast Guard, Transport Canada, the German Bundesministerium für Verkehr,the Netherlands Shipping Inspectorate and the Australian Maritime Safety Authority. Some authoritieshave adopted the method of assessment used in the MCA Code, some use a method similar to that used inthe UK prior to the development of the Code, and others use a method based on that used by the US CoastGuard.
The different methods of assessment were considered in the 1980s, during the development of the methodused in the Code. The older methods were rejected at that time, because they do not necessarily provide agood measure of safety, may limit the sail area that can be carried in light winds, and do not provide anyinformation on the level of safety when sailing. They incorporate traditional methods of predicting theheeling moments in specified wind speeds, and consideration of the effects of gusts which are based onthe traditional energy balance assumptions that are known to be invalid. Those authorities who retain theiruse appear to be satisfied with their application. Few authorities have experience of assessing a significantnumber of large yachts. Whilst some expressed an interest in the findings of this study, they did not offernew information to assist new developments.
15 SUMMARY OF FINDINGS
1. Some designers experience difficulties in achieving compliance with the existing requirements,particularly a range of stability of 90 degrees. Other designers find that the downflooding angle is thecritical parameter.
2. Most designers consider that the Code requirements are necessary to ensure safety from a disastrousknockdown or capsize, because automatic sail handling systems can not provide a fail safealternative.
3. The different experiences of designers largely are the result of the different styles of yacht beingdesigned. It is clear that yachts of the largest sizes currently being built can be designed to complywith the current requirements. It is unclear whether the style of yachts for which compliance is
difficult is necessary to obtain adequate performance, or whether it enables the designer to create ayacht that is desirable in other respects. The fact that yachts of extremely high value are beingdesigned, which have difficulty in complying, is evidence that there is some demand for this style of yacht, whether for performance or other reasons.

8/2/2019 Mca-Yates Research Project 534
http://slidepdf.com/reader/full/mca-yates-research-project-534 17/34
17
4. Stability characteristics are affected by draft restrictions, because of port and navigational constraints.Lifting keels are used in some cases. Shallow draft and lifting keel configurations may constrainballast to a relatively low weight or high location. This may result in a relatively high centre of gravity. To obtain satisfactory sailing performance, such yachts may have relatively high beam. Thiscombination provides good stability at normal sailing angles but is detrimental to stability at largeangles.
5. Other design features, such as relatively low freeboard or small superstructures, are detrimental to thestability at large angles, but may be considered as attractive features of a particular style of yacht.
6. Rig types vary considerably, and differences in their performance can be measured in wind tunneltests, but there is no evidence that the heeling moment coefficients of particular rigs vary to such adegree that they warrant different approaches for the purposes of safety assessment.
7. Both the maximum righting moment and the maximum heeling moment tend to increase in proportionwith the length cubed, so that there is no general trend of reduction in the ratio of heeling moment torighting moment with increasing size.
8. Some very large yachts, with a range of stability less than 90 degrees, may have a combination of sailplan and stability characteristics that make them vulnerable to wind speeds below 30 knots. Suchwind speeds may be experienced as gusts in Beaufort force 5 to 6, or in squalls. This is not considered
to represent an adequate level of safety for a vessel which is equipped for ocean passages, and is of asize that one would expect to be adequate for such service. One example with such characteristics isknown, and it is possible that others may exist, or be built in the future, if regulatory authorities allow.It is anticipated that owners investing the large sums involved in a large yacht project will expect ahigh level of safety to be assured by the Code requirements.
9. Rig failures occur in a range of circumstances. They are more frequent on high performance racingyachts, where safety factors are minimised in an effort to reduce rig weight. On cruising yachts theyare rare, and tend to be the result of component failures rather than overloading of the mast or rigging.
10. Most yacht designers and rig designers agree that rigs are likely to withstand the forces required toheel a large yacht beyond its angle of maximum righting moment.
11. Powered sail handling systems provide an efficient means of controlling the rig under mostcircumstances, but cannot be relied upon as a fail safe means of reducing the heeling moment
sufficiently, in short the time required, to avoid knockdown in the event of a sudden, unexpected, gustor squall.
12. A knockdown is a real hazard, and there are numerous anecdotal accounts as evidence that very largeyachts are heeled to angles sufficient to cause alarm to the captain and crew. Documentary evidenceis scarce, and statistics therefore are inadequate to establish whether the probability of a knockdowndecreases with size. It is considered likely that such a relationship exists, primarily because largeyachts tend to be sailed in a more conservative manner than smaller yachts. It may be argued,therefore, that large yachts are safer because of a lower probability of knockdown, but the possibilityof knockdown cannot be neglected.
13. The examples considered indicate that, if a yacht has insufficient stability at large angles to complywith the 90 degree range requirement, it may have insufficient stability to withstand the heelingeffects of squalls of about 40 knots.
16 RECOMMENDATIONS
The method of assessment and minimum criteria defined in the existing Code of Practice are consideredto remain valid for all sizes of sailing yacht, and no relaxation of the requirements is recommended on thebasis of size.
There may be circumstances where the maximum righting moment of a particular vessel is high inrelation to the potential maximum heeling moment. Such a relationship may be the result of wide beam,heavy displacement, or a small rig. In such circumstances the wind speed required to capsize the vesselmay be sufficiently high that it is unlikely to be encountered, even in a squall, when full sail is set. Therequirement for a range of stability of 90 degrees then may be inappropriate, and an alternative approach
is recommended.
The wind speed required to capsize should be calculated as follows:
8/2/2019 Mca-Yates Research Project 534
http://slidepdf.com/reader/full/mca-yates-research-project-534 18/34
18
The heel angle resulting from a steady wind heeling moment corresponds to the intersection of therighting and heeling arm curves, so the heeling arm at the point of capsize is defined where the heelingarm curve is tangential to the GZ curve. The heeling arm curve is defined by the formula
( )1.3
0θ cos θHAHA =
The heeling moment is the product of the heeling arm and the displacement, and
)(V0.5HM 2hullhullhullsailssailssails C h AC h A += ρ
Where: ρ is the density of airV is the apparent wind speedAsails is the area of the full upwind sail plan, including sail overlapshsails is the height of the centroid of the sail plan above half the draftCsails is the maximum sail heeling force coefficient, assumed to be 1.75Ahull is the profile area of the hull and superstructures
hhull is the height of the centroid of the hull and superstructure area above half the draftChull is the hull heeling force coefficient, assumed to be 1.0
The yacht should be considered to have adequate stability if the wind speed required to capsize is not lessthan 40 knots.
This recommendation is in line with the requirements for multihulls in the MCA Code for large yachts.They are required to withstand a mean wind speed of 27 knots with the full upwind sail plan set, or toprovide adequate buoyancy to maintain floatation if inverted. The wind speed which would result incapsize is determined in a similar way to that described above, and a gust factor of 1.4 is assumed. Amean wind of 27 knots therefore equates to a gust wind speed of 38 knots. The heeling moments of multihulls are determined using a different formula to that for monohulls, because the plan area of thedeck has a significant influence, but it is considered appropriate that the limiting wind speeds should besimilar.
17 REFERENCES
1. Sail Training Vessel Stability Research, Phase 2. Wolfson Unit Report 908 for the Department of Transport, February 1989.
2. The Development of Stability Standards for UK Sailing Vessels. B. Deakin. Presented at the RINASpring Meetings, London, 1990.
3. Rules for Classification and Construction I – Part 4, Chapter 5: Guidelines for Design andConstruction of Large Modern Yacht Rigs. Germanischer Lloyd AG, Hamburg, 2002
4. The Verification of Masts and Rigging of Large Sailing Vessels. M.J.Gudmunsen, 16th
HISWASymposium on Yacht Design and Construction, Amsterdam, November 2000.

8/2/2019 Mca-Yates Research Project 534
http://slidepdf.com/reader/full/mca-yates-research-project-534 19/34
19
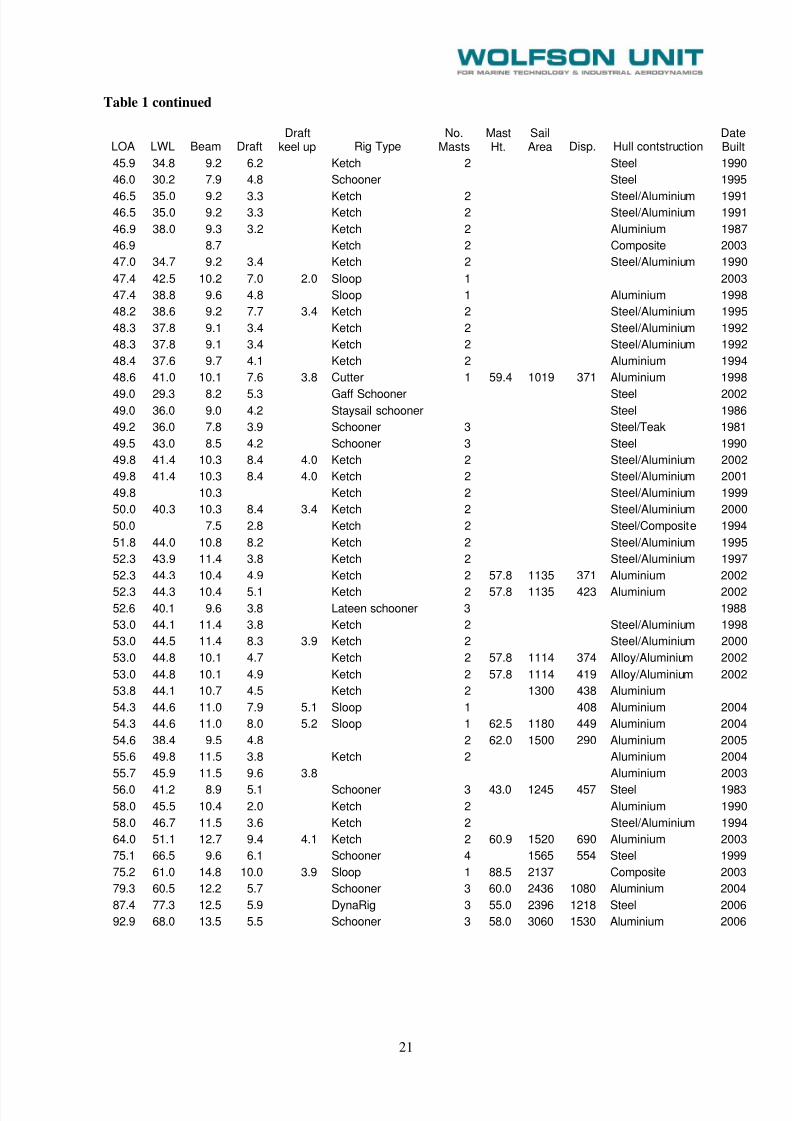
Table 1 Summary of the yachts in the database
LOA LWL Beam DraftDraft
keel up Rig TypeNo.
MastsMastHt.
SailArea Disp. Hull contstruction
DateBuilt
35.2 26.7 7.5 5.4 3.4 Ketch 2 34.3 429 197 Steel, Aluminium 198735.2 26.7 7.5 5.4 3.4 Ketch 2 34.3 429 197 Steel, Aluminium 198735.4 27.3 7.9 2.9 Schooner Cedar/E-glass 199535.7 26.0 7.6 3.0 Ketch 2 Aluminium 199235.8 30.0 8.1 5.2 Sloop 1 Aluminium 198836.0 29.4 7.3 2.3 Ketch 2 Aluminium 198236.0 26.8 7.7 3.6 Sloop 1 Steel/Aluminium 198636.0 27.7 8.2 9.9 5.8 Sloop 1 Steel/Aluminium 198936.0 28.1 7.4 6.6 2.1 Cutter 1 610 Aluminium 198736.0 28.2 7.9 3.8 Ketch 2 Aluminium 199536.0 29.0 8.1 5.5 3.5 Sloop 1 Composite 200136.0 30.0 7.9 Ketch 2 Steel 198736.0 7.5 3.0 Ketch 2 Steel 199536.2 29.4 8.2 3.3 Sloop 1 Aluminium 199536.5 29.3 8.1 3.5 Ketch 2 Aluminium 198136.5 32.4 8.7 3.6 Sloop 1 Steel/Aluminium 199337.0 30.3 8.3 3.2 Sloop 1 Aluminium 199537.0 30.4 7.3 3.1 Ketch 2 Steel/Aluminium 199237.0 30.5 8.4 3.8 Sloop 1 Aluminium 199937.0 7.6 3.1 Ketch 2 Steel/Aluminium 199637.2 31.5 8.4 4.0 Sloop 1 Aluminium 200337.2 29.9 7.6 5.9 2.7 Cutter Aluminium 198737.2 32.8 7.5 4.8 Sloop 1 Carbon fibre 200437.3 33.1 7.4 4.7 1 1717 120 Composite 200537.4 28.6 8.2 3.5 Ketch 2 Aluminium 1991
37.4 29.0 8.4 3.4 Ketch 2 Aluminium 199437.5 30.7 8.3 4.0 Sloop 1 Aluminium 200437.5 23.7 7.6 3.2 Schooner Steel 199337.5 27.7 8.0 3.9 Sloop Aluminium 198937.6 29.3 8.1 3.7 Ketch 2 Aluminium 199037.6 29.3 8.0 3.5 Ketch 2 Aluminium 198937.8 27.4 7.8 8.1 3.0 Sloop 1 Wood/Epoxy 199937.8 30.4 7.9 5.9 3.1 Ketch 2 Aluminium 198638.0 33.7 8.9 3.5 Sloop 1 Advanced composite 200238.1 28.5 7.8 6.6 2.4 Cutter Steel/GRP 199038.1 32.8 8.6 5.5 3.3 Schooner Aluminium 199238.3 30.5 8.5 8.7 3.0 Ketch 2 Wood/West system 199338.4 24.0 6.9 4.2 Schooner Steel 198638.4 24.0 8.4 6.3 Ketch 2 Aluminium 199138.5 32.5 8.1 3.5 Ketch 2 Steel 199138.5 32.5 8.1 3.5 Ketch 2 Steel 199138.7 30.7 7.6 3.0 Ketch 2 Steel/Aluminium 198438.9 31.1 8.7 3.4 Ketch 2 Aluminium 199339.0 31.6 9.0 3.5 Sloop 1 Aluminium 199639.4 27.8 6.6 4.8 Sloop 1 55.0 839 180 Steel 193339.5 27.5 7.0 4.4 Gaff Schooner 2 44.2 843 210 Wood on steel frames 191039.6 8.4 4.0 Sloop 1 Alustar 200139.8 29.8 7.7 3.9 Ketch 2 Aluminium 200139.8 33.5 8.5 3.9 Sloop 1 49.6 609 183 Aluminium 200539.8 33.5 8.5 4.0 Sloop 1 49.6 609 199 Aluminium 2005

8/2/2019 Mca-Yates Research Project 534
http://slidepdf.com/reader/full/mca-yates-research-project-534 20/34
20
Table 1 continued.
LOA LWL Beam DraftDraft
keel up Rig TypeNo.
MastsMastHt.
SailArea Disp. Hull contstruction
DateBuilt
39.9 28.0 8.0 3.8 Sloop 1 Aluminium 200240.0 30.0 8.7 4.0 Schooner Aluminium 199340.0 30.0 8.7 4.0 Schooner Aluminium 199740.0 31.9 8.2 6.4 3.4 Ketch 2 Steel/Aluminium 199040.0 33.8 8.8 4.3 Ketch 2 44.5 700 220 Aluminium 200540.0 35.5 9.5 3.9 Sloop 1 Composite 199340.0 36.0 9.0 3.8 Sloop 1 Composite 199140.0 6.5 2.8 Ketch 2 Steel/Composite 199040.2 30.1 8.8 2.7 Ketch 2 827 Aluminium 199640.4 33.5 8.7 4.2 Sloop 1 Aluminium 200040.4 32.1 8.0 6.5 3.5 Ketch 2 Steel/Aluminium 200140.5 32.5 9.2 4.0 Ketch 2 Aluminium 199340.5 32.4 9.0 3.0 Sloop 1 Aluminium 199440.6 29.3 8.0 4.4 Schooner 2 45.6 1000 165 Alustar 200140.6 29.8 7.6 3.8 Schooner 2 34.0 586 Aluminium 197040.6 29.8 7.6 3.8 Schooner 2 34.0 586 209 Aluminium 197040.7 30.1 8.8 2.7 Ketch 2 Aluminium 199740.9 34.0 8.7 4.6 Sloop 1 Aluminium 200241.0 36.0 9.0 3.8 Sloop 1 Composite 199541.2 30.5 8.0 3.9 Ketch 2 Aluminium 199241.6 28.4 7.9 4.5 2.3 Ketch 2 Steel/Aluminium 200041.6 28.4 7.9 6.8 3.7 Ketch 2 Steel/Aluminium 200141.6 6.4 4.8 Sloop 1 Steel 200341.8 33.3 7.7 5.8 2.5 Ketch 2 Steel 198642.0 31.0 8.5 5.0 2.7 Ketch 2 Steel/Aluminium 2000
42.4 35.8 8.3 5.9 3.5 Sloop 1 Composite 200342.4 29.0 7.6 3.0 Schooner Composite 199542.4 34.8 8.9 4.9 Ketch 2 Aluminium 199042.4 33.0 8.7 4.5 Ketch 2 Aluminium 199842.4 37.9 9.5 Schooner 2 Carbon fibre 200342.6 28.4 7.9 4.9 2.7 Ketch 2 Steel/Aluminium 199942.9 35.2 8.8 7.0 4.8 Sloop 1 48.6 Aluminium 200242.9 35.2 8.8 4.1 Sloop 1 Aluminium 200443.0 35.0 8.3 5.9 3.5 Sloop 1 53.0 1041 152 Aluminium 200043.0 7.2 4.3 Gaff Schooner Steel 199243.1 35.2 8.6 4.2 Sloop 1 49.9 729 236 Aluminium 200143.1 35.2 8.6 4.3 Sloop 1 49.9 729 259 Aluminium 200143.4 32.3 8.8 6.0 2.5 Yawl 2 836 198743.4 32.3 8.8 6.0 2.5 Ketch 2 Steel/Aluminium 198843.4 32.3 8.8 6.0 2.5 Ketch 2 Steel/Aluminium 198743.4 33.5 8.8 5.9 2.6 Ketch 2 43.3 731 293 Steel, Aluminium 198743.4 33.5 8.8 5.9 2.6 Ketch 2 43.3 731 293 Steel, Aluminium 198743.6 35.2 9.0 4.6 Ketch 2 Aluminium 199243.6 37.9 9.0 2.0 Sloop 1 Aluminium 200244.7 38.1 9.1 4.5 Ketch 2 Carbon-fibre composite 199744.8 34.5 9.4 4.3 Ketch 2 Aluminium 200144.9 37.7 8.3 6.7 Sloop 1 Carbon 200345.0 35.6 8.9 4.4 7.7 Ketch 2 Steel 2003
45.0 36.5 7.4 3.8 Sloop 1 Wood 199345.7 35.8 9.2 4.3 Schooner 2 49.9 1100 306 Aluminium 2002
8/2/2019 Mca-Yates Research Project 534
http://slidepdf.com/reader/full/mca-yates-research-project-534 21/34
21
Table 1 continued
LOA LWL Beam DraftDraft
keel up Rig TypeNo.
MastsMastHt.
SailArea Disp. Hull contstruction
DateBuilt
45.9 34.8 9.2 6.2 Ketch 2 Steel 199046.0 30.2 7.9 4.8 Schooner Steel 199546.5 35.0 9.2 3.3 Ketch 2 Steel/Aluminium 199146.5 35.0 9.2 3.3 Ketch 2 Steel/Aluminium 199146.9 38.0 9.3 3.2 Ketch 2 Aluminium 198746.9 8.7 Ketch 2 Composite 200347.0 34.7 9.2 3.4 Ketch 2 Steel/Aluminium 199047.4 42.5 10.2 7.0 2.0 Sloop 1 200347.4 38.8 9.6 4.8 Sloop 1 Aluminium 199848.2 38.6 9.2 7.7 3.4 Ketch 2 Steel/Aluminium 199548.3 37.8 9.1 3.4 Ketch 2 Steel/Aluminium 199248.3 37.8 9.1 3.4 Ketch 2 Steel/Aluminium 199248.4 37.6 9.7 4.1 Ketch 2 Aluminium 199448.6 41.0 10.1 7.6 3.8 Cutter 1 59.4 1019 371 Aluminium 199849.0 29.3 8.2 5.3 Gaff Schooner Steel 200249.0 36.0 9.0 4.2 Staysail schooner Steel 198649.2 36.0 7.8 3.9 Schooner 3 Steel/Teak 198149.5 43.0 8.5 4.2 Schooner 3 Steel 199049.8 41.4 10.3 8.4 4.0 Ketch 2 Steel/Aluminium 200249.8 41.4 10.3 8.4 4.0 Ketch 2 Steel/Aluminium 200149.8 10.3 Ketch 2 Steel/Aluminium 199950.0 40.3 10.3 8.4 3.4 Ketch 2 Steel/Aluminium 200050.0 7.5 2.8 Ketch 2 Steel/Composite 199451.8 44.0 10.8 8.2 Ketch 2 Steel/Aluminium 199552.3 43.9 11.4 3.8 Ketch 2 Steel/Aluminium 1997
52.3 44.3 10.4 4.9 Ketch 2 57.8 1135 371 Aluminium 200252.3 44.3 10.4 5.1 Ketch 2 57.8 1135 423 Aluminium 200252.6 40.1 9.6 3.8 Lateen schooner 3 198853.0 44.1 11.4 3.8 Ketch 2 Steel/Aluminium 199853.0 44.5 11.4 8.3 3.9 Ketch 2 Steel/Aluminium 200053.0 44.8 10.1 4.7 Ketch 2 57.8 1114 374 Alloy/Aluminium 200253.0 44.8 10.1 4.9 Ketch 2 57.8 1114 419 Alloy/Aluminium 200253.8 44.1 10.7 4.5 Ketch 2 1300 438 Aluminium54.3 44.6 11.0 7.9 5.1 Sloop 1 408 Aluminium 200454.3 44.6 11.0 8.0 5.2 Sloop 1 62.5 1180 449 Aluminium 200454.6 38.4 9.5 4.8 2 62.0 1500 290 Aluminium 200555.6 49.8 11.5 3.8 Ketch 2 Aluminium 200455.7 45.9 11.5 9.6 3.8 Aluminium 200356.0 41.2 8.9 5.1 Schooner 3 43.0 1245 457 Steel 198358.0 45.5 10.4 2.0 Ketch 2 Aluminium 199058.0 46.7 11.5 3.6 Ketch 2 Steel/Aluminium 199464.0 51.1 12.7 9.4 4.1 Ketch 2 60.9 1520 690 Aluminium 200375.1 66.5 9.6 6.1 Schooner 4 1565 554 Steel 199975.2 61.0 14.8 10.0 3.9 Sloop 1 88.5 2137 Composite 200379.3 60.5 12.2 5.7 Schooner 3 60.0 2436 1080 Aluminium 200487.4 77.3 12.5 5.9 DynaRig 3 55.0 2396 1218 Steel 200692.9 68.0 13.5 5.5 Schooner 3 58.0 3060 1530 Aluminium 2006

8/2/2019 Mca-Yates Research Project 534
http://slidepdf.com/reader/full/mca-yates-research-project-534 22/34
22
Figure 1 Illustration of the size of yachts built in recent years
1980 1985 1990 1995 2000 2005 201035
45
55
65
75
85
95
Year Built
L e n g t h O v e r a l l - m e t r e s
Figure 2 Distribution of size within the fleet
0
5
10
15
20
25
30
35
40
45
50
35-40 40-45 45-50 50-55 55-60 60-65 65-70 70-75 75-80 80-85 85-90 90-95
Length overall - metres
N u m
b e r o f y a c h
t s
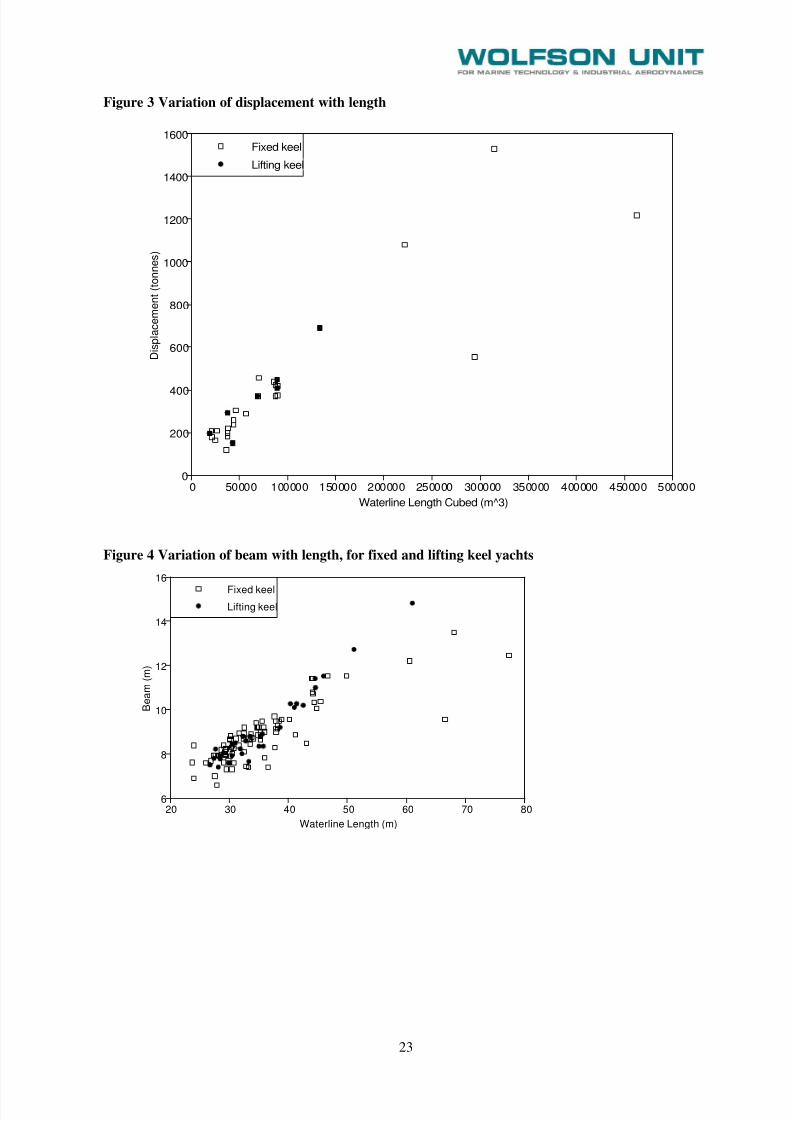
8/2/2019 Mca-Yates Research Project 534
http://slidepdf.com/reader/full/mca-yates-research-project-534 23/34
23
Figure 3 Variation of displacement with length
0 50000 100000 150000 200000 250000 300000 350000 400000 450000 5000000
200
400
600
800
1000
1200
1400
1600Fixed keel
Lifting keel
Waterline Length Cubed (m^3)
D i s p l a c e m e n t ( t o n n e s )
Figure 4 Variation of beam with length, for fixed and lifting keel yachts
20 30 40 50 60 70 806
8
10
12
14
16Fixed keel
Lifting keel
Waterline Length (m)
B e a m
( m )
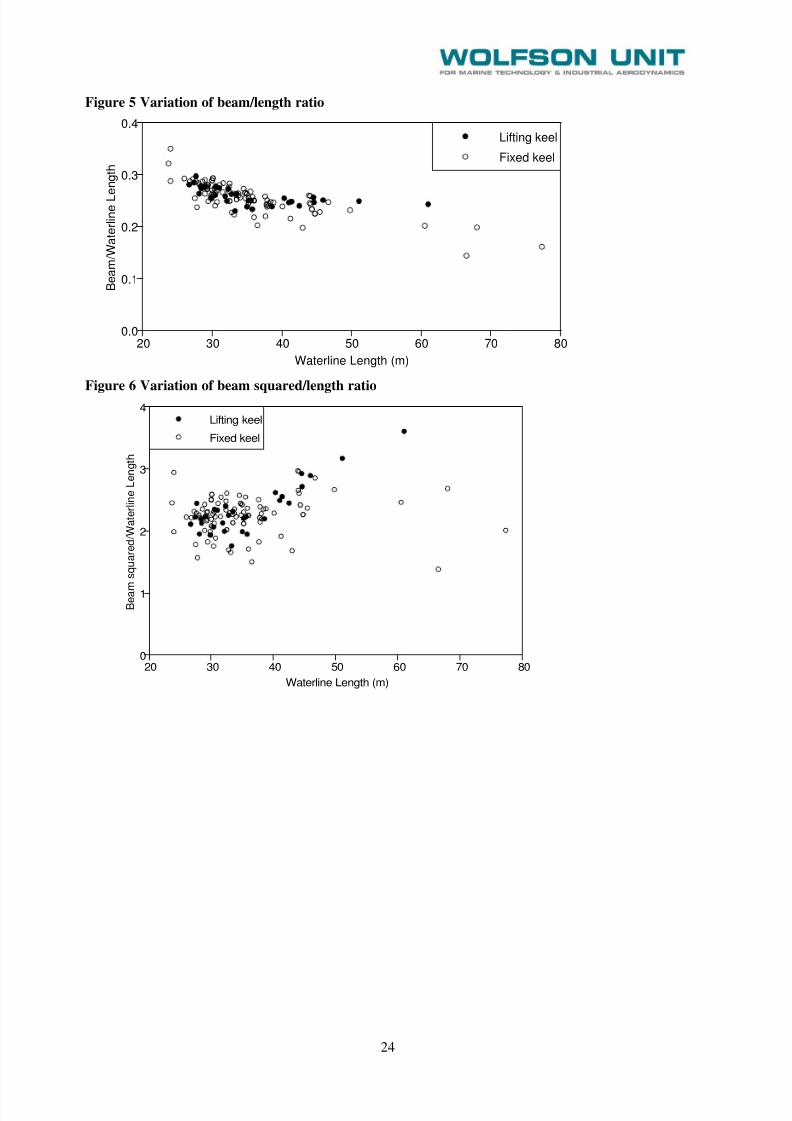
8/2/2019 Mca-Yates Research Project 534
http://slidepdf.com/reader/full/mca-yates-research-project-534 24/34
24
Figure 5 Variation of beam/length ratio
20 30 40 50 60 70 800.0
0.1
0.2
0.3
0.4Lifting keel
Fixed keel
Waterline Length (m)
B e a m
/ W a t e r l i n e
L e n g t h
Figure 6 Variation of beam squared/length ratio
20 30 40 50 60 70 800
1
2
3
4Lifting keel
Fixed keel
Waterline Length (m)
B e a m s q u a r e d / W a t e r l i n e
L e n g t h
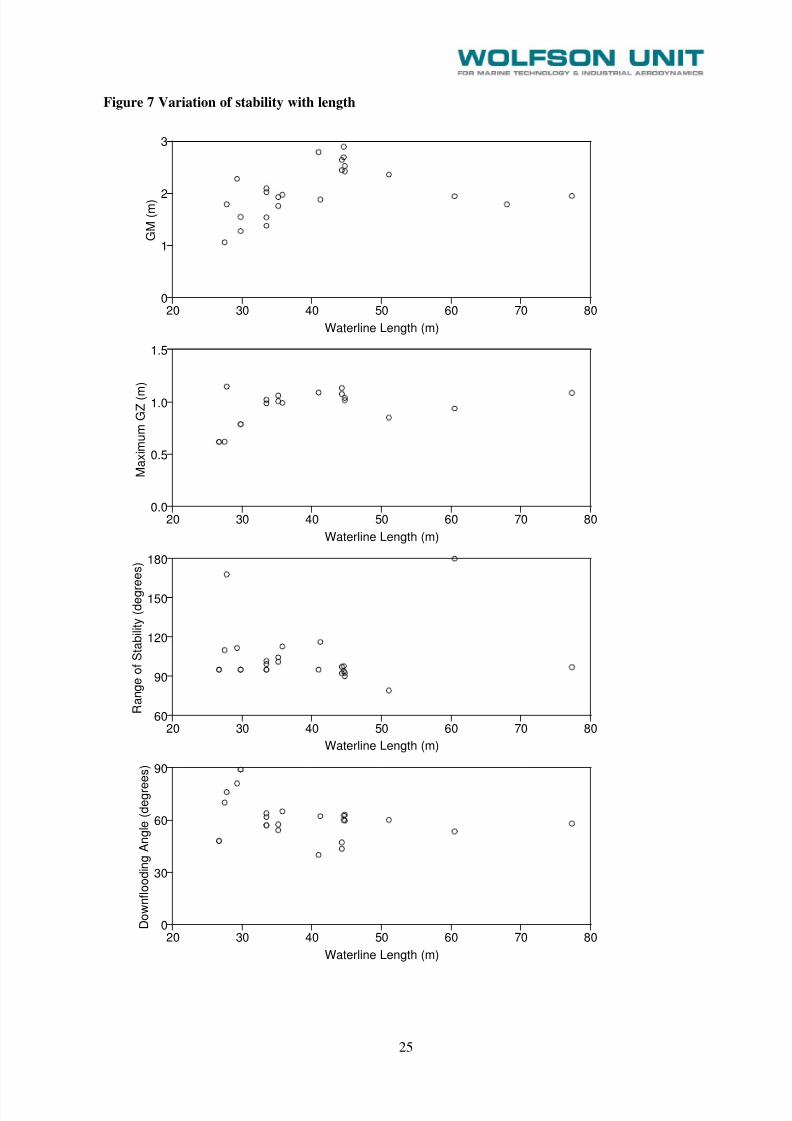
8/2/2019 Mca-Yates Research Project 534
http://slidepdf.com/reader/full/mca-yates-research-project-534 25/34
25
Figure 7 Variation of stability with length
20 30 40 50 60 70 800
1
2
3
20 30 40 50 60 70 800.0
0.5
1.0
1.5
20 30 40 50 60 70 8060
90
120
150
180
20 30 40 50 60 70 800
30
60
90
Waterline Length (m)
G M ( m )
Waterline Length (m)
M a x i m u m
G Z ( m )
Waterline Length (m)
R a n g e o f S
t a b i l i t y ( d e g r e e s )
Waterline Length (m)
D o w n f l o o d i n g
A n g l e
( d e g r e e s )
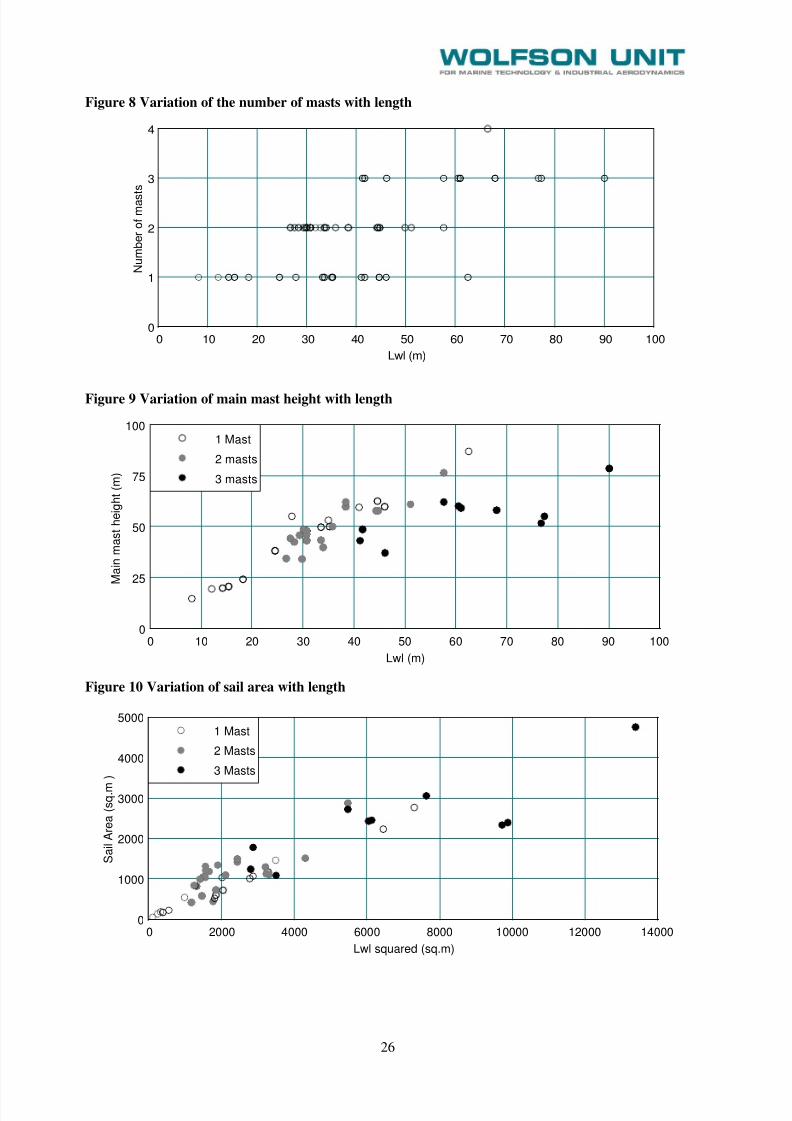
8/2/2019 Mca-Yates Research Project 534
http://slidepdf.com/reader/full/mca-yates-research-project-534 26/34
26
Figure 8 Variation of the number of masts with length
0 10 20 30 40 50 60 70 80 90 1000
1
2
3
4
Lwl (m)
N u m
b e r o f m a s t s
Figure 9 Variation of main mast height with length
0 10 20 30 40 50 60 70 80 90 1000
25
50
75
1001 Mast
2 masts
3 masts
Lwl (m)
M a i n m a s t h e i g h t ( m
)
Figure 10 Variation of sail area with length
0 2000 4000 6000 8000 10000 12000 140000
1000
2000
3000
4000
50001 Mast
2 Masts
3 Masts
Lwl squared (sq.m)
S a i l A r e a
( s q . m
)

8/2/2019 Mca-Yates Research Project 534
http://slidepdf.com/reader/full/mca-yates-research-project-534 27/34
27
Figure 11 Heeling force coefficient variation with length
0 10 20 30 40 50 60 70 80 90 1000.0
0.5
1.0
1.5
2.0
Lwl (m)
H e e l i n g
f o r c e c o e f f i c
i e n t
Figure 12 Centre of effort height variation with length
0 10 20 30 40 50 60 70 80 90 1000.0
0.2
0.4
0.6
Lwl (m)
C e n t r e o
f e f f o r t h e i g h t / m a s t h e i g h t
Figure 13 Heeling moment coefficient variation with length
0 10 20 30 40 50 60 70 80 90 1000.0
0.5
1.0Maximum for conventional rigs
Lwl (m)
H e e l i n g m o m e n t c o e f f i c i e n
t
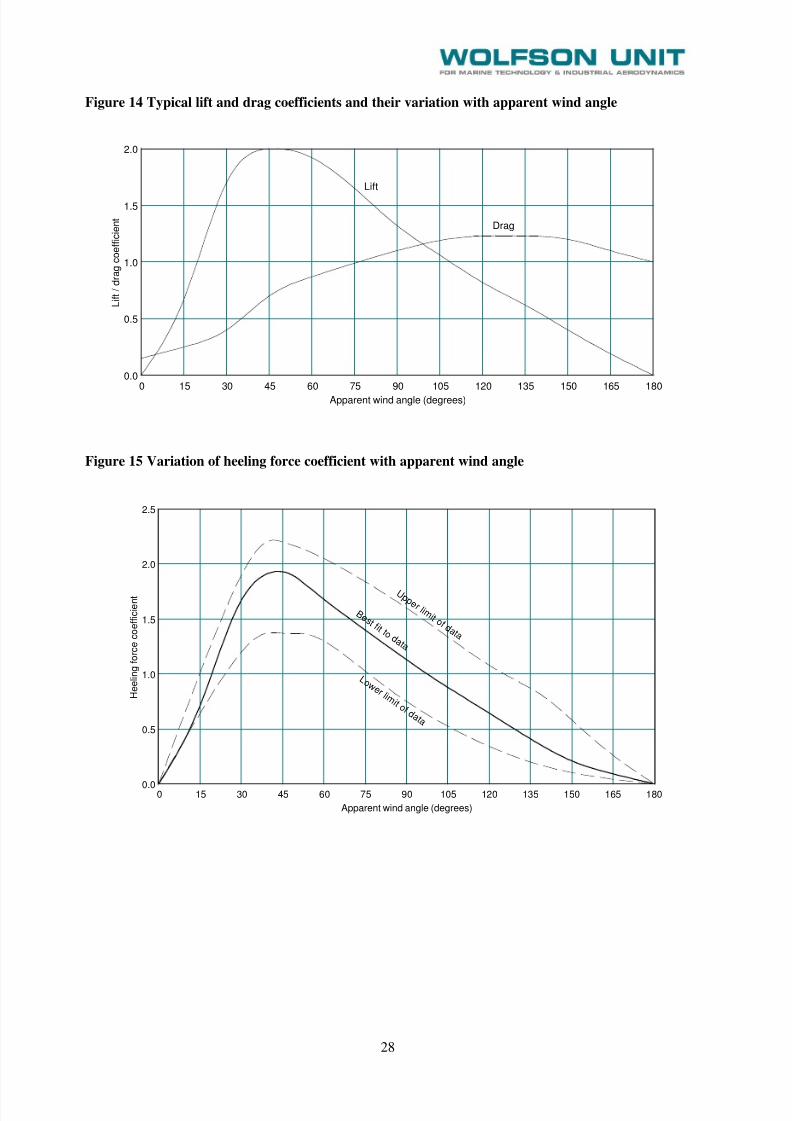
8/2/2019 Mca-Yates Research Project 534
http://slidepdf.com/reader/full/mca-yates-research-project-534 28/34
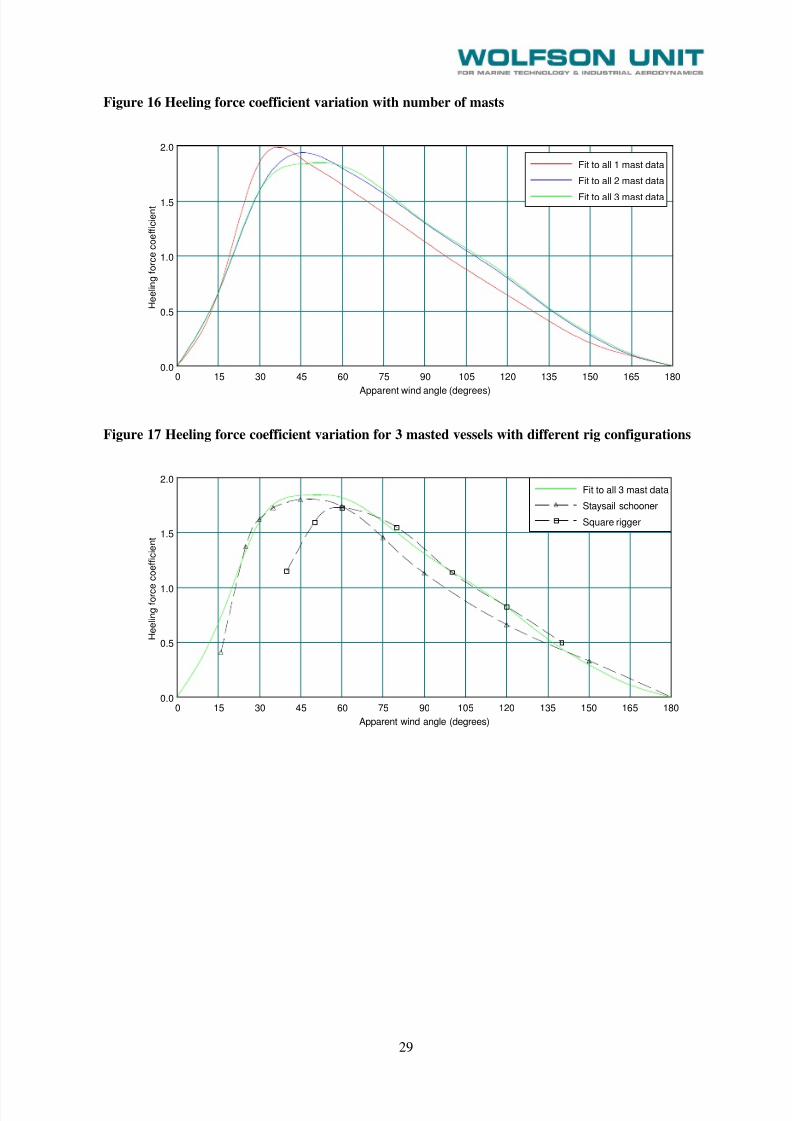
8/2/2019 Mca-Yates Research Project 534
http://slidepdf.com/reader/full/mca-yates-research-project-534 29/34
29
Figure 16 Heeling force coefficient variation with number of masts
0 15 30 45 60 75 90 105 120 135 150 165 1800.0
0.5
1.0
1.5
2.0
Fit to all 1 mast data
Fit to all 2 mast data
Fit to all 3 mast data
Apparent wind angle (degrees)
H e e l i n g
f o r c e c o e f f i c i e n t
Figure 17 Heeling force coefficient variation for 3 masted vessels with different rig configurations
0 15 30 45 60 75 90 105 120 135 150 165 1800.0
0.5
1.0
1.5
2.0Fit to all 3 mast data
Staysail schooner
Square rigger
Apparent wind angle (degrees)
H e e l i n g
f o r c e c o e f f i c i e n t
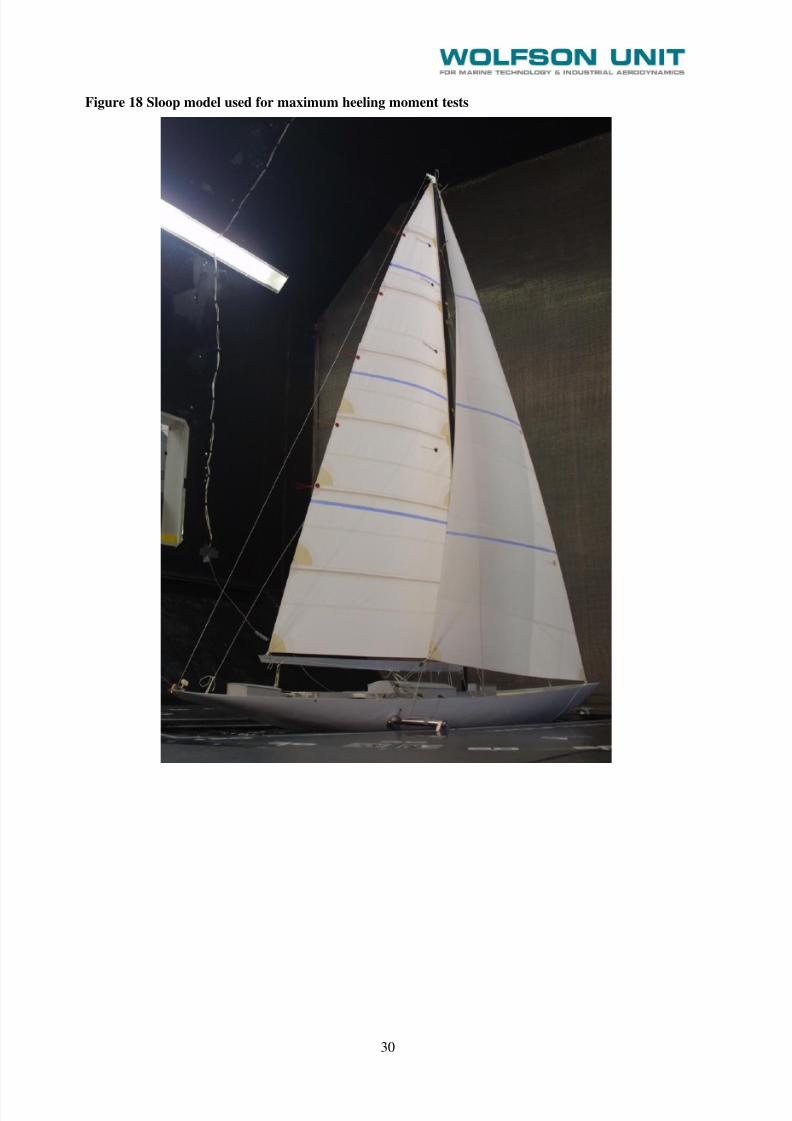
8/2/2019 Mca-Yates Research Project 534
http://slidepdf.com/reader/full/mca-yates-research-project-534 30/34
30
Figure 18 Sloop model used for maximum heeling moment tests
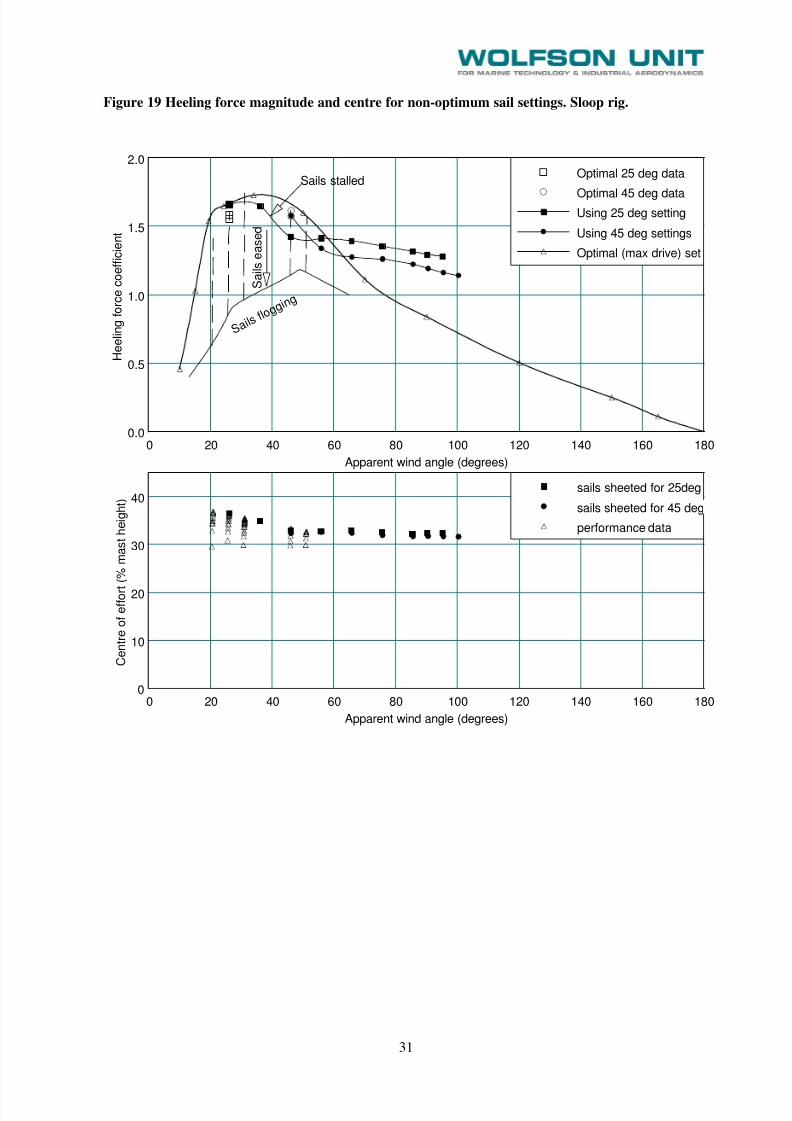
8/2/2019 Mca-Yates Research Project 534
http://slidepdf.com/reader/full/mca-yates-research-project-534 31/34
31
Figure 19 Heeling force magnitude and centre for non-optimum sail settings. Sloop rig.
0 20 40 60 80 100 120 140 160 1800.0
0.5
1.0
1.5
2.0
0 20 40 60 80 100 120 140 160 1800
10
20
30
40
Optimal 25 deg data
Optimal 45 deg dataUsing 25 deg setting
Using 45 deg settings
Optimal (max drive) set
sails sheeted for 25deg
sails sheeted for 45 deg
performance data
S a i l s f l o g
g i n g S a i l s e a s e d
Sails stalled
Apparent wind angle (degrees)
H e e l i n g
f o r c e c o e f f i c i e n t
Apparent wind angle (degrees)
C e n t r e o f e f f o r t ( %
m a s t h e i g h t )

8/2/2019 Mca-Yates Research Project 534
http://slidepdf.com/reader/full/mca-yates-research-project-534 32/34
32
Figure 20 Schooner model used for development of the Code requirements in 1989
Figure 21 Comparison of performance test data with those originally used to develop the Code.3 masted rig.
0 20 40 60 80 100 120 140 1600.0
0.5
1.0
1.5
2.0
set 30, 30 - 50
set 60, 55 - 80
set 75, 70 - 95
set 125, 90 - 140
set 150, 105 - 160
Optimum settings
Original research (1989) test data
Probable maximum by over sheeting
Possible maximum with wind shift
Performance Test Data
Apparent Wind Angle (degrees)
H e e l i n g
F o r c e
C o e f f i c i e n t
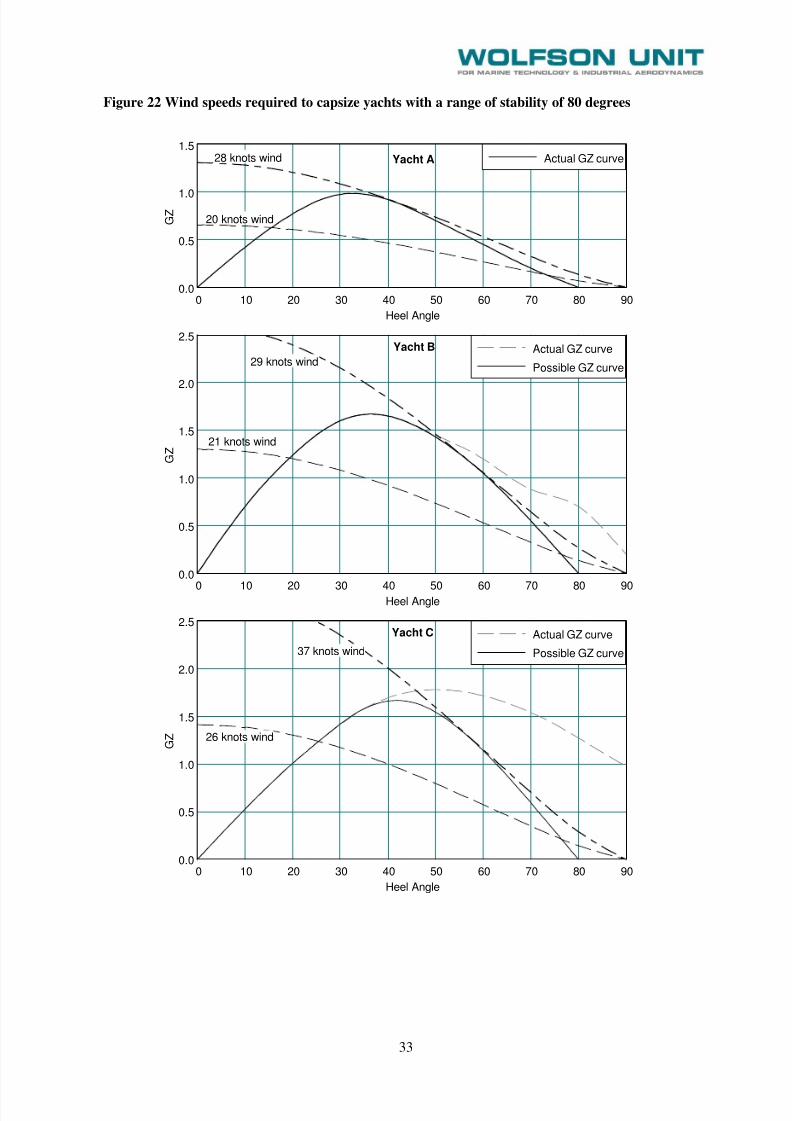
8/2/2019 Mca-Yates Research Project 534
http://slidepdf.com/reader/full/mca-yates-research-project-534 33/34
33
Figure 22 Wind speeds required to capsize yachts with a range of stability of 80 degrees
0 10 20 30 40 50 60 70 80 900.0
0.5
1.0
1.5
0 10 20 30 40 50 60 70 80 900.0
0.5
1.0
1.5
2.0
2.5
0 10 20 30 40 50 60 70 80 900.0
0.5
1.0
1.5
2.0
2.5
Actual GZ curve
Actual GZ curve
Possible GZ curve
Actual GZ curve
Possible GZ curve
Yacht A28 knots wind
20 knots wind
Yacht B
Yacht C
29 knots wind
21 knots wind
37 knots wind
26 knots wind
Heel Angle
G Z
Heel Angle
G Z
Heel Angle
G Z
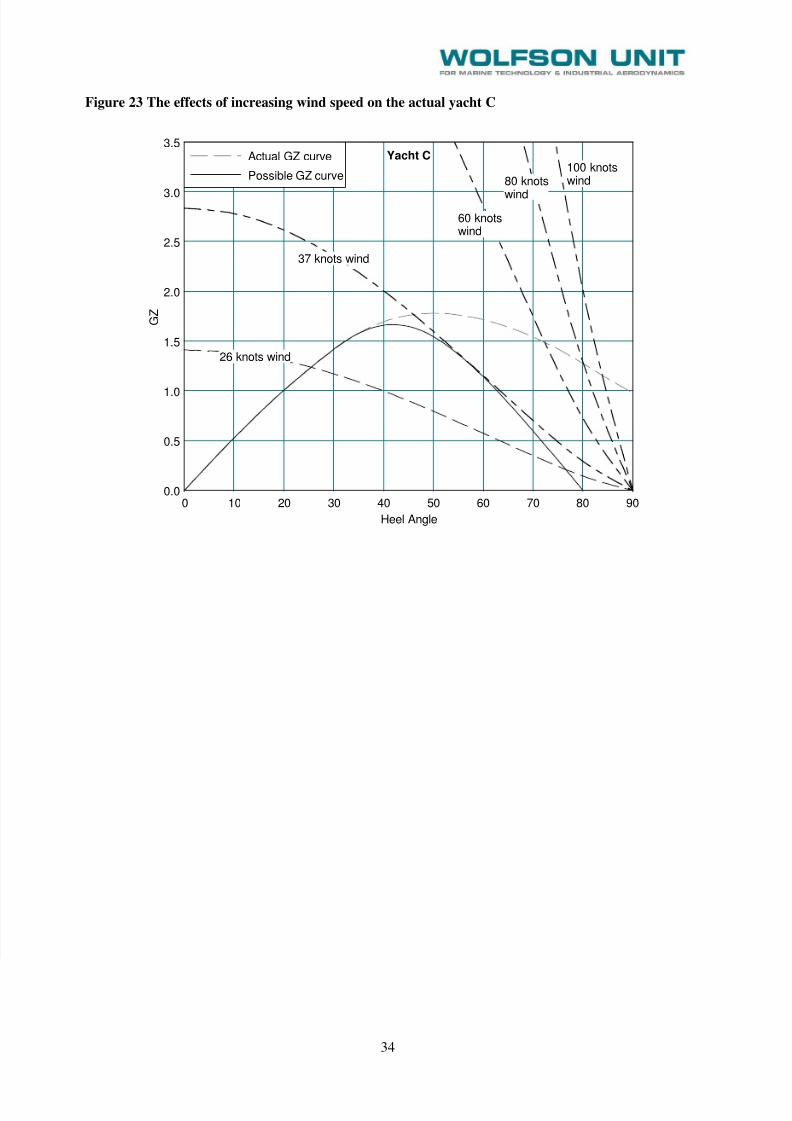
8/2/2019 Mca-Yates Research Project 534
http://slidepdf.com/reader/full/mca-yates-research-project-534 34/34
Figure 23 The effects of increasing wind speed on the actual yacht C
0 10 20 30 40 50 60 70 80 900.0
0.5
1.0
1.5
2.0
2.5
3.0
3.5Actual GZ curve
Possible GZ curve
26 knots wind
37 knots wind
60 knotswind
80 knotswind
100 knotswind
Yacht C
Heel Angle
G Z