mayor michael a. nutter
TRANSCRIPT
City of Philadelphia Mayor Michael A. Nutter
1
Tale of the Tape: 1984 to 2014
A Report of Data and Metrics Detailing the
Growth and Progress of the City of Philadelphia
Updated January 15, 2015

Table of Contents
Updated January 15, 2015
� Executive Summary (Slide 3) � Summary Tables by Mayoral Administration (Slides 4-5) � Public Safety (Slides 6-8) � Local Funding to the School District of Philadelphia (Slides 9-10) � Educational Attainment (Slide 11) � High School Graduation Rates (Slide 12) � Population Growth (Slide 13) � Jobs and Employment Rates in Philadelphia (Slides 14-15) � Jobs and Employment Rates of Philadelphia Residents (Slides 16-17) � Wage Tax Rates (Slide 18) � Poverty Rate (Slide 19) � Infant Mortality Rate (Slide 20) � Adult and Youth Smoking Rates (Slide 21) � Vaccination Rate (Slide 22) � General Obligation Bond Rating (Slide 23) � City Employee Totals (Slide 24)
2

Executive Summary
Updated January 15, 2015 3
This presentation captures key changes in Philadelphia over the last 30 years. The data shows that Philadelphia is experiencing extraordinary safety increases, generating significant new revenues for education, creating an environment for increased economic vitality, job growth, and employment, experiencing population growth, and improving the quality of life for many children and adults. These measures reflect the values and priorities of the Nutter Administration: public safety, education, jobs, tax policy and employment, quality of life, and fiscal integrity. This release of factual baseline data and information will help Philadelphians evaluate the progress of their city in various critical areas of concern, and utilize this information as new proposals and ideas are advanced in the future: � With significant reductions in murders and violent crime, as well as civilian fire fatalities, Philadelphians are safer. � Philadelphians are now better educated, and local funding to the School District of Philadelphia is at its highest point in 30 years. � Philadelphia is attracting and retaining residents, reversing trends from previous decades of decline. The city continues to grow in
population for the first time in 60 years. � Wage tax rates are at a 30 year low, and the number of jobs is growing. � Children in the city are considerably healthier, with reductions in infant mortality and smoking rates, and higher rates of
vaccinations. Nevertheless, Philadelphia has remaining challenges to address. Despite progress in recent years, the city's poverty rate continues to remain high and schools need additional funding in order for students to reach their potential. The City continues work to address the issues of literacy, incarceration, and crime to improve the quality of life for residents and visitors. This report shows that over time with consistent effort and a vision for the future, Philadelphia can make significant progress. Many of the positive gains that have been made over the past 7 years would not have been possible without the significant input, cooperation and support of Philadelphia City Council through their public policy input, or legislative and budgetary actions, and we thank Council for their focus on making Philadelphia better. We are proud of the gains over the last 7 years and we have more work to do.
Tale of the Tape Overview
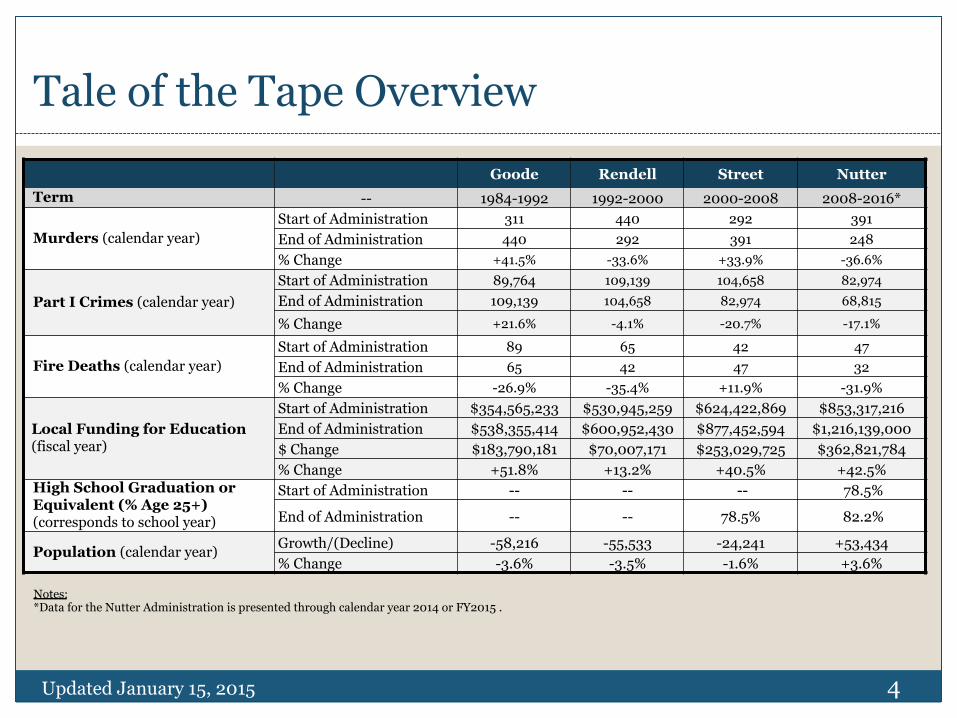
Goode Rendell Street Nutter Term -- 1984-1992 1992-2000 2000-2008 2008-2016*
Murders (calendar year) Start of Administration 311 440 292 391 End of Administration 440 292 391 248 % Change +41.5% -33.6% +33.9% -36.6%
Part I Crimes (calendar year) Start of Administration 89,764 109,139 104,658 82,974 End of Administration 109,139 104,658 82,974 68,815
% Change +21.6% -4.1% -20.7% -17.1%
Fire Deaths (calendar year) Start of Administration 89 65 42 47 End of Administration 65 42 47 32 % Change -26.9% -35.4% +11.9% -31.9%
Local Funding for Education (fiscal year)
Start of Administration $354,565,233 $530,945,259 $624,422,869 $853,317,216 End of Administration $538,355,414 $600,952,430 $877,452,594 $1,216,139,000 $ Change $183,790,181 $70,007,171 $253,029,725 $362,821,784 % Change +51.8% +13.2% +40.5% +42.5%
High School Graduation or Equivalent (% Age 25+) (corresponds to school year)
Start of Administration -- -- -- 78.5%
End of Administration -- -- 78.5% 82.2%
Population (calendar year) Growth/(Decline) -58,216 -55,533 -24,241 +53,434 % Change -3.6% -3.5% -1.6% +3.6%
4
Notes: *Data for the Nutter Administration is presented through calendar year 2014 or FY2015 .
Updated January 15, 2015

Tale of the Tape Overview, Continued
Updated January 15, 2015 5
Goode Rendell Street Nutter
Employment in Philadelphia (calendar year)
Growth/(Decline) -38,500 -10,600 -33,200 +4,164 % Change -5.1% -1.5% -4.8% +0.6%
Employment of Philadelphians (calendar year)
Growth/(Decline) -24,975 -17,736 -17,846 +10,061 % Change -3.8% -2.9% -3.0% +1.7%
Wage Tax (Residents) (fiscal year)
Start of Administration 4.960% 4.960% 4.614% 4.219% End of Administration 4.960% 4.614% 4.219% 3.920%
Wage Tax (Non-Residents) (fiscal year)
Start of Administration 4.313% 4.313% 4.011% 3.724% End of Administration 4.313% 4.011% 3.724% 3.492%
Poverty Rates (%) (calendar year)
Start of Administration -- -- 22.9% 24.1% End of Administration -- -- 23.8% 26.3%
Infant Mortality Rate (per 1,000 births) (calendar year)
Start of Administration 15.2 13.8 10.3 10.0
End of Administration 14.2 11.6 11.4 9.3
Childhood Immunization Rate (%) (calendar year)
Start of Administration -- 46.0% 77.0% 84.0% End of Administration 46.0% 83.0% 86.0% 89.0%
Bond Rating (Moody's) (calendar year)
Start of Administration Baa B Baa1 Baa1 End of Administration B Baa2 Baa1 A2
Notes: Data for the Nutter Administration is presented through calendar year 2014 or FY2015 .

Reduction in Murders and Part I Violent Crimes
6
Homicides Goode Rendell Street Nutter Term 1984-1992 1992-2000 2000-2008 2008-2016* Start of Administration (previous year) 311 440 292 391 End of Administration (last full year) 440 292 391 248 Change (%) +41.5% -33.6% +33.9% -36.6% Count Increase/Decrease: +128 -148 +99 -143
Part I Violent Crimes Goode Rendell Street Nutter
Start of Administration (previous year) 89,764 109,139 104,658 82,974
End of Administration (last full year) 109,139 104,658 82,974 68,815
Change (%) +21.6% -4.1% -20.7% -17.1% Count Increase/Decrease: +19,375 -4,481 -21,684 -14,159
*Note: The Nutter Administration’s end of administration data is from 2014. 2014 totals are preliminary and may change. Totals include incidents covered under a revised definition of rape Source: Philadelphia Police Department, January 2015
� Since the start of the Nutter Administration, the number of murders has declined by almost 37%, from 391 in 2007 down to 248 in 2014, and is at its lowest level since 1967.
� Violent crime has also declined since 2007. The number of Part I violent crime incidents (rape, robbery, murder, aggravated assault, theft, arson) has declined by 14,159 incidents or over 17%.
0
20,000
40,000
60,000
80,000
100,000
120,000
140,000
0
100
200
300
400
500
600
Tota
l Vio
lent
Cri
mes
Tota
l Mur
ders
Murders and Part I Violent Crimes
Total Murders
Violent Crime Totals
Updated January 15, 2015
Stability in Police Leadership Has Led to a Reduction in Crime
Updated January 15, 2015
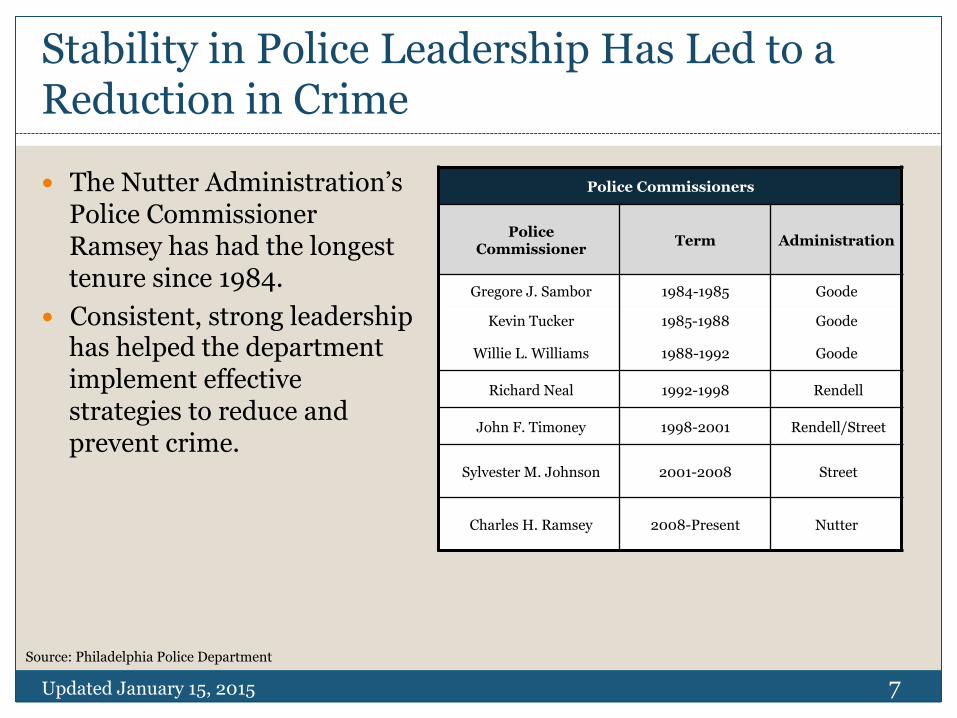
� The Nutter Administration’s Police Commissioner Ramsey has had the longest tenure since 1984.
� Consistent, strong leadership has helped the department implement effective strategies to reduce and prevent crime.
Police Commissioners
Police Commissioner Term Administration
Gregore J. Sambor 1984-1985 Goode
Kevin Tucker 1985-1988 Goode
Willie L. Williams 1988-1992 Goode
Richard Neal 1992-1998 Rendell
John F. Timoney 1998-2001 Rendell/Street
Sylvester M. Johnson 2001-2008 Street
Charles H. Ramsey 2008-Present Nutter
7 Source: Philadelphia Police Department

Fewer Civilians Have Suffered Fire Fatalities
Updated January 15, 2015
Fire Deaths Goode Rendell Street Nutter
Term 1984-1992 1992-2000 2000-2008 2008-2016*
Start of Administration (previous year) 89 65 42 47 End of Administration (last full year) 65 42 47 32 Change (%) -26.9% -35.4% +11.9% -31.9% Count Increase/Decrease: -24 -23 +5 -15
*Note: The Nutter Administration’s end of administration data is from 2014
89 85
100
88 78
104 103
70 65
89 85 77
90
51 62
46 42 51
45
32
44 45 52 52
47 39
30 33 32 25 24
32
0
20
40
60
80
100
120
1983
19
84
1985
19
86
1987
19
88
1989
19
90
1991
19
92
1993
19
94
1995
19
96
1997
19
98
1999
20
00
2001
20
02
2003
20
04
2005
20
06
2007
20
08
2009
20
10
2011
20
12
2013
20
14
Num
ber
of F
ire
Dea
ths
Civilian Fire Fatalities in Philadelphia � The number of
civilian fire deaths reached an all-time low under the Nutter Administration with 24 fatalities in 2013, down from a high of 104 in 1988.
8
City Taxpayer Funding to Schools Increased by over $360M – More Than At Any Time in the Last 30 Years
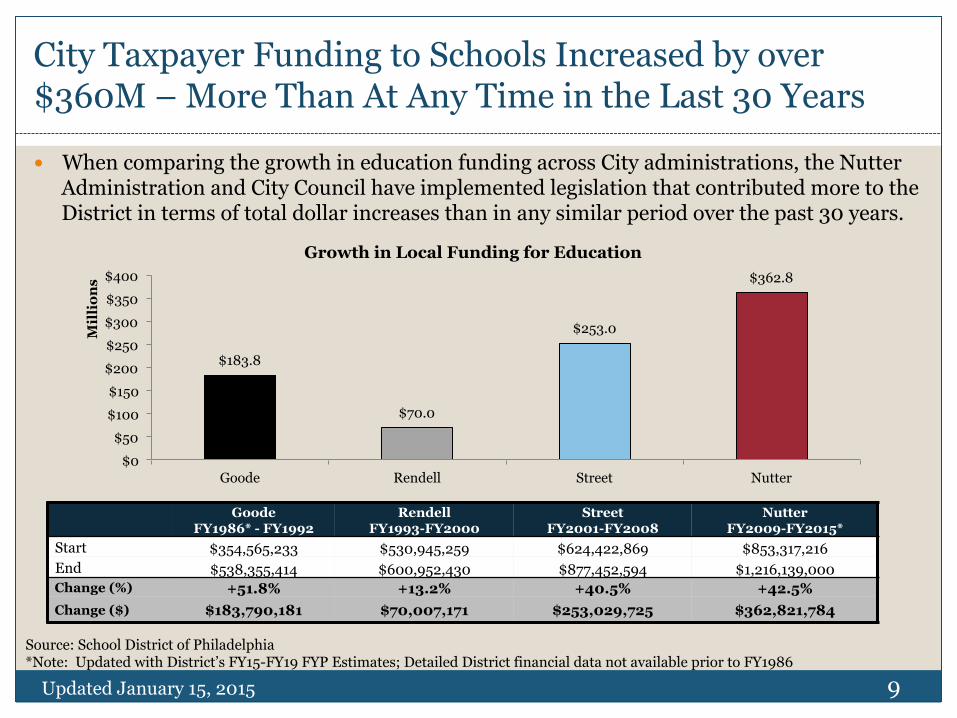
Goode FY1986* - FY1992
Rendell FY1993-FY2000
Street FY2001-FY2008
Nutter FY2009-FY2015*
Start $354,565,233 $530,945,259 $624,422,869 $853,317,216 End $538,355,414 $600,952,430 $877,452,594 $1,216,139,000 Change (%) +51.8% +13.2% +40.5% +42.5% Change ($) $183,790,181 $70,007,171 $253,029,725 $362,821,784
Source: School District of Philadelphia *Note: Updated with District’s FY15-FY19 FYP Estimates; Detailed District financial data not available prior to FY1986
� When comparing the growth in education funding across City administrations, the Nutter Administration and City Council have implemented legislation that contributed more to the District in terms of total dollar increases than in any similar period over the past 30 years.
9
$183.8
$70.0
$253.0
$362.8
$0 $50
$100 $150
$200 $250 $300 $350 $400
Goode Rendell Street Nutter
Mil
lion
s
Growth in Local Funding for Education
Updated January 15, 2015

City Taxpayer Funding to Schools Increased by over $360M since FY2009
Source: School District of Philadelphia Note: Excludes Federal funding; Detailed District financial data not available prior to FY1986
10
• Since 2009, the local funding increase is more than 100 times the State’s increase.
$183.8
$70.0
$253.0
$362.8
$196.7
$167.8
$384.2 $3.5
$0
$100
$200
$300
$400
$500
$600
$700
FY1986-FY1992 FY1993-FY2000 FY2001-FY2008 FY2009-FY2015
Mil
lion
s
Change in Operating Revenues by Source ($)
Total State
Total Local
Updated January 15, 2015

Gains in Educational Attainment
Updated January 15, 2015
� The percentage of Philadelphians who are high school graduates has increased from 78.4% to 82.2% since the start of the Nutter Administration.
� Over the same period, the percentage of individuals with a bachelor’s degree or beyond increased from 21% to 25.2%.
� The percentage of those with an associate’s degree or beyond has also grown from 26.5% to 30.2% since 2008.
11 Source: American Community Survey, 1-year estimates
78.4% 77.5%
79.3% 78.4%
81.1% 80.1%
80.9% 81.3% 82.2%
75% 76% 77% 78% 79% 80% 81% 82% 83%
2005 2006 2007 2008 2009 2010 2011 2012 2013
Population Age 25+ with High School Diploma
26.6% 26.6% 27.4% 26.5% 27.4% 27.4% 28.6% 29.7% 30.2%
21.6% 21.6% 21.1% 21.0% 23.2% 22.6% 23.6% 24.3% 25.2%
9.4% 9.4% 8.7% 9.1% 10.1% 9.8% 9.7% 9.7% 10.4%
0%
5%
10%
15%
20%
25%
30%
35%
2005 2006 2007 2008 2009 2010 2011 2012 2013
Educational Attainment for Population Age 25+ AA+, BA+, and Graduate Degrees
AA+ BA+ Graduate
Rising High School Graduation Rates in the School District of Philadelphia
Updated January 15, 2015
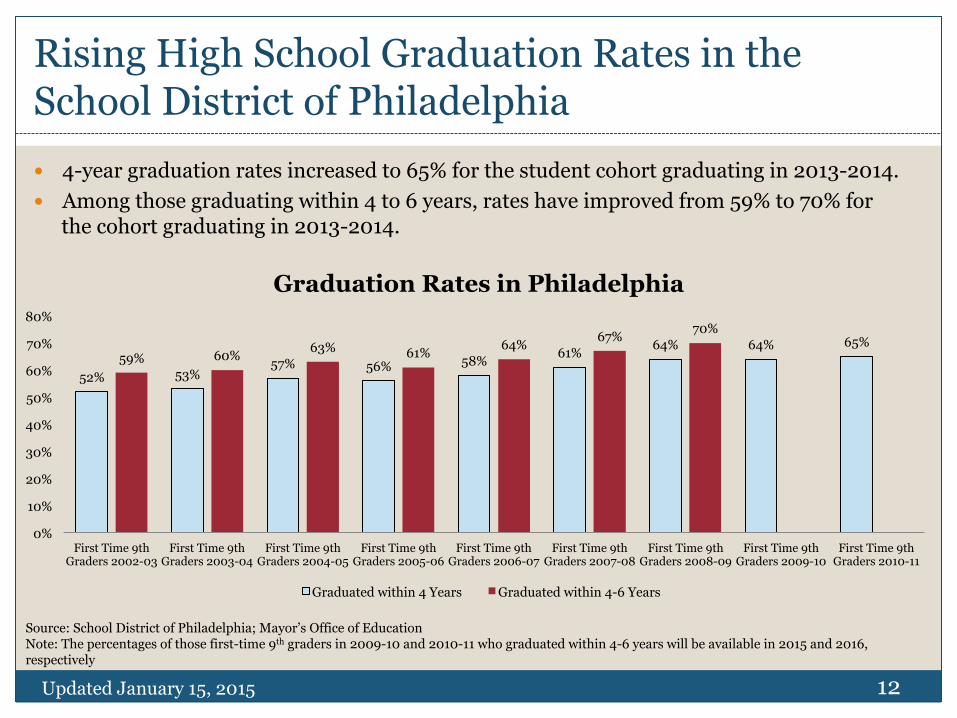
� 4-year graduation rates increased to 65% for the student cohort graduating in 2013-2014. � Among those graduating within 4 to 6 years, rates have improved from 59% to 70% for
the cohort graduating in 2013-2014.
Source: School District of Philadelphia; Mayor’s Office of Education Note: The percentages of those first-time 9th graders in 2009-10 and 2010-11 who graduated within 4-6 years will be available in 2015 and 2016, respectively
12
52% 53% 57% 56% 58% 61% 64% 64% 65%
59% 60% 63% 61% 64% 67% 70%
0%
10%
20%
30%
40%
50%
60%
70%
80%
First Time 9th Graders 2002-03
First Time 9th Graders 2003-04
First Time 9th Graders 2004-05
First Time 9th Graders 2005-06
First Time 9th Graders 2006-07
First Time 9th Graders 2007-08
First Time 9th Graders 2008-09
First Time 9th Graders 2009-10
First Time 9th Graders 2010-11
Graduation Rates in Philadelphia
Graduated within 4 Years Graduated within 4-6 Years
Population Growth for 7th Consecutive Year
Updated January 15, 2015
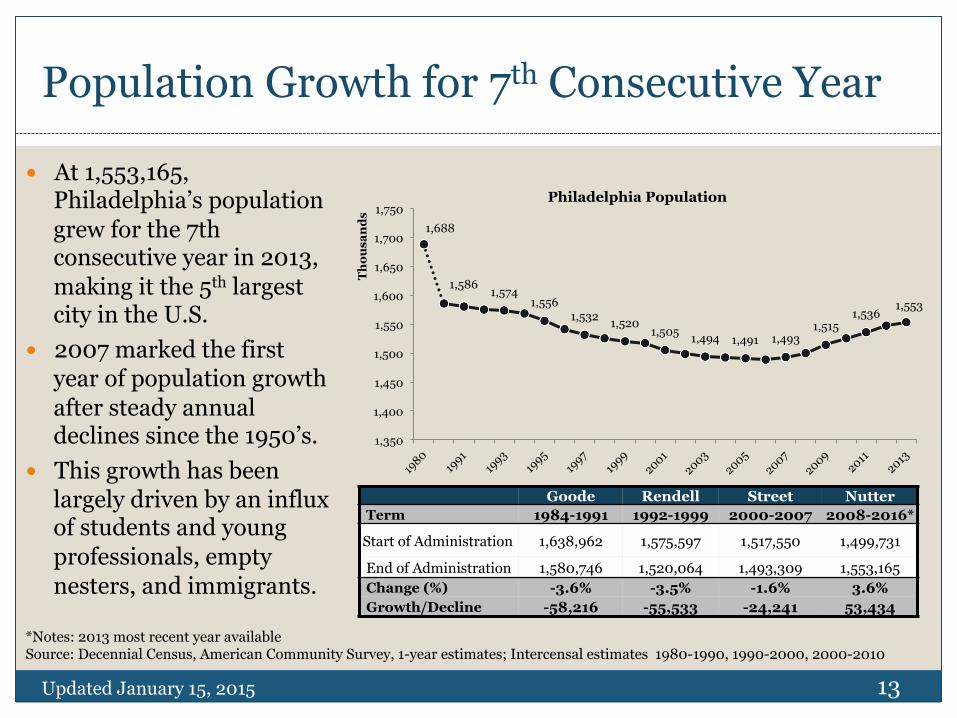
� At 1,553,165, Philadelphia’s population grew for the 7th consecutive year in 2013, making it the 5th largest city in the U.S.
� 2007 marked the first year of population growth after steady annual declines since the 1950’s.
� This growth has been largely driven by an influx of students and young professionals, empty nesters, and immigrants.
13
1,688
1,586 1,574 1,556
1,532 1,520 1,505 1,494 1,491 1,493
1,515 1,536
1,553
1,350
1,400
1,450
1,500
1,550
1,600
1,650
1,700
1,750
Thou
sand
s
Philadelphia Population
*Notes: 2013 most recent year available Source: Decennial Census, American Community Survey, 1-year estimates; Intercensal estimates 1980-1990, 1990-2000, 2000-2010
Goode Rendell Street Nutter Term 1984-1991 1992-1999 2000-2007 2008-2016*
Start of Administration 1,638,962 1,575,597 1,517,550 1,499,731
End of Administration 1,580,746 1,520,064 1,493,309 1,553,165 Change (%) -3.6% -3.5% -1.6% 3.6% Growth/Decline -58,216 -55,533 -24,241 53,434

Jobs and Employment Levels Are Recovering
Updated January 15, 2015
� In 2013, the total number of jobs in Philadelphia surpassed 2008 levels, the year before the effects of the great recession were felt in full force.
� To date, 2014 employment in Philadelphia is at the highest level since 2003.
14
*Note: 2014 represents year to date average through November Source: Bureau of Labor Statistics, State and Area Employment (establishment survey)
752 755 760 772 776
762 747
714 696 689 688
676 674 668 675
685 696
688 684 671
658 660 663 663 663 653 657 660 662 666 667
580
600
620
640
660
680
700
720
740
760
780
800
Jobs
in T
hous
ands
Job Growth and Decline (Establishment Employment)
Goode Rendell Street Nutter
-5.1%
-1.5%
-4.8%
0.6%
-6.0%
-5.0%
-4.0%
-3.0%
-2.0%
-1.0%
0.0%
1.0%
Goode 1984-1991
Rendell 1992-1999
Street 2000-2007
Nutter 2008-2016*
Change in Total Employment (%)
Jobs in Philadelphia: The Number of Jobs Is Increasing After Decades of Decline
Updated January 15, 2015
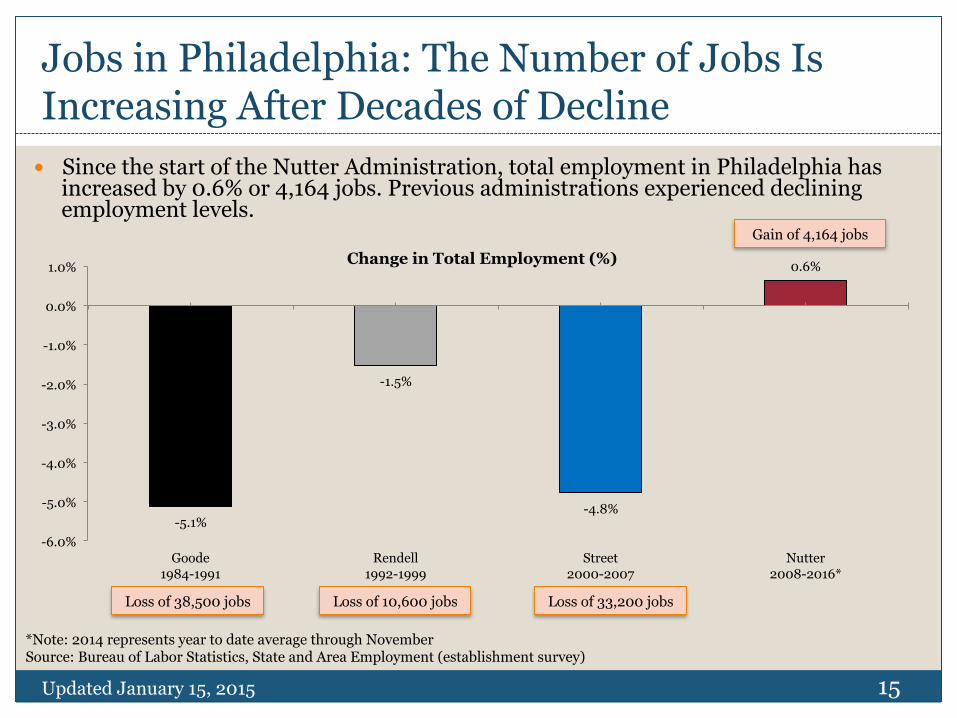
� Since the start of the Nutter Administration, total employment in Philadelphia has increased by 0.6% or 4,164 jobs. Previous administrations experienced declining employment levels.
15
*Note: 2014 represents year to date average through November Source: Bureau of Labor Statistics, State and Area Employment (establishment survey)
Loss of 38,500 jobs Loss of 10,600 jobs Loss of 33,200 jobs
Gain of 4,164 jobs
Employed Philadelphia Residents: Signs of Improvement
Updated January 15, 2015
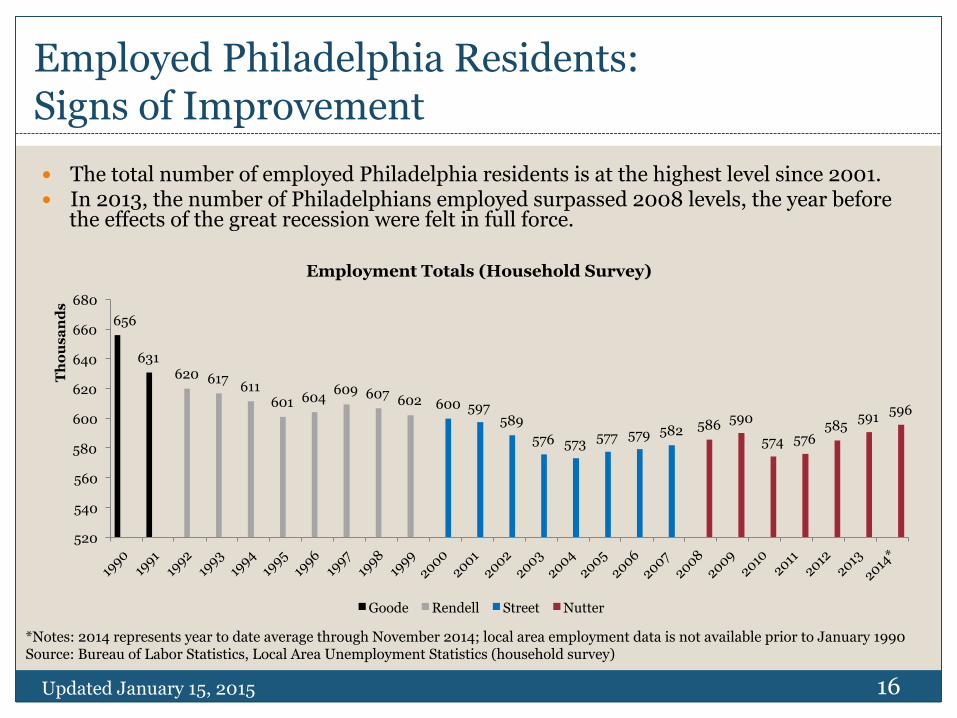
� The total number of employed Philadelphia residents is at the highest level since 2001. � In 2013, the number of Philadelphians employed surpassed 2008 levels, the year before
the effects of the great recession were felt in full force.
16
*Notes: 2014 represents year to date average through November 2014; local area employment data is not available prior to January 1990 Source: Bureau of Labor Statistics, Local Area Unemployment Statistics (household survey)
656
631 620 617 611
601 604 609 607 602 600 597 589
576 573 577 579 582 586 590 574 576
585 591 596
520
540
560
580
600
620
640
660
680
Thou
sand
s
Employment Totals (Household Survey)
Goode Rendell Street Nutter

-3.8%
-2.9% -3.0%
1.7%
-5.0%
-4.0%
-3.0%
-2.0%
-1.0%
0.0%
1.0%
2.0%
Goode 1990*-1991
Rendell 1992-1999
Street 2000-2007
Nutter 2008-2016*
Percentage Change in Employment (%)
Employed Philadelphia Residents: The Number of Jobs Has Begun to Increase
Updated January 15, 2015
� Since the start of the Nutter Administration, total employment of city residents has increased by 1.7% or by 10,061 jobs.
17
*Note: Local area employment data is not available prior to January 1990; 2014 represents year to date average through November 2014 Source: Bureau of Labor Statics, Local Area Unemployment Statistics (household survey)
Loss of 24,975 jobs Loss of 17,736 jobs Loss of 17,846 jobs
Gain of 10,061 jobs
Wage Tax Rates at 30 Year Lows
Updated January 15, 2015
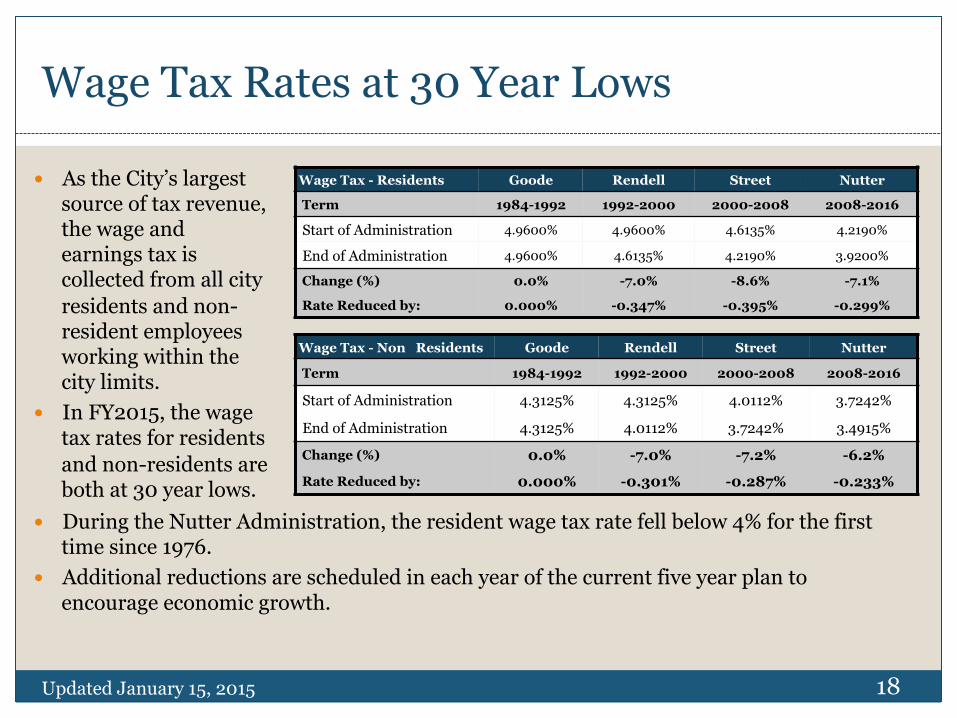
� As the City’s largest source of tax revenue, the wage and earnings tax is collected from all city residents and non-resident employees working within the city limits.
� In FY2015, the wage tax rates for residents and non-residents are both at 30 year lows.
18
Wage Tax - Residents Goode Rendell Street Nutter
Term 1984-1992 1992-2000 2000-2008 2008-2016
Start of Administration 4.9600% 4.9600% 4.6135% 4.2190%
End of Administration 4.9600% 4.6135% 4.2190% 3.9200%
Change (%) 0.0% -7.0% -8.6% -7.1%
Rate Reduced by: 0.000% -0.347% -0.395% -0.299%
Wage Tax - Non Residents Goode Rendell Street Nutter
Term 1984-1992 1992-2000 2000-2008 2008-2016
Start of Administration 4.3125% 4.3125% 4.0112% 3.7242%
End of Administration 4.3125% 4.0112% 3.7242% 3.4915%
Change (%) 0.0% -7.0% -7.2% -6.2%
Rate Reduced by: 0.000% -0.301% -0.287% -0.233%
� During the Nutter Administration, the resident wage tax rate fell below 4% for the first time since 1976.
� Additional reductions are scheduled in each year of the current five year plan to encourage economic growth.

Declining Poverty Rate
Updated January 15, 2015
� Philadelphia’s poverty rate has declined by 2.1% since its peak in 2011 but still remains above state and national rates.
� Over the last 30 years, the city’s poverty rate has consistently been higher than state and national levels.
Source: Decennial Census, American Community Survey, 1-year estimates
19
20.6% 20.3% 22.9%
24.5% 25.1% 23.8% 24.1% 25.0%
26.7% 28.4%
26.9% 26.3%
12.4% 13.1% 12.4% 13.3% 13.3% 13.0% 13.2% 14.3% 15.3% 15.9% 15.9% 15.8%
10.5% 11.1% 11.0% 11.9% 12.1% 11.6% 12.1% 12.5% 13.4% 13.8% 13.7% 13.7%
0%
5%
10%
15%
20%
25%
30%
1979 1989 2000 2005 2006 2007 2008 2009 2010 2011 2012 2013
Poverty Rate (%)
Philadelphia National PA
Infants are Surviving at Higher Rates than Ever
Updated January 15, 2015
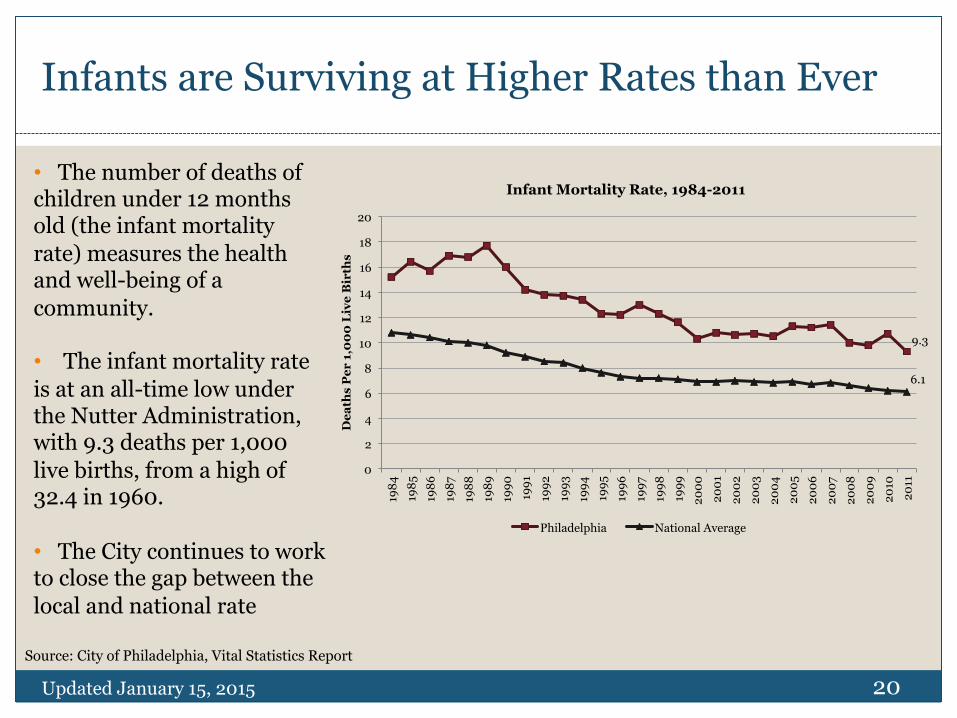
• The number of deaths of children under 12 months old (the infant mortality rate) measures the health and well-being of a community.
• The infant mortality rate is at an all-time low under the Nutter Administration, with 9.3 deaths per 1,000 live births, from a high of 32.4 in 1960.
• The City continues to work to close the gap between the local and national rate
20 Source: City of Philadelphia, Vital Statistics Report
9.3
6.1
0
2
4
6
8
10
12
14
16
18
20
1984
19
85
1986
19
87
1988
19
89
1990
19
91
1992
19
93
1994
19
95
1996
19
97
1998
19
99
2000
20
01
2002
20
03
2004
20
05
2006
20
07
2008
20
09
2010
20
11
Dea
ths
Per
1,0
00
Liv
e B
irth
s
Infant Mortality Rate, 1984-2011
Philadelphia National Average

Fewer Philadelphians Are Smoking
25.9% 24.8%
25.9% 25.9% 27.3%
25.2%
23.3%
19.5%
26.4% 28.5%
23.0%
15.8%
13.9%
10.7% 10.8% 9.6%
7.5%
0%
5%
10%
15%
20%
25%
30%
Smok
ing
prev
alen
ce
Adult Smoking
Youth Smoking
21
Adult and Youth Smoking Rates in Philadelphia
Sources: Youth Risk Behavior Surveillance System – youth in 9th-12th grade Public Health Management Corporation Household Health Survey – adults age 18 and over US Department of Health and Human Services, Office of the Surgeon General, “Preventing Tobacco Use Among Youth and Young Adults”
� According to the Surgeon General, the vast majority of Americans who begin daily smoking during adolescence are addicted to nicotine by young adulthood. Reducing the number of youth that smoke therefore has a significant impact on the number of adults that smoke.
� In Philadelphia,7.5% of youth were smoking in 2013 – the lowest rate in at least 20 years – compared to a high of 28.5% in 1997.
� Fewer adults are also smoking, although the change is much less dramatic.
Updated January 15, 2015

More Children Are Now Vaccinated against Preventable Diseases
Updated January 15, 2015
35 37 39 46 46 48
70 70
79 80 82 83 77 76 75
81 81 85 83
86 84 84 86 83 85
88 89
0
10
20
30
40
50
60
70
80
90
100
Per
cent
age
of C
hild
ren
19-3
4 m
onth
s of
age
*
Childhood Immunization Rate, 1988-2014
� In 2014, 89% of children in Philadelphia were vaccinated, compared with only 35% in 1988.
22

Improved General Obligation Bond Rating Indicative of Financial Progress
Updated January 15, 2015
� The City’s general obligation bond rating indicates credit quality and overall financial position.
� Changes in the ratings over time reveal periods of fiscal challenges as well as financial progress across administrations.
� In 2010, the Moody’s increased the City’s bond rating to A1 but this rating was reduced to A2 in the fall, over concerns about the City’s limited budgetary options in the midst of the recession.
� In 2013, S&P increased the City’s bond rating to A+, its highest level in 30 years, noting improved revenues and successful cost containment.
� For the first time, the City is rated in the ‘A’ category by all three rating agencies.
23
GO Ra&ng Moody's S&P Fitch 1984
Goode
Baa BBB+ -‐-‐ 1985 Baa BBB+ -‐-‐ 1986 Baa BBB+ -‐-‐ 1987 Baa BBB+ -‐-‐ 1988 Baa BBB+ -‐-‐ 1989 Baa BBB+ -‐-‐ 1990 B CCC -‐-‐ 1991 B CCC -‐-‐ 1992
Rendell
B B -‐-‐ 1993 Ba BB -‐-‐ 1994 Ba BB -‐-‐ 1995 Baa BBB-‐ -‐-‐ 1996 Baa BBB-‐ BBB-‐ 1997 Baa BBB BBB 1998 Baa2 BBB BBB+ 1999 Baa2 BBB BBB+ 2000
Street
Baa1 BBB A-‐ 2001 Baa1 BBB A-‐ 2002 Baa1 BBB A-‐ 2003 Baa1 BBB A-‐ 2004 Baa1 BBB BBB+ 2005 Baa1 BBB BBB+ 2006 Baa1 BBB BBB+ 2007 Baa1 BBB BBB+ 2008
Nu>er
Baa1 BBB BBB+ 2009 Baa1 BBB BBB 2010 A2 BBB A-‐ 2011 A2 BBB A-‐ 2012 A2 BBB+ A-‐ 2013 A2 A+ A-‐ 2014 A2 A+ A-‐
Investment Grade Ra&ngs
Aaa/AAA
Minimal Risk
Aa/AA Very Low Risk
A/A Low Risk
Baa/BBB Moderate Risk
Ba/BB SubstanJal Risk
B/B High Risk
Caa/CCC Very High Risk
Source: City Treasurer’s Office
Reducing the Size of City Government to Control Costs while Maintaining Critical City Services
Updated January 15, 2015
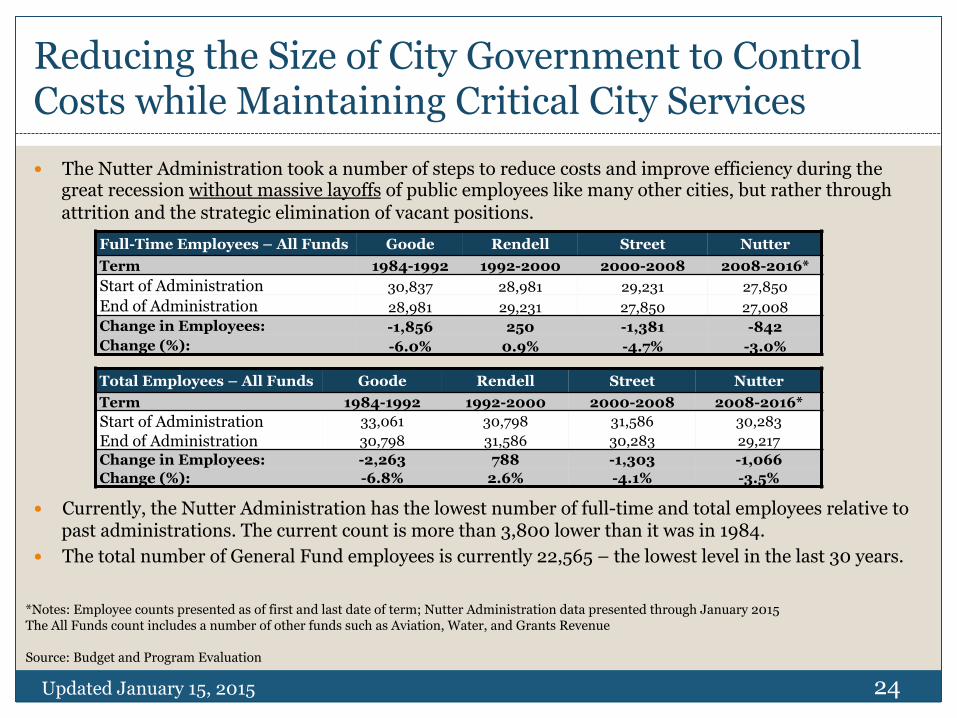
� The Nutter Administration took a number of steps to reduce costs and improve efficiency during the great recession without massive layoffs of public employees like many other cities, but rather through attrition and the strategic elimination of vacant positions.
� Currently, the Nutter Administration has the lowest number of full-time and total employees relative to past administrations. The current count is more than 3,800 lower than it was in 1984.
� The total number of General Fund employees is currently 22,565 – the lowest level in the last 30 years.
Total Employees – All Funds Goode Rendell Street Nutter Term 1984-1992 1992-2000 2000-2008 2008-2016* Start of Administration 33,061 30,798 31,586 30,283 End of Administration 30,798 31,586 30,283 29,217 Change in Employees: -2,263 788 -1,303 -1,066 Change (%): -6.8% 2.6% -4.1% -3.5%
Full-Time Employees – All Funds Goode Rendell Street Nutter Term 1984-1992 1992-2000 2000-2008 2008-2016* Start of Administration 30,837 28,981 29,231 27,850 End of Administration 28,981 29,231 27,850 27,008 Change in Employees: -1,856 250 -1,381 -842 Change (%): -6.0% 0.9% -4.7% -3.0%
24
*Notes: Employee counts presented as of first and last date of term; Nutter Administration data presented through January 2015 The All Funds count includes a number of other funds such as Aviation, Water, and Grants Revenue Source: Budget and Program Evaluation