may 2021 costs and performance of funds incorporating a
TRANSCRIPT

MAY 2021
COSTS AND PERFORMANCE OF FUNDS INCORPORATING A NON-FINANCIAL APPROACH MARKETED IN FRANCE BETWEEN 2012 AND 2018 PIERRE-EMMANUEL DARPEIX NATACHA MOSSON
amf-france.org

2/49
This study was coordinated by the Analysis, Strategy and Risk Division. It is based on sources that are considered to be reliable but whose comprehensiveness and accuracy cannot be guaranteed. The views expressed in “Risk and Trend Mapping” are those of the authors; they do not necessarily reflect the position of the AMF. Copying, distributing or reproducing this report, in full or in part, is subject to prior express written authorisation from the AMF.

3/49
Costs and performance of funds incorporating a non-financial approach marketed in France between 2012 and 20181
PIERRE-EMMANUEL DARPEIX AND NATACHA MOSSON
Executive summary
Environmental, social and governance (ESG) considerations attract increasing attention in public debate. In the corporate and financial sector, this has been reflected in particular by the emergence of the concepts of Corporate Social Responsibility (CSR), Socially Responsible Investment (SRI) and, more recently, sustainable finance. In practice, the non-financial characteristics of an investment are not always evident, and the nature of the requirements that fund managers claiming a non-financial approach set for themselves is highly variable, as was illustrated by the debates that preceded the publication of the AMF policy on the subject in the spring and summer of 2020. A number of labels have been adopted for asset management in order to establish quality standards in this approach (to combat "greenwashing") and to help investors find their way in the investment fund universe. At the same time, the fees paid by investors (and retail investors in particular) have been a recurring subject of interest in Europe. At the end of 2017, for example, the European Commission asked the three European supervisory authorities (ESAs) to prepare regular reports on the costs and performance of financial products distributed to retail clients, in order to promote transparency and enhance retail investors' confidence. We employed an updated version of the database used for the study on the costs and performance of employee investment undertakings (Darpeix and Mosson, 2019). This database (supplied by the data provider SIX Financial – Europerformance) covers 28,480 fund share classes marketed in France between 2012 and 2018. We used it to rank, in terms of costs and performance, fund share classes claiming a non-financial approach (either by a reference in the fund's name – according to a list of key words appended to this report – or by obtaining a French label, these two characteristics being assessed as of January 2021) by comparison with their conventional equivalents. The two methods do not identify the same funds. For example, 825 fund share classes in our sample claim non-financial characteristics in their name although they do not have a label. Conversely, 623 fund share classes have at least one label (ISR / Greenfin / Finansol) without this necessarily being obvious from the fund's name (NB: the aim of the study is in no case to verify the reality of the funds' claim to non-financial characteristics). We obtained precise information about the dates of each fund’s first labelling, but we do not know the historical evolution of the funds’ commercial names. In order to treat homogenously these two ways of referencing to a non-financial approach, we start by evaluating the “non-financial” nature (name or labelling) as of January 2021. We thus hypothesise initially that funds with a label or referring to non-financial features in their name in January 2021 had a different behaviour from their standard equivalents over the full period of study, that is between 2012 and 2018. Put another way, we analyse the historical cost and performance patterns (from 2012 to 2018) of the funds whose name included a non-financial reference in January 2021 or which had obtained a label at that time (we do not measure the impact of obtaining a label, nor that of changing name, on fees and performance). In a second step, we make use of the labelling dates to run a robustness check: the results from the preliminary analysis do not appear substantially modified, yet the previously mentioned limitations must be kept in mind when interpreting the regression tables.
1 The authors wish to thank Gunther Capelle-Blancard and Thierry Roncalli, members of the AMF’s Scientific Committee, for their comments and suggestions on earlier versions of this paper. They also thank the labels’ administrators, who kindly accepted to share additional information with them (in particular the dates of first labellisation). Obviously, potential errors or omissions are the sole responsibility of the authors.

4/49
To the extent that the consideration of non-financial criteria adds an extra analysis level for the fund manager (which could generate extra costs) and entails restrictions concerning the asset universe, it might have been feared that funds incorporating non-financial approaches would be more costly and would underperform their conventional equivalents. This is not what our preliminary results seem to indicate : generally, between 2012 and 2018, we find no significant difference in raw returns (not adjusted for risk), and we find that fund share classes taking non-financial criteria into consideration tended to cost less than the others. Indeed, all else being equal, a fund share class claiming in its name to incorporate non-financial criteria and having a label (as of Jan. 2021) was on average significantly less expensive, by 0.17 percentage points (i.e. 17 basis points, or bps), than an equivalent conventional fund share class over the period of analysis (after controlling for the specific features of each asset management company).
5/49
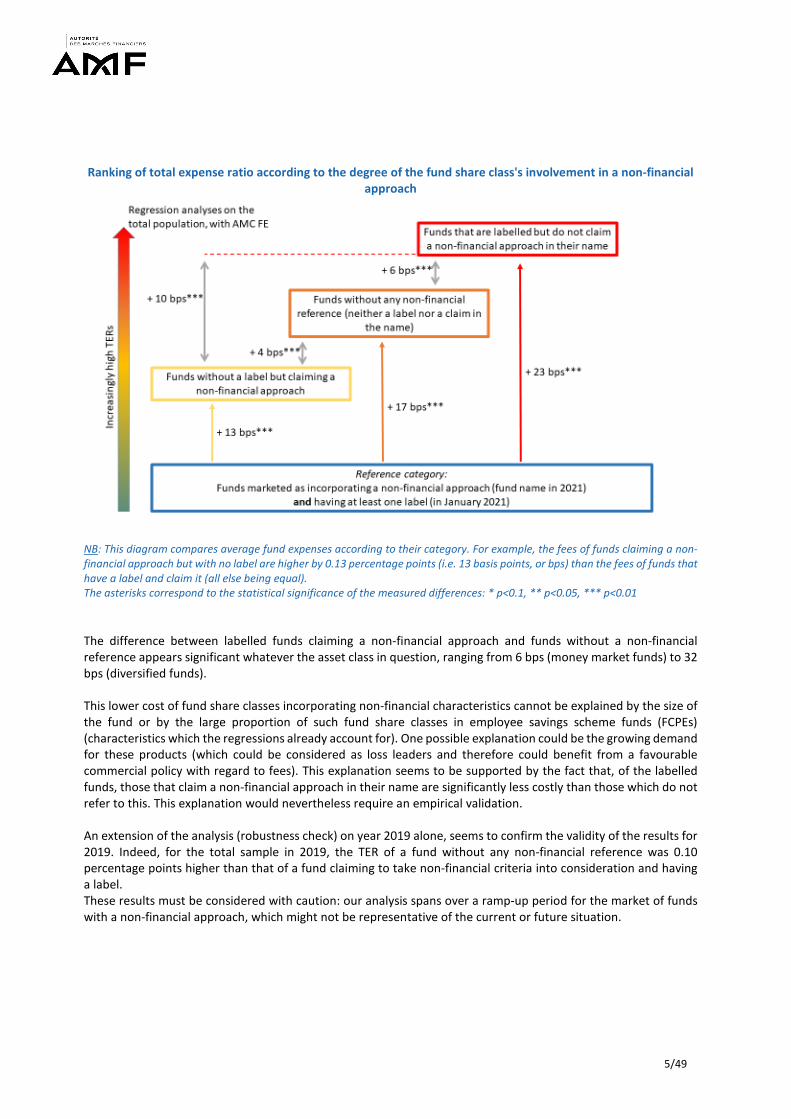
Ranking of total expense ratio according to the degree of the fund share class's involvement in a non-financial
approach
NB: This diagram compares average fund expenses according to their category. For example, the fees of funds claiming a non-financial approach but with no label are higher by 0.13 percentage points (i.e. 13 basis points, or bps) than the fees of funds that have a label and claim it (all else being equal). The asterisks correspond to the statistical significance of the measured differences: * p<0.1, ** p<0.05, *** p<0.01 The difference between labelled funds claiming a non-financial approach and funds without a non-financial reference appears significant whatever the asset class in question, ranging from 6 bps (money market funds) to 32 bps (diversified funds). This lower cost of fund share classes incorporating non-financial characteristics cannot be explained by the size of the fund or by the large proportion of such fund share classes in employee savings scheme funds (FCPEs) (characteristics which the regressions already account for). One possible explanation could be the growing demand for these products (which could be considered as loss leaders and therefore could benefit from a favourable commercial policy with regard to fees). This explanation seems to be supported by the fact that, of the labelled funds, those that claim a non-financial approach in their name are significantly less costly than those which do not refer to this. This explanation would nevertheless require an empirical validation. An extension of the analysis (robustness check) on year 2019 alone, seems to confirm the validity of the results for 2019. Indeed, for the total sample in 2019, the TER of a fund without any non-financial reference was 0.10 percentage points higher than that of a fund claiming to take non-financial criteria into consideration and having a label. These results must be considered with caution: our analysis spans over a ramp-up period for the market of funds with a non-financial approach, which might not be representative of the current or future situation.

6/49
In light of the growing importance of non-financial criteria, the greening efforts made by asset management companies, and the updating of AMF policy to distinguish funds whose approach is "significantly binding", it will be useful to conduct the study again and update it using more exhaustive databases. Our study constitutes a first attempt to shed light on the matter. The retrieval of cost data via an automated prospectus reading tool could make it possible to have an exhaustive view of the universe of French funds.
1. INTRODUCTION Private investors feel increasingly concerned by sustainable development issues: 87% assign importance to this, according to a survey carried out by Audirep in June 2019 for the AMF2 on a representative sample of the French population aged 18 and over. These concerns are reflected in savings decisions, with 53% of the persons surveyed indicating that they endeavoured to take sustainable development issues into consideration in their savings and investment decisions.3 In response to this interest, many asset management companies have sought to offer their clients investment funds taking non-financial criteria into account by incorporating environmental, social and governance characteristics in their investment strategies. This trend, which began a few years ago, has accelerated sharply in the past two years. Nevertheless, retail investors have a limited knowledge of socially responsible investments (SRI) and environmental, social and governance (ESG) criteria. For example, only 21% of those surveyed (16% respectively) have a knowledge of at least the basics of SRI (ESG respectively). Investors interested in these investments are also put off by the large number of strategies that may be deployed, which can make understanding and comparisons difficult. The consideration of these non-financial criteria may, indeed, take various forms, which are more or less restrictive. It may mean funds refusing any investment in a list of companies or sectors that are deemed incompatible (exclusion approach), rating companies on the basis of ESG criteria and allowing themselves to invest only in companies which, in each sector or in the investment universe, have obtained the highest score (best-in-class or best-in-universe approach), imposing minimum ESG scores on fund managers for their portfolios, with no limitations on the investment universe, or building thematic funds investing in a particular aspect of sustainable development, etc. Most responsible strategies also incorporate shareholder engagement practices on ESG themes, but these can also take various forms. Likewise, solidarity investment funds, which are a sub-category of funds incorporating a non-financial approach, can take two forms: profit-sharing investments, where at least 25% of the income (interest or dividends) is paid out to non-profit organisations in the form of donations, and solidarity investments, where at least 10% of savings are invested in Social and Solidarity Economy companies or organisations with a major social or environmental purpose. Moreover, the fund managers' consideration of non-financial criteria may be more or less ambitious.4 The survey carried out by the AMF highlights the fact that clearer and more comprehensive information would encourage 70% of the respondents to take a greater interest in responsible investments. In some cases, the approach implemented by the fund managers has a limited, or even a very limited impact on the investment strategy. This observation led the AMF to publish a policy in the spring of 2020 concerning the information to be provided by collective investment products incorporating non-financial 2 AMF (2019) French people and responsible investment. 3 Sustainable development issues seem to be taken into consideration above all in consumption habits (88% of respondents), in transport choices (79% of those surveyed) and in election choices (70% of respondents). 4 It is for these reasons in particular that the AMF enriched its policy in 2020 by publishing Position-Recommendation 2020-03 relating to the information to be provided by collective investment schemes incorporating non-financial approaches.

7/49
approaches intended for retail investors. This policy defines minimum standards for products wanting to communicate about the consideration of non-financial criteria.5 In order to establish quality standards and enable French savers to easily identify funds incorporating non-financial criteria, labels have gradually been introduced. As of 1997, the Finansol label was set up with the goal of promoting solidarity savings products. The trend gathered pace starting from 2015 with the creation of two new labels, the SRI label, presented as a tool for choosing responsible and sustainable investments, which was promoted by the French Ministry for the Economy and Finance, and the TEEC label ("Energy and Ecological Transition for the Climate", renamed Greenfin) promoted by the Ministry for the Ecological and Solidarity Transition.6 These labels are still not very well known by the general public: 16% of those surveyed in June 2019 stated that they had heard of the SRI label, and the equivalent figure was only 10% for the Greenfin label. In its report on sustainable finance in collective investment management published at the end of 2017, the AMF recommended that funds marketed to retail investors which stress a non-financial approach should obtain a label, but there is no such obligation at present, and so certain funds claiming that they incorporate non-financial criteria have no label. Perceptions of the returns and charges of funds incorporating a non-financial approach are very diverse. Again according to the survey conducted for the AMF, 36% of the respondents, for example, consider that responsible investments are costly. The question of the costs and performance of these investments is discussed in the academic literature even now, although the first studies on the subject appeared as early as the late 1980s. In theory, restrictions concerning the investment universe could lead to the construction of portfolios that are less diversified and suboptimal from a financial viewpoint, eroding performance by reducing returns and/or increasing the level of risk (standard portfolio choice theory). Indirectly, funds taking non-financial criteria into consideration could underperform conventional funds in the short term if it turned out that the financial results of companies that meet non-financial requirements are systematically inferior to those of other companies. It might be thought that companies incorporating ESG objectives incur additional costs (production and dissemination of non-financial information, costs of complying with standards) which might detract from their short-term performance, even if those costs improve their long-term performance. However, a growing number of studies have now shown that companies that are attentive to their social, societal and environmental responsibility appear to be more efficient and better managed (this hypothesis would be reflected by a superior performance of both the eligible securities and the portfolio manager). Moreover, investors who are looking for securities complying with non-financial criteria could be less demanding with regard to financial performance. For example, Starks et al (2017) show that the holders of securities incorporating non-financial criteria are less inclined to sell securities that have recently underperformed or posted disappointing returns.
5 Position-Recommendation 2020-03, updated in July 2020. 6 See the Greenfin label Criteria Guidelines (April 2019 version).

8/49
Table 1: Factors affecting the performance of the underlying securities and of funds highlighting non-financial
characteristics
Factors favourable to performance Factors unfavourable to performance
Improved risk management (consideration of additional risks)
Restrictions concerning the investment universe that could lead to the construction of portfolios
that are less diversified and suboptimal
Financial results of virtuous companies less satisfactory in the short term
Investors prepared to accept a weaker financial
performance
The existence of theoretical arguments and counter-arguments to explain the over- or under-performance of funds taking non-financial criteria into consideration is reflected in the diversity of the results obtained by empirical academic research. A meta-analysis performed on 85 studies was unable to exhibit a definite link between non-financial criteria and financial performance,7 whereas by a meta-analysis based on 2,200 studies, Friede et al (2015) tended to demonstrate a positive financial impact of the consideration of ESG criteria. 90% of the analyses highlighted a non-negative (i.e. positive or non-significant) relation between financial performance and the consideration of ESG criteria, and most of the analyses even showed a positive relation, stable over time.8 This diversity of results can be explained by the numerous investment strategies and procedures for inclusion of non-financial criteria that can be implemented by fund managers, which make the category of SRI and ESG funds very heterogeneous. It could also be explained by the conjunction of effects acting in opposite directions (Galema et al (2008)). This lack of a significant difference has been confirmed for funds marketed in France between 2004 and 2007.9 No over- or under-performance of funds incorporating a non-financial approach could be shown for this period, but the authors did show to what extent the conditions of the selection process affect funds' performance. For example, the number of exclusion criteria seemed to be negatively correlated to performance, since these criteria reduce the investable universe and hence the potential for diversification. Moreover, sector exclusion filters resulted in underperformance, whereas cross-cutting filters10 were neutral. In their analysis of US SRI equity funds between 1997 and 2005, Gil-Bazo et al (2010) showed that SRI funds outperformed their conventional equivalents, by between 0.96% and 1.83% annually before fees. However, they highlighted a difference between generalist asset management companies and those that have specialised in SRI: the SRI funds of the generalists seemed to underperform their conventional equivalents, whereas the SRI funds of the specialist companies posted an annual performance exceeding that of their conventional equivalents. Climent and Soriano (2011), for their part, concluded that US equity funds that are specifically environmental ("green" funds) did not post a weaker performance (adjusted for risk) than their conventional SRI equivalents between 1987 and 2009. 7 Revelli, C., & Viviani, J. L. (2015). Financial performance of socially responsible investing (SRI): what have we learned? A metaanalysis. Business Ethics: A European Review, 24(2), 158-185. 8 For an exhaustive comparison of the results taken from the academic literature, one can refer to the study by Friede et al (Table 1 of the article) or that by Revelli et al (Appendix A to the article). 9 Capelle-Blancard, G., & Monjon, S. (2014). The performance of socially responsible funds: does the screening process matter? European Financial Management, 20(3), 494-520. 10 Unlike sector exclusion filters, cross-cutting filters apply to all sectors. One very common example of a cross-cutting filter is compliance with the Universal Declaration of Human Rights.

9/49
However, it would seem that there has been strong outperformance by securities including non-financial characteristics in the recent period. For example, Bennani et al (2018) showed in the equity market that introducing ESG filters into the selection of portfolio securities had a neutral or even negative impact between 2010 and 2013. Conversely, buying best-in-class securities and selling worst-in-class securities of the euro area would have generated an excess annual return of 6.6% over the period 2014–2017. An update of the results to include the period from January 2018 to June 2019 confirmed these conclusions (Drei et al (2019)). A similar phenomenon has also been shown in the market for the best-rated European bonds (investment grade): Ben Slimane et al (2019) showed that the 2014–2019 period was favourable to ESG investments, unlike the 2010–2013 period. Very recently, in the course of an analysis of investment funds' performance during the Covid-19 crisis, Pastor and Vorsatz (2020) exhibited a positive correlation between fund performance and the ESG score assigned by Morningstar based on details of the securities in the portfolio. ESMA (2020) referred to two notes published by data providers showing that ESG funds were more resilient to the 2020 crisis than their conventional counterparts. Now turning to the issue of fees and costs, it is understandable that the establishment and monitoring of portfolios incorporating non-financial characteristics could entail extra costs for the fund managers, notably with regard to analysis of those criteria and access to new or additional data. Some authors, such as Christoffersen & Musto (2002) or Gil-Bazo, Ruiz-Verdú & Santos (2010), have also suggested that fund charges could be not merely due to passing on management operating costs, but could also take into account clients' sensitivity to performance so as to extract the highest possible fees from them. Supposing that the clients of "virtuous" funds are less driven by financial profit than other investors, fund managers could be tempted to increase their fees. Hartzmark & Sussman (2019) suggested two possible explanations for the higher net new money inflows to the US funds best rated by Morningstar with regard to non-financial criteria: investors' belief (not always confirmed) in a positive correlation between a fund's future performance and its non-financial rating, but also a non-financial motive such as altruism. What is more, from a marketing viewpoint, the bandwagon effect could enable asset management companies to increase fees for their "virtuous" funds, since Hartzmark & Sussman (2019) have shown that the US funds rated most highly by Morningstar with regard to non-financial criteria are preferred by investors at the expense of funds that are less highly rated. Finally, a good image could also justify higher fees. Gil-Bazo et al (2010) therefore posed the question as to whether fund investors taking non-financial criteria into consideration pay an explicit price for the ethical value of their investments. Conversely, products that incorporate a non-financial approach could prove to be good loss leaders for the asset management companies, and as such benefit from advantageous pricing policies. The view could also be held that the reduction in the universe of securities eligible in the portfolio allows fund managers to reduce their research costs and improve the quality of their financial research on the companies (which would also have the effect of increasing the portfolio's gross performance). Finally, one possible explanation is that responsible investment funds are more recent, and their lower fees are driven by current market conditions (the levels of fees of conventional funds may therefore be inherited from past practices of high margins).
10/49
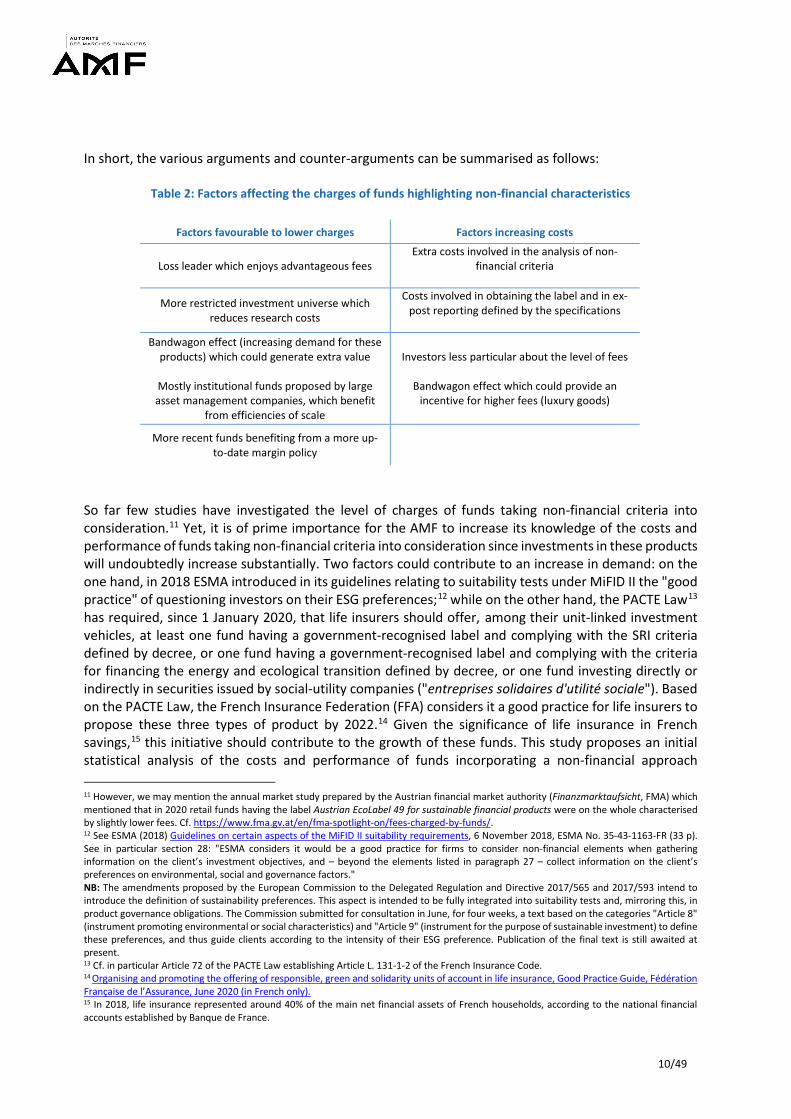
In short, the various arguments and counter-arguments can be summarised as follows:
Table 2: Factors affecting the charges of funds highlighting non-financial characteristics
Factors favourable to lower charges Factors increasing costs
Loss leader which enjoys advantageous fees Extra costs involved in the analysis of non-
financial criteria
More restricted investment universe which reduces research costs
Costs involved in obtaining the label and in ex-post reporting defined by the specifications
Bandwagon effect (increasing demand for these
products) which could generate extra value
Mostly institutional funds proposed by large asset management companies, which benefit
from efficiencies of scale
Investors less particular about the level of fees
Bandwagon effect which could provide an incentive for higher fees (luxury goods)
More recent funds benefiting from a more up-to-date margin policy
So far few studies have investigated the level of charges of funds taking non-financial criteria into consideration.11 Yet, it is of prime importance for the AMF to increase its knowledge of the costs and performance of funds taking non-financial criteria into consideration since investments in these products will undoubtedly increase substantially. Two factors could contribute to an increase in demand: on the one hand, in 2018 ESMA introduced in its guidelines relating to suitability tests under MiFID II the "good practice" of questioning investors on their ESG preferences;12 while on the other hand, the PACTE Law13 has required, since 1 January 2020, that life insurers should offer, among their unit-linked investment vehicles, at least one fund having a government-recognised label and complying with the SRI criteria defined by decree, or one fund having a government-recognised label and complying with the criteria for financing the energy and ecological transition defined by decree, or one fund investing directly or indirectly in securities issued by social-utility companies ("entreprises solidaires d'utilité sociale"). Based on the PACTE Law, the French Insurance Federation (FFA) considers it a good practice for life insurers to propose these three types of product by 2022.14 Given the significance of life insurance in French savings,15 this initiative should contribute to the growth of these funds. This study proposes an initial statistical analysis of the costs and performance of funds incorporating a non-financial approach 11 However, we may mention the annual market study prepared by the Austrian financial market authority (Finanzmarktaufsicht, FMA) which mentioned that in 2020 retail funds having the label Austrian EcoLabel 49 for sustainable financial products were on the whole characterised by slightly lower fees. Cf. https://www.fma.gv.at/en/fma-spotlight-on/fees-charged-by-funds/. 12 See ESMA (2018) Guidelines on certain aspects of the MiFID II suitability requirements, 6 November 2018, ESMA No. 35-43-1163-FR (33 p). See in particular section 28: "ESMA considers it would be a good practice for firms to consider non-financial elements when gathering information on the client’s investment objectives, and – beyond the elements listed in paragraph 27 – collect information on the client’s preferences on environmental, social and governance factors." NB: The amendments proposed by the European Commission to the Delegated Regulation and Directive 2017/565 and 2017/593 intend to introduce the definition of sustainability preferences. This aspect is intended to be fully integrated into suitability tests and, mirroring this, in product governance obligations. The Commission submitted for consultation in June, for four weeks, a text based on the categories "Article 8" (instrument promoting environmental or social characteristics) and "Article 9" (instrument for the purpose of sustainable investment) to define these preferences, and thus guide clients according to the intensity of their ESG preference. Publication of the final text is still awaited at present. 13 Cf. in particular Article 72 of the PACTE Law establishing Article L. 131-1-2 of the French Insurance Code. 14 Organising and promoting the offering of responsible, green and solidarity units of account in life insurance, Good Practice Guide, Fédération Française de l’Assurance, June 2020 (in French only). 15 In 2018, life insurance represented around 40% of the main net financial assets of French households, according to the national financial accounts established by Banque de France.

11/49
distributed in France, and the positioning of these funds relative to the rest of the market. The remainder of the study is organised as follows: section 2 describes the database used, presenting descriptive statistics and commenting on the representativeness of the sample; section 3 proposes an econometric analysis of the differences in costs and performance, and section 4 concludes.
2. DESCRIPTION OF THE DATA
2.1. DATABASE CONSTRUCTION
The database is the same as the one that we used in 2019 for the study on the costs and performance of employee investment undertakings,16 except that it has been updated to include the year 2018: the analysis period therefore covers the years 2012 to 2018. At the start of 2021, another update of the database was requested from the data provider Six Financial – Europerformance to include the year 2019. However, this data provider seems to have significantly improved the coverage of its database, which has led to a big increase in the fund universe between the database covering the years 2012-2018 and the 2019 extension. As a consequence, the historical panel analysis will be performed over the period 2012–2018 and the data for 2019 will be used for a robustness check: they are analysed separately to confirm the stability of the results (see section 4). The database used contains French fund share classes, but also foreign fund share classes sold in France. For these fund share classes, we distinguish between:
- Fund share classes claiming non-financial characteristics (whether or not they have a label) by means of a key word search on the fund name (the list of key words searched for is available in Annex 1);
- Fund share classes having the SRI label; - Fund share classes having the Greenfin (GF) label; and - Fund share classes having the Finansol (FS) label.
One of the limits that we faced concerns the lack of public data relating to funds' date of certification. The label websites generally merely give a list of labelled funds at a given date (in this case January 2021). However, we were able to obtain this information through a specific request sent to each label administrator. Regarding the fund names, on the other hand, we had no information concerning their history and possible changes. We therefore assumed that the funds had not changed their name during the period covered by the study and we adopted the fund name documented in January 2021. To ensure consistency between the various metrics used (invariant fund name, time-dependent labelling), we assumed initially that the funds that were currently labelled were labelled throughout the entire study period (assuming that they were already ‘virtuous’ before their certification, or even before the creation of the labels). Put another way, we studied the costs and historical performance of funds that were labelled in January 2021 by comparison with other funds. The fund labelling dates are used subsequently section 4 to test the robustness of the results. One will have to bear in mind these strong hypotheses when interpreting the following results, which must be considered preliminary at this stage.
16 Darpeix, P.-E., & Mosson, N. (2019). Costs and performance of employee savings scheme funds. AMF Risk and Trend Mapping.

12/49
2.2. SAMPLE REPRESENTATIVENESS (2012-2018 PERIOD)
In this part we investigate the representativeness of the sample with regard to the three labels,17 since the representativeness regarding French and foreign fund share classes as a whole has already been analysed in Darpeix and Mosson (2019). As a reminder, the coverage of the SIX database is better than that of Lipper for employee savings scheme funds (FCPEs) but less satisfactory for foreign funds marketable in France. The two commercial databases have a relatively similar coverage rate for French funds (at end-2017, the AMF listed 11,738 fund share classes versus 6,554 for SIX and 6,779 for Lipper).18
Table 3: Number of labelled funds present in the database19
Number of labelled funds (fund share classes) in
January 202120
Of which funds present in the database (in December
2018)
Of which fund share classes present in the
database (in December 2018)
SRI label 629 (Unknown number of fund share classes)
550 1,515
Greenfin label 26 (174 fund share classes) 19 67 Finansol label 83 (136 fund share classes) 49 74
Source: SIX Financial, SRI Label, Ministry for the Ecological and Solidarity Transition, Finansol, AMF 87% of the funds having the SRI label in January 2021 were present in our database, compared with 73% for the Greenfin label and only 59% for funds having the Finansol label. However, it should be noted that our database details the various fund share classes of each fund, and we have assumed that all the fund share classes had the label when the fund had one, which is why our database lists 1,515 fund share classes having the SRI label, 74 fund share classes having the Finansol label and 67 fund share classes having the Greenfin label. Finally, as a reminder, since there is no exhaustive information on the history of the fund's name, we assumed that the name documented in January 2021 (and the labelling characteristics at that date, at least initially) were invariant throughout the analysis period. Another way of presenting things is to say that we studied the historical performance and costs of funds which had a label (or claimed a non-financial approach in their name) as of January 2021.
2.3. ANALYSIS OF THE NUMBER OF FUND SHARE CLASSES (2012-2018 PERIOD)
Our initial database comprises 31,930 fund share classes (French and foreign). The funds are not all present throughout the study period: some were created, while others disappeared. They were all kept in the sample but they were not necessarily present throughout the study period, which explains why there are only slightly less than 22,000 fund share classes at most in a given year. However, the presence of a fund share class in a given year does not necessarily mean that there are exhaustive data for that year. We therefore chose, for each year, to keep only the fund share classes reporting at least one cost data item or one performance data item. We therefore describe only the sample of fund share classes
17 For a more comprehensive view of the number of labelled funds among the French funds, refer to the overview of labels in the third AMF report on non-financial approaches in collective investment management (December 2020). 18 It should be mentioned that the SIX database (like the Lipper database) focuses on funds for which there is an effective marketing drive (i.e. excluding funds closed to new subscriptions) in France, which could partly explain why it does not cover all French funds. 19 Two main reasons can explain the difference: first, the SIX database is not exhaustive (like the other commercial databases, SIX retrieves the marketing documents posted online, or receives information from the market players); and second, the lists of labelled funds provided by the certification organisations are not necessarily associated with clear IDs (ISIN code or precise name). 20 The information provided by the Greenfin and Finansol labels give details concerning the labelled fund share classes, unlike the SRI label which indicates an ISIN code for each labelled fund.

13/49
that can be included in the regression analyses of costs or performance. This choice reduces the sample of fund share classes differently depending on the year (Table 4).
Table 4: Number of fund share classes referenced and number of fund share classes selected
Number of fund share classes referenced in the
database
Number of fund share classes having sufficient
data for analysis 2012 2013 2014 2015 2016 2017 2018
19,859 20,634 20,335 20,396 20,656 19,416 21,873
16,358 15,728 15,038 14,156 13,465 13,129 19,442
Source: SIX Financial, AMF The data's completeness seems to have improved significantly in 2018, because only 11% of the observations had to be removed, versus 35% in 2016. For the remainder of the analysis we therefore select 28,480 fund share classes, breaking down as follows:
Table 5: Number of fund share classes marketable in France each year21
Fund share classes incorporating non-
financial characteristics (by claim or labelling)
Fund share classes claiming a
non-financial approach in their
name (with or without a label)
Fund share classes having
at least one label (with or
without claim)
Fund share classes
having the SRI label
Fund share classes
having the Greenfin
label
Fund share classes
having the Finansol
label
Total fund share classes marketed in
France
2012 2013 2014 2015 2016 2017 2018
1,089 1,048 1,055 1,039 1,052 1,087 1,661
750 702 707 691 703 717
1,066
588 602 608 607 614 662
1,057
545 558 564 563 566 610 991
10 10 10 10 15 21 34
46 47 47 47 46 46 63
16,358 15,728 15,038 14,156 13,465 13,129 19,442
Source: SIX Financial, AMF For the remainder of the analysis, the fund share classes designated as incorporating non-financial criteria are the fund share classes that claim non-financial characteristics in their fund's name and/or fund share classes having a label (the two criteria being observed as of January 2021). Regarding Table 5, we can make the following observations:
- The number of fund share classes claiming a non-financial approach or having a label remained relatively stable between 2012 and 2017 before growing significantly in 2018;22
- The weight of fund share classes claiming to take non-financial criteria into consideration (whether or not they have a label) in investment management increased only very slightly over
21 As a reminder, we initially studied the past costs and performance of funds that had a label in 2021. These funds may have been created before the establishment of the labels that they have now. The dates of creation specific to each fund and the improved coverage of the SIX database therefore account for the change in the number of fund share classes labelled since 2012. 22 NB: the updating of the AMF policy on the marketing of funds claiming a non-financial approach (DOC-2020-03) is subsequent to the last year for which data are available. It is therefore not yet possible to assess its impact.

14/49
the period. Fund share classes incorporating non-financial characteristics indeed represented 8.5% of all fund share classes marketed in France in 2018, versus 6.7% in 2012.
Some fund share classes can claim to take non-financial criteria into consideration without having a label, others have one of the three labels but do not indicate this in their name, and, finally, some have several labels. More precisely, the breakdown of fund share classes claiming a non-financial approach and/or having a label can be summarised as follows: Table 6: Number of fund share classes claiming a non-financial approach and/or labelled (names and labels as
documented in January 2021)
Fund share classes with no non-financial reference in their name 27,140 Fund share classes claiming non-financial
characteristics in their name 1,340
Of which fund share classes having 1 label 622 Of which fund share classes having 1 label 485 SRI label 617 SRI label 392 GF label 4 GF label 18 FS label 1 FS label 45 Of which fund share classes having 2 labels 1 Of which fund share classes having 2 labels 29 Of which fund share classes having 3 labels 0 Of which fund share classes having 3 labels 1
Source: SIX Financial, AMF It is noteworthy that 825 fund share classes in our sample refer to non-financial characteristics in their name although they do not have a label. Conversely, 623 fund share classes have at least one label but do not stress it in the choice of their fund's name. This unclear distinction that may persist between labelled funds and funds claiming a non-financial approach without having a label will probably soon be attenuated. Indeed, funds intended for retail investors and claiming SRI status without owning a label will now have to indicate this clearly. Moreover, funds marketed to retail clients wanting to use terms relating to non-financial characteristics in their name will have to adopt a "significantly binding" approach to non-financial criteria in their investment management.23 Fund share classes mentioning non-financial criteria (either by a reference in their name or by having a label in January 2021) are more invested in equities (with a slight acceleration last year) by comparison with fund share classes without any non-financial reference. Conversely, fund share classes not taking non-financial criteria into consideration include more "other" funds.
23 These measures shall be applied by 10 March 2021 at the latest. For more details, refer to Position-Recommendation 2020-03 on the information to be provided by collective investment schemes incorporating non-financial approaches.

15/49
Figure 1: Breakdown of funds (by number) according to their classification
Fund share classes incorporating non-financial characteristics (name or label in January 2021)
Fund classes without a non-financial approach
The proportion of fund share classes including non-financial criteria is highest for FCPEs (21.7% in 2018, a percentage that has been stable since 2012), which could be explained by the fact that company savings plans can propose at least one solidarity fund (Article 81 of the 2008 Economic Modernisation Act ("Loi de modernisation de l’économie") [Only in French] amending Article L3332-17 of the French Labour Code [Only in French]). The proportion of fund share classes incorporating a non-financial approach is slightly higher for the fund share classes reserved for institutional investors (8.3% in 2018) than for fund share classes intended for retail investors (7.8% in 2018).24 These percentages seem to have increased very gradually since 2012.
24 We could even consider that this difference of proportions is minimised given that the database does not list all the professional funds or those dedicated to institutionals.
Equity funds
Bond fundsDiversified
funds
Money market funds
Others Total
2012 669 163 133 86 38 1 0892013 627 166 132 86 37 1 0482014 627 174 138 81 35 1 0552015 608 170 144 82 35 1 0392016 621 175 144 82 30 1 0522017 644 191 140 79 33 1 0872018 1 022 281 195 93 70 1 661
0%
10%
20%
30%
40%
50%
60%
70%
80%
90%
100%
2012 2013 2014 2015 2016 2017 2018
Equity funds Bond funds Diversified funds Money market funds Others
Equity funds
Bond fundsDiversified
funds
Money market funds
Others Total
2012 7 045 3 201 1 720 861 2 442 15 2692013 6 688 3 232 1 721 774 2 265 14 6802014 6 372 3 191 1 660 697 2 063 13 9832015 6 042 3 106 1 574 616 1 779 13 1172016 5 757 3 074 1 511 560 1 511 12 4132017 5 606 3 083 1 453 512 1 388 12 0422018 8 280 4 558 2 161 480 2 302 17 781
0%
10%
20%
30%
40%
50%
60%
70%
80%
90%
100%
2012 2013 2014 2015 2016 2017 2018
Equity funds Bond funds Diversified funds Money market funds Others

16/49
Figure 2: Breakdown of fund share classes (by number) according to the target clients
Employee savings scheme funds (FCPEs)
Fund share classes intended for institutional investors
Fund share classes intended for mixed clients
Fund share classes intended for retail investors
Source: SIX, AMF calculations
A major difference in the funds' domiciliation can be observed depending on whether or not the funds incorporate non-financial characteristics. For fund share classes marketed in France and taking non-financial criteria into consideration, French funds are the majority, followed by Luxembourg and Belgian funds. For the other fund share classes, France ranks second behind Luxembourg and ahead of Ireland, because Ireland offers French clients only a very few fund share classes focused on non-financial criteria.
0%
10%
20%
30%
40%
50%
60%
70%
80%
90%
100%
2012 2013 2014 2015 2016 2017 2018
Incorporating a non-financial approach Without a non-financial approach
0%
10%
20%
30%
40%
50%
60%
70%
80%
90%
100%
2012 2013 2014 2015 2016 2017 2018
Incorporating a non-financial approach Without a non-financial approach
0%
10%
20%
30%
40%
50%
60%
70%
80%
90%
100%
2012 2013 2014 2015 2016 2017 2018
Incorporating a non-financial approach Without a non-financial approach
0%
10%
20%
30%
40%
50%
60%
70%
80%
90%
100%
2012 2013 2014 2015 2016 2017 2018
Incorporating a non-financial approach Without a non-financial approach
17/49
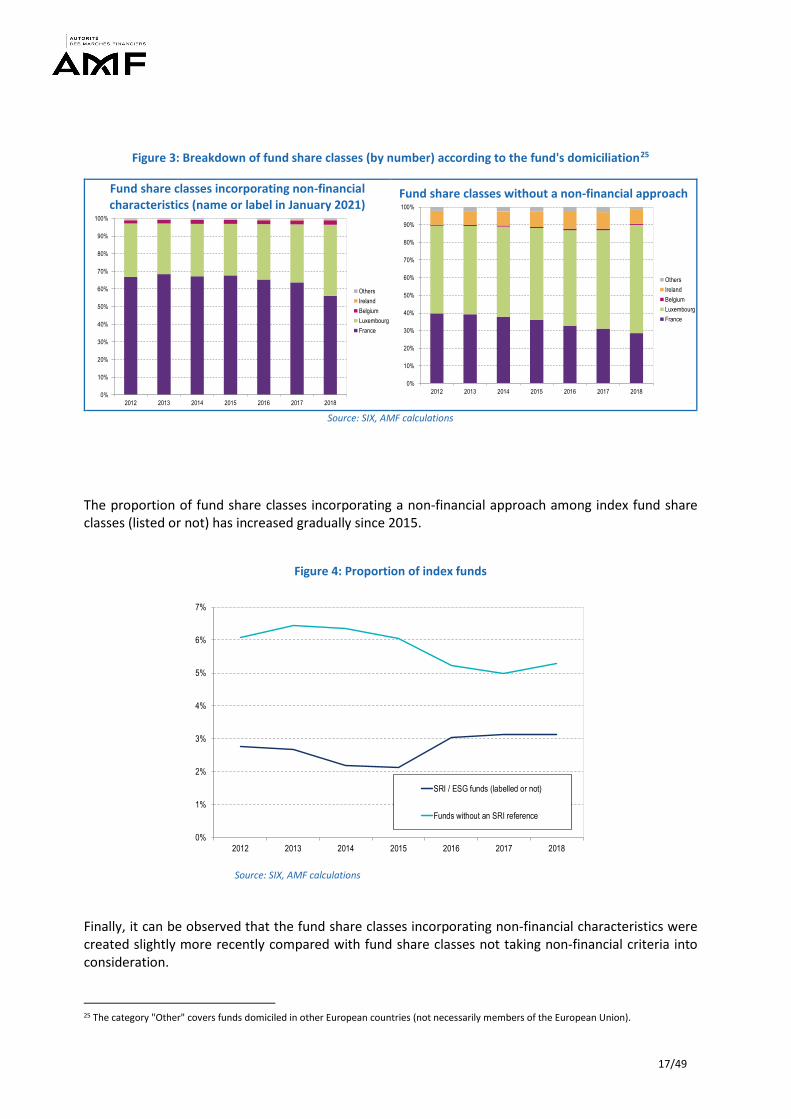
Figure 3: Breakdown of fund share classes (by number) according to the fund's domiciliation25
Fund share classes incorporating non-financial characteristics (name or label in January 2021)
Fund share classes without a non-financial approach
Source: SIX, AMF calculations
The proportion of fund share classes incorporating a non-financial approach among index fund share classes (listed or not) has increased gradually since 2015.
Figure 4: Proportion of index funds
Source: SIX, AMF calculations
Finally, it can be observed that the fund share classes incorporating non-financial characteristics were created slightly more recently compared with fund share classes not taking non-financial criteria into consideration. 25 The category "Other" covers funds domiciled in other European countries (not necessarily members of the European Union).
0%
10%
20%
30%
40%
50%
60%
70%
80%
90%
100%
2012 2013 2014 2015 2016 2017 2018
OthersIrelandBelgiumLuxembourgFrance
0%
10%
20%
30%
40%
50%
60%
70%
80%
90%
100%
2012 2013 2014 2015 2016 2017 2018
OthersIrelandBelgiumLuxembourgFrance
0%
1%
2%
3%
4%
5%
6%
7%
2012 2013 2014 2015 2016 2017 2018
SRI / ESG funds (labelled or not)
Funds without an SRI reference

18/49
Figure 5: Statistics concerning the age of fund share classes in 2018
Source: SIX, AMF calculations NB: The ends of the box plots represent the smallest and largest adjacent values,26 the bottom of the box represents the first quartile, the middle line the median and the top of the box represents the third quartile.
2.4. ANALYSIS BY VOLUME
We adopted the variable of net assets at 31 December of each year to perform the analysis by volume. The total net assets is defined, for each date, as the net asset value per share multiplied by the number of units. Regarding Table 7, we can make the following observations:
- After a slight decrease between 2013 and 2016, the net assets of fund share classes claiming a non-financial approach have been on an uptrend since 2017;
- As a proportion of total net assets, these fund classes followed the same pattern: their share declined until 2016 before rebounding slightly.
Table 7: Net assets of fund share classes marketable in France per year (in billions of euros)
Fund share classes incorporating non-
financial characteristics (by claim or labelling)
Fund share classes claiming a
non-financial approach in their
name (with or without a label)
Fund share classes having
at least one label (with or
without claim)
Fund share classes
having the SRI label
Fund share classes
having the Greenfin
label
Fund share classes
having the Finansol
label
Total fund share classes
marketed in France
2012 2013 2014 2015 2016 2017 2018
168 170 157 153 147 159 178
77 82 78 73 69 75 92
138 141 128 123 117 125 135
137 140 127 122 115 123 133
0 0 0 0 0 0 1
1 1 2 2 3 3 4
1,721 1,789 1,868 1,931 1,876 1,975 2,303
Source: SIX Financial, AMF As a proportion of the total fund share classes taking non-financial criteria into consideration, money market fund share classes declined steeply, from 56.9% in 2012 to 33.7% in 2018. The macroeconomic 26 The smallest adjacent value is obtained by the following formula: 𝑄𝑄1 − 3
2 (𝑄𝑄3 − 𝑄𝑄1) while the largest adjacent value is obtained by the
following formula: 𝑄𝑄3 + 32
(𝑄𝑄3 − 𝑄𝑄1) where Q1 corresponds to the first quartile and Q3 to the third quartile.

19/49
environment of recent years, with a combination of low interest rates and well-performing equity markets, therefore gradually, through a valuation effect, reduced the weight of money market fund share classes to the benefit of other asset classes, notably equities. These orders of magnitude seem consistent with the figures of the Association Française de la Gestion Financière (French Asset Management Association, AFG), which estimates that 36% of open-ended SRI collective investment units (CIUs) were invested in listed equities, 31% in money markets and 18% in bonds at end-2019.27 Figure 6: Breakdown of the net assets of fund share classes according to their classification (in billions of euros)
Fund share classes incorporating non-financial
characteristics (in billions of euros)
Fund share classes without a non-financial approach
(in billions of euros)
Fund share classes incorporating a non-financial approach are widely distributed among FCPEs. In 2018 they represented 28.6% of FCPEs' net assets. Moreover, the observation made concerning the analysis by number is confirmed, since the proportion of fund share classes taking non-financial criteria into consideration is slightly higher for the fund share classes sold to institutional investors (8.2%) than for fund share classes sold to retail investors (7.1%).
27 AFG (2020), Responsible Investment management: Survey data at end-2019, May 2020 (in French only).
Equity funds
Bond fundsDiversified
funds
Money market funds
Others Total
2012 48 14 8 96 2 1682013 53 16 9 91 2 1702014 52 17 9 78 2 1572015 54 15 10 72 2 1532016 58 16 10 61 2 1472017 69 19 12 57 2 1592018 78 21 15 60 4 178
0%
10%
20%
30%
40%
50%
60%
70%
80%
90%
100%
2012 2013 2014 2015 2016 2017 2018
Equity funds Bond funds Diversified funds Money market funds Others
Equity funds
Bond fundsDiversified
funds
Money market funds
Others Total
2012 576 340 140 379 118 1 5532013 674 325 166 334 120 1 6192014 692 364 197 332 126 1 7112015 720 370 202 360 125 1 7782016 702 389 199 324 116 1 7302017 772 416 222 293 113 1 8162018 849 533 295 274 174 2 125
0%
10%
20%
30%
40%
50%
60%
70%
80%
90%
100%
2012 2013 2014 2015 2016 2017 2018
Equity funds Bond funds Diversified funds Money market funds Others

20/49
Figure 7: Breakdown of the net assets of fund share classes according to the target clients
Employee savings scheme funds (FCPEs)
Fund share classes intended for institutional investors
Fund share classes intended for mixed clients
Fund share classes intended for retail investors
Source: SIX, AMF calculations
The great majority of fund share classes including non-financial characteristics are domiciled in France (75.5% in 2018). However, this proportion has tended to decrease in recent years, to the benefit of Luxembourg.
Figure 8: Breakdown of the net assets of fund share classes according to the fund's domiciliation
Fund share classes incorporating non-financial characteristics
Fund share classes without a non-financial approach
Source: SIX, AMF calculations
0%
10%
20%
30%
40%
50%
60%
70%
80%
90%
100%
2012 2013 2014 2015 2016 2017 2018
Incorporating a non-financial approach Without a non-financial approach
0%
10%
20%
30%
40%
50%
60%
70%
80%
90%
100%
2012 2013 2014 2015 2016 2017 2018
Incorporating a non-financial approach Without a non-financial approach
0%
10%
20%
30%
40%
50%
60%
70%
80%
90%
100%
2012 2013 2014 2015 2016 2017 2018
Incorporating a non-financial approach Without a non-financial approach
0%
10%
20%
30%
40%
50%
60%
70%
80%
90%
100%
2012 2013 2014 2015 2016 2017 2018
Incorporating a non-financial approach Without a non-financial approach
0%
10%
20%
30%
40%
50%
60%
70%
80%
90%
100%
2012 2013 2014 2015 2016 2017 2018
OthersIrelandBelgiumLuxembourgFrance
0%
10%
20%
30%
40%
50%
60%
70%
80%
90%
100%
2012 2013 2014 2015 2016 2017 2018
OthersIrelandBelgiumLuxembourgFrance
21/49
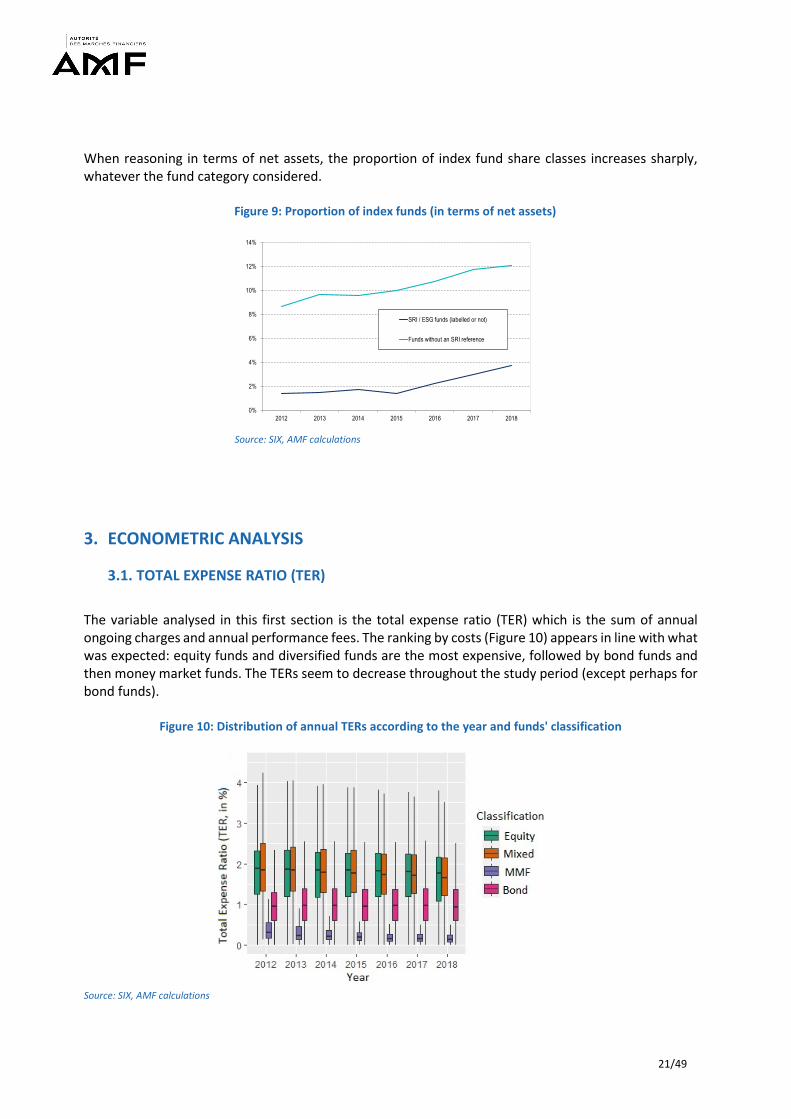
When reasoning in terms of net assets, the proportion of index fund share classes increases sharply, whatever the fund category considered.
Figure 9: Proportion of index funds (in terms of net assets)
Source: SIX, AMF calculations
3. ECONOMETRIC ANALYSIS
3.1. TOTAL EXPENSE RATIO (TER)
The variable analysed in this first section is the total expense ratio (TER) which is the sum of annual ongoing charges and annual performance fees. The ranking by costs (Figure 10) appears in line with what was expected: equity funds and diversified funds are the most expensive, followed by bond funds and then money market funds. The TERs seem to decrease throughout the study period (except perhaps for bond funds).
Figure 10: Distribution of annual TERs according to the year and funds' classification
Source: SIX, AMF calculations
0%
2%
4%
6%
8%
10%
12%
14%
2012 2013 2014 2015 2016 2017 2018
SRI / ESG funds (labelled or not)
Funds without an SRI reference

22/49
NB: The tips of the whiskers represent the smallest and largest adjacent values,28 the bottom of the box represents the first quartile, the middle line the median and the top of the box represents the third quartile. Like for the study on employee investment undertakings (Darpeix and Mosson, 2019), a series of regression analyses was conducted combining all the available observations in the database, inserting dummy variables for the date and for the various characteristics (pooled OLS with time and characteristics dummies). The list of explanatory variables is the same (the date, type of clients, investment management style, classification, fund domiciliation and fund investment in another fund, and age of the fund). We also added a control for past performance in the cost regressions, and constructed a variable identifying fund share classes incorporating non-financial characteristics. This last variable distinguishes between:
Fund share classes mentioning a non-financial approach in their name and having a label; Fund share classes claiming a non-financial approach but having no label; Fund share classes having a label but which do not mention it in their name; and Fund share classes with no reference to non-financial criteria and no label.
The regression analyses were conducted on the overall sample and then by classification. An "asset management company" (AMC) fixed effect was added to control for the fund managers' specific features regarding pricing policy. To conduct the analysis on the overall sample, the equation to be estimated in this first part is as follows: 𝑇𝑇𝐸𝐸𝐸𝐸𝑖𝑖,𝑡𝑡= 𝛼𝛼0 + 𝛼𝛼𝐴𝐴𝐴𝐴𝐴𝐴 + 𝛼𝛼2 𝑦𝑦𝑦𝑦𝑦𝑦𝑦𝑦𝑡𝑡 + 𝛼𝛼3 𝑐𝑐𝑐𝑐𝑐𝑐𝑦𝑦𝑐𝑐𝑐𝑐𝑠𝑠𝑖𝑖 + 𝛼𝛼4 𝑚𝑚𝑦𝑦𝑐𝑐𝑦𝑦𝑚𝑚𝑦𝑦𝑚𝑚𝑦𝑦𝑐𝑐𝑐𝑐𝑖𝑖 + 𝛼𝛼5 𝑐𝑐𝑐𝑐𝑦𝑦𝑠𝑠𝑠𝑠𝑐𝑐𝑐𝑐𝑐𝑐𝑐𝑐𝑦𝑦𝑐𝑐𝑐𝑐𝑐𝑐𝑐𝑐𝑖𝑖+ 𝛼𝛼6 𝑐𝑐𝑦𝑦𝑐𝑐𝑐𝑐𝑐𝑐𝑐𝑐𝑦𝑦𝑐𝑐𝑐𝑐𝑐𝑐𝑦𝑦𝑖𝑖 + 𝛼𝛼7 𝑐𝑐𝑦𝑦𝑦𝑦𝑓𝑓𝑦𝑦𝑦𝑦𝑓𝑓𝑓𝑓𝑓𝑓𝑖𝑖 + 𝛼𝛼8 𝑐𝑐𝑐𝑐𝑐𝑐𝑐𝑐𝑐𝑐𝑐𝑐𝑦𝑦𝑐𝑐𝑐𝑐𝑐𝑐𝑦𝑦𝑐𝑐𝑖𝑖 + 𝛼𝛼9 𝑦𝑦𝑚𝑚𝑦𝑦𝑖𝑖,𝑡𝑡 + 𝛼𝛼10 𝐿𝐿𝑐𝑐𝑚𝑚(𝑐𝑐𝑦𝑦𝑐𝑐𝑦𝑦𝑠𝑠𝑠𝑠𝑦𝑦𝑐𝑐𝑠𝑠)𝑖𝑖,𝑡𝑡+ 𝛼𝛼11 𝐺𝐺𝑦𝑦𝑐𝑐𝑠𝑠𝑠𝑠_𝑃𝑃𝑦𝑦𝑦𝑦𝑐𝑐𝑐𝑐𝑦𝑦𝑚𝑚𝑦𝑦𝑐𝑐𝑐𝑐𝑦𝑦𝑖𝑖,𝑡𝑡−1 + 𝜀𝜀𝑖𝑖,𝑡𝑡 Where
- 𝑇𝑇𝐸𝐸𝐸𝐸𝑖𝑖,𝑡𝑡 is the total expense ratio per fund per year; - 𝑦𝑦𝑦𝑦𝑦𝑦𝑦𝑦𝑡𝑡 is a dummy indicating the year of the observation; - 𝑐𝑐𝑐𝑐𝑐𝑐𝑦𝑦𝑐𝑐𝑐𝑐𝑠𝑠𝑖𝑖 is dummy capturing the type of clients targeted by the fund (institutional investors,
retail investors, mixed or FCPE); - 𝑚𝑚𝑦𝑦𝑐𝑐𝑦𝑦𝑚𝑚𝑦𝑦𝑚𝑚𝑦𝑦𝑐𝑐𝑐𝑐𝑖𝑖 is dummy for the management style (active or passive); - 𝑐𝑐𝑐𝑐𝑦𝑦𝑠𝑠𝑠𝑠𝑐𝑐𝑐𝑐𝑐𝑐𝑐𝑐𝑦𝑦𝑐𝑐𝑐𝑐𝑐𝑐𝑐𝑐𝑖𝑖 is a dummy indicating the fund's investment category (equities, bonds, money
market, diversified or other); - 𝑐𝑐𝑦𝑦𝑐𝑐𝑐𝑐𝑐𝑐𝑐𝑐𝑦𝑦𝑐𝑐𝑐𝑐𝑐𝑐𝑦𝑦𝑖𝑖 provides information on the fund's nationality (French or foreign); - 𝑐𝑐𝑦𝑦𝑦𝑦𝑓𝑓𝑦𝑦𝑦𝑦𝑓𝑓𝑓𝑓𝑓𝑓𝑖𝑖 indicates whether the fund is a feeder fund or a fund of funds (i.e. invested mostly
in one or more other funds); - 𝑐𝑐𝑐𝑐𝑐𝑐𝑐𝑐𝑐𝑐𝑐𝑐𝑦𝑦𝑐𝑐𝑐𝑐𝑐𝑐𝑦𝑦𝑐𝑐𝑖𝑖 provides information on the degree of consideration of non-financial criteria
(see above); - 𝑦𝑦𝑚𝑚𝑦𝑦𝑖𝑖,𝑡𝑡 measures the age of the fund in years (calculated as the difference between the date
studied and the date of the fund's creation); - 𝐿𝐿𝑐𝑐𝑚𝑚(𝑐𝑐𝑦𝑦𝑐𝑐𝑦𝑦𝑠𝑠𝑠𝑠𝑦𝑦𝑐𝑐𝑠𝑠)𝑖𝑖,𝑡𝑡 corresponds to the logarithm of net assets as at 31 December of the year of
the observation, and - 𝐺𝐺𝑦𝑦𝑐𝑐𝑠𝑠𝑠𝑠_𝑃𝑃𝑦𝑦𝑦𝑦𝑐𝑐𝑐𝑐𝑦𝑦𝑚𝑚𝑦𝑦𝑐𝑐𝑐𝑐𝑦𝑦𝑖𝑖,𝑡𝑡−1 is the gross performance before fees for the previous year.29
28 See footnote 25. 29 The net performance for year n was calculated as the growth rate of the net asset value per share between 31/12 of year n-1 and 31/12 of year n. To obtain a gross performance, we made the assumption that, in first approximation, the total net assets were stable throughout the year, and we added the total expense ratio to the net performance.

23/49
The variables 𝑐𝑐𝑐𝑐𝑐𝑐𝑦𝑦𝑐𝑐𝑐𝑐𝑠𝑠𝑖𝑖, 𝑚𝑚𝑦𝑦𝑐𝑐𝑦𝑦𝑚𝑚𝑦𝑦𝑚𝑚𝑦𝑦𝑐𝑐𝑐𝑐𝑖𝑖, 𝑐𝑐𝑐𝑐𝑦𝑦𝑠𝑠𝑠𝑠𝑐𝑐𝑐𝑐𝑐𝑐𝑐𝑐𝑦𝑦𝑐𝑐𝑐𝑐𝑐𝑐𝑐𝑐𝑖𝑖, 𝑐𝑐𝑦𝑦𝑐𝑐𝑐𝑐𝑐𝑐𝑐𝑐𝑦𝑦𝑐𝑐𝑐𝑐𝑐𝑐𝑦𝑦𝑖𝑖 , 𝑐𝑐𝑦𝑦𝑦𝑦𝑓𝑓𝑦𝑦𝑦𝑦𝑓𝑓𝑓𝑓𝑓𝑓𝑖𝑖, and 𝑐𝑐𝑐𝑐𝑐𝑐𝑐𝑐𝑐𝑐𝑐𝑐𝑦𝑦𝑐𝑐𝑐𝑐𝑐𝑐𝑦𝑦𝑐𝑐𝑖𝑖 are therefore variables that are specific to each fund but constant over the period of analysis. The estimated parameters for the 𝑐𝑐𝑐𝑐𝑐𝑐𝑐𝑐𝑐𝑐𝑐𝑐𝑦𝑦𝑐𝑐𝑐𝑐𝑐𝑐𝑦𝑦𝑐𝑐𝑖𝑖 variable (“non-financial indicator", in Table 8) show that the fund share classes claiming a non-financial approach and having a label appear less expensive than their conventional equivalents in the overall sample (the two left-hand side columns). However, it is worth noting that funds that are labelled but claim no reference to a non-financial approach in their name come out as more expensive, not only than other labelled funds, but also than funds claiming a non-financial approach without having a label, or even, in the model with AMC fixed effects, than funds without a label and with no specific mention of any non-financial characteristics in their name. This observation would tend to support the loss leader hypothesis: the funds for which non-financial characteristics are highlighted seem less expensive than those which make no such promotion. In other words, it is the claim of a non-financial approach that would appear to go hand-in-hand with lower charges. The analysis by asset class (following columns) tends to confirm this result, although some TER spreads between fund classes that are labelled and/or marketed as incorporating non-financial criteria are non-significant. On the other hand, the TERs of fund share classes without any non-financial reference are systematically higher than the TERs of fund share classes that claim a non-financial approach and are labelled, whatever the asset class considered. The inversion of the ranking between funds without any non-financial approach and those which have a label without stressing it is found again when the AMC fixed effects are added, for the sub-population of equity funds and the sub-population of diversified funds . For example, Table 8 shows that, all else being equal, a fund share class claiming non-financial characteristics (through its name) and having a label (i.e. the reference category for "non-financial" dummies) appears less expensive than a "conventional" fund share class by 0.17 percentage points (i.e. 17 bps). This difference is 0.32 percentage points for diversified fund share classes, 0.17 percentage points for equity fund share classes, 0.12 percentage points for bond fund share classes and 0.06 percentage points for money market fund share classes. All these differences are statistically significant at the 1% confidence level. The regression analyses without AMC fixed effects (left-hand columns for each category) show slightly higher coefficients on the "non-financial" dummies (for example, 34 basis points were found for the regression analysis combining all the asset classes, versus the 17 indicated in the previous paragraph). This would suggest pricing specificities from one AMC to another, and a specialisation of certain companies in funds having a non-financial approach. As the box plots suggested (Figure 10), the TERs are highest for equity funds (the reference category for the "underlying assets" variable), followed by diversified funds and bond funds. As expected, the money market funds are the least expensive. Moreover, a constant overall reduction in TERs can be observed from 2014.
NB: The data on fees are entered in the database with a time lag of one year. This is because the TER for fees paid during year n is indicated on the KIIDs for year n+1. For example, SIX indicates for 2018 the effective TER in 2017 which is given to clients as an indication for the year 2018. It is essential to bear in mind this time lag when linking the net performance for one year to the TER for the same year (reported the following year).

24/49
Lastly, the results obtained for the study on the costs and performance of employee investment undertakings are confirmed: the TER of employee investment undertakings (the reference category for the "type of clients" variable) is mid-way between that of institutional funds and that of funds intended for retail investors.

25/49
Table 8: Regression analysis of the total expense ratio on the characteristics of fund share classes
NB: On the overall sample, all else being equal (and controlling for the specific nature of each AMC), the TER of a fund without any non-financial reference was 17.1 basis points more than that of a fund claiming to take non-financial criteria into consideration and having a label.
2013 0.046*** 0.020* 0.016 -0.020 0.240*** 0.196*** -0.003 -0.003 0.027 0.006(0.015) (0.012) (0.025) (0.018) (0.047) (0.035) (0.019) (0.018) (0.022) (0.018)
2014 -0.033** -0.048*** -0.046** -0.058*** -0.052 -0.067** -0.095*** -0.068*** -0.087*** -0.067***(0.013) (0.011) (0.021) (0.015) (0.039) (0.029) (0.019) (0.018) (0.021) (0.018)
2015 -0.051*** -0.071*** -0.065*** -0.073*** -0.061 -0.095*** -0.122*** -0.102*** -0.010 -0.040**(0.013) (0.011) (0.021) (0.015) (0.038) (0.029) (0.019) (0.018) (0.020) (0.017)
2016 -0.068*** -0.096*** -0.097*** -0.111*** -0.069* -0.113*** -0.154*** -0.125*** -0.051*** -0.075***(0.013) (0.011) (0.021) (0.015) (0.038) (0.029) (0.020) (0.018) (0.020) (0.017)
2017 -0.052*** -0.087*** -0.099*** -0.119*** -0.024 -0.075** -0.137*** -0.116*** 0.022 -0.040**(0.013) (0.011) (0.021) (0.016) (0.039) (0.030) (0.020) (0.019) (0.020) (0.017)
2018 -0.101*** -0.135*** -0.158*** -0.177*** -0.077* -0.128*** -0.118*** -0.105*** -0.062*** -0.103***(0.014) (0.011) (0.022) (0.016) (0.040) (0.030) (0.022) (0.020) (0.020) (0.017)
Institutional funds -0.169*** -0.345*** -0.116*** -0.355*** -0.230*** -0.474*** 0.034 0.009 -0.229*** -0.317***(0.018) (0.016) (0.033) (0.026) (0.044) (0.039) (0.024) (0.023) (0.031) (0.029)
Mixed fund 0.476*** 0.243*** 0.723*** 0.390*** 0.481*** 0.112*** 0.177*** 0.132*** 0.245*** 0.118***(0.016) (0.015) (0.031) (0.025) (0.033) (0.032) (0.022) (0.021) (0.030) (0.028)
Retail funds 0.472*** 0.358*** 0.701*** 0.545*** 0.424*** 0.252*** 0.169*** 0.120*** 0.343*** 0.201***(0.020) (0.018) (0.035) (0.028) (0.055) (0.047) (0.032) (0.032) (0.034) (0.032)
Index funds -1.186*** -0.893*** -1.397*** -1.012*** 0.523** -0.131 -0.265*** -0.268*** -0.693*** -0.679***(0.015) (0.016) (0.018) (0.019) (0.226) (0.320) (0.064) (0.073) (0.030) (0.036)
Others classification -0.493*** -0.475***(0.011) (0.010)
Diversified classification -0.120*** -0.249***(0.011) (0.009)
Money market classification -1.525*** -1.394***(0.015) (0.012)
Bonds classification -0.878*** -0.802***(0.009) (0.007)
Foreign funds 0.061*** 0.219*** -0.138*** 0.234*** -0.010 -0.238** 0.125*** 0.235*** 0.350*** 0.308***(0.008) (0.025) (0.012) (0.035) (0.030) (0.099) (0.014) (0.056) (0.010) (0.047)
Funds of funds 0.210*** 0.300*** 0.232*** 0.349*** 0.170*** 0.399*** 0.255*** 0.186*** 0.180*** 0.149***(0.010) (0.009) (0.018) (0.015) (0.023) (0.021) (0.013) (0.014) (0.018) (0.018)
Claiming non-financial characteristics without a label 0.157*** 0.129*** 0.222*** 0.113*** 0.221*** 0.212*** -0.045 0.026 0.135*** 0.132***(0.027) (0.023) (0.038) (0.029) (0.085) (0.070) (0.038) (0.038) (0.041) (0.038)
Labelled but no claim 0.296*** 0.227*** 0.308*** 0.224*** 0.353*** 0.171** -0.039 0.062* 0.174*** 0.136***(0.027) (0.022) (0.036) (0.028) (0.094) (0.077) (0.036) (0.035) (0.043) (0.041)
No non-financial reference 0.342*** 0.171*** 0.378*** 0.174*** 0.568*** 0.319*** 0.045 0.062** 0.269*** 0.116***(0.021) (0.017) (0.028) (0.022) (0.073) (0.058) (0.030) (0.028) (0.032) (0.028)
Age of funds -0.002*** 0.002*** 0.002** 0.005*** -0.006*** 0.006*** -0.010*** -0.008*** -0.002*** 0.002***(0.0005) (0.0004) (0.001) (0.001) (0.002) (0.001) (0.001) (0.001) (0.001) (0.001)
Log (net assets) -0.045*** -0.026*** -0.063*** -0.036*** -0.057*** -0.022*** 0.007*** 0.004* -0.026*** -0.030***(0.001) (0.001) (0.002) (0.002) (0.005) (0.004) (0.002) (0.002) (0.002) (0.002)
Gross performance N-1 0.313*** 0.178*** 0.097** -0.016 1.649*** 1.393*** 3.759*** 2.715*** 0.969*** 0.524***(0.032) (0.026) (0.042) (0.030) (0.181) (0.141) (0.273) (0.253) (0.077) (0.066)
Constant 2.020*** 2.434*** 2.227*** 1.724*** 1.880*** 1.992*** 0.107* -0.031 0.840*** 1.122***(0.035) (0.436) (0.055) (0.267) (0.107) (0.459) (0.059) (0.167) (0.055) (0.287)
FIXED AMC EFFECTS N Y N Y N Y N Y N YR squared 0.384 0.612 0.296 0.644 0.130 0.552 0.299 0.456 0.282 0.516
Nb obs 60 635 60 635 28 894 28 894 8 401 8 401 3 529 3 529 12 633 12 633F-test 1,714.940*** 166.938*** 673.410*** 121.941*** 69.454*** 33.269*** 83.354*** 23.367*** 274.566*** 49.788***
* p<0.1, ** p<0.05, *** p<0.01
Dependent variable: Total expense ratio (TER, as a %)Pooled-OLS
Total sample Equity funds Diversified funds Money market funds Bond funds
Time dummies
Reference year: 2012
“Type of client” dummies
Reference category: FCPE
“Type of management”indicator
“Underlying assets” dummies
Reference category: equity funds
“Nationality” indicator
“Fund of funds”indicator
“Non-financial”indicator
Reference category: Funds claiming consideration of non-financial criteria and with a
label
Fund age variable
Size of class variable
Gross performance of fund in year N-1
26/49
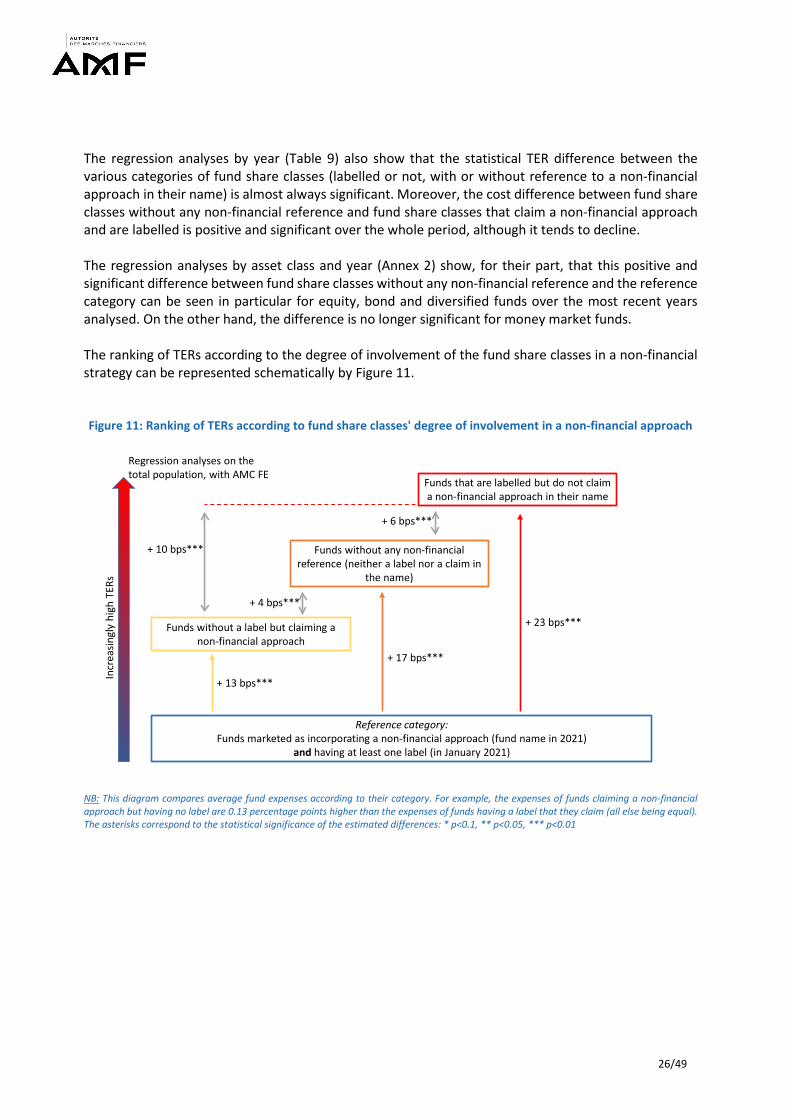
The regression analyses by year (Table 9) also show that the statistical TER difference between the various categories of fund share classes (labelled or not, with or without reference to a non-financial approach in their name) is almost always significant. Moreover, the cost difference between fund share classes without any non-financial reference and fund share classes that claim a non-financial approach and are labelled is positive and significant over the whole period, although it tends to decline. The regression analyses by asset class and year (Annex 2) show, for their part, that this positive and significant difference between fund share classes without any non-financial reference and the reference category can be seen in particular for equity, bond and diversified funds over the most recent years analysed. On the other hand, the difference is no longer significant for money market funds. The ranking of TERs according to the degree of involvement of the fund share classes in a non-financial strategy can be represented schematically by Figure 11. Figure 11: Ranking of TERs according to fund share classes' degree of involvement in a non-financial approach
NB: This diagram compares average fund expenses according to their category. For example, the expenses of funds claiming a non-financial approach but having no label are 0.13 percentage points higher than the expenses of funds having a label that they claim (all else being equal). The asterisks correspond to the statistical significance of the estimated differences: * p<0.1, ** p<0.05, *** p<0.01
Reference category:Funds marketed as incorporating a non-financial approach (fund name in 2021)
and having at least one label (in January 2021)
Funds without a label but claiming a non-financial approach
Funds without any non-financial reference (neither a label nor a claim in
the name)
Funds that are labelled but do not claim a non-financial approach in their name
+ 13 bps***
+ 17 bps***
+ 23 bps***
+ 10 bps***
+ 6 bps***
+ 4 bps***
Incr
easin
gly
high
TER
s
Regression analyses on the total population, with AMC FE

27/49
Table 9: Regression analysis of the total expense ratio on the characteristics of fund share classes by year
NB: In 2012, all else being equal (and controlling for the specific nature of each AMC), the TER of a fund without any non-financial reference was 18.2 basis points more than that of a fund claiming to take non-financial criteria into consideration and having a label.
Institutional funds 0.091 -0.017 -0.004 -0.161** -0.152*** -0.277*** -0.194*** -0.385*** -0.200*** -0.385*** -0.227*** -0.422*** -0.227*** -0.408***(0.137) (0.108) (0.083) (0.069) (0.052) (0.045) (0.044) (0.040) (0.039) (0.036) (0.038) (0.035) (0.038) (0.035)
Mixed fund 0.697*** 0.487*** 0.619*** 0.365*** 0.494*** 0.284*** 0.460*** 0.213*** 0.459*** 0.228*** 0.440*** 0.208*** 0.409*** 0.210***(0.134) (0.106) (0.080) (0.067) (0.048) (0.043) (0.040) (0.038) (0.035) (0.033) (0.035) (0.033) (0.034) (0.032)
Retail funds 0.601*** 0.598*** 0.528*** 0.431*** 0.445*** 0.378*** 0.457*** 0.333*** 0.493*** 0.364*** 0.485*** 0.336*** 0.470*** 0.340***(0.141) (0.111) (0.087) (0.073) (0.056) (0.050) (0.048) (0.044) (0.044) (0.040) (0.043) (0.040) (0.043) (0.039)
Index funds -1.214*** -0.838*** -1.229*** -0.903*** -1.197*** -0.937*** -1.226*** -0.955*** -1.194*** -0.912*** -1.152*** -0.847*** -1.081*** -0.849***(0.047) (0.046) (0.041) (0.041) (0.037) (0.038) (0.037) (0.039) (0.037) (0.041) (0.040) (0.043) (0.043) (0.045)
Others classification -0.603*** -0.543*** -0.550*** -0.528*** -0.444*** -0.435*** -0.464*** -0.488*** -0.444*** -0.427*** -0.357*** -0.353*** -0.334*** -0.338***(0.038) (0.032) (0.033) (0.029) (0.029) (0.026) (0.028) (0.025) (0.026) (0.024) (0.028) (0.024) (0.028) (0.025)
Diversified classification -0.138*** -0.312*** -0.095*** -0.257*** -0.074** -0.205*** -0.093*** -0.243*** -0.123*** -0.232*** -0.077*** -0.213*** -0.096*** -0.192***(0.039) (0.032) (0.033) (0.028) (0.029) (0.025) (0.027) (0.023) (0.025) (0.022) (0.026) (0.022) (0.026) (0.022)
Money market classification -1.415*** -1.332*** -1.404*** -1.283*** -1.435*** -1.284*** -1.545*** -1.430*** -1.558*** -1.421*** -1.500*** -1.405*** -1.440*** -1.335***(0.049) (0.039) (0.044) (0.036) (0.042) (0.034) (0.039) (0.032) (0.035) (0.029) (0.036) (0.030) (0.038) (0.031)
Bonds classification -0.961*** -0.878*** -0.869*** -0.803*** -0.890*** -0.800*** -0.853*** -0.813*** -0.841*** -0.758*** -0.769*** -0.716*** -0.787*** -0.723***(0.038) (0.031) (0.032) (0.027) (0.024) (0.020) (0.024) (0.020) (0.019) (0.016) (0.020) (0.017) (0.019) (0.016)
Foreign funds -0.061* -0.033 0.051** 0.177** 0.053*** 0.245*** 0.038** 0.185*** 0.073*** 0.198*** 0.109*** 0.222*** 0.114*** 0.201***(0.032) (0.147) (0.024) (0.073) (0.020) (0.060) (0.019) (0.060) (0.019) (0.061) (0.020) (0.066) (0.020) (0.068)
Funds of funds 0.214*** 0.362*** 0.227*** 0.364*** 0.224*** 0.311*** 0.204*** 0.292*** 0.197*** 0.248*** 0.174*** 0.235*** 0.214*** 0.240***(0.029) (0.024) (0.026) (0.023) (0.025) (0.022) (0.025) (0.022) (0.025) (0.022) (0.026) (0.023) (0.026) (0.023)
Claiming non-financial characteristics without a label 0.214** 0.121 0.202** 0.123* 0.201*** 0.157*** 0.125* 0.120** 0.109* 0.105** 0.144** 0.138*** 0.155** 0.111**(0.099) (0.079) (0.087) (0.071) (0.074) (0.061) (0.068) (0.056) (0.063) (0.053) (0.063) (0.053) (0.063) (0.052)
Labelled but no claim 0.267*** 0.209*** 0.385*** 0.265*** 0.323*** 0.231*** 0.351*** 0.287*** 0.269*** 0.220*** 0.273*** 0.224*** 0.191*** 0.116**(0.096) (0.078) (0.085) (0.070) (0.071) (0.059) (0.067) (0.056) (0.063) (0.054) (0.063) (0.053) (0.061) (0.052)
No non-financial reference 0.365*** 0.182*** 0.454*** 0.240*** 0.390*** 0.212*** 0.348*** 0.178*** 0.275*** 0.127*** 0.312*** 0.151*** 0.269*** 0.124***(0.078) (0.062) (0.069) (0.056) (0.057) (0.047) (0.053) (0.043) (0.049) (0.041) (0.049) (0.041) (0.047) (0.039)
Age of funds -0.003* -0.002 -0.003* -0.001 -0.003** 0.001 -0.002 0.003*** -0.0004 0.004*** -0.001 0.004*** 0.002* 0.005***(0.002) (0.001) (0.002) (0.001) (0.001) (0.001) (0.001) (0.001) (0.001) (0.001) (0.001) (0.001) (0.001) (0.001)
Log (net assets) -0.060*** -0.023*** -0.044*** -0.019*** -0.048*** -0.024*** -0.043*** -0.022*** -0.042*** -0.027*** -0.043*** -0.030*** -0.039*** -0.027***(0.005) (0.005) (0.004) (0.004) (0.004) (0.003) (0.003) (0.003) (0.003) (0.003) (0.003) (0.003) (0.003) (0.003)
Gross performance N-1 1.272*** 1.026*** -1.306*** -0.956*** 0.774*** 0.809*** 0.284*** 0.022 0.147* 0.205*** 0.747*** 0.374*** 0.519*** 0.465***(0.138) (0.112) (0.136) (0.114) (0.110) (0.093) (0.067) (0.057) (0.084) (0.071) (0.083) (0.070) (0.086) (0.072)
Constant 2.008*** 2.177*** 1.716*** 2.152*** 1.915*** 2.785*** 1.955*** 3.053*** 1.957*** 3.168*** 1.907*** 3.188*** 1.792*** 3.157***(0.178) (0.674) (0.127) (0.636) (0.094) (0.439) (0.082) (0.442) (0.076) (0.424) (0.077) (0.425) (0.077) (0.403)
FIXED AMC EFFECTS N Y N Y N Y N Y N Y N Y N YR squared 0.392 0.669 0.397 0.655 0.393 0.644 0.379 0.633 0.391 0.629 0.387 0.626 0.386 0.631
Nb obs 5 759 5 759 6 971 6 971 8 757 8 757 10 093 10 093 10 239 10 239 10 021 10 021 8 795 8 795F-test 231.572*** 29.043*** 285.907*** 29.532*** 353.868*** 31.730*** 385.006*** 34.385*** 410.671*** 34.658*** 394.477*** 36.155*** 344.997*** 33.827***
* p<0.1, ** p<0.05, *** p<0.01
Dependent variable: Total expense ratio (TER, as a %)OLS by year
2012 2013 2014 2015 2016 2017 2018
Fund age variable
Size of class variable
Gross performance of fund in year N-1
“Type of client” dummies
Reference category: FCPE
“Type of management”indicator
“Underlying assets” dummies
Reference category: equity funds
“Nationality” indicator
“Fund of funds”indicator
“Non-financial”indicator
Reference category: Funds claiming consideration of non-financial criteria and with a
label
28/49
3.2. NET PERFORMANCES
In this second section, the variable analysed is the net performance. To obtain this metric, we calculated the change in net asset value per share (NAV) between the months of December of each year to obtain annual performances net of ongoing charges and performance fees, as presented in the KIID. We eliminated changes in NAV which did not correspond to a real performance by choosing a threshold which made it possible to identify operations of division and multiplication of the nominal value.30 To conduct this second analysis, the equation to be estimated is as follows: 𝑃𝑃𝑦𝑦𝑦𝑦𝑐𝑐𝑐𝑐𝑦𝑦𝑚𝑚𝑦𝑦𝑐𝑐𝑐𝑐𝑦𝑦𝑖𝑖,𝑡𝑡= 𝛼𝛼0 + 𝛼𝛼𝑆𝑆𝑆𝑆𝑆𝑆 + 𝛼𝛼2 𝑦𝑦𝑦𝑦𝑦𝑦𝑦𝑦𝑡𝑡 + 𝛼𝛼3 𝑐𝑐𝑐𝑐𝑐𝑐𝑦𝑦𝑐𝑐𝑐𝑐𝑠𝑠𝑖𝑖 + 𝛼𝛼4 𝑚𝑚𝑦𝑦𝑐𝑐𝑦𝑦𝑚𝑚𝑦𝑦𝑚𝑚𝑦𝑦𝑐𝑐𝑐𝑐𝑖𝑖 + 𝛼𝛼5 𝑐𝑐𝑐𝑐𝑦𝑦𝑠𝑠𝑠𝑠𝑐𝑐𝑐𝑐𝑐𝑐𝑐𝑐𝑦𝑦𝑐𝑐𝑐𝑐𝑐𝑐𝑐𝑐𝑖𝑖+ 𝛼𝛼6 𝑐𝑐𝑦𝑦𝑐𝑐𝑐𝑐𝑐𝑐𝑐𝑐𝑦𝑦𝑐𝑐𝑐𝑐𝑐𝑐𝑦𝑦𝑖𝑖 + 𝛼𝛼7 𝑐𝑐𝑦𝑦𝑦𝑦𝑓𝑓𝑦𝑦𝑦𝑦𝑓𝑓𝑓𝑓𝑓𝑓𝑖𝑖 + 𝛼𝛼8 𝑐𝑐𝑐𝑐𝑐𝑐𝑐𝑐𝑐𝑐𝑐𝑐𝑦𝑦𝑐𝑐𝑐𝑐𝑐𝑐𝑦𝑦𝑐𝑐𝑖𝑖 + 𝛼𝛼9 𝑦𝑦𝑚𝑚𝑦𝑦𝑖𝑖,𝑡𝑡 + 𝛼𝛼10 𝐿𝐿𝑐𝑐𝑚𝑚(𝑐𝑐𝑦𝑦𝑐𝑐𝑦𝑦𝑠𝑠𝑠𝑠𝑦𝑦𝑐𝑐𝑠𝑠)𝑖𝑖,𝑡𝑡+ 𝜀𝜀𝑖𝑖,𝑡𝑡 Where
- 𝑃𝑃𝑦𝑦𝑦𝑦𝑐𝑐𝑐𝑐𝑦𝑦𝑚𝑚𝑦𝑦𝑐𝑐𝑐𝑐𝑦𝑦𝑖𝑖,𝑡𝑡 is the net performance per fund per year; - 𝑦𝑦𝑦𝑦𝑦𝑦𝑦𝑦𝑡𝑡 is a dummy for the year of the observation; - 𝑐𝑐𝑐𝑐𝑐𝑐𝑦𝑦𝑐𝑐𝑐𝑐𝑠𝑠𝑖𝑖 is a dummy coding the type of clients targeted (institutionals, retail investors, mixed or
FCPE); - 𝑚𝑚𝑦𝑦𝑐𝑐𝑦𝑦𝑚𝑚𝑦𝑦𝑚𝑚𝑦𝑦𝑐𝑐𝑐𝑐𝑖𝑖 is a dummy for the management style (active or passive); - 𝑐𝑐𝑐𝑐𝑦𝑦𝑠𝑠𝑠𝑠𝑐𝑐𝑐𝑐𝑐𝑐𝑐𝑐𝑦𝑦𝑐𝑐𝑐𝑐𝑐𝑐𝑐𝑐𝑖𝑖 indicates the fund's investment category (equities, bonds, money market,
diversified or other); - 𝑐𝑐𝑦𝑦𝑐𝑐𝑐𝑐𝑐𝑐𝑐𝑐𝑦𝑦𝑐𝑐𝑐𝑐𝑐𝑐𝑦𝑦𝑖𝑖 provides information on the fund's nationality (French or foreign); - 𝑐𝑐𝑦𝑦𝑦𝑦𝑓𝑓𝑦𝑦𝑦𝑦𝑓𝑓𝑓𝑓𝑓𝑓𝑖𝑖 indicates whether the fund is a feeder fund or a fund of funds (i.e. invested mostly
in one or more other funds); - 𝑐𝑐𝑐𝑐𝑐𝑐𝑐𝑐𝑐𝑐𝑐𝑐𝑦𝑦𝑐𝑐𝑐𝑐𝑐𝑐𝑦𝑦𝑐𝑐𝑖𝑖 encodes the degree of consideration of non-financial criteria (see previous
section); - 𝑦𝑦𝑚𝑚𝑦𝑦𝑖𝑖,𝑡𝑡 measures the age of the fund in years (calculated as the difference between the date of
the observation and the date of the fund's creation); and - 𝐿𝐿𝑐𝑐𝑚𝑚(𝑐𝑐𝑦𝑦𝑐𝑐𝑦𝑦𝑠𝑠𝑠𝑠𝑦𝑦𝑐𝑐𝑠𝑠)𝑖𝑖,𝑡𝑡 corresponds to the logarithm of net assets as at 31 December of the
corresponding year. The variables 𝑐𝑐𝑐𝑐𝑐𝑐𝑦𝑦𝑐𝑐𝑐𝑐𝑠𝑠𝑖𝑖, 𝑚𝑚𝑦𝑦𝑐𝑐𝑦𝑦𝑚𝑚𝑦𝑦𝑚𝑚𝑦𝑦𝑐𝑐𝑐𝑐𝑖𝑖, 𝑐𝑐𝑐𝑐𝑦𝑦𝑠𝑠𝑠𝑠𝑐𝑐𝑐𝑐𝑐𝑐𝑐𝑐𝑦𝑦𝑐𝑐𝑐𝑐𝑐𝑐𝑐𝑐𝑖𝑖, 𝑐𝑐𝑦𝑦𝑐𝑐𝑐𝑐𝑐𝑐𝑐𝑐𝑦𝑦𝑐𝑐𝑐𝑐𝑐𝑐𝑦𝑦𝑖𝑖 , 𝑐𝑐𝑦𝑦𝑦𝑦𝑓𝑓𝑦𝑦𝑦𝑦𝑓𝑓𝑓𝑓𝑓𝑓𝑖𝑖, and 𝑐𝑐𝑐𝑐𝑐𝑐𝑐𝑐𝑐𝑐𝑐𝑐𝑦𝑦𝑐𝑐𝑐𝑐𝑐𝑐𝑦𝑦𝑐𝑐𝑖𝑖 are therefore variables that are specific to each fund share class but constant over the study period. The aggregated results for all the years should be viewed cautiously given the high variability of the results depending on the year in question. Unlike the regression analyses with TERs, Table 10 shows that no hierarchy of fund share classes can be established according to their involvement in the consideration of non-financial criteria. The differences in net performance between these different categories of fund share classes are, in the great majority of cases, non-significant.
30 We thus removed from the sample the annual observations for which the NAV per share increased by more than 100% (doubling) or decreased by more than 50% (halving).

29/49
Table 10: Regression analysis of net performance on the characteristics of fund share classes
NB: On average over the period, all else being equal (and controlling for the specific nature of each AMC), the annual performance of diversified funds having a label but without a claim was 1.0 basis point higher than that of funds which claim this approach and are labelled (reference category). This difference is significant at the 5% confidence level. The other parameters estimated on the "non-financial" indicator all fail the significance test.
2013 -0.015*** -0.016*** 0.021*** 0.021*** -0.010*** -0.010*** -0.006*** -0.006*** -0.102*** -0.102***(0.001) (0.001) (0.002) (0.002) (0.002) (0.002) (0.001) (0.001) (0.001) (0.001)
2014 -0.066*** -0.066*** -0.094*** -0.094*** -0.041*** -0.042*** -0.008*** -0.008*** -0.057*** -0.057***(0.001) (0.001) (0.002) (0.002) (0.002) (0.002) (0.001) (0.001) (0.001) (0.001)
2015 -0.097*** -0.098*** -0.123*** -0.123*** -0.063*** -0.064*** -0.010*** -0.009*** -0.115*** -0.116***(0.001) (0.001) (0.002) (0.002) (0.002) (0.002) (0.001) (0.001) (0.001) (0.001)
2016 -0.069*** -0.070*** -0.092*** -0.093*** -0.064*** -0.066*** -0.010*** -0.010*** -0.055*** -0.056***(0.001) (0.001) (0.002) (0.002) (0.002) (0.002) (0.001) (0.001) (0.001) (0.001)
2017 -0.014*** -0.016*** 0.016*** 0.016*** -0.030*** -0.033*** -0.011*** -0.010*** -0.073*** -0.075***(0.001) (0.001) (0.002) (0.002) (0.002) (0.002) (0.001) (0.001) (0.001) (0.001)
2018 -0.197*** -0.198*** -0.281*** -0.282*** -0.170*** -0.173*** -0.008*** -0.008*** -0.130*** -0.133***(0.001) (0.001) (0.002) (0.002) (0.002) (0.002) (0.001) (0.001) (0.001) (0.001)
Institutional funds 0.001 0.001 0.004 0.004 -0.005** 0.003 0.008*** 0.007*** 0.008*** 0.002(0.002) (0.002) (0.004) (0.004) (0.002) (0.002) (0.001) (0.002) (0.003) (0.003)
Mixed fund -0.006*** -0.004** -0.007** -0.003 -0.005*** 0.0001 0.010*** 0.008*** 0.0005 -0.005(0.002) (0.002) (0.004) (0.004) (0.002) (0.002) (0.001) (0.001) (0.003) (0.003)
Retail funds -0.005** -0.005** -0.003 -0.004 -0.007** 0.0001 0.003* 0.002 0.001 -0.005(0.002) (0.002) (0.004) (0.004) (0.003) (0.003) (0.002) (0.002) (0.003) (0.003)
Index funds -0.011*** -0.005*** -0.007*** -0.002 0.006 0.010 -0.012*** -0.007 0.004** 0.008**(0.001) (0.002) (0.002) (0.003) (0.011) (0.021) (0.004) (0.005) (0.002) (0.003)
Others classification -0.067*** -0.065***(0.001) (0.001)
Diversified classification -0.044*** -0.042***(0.001) (0.001)
Money market classification -0.090*** -0.088***(0.002) (0.002)
Bonds classification -0.056*** -0.056***(0.001) (0.001)
Foreign funds -0.004*** -0.011*** -0.002 -0.017*** -0.005*** 0.012*** -0.001* 0.001 -0.005*** -0.003(0.001) (0.003) (0.001) (0.005) (0.001) (0.004) (0.001) (0.004) (0.001) (0.004)
Funds of funds -0.002* -0.001 -0.009*** -0.007*** -0.001 -0.001 0.010*** 0.007*** 0.001 0.001(0.001) (0.001) (0.002) (0.003) (0.001) (0.001) (0.001) (0.001) (0.002) (0.002)
Claiming non-financial characteristics without a label 0.001 0.001 0.001 -0.0001 -0.0001 0.003 -0.002 0.002 0.001 0.001(0.003) (0.003) (0.005) (0.005) (0.004) (0.004) (0.003) (0.003) (0.004) (0.004)
Labelled but no claim 0.005 0.003 0.007 0.005 0.007 0.010** 0.001 0.004 0.006 -0.001(0.003) (0.003) (0.005) (0.005) (0.005) (0.005) (0.002) (0.003) (0.004) (0.005)
No non-financial reference 0.002 0.0002 0.002 -0.002 0.001 0.001 0.003* 0.004** 0.001 -0.002(0.002) (0.002) (0.004) (0.004) (0.003) (0.004) (0.002) (0.002) (0.003) (0.003)
Age of funds 0.00002 -0.00003 0.0002** 0.00002 0.0003*** 0.0002*** -0.001*** -0.0005*** -0.0001 0.0001**(0.00005) (0.0001) (0.0001) (0.0001) (0.0001) (0.0001) (0.00004) (0.00005) (0.0001) (0.0001)
Log (net assets) 0.003*** 0.003*** 0.004*** 0.004*** 0.002*** 0.001*** 0.0005*** 0.0004** 0.001*** 0.001***(0.0001) (0.0001) (0.0002) (0.0002) (0.0002) (0.0002) (0.0001) (0.0001) (0.0001) (0.0002)
Constant 0.100*** 0.027 0.085*** 0.085* 0.065*** 0.007 -0.003 -0.005 0.084*** 0.089**(0.003) (0.049) (0.006) (0.045) (0.005) (0.024) (0.004) (0.013) (0.004) (0.038)
FIXED AMC EFFECTS N Y N Y N Y N Y N YR squared 0.323 0.340 0.399 0.415 0.511 0.586 0.112 0.168 0.368 0.404
Nb obs 99 186 99 186 46 689 46 689 1 194 1 194 4 938 4 938 2 282 2 282F-test 2,253.477*** 76.421*** 1,822.495*** 66.629*** 731.834*** 47.299*** 36.506*** 7.023*** 781.398*** 47.802***
* p<0.1, ** p<0.05, *** p<0.01
Dependent variable: Total expense ration (TER, as a %)Pooled-OLS
Whole sample Equity funds Diversified funds Money market funds Bond funds
“Non-financial”indicator
Reference category: Funds claiming
consideration of non-financial criteria and with a
label
Fund age variable
Size of class variable
Tuime dummies
Reference year: 2012
“Client type” dummies"
Reference category: FCPE
“Management type”indicator
“Underlying assets” dummies
Reference category: equity funds
“Nationality” indicator
“Fund of funds” indicator

30/49
Table 11 shows that the difference in performance was non-significant until 2014. However, fund share classes without any non-financial reference obtained a slightly higher net performance than fund share classes claiming a non-financial approach and having a label in 2016 and 2017, and a slightly lower performance in 2015 and 2018. The regression tables by classification and by year (Annex 3) are not very conclusive. They merely highlight a relative outperformance by equity, bond and diversified fund share classes claiming a non-financial approach in 2018 and having a label, by comparison with fund share classes without any non-financial reference.
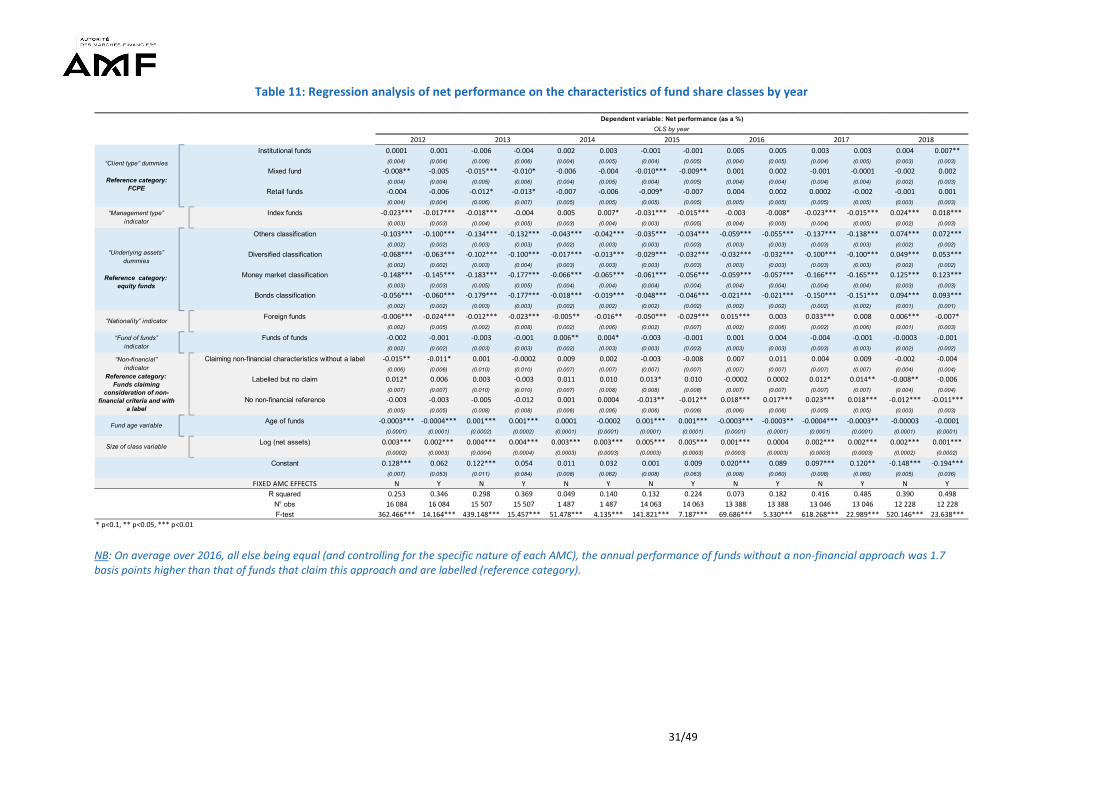
31/49
Table 11: Regression analysis of net performance on the characteristics of fund share classes by year
NB: On average over 2016, all else being equal (and controlling for the specific nature of each AMC), the annual performance of funds without a non-financial approach was 1.7 basis points higher than that of funds that claim this approach and are labelled (reference category).
Institutional funds 0.0001 0.001 -0.006 -0.004 0.002 0.003 -0.001 -0.001 0.005 0.005 0.003 0.003 0.004 0.007**(0.004) (0.004) (0.006) (0.006) (0.004) (0.005) (0.004) (0.005) (0.004) (0.005) (0.004) (0.005) (0.003) (0.003)
Mixed fund -0.008** -0.005 -0.015*** -0.010* -0.006 -0.004 -0.010*** -0.009** 0.001 0.002 -0.001 -0.0001 -0.002 0.002(0.004) (0.004) (0.005) (0.006) (0.004) (0.005) (0.004) (0.005) (0.004) (0.004) (0.004) (0.004) (0.002) (0.003)
Retail funds -0.004 -0.006 -0.012* -0.013* -0.007 -0.006 -0.009* -0.007 0.004 0.002 0.0002 -0.002 -0.001 0.001(0.004) (0.004) (0.006) (0.007) (0.005) (0.005) (0.005) (0.005) (0.005) (0.005) (0.005) (0.005) (0.003) (0.003)
Index funds -0.023*** -0.017*** -0.018*** -0.004 0.005 0.007* -0.031*** -0.015*** -0.003 -0.008* -0.023*** -0.015*** 0.024*** 0.018***(0.003) (0.003) (0.004) (0.005) (0.003) (0.004) (0.003) (0.005) (0.004) (0.005) (0.004) (0.005) (0.002) (0.003)
Others classification -0.103*** -0.100*** -0.134*** -0.132*** -0.043*** -0.042*** -0.035*** -0.034*** -0.059*** -0.055*** -0.137*** -0.138*** 0.074*** 0.072***(0.002) (0.002) (0.003) (0.003) (0.002) (0.003) (0.003) (0.003) (0.003) (0.003) (0.003) (0.003) (0.002) (0.002)
Diversified classification -0.068*** -0.063*** -0.102*** -0.100*** -0.017*** -0.013*** -0.029*** -0.032*** -0.032*** -0.032*** -0.100*** -0.100*** 0.049*** 0.053***(0.002) (0.002) (0.003) (0.004) (0.003) (0.003) (0.003) (0.003) (0.003) (0.003) (0.003) (0.003) (0.002) (0.002)
Money market classification -0.148*** -0.145*** -0.183*** -0.177*** -0.066*** -0.065*** -0.061*** -0.056*** -0.059*** -0.057*** -0.166*** -0.165*** 0.125*** 0.123***(0.003) (0.003) (0.005) (0.005) (0.004) (0.004) (0.004) (0.004) (0.004) (0.004) (0.004) (0.004) (0.003) (0.003)
Bonds classification -0.056*** -0.060*** -0.179*** -0.177*** -0.018*** -0.019*** -0.048*** -0.046*** -0.021*** -0.021*** -0.150*** -0.151*** 0.094*** 0.093***(0.002) (0.002) (0.003) (0.003) (0.002) (0.002) (0.002) (0.002) (0.002) (0.002) (0.002) (0.002) (0.001) (0.001)
Foreign funds -0.006*** -0.024*** -0.012*** -0.023*** -0.005** -0.016** -0.050*** -0.029*** 0.015*** 0.003 0.033*** 0.008 0.006*** -0.007*(0.002) (0.005) (0.002) (0.008) (0.002) (0.006) (0.002) (0.007) (0.002) (0.006) (0.002) (0.006) (0.001) (0.003)
Funds of funds -0.002 -0.001 -0.003 -0.001 0.006** 0.004* -0.003 -0.001 0.001 0.004 -0.004 -0.001 -0.0003 -0.001(0.002) (0.002) (0.003) (0.003) (0.002) (0.003) (0.003) (0.003) (0.003) (0.003) (0.003) (0.003) (0.002) (0.002)
Claiming non-financial characteristics without a label -0.015** -0.011* 0.001 -0.0002 0.009 0.002 -0.003 -0.008 0.007 0.011 0.004 0.009 -0.002 -0.004(0.006) (0.006) (0.010) (0.010) (0.007) (0.007) (0.007) (0.007) (0.007) (0.007) (0.007) (0.007) (0.004) (0.004)
Labelled but no claim 0.012* 0.006 0.003 -0.003 0.011 0.010 0.013* 0.010 -0.0002 0.0002 0.012* 0.014** -0.008** -0.006(0.007) (0.007) (0.010) (0.010) (0.007) (0.008) (0.008) (0.008) (0.007) (0.007) (0.007) (0.007) (0.004) (0.004)
No non-financial reference -0.003 -0.003 -0.005 -0.012 0.001 0.0004 -0.013** -0.012** 0.018*** 0.017*** 0.023*** 0.018*** -0.012*** -0.011***(0.005) (0.005) (0.008) (0.008) (0.006) (0.006) (0.006) (0.006) (0.006) (0.006) (0.005) (0.005) (0.003) (0.003)
Age of funds -0.0003*** -0.0004*** 0.001*** 0.001*** 0.0001 -0.0002 0.001*** 0.001*** -0.0003*** -0.0003** -0.0004*** -0.0003** -0.00003 -0.0001(0.0001) (0.0001) (0.0002) (0.0002) (0.0001) (0.0001) (0.0001) (0.0001) (0.0001) (0.0001) (0.0001) (0.0001) (0.0001) (0.0001)
Log (net assets) 0.003*** 0.002*** 0.004*** 0.004*** 0.003*** 0.003*** 0.005*** 0.005*** 0.001*** 0.0004 0.002*** 0.002*** 0.002*** 0.001***(0.0002) (0.0003) (0.0004) (0.0004) (0.0003) (0.0003) (0.0003) (0.0003) (0.0003) (0.0003) (0.0003) (0.0003) (0.0002) (0.0002)
Constant 0.128*** 0.062 0.122*** 0.054 0.011 0.032 0.001 0.009 0.020*** 0.089 0.097*** 0.120** -0.148*** -0.194***(0.007) (0.053) (0.011) (0.084) (0.008) (0.062) (0.008) (0.063) (0.008) (0.060) (0.008) (0.060) (0.005) (0.036)
FIXED AMC EFFECTS N Y N Y N Y N Y N Y N Y N YR squared 0.253 0.346 0.298 0.369 0.049 0.140 0.132 0.224 0.073 0.182 0.416 0.485 0.390 0.498
N° obs 16 084 16 084 15 507 15 507 1 487 1 487 14 063 14 063 13 388 13 388 13 046 13 046 12 228 12 228F-test 362.466*** 14.164*** 439.148*** 15.457*** 51.478*** 4.135*** 141.821*** 7.187*** 69.686*** 5.330*** 618.268*** 22.989*** 520.146*** 23.638***
* p<0.1, ** p<0.05, *** p<0.01
Dependent variable: Net performance (as a %)OLS by year
2012 2013 2014 2015 2016 2017 2018
Fund age variable
Size of class variable
“Client type” dummies
Reference category: FCPE
“Management type”indicator
“Underlying assets” dummies
Reference category: equity funds
“Nationality” indicator
“Fund of funds”indicator
“Non-financial”indicator
Reference category: Funds claiming
consideration of non-financial criteria and with
a label

32/49
4. ROBUSTNESS CHECKS
4.1. REGRESSION ANALYSES ON THE YEAR 2019
In order to confirm the results obtained for the period 2012–2018, we conducted a similar analysis on the year 2019 only. As a reminder, an improvement in our data provider's fund coverage resulted in a significant increase in the fund universe between the 2012-2018 base and the data received for 2019, which justifies considering 2019 separately.
Table 12: Number and net assets of fund share classes marketable in France in 2019
Fund share classes
incorporating non-financial
characteristics (by claim or
labelling)
Fund share classes claiming a
non-financial approach in their
name (with or without a label)
Fund share classes having
at least one label (with or
without claim)
Fund share classes
having the SRI label
Fund share classes
having the Greenfin
label
Fund share classes
having the Finansol
label
Total fund share classes
marketed in France
Number of fund share
classes 2,027 1,383 1,194 1,122 43 62 20,403
Net assets (in billions of
euros) 196 159 266 192 3 5 2,920
Source: SIX, AMF calculations
Of all the fund share classes marketed in France in 2019, 9.9% incorporate a non-financial approach (by a commercial claim or a label), i.e. 6.7% in volume terms.
Table 13: Breakdown of the number and net assets of fund share classes according to their classification
Fund share classes incorporating non-financial characteristics
Fund share classes without a non-financial approach
By number By volume
(€ billion) By number By volume (€ billion)
Equities 1,258 130 8,491 1,153 Other 88 4 2,432 178 Diversified 232 20 2,332 335 Money market 91 77 460 275 Bonds 358 34 4,661 713
Source: SIX, AMF calculations
As was the case in previous years, fund share classes incorporating a non-financial approach are mostly equity funds (62.1% by number and 49.0% by volume). The regression analyses on the TER seem to confirm, over the total population, the lower cost of funds that claim a non-financial approach and are labelled. This result remains valid for equity funds and diversified funds. However, the difference in costs between funds that claim a non-financial approach and are labelled and "conventional" funds is non-significant for money market and bond funds.
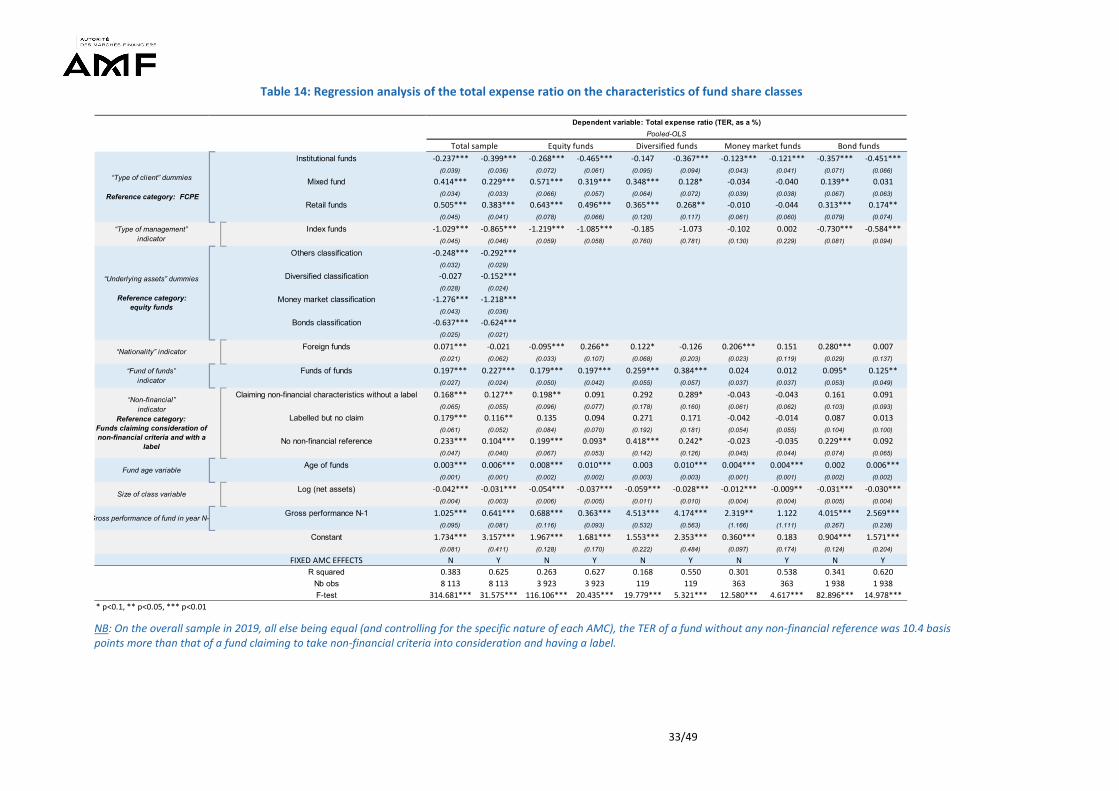
33/49
Table 14: Regression analysis of the total expense ratio on the characteristics of fund share classes
NB: On the overall sample in 2019, all else being equal (and controlling for the specific nature of each AMC), the TER of a fund without any non-financial reference was 10.4 basis points more than that of a fund claiming to take non-financial criteria into consideration and having a label.
Institutional funds -0.237*** -0.399*** -0.268*** -0.465*** -0.147 -0.367*** -0.123*** -0.121*** -0.357*** -0.451***(0.039) (0.036) (0.072) (0.061) (0.095) (0.094) (0.043) (0.041) (0.071) (0.066)
Mixed fund 0.414*** 0.229*** 0.571*** 0.319*** 0.348*** 0.128* -0.034 -0.040 0.139** 0.031(0.034) (0.033) (0.066) (0.057) (0.064) (0.072) (0.039) (0.038) (0.067) (0.063)
Retail funds 0.505*** 0.383*** 0.643*** 0.496*** 0.365*** 0.268** -0.010 -0.044 0.313*** 0.174**(0.045) (0.041) (0.078) (0.066) (0.120) (0.117) (0.061) (0.060) (0.079) (0.074)
Index funds -1.029*** -0.865*** -1.219*** -1.085*** -0.185 -1.073 -0.102 0.002 -0.730*** -0.584***(0.045) (0.046) (0.059) (0.058) (0.760) (0.781) (0.130) (0.229) (0.081) (0.094)
Others classification -0.248*** -0.292***(0.032) (0.029)
Diversified classification -0.027 -0.152***(0.028) (0.024)
Money market classification -1.276*** -1.218***(0.043) (0.036)
Bonds classification -0.637*** -0.624***(0.025) (0.021)
Foreign funds 0.071*** -0.021 -0.095*** 0.266** 0.122* -0.126 0.206*** 0.151 0.280*** 0.007(0.021) (0.062) (0.033) (0.107) (0.068) (0.203) (0.023) (0.119) (0.029) (0.137)
Funds of funds 0.197*** 0.227*** 0.179*** 0.197*** 0.259*** 0.384*** 0.024 0.012 0.095* 0.125**(0.027) (0.024) (0.050) (0.042) (0.055) (0.057) (0.037) (0.037) (0.053) (0.049)
Claiming non-financial characteristics without a label 0.168*** 0.127** 0.198** 0.091 0.292 0.289* -0.043 -0.043 0.161 0.091(0.065) (0.055) (0.096) (0.077) (0.178) (0.160) (0.061) (0.062) (0.103) (0.093)
Labelled but no claim 0.179*** 0.116** 0.135 0.094 0.271 0.171 -0.042 -0.014 0.087 0.013(0.061) (0.052) (0.084) (0.070) (0.192) (0.181) (0.054) (0.055) (0.104) (0.100)
No non-financial reference 0.233*** 0.104*** 0.199*** 0.093* 0.418*** 0.242* -0.023 -0.035 0.229*** 0.092(0.047) (0.040) (0.067) (0.053) (0.142) (0.126) (0.045) (0.044) (0.074) (0.065)
Age of funds 0.003*** 0.006*** 0.008*** 0.010*** 0.003 0.010*** 0.004*** 0.004*** 0.002 0.006***(0.001) (0.001) (0.002) (0.002) (0.003) (0.003) (0.001) (0.001) (0.002) (0.002)
Log (net assets) -0.042*** -0.031*** -0.054*** -0.037*** -0.059*** -0.028*** -0.012*** -0.009** -0.031*** -0.030***(0.004) (0.003) (0.006) (0.005) (0.011) (0.010) (0.004) (0.004) (0.005) (0.004)
Gross performance N-1 1.025*** 0.641*** 0.688*** 0.363*** 4.513*** 4.174*** 2.319** 1.122 4.015*** 2.569***(0.095) (0.081) (0.116) (0.093) (0.532) (0.563) (1.166) (1.111) (0.267) (0.238)
Constant 1.734*** 3.157*** 1.967*** 1.681*** 1.553*** 2.353*** 0.360*** 0.183 0.904*** 1.571***(0.081) (0.411) (0.128) (0.170) (0.222) (0.484) (0.097) (0.174) (0.124) (0.204)
FIXED AMC EFFECTS N Y N Y N Y N Y N YR squared 0.383 0.625 0.263 0.627 0.168 0.550 0.301 0.538 0.341 0.620
Nb obs 8 113 8 113 3 923 3 923 119 119 363 363 1 938 1 938F-test 314.681*** 31.575*** 116.106*** 20.435*** 19.779*** 5.321*** 12.580*** 4.617*** 82.896*** 14.978***
* p<0.1, ** p<0.05, *** p<0.01
Fund age variable
Size of class variable
Gross performance of fund in year N-
Dependent variable: Total expense ratio (TER, as a %)Pooled-OLS
“Type of client” dummies
Reference category: FCPE
“Type of management”indicator
“Underlying assets” dummies
Reference category: equity funds
“Nationality” indicator
“Fund of funds”indicator
“Non-financial”indicator
Reference category: Funds claiming consideration of non-financial criteria and with a
label
Total sample Equity funds Diversified funds Money market funds Bond funds

34/49
Moreover, the analysis of net performances points to an outperformance, in the overall sample, of funds that claim a non-financial approach and are labelled, by comparison with funds without a non-financial approach. This result is again found for equity and money market funds, but the opposite conclusion can be reached for diversified funds (Table 15).
4.2. CONSIDERATION OF LABELLING DATES
Although this information is not public, it was possible to obtain from each label administrator the date of first labelling for each fund. Two labels provided us with the precise dates of first labelling, and the third one gave us the year. To ensure consistency between the disparate granularity of this information, we made the assumption that, where labelling occurred during the year, the labelling was valid for the whole of that year. For example, we considered that a fund that was labelled on 1 June 2017 was, by extension, labelled since the beginning of 2017. Moreover, without information concerning the history of the fund's name, and with a concern for uniform treatment (between commercial claims and labels), for the following regression analyses we did not take into consideration the claim of a non-financial approach via the fund's name. We thus reduced the "non-financial" variable to a dummy taking the value 1 if the fund share class in question was labelled at a given date. Taking labelling dates into consideration does not call into question our previous results. For example, Table 16 shows that labelled funds had on average a TER 18.2 basis points lower than that of funds with no label. This difference is 19.6 basis points for equity funds, 13 basis points for bond funds, 12.8 basis points for diversified funds and 8.7 basis points for money market funds. Incidentally, in a regression not reported here where we distinguished each label, the cost difference between each label and the reference population was significant, but the coefficients for each label were not significantly different from one another. These results seem to confirm the fact that labelled funds were on average less expensive than non-labelled funds. The hypothesis according to which funds having a label in January 2021 behaved differently from the others (in terms of pricing) even before obtaining their label therefore does not seem to have significantly distorted the results.

35/49
Table 15: Regression analysis of net performance on the characteristics of fund share classes
NB: On average over 2019, all else being equal (and controlling for the specific nature of each AMC), the annual performance of equity funds without a non-financial approach was 3.7 basis points lower than the performance of funds claiming a non-financial approach and having a label (reference category).
Institutional funds 0.001 0.0002 -0.002 -0.001 -0.006 -0.003 0.005** 0.005** 0.014** 0.003(0.003) (0.004) (0.006) (0.007) (0.005) (0.006) (0.002) (0.002) (0.006) (0.006)
Mixed fund -0.002 -0.004 -0.010 -0.008 -0.002 -0.004 0.004** 0.005** 0.008 -0.003(0.003) (0.003) (0.006) (0.007) (0.004) (0.005) (0.002) (0.002) (0.006) (0.006)
Retail funds -0.001 -0.003 -0.004 -0.004 -0.014* -0.013* -0.0003 0.0004 0.010 -0.002(0.004) (0.004) (0.007) (0.007) (0.007) (0.007) (0.003) (0.003) (0.006) (0.006)
Index funds -0.007*** -0.0004 -0.004 -0.003 -0.064 -0.059 -0.002 0.007 -0.011*** -0.009*(0.002) (0.003) (0.003) (0.004) (0.057) (0.056) (0.004) (0.011) (0.003) (0.005)
Others classification -0.169*** -0.170***(0.002) (0.002)
Diversified classification -0.125*** -0.123***(0.002) (0.002)
Money market classification -0.240*** -0.241***(0.003) (0.003)
Bonds classification -0.172*** -0.173***(0.001) (0.001)
Foreign funds 0.004*** -0.018*** 0.003 -0.019*** 0.006** -0.004 0.008*** 0.008 0.023*** 0.009(0.001) (0.003) (0.002) (0.006) (0.003) (0.009) (0.001) (0.006) (0.002) (0.006)
Funds of funds 0.006*** 0.006*** -0.005 -0.006 0.002 -0.001 0.003* 0.004** -0.003 -0.006(0.002) (0.002) (0.004) (0.004) (0.003) (0.003) (0.002) (0.002) (0.004) (0.004)
Claiming non-financial characteristics without a label -0.003 -0.006 -0.014** -0.018*** 0.039*** 0.040*** -0.003 -0.005* 0.005 0.003(0.004) (0.004) (0.006) (0.006) (0.010) (0.009) (0.003) (0.003) (0.006) (0.005)
Labelled but no claim -0.008*** -0.004 -0.022*** -0.020*** 0.026** 0.033*** -0.003 -0.005* 0.017** 0.015**(0.004) (0.004) (0.006) (0.006) (0.011) (0.010) (0.002) (0.003) (0.007) (0.007)
No non-financial reference -0.017*** -0.020*** -0.035*** -0.037*** 0.021** 0.018** -0.002 -0.004** 0.008* 0.001(0.003) (0.003) (0.005) (0.005) (0.008) (0.008) (0.002) (0.002) (0.004) (0.004)
Age of funds -0.0003*** -0.0003*** -0.0004*** -0.0005*** 0.001*** 0.001*** 0.0001 0.00004 -0.0004*** -0.0002*(0.0001) (0.0001) (0.0001) (0.0001) (0.0002) (0.0002) (0.0001) (0.0001) (0.0001) (0.0001)
Log (net assets) 0.003*** 0.003*** 0.005*** 0.005*** 0.002*** 0.0001 0.00004 -0.0001 0.001** 0.0003(0.0002) (0.0002) (0.0003) (0.0003) (0.0005) (0.0005) (0.0002) (0.0002) (0.0003) (0.0003)
Constant 0.198*** 0.219*** 0.193*** 0.197*** 0.054*** 0.093*** -0.006 -0.002 0.026*** 0.087***(0.005) (0.027) (0.009) (0.013) (0.011) (0.027) (0.004) (0.010) (0.008) (0.031)
FIXED AMC EFFECTS N Y N Y N Y N Y N YR squared 0.573 0.631 0.037 0.208 0.041 0.370 0.160 0.300 0.058 0.274
Nb obs 20 403 20 403 9 749 9 749 2 564 2 564 551 551 5 019 5 019F-test 1,827.424*** 57.905*** 33.952*** 5.503*** 9.916*** 4.054*** 9.353*** 1.906*** 28.137*** 6.036***
* p<0.1, ** p<0.05, *** p<0.01
Dependent variable: Net performance (as a %)Pooled-OLS
Total sample Equity funds Diversified funds Money market funds Bond funds
Fund age variable
Size of class variable
“Type of client” dummies
Reference category: FCPE
“Type of management”indicator
“Underlying assets” dummies
Reference category: equity funds
“Nationality” indicator
“Fund of funds”indicator
“Non-financial”indicator
Reference category: Funds claiming consideration of non-financial criteria and with a
label

36/49
Table 16: Regression analysis of the TER on the characteristics of fund share classes (taking into consideration the date of labelling)
NB: On average for the overall sample, all else being equal (and controlling for the specific nature of each AMC), the TER of labelled funds was 18.2 basis points lower than that of non-labelled funds.
2013 0.047*** 0.021* 0.020 -0.018 0.244*** 0.196*** -0.005 -0.003 0.026 0.006(0.015) (0.012) (0.025) (0.018) (0.048) (0.035) (0.019) (0.018) (0.022) (0.018)
2014 -0.033** -0.048*** -0.047** -0.058*** -0.052 -0.068** -0.098*** -0.069*** -0.088*** -0.067***(0.013) (0.011) (0.021) (0.015) (0.039) (0.029) (0.019) (0.018) (0.021) (0.018)
2015 -0.053*** -0.072*** -0.067*** -0.074*** -0.062 -0.098*** -0.127*** -0.104*** -0.012 -0.041**(0.013) (0.011) (0.021) (0.015) (0.038) (0.029) (0.019) (0.018) (0.020) (0.017)
2016 -0.067*** -0.096*** -0.094*** -0.109*** -0.067* -0.115*** -0.159*** -0.126*** -0.051*** -0.074***(0.013) (0.011) (0.021) (0.015) (0.038) (0.029) (0.020) (0.018) (0.020) (0.017)
2017 -0.050*** -0.086*** -0.096*** -0.116*** -0.021 -0.078*** -0.141*** -0.116*** 0.023 -0.039**(0.013) (0.011) (0.021) (0.016) (0.039) (0.030) (0.020) (0.019) (0.020) (0.017)
2018 -0.096*** -0.132*** -0.151*** -0.171*** -0.070* -0.130*** -0.122*** -0.105*** -0.059*** -0.101***(0.014) (0.011) (0.022) (0.016) (0.040) (0.030) (0.022) (0.020) (0.020) (0.017)
Institutional funds -0.156*** -0.345*** -0.103*** -0.350*** -0.201*** -0.452*** 0.033 0.008 -0.216*** -0.323***(0.018) (0.016) (0.033) (0.026) (0.045) (0.039) (0.024) (0.023) (0.031) (0.029)
Mixed fund 0.492*** 0.243*** 0.737*** 0.395*** 0.526*** 0.142*** 0.179*** 0.132*** 0.261*** 0.111***(0.016) (0.015) (0.031) (0.025) (0.033) (0.032) (0.022) (0.021) (0.030) (0.028)
Retail funds 0.484*** 0.357*** 0.710*** 0.548*** 0.456*** 0.276*** 0.171*** 0.123*** 0.357*** 0.194***(0.020) (0.018) (0.034) (0.028) (0.055) (0.047) (0.032) (0.032) (0.033) (0.031)
Index funds -1.171*** -0.888*** -1.376*** -1.004*** 0.527** -0.123 -0.257*** -0.265*** -0.682*** -0.678***(0.015) (0.016) (0.018) (0.019) (0.227) (0.321) (0.064) (0.073) (0.030) (0.036)
Others classification -0.478*** -0.471***(0.011) (0.009)
Diversified classification -0.113*** -0.249***(0.011) (0.009)
Money market classification -1.524*** -1.392***(0.015) (0.012)
Bonds classification -0.871*** -0.801***(0.009) (0.007)
Foreign funds 0.075*** 0.220*** -0.118*** 0.234*** -0.003 -0.221** 0.142*** 0.248*** 0.364*** 0.300***(0.008) (0.025) (0.012) (0.035) (0.030) (0.099) (0.013) (0.056) (0.010) (0.047)
Funds of funds 0.224*** 0.304*** 0.250*** 0.357*** 0.194*** 0.411*** 0.267*** 0.191*** 0.196*** 0.153***(0.010) (0.008) (0.018) (0.015) (0.023) (0.021) (0.013) (0.014) (0.018) (0.018)
Labelled funds -0.336*** -0.182*** -0.338*** -0.196*** -0.388*** -0.128** -0.118** -0.087* -0.300*** -0.130***(0.031) (0.025) (0.046) (0.034) (0.076) (0.061) (0.049) (0.046) (0.043) (0.038)
Age of funds -0.001** 0.002*** 0.002*** 0.006*** -0.007*** 0.006*** -0.009*** -0.008*** -0.002*** 0.002***(0.0005) (0.0004) (0.001) (0.001) (0.002) (0.001) (0.001) (0.001) (0.001) (0.001)
Log (net assets) -0.045*** -0.025*** -0.063*** -0.035*** -0.056*** -0.022*** 0.006*** 0.003 -0.026*** -0.030***(0.001) (0.001) (0.002) (0.002) (0.005) (0.004) (0.002) (0.002) (0.002) (0.002)
Gross performance N-1 0.320*** 0.181*** 0.108*** -0.012 1.672*** 1.394*** 3.791*** 2.725*** 0.964*** 0.523***(0.032) (0.026) (0.042) (0.030) (0.182) (0.141) (0.273) (0.253) (0.077) (0.066)
Constant 2.315*** 2.602*** 2.547*** 1.883*** 2.361*** 2.288*** 0.155*** 0.037 1.075*** 1.242***(0.030) (0.435) (0.048) (0.266) (0.087) (0.457) (0.050) (0.164) (0.047) (0.286)
FIXED AMC EFFECTS N Y N Y N Y N Y N YR squared 0.381 0.611 0.292 0.644 0.121 0.550 0.296 0.455 0.279 0.516
Nb obs 60 635 60 635 28 894 28 894 8 401 8 401 3 529 3 529 12 633 12 633F-test 1,867.449*** 167.216*** 744.074*** 122.197*** 71.906*** 33.242*** 92.263*** 23.725*** 304.485*** 50.124***
* p<0.1, ** p<0.05, *** p<0.01
Dependent variable: Total expense ratio (TER, as a %)Pooled-OLS
Total sample Equity funds Diversified funds Money market funds Bond funds
Fund age variable
Size of class variable
Gross performance of fund in year N-1
“Labelled”indicator
Time dummies
Reference year: 2012
“Type of client” dummies
Reference category: FCPE
“Type of management”indicator
“Underlying assets” dummies
Reference category: equity funds
“Nationality” indicator
“Fund of funds”indicator

37/49
5. CONCUSION
The econometric analysis performed on fund share classes seems to show that the net performances of fund share classes incorporating non-financial characteristics marketed in France are not really different from those of conventional fund share classes, and that fund share classes taking non-financial criteria into consideration would tend to be significantly less expensive than their equivalents without a non-financial approach. This lower cost cannot be explained ex ante by the size of the fund share class or by the large proportion of such fund share classes in employee savings scheme funds (FCPEs), since these two variables are controlled for in the regression analyses. We could therefore imagine that fund share classes incorporating a non-financial approach serve as loss leaders for the asset management companies and accordingly benefit from lower fees. It could be possible, moreover, that the initial reduction in the universe of eligible securities limit research costs. Lastly, it is possible to imagine that the managers of funds incorporating a non-financial approach deliberately want to make them accessible to the greatest number (responsible pricing). However, the data currently available to us merely allow an analysis of the TER (total expense ratio), i.e. an aggregation of ongoing charges and performance fees. We are relatively ignorant as to the entry and exit fees actually charged by the fund managers (when the variable is documented, this is merely a maximum value), distribution costs (trailer fees) and the charges of the wrapper (life insurance, company savings plan ("PEE"), retirement savings plan ("PER"), securities account). At this stage all the analyses performed therefore give merely a partial view of the fees actually charged to investors, which urges for caution when interpreting the results. In a context of repeated calls for the mobilisation of savings for financing the economy, and at a time when the industry is significantly expanding its offering of investment products incorporating non-financial characteristics, an exhaustive view of all the fees charged on whatsoever grounds would be indispensable for investor information, especially with regard to the risks incurred. The use of a (non-exhaustive) commercial database is for the time being the only solution for analysing funds' fees. Text-mining work underway to collect the price information contained in Key Investor Information Documents (KIIDs) could make it possible to have an exhaustive view of the fees received by French funds. Although some of the charges shown in the KIIDs are maximum charges (entry/exit fees), the use of such a method would make it possible to have a comprehensive and coordinated view of the universe of French funds. To extend this methodology to all European funds, however, it would be necessary to collect the KIIDs for all the jurisdictions, or that each regulator undertake similar work. Otherwise, a comparison with foreign funds sold to French clients would still require the use of commercial databases. An exhaustive, harmonised European cost database would prove extremely useful both to assess the funds' comparability and to enable investors to make an informed choice. Finally, the risk of funds incorporating a non-financial approach is not analysed in this study. The outperformance of indices and funds considering non-financial criteria by comparison with their "conventional" equivalents or their benchmark indices could partly be explained by more cautious risk management31. A comparison of the risk of funds incorporating non-financial characteristics on the one hand, and "conventional" funds on the other hand, could constitute an interesting supplement to this first study.
31 ESMA (2020). ESMA Report on Trends, Risks and Vulnerabilities, No. 1, 2020.

38/49
BIBLIOGRAPHY AMF (2019). Sustainable finance, responsible investments, The French and socially responsible investments: Audirep study for the AMF AMF (2020). Position-Recommendation DOC-2020-03 designed to ensure proportionality between the reality of the consideration of non-financial factors in investment management and the position reserved for them in reporting to investors (update of 27 July 2020) Bennani, L., Le Guenedal, T., Lepetit, F., Ly, L., Mortier, V., Roncalli, T., & Sekine, T. (2018). How ESG Investing Has Impacted the Asset Pricing in the Equity Market. Amundi Discussion Paper, 36, www.research-center.amundi.com. Ben Slimane, M., Le Guenedal, T., Roncalli, T., & Sekine, T. (2019). ESG Investing in Corporate Bonds: Mind the Gap. Amundi Working Paper, 94, www.research-center.amundi.com. CapelleBlancard, G., & Monjon, S. (2014). The performance of socially responsible funds: does the screening process matter?. European Financial Management, 20(3), 494-520. Christoffersen, S. E., & Musto, D. K. (2002). Demand curves and the pricing of money management. The Review of Financial Studies, 15(5), 1499-1524. Climent, F., & Soriano, P. (2011). Green and good? The investment performance of US environmental mutual funds. Journal of Business Ethics, 103(2), 275-287. Cortez, M. C., Silva, F., & Areal, N. (2009). The performance of European socially responsible funds. Journal of business ethics, 87(4), 573-588. Darpeix, P.-E., & Mosson, N. (2019). Costs and performance of employee savings scheme funds. AMF Risk and Trend Mapping. Drei, A., Le Guenedal, T., Lepetit, F., Ly, L., Mortier, V., Roncalli, T., & Sekine, T. (2019). ESG Investing in Recent Years: New Insights from Old Challenges. Amundi Discussion Paper, 42, www. research-center. amundi. com. ESMA (2018). Guidelines on certain aspects of the MiFID II suitability requirements, 6 November 2018, ESMA No. 35-43-1163-FR (33 p). ESMA (2020). ESMA Report on Trends, Risks and Vulnerabilities, No. 1, 2020. Friede, Gunnar, Timo Busch & Alexander Bassen (2015). ESG and financial performance: aggregated evidence from more than 2000 empirical studies, Journal of Sustainable Finance & Investment, 5:4, 210-233. Galema, R., Plantinga, A., & Scholtens, B. (2008). The stocks at stake: Return and risk in socially responsible investment. Journal of Banking & Finance, 32(12), 2646-2654. Geczy, C., Stambaugh, R. F., & Levin, D. (2005). Investing in socially responsible mutual funds. Available at SSRN 416380. Gil-Bazo, J., Ruiz-Verdú, P., & Santos, A. A. (2010). The performance of socially responsible mutual funds: The role of fees and management companies. Journal of Business Ethics, 94(2), 243-263. Hartzmark, S. M., & Sussman, A. B. (2019). Do investors value sustainability? A natural experiment examining ranking and fund flows. The Journal of Finance, 74(6), 2789-2837.

39/49
Pastor, Lubos & M. Blair Vorsatz (2020). Fund performance and flows during the Covid-19 crisis. NBER Working Paper, No. 27751, July 2020, 50 p. Revelli, C., & Viviani, J. L. (2015). Financial performance of socially responsible investing (SRI): what have we learned? A metaanalysis. Business Ethics: A European Review, 24(2), 158-185. Sánchez, J. L. F., & Sotorrío, L. L. (2009). Performance of European SRI funds vs. conventional funds. Working paper, University of Cantabria, Santander. Starks, L. T., Venkat, P., & Zhu, Q. (2017). Corporate ESG profiles and investor horizons. Available at SSRN 3049943.

40/49
Annex 1: List of key words used to identify fund classes claiming a non-financial approach
The key words that can be used to identify fund classes claiming a non-financial approach have been identified "pragmatically": the relevance of each key word was assessed through a manual check on the marketing documents of the funds highlighting them.
Theme Key words SRI / ESG • ISR (French for "SRI")
• SRI • ESG
Sustainable • Durable / Durables (French for "sustainable") • Sustainable / Sustainability • ODD (“Objectifs du Développement Durable”)
(French for "SDG") • SDG ("Sustainable Development Goals") • Responsable (French for "responsible") • Responsible / Responsibility
Water • Sustainable water • Sustainable global water • Eco fund water • Eco CSOB water • Or bleu (French for "blue gold")
Energy • New energy • Alternative energy • Energy evolution • Energies renouvelables (French for "Renewable
energies") • Energy solution / solutions • Nouvelles énergies (French for "New energies") • Energy innovators • Energy transition • Smart energy • Clean Energy • Carbon • Active solar
Future • Future world • New resources • Future resources • Future building • Enjeux futurs (French for "Future issues") • Nouvelle stratégie (French for "New strategy") • Longevity economy • France futur (French for "France of the future") • Grandchildren • Esperance (French for "Hope, Expectation")
Planet • Planète (French for "Planet") • Planet

41/49
Environment • Environnement (French for "Environment") • Environment / Environmental • Green • Renewable • Transition • Climat / Climatique (French for "Climate") • Climate • Terreneuve (French for "Newfoundland") • Ecotrends • Ecology • Clean economy • Clean world • Eco solutions • Impact • Circular economy • Positive economy
Social • Social • Faim (French for "Hunger") • Fonds de partage (French for "Shared return
fund") • Investissement et partage (French for
"Investment and sharing") • Partage sos (French for "SOS Sharing") • Solidaire / Solidaires / Solidarité (French for
"Solidarity") • Solidarity • Humain (French for "Human") • Human • Emploi (French for "Employment") • Happy • Shared Growth • Ethique / Ethiques (French for "Ethical") • Ethical • Gender equality • Insertion (French for "Social inclusion") • Engagement • Women empowerment • Valeurs féminines (French for "Women's values") • Women leaders • Well-being • Gender diversity
Technology • Clean tech • Cleantech • Clean technology • Disruptive technology
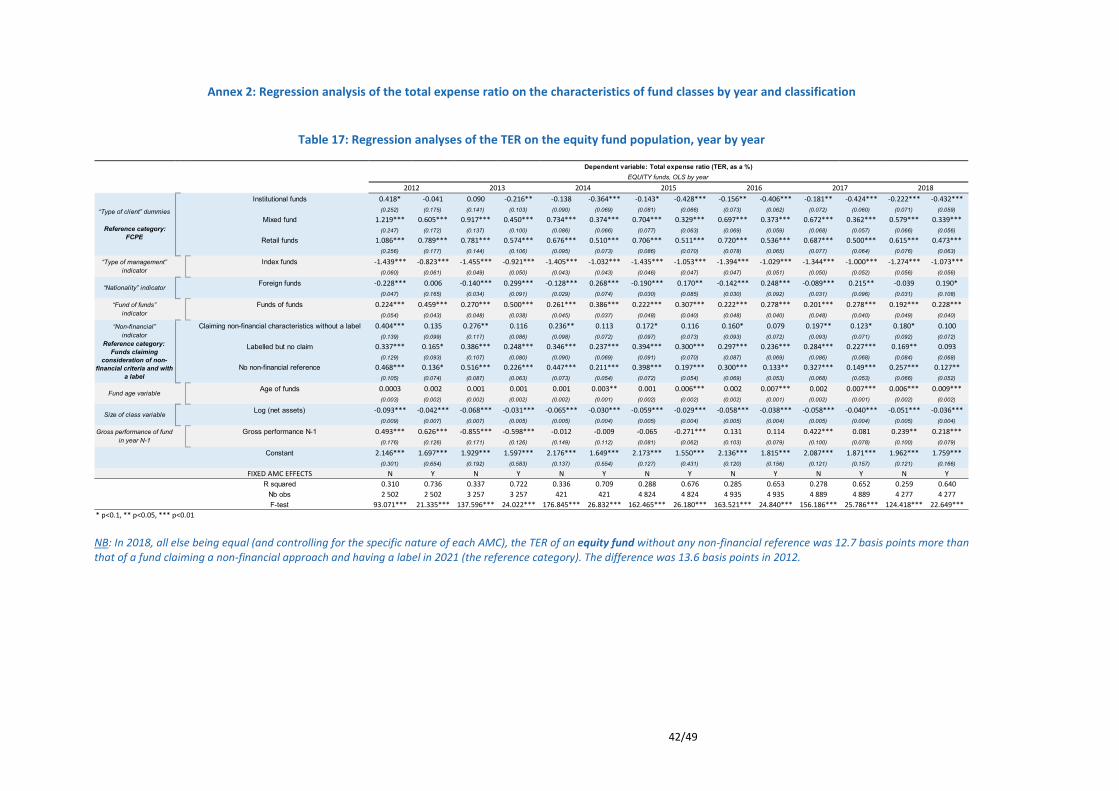
42/49
Annex 2: Regression analysis of the total expense ratio on the characteristics of fund classes by year and classification
Table 17: Regression analyses of the TER on the equity fund population, year by year
NB: In 2018, all else being equal (and controlling for the specific nature of each AMC), the TER of an equity fund without any non-financial reference was 12.7 basis points more than that of a fund claiming a non-financial approach and having a label in 2021 (the reference category). The difference was 13.6 basis points in 2012.
Institutional funds 0.418* -0.041 0.090 -0.216** -0.138 -0.364*** -0.143* -0.428*** -0.156** -0.406*** -0.181** -0.424*** -0.222*** -0.432***(0.252) (0.175) (0.141) (0.103) (0.090) (0.069) (0.081) (0.066) (0.073) (0.062) (0.072) (0.060) (0.071) (0.059)
Mixed fund 1.219*** 0.605*** 0.917*** 0.450*** 0.734*** 0.374*** 0.704*** 0.329*** 0.697*** 0.373*** 0.672*** 0.362*** 0.579*** 0.339***(0.247) (0.172) (0.137) (0.100) (0.086) (0.066) (0.077) (0.063) (0.069) (0.059) (0.068) (0.057) (0.066) (0.056)
Retail funds 1.086*** 0.789*** 0.781*** 0.574*** 0.676*** 0.510*** 0.706*** 0.511*** 0.720*** 0.536*** 0.687*** 0.500*** 0.615*** 0.473***(0.256) (0.177) (0.144) (0.106) (0.095) (0.073) (0.086) (0.070) (0.078) (0.065) (0.077) (0.064) (0.076) (0.063)
Index funds -1.439*** -0.823*** -1.455*** -0.921*** -1.405*** -1.032*** -1.435*** -1.053*** -1.394*** -1.029*** -1.344*** -1.000*** -1.274*** -1.073***(0.060) (0.061) (0.049) (0.050) (0.043) (0.043) (0.046) (0.047) (0.047) (0.051) (0.050) (0.052) (0.056) (0.056)
Foreign funds -0.228*** 0.006 -0.140*** 0.299*** -0.128*** 0.268*** -0.190*** 0.170** -0.142*** 0.248*** -0.089*** 0.215** -0.039 0.190*(0.047) (0.165) (0.034) (0.091) (0.029) (0.074) (0.030) (0.085) (0.030) (0.092) (0.031) (0.096) (0.031) (0.108)
Funds of funds 0.224*** 0.459*** 0.270*** 0.500*** 0.261*** 0.386*** 0.222*** 0.307*** 0.222*** 0.278*** 0.201*** 0.278*** 0.192*** 0.228***(0.054) (0.043) (0.048) (0.038) (0.045) (0.037) (0.048) (0.040) (0.048) (0.040) (0.048) (0.040) (0.049) (0.040)
Claiming non-financial characteristics without a label 0.404*** 0.135 0.276** 0.116 0.236** 0.113 0.172* 0.116 0.160* 0.079 0.197** 0.123* 0.180* 0.100(0.139) (0.099) (0.117) (0.086) (0.098) (0.072) (0.097) (0.073) (0.093) (0.072) (0.093) (0.071) (0.092) (0.072)
Labelled but no claim 0.337*** 0.165* 0.386*** 0.248*** 0.346*** 0.237*** 0.394*** 0.300*** 0.297*** 0.236*** 0.284*** 0.227*** 0.169** 0.093(0.129) (0.093) (0.107) (0.080) (0.090) (0.069) (0.091) (0.070) (0.087) (0.069) (0.086) (0.068) (0.084) (0.068)
No non-financial reference 0.468*** 0.136* 0.516*** 0.226*** 0.447*** 0.211*** 0.398*** 0.197*** 0.300*** 0.133** 0.327*** 0.149*** 0.257*** 0.127**(0.105) (0.074) (0.087) (0.063) (0.073) (0.054) (0.072) (0.054) (0.069) (0.053) (0.068) (0.053) (0.066) (0.052)
Age of funds 0.0003 0.002 0.001 0.001 0.001 0.003** 0.001 0.006*** 0.002 0.007*** 0.002 0.007*** 0.006*** 0.009***(0.003) (0.002) (0.002) (0.002) (0.002) (0.001) (0.002) (0.002) (0.002) (0.001) (0.002) (0.001) (0.002) (0.002)
Log (net assets) -0.093*** -0.042*** -0.068*** -0.031*** -0.065*** -0.030*** -0.059*** -0.029*** -0.058*** -0.038*** -0.058*** -0.040*** -0.051*** -0.036***(0.009) (0.007) (0.007) (0.005) (0.005) (0.004) (0.005) (0.004) (0.005) (0.004) (0.005) (0.004) (0.005) (0.004)
Gross performance N-1 0.493*** 0.626*** -0.855*** -0.598*** -0.012 -0.009 -0.065 -0.271*** 0.131 0.114 0.422*** 0.081 0.239** 0.218***(0.176) (0.126) (0.171) (0.126) (0.149) (0.112) (0.081) (0.062) (0.103) (0.079) (0.100) (0.078) (0.100) (0.079)
Constant 2.146*** 1.697*** 1.929*** 1.597*** 2.176*** 1.649*** 2.173*** 1.550*** 2.136*** 1.815*** 2.087*** 1.871*** 1.962*** 1.759***(0.301) (0.654) (0.192) (0.583) (0.137) (0.554) (0.127) (0.431) (0.120) (0.156) (0.121) (0.157) (0.121) (0.166)
FIXED AMC EFFECTS N Y N Y N Y N Y N Y N Y N YR squared 0.310 0.736 0.337 0.722 0.336 0.709 0.288 0.676 0.285 0.653 0.278 0.652 0.259 0.640
Nb obs 2 502 2 502 3 257 3 257 421 421 4 824 4 824 4 935 4 935 4 889 4 889 4 277 4 277F-test 93.071*** 21.335*** 137.596*** 24.022*** 176.845*** 26.832*** 162.465*** 26.180*** 163.521*** 24.840*** 156.186*** 25.786*** 124.418*** 22.649***
* p<0.1, ** p<0.05, *** p<0.01
Dependent variable: Total expense ratio (TER, as a %)EQUITY funds, OLS by year
2012 2013 2014 2015 2016 2017 2018
Size of class variable
Gross performance of fund in year N-1
“Type of client” dummies
Reference category: FCPE
“Type of management”indicator
“Nationality” indicator
“Fund of funds”indicator
“Non-financial”indicator
Reference category: Funds claiming
consideration of non-financial criteria and with
a label
Fund age variable

43/49
Table 18: Regression analyses of the TER on the bond fund population, year by year
NB: In 2018, all else being equal (and controlling for the specific nature of each AMC), the TER of a bond fund without any non-financial reference was 11.8 basis points more than that of a fund claiming a non-financial approach and having a label in 2021 (the reference category). The difference was 18.3 basis points in 2012 (significant at 10%).
Institutional funds -0.095 -0.076 -0.100 -0.019 -0.163** -0.109 -0.263*** -0.343*** -0.289*** -0.422*** -0.286*** -0.411*** -0.381*** -0.425***(0.223) (0.183) (0.167) (0.154) (0.083) (0.084) (0.079) (0.075) (0.068) (0.068) (0.067) (0.066) (0.065) (0.062)
Mixed fund 0.274 0.241 0.238 0.299* 0.258*** 0.258*** 0.222*** 0.097 0.208*** 0.048 0.234*** 0.080 0.142** 0.055(0.219) (0.181) (0.163) (0.153) (0.079) (0.081) (0.076) (0.073) (0.065) (0.066) (0.064) (0.064) (0.062) (0.060)
Retail funds 0.422* 0.343* 0.379** 0.372** 0.301*** 0.310*** 0.291*** 0.176** 0.284*** 0.131* 0.330*** 0.173** 0.247*** 0.159**(0.227) (0.186) (0.172) (0.159) (0.089) (0.090) (0.085) (0.081) (0.074) (0.074) (0.073) (0.072) (0.071) (0.068)
Index funds -0.408*** -0.516*** -0.581*** -0.708*** -0.581*** -0.696*** -0.691*** -0.649*** -0.736*** -0.618*** -0.768*** -0.642*** -0.649*** -0.554***(0.091) (0.099) (0.088) (0.108) (0.071) (0.097) (0.073) (0.088) (0.067) (0.090) (0.074) (0.095) (0.082) (0.101)
Foreign funds 0.225*** 0.257 0.431*** 0.335* 0.322*** 0.272** 0.359*** 0.303*** 0.359*** 0.338*** 0.335*** 0.190 0.270*** 0.209(0.043) (0.402) (0.034) (0.175) (0.024) (0.110) (0.026) (0.114) (0.024) (0.130) (0.025) (0.171) (0.026) (0.156)
Funds of funds 0.292*** 0.188*** 0.218*** 0.174*** 0.172*** 0.126*** 0.200*** 0.162*** 0.153*** 0.109** 0.136*** 0.137*** 0.101** 0.158***(0.050) (0.046) (0.051) (0.050) (0.044) (0.044) (0.046) (0.046) (0.045) (0.046) (0.047) (0.048) (0.047) (0.046)
Claiming non-financial characteristics without a label 0.193 0.185 0.167 0.167 0.154 0.156 0.097 0.112 0.133 0.121 0.139 0.134 0.134 0.079(0.139) (0.125) (0.130) (0.129) (0.099) (0.099) (0.101) (0.094) (0.097) (0.095) (0.097) (0.094) (0.095) (0.088)
Labelled but no claim 0.116 0.013 0.336** 0.256** 0.154 0.211** 0.162 0.175* 0.086 0.062 0.146 0.149 0.144 0.099(0.143) (0.129) (0.135) (0.130) (0.102) (0.100) (0.108) (0.101) (0.103) (0.102) (0.103) (0.103) (0.099) (0.097)
No non-financial reference 0.183* 0.030 0.266*** 0.093 0.204*** 0.090 0.260*** 0.141** 0.271*** 0.123* 0.290*** 0.167** 0.253*** 0.118*(0.106) (0.094) (0.103) (0.095) (0.074) (0.069) (0.080) (0.071) (0.077) (0.072) (0.075) (0.071) (0.072) (0.066)
Age of funds 0.003 0.004** -0.0003 0.003 0.002 0.003** -0.002 0.003* -0.002 0.003** -0.002 0.003** 0.001 0.006***(0.002) (0.002) (0.002) (0.002) (0.001) (0.002) (0.002) (0.001) (0.001) (0.001) (0.001) (0.001) (0.001) (0.001)
Log (net assets) -0.022*** -0.025*** -0.011* -0.020*** -0.028*** -0.039*** -0.024*** -0.030*** -0.029*** -0.033*** -0.031*** -0.033*** -0.034*** -0.034***(0.008) (0.008) (0.007) (0.007) (0.005) (0.005) (0.005) (0.004) (0.004) (0.004) (0.004) (0.004) (0.004) (0.004)
Gross performance N-1 4.110*** 3.404*** -2.700*** -1.722*** 2.787*** 2.343*** 0.738*** 0.023 -0.512*** -0.600*** -0.950*** -1.364*** 3.210*** 2.625***(0.330) (0.297) (0.317) (0.340) (0.148) (0.155) (0.207) (0.191) (0.164) (0.157) (0.214) (0.205) (0.203) (0.181)
Constant 0.614** 0.959** 0.566** 0.862* 0.587*** 1.066*** 0.831*** 1.297*** 0.959*** 1.394*** 0.952*** 1.401*** 0.931*** 1.311***(0.281) (0.447) (0.224) (0.472) (0.133) (0.190) (0.130) (0.185) (0.118) (0.192) (0.116) (0.224) (0.114) (0.214)
FIXED AMC EFFECTS N Y N Y N Y N Y N Y N Y N YR squared 0.345 0.651 0.264 0.555 0.373 0.586 0.271 0.561 0.310 0.540 0.310 0.544 0.378 0.614
Nb obs 885 885 1 185 1 185 167 167 2 158 2 158 2 296 2 296 2 357 2 357 2 082 2 082F-test 38.285*** 9.275*** 35.027*** 6.908*** 81.990*** 9.670*** 66.381*** 11.133*** 85.288*** 10.760*** 87.699*** 11.562*** 104.559*** 14.566***
* p<0.1, ** p<0.05, *** p<0.01
Dependent variable: Total expense ratio (TER, as a %)BONDS funds, OLS by year
2012 2013 2014 2015 2016 2017 2018
Size of class variable
Gross performance of fund in year N-1
“Type of client” dummies
Reference category: FCPE
“Type of management”indicator
“Nationality” indicator
“Fund of funds”indicator
“Non-financial”indicator
Reference category: Funds claiming
consideration of non-financial criteria and with
a label
Fund age variable

44/49
Table 19: Regression analyses of the TER on the diversified fund population, year by year
NB: In 2018, all else being equal (and controlling for the specific nature of each AMC), the TER of a diversified fund without any non-financial reference was 29.6 basis points more than that of a fund claiming a non-financial approach and having a label in 2021 (the reference category).
Institutional funds -0.288 -0.369 -0.111 -0.478*** -0.239* -0.445*** -0.191* -0.488*** -0.142 -0.396*** -0.178* -0.469*** -0.222** -0.451***(0.374) (0.260) (0.206) (0.160) (0.130) (0.115) (0.101) (0.097) (0.096) (0.092) (0.096) (0.091) (0.092) (0.091)
Mixed fund 0.758** 0.324 0.581*** 0.097 0.563*** 0.151 0.499*** 0.095 0.496*** 0.163** 0.406*** 0.069 0.379*** 0.119*(0.356) (0.247) (0.184) (0.148) (0.102) (0.098) (0.074) (0.081) (0.068) (0.073) (0.066) (0.071) (0.064) (0.070)
Retail funds 0.454 0.422 0.664*** 0.284 0.462*** 0.339** 0.483*** 0.261** 0.484*** 0.294** 0.368*** 0.210* 0.391*** 0.252**(0.384) (0.264) (0.229) (0.179) (0.158) (0.138) (0.125) (0.118) (0.125) (0.119) (0.124) (0.115) (0.121) (0.117)
Index funds -0.468 -0.212 1.935*** -0.143 1.902*** -0.150 -0.538 -0.075 -0.249 -0.798 -0.201 -1.037 -0.354 -1.183(0.999) (0.648) (0.555) (0.657) (0.519) (0.674) (0.477) (0.645) (0.585) (0.691) (0.578) (0.665) (0.755) (0.776)
Foreign funds -0.319* -0.301 0.151 -0.070 -0.012 -0.266 0.060 -0.589** 0.013 -0.591** 0.163** 0.026 0.045 -0.133(0.169) (0.667) (0.109) (0.272) (0.083) (0.269) (0.068) (0.265) (0.067) (0.265) (0.072) (0.230) (0.067) (0.233)
Funds of funds -0.028 0.279*** 0.078 0.393*** 0.163*** 0.382*** 0.224*** 0.429*** 0.189*** 0.381*** 0.193*** 0.361*** 0.304*** 0.427***(0.077) (0.066) (0.070) (0.062) (0.062) (0.060) (0.054) (0.053) (0.056) (0.055) (0.056) (0.054) (0.054) (0.055)
Claiming non-financial characteristics without a label -0.046 -0.051 0.293 0.098 0.380 0.366* 0.215 0.091 0.150 0.103 0.192 0.204 0.393** 0.350**(0.417) (0.317) (0.372) (0.309) (0.259) (0.220) (0.199) (0.174) (0.182) (0.158) (0.178) (0.154) (0.170) (0.152)
Labelled but no claim 0.215 0.058 0.638 0.174 0.459* 0.368* 0.396* 0.107 0.313 0.055 0.317 0.085 0.292 0.126(0.449) (0.339) (0.402) (0.330) (0.269) (0.223) (0.219) (0.189) (0.206) (0.183) (0.201) (0.176) (0.187) (0.173)
No non-financial reference 0.429 0.218 0.808** 0.344 0.661*** 0.523*** 0.549*** 0.250* 0.483*** 0.204 0.520*** 0.270** 0.520*** 0.296**(0.382) (0.292) (0.340) (0.281) (0.221) (0.181) (0.169) (0.141) (0.155) (0.132) (0.149) (0.126) (0.138) (0.123)
Age of funds -0.014** -0.003 -0.012** 0.0002 -0.014*** -0.0005 -0.008** 0.004 -0.001 0.010*** -0.004 0.006* 0.002 0.012***(0.006) (0.005) (0.005) (0.004) (0.004) (0.004) (0.004) (0.003) (0.003) (0.003) (0.003) (0.003) (0.003) (0.003)
Log (net assets) -0.076*** -0.019 -0.047*** -0.015 -0.057*** -0.020* -0.066*** -0.030*** -0.053*** -0.024** -0.045*** -0.012 -0.052*** -0.023**(0.019) (0.015) (0.015) (0.013) (0.012) (0.011) (0.011) (0.010) (0.010) (0.010) (0.010) (0.010) (0.010) (0.010)
Gross performance N-1 6.123*** 4.139*** -4.560*** -3.859*** 0.840* 3.000*** 2.441*** 2.661*** 0.562 3.021*** 3.668*** 4.516*** 2.362*** 2.054***(0.606) (0.513) (0.571) (0.539) (0.507) (0.516) (0.323) (0.330) (0.575) (0.606) (0.477) (0.526) (0.582) (0.661)
Constant 1.975*** 1.759** 1.357*** 1.670** 1.839*** 1.981*** 1.852*** 2.507*** 1.797*** 2.392*** 1.573*** 2.242*** 1.592*** 2.359***(0.594) (0.793) (0.446) (0.756) (0.300) (0.537) (0.237) (0.499) (0.223) (0.499) (0.221) (0.485) (0.213) (0.477)
FIXED AMC EFFECTS N Y N Y N Y N Y N Y N Y N YR squared 0.206 0.744 0.152 0.693 0.137 0.617 0.169 0.590 0.118 0.560 0.146 0.585 0.149 0.555
Nb obs 880 880 1 011 1 011 1 208 1 208 1 371 1 371 1 382 1 382 1 325 1 325 1 224 1 224F-test 18.727*** 9.889*** 14.964*** 7.742*** 15.848*** 6.176*** 23.081*** 6.397*** 15.263*** 5.654*** 18.688*** 6.458*** 17.698*** 5.354***
* p<0.1, ** p<0.05, *** p<0.01
Dependent variable: Total expense ratio (TER, as a %)DIVERSIFIED funds, OLS by year
2012 2013 2014 2015 2016 2017 2018
Size of class variable
Gross performance of fund in year N-1
“Type of client” dummies
Reference category: FCPE
“Type of management”indicator
“Nationality” indicator
“Fund of funds”indicator
“Non-financial”indicator
Reference category: Funds claiming
consideration of non-financial criteria and with a
label
Fund age variable

45/49
Table 20: Regression analyses of the TER on the money market fund population, year by year
NB: In 2018, all else being equal (and controlling for the specific nature of each AMC), the TER of a money market fund without any non-financial reference was 3.3 basis points less (deviation not significantly different from 0) than that of a fund claiming a non-financial approach and having a label in 2021 (the reference category). Whatever the year considered, the degree of consideration of non-financial criteria is apparently not able to account significantly for the cost differences between money market funds (which could be explained by the small number of observations relative to the number of explanatory variables).
Institutional funds 0.117 0.178 0.112 0.047 -0.007 -0.020 0.030 0.025 -0.037 -0.040 -0.108*** -0.098*** -0.144*** -0.138***(0.195) (0.179) (0.126) (0.129) (0.058) (0.067) (0.050) (0.054) (0.036) (0.037) (0.032) (0.032) (0.034) (0.030)
Mixed fund 0.321* 0.329* 0.332*** 0.206* 0.101* 0.086 0.136*** 0.112** 0.055* 0.038 -0.028 -0.024 -0.054* -0.054*(0.192) (0.176) (0.121) (0.124) (0.054) (0.063) (0.046) (0.050) (0.032) (0.033) (0.029) (0.029) (0.031) (0.028)
Retail funds 0.284 0.341* 0.282* 0.170 0.199** 0.155* 0.178*** 0.137* 0.058 0.056 -0.023 -0.037 -0.067 -0.095**(0.207) (0.191) (0.145) (0.147) (0.079) (0.090) (0.068) (0.074) (0.055) (0.054) (0.047) (0.048) (0.048) (0.044)
Index funds -0.313** -0.267* -0.331** -0.302* -0.161 -0.200 -0.251 -0.058 -0.080 0.087 -0.033 0.113 -0.059 0.023(0.139) (0.142) (0.159) (0.169) (0.164) (0.235) (0.262) (0.290) (0.211) (0.218) (0.175) (0.186) (0.111) (0.179)
Foreign funds 0.056 0.450 0.083 0.193 0.110*** 0.223 0.098*** 0.250* 0.126*** 0.231** 0.157*** 0.241*** 0.163*** 0.107(0.077) (0.473) (0.060) (0.214) (0.034) (0.144) (0.029) (0.131) (0.022) (0.099) (0.019) (0.091) (0.020) (0.074)
Funds of funds 0.325*** 0.221*** 0.400*** 0.238*** 0.205*** 0.167*** 0.204*** 0.166*** 0.094*** 0.060** 0.025 0.014 -0.009 -0.0003(0.039) (0.043) (0.043) (0.048) (0.031) (0.036) (0.030) (0.034) (0.025) (0.027) (0.023) (0.024) (0.027) (0.025)
Claiming non-financial characteristics without a label -0.070 -0.033 -0.114 -0.010 -0.0001 -0.019 -0.040 0.034 -0.034 0.019 -0.033 -0.014 -0.022 -0.026(0.154) (0.152) (0.154) (0.156) (0.099) (0.107) (0.083) (0.089) (0.064) (0.064) (0.053) (0.053) (0.051) (0.047)
Labelled but no claim -0.033 0.025 -0.017 0.072 -0.054 -0.031 -0.058 0.035 -0.033 0.053 -0.037 0.021 -0.042 -0.009(0.134) (0.128) (0.143) (0.138) (0.092) (0.098) (0.079) (0.084) (0.061) (0.061) (0.050) (0.050) (0.046) (0.042)
No non-financial reference 0.108 0.039 0.095 0.067 0.033 0.027 0.033 0.064 -0.008 0.024 -0.031 -0.015 -0.022 -0.033(0.113) (0.107) (0.121) (0.116) (0.077) (0.081) (0.066) (0.067) (0.050) (0.048) (0.041) (0.040) (0.038) (0.033)
Age of funds -0.015*** -0.011*** -0.020*** -0.014*** -0.007*** -0.006*** -0.007*** -0.004** -0.004*** -0.001 -0.0001 0.0003 0.003** 0.003***(0.002) (0.002) (0.002) (0.002) (0.002) (0.002) (0.002) (0.002) (0.001) (0.001) (0.001) (0.001) (0.001) (0.001)
Log (net assets) 0.019** 0.006 0.022** 0.010 0.014** 0.013** 0.012** 0.009 -0.004 -0.006 -0.012*** -0.010*** -0.016*** -0.013***(0.008) (0.009) (0.009) (0.009) (0.006) (0.006) (0.005) (0.005) (0.004) (0.004) (0.003) (0.003) (0.003) (0.003)
Gross performance N-1 2.489*** 11.178*** -3.018*** -4.961*** 8.423*** 6.700*** 8.717*** 5.980*** 3.773*** 2.976*** 1.321 1.209 6.227*** 6.853***(0.693) (1.661) (0.794) (0.989) (0.449) (0.495) (0.851) (0.881) (0.877) (0.829) (1.004) (0.965) (1.745) (1.555)
Constant -0.244 -0.227 -0.197 -0.088 -0.132 -0.164 -0.100 -0.266 0.239** 0.076 0.429*** 0.229* 0.479*** 0.313***(0.274) (0.425) (0.230) (0.429) (0.139) (0.312) (0.121) (0.190) (0.094) (0.143) (0.079) (0.123) (0.081) (0.105)
FIXED AMC EFFECTS N Y N Y N Y N Y N Y N Y N YR squared 0.285 0.534 0.355 0.570 0.576 0.658 0.359 0.496 0.163 0.423 0.191 0.431 0.326 0.631
Nb obs 495 495 495 495 524 524 544 544 551 551 522 522 398 398F-test 16.022*** 5.435*** 22.079*** 5.873*** 57.760*** 8.887*** 24.759*** 4.755*** 8.720*** 3.604*** 10.019*** 3.627*** 15.530*** 6.870***
* p<0.1, ** p<0.05, *** p<0.01
Dependent variable: Total expense ratio (TER, as a %)MONEY MARKET funds, OLS by year
2012 2013 2014 2015 2016 2017 2018
Size of class variable
Gross performance of fund in year N-1
“Type of client” dummies
Reference category: FCPE
“Type of management”indicator
“Nationality” indicator
“Fund of funds”indicator
“Non-financial”indicator
Reference category: Funds claiming
consideration of non-financial criteria and with a
label
Fund age variable
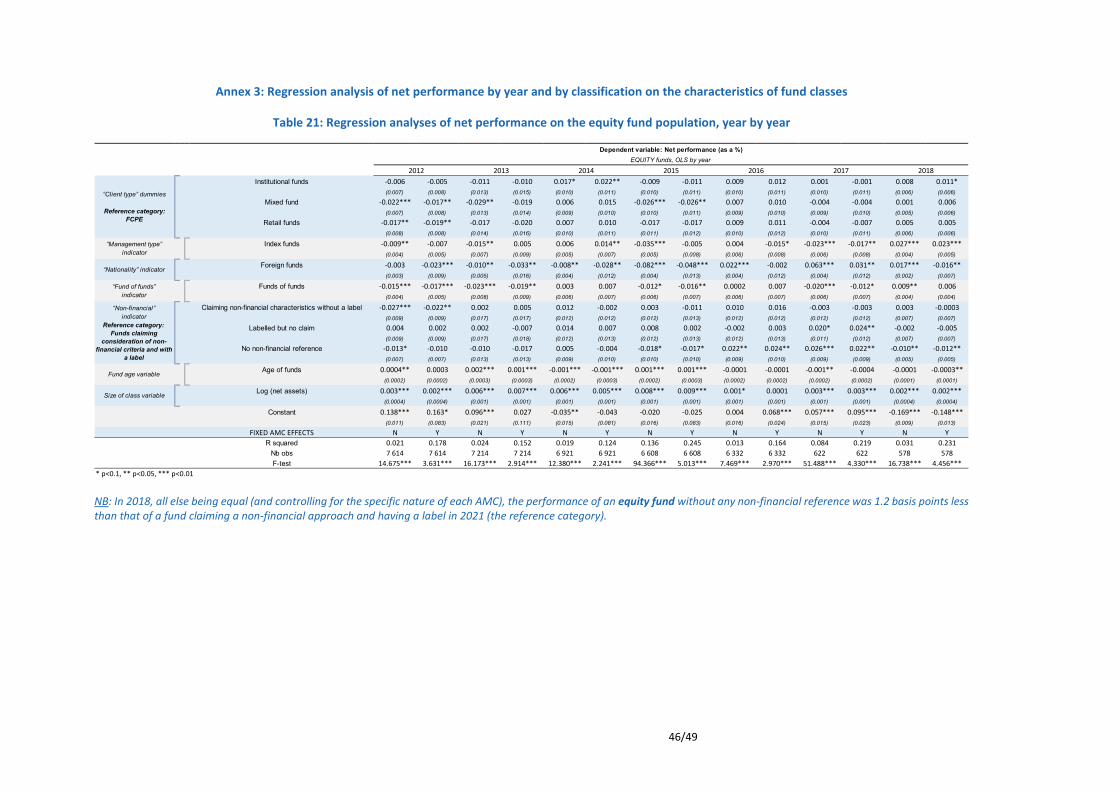
46/49
Annex 3: Regression analysis of net performance by year and by classification on the characteristics of fund classes
Table 21: Regression analyses of net performance on the equity fund population, year by year
NB: In 2018, all else being equal (and controlling for the specific nature of each AMC), the performance of an equity fund without any non-financial reference was 1.2 basis points less than that of a fund claiming a non-financial approach and having a label in 2021 (the reference category).
Institutional funds -0.006 -0.005 -0.011 -0.010 0.017* 0.022** -0.009 -0.011 0.009 0.012 0.001 -0.001 0.008 0.011*(0.007) (0.008) (0.013) (0.015) (0.010) (0.011) (0.010) (0.011) (0.010) (0.011) (0.010) (0.011) (0.006) (0.006)
Mixed fund -0.022*** -0.017** -0.029** -0.019 0.006 0.015 -0.026*** -0.026** 0.007 0.010 -0.004 -0.004 0.001 0.006(0.007) (0.008) (0.013) (0.014) (0.009) (0.010) (0.010) (0.011) (0.009) (0.010) (0.009) (0.010) (0.005) (0.006)
Retail funds -0.017** -0.019** -0.017 -0.020 0.007 0.010 -0.017 -0.017 0.009 0.011 -0.004 -0.007 0.005 0.005(0.008) (0.008) (0.014) (0.016) (0.010) (0.011) (0.011) (0.012) (0.010) (0.012) (0.010) (0.011) (0.006) (0.006)
Index funds -0.009** -0.007 -0.015** 0.005 0.006 0.014** -0.035*** -0.005 0.004 -0.015* -0.023*** -0.017** 0.027*** 0.023***(0.004) (0.005) (0.007) (0.009) (0.005) (0.007) (0.005) (0.008) (0.006) (0.008) (0.006) (0.008) (0.004) (0.005)
Foreign funds -0.003 -0.023*** -0.010** -0.033** -0.008** -0.028** -0.082*** -0.048*** 0.022*** -0.002 0.063*** 0.031** 0.017*** -0.016**(0.003) (0.009) (0.005) (0.016) (0.004) (0.012) (0.004) (0.013) (0.004) (0.012) (0.004) (0.012) (0.002) (0.007)
Funds of funds -0.015*** -0.017*** -0.023*** -0.019** 0.003 0.007 -0.012* -0.016** 0.0002 0.007 -0.020*** -0.012* 0.009** 0.006(0.004) (0.005) (0.008) (0.009) (0.006) (0.007) (0.006) (0.007) (0.006) (0.007) (0.006) (0.007) (0.004) (0.004)
Claiming non-financial characteristics without a label -0.027*** -0.022** 0.002 0.005 0.012 -0.002 0.003 -0.011 0.010 0.016 -0.003 -0.003 0.003 -0.0003(0.009) (0.009) (0.017) (0.017) (0.012) (0.012) (0.012) (0.013) (0.012) (0.012) (0.012) (0.012) (0.007) (0.007)
Labelled but no claim 0.004 0.002 0.002 -0.007 0.014 0.007 0.008 0.002 -0.002 0.003 0.020* 0.024** -0.002 -0.005(0.009) (0.009) (0.017) (0.018) (0.012) (0.013) (0.012) (0.013) (0.012) (0.013) (0.011) (0.012) (0.007) (0.007)
No non-financial reference -0.013* -0.010 -0.010 -0.017 0.005 -0.004 -0.018* -0.017* 0.022** 0.024** 0.026*** 0.022** -0.010** -0.012**(0.007) (0.007) (0.013) (0.013) (0.009) (0.010) (0.010) (0.010) (0.009) (0.010) (0.009) (0.009) (0.005) (0.005)
Age of funds 0.0004** 0.0003 0.002*** 0.001*** -0.001*** -0.001*** 0.001*** 0.001*** -0.0001 -0.0001 -0.001** -0.0004 -0.0001 -0.0003**(0.0002) (0.0002) (0.0003) (0.0003) (0.0002) (0.0003) (0.0002) (0.0003) (0.0002) (0.0002) (0.0002) (0.0002) (0.0001) (0.0001)
Log (net assets) 0.003*** 0.002*** 0.006*** 0.007*** 0.006*** 0.005*** 0.008*** 0.009*** 0.001* 0.0001 0.003*** 0.003*** 0.002*** 0.002***(0.0004) (0.0004) (0.001) (0.001) (0.001) (0.001) (0.001) (0.001) (0.001) (0.001) (0.001) (0.001) (0.0004) (0.0004)
Constant 0.138*** 0.163* 0.096*** 0.027 -0.035** -0.043 -0.020 -0.025 0.004 0.068*** 0.057*** 0.095*** -0.169*** -0.148***(0.011) (0.083) (0.021) (0.111) (0.015) (0.081) (0.016) (0.083) (0.016) (0.024) (0.015) (0.023) (0.009) (0.013)
FIXED AMC EFFECTS N Y N Y N Y N Y N Y N Y N YR squared 0.021 0.178 0.024 0.152 0.019 0.124 0.136 0.245 0.013 0.164 0.084 0.219 0.031 0.231
Nb obs 7 614 7 614 7 214 7 214 6 921 6 921 6 608 6 608 6 332 6 332 622 622 578 578F-test 14.675*** 3.631*** 16.173*** 2.914*** 12.380*** 2.241*** 94.366*** 5.013*** 7.469*** 2.970*** 51.488*** 4.330*** 16.738*** 4.456***
* p<0.1, ** p<0.05, *** p<0.01
Dependent variable: Net performance (as a %)EQUITY funds, OLS by year
2012 2013 2014 2015 2016 2017 2018
Size of class variable
“Client type” dummies
Reference category: FCPE
“Management type”indicator
“Nationality” indicator
“Fund of funds”indicator
“Non-financial”indicator
Reference category: Funds claiming
consideration of non-financial criteria and with
a label
Fund age variable

47/49
Table 22: Regression analyses of net performance on the bond fund population, year by year
NB: In 2018, all else being equal (and controlling for the specific nature of each AMC), the performance of a bond fund without any non-financial reference was 1.5 basis points less than that of a fund claiming a non-financial approach and having a label in 2021 (the reference category).
Institutional funds 0.032*** 0.013 0.004 -0.005 -0.010 -0.015* 0.001 0.002 0.014** 0.008 0.010* 0.005 -0.003 0.001(0.009) (0.009) (0.007) (0.007) (0.008) (0.009) (0.006) (0.007) (0.007) (0.007) (0.006) (0.006) (0.005) (0.005)
Mixed fund 0.020** 0.002 0.001 -0.010 -0.021*** -0.025*** -0.003 -0.004 0.003 0.001 0.006 0.002 -0.009* -0.003(0.009) (0.009) (0.007) (0.007) (0.008) (0.009) (0.006) (0.007) (0.006) (0.007) (0.006) (0.006) (0.005) (0.005)
Retail funds 0.034*** 0.007 -0.007 -0.015* -0.023*** -0.017* -0.009 -0.005 0.015** 0.006 0.006 -0.007 -0.015*** -0.005(0.010) (0.010) (0.007) (0.008) (0.009) (0.009) (0.007) (0.007) (0.007) (0.008) (0.006) (0.007) (0.005) (0.005)
Index funds -0.030*** -0.019* -0.009* 0.0002 0.050*** 0.044*** 0.014*** 0.018** -0.009* 0.008 -0.015*** -0.006 0.026*** 0.021***(0.007) (0.010) (0.005) (0.008) (0.006) (0.010) (0.005) (0.008) (0.005) (0.008) (0.004) (0.007) (0.004) (0.005)
Foreign funds -0.004 0.003 -0.029*** 0.005 -0.002 0.003 -0.021*** -0.008 0.022*** 0.010 0.009*** 0.003 -0.009*** -0.018**(0.003) (0.011) (0.002) (0.009) (0.003) (0.012) (0.002) (0.010) (0.002) (0.012) (0.002) (0.009) (0.002) (0.007)
Funds of funds -0.0002 0.001 -0.001 0.0003 0.005 -0.003 0.005 0.006 -0.002 0.001 -0.001 0.0001 0.0001 -0.002(0.005) (0.006) (0.004) (0.005) (0.005) (0.006) (0.004) (0.005) (0.004) (0.005) (0.004) (0.005) (0.003) (0.004)
Claiming non-financial characteristics without a label 0.008 0.001 0.005 0.002 0.005 0.003 -0.002 0.004 -0.004 0.0004 0.002 0.004 -0.007 -0.005(0.013) (0.013) (0.010) (0.010) (0.012) (0.012) (0.009) (0.009) (0.009) (0.010) (0.007) (0.008) (0.006) (0.006)
Labelled but no claim 0.036** 0.006 0.012 0.002 0.010 0.004 -0.002 0.004 0.004 -0.005 0.011 0.007 -0.022*** -0.021***(0.015) (0.015) (0.011) (0.012) (0.014) (0.014) (0.010) (0.011) (0.010) (0.011) (0.009) (0.009) (0.007) (0.007)
No non-financial reference 0.017 -0.001 0.002 -0.005 -0.011 -0.012 -0.004 0.004 0.009 0.004 0.016*** 0.007 -0.018*** -0.015***(0.010) (0.010) (0.008) (0.008) (0.010) (0.010) (0.008) (0.008) (0.007) (0.008) (0.006) (0.006) (0.005) (0.004)
Age of funds -0.002*** -0.001*** -0.0001 0.0003** 0.002*** 0.001*** 0.001*** 0.001*** -0.001*** -0.001*** -0.001*** -0.0005*** 0.001*** 0.001***(0.0002) (0.0002) (0.0001) (0.0001) (0.0002) (0.0002) (0.0001) (0.0001) (0.0001) (0.0001) (0.0001) (0.0001) (0.0001) (0.0001)
Log (net assets) 0.002*** 0.002*** 0.002*** 0.001*** -0.001 0.0001 0.001*** 0.001** 0.001*** 0.001*** 0.001*** 0.001** 0.001** 0.0005*(0.0005) (0.0005) (0.0004) (0.0004) (0.0005) (0.0005) (0.0004) (0.0004) (0.0004) (0.0004) (0.0003) (0.0003) (0.0003) (0.0003)
Constant 0.044*** 0.069 -0.015 -0.011 0.065*** 0.034 -0.017 -0.062*** 0.005 0.035* -0.008 0.040*** -0.019** -0.031***(0.015) (0.062) (0.011) (0.050) (0.014) (0.022) (0.011) (0.017) (0.011) (0.018) (0.009) (0.015) (0.008) (0.012)
FIXED AMC EFFECTS N Y N Y N Y N Y N Y N Y N YR squared 0.039 0.273 0.072 0.272 0.052 0.229 0.064 0.254 0.072 0.202 0.043 0.219 0.068 0.326
Nb obs 3 312 3 312 3 364 3 364 3 317 3 317 3 266 3 266 3 239 3 239 3 253 3 253 3 069 3 069F-test 12.058*** 4.402*** 23.741*** 4.408*** 16.350*** 3.498*** 20.379*** 4.027*** 22.700*** 2.908*** 13.245*** 3.318*** 20.432*** 5.583***
* p<0.1, ** p<0.05, *** p<0.01
Dependent variable: Net performance (as a %)BONDS funds, OLS by year
2012 2013 2014 2015 2016 2017 2018
Size of class variable
“Client type” dummies
Reference category: FCPE
“Management type”indicator
“Nationality” indicator
“Fund of funds”indicator
“Non-financial”indicator
Reference category: Funds claiming
consideration of non-financial criteria and with
a label
Fund age variable

48/49
Table 23: Regression analyses of net performance on the diversified fund population, year by year
NB: In 2018, all else being equal (and controlling for the specific nature of each AMC), the performance of a diversified fund without any non-financial reference was 1.9 basis points less than that of a fund claiming a non-financial approach and having a label in 2021 (the reference category).
Institutional funds -0.014** 0.002 -0.018** 0.003 -0.004 -0.005 0.006 0.011** -0.004 0.002 -0.001 0.005 0.003 0.006(0.006) (0.005) (0.007) (0.007) (0.004) (0.005) (0.005) (0.005) (0.004) (0.004) (0.005) (0.005) (0.004) (0.004)
Mixed fund -0.013*** -0.004 -0.012** -0.002 -0.005 -0.005 0.001 0.006 -0.002 -0.003 0.002 0.004 -0.006* 0.001(0.004) (0.005) (0.005) (0.006) (0.003) (0.004) (0.004) (0.004) (0.003) (0.003) (0.003) (0.004) (0.003) (0.003)
Retail funds -0.008 0.007 -0.018** 0.004 -0.005 -0.015*** -0.005 -0.002 -0.012** -0.004 0.001 0.006 0.006 0.004(0.007) (0.007) (0.009) (0.009) (0.005) (0.005) (0.006) (0.006) (0.006) (0.005) (0.006) (0.006) (0.006) (0.005)
Index funds -0.028 0.0003 -0.021 -0.005 0.032 0.024 -0.004 -0.010 0.018 -0.053* 0.002 -0.043 0.010 0.080**(0.031) (0.033) (0.039) (0.058) (0.024) (0.035) (0.026) (0.037) (0.024) (0.032) (0.022) (0.036) (0.020) (0.032)
Foreign funds -0.003 -0.010 -0.020*** 0.032* 0.009*** 0.059*** -0.048*** -0.028*** 0.005* 0.016* 0.009*** 0.022** 0.009*** -0.002(0.004) (0.012) (0.004) (0.017) (0.003) (0.011) (0.003) (0.010) (0.003) (0.008) (0.003) (0.009) (0.003) (0.007)
Funds of funds -0.001 0.002 -0.002 -0.002 0.012*** 0.006** -0.002 -0.003 -0.007*** -0.0002 -0.004 -0.001 0.001 -0.005**(0.003) (0.003) (0.004) (0.004) (0.002) (0.003) (0.003) (0.003) (0.003) (0.002) (0.003) (0.003) (0.003) (0.002)
Claiming non-financial characteristics without a label -0.008 -0.005 0.007 0.022 0.001 0.0004 0.014 0.013 -0.004 -0.002 0.011 0.013 -0.021** -0.018**(0.012) (0.010) (0.015) (0.014) (0.009) (0.008) (0.010) (0.009) (0.009) (0.007) (0.010) (0.008) (0.009) (0.007)
Labelled but no claim 0.025* 0.017 0.002 0.014 -0.001 0.012 0.017 0.018* 0.001 0.001 0.027** 0.019* -0.015 -0.009(0.014) (0.012) (0.017) (0.016) (0.010) (0.010) (0.011) (0.010) (0.010) (0.009) (0.011) (0.010) (0.009) (0.008)
No non-financial reference 0.003 -0.0005 0.003 0.006 -0.006 0.005 0.006 0.003 0.005 0.005 0.022*** 0.011 -0.023*** -0.019***(0.010) (0.009) (0.013) (0.012) (0.008) (0.007) (0.008) (0.007) (0.007) (0.006) (0.008) (0.007) (0.007) (0.006)
Age of funds 0.001*** 0.001*** 0.001*** 0.001*** 0.0003* -0.0001 0.001*** 0.001*** -0.0004** 0.00003 0.0002 0.0004** -0.0005*** -0.001***(0.0002) (0.0002) (0.0003) (0.0003) (0.0002) (0.0002) (0.0002) (0.0002) (0.0002) (0.0001) (0.0002) (0.0002) (0.0001) (0.0001)
Log (net assets) 0.002*** 0.001 0.002*** 0.002** 0.002*** 0.001** 0.001** 0.001* 0.002*** 0.0002 0.00002 -0.0004 0.002*** 0.001**(0.001) (0.001) (0.001) (0.001) (0.0004) (0.0004) (0.0005) (0.0005) (0.0004) (0.0004) (0.0005) (0.0005) (0.0005) (0.0004)
Constant 0.058*** 0.012 0.051*** -0.030 0.012 0.053** 0.006 0.017 0.0004 0.078*** 0.033*** 0.052* -0.084*** -0.122***(0.013) (0.032) (0.016) (0.044) (0.010) (0.026) (0.011) (0.028) (0.010) (0.024) (0.011) (0.027) (0.010) (0.023)
FIXED AMC EFFECTS N Y N Y N Y N Y N Y N Y N YR squared 0.036 0.491 0.047 0.431 0.035 0.440 0.195 0.571 0.037 0.532 0.025 0.491 0.045 0.526
Nb obs 1 828 1 828 1 822 1 822 1 789 1 789 1 705 1 705 1 645 1 645 1 584 1 584 1 567 1 567F-test 6.105*** 4.843*** 8.064*** 3.874*** 5.909*** 4.049*** 37.273*** 6.707*** 5.636*** 5.507*** 3.735*** 4.642*** 6.592*** 5.430***
* p<0.1, ** p<0.05, *** p<0.01
Dependent variable: Net performance (as a %)DIVERSIFIED funds, OLS by year
2012 2013 2014 2015 2016 2017 2018
Size of class variable
“Client type” dummies
Reference category: FCPE
“Management type”indicator
“Nationality” indicator
“Fund of funds”indicator
“Non-financial”indicator
Reference category: Funds claiming
consideration of non-financial criteria and with a
label
Fund age variable

49/49
Table 24: Regression analyses of net performance on the money market fund population, year by year
NB: In 2018, all else being equal (and controlling for the specific nature of each AMC), the performance of a money market fund without any non-financial reference was 0.4 basis points more than that of a fund claiming a non-financial approach and having a label in 2021 (the reference category). However, the difference in performance is weakly significant.
Institutional funds 0.015*** 0.009 0.011** 0.010* 0.003 0.002 0.004* 0.004* 0.002 0.003** 0.0004 0.001 0.001 0.001(0.005) (0.006) (0.005) (0.005) (0.002) (0.002) (0.002) (0.002) (0.002) (0.001) (0.002) (0.002) (0.002) (0.002)
Mixed fund 0.019*** 0.014** 0.014*** 0.012** 0.001 0.001 0.005** 0.004** 0.003** 0.003** 0.001 0.001 0.001 0.001(0.005) (0.006) (0.004) (0.005) (0.002) (0.002) (0.002) (0.002) (0.001) (0.001) (0.001) (0.002) (0.002) (0.002)
Retail funds 0.009 0.001 0.005 0.003 -0.002 -0.003 0.001 0.0003 0.001 0.001 -0.001 -0.0003 -0.003 -0.002(0.007) (0.008) (0.006) (0.007) (0.003) (0.003) (0.003) (0.003) (0.002) (0.002) (0.002) (0.003) (0.003) (0.003)
Index funds -0.024** -0.017 -0.015 -0.010 -0.005 0.0001 -0.006 -0.004 -0.007 -0.008 -0.004 -0.002 -0.007 -0.0003(0.011) (0.013) (0.011) (0.013) (0.007) (0.008) (0.009) (0.014) (0.007) (0.008) (0.006) (0.013) (0.007) (0.013)
Foreign funds -0.007** 0.002 -0.003 0.0003 -0.0004 -0.002 -0.001 -0.003 -0.001 0.001 0.002* 0.002 0.007*** 0.001(0.003) (0.018) (0.003) (0.016) (0.001) (0.006) (0.001) (0.006) (0.001) (0.004) (0.001) (0.005) (0.001) (0.005)
Funds of funds 0.021*** 0.011*** 0.015*** 0.009*** 0.005*** 0.005*** 0.004*** 0.003* 0.002* 0.002** -0.001 -0.0004 -0.002 -0.002(0.003) (0.004) (0.003) (0.003) (0.001) (0.001) (0.001) (0.002) (0.001) (0.001) (0.001) (0.001) (0.002) (0.002)
Claiming non-financial characteristics without a label -0.007 -0.005 -0.001 0.003 -0.002 -0.002 -0.001 0.002 0.0003 0.001 0.00003 -0.0005 0.002 0.003(0.011) (0.011) (0.009) (0.010) (0.004) (0.004) (0.004) (0.004) (0.003) (0.002) (0.003) (0.003) (0.003) (0.003)
Labelled but no claim -0.002 0.003 0.001 0.005 0.00002 -0.001 0.00004 0.003 -0.0002 0.001 -0.0001 -0.001 0.003 0.002(0.011) (0.012) (0.009) (0.010) (0.004) (0.004) (0.004) (0.004) (0.003) (0.002) (0.002) (0.003) (0.003) (0.003)
No non-financial reference 0.004 0.001 0.004 0.005 0.001 0.002 0.002 0.003 0.001 0.001 0.0002 -0.0002 0.004** 0.004*(0.009) (0.010) (0.007) (0.008) (0.003) (0.003) (0.003) (0.003) (0.002) (0.002) (0.002) (0.002) (0.002) (0.002)
Age of funds -0.001*** -0.001*** -0.001*** -0.0005*** -0.0003*** -0.0003*** -0.0004*** -0.0003*** -0.0002*** -0.0002*** 0.0001 0.0001 -0.00003 -0.0001(0.0002) (0.0002) (0.0001) (0.0002) (0.0001) (0.0001) (0.0001) (0.0001) (0.0001) (0.00005) (0.00005) (0.0001) (0.0001) (0.0001)
Log (net assets) 0.0001 -0.001 0.0002 0.0002 0.00001 0.0002 0.001*** 0.0001 0.001*** 0.0003** 0.0002 0.0002 0.0002 0.0003(0.001) (0.001) (0.0004) (0.001) (0.0002) (0.0002) (0.0002) (0.0002) (0.0002) (0.0001) (0.0001) (0.0002) (0.0002) (0.0002)
Constant 0.004 0.016 -0.009 -0.011 0.004 -0.0002 -0.010* -0.0003 -0.016*** -0.007 -0.007* -0.005 -0.010** -0.005(0.014) (0.038) (0.012) (0.034) (0.005) (0.013) (0.005) (0.009) (0.004) (0.005) (0.004) (0.007) (0.004) (0.008)
FIXED AMC EFFECTS N Y N Y N Y N Y N Y N Y N YR squared 0.174 0.312 0.089 0.179 0.061 0.275 0.065 0.239 0.052 0.535 0.023 0.088 0.188 0.302
Nb obs 933 933 852 852 773 773 697 697 639 639 589 589 455 455F-test 17.608*** 2.876*** 7.446*** 1.344** 4.484*** 2.191*** 4.356*** 1.725*** 3.139*** 5.974*** 1.243 0.502 9.347*** 1.874***
* p<0.1, ** p<0.05, *** p<0.01
Dependent variable: Net performance (as a %)MONEY MARKET funds, OLS by year
2012 2013 2014 2015 2016 2017 2018
Size of class variable
“Client type” dummies
Reference category: FCPE
“Management type”indicator
“Nationality” indicator
“Fund of funds”indicator
“Non-financial”indicator
Reference category: Funds claiming
consideration of non-financial criteria and with
a label
Fund age variable