may 2018 professional examinations quantitative …
TRANSCRIPT
Page 1 of 21
MAY 2018 PROFESSIONAL EXAMINATIONS QUANTITATIVE TOOLS IN BUSINESS (PAPER 1.4)
CHIEF EXAMINER’S REPORT, QUESTIONS AND MARKING SCHEME
STANDARD OF THE PAPER The Quantitative Tools in Business, Paper 1.4, written in May was well structured with the paper adequately covering all the Level One Syllabus and the ICAG Manual. The standard of the Paper is a little low compared to the previous Papers (November 2017, May 2017, November 2016, May 2016), and the format and style are different from the aforementioned Papers. There were a few identifiable ambiguities or typing errors in the paper. This error, however, had limited effect on candidates’ ability to solve the sub- question. In general most candidates who tackled the question understood the sub-question, with many candidates scoring very high marks on the question. The marking scheme was well-drawn; every sub-question had marks duly allocated and the marks were adequate for each question. Examiners had access to the Examination Paper before the co-ordination. The marking scheme was straight forward and candidates were rewarded for any meaningful attempts made. GENERAL PERFORMANCE OF CANDIDATES The general performance of candidates can be described as above average. The majority of the candidates who wrote the paper at centres across the country performed averagely well with many scoring above 45%. Many of the average performers recorded were found in the traditional high performing centers of Accra, Kumasi, Takoradi and Cape Coast. Indeed the best two candidates, who were from the Accra centre scored between 80%-85%. A few candidates scored below 10%. There were no traceable copying by candidates, except that some candidates did not number their answers very well, which made some examiners have some challenges trying to separate answered questions for marking and scoring. A few candidates also wasted their time trying to solve more than the necessary questions instead of the recommended five and ended up scoring very high mark on a few questions and obtained almost zero marks on some questions. Per the scripts submitted for marking in this year’s May Examination diet, one will conclude that candidates’ preparation for the paper was a little better than previous diets and this is reflected in the general performance. In fact, a few candidates scored 20/20 on as many as two questions in this diet.

Page 2 of 21
NOTABLE STRENGTHS & WEAKNESSES Candidates’ notable strengths in the performance were on Forecasting (QUESTION TWO & FOUR, SEVEN), Statistics (QUESTION SIX). The majority of the candidates could easily form a frequency table and do simple calculations of/on the summary statistics (mean, median, mode, standard deviation, coefficient of variation) and could use the calculator very well in the QUESTIONS, TWO, FOUR & SEVEN. They could also use graphs to illustrate perfect negative and perfect positive correlations very well. These strengths were demonstrated mostly by candidates who took their paper in Accra, Kumasi, Cape Coast and Takoradi. This might be due to the availability of teaching and learning materials in these centres, and qualified instructors for teaching the quantitative tools in Business. The less patronized questions were QUESTIONS, ONE & FIVE. I suggest ICAG encourage the teaching of the subject, (Mathematical Finance in all the regional capitals). Candidates’ main weaknesses were: lack of basic knowledge of annuities and inadequate preparation by some candidates for the exams. This is reflected in their inability to solve simple financial problems in QUESTIONS ONE and FIVE. Many candidates could not interpret figures after they had calculated them. This weakness is widespread and included candidates from even the four average high performing centres of Accra, Cape Coast , Kumasi and Takoradi. Refer to the detailed question-by-question analysis of performance below for more on these other weaknesses:

Page 3 of 21
QUESTION ONE
a) You have received a prize amount of GH¢5,000 and you wish to invest it for five years. The
two alternatives are to use a bank account where the 14% per annum gross rate is
compounded monthly or a savings fund where the 14.5% per annum gross rate is
compounded annually.
Required:
i) Calculate the size of each fund at the end of the five years. (Ignore tax considerations).
(8 marks)
ii) Calculate the effective annual interest rate of the bank account investment. (4 marks)
iii) Advise your client on the basis of your calculations. (2 marks)
b) The Managing Director of a small manufacturing company is considering buying a piece of
machinery which costs GH¢15,000.
Required:
If the machine is to be purchased by taking a five year loan at 9% per annum which will be
paid off in five equal annual instalments (starting a year after the loan is taken out), calculate
the size of each instalment to the nearest whole number. (6 marks)
(Total: 20 marks)
QUESTION TWO
A Ghanaian student studying abroad wants to develop an empirical model for energy
consumption (in kilowatts per day) as a function of the daily high temperature (in degrees
Celsius) in winter. For nine days the following information was obtained:
Temperature -0.4 -0.2 0.3 0.8 1.1 1.4 1.8 2.1 2.5
Energy used 28 30 26 25 26 26 27 26 22
Required:
a) Identify the response and predictor variables, based on the purpose for developing the
regression model. (2 marks)
b) Determine the coefficient of regression and the regression constant. Give your values to 2
decimal places. (5 marks)
c) Interpret your results in b) above. (3 marks)
d) Write the equation of the regression line of energy use on temperature in the form y=a+bx.
(2 marks)

Page 4 of 21
e) Estimate the student’s daily energy consumption when the daily high temperature is 2
degrees Celsius. (2 marks)
f) Determine the standard error of estimate. (6 marks)
(Total: 20 marks)
QUESTION THREE
a) The marginal revenue function of a manufacturing company is given by: MR=2x2-15x-50.
The marginal cost function is given by: MC=4x2-300x-500. Let x be the number of items
either produced or sold.
Required:
i) Calculate the revenue generated when 50 items are sold. (2 marks)
ii) Calculate the number of items that will yield maximum revenue. (4 marks)
iii) Calculate the total revenue if 100 items are produced. (4 marks)
iv) Calculate the total profit for the 100 items. (4 marks)
v) If the tax of 20% is imposed on each item produced, find the cost of 100 items.
(6 marks)
(Total: 20 marks)
QUESTION FOUR
a) The quarterly unit sales of electronic items of a retail company for the last three years are as
follows:
Year Quarter 1 Quarter 2 Quarter3 Quarter 4
2013 100 115 70 210
2014 120 165 100 220
2015 150 195 120 270
Required:
i) Calculate a centred three moving average of the unit sales. (3 marks)
ii) Calculate the trend using a centred four-quarterly moving average. (4 marks)

Page 5 of 21
iii) Calculate the four seasonal variations using (ii) and the multiplicative model. (7 marks)
iv) Forecast the number of unit sales for the year 2016 using the multiplicative model. (4 marks)
v) Comment on your answer in (iv). (2 marks)
(Total: 20 marks)
QUESTION FIVE
a) Kofy Addo invested GH¢4,000 into his bank account at the beginning of every year for four
years. The bank paid interest at 8% compounded annually for the first four years. Thereafter,
the interest rate changed to 8.35% but Kofy Addo did not make any more deposits. At the
end of the sixth year he withdrew GH¢5000.
Required:
i) Calculate the size of the investment at the end of the sixth year, before the withdrawal.
(5 marks)
ii) Calculate the size of the investment after the withdrawal in the sixth year. (2 marks)
iii) Calculate the balance in the account after the eighth year. (3 marks)
b) Kofy Addo decided to start saving money for his future. At the end of each month he
deposited GH¢500 into an account at Trust Bank, which earned an interest rate of 9% per
annum compounded monthly.
Required:
i) Determine the balance of Kofy Addo's account after 20 years. (4 marks)
ii) Calculate the amount deposited into the account over the 20 year period. (2 marks)
iii) Calculate how much interest he earned over the 20 year period. (2 marks)
iv) Calculate the effective annual rate of interest. (2 marks)
(Total: 20 marks)
Page 6 of 21
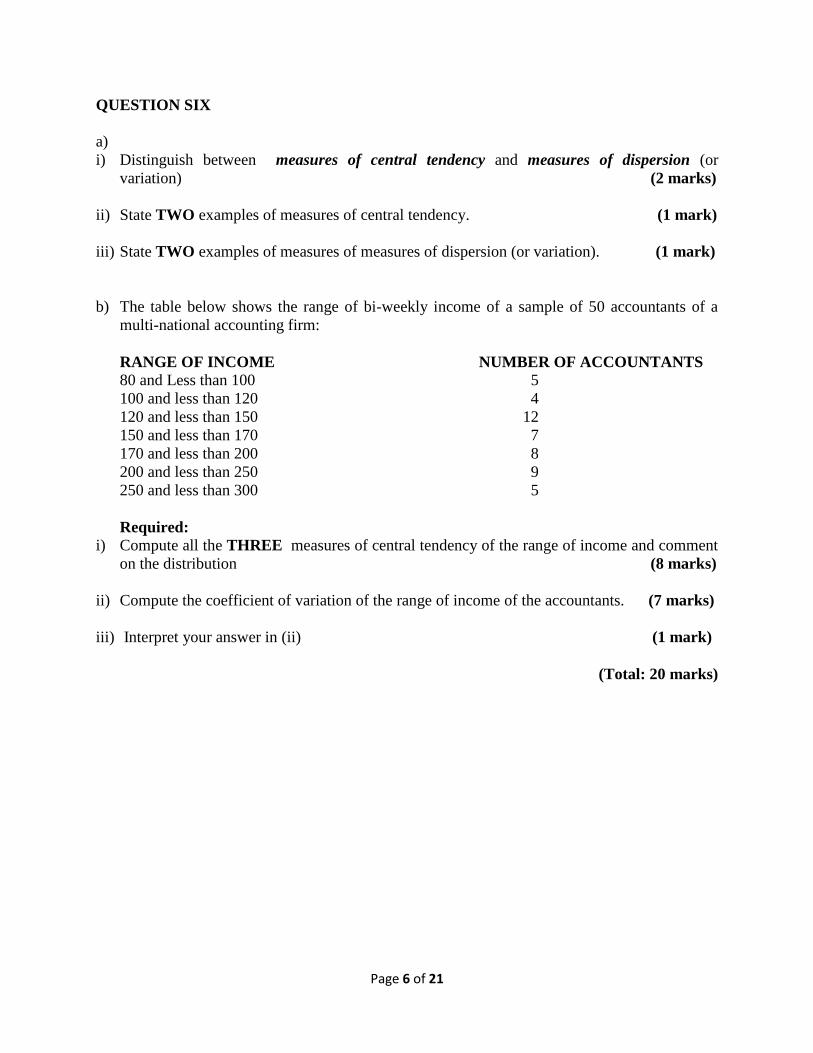
QUESTION SIX
a)
i) Distinguish between measures of central tendency and measures of dispersion (or
variation) (2 marks)
ii) State TWO examples of measures of central tendency. (1 mark)
iii) State TWO examples of measures of measures of dispersion (or variation). (1 mark)
b) The table below shows the range of bi-weekly income of a sample of 50 accountants of a
multi-national accounting firm:
RANGE OF INCOME NUMBER OF ACCOUNTANTS
80 and Less than 100 5
100 and less than 120 4
120 and less than 150 12
150 and less than 170 7
170 and less than 200 8
200 and less than 250 9
250 and less than 300 5
Required:
i) Compute all the THREE measures of central tendency of the range of income and comment
on the distribution (8 marks)
ii) Compute the coefficient of variation of the range of income of the accountants. (7 marks)
iii) Interpret your answer in (ii) (1 mark)
(Total: 20 marks)

Page 7 of 21
QUESTION SEVEN
a) Sketch a scatter graph for two variables (dependent and independent variables) that
represents:
i) Perfect positive correlation between the variables. (1 mark)
ii) Perfect negative correlation between the variables. (1 mark)
b) The secretariat of an association of industries gathered the following data from a random
sample of member firms that produce similar products:
Firm A1 B2 C3 D4 E5 F6 G7 H8 I9 J10
Production
Cost
(GH¢‘000)
15.5 14 16 17 15 16 18 16.5 19 18.5
Production
Output
(GH¢’000)
40 38 48 56 62 75 70 90 110 120
Required:
i) Compute the Pearson’s product moment correlation coefficient for the data. (6 marks)
ii) Hence, compute the coefficient of determination. (2 marks)
iii) Comment on your answer in (ii). (2 marks)
iv) Compute Spearman’s rank correlation coefficient for the data and comment on your answer.
(8 marks)
(Total: 20 marks)
Page 8 of 21
SOLUTION TO QUESTIONS
QUESTION ONE
a)
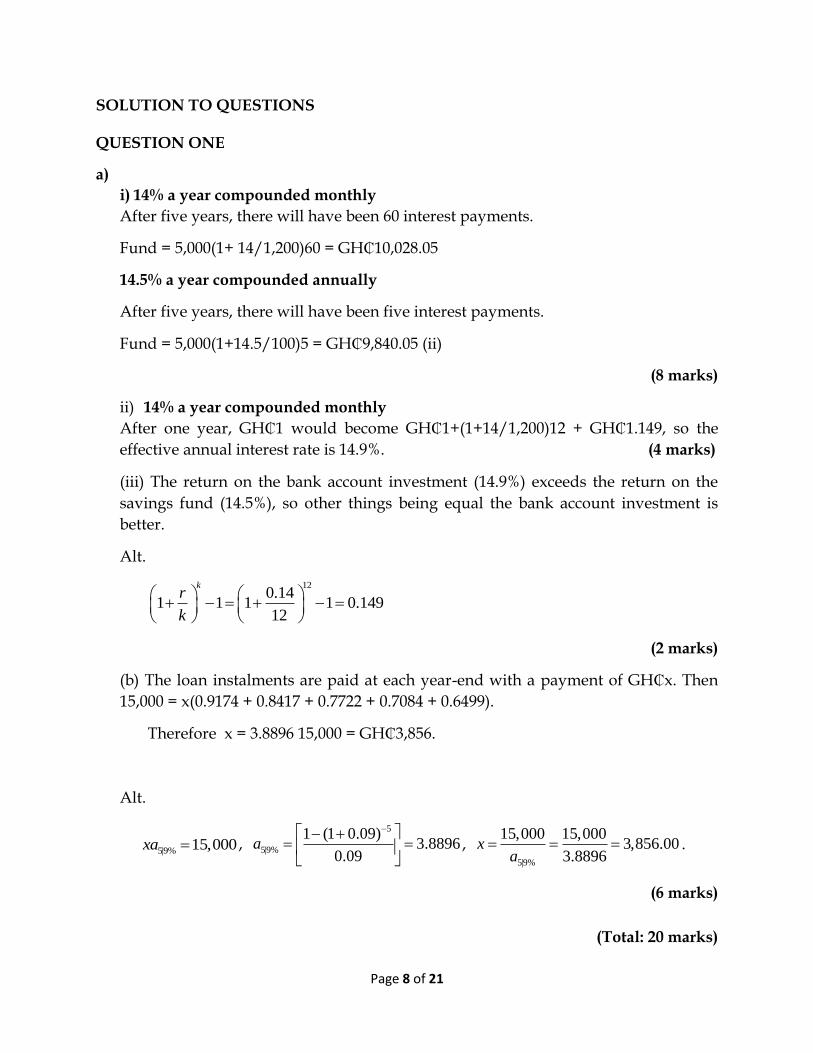
i) 14% a year compounded monthly
After five years, there will have been 60 interest payments.
Fund = 5,000(1+ 14/1,200)60 = GH₵10,028.05
14.5% a year compounded annually
After five years, there will have been five interest payments.
Fund = 5,000(1+14.5/100)5 = GH₵9,840.05 (ii)
(8 marks)
ii) 14% a year compounded monthly
After one year, GH₵1 would become GH₵1+(1+14/1,200)12 + GH₵1.149, so the
effective annual interest rate is 14.9%. (4 marks)
(iii) The return on the bank account investment (14.9%) exceeds the return on the
savings fund (14.5%), so other things being equal the bank account investment is
better.
Alt.
12
0.141 1 1 1 0.149
12
kr
k
(2 marks)
(b) The loan instalments are paid at each year-end with a payment of GH₵x. Then
15,000 = x(0.9174 + 0.8417 + 0.7722 + 0.7084 + 0.6499).
Therefore x = 3.8896 15,000 = GH₵3,856.
Alt.
5|9% 15,000xa ,
5
5|9%
1 (1 0.09)3.8896
0.09a
, 5|9%
15,000 15,0003,856.00
3.8896x
a .
(6 marks)
(Total: 20 marks)

Page 9 of 21
EXAMINER’S COMMENTS
It was a less popular question among candidates than QUESTION THREE, and some candidates who answered it scored extremely low marks 0/20. Only a handful of candidates performed extremely well, with the highest scored being 20/20.
QUESTION TWO
a)
Energy use is the response variable
Temperature is the predictor variable
(2 marks)
b)
x y xy X2 yest (y - yest)2
-0.4 28 -11.2 0.16 28.46 0.2116
-0.2 30 -6 0.04 28.15 3.4225
0.3 26 7.8 0.09 27.38 1.9044
0.8 25 20 0.64 26.6 2.56
1.1 26 28.6 1.21 26.14 0.0196
1.4 26 36.4 1.96 25.67 0.1089
1.8 27 48.6 3.24 25.05 3.8025
2.1 26 54.6 4.41 24.59 1.9881
2.5 22 55 6.25 23.97 3.8809
9.4 236 233.8 18 17.8985
b = 𝑛 ∑ 𝑥𝑦 − ∑ 𝑥 ∑ 𝑦
n∑x2 - (∑x)2
b = 9X233.8 – 9.4X236 = -114.2 = -1.55
9X18 – 9.42 73.64
Page 10 of 21
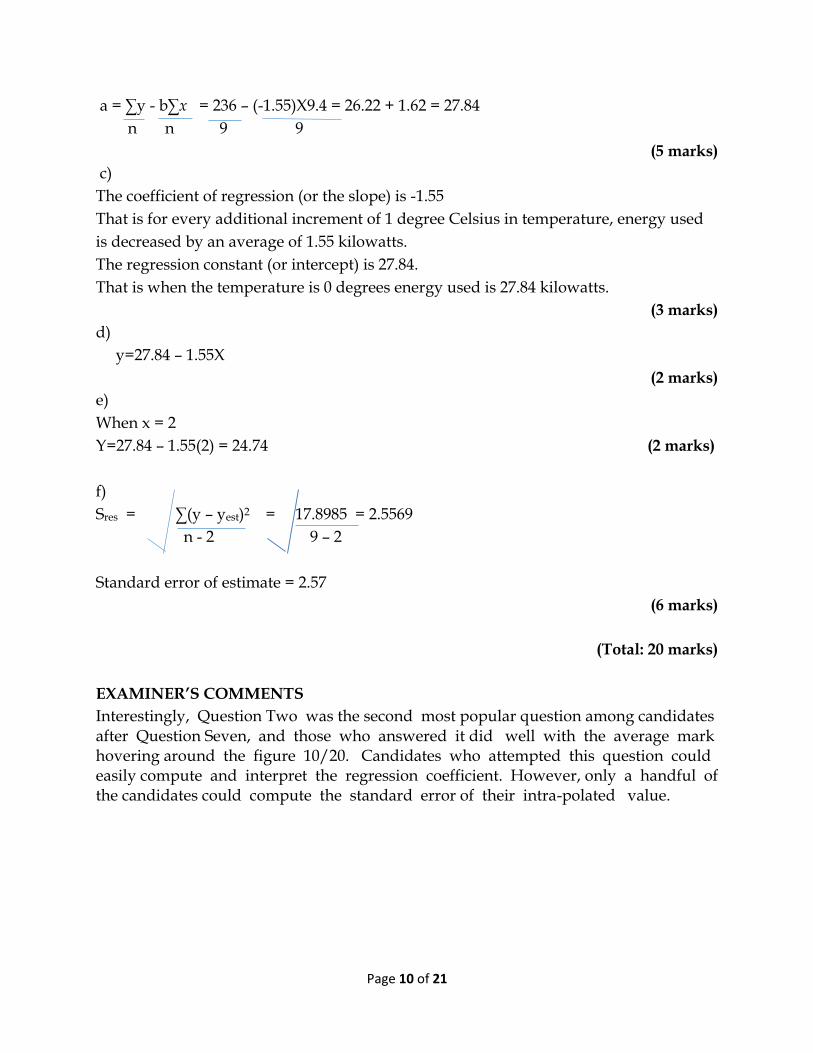
a = ∑y - b∑x = 236 – (-1.55)X9.4 = 26.22 + 1.62 = 27.84
n n 9 9
(5 marks)
c)
The coefficient of regression (or the slope) is -1.55
That is for every additional increment of 1 degree Celsius in temperature, energy used
is decreased by an average of 1.55 kilowatts.
The regression constant (or intercept) is 27.84.
That is when the temperature is 0 degrees energy used is 27.84 kilowatts.
(3 marks)
d)
y=27.84 – 1.55X
(2 marks)
e)
When x = 2
Y=27.84 – 1.55(2) = 24.74 (2 marks)
f)
Sres = ∑(y – yest)2 = 17.8985 = 2.5569
n - 2 9 – 2
Standard error of estimate = 2.57
(6 marks)
(Total: 20 marks)
EXAMINER’S COMMENTS
Interestingly, Question Two was the second most popular question among candidates after Question Seven, and those who answered it did well with the average mark hovering around the figure 10/20. Candidates who attempted this question could easily compute and interpret the regression coefficient. However, only a handful of the candidates could compute the standard error of their intra-polated value.

Page 11 of 21
QUESTION THREE
a) 22 15 50MR x x
24 300 500MC x x
i) 2Re (2 15 50)Total venue TR MR x x dx
3 22 15 503 2
x x x c
3 22 15 503 2
x x x c
If 50x
3 2152
3 250 50 50 50TR
62083.33TR
62083 (2 marks)
ii) For the number of items that yield maximum revenue
0MR
22 15 50 0x x
22 5 20 50 0x x x
2 5 10 2 5 0x x x
10 2 5 0x x
5210,
10, 2.5
10
x
x
x
0x
(4 marks)
iii) 3 2152 503 2
TR x x x
3 2152 100 100 50 100
3 2
586666.67
586666.00 (4 marks)

Page 12 of 21
iv) 3 2152 503 2
TR x x x
3 2
3 2
3004 5003 2
3004 5003 2
TC MC TR x x x
TC x x x
profit TR TC
3 2 3 2
3 2
152 450 150 5003 2 3
2852 4503 2
x x x x x x
x x x
If 100x
3 22852 100 100 450 100
3 2
803,333.33
Thus total profit if 100 items are produced is 833,333.33.
(4 marks)
v) TC MCdx
3 24 150 5003
TC x x x c
On the imposition of tax on each items
3 24 150 500 0.23
TC x x x x c
3 24 100 150 100 500 100 0.2 100
3TC c
216,646.67 c (6 marks)
(Total: 20 marks)
EXAMINER’S COMMENTS Question Three was the fifth most popular question among candidates, after Question Six. One candidate scored 19.5/20. However, a few candidates could manage 12 marks and above. Many candidates could not integrate the Marginal Revenue in order to obtain the Total Revenue.

Page 13 of 21
QUESTION FOUR
(i) and (ii)
YEAR QTR X Y 3MT 3MA 4MT 8MT 4CMA,T S=Y/T
2013 1 1 100
2 2 115 285 95
495
3 3 70 395 131.67 1010 126.25 0.55
515
4 4 210 400 133.33 1080 135 1.56
565
2014 1 5 120 495 165 1160 145 0.83
595
2 6 165 385 128.33 1200 150 1.1
605
3 7 100 485 161.67 1200 155 0.65
635
4 8 220 470 156.67 1240 162.5 1.35
665
2015 1 9 150 565 188.33 1300 168.75 0.89
685
2 10 195 465 155 1420 177.5 1.1
735

Page 14 of 21
3 11 120 585 195
4 12 270
(7 marks)
iii)SEASONAL VARIATIONS
QTR 1 QTR 2 QTR 3 QTR 4
- - 0.55 1.56
0.83 1.1 0.65 1.35
0.89 1.1 - -
Sum 1.72 2.2 1.2 2.91
Average 0.86 1.1 0.6 1.46 4.02
Adjusted Seasonal Variation 0.856 1.095 0.597 1.452 4
Adjustment factor = 4/4.02 = 0.995
(7 marks)
iv)
Trend equation is T= a+ bt
b = 177.5 – 126.25 = 7.32
10 – 3
T= 126.25+7.32t
Forecast for year 2016:
Quarter X t Trend Seasonal Variation Forecast
1 13 10 199.45 0.856 170.73
2 14 11 206.77 1.095 226.41
3 15 12 214.09 0.597 127.81

Page 15 of 21
4 16 13 221.41 1.452 321.49
(6 marks)
v) Generally increasing seasonal forecast.
(Total: 20 marks)
EXAMINER’S COMMENTS It can be adjudged the third most popular question after Question Two. Candidates who answered this question performed well. In fact, they could easily calculate the centred moving averages, and also forecast from the centred moving average the trend value. Candidates could also do seasonal decomposition easily via the centred trend values. Many candidates scored above 10/20.
QUESTION FIVE
a)
i)
FV6 = 4,000(1+0.08) (1+0.08)4- 1 (1+0.0835)2
0.08
= GH¢22,8530.01
(5 marks)
ii) Size of investment after withdrawal = 22,853.01 – 5,000
= GH¢17,853.01
(2 marks)
iii) After the 8th year, n=2
Balance in the account after the 8th year = 17,853.01(1+0.0835)2
= GH¢20,958.94
(3 marks)
b)
i) FV240 = 500 1+0.09 240 - 1
12 0.09/12
= GH¢333,943.44
(4 marks)
ii) Amount deposited = 500X(12x20) = GH¢120,000 (2 marks)

Page 16 of 21
iii) Interest earned = 333,943.44 – 120,000 = GH¢213,943.44 (2 marks)
iv. Effective Annual Rate, EAR = 1+0.09 12 - 1 12
= 9.38%
(2 marks)
(Total: 20 marks)
EXAMINER’S COMMENTS This question was also a less popular question among students. Candidates were ill-prepared for the Mathematics of Finance questions. However, some of the few candidates who answered this question scored 20/20.
QUESTION SIX
a)
i)
Measures of central tendency are averages that describe the way in which a group of
data cluster around a central value.
Measures of dispersion give some idea of the amount of spread or scatter (about its
average) that occur in a given group of data.
(2 marks)
ii) Examples of measures of central tendency: Mean, Median and Mode. (1 mark)
iii) Examples of measures of dispersion: Mean deviation, Variance, Standard
Deviation, Range, Coefficient of variation, Quartiles, Quartile deviation, etc.
(1 mark)
b)
i) 80 and less than 100; 250 and less than 300
Classes Class Class Frequency fx fx2

Page 17 of 21
Boundaries Midpoints f
80 – 99 79.5 – 99.5 89.5 5 447.5 40,051.25
100 – 119 99.5 – 119.5 109.5 4 438 47,961
120 – 149 119.5 -149.5 134.5 12 1614 217,083
150 – 169 149.5 – 169.5 159.5 7 1116.5 178,081.75
170 – 199 169.5 – 199.5 184.5 8 1476 272,322
200 – 249 199.5 – 249.5 224.5 9 2020.5 453,602.25
250 = 299 249.5 – 299.5 274.5 5 1372.5 376,751.25
50 8485 1,585,852.5
848550
169.7fx
fX
Median = LB + N/2 - Fm-1 Cm
fm
Median = 149.5 + 25 - 21 x 20
7
= 149.5 + 11.43
= 160.93
Mode = LB + D1 C
D1 + D2
D1 = 12 – 4 = 8
D2 = 12 – 7 = 5
Mode = 119.5 + 8 x 30
8 + 5
= 119.5 + 18.46

Page 18 of 21
= 137.96
137.96<160.93<169.7 ie Mode<Median<Mean therefore the distribution is positively
skewed.
(8 marks)
iii.
Standard Deviation, S = ∑fX2 - ∑fX 2
∑f ∑f
S = 1585852.5 – 8485 2
50 50
S = (31717.05 – 28798.09)
S = 2918.96 = 54.0
54.03
100% 31.84%169.7
SCV
X
There is 31% variation in biweekly income of the 50 accountants.
(8 marks)
(Total: 20 marks)
EXAMINER’S COMMENTS Question Six was the fourth most popular question among candidates, and most candidates who attempted this question did averagely well. Many candidates scored above 10 marks in this question. The highest mark scored here was about 18/20. However, many candidates could not form the class boundaries and therefore lost some marks on the question.

Page 19 of 21
QUESTION SEVEN
a)
i. Perfect positive correlation
(1 mark)
ii. Perfect negative correlation (1 mark)

Page 20 of 21
b.
i)
x Y XY X2 Y2 RX RY d=RX-RY d2
15.5 40 620 240.25 1600 3 2 1 1
14 38 532 196 1444 1 1 0 0
16 48 768 256 2304 4.5 3 0.5 0.25
17 56 952 289 3136 7 4 3 9
15 62 930 225 3844 2 5 -3 9
16 75 1200 256 5625 4.5 7 -2.5 6.25
18 70 1260 324 4900 8 6 2 4
16.5 90 1485 272.25 8100 6 8 -2 4
19 110 2090 361 12100 10 9 1 1
18.5 120 2220 342.25 14400 9 10 -1 1
165.5 709 12057 2761.75 57,453 35.5
r = n∑XY - ∑X∑Y
n∑X2 – [∑X]2 n∑Y2 – [∑Y]2
= 10 X 12057 – 165.5 X 709
10X 2761.75 – 165.52 10X57,453- 7092
= 3230.5
227.25X71,849
= 3230.5 = 0.799
4040.75
= 0.8
(6 marks)
Page 21 of 21
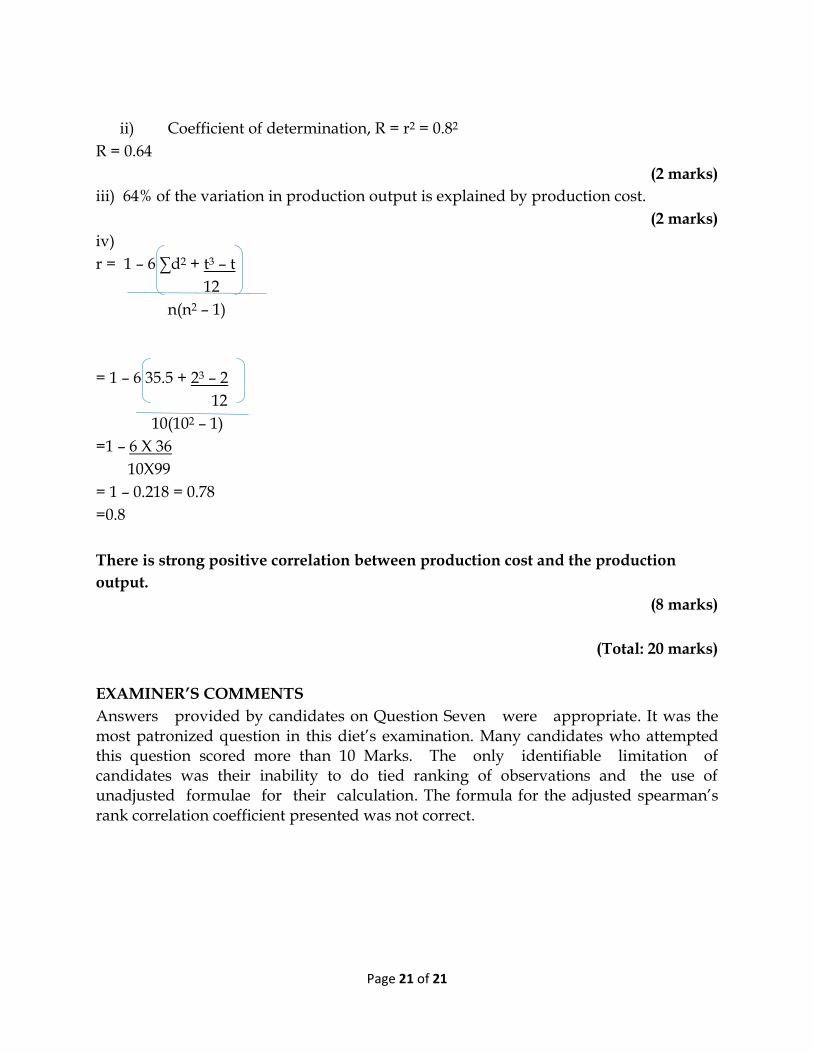
ii) Coefficient of determination, R = r2 = 0.82
R = 0.64
(2 marks)
iii) 64% of the variation in production output is explained by production cost.
(2 marks)
iv)
r = 1 – 6 ∑d2 + t3 – t
12
n(n2 – 1)
= 1 – 6 35.5 + 23 – 2
12
10(102 – 1)
=1 – 6 X 36
10X99
= 1 – 0.218 = 0.78
=0.8
There is strong positive correlation between production cost and the production
output.
(8 marks)
(Total: 20 marks)
EXAMINER’S COMMENTS
Answers provided by candidates on Question Seven were appropriate. It was the most patronized question in this diet’s examination. Many candidates who attempted this question scored more than 10 Marks. The only identifiable limitation of candidates was their inability to do tied ranking of observations and the use of unadjusted formulae for their calculation. The formula for the adjusted spearman’s rank correlation coefficient presented was not correct.