may 2018 monetary policy statement - rbnz.govt.nz · 1 reserve bank o ne zealan / mtar p stam a...
TRANSCRIPT

iRESERVE BANK OF NEW ZEALAND/MONETARY POLICY STATEMENT, MAY 2018
Monetary Policy StatementMay 2018

iiRESERVE BANK OF NEW ZEALAND/MONETARY POLICY STATEMENT, MAY 2018
Report and supporting notes published at:
https://www.rbnz.govt.nz/monetary-policy/monetary-policy-statement
Subscribe online: https://www.rbnz.govt.nz/email-updates
Copyright © 2018 Reserve Bank of New Zealand
This report is published pursuant to section 165A of the Reserve Bank of New Zealand Act 1989.
ISSN 1770-4829

1RESERVE BANK OF NEW ZEALAND/MONETARY POLICY STATEMENT, MAY 2018
Monetary Policy StatementMay 2018
Projections finalised on 2 May 2018. Data finalised on 4 May 2018. Policy assessment finalised on 9 May 2018.
Policy Targets Agreement 2
1. Policy assessment 4
2. Key policy judgements 5
Box A: Recent monetary policy decisions 12 Box B: The 2018 Policy Targets Agreement 14
3. Domestic activity and employment 17
Box C: Maximum sustainable employment 23
4. Prices and costs 28
5. International and financial markets developments 34
Box D: The impact of US dollar funding pressures on New Zealand banks 37
Contents6. Statistical appendix 39
6.1 Key forecast variables 40 6.2 Measures of inflation, inflation expectations, and asset prices 41 6.3 Measures of labour market conditions 42 6.4 Composition of real GDP growth 43 6.5 Summary of economic projections 44

2RESERVE BANK OF NEW ZEALAND/MONETARY POLICY STATEMENT, MAY 2018
Policy Targets Agreement
Context
The Government’s economic objective is to improve the wellbeing and living standards of New Zealanders through a sustainable, productive and inclusive economy. Our priority is to move towards a low carbon economy, with a strong diversified export base, that delivers decent jobs with higher wages and reduces inequality and poverty.
Monetary policy plays an important role in supporting the Government’s economic objective. The Government expects monetary policy to be directed at achieving and maintaining stability in the general level of prices over the medium term and supporting maximum sustainable employment.
This agreement between the Minister of Finance and the Governor of the Reserve Bank of New Zealand (the Bank) is made under section 9 of the Reserve Bank of New Zealand Act 1989 (the Act). The Minister and the Governor agree as follows:
1 Monetary policy objective
a) Under Section 8 of the Act the Reserve Bank is required to conduct monetary policy with the goal of maintaining a stable general level of prices.
b) The conduct of monetary policy will maintain a stable general level of prices, and contribute to supporting maximum sustainable employment within the economy.
2 Policy target
a) The price stability target will be defined in terms of the All Groups Consumers Price Index (CPI), as published by Statistics New Zealand.
b) For the purpose of this agreement, the policy target shall be to keep future annual CPI inflation between 1 and 3 percent over the medium-term, with a focus on keeping future inflation near the 2 percent mid-point.
c) The Bank will implement a flexible inflation targeting regime. In particular the Bank shall, in pursuing the policy target:
i. have regard to the efficiency and soundness of the financial system;
ii. seek to avoid unnecessary instability in output, employment, interest rates, and the exchange rate; and
iii. respond to events whose impact on inflation is expected to be temporary in a manner consistent with meeting the medium-term target.

3RESERVE BANK OF NEW ZEALAND/MONETARY POLICY STATEMENT, MAY 2018
3 Transparency and accountability
a) The Bank shall implement monetary policy in a transparent manner. In addition to the requirements of section 15 of the Act the Bank shall in its Monetary Policy Statement (MPS):
i. explain what measures it has taken into account in respect of meeting the requirements of section 2(c) and explain how these matters have been taken into account in its implementation of monetary policy; and
ii. when inflation outcomes, and/or expected inflation outcomes, are outside of the target range explain the reasons for this; and
iii. explain how current monetary policy decisions contribute to supporting maximum levels of sustainable employment within the economy.
b) The Bank shall be fully accountable for its judgements and actions in implementing monetary policy.
Dated at Wellington this 26th day of March 2018

4RESERVE BANK OF NEW ZEALAND/MONETARY POLICY STATEMENT, MAY 2018
Tena koutou, katoa, welcome all.
The Official Cash Rate (OCR) will remain at 1.75 percent for some time to come. The direction of our next move is equally balanced, up or down. Only time and events will tell.
Economic growth and employment in New Zealand remain robust, near their sustainable levels. However, consumer price inflation remains below the 2 percent mid-point of our target due, in part, to recent low food and import price inflation, and subdued wage pressures.
The recent growth in demand has been delivered by an unprecedented increase in employment. The number of willing workers continues to rise, especially with more female and older workers choosing to participate. Likewise net immigration has added to the supply of labour, and the demand for goods, services, and accommodation.
Ahead, global economic growth is forecast to continue supporting demand for New Zealand’s products and services. Global inflation pressures are expected to rise but remain contained.
At home, ongoing spending and investment, by both households and government, is expected to support economic growth and employment
demand. Business investment should also increase due to emerging capacity constraints.
The emerging capacity constraints are projected to see New Zealand’s consumer price inflation gradually rise to our 2 percent annual target.
To best ensure this outcome, we expect to keep the OCR at this expansionary level for a considerable period of time. This is the best contribution we can make, at this moment, to maximising sustainable employment and maintaining low and stable inflation.
Our economic projections, assumptions, and key risks and uncertainties, are elaborated on fully in our Monetary Policy Statement.
Meitaki, thanks.
Adrian Orr
Governor
Chapter 1Policy assessment

5RESERVE BANK OF NEW ZEALAND/MONETARY POLICY STATEMENT, MAY 2018
Chapter 2Key policy judgements
• AnnualCPIinflationeasedto1.1percentintheMarch2018quarter,andcoreinflationwas1.5percent.
• Employmentiswithinabroadrangeofindicatorsofthemaximumsustainablelevel.
• Positiveglobalconditions,fiscalstimulusinNewZealand,andhighnetimmigrationareexpectedtosupportgrowthovertheprojection.
• Stimulatorymonetarypolicyremainsnecessarytoensurecapacitypressurebuilds,andinflationincreasestoaroundthe2percenttargetmid-point.
Drivers of growth
Robust global growth is providing more support to the New Zealand economy than in recent years. Global activity and inflationary pressure were weak after the global financial crisis, prompting central banks around the world to respond with stimulatory monetary policy. With growth in advanced economies picking up in 2017, spare capacity has mostly been absorbed. Inflationary pressure is gradually returning, and central banks have begun to normalise monetary policy settings. The New Zealand dollar trade-weighted index (TWI) has depreciated since mid-2017. In addition, the prices of key New Zealand exports have increased and the terms of trade are at a record-high level.
Trading-partner growth is expected to remain robust. There are some early signs of downside risks mounting, although overall risks to global activity are roughly balanced. Global financial conditions have tightened due to lower equity prices, increased market volatility, and higher bank funding costs. These developments have not had a significant impact in New Zealand to date, but they are important risks to the outlook for the domestic economy.
High net immigration continues to support domestic growth. More people have been arriving and fewer leaving, partly due to the relative

6RESERVE BANK OF NEW ZEALAND/MONETARY POLICY STATEMENT, MAY 2018
2000 2003 2006 2009 2012 2015 2018 -4
-2
0
2
4
6
8
-4
-2
0
2
4
6
8% %
Projection
GDP growth
Potential output growth
Figure 2.1 GDP growth
(annual)
Source: Stats NZ, RBNZ estimates.
strength of the New Zealand labour market. Annual net inflows remain high, despite declining slightly since mid-2017 as global conditions have improved. Having been strong since 2012, net immigration has been a key driver of growth in demand and supply in the New Zealand economy. While adding to net demand, the composition and drivers of this net inflow suggest it has contributed less inflationary pressure than in previous migration cycles. We assume net immigration will fall due to the strengthening Australian labour market, tighter visa requirements, and people with temporary visas departing. With lower population growth, consumption growth and house price inflation are expected to decline. However, labour supply growth is also expected to slow, so the impact of population growth on inflationary pressure is expected to be small.
After contributing significantly to the economic expansion over several years, growth in residential investment has softened over the past year. Activity in Canterbury has moderated, while elsewhere, growth in construction activity has been constrained by access to usable land and credit. Input costs for labour and materials have increased as well. Monthly consent issuance suggests growth in residential investment will be low over the next six months. KiwiBuild is assumed to generate additional activity from late 2019, although constraints may limit the increase in construction activity.
House price inflation has slowed since mid-2016. Demand for housing has been dampened by tighter credit conditions, partly due to tighter loan-to-value ratio (LVR) requirements, and higher mortgage rates. Investor demand has been notably softer. House price inflation is expected to remain relatively subdued, reflecting the decline in net immigration, affordability pressures, and government policy changes such as restrictions on foreign buyers. Consistent with this, consumption growth has eased in the past year and is expected to decline further.
Annual GDP growth was 2.9 percent in the December 2017 quarter, after averaging 3.5 percent since 2014 (figure 2.1). Slower growth in residential investment and consumption weighed on growth in 2017. Strong population growth and rising labour force participation have contributed to potential output growth of around 3 percent annually.
Along with improving global conditions and low interest rates, fiscal policy is expected to help lift GDP growth to above potential. In addition to KiwiBuild, higher government spending and increases in government transfers and allowances are expected to support demand. Government spending is assumed to grow at an average rate of around 3.5 percent over the next two years. In addition, transfers and allowances are expected to increase annual household income by $1.4 billion. These assumptions reflect the information in Treasury’s Half Year Economic and Fiscal Update (HYEFU 2017), and their impact on demand is based on the Bank’s analysis of how fiscal policies affect the economy.

7RESERVE BANK OF NEW ZEALAND/MONETARY POLICY STATEMENT, MAY 2018
2000 2003 2006 2009 2012 2015 2018 90
91
92
93
94
95
96
97
98
99
60
61
62
63
64
65
66
67
68
69% %
Projection
Share of working-age population
Share of labour force (RHS)
Figure 2.2 Employment
Source: Stats NZ, RBNZ estimates.
Employment developments
Employment is currently within a broad range of indicators of the maximum sustainable level. Spare capacity in the labour market appears to have been absorbed, although estimates of capacity are uncertain. The unemployment rate has declined from more than 6 percent in 2012 to 4.4 percent in the March 2018 quarter. Other indicators of maximum sustainable employment are discussed in box C.
Employment growth in the construction and services sectors has been especially strong. In the March 2018 quarter, a record-high 67.7 percent of working-age people were employed (figure 2.2). This high rate of employment is partly because of an upward trend in labour force participation by women and people aged 55 and over. With the outlook for growth above potential, employment is expected to grow faster than the labour force, leading to a decline in the unemployment rate.
Inflation developments
Annual CPI inflation fell to 1.1 percent in the March 2018 quarter, from 1.6 percent previously (figure 2.3). Tradables inflation has been volatile, contributing to an increase in inflation to around 2 percent in 2017 and then driving it down more recently. CPI inflation is expected to average 1.4 percent over 2018.
Despite spare capacity having been absorbed, core inflation has remained low and is 1.5 percent. Our analysis suggests low CPI inflation between 2012 and 2016 may be still weighing on price-setting decisions, despite inflation expectations remaining well anchored at the 2 percent target mid-point. Other factors – such as technological developments and the globalisation of labour markets – may also be suppressing prices. Backward-looking price-setting behaviour is assumed to continue to
2000 2003 2006 2009 2012 2015 2018 0
1
2
3
4
5
6
0
1
2
3
4
5
6% %
Projection
Headline inflation
Core inflation
Figure 2.3CPI inflation
(annual)
Source: Stats NZ, RBNZ estimates.
Note: Core inflation is the sectoral factor model measure.

8RESERVE BANK OF NEW ZEALAND/MONETARY POLICY STATEMENT, MAY 2018
weigh on inflation in the future. There is considerable uncertainty around this assumption and, as such, price-setting behaviour is a key risk to the outlook for inflation.
Monetary policy
The Policy Targets Agreement states that the objectives for monetary policy are to keep future annual CPI inflation between 1 and 3 percent over the medium term, and to contribute to supporting maximum sustainable employment. In addition, the Bank is directed to avoid unnecessary volatility in output, employment, the exchange rate, and interest rates, and have regard to the efficiency and soundness of the financial system (see box B).
Given these objectives, the Bank’s judgement is that monetary policy needs to be stimulatory to ensure inflation increases towards the mid-point of the target range over the medium term (figure 2.4). Reflecting this, employment is expected to increase, helping to offset subdued pricing behaviour. Stable survey measures of inflation expectations support this monetary policy stance, as inflation is expected to return to the mid-point of the Bank’s target range.
Financial market pricing for future OCR increases has been pushed out, helping to support financial conditions in New Zealand. Mortgage rates for one- to three-year terms have declined over the past six months (figure 2.5).
A further reduction in the OCR, to return inflation to the target mid-point more quickly, risks creating unnecessary volatility in output, employment, and interest rates. While GDP growth has been softer than expected over the past year, positive global conditions and fiscal stimulus are expected to boost demand. As a result, any reduction in the OCR would likely
2000 2003 2006 2009 2012 2015 2018 1
2
3
4
5
6
7
8
9
1
2
3
4
5
6
7
8
9% %
Projection
Figure 2.4Official Cash Rate
Source: RBNZ estimates.
2013 2014 2015 2016 20174.0
4.5
5.0
5.5
6.0
6.5
7.0
4.0
4.5
5.0
5.5
6.0
6.5
7.0% %
1-year
3-year
2-year
Figure 2.5Mortgage interest rates
Source: interest.co.nz.
Note: The rate shown for each term is the average of the latest rate on offer from ANZ, ASB, BNZ, and Westpac.

9RESERVE BANK OF NEW ZEALAND/MONETARY POLICY STATEMENT, MAY 2018
need to be reversed as inflationary pressure increases. In addition, any increase in employment might not be sustainable given the likelihood that monetary policy would need to tighten more quickly.
A higher OCR risks there being insufficient demand to generate a sustained pick-up in inflation towards the target mid-point. While employment and inflation are expected to increase, responding to such expectations without more evidence that they are emerging could stifle the recovery. A longer period of low inflation risks inflation expectations falling and this becoming embedded in price-setting behaviour.
Key assumptions and risks
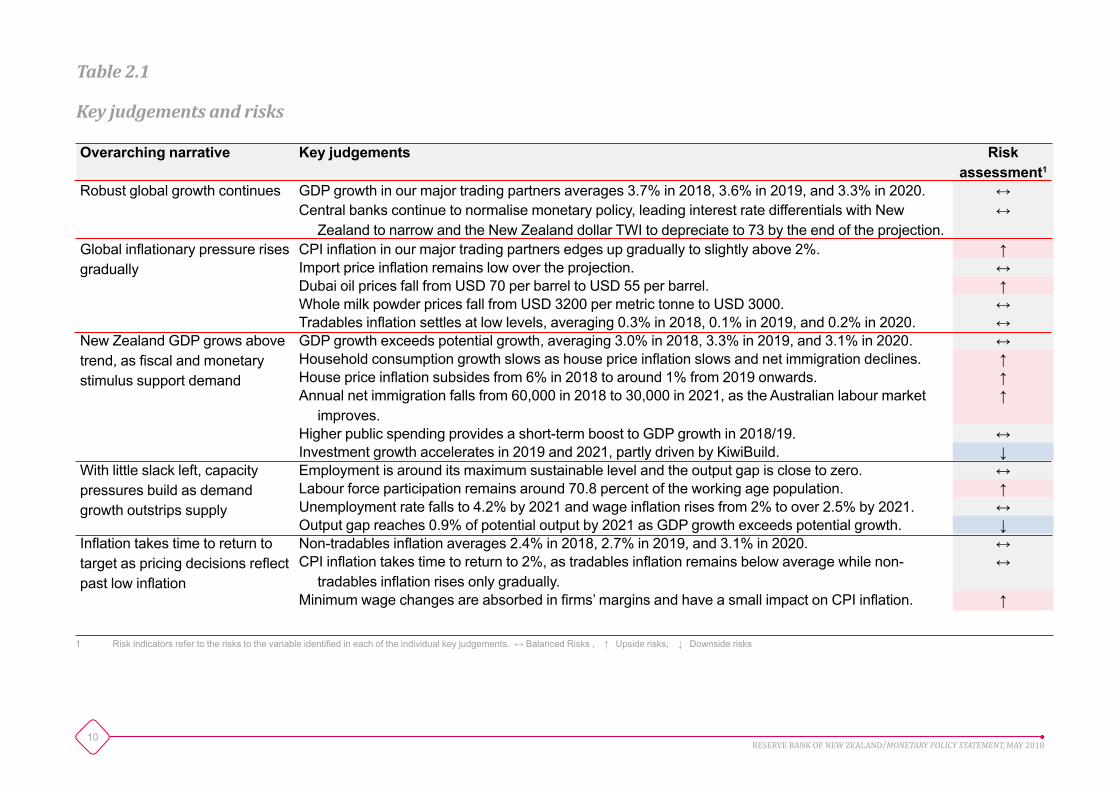
The risks around the OCR projection are broadly balanced. The Bank’s central view of how global and domestic economic conditions will evolve depends on the assumptions outlined in table 2.1. These assumptions are regularly evaluated and updated. Monetary policy may need to adjust as new data or information become available, or as our understanding of the economy develops. There are several uncertainties and risks around these projections. The Bank’s view of the balance of risks for each variable is also shown in table 2.1.
In aggregate, the risks to employment and activity appear to be broadly balanced. On the upside, net immigration could stay high for longer if the New Zealand labour market remains relatively attractive. With high population growth and low interest rates, a resurgence in the housing market could boost consumption by more than assumed. On the downside, construction activity is already elevated and capacity constraints could limit the sector’s contribution to growth. Although the risks around the global outlook have become more balanced over the past year, the recent tightening in global financial conditions is a downside risk to growth. Financial markets may push long-term interest
rates higher if the outlook for inflation and economic activity becomes more uncertain (see scenario 1).
The risks to the outlook for inflation are also balanced. On the downside, inflation has been weaker than expected for several years. If the factors that have been keeping domestic inflation low persist for longer than anticipated, inflation could stay subdued. On the upside, inflation could pick up faster than expected if price-setting behaviour becomes more forward looking (see scenario 2). The upcoming minimum wage increases are another upside risk to inflation, as higher wages could cause firms to raise prices by more than assumed.
The following scenarios highlight two of these key risks to our projections. Both developments would have substantial impacts on the projections if they materialised.
Scenario 1: Tighter financial conditions
The recovery in global growth has been supported by easy financial conditions. If financial conditions were to tighten abruptly, global economic activity would be adversely affected. This would reduce world demand and lower the price of New Zealand’s exports (figure 2.6). Long-term interest rates would also increase, leading to higher funding costs for New Zealand banks and higher mortgage rates. While the New Zealand dollar TWI would depreciate (figure 2.7), the increase in mortgage rates and lower export prices would dampen consumption and business investment. In this scenario, the Bank would need to lower the OCR to support the economy and meet its inflation and employment objectives (figure 2.9).
10RESERVE BANK OF NEW ZEALAND/MONETARY POLICY STATEMENT, MAY 2018
Table 2.1
Key judgements and risks
Overarching narrative Key judgements Risk assessment1
Robust global growth continues GDP growth in our major trading partners averages 3.7% in 2018, 3.6% in 2019, and 3.3% in 2020. ↔Central banks continue to normalise monetary policy, leading interest rate differentials with New
Zealand to narrow and the New Zealand dollar TWI to depreciate to 73 by the end of the projection.↔
Global inflationary pressure rises gradually
CPI inflation in our major trading partners edges up gradually to slightly above 2%. ↑Import price inflation remains low over the projection. ↔Dubai oil prices fall from USD 70 per barrel to USD 55 per barrel. ↑Whole milk powder prices fall from USD 3200 per metric tonne to USD 3000. ↔Tradables inflation settles at low levels, averaging 0.3% in 2018, 0.1% in 2019, and 0.2% in 2020. ↔
New Zealand GDP grows above trend, as fiscal and monetary stimulus support demand
GDP growth exceeds potential growth, averaging 3.0% in 2018, 3.3% in 2019, and 3.1% in 2020. ↔Household consumption growth slows as house price inflation slows and net immigration declines. ↑House price inflation subsides from 6% in 2018 to around 1% from 2019 onwards. ↑Annual net immigration falls from 60,000 in 2018 to 30,000 in 2021, as the Australian labour market
improves.↑
Higher public spending provides a short-term boost to GDP growth in 2018/19. ↔Investment growth accelerates in 2019 and 2021, partly driven by KiwiBuild. ↓
With little slack left, capacity pressures build as demand growth outstrips supply
Employment is around its maximum sustainable level and the output gap is close to zero. ↔Labour force participation remains around 70.8 percent of the working age population. ↑Unemployment rate falls to 4.2% by 2021 and wage inflation rises from 2% to over 2.5% by 2021. ↔Output gap reaches 0.9% of potential output by 2021 as GDP growth exceeds potential growth. ↓
Inflation takes time to return to target as pricing decisions reflect past low inflation
Non-tradables inflation averages 2.4% in 2018, 2.7% in 2019, and 3.1% in 2020. ↔CPI inflation takes time to return to 2%, as tradables inflation remains below average while non-
tradables inflation rises only gradually.↔
Minimum wage changes are absorbed in firms’ margins and have a small impact on CPI inflation. ↑
1 Risk indicators refer to the risks to the variable identified in each of the individual key judgements. ↔ Balanced Risks , ↑ Upside risks, ↓ Downside risks

11RESERVE BANK OF NEW ZEALAND/MONETARY POLICY STATEMENT, MAY 2018
Scenario 2: Forward-looking price-setting behaviour
Price-setting behaviour appears to be weighing on inflation outcomes, with businesses seeming to place greater weight on past low inflation than expectations of future inflation when setting prices. However, if businesses begin to see demand rise and costs increase, this could result in price-setting behaviour becoming more forward-looking, leading to a faster rise in inflation. This is particularly relevant given the significant minimum wage increases expected over the projection. Such a change in price-setting behaviour would mean that less capacity pressure would be needed to return inflation to the target mid-point (figure 2.8). As such, monetary policy would not need to be as stimulatory and the OCR would be higher than in the central projection (figure 2.9).
2005 2008 2011 2014 2017 202060
65
70
75
80
85
90
95
60
65
70
75
80
85
90
95Index Index
Projection
Central
Tighter financialconditions
Figure 2.6Export prices
(world terms, s.a.)
Source: Stats NZ, RBNZ estimates.
2005 2008 2011 2014 2017 202055
60
65
70
75
80
85
55
60
65
70
75
80
85Index Index
Projection
Central
Tighter financialconditions
Figure 2.7New Zealand dollar TWI
Source: RBNZ estimates.

12RESERVE BANK OF NEW ZEALAND/MONETARY POLICY STATEMENT, MAY 2018
Box A
Recent monetary policy decisions
Indicators of global economic activity weakened in 2016. The Bank’s forecasts of trading-partner growth and inflation were revised lower and, despite low commodity prices, the New Zealand dollar exchange rate remained elevated. These developments challenged the Bank’s assumption that global economic activity and inflation would strengthen and lift tradables inflation in New Zealand via higher import prices and a lower exchange rate. This led the Bank to revise down its medium-term outlook for tradables inflation. In addition, surveyed inflation expectations fell in the March 2016 quarter, with short-term expectations falling towards the lower half of the target range (figure A.1). The Bank judged that circumstances warranted easing the OCR by 75 basis points, bringing it to 1.75 percent in November 2016.
Increases in food and fuel prices boosted CPI inflation from the start of 2017 and short-term inflation expectations increased. However, measures of core and wage inflation remained low. The Bank’s outlook for inflationary pressure also remained subdued, as growth in the domestic economy was weaker than expected. The housing market continued to soften and construction activity plateaued as a share of the economy.
While domestic conditions softened, the outlook for growth remained above trend, supported by fiscal stimulus and improving global conditions. In the November 2017 Statement, the Bank incorporated a more-stimulatory path for fiscal policy reflecting the new Government’s policies. Trading-partner growth increased, and by early 2018 there were signs of global inflationary pressure building. Export prices recovered, contributing to record-high terms of trade.
2005 2008 2011 2014 2017 20200
2
4
6
8
10
0
2
4
6
8
10% %
Projection
Central
Tighter financialconditions
Forward-lookingpricing behaviour
Figure 2.9Official Cash Rate
Source: RBNZ estimates.
2005 2008 2011 2014 2017 2020-3
-2
-1
0
1
2
3
-3
-2
-1
0
1
2
3% %
Projection
Central
Forward-lookingpricing behaviour
Figure 2.8Output gap
(share of potential output)
Source: RBNZ estimates.

13RESERVE BANK OF NEW ZEALAND/MONETARY POLICY STATEMENT, MAY 2018
These developments were broadly offsetting, and so there was no clear reason to deviate from the existing monetary policy stance. The Bank held the OCR at 1.75 percent and retained the view that monetary policy would remain accommodative for a considerable period (figure A.2).
1 2 3 4 5 6 7 8 9 100
1
2
3
4
0
1
2
3
4% %
2016 Mar MPS
2018 Feb MPS
2017 Mar MPS
Figure A.1Inflation expectations curve
(annual, by number of years ahead)
Source: RBNZ estimates.
2005 2008 2011 2014 2017 20200
1
2
3
4
5
6
7
8
9
0
1
2
3
4
5
6
7
8
9% %
Actual
Feb 18
Previousprojections
Figure A.2Official Cash Rate
Source: RBNZ estimates.
Note: The Bank changed from publishing the forward path for the 90-day interest rate to the OCR in November 2016. For illustrative purposes, previous 90-day interest rate tracks have been
adjusted to an OCR basis by applying an assumption of a constant spread between the 90-day rate and the OCR.

14RESERVE BANK OF NEW ZEALAND/MONETARY POLICY STATEMENT, MAY 2018
Box B
The 2018 Policy Targets Agreement
On 26 March 2018, the Governor of the Reserve Bank and the Minister of Finance signed a new Policy Targets Agreement (PTA). In the current monetary policy framework, the PTA sets operational targets for the conduct of monetary policy, consistent with the Reserve Bank of New Zealand Act 1989 (the Act) and its goal of medium-term price stability. The PTA also outlines other factors the Bank is to consider when setting monetary policy, and details additional accountability and transparency requirements.
The new PTA represents a further evolution in the Bank’s flexible approach to inflation targeting. It preserves the medium-term focus on price stability while also recognising the role that monetary policy can play in stabilising the real economy in the short term. In doing so, the new PTA reflects some of the changes that the Government is in the process of making to the monetary policy framework set out in the Act.
This box summarises the new PTA and what it means for the operation of monetary policy in New Zealand.
Section 1 – Monetary policy objectives
The PTA is divided into three sections. The first outlines the objectives of monetary policy in New Zealand. At the core of the PTA is a focus on delivering medium-term price stability. This reflects the view that monetary policy’s best contribution to long-run economic growth and employment comes through ensuring low and stable inflation. In the PTA, the Bank is directed to ‘conduct monetary policy with the goal of
maintaining a stable general level of prices’, consistent with Section 8 of the Act.
In addition, the new PTA explicitly directs the Bank to ‘contribute to supporting maximum sustainable employment within the economy’. This reflects that the Government is in the process of adding employment to the Bank’s current mandate of price stability in the Act. We consider this an evolution in our current approach to inflation targeting, which builds on the flexibility we have been using for some time.
The direction in the PTA for the Bank to support maximum sustainable employment highlights that one role for monetary policy – once medium-term price stability has been taken into account – is to help keep the level of employment close to a sustainable level. It also suggests employment goals should be considered in a sustainable way. The Bank should not seek to boost employment in the short term at the expense of long-term employment, welfare, or well-anchored inflation expectations.
The new PTA also continues to recognise the limits of monetary policy. With regards to employment, the Bank is directed to support, rather than achieve, maximum sustainable employment. This highlights that monetary policy is one aspect of a large array of factors that determine employment. Factors such as demographic trends, government policy settings, and technological innovation are likely to have a much greater impact on the sustainable level of employment than monetary policy does.
Section 2 – Policy target
The second section of the PTA outlines the specific targets of monetary policy. The price stability target is the All Groups Consumers Price Index (CPI), a measure of the cost of living of the average New Zealand
15RESERVE BANK OF NEW ZEALAND/MONETARY POLICY STATEMENT, MAY 2018
.household. The target is to ‘keep future annual CPI inflation between 1 and 3 percent over the medium-term, with a focus on keeping future inflation near the 2 percent mid-point’. The target is forward looking, reflecting the medium-term focus of price stability and that monetary policy affects inflation with a lag.
The target range reflects the flexible approach the Bank is directed to undertake and the uncertainty inherent in the operation of monetary policy. The economy is constantly hit with unexpected developments, and the substantial lags with which monetary policy affects economic activity, employment, and inflation can vary through stages of the economic cycle and under different conditions. These factors can temporarily push inflation away from the target mid-point. The focus on the 2 percent mid-point helps the Bank anchor inflation expectations, which allows the Bank more flexibility to consider additional goals.
Maximum sustainable employment is not given a specific numerical target. Sustainable employment is a broad concept that is subject to significant uncertainty. Many factors need to be considered to form an assessment of maximum sustainable employment. These factors include unemployment, underemployment, flows in and out of the labour market, participation, trends in hours worked, and wage growth. In the past, the Bank considered labour market conditions as indicators of inflationary pressure, and when thinking about how to minimise volatility in the real economy. However, the Bank’s understanding of maximum sustainable employment will likely evolve as we put further resources into assessing these factors. This evolution in our understanding will be discussed in speeches, Bulletin articles, and Monetary Policy Statements.
The new PTA explicitly advocates a flexible approach to inflation targeting. The well-anchored inflation expectations that we observe are a direct result of the Bank’s historical focus on price stability. In an
environment of anchored inflation expectations, there are a range of policy settings consistent with price stability over the medium term. As a result, the Bank can consider additional short-term goals. The PTA directs the Bank to use this flexibility to avoid unnecessary instability in output, interest rates, and the exchange rate, and have regard to the efficiency and soundness of the financial system. These elements have been included in successive PTAs for some time.
Section 3 – Transparency and accountability
Independence from political influence is an important part of monetary policy. It gives the Bank the credibility to achieve the objectives of the PTA. However, if the Bank is to maintain this independence, it must be transparent in its actions and accountable to the public. Transparency has the additional advantage of improving the effectiveness of monetary policy. If businesses, households, and financial market participants understand our objectives and how we plan to achieve them, then monetary policy has a much more direct effect on inflation.
The final section of the PTA lays out the transparency and accountability requirements of the Bank when setting monetary policy, additional to the requirements outlined in the Act. At a high level, the Bank is directed to achieve three additional things in its Monetary Policy Statement:
• Provide a clear description of how the Bank has contributed to the following factors, and how these factors have influenced monetary policy:
- have regard to the efficiency and soundness of the financial system;

16RESERVE BANK OF NEW ZEALAND/MONETARY POLICY STATEMENT, MAY 2018
- seek to avoid unnecessary instability in output, employment, interest rates, and the exchange rate; and
- respond to events whose impact on inflation is expected to be temporary in a manner consistent with meeting the medium-term target.
• Explain the factors that have led to any periods where inflation is (or is forecast to be) outside the target range.
• Explain how current monetary policy decisions contribute to supporting maximum levels of sustainable employment within the economy.

17RESERVE BANK OF NEW ZEALAND/MONETARY POLICY STATEMENT, MAY 2018
• GDPgrowthwasslightlylowerthanexpectedattheendof2017.Growthisexpectedtoincreaseoverthenextyear,drivenbyhighnetimmigration,fiscalstimulus,arobustglobaleconomy,andstimulatorymonetarypolicy.
• Thelabourmarkethastightenedoverthepastfiveyears.Arangeofindicatorssuggeststhatemploymentisclosetoitsmaximumsustainablelevel,althoughthisishighlyuncertain.
• Overtheforecast,stimulatorymonetarypolicyisneededtodriveGDPgrowthaboveitspotentialratesoastogenerateapick-upincapacitypressure,furtherincreasesinemployment,andariseininflation.
Domestic activity
Over the past year, GDP growth has slowed moderately. GDP rose by 0.6 percent in the December 2017 quarter and by 2.9 percent over the year (figure 3.1). This was slightly weaker than expected in the February Statement, reflecting slower construction growth and weather-related weakness in dairy production. Growth in the rest of the economy was more robust, particularly in the services sector.
Annual GDP growth is expected to increase over the next year and average 3.1 percent over the projection. Demand growth is expected to be driven by high net immigration, fiscal stimulus, a robust global economy, and stimulatory monetary policy.
High rates of net immigration have been a key driver of consumption growth over the past year. Annual consumption growth was 4.2 percent in the year to the December 2017 quarter – the 11th consecutive quarter of above-average growth. However, on a per capita basis, consumption growth has slowed to below its historical average (figure 3.2).
Chapter 3Domestic activity and employment

18RESERVE BANK OF NEW ZEALAND/MONETARY POLICY STATEMENT, MAY 2018
Consumption growth is expected to ease as population growth slows and house price inflation subsides. Risks to the consumption forecast lie to the upside. Net immigration has been stronger than expected in recent months and may decline more slowly than expected, boosting population growth for longer. House price inflation has rebounded since mid-2017. If this rebound continues, consumption growth could be stronger than expected.
Residential investment growth has slowed over the past year due to a decline in construction activity in Canterbury and slowing growth in Auckland. Residential investment is high as a share of the economy (figure 3.3), and business surveys indicate supply constraints are holding back further growth. Land, labour, and financing constraints all appear to be limiting factors, and the costs of labour and other inputs are increasing.
Supply constraints are expected to continue to bind in 2018. From 2019 onwards, the Government’s KiwiBuild housing is assumed to overcome some of these constraints and boost growth in residential investment. This assumption is consistent with the Treasury’s HYEFU 2017 projections. However, there are downside risks to this projection, particularly if capacity constraints in the sector continue to bind and KiwiBuild crowds out private sector investment.
In addition to KiwiBuild, other fiscal policies are expected to provide a near-term boost to GDP. Higher government spending and increased transfers and allowances are both expected to support demand in 2018 and 2019. These assumptions have not changed since the February Statement, and reflect the information in Treasury’s HYEFU 2017 as well as the Bank’s analysis of how fiscal policies affect the economy.
2006 2008 2010 2012 2014 2016 2018 2020-6
-4
-2
0
2
4
6
8
-6
-4
-2
0
2
4
6
8% %
Consumption
Consumption per capita
Projection
Figure 3.2Consumption growth
(annual)
Source: Stats NZ, RBNZ estimates.
Note: The dashed lines represent the average realised rates of growth since 1992.
2006 2008 2010 2012 2014 2016 2018 2020-3
-2
-1
0
1
2
3
4
5
-3
-2
-1
0
1
2
3
4
5% %
Projection
Annual (May MPS)
Annual (Feb MPS)
Quarterly
Figure 3.1GDP growth
Source: Stats NZ, RBNZ estimates.

19RESERVE BANK OF NEW ZEALAND/MONETARY POLICY STATEMENT, MAY 2018
Growth in our major trading partners is expected to stay above trend over the next two years (see chapter 5). Partly reflecting these robust global conditions, the prices of key New Zealand exports have recovered. Dairy prices have risen to around their historical average as a result of strong global demand and subdued production volumes. This recovery in export prices, combined with low import prices, has boosted the terms of trade (figure 3.4), supporting household and business spending by raising domestic incomes. Higher terms of trade have also contributed to a relatively elevated exchange rate, increasing the overseas purchasing power of New Zealanders and hence the demand for imports. Over the forecast, the terms of trade are expected to remain elevated.
Potential output and the labour force
We estimate that the growth rate of potential output was around 3.2 percent in 2017 (figure 3.5).1 Over the forecast, potential growth is expected to ease to below 3 percent as the growth rate of the labour force slows. The level of potential output is unobservable and consequently estimates of it are highly uncertain. Nevertheless, such estimates are necessary to form a view of capacity pressure in the economy.
Rapid growth in New Zealand’s labour force has been a key driver of potential growth in recent years, but this impulse is expected to fade over the forecast. Two factors have driven rapid growth in the labour force: high net immigration and increased participation rates among women and people aged 55 and over (figure 3.6). 2 As a result, the labour force
1 For details surrounding our estimations of potential output, see Lienert, A., & D. Gillmore (2015) ‘The Reserve Bank’s method of estimating “potential output”’, Reserve Bank of New Zealand Analytical Note AN2015/01.
2 For more detail on the structural drivers of New Zealand’s participation rate, see Culling, J., & H., Skilling (2018) ‘How does New Zealand stack up? A comparison of labour supply across the OECD’, Reserve Bank of New Zealand Bulletin, 81(2), April.
2002 2005 2008 2011 2014 2017 20204.0
4.5
5.0
5.5
6.0
6.5
7.0
7.5
8.0
4.0
4.5
5.0
5.5
6.0
6.5
7.0
7.5
8.0% %
Projection
Figure 3.3Residential investment
(share of potential output)
Source: Stats NZ, RBNZ estimates.
2002 2005 2008 2011 2014 2017 20200.8
0.9
1.0
1.1
1.2
1.3
0.8
0.9
1.0
1.1
1.2
1.3Index Index
Projection
Figure 3.4 Terms of trade
Source: Stats NZ, RBNZ estimates.

20RESERVE BANK OF NEW ZEALAND/MONETARY POLICY STATEMENT, MAY 2018
grew by 2.5 percent in the year to the March 2018 quarter. Since 2012, migration has contributed around half of the growth in the labour force, while participation accounts for around a quarter of the growth. Over the projection, growth in the labour force is expected to slow to around 1.5 percent per year, as the participation rate plateaus and net immigration wanes. Risks to the labour force projection are to the upside. The strong New Zealand labour market could encourage more workers to enter the labour force, both domestically (via higher participation) and from overseas.
Net immigration remains high, but has eased slightly in recent months and is expected to fall further. Annual net inflows were 57,500 in the year to March 2018 (figure 3.7). Much of the recent strength in net immigration has been driven by low net outflows to Australia, but these flows are expected to partially reverse as the Australian labour market
2002 2005 2008 2011 2014 2017 20200
1
2
3
4
5
0
1
2
3
4
5% %
Capital
Labour
Total factorproductivity
Potential outputgrowth
Projection
Figure 3.5 Contributions to potential output growth
(annual)
Source: Stats NZ, RBNZ estimates.
2002 2005 2008 2011 2014 2017 2020-2
-1
0
1
2
3
4
5
6
7
-2
-1
0
1
2
3
4
5
6
7% %
Total
Natural populationincrease
Migration
Participation
Projection
Figure 3.6Labour force growth
(annual)
Source: Stats NZ, RBNZ estimates.
2002 2005 2008 2011 2014 2017 2020-20
-10
0
10
20
30
40
50
60
70
40
50
60
70
80
90
100
110
120000s 000s
Arrivals
Departures
Net (RHS)
Projection
Figure 3.7Overseas arrivals and departures
(quarterly, annual total)
Source: Stats NZ, RBNZ estimates.
Note: The data shown are for permanent and long-term working-age arrivals and departures.
21RESERVE BANK OF NEW ZEALAND/MONETARY POLICY STATEMENT, MAY 2018
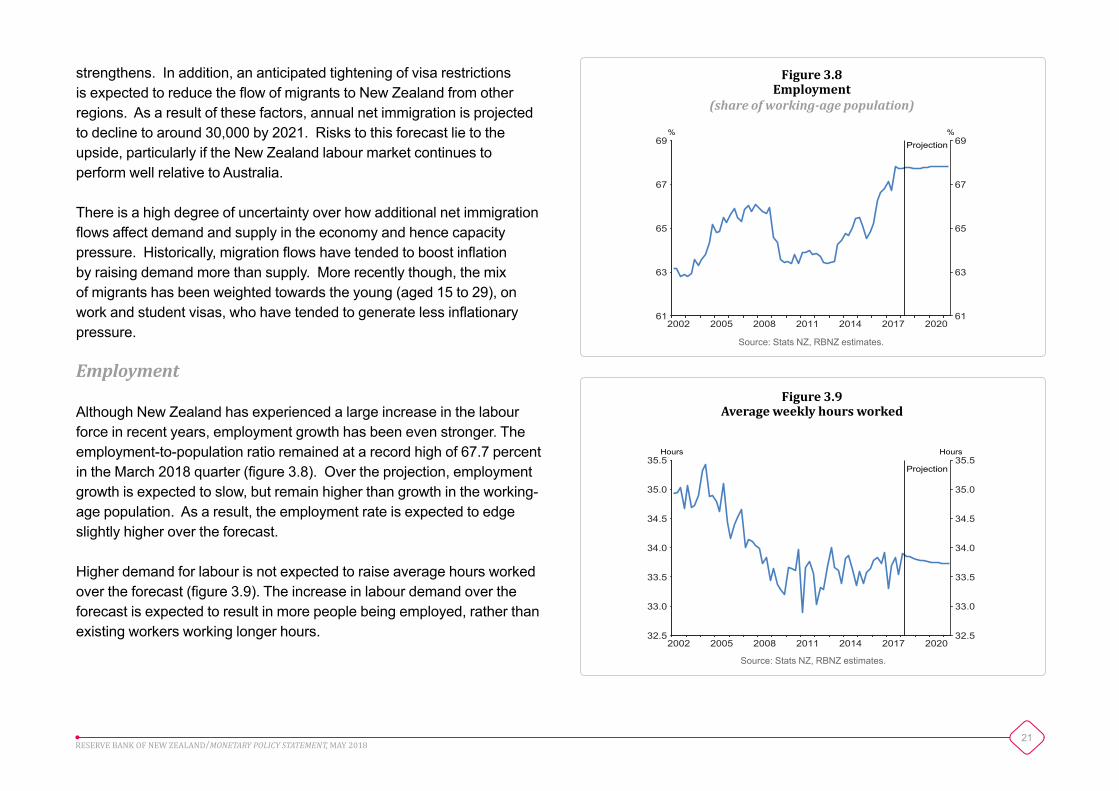
strengthens. In addition, an anticipated tightening of visa restrictions is expected to reduce the flow of migrants to New Zealand from other regions. As a result of these factors, annual net immigration is projected to decline to around 30,000 by 2021. Risks to this forecast lie to the upside, particularly if the New Zealand labour market continues to perform well relative to Australia.
There is a high degree of uncertainty over how additional net immigration flows affect demand and supply in the economy and hence capacity pressure. Historically, migration flows have tended to boost inflation by raising demand more than supply. More recently though, the mix of migrants has been weighted towards the young (aged 15 to 29), on work and student visas, who have tended to generate less inflationary pressure.
Employment
Although New Zealand has experienced a large increase in the labour force in recent years, employment growth has been even stronger. The employment-to-population ratio remained at a record high of 67.7 percent in the March 2018 quarter (figure 3.8). Over the projection, employment growth is expected to slow, but remain higher than growth in the working-age population. As a result, the employment rate is expected to edge slightly higher over the forecast.
Higher demand for labour is not expected to raise average hours worked over the forecast (figure 3.9). The increase in labour demand over the forecast is expected to result in more people being employed, rather than existing workers working longer hours.
2002 2005 2008 2011 2014 2017 202061
63
65
67
69
61
63
65
67
69% %
Projection
Figure 3.8Employment
(share of working-age population)
Source: Stats NZ, RBNZ estimates.
2002 2005 2008 2011 2014 2017 202032.5
33.0
33.5
34.0
34.5
35.0
35.5
32.5
33.0
33.5
34.0
34.5
35.0
35.5Hours Hours
Projection
Figure 3.9Average weekly hours worked
Source: Stats NZ, RBNZ estimates.

22RESERVE BANK OF NEW ZEALAND/MONETARY POLICY STATEMENT, MAY 2018
Labour market slack and capacity pressure
Employment growth has exceeded labour force growth in recent years resulting in the unemployment rate declining from more than 6 percent in 2012 to 4.4 percent in the March 2018 quarter (figure 3.10). There is a great deal of uncertainty over where the current level of employment stands in relation to its maximum sustainable level. No single indicator can provide a comprehensive answer, so the Reserve Bank tracks a number of metrics to form a holistic assessment (see box C). Our thinking in this area is evolving, but based on the available evidence, employment appears to be around its maximum sustainable level.
Over the projection, employment growth is expected to continue to outpace growth in the labour force, leading to further tightening in the labour market. This labour market tightening is reflected in a slight fall in the unemployment rate over the next three years.
This assessment of the labour market is consistent with broader measures of capacity. Our suite of indicators of capacity pressure suggests that the level of GDP is broadly in line with the level of potential output and the output gap is around zero (figure 3.11). Over the projection, stimulatory monetary policy is expected to support an increase in the output gap to 0.9 percent of potential output in 2020, generating a pick-up in inflationary pressure and returning inflation to the 2 percent mid-point.
2002 2005 2008 2011 2014 2017 20203.0
3.5
4.0
4.5
5.0
5.5
6.0
6.5
7.0
3.0
3.5
4.0
4.5
5.0
5.5
6.0
6.5
7.0% %
Projection
Figure 3.10Unemployment rate
Source: Stats NZ, RBNZ estimates.
2002 2005 2008 2011 2014 2017 2020-5
-4
-3
-2
-1
0
1
2
3
4
-5
-4
-3
-2
-1
0
1
2
3
4% %
Output gap
Indicator rangeProjection
Figure 3.11Output gap and indicator range
(share of potential output)
Source: Stats NZ, RBNZ estimates.
Note: Shaded area indicates the range between maximum and minimum values from a suite of indicators of the output gap.
23RESERVE BANK OF NEW ZEALAND/MONETARY POLICY STATEMENT, MAY 2018
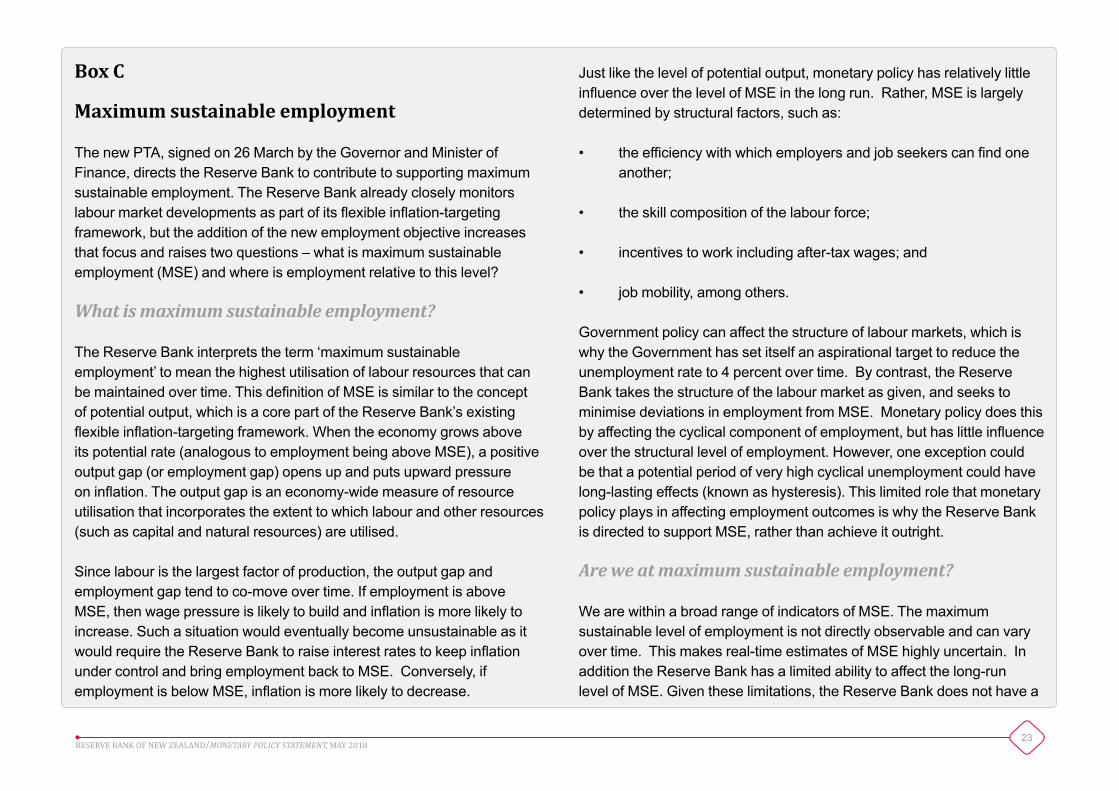
Box C
Maximum sustainable employment
The new PTA, signed on 26 March by the Governor and Minister of Finance, directs the Reserve Bank to contribute to supporting maximum sustainable employment. The Reserve Bank already closely monitors labour market developments as part of its flexible inflation-targeting framework, but the addition of the new employment objective increases that focus and raises two questions – what is maximum sustainable employment (MSE) and where is employment relative to this level?
What is maximum sustainable employment?
The Reserve Bank interprets the term ‘maximum sustainable employment’ to mean the highest utilisation of labour resources that can be maintained over time. This definition of MSE is similar to the concept of potential output, which is a core part of the Reserve Bank’s existing flexible inflation-targeting framework. When the economy grows above its potential rate (analogous to employment being above MSE), a positive output gap (or employment gap) opens up and puts upward pressure on inflation. The output gap is an economy-wide measure of resource utilisation that incorporates the extent to which labour and other resources (such as capital and natural resources) are utilised.
Since labour is the largest factor of production, the output gap and employment gap tend to co-move over time. If employment is above MSE, then wage pressure is likely to build and inflation is more likely to increase. Such a situation would eventually become unsustainable as it would require the Reserve Bank to raise interest rates to keep inflation under control and bring employment back to MSE. Conversely, if employment is below MSE, inflation is more likely to decrease.
Just like the level of potential output, monetary policy has relatively little influence over the level of MSE in the long run. Rather, MSE is largely determined by structural factors, such as:
• the efficiency with which employers and job seekers can find one another;
• the skill composition of the labour force;
• incentives to work including after-tax wages; and
• job mobility, among others.
Government policy can affect the structure of labour markets, which is why the Government has set itself an aspirational target to reduce the unemployment rate to 4 percent over time. By contrast, the Reserve Bank takes the structure of the labour market as given, and seeks to minimise deviations in employment from MSE. Monetary policy does this by affecting the cyclical component of employment, but has little influence over the structural level of employment. However, one exception could be that a potential period of very high cyclical unemployment could have long-lasting effects (known as hysteresis). This limited role that monetary policy plays in affecting employment outcomes is why the Reserve Bank is directed to support MSE, rather than achieve it outright.
Are we at maximum sustainable employment?
We are within a broad range of indicators of MSE. The maximum sustainable level of employment is not directly observable and can vary over time. This makes real-time estimates of MSE highly uncertain. In addition the Reserve Bank has a limited ability to affect the long-run level of MSE. Given these limitations, the Reserve Bank does not have a
24RESERVE BANK OF NEW ZEALAND/MONETARY POLICY STATEMENT, MAY 2018
specific numerical target for employment, unlike for inflation. Instead, the Reserve Bank monitors a wide range of labour market indicators to form a holistic assessment of whether the economy is currently operating at MSE.
The ideal indicator of MSE should help us identify when the demand for labour is growing at a different rate to the supply of labour, and hence should be well-correlated with cyclical fluctuations in wage growth. The following paragraphs describe several labour market indicators, highlight their different trends, and provide an initial assessment of whether the economy is at MSE.
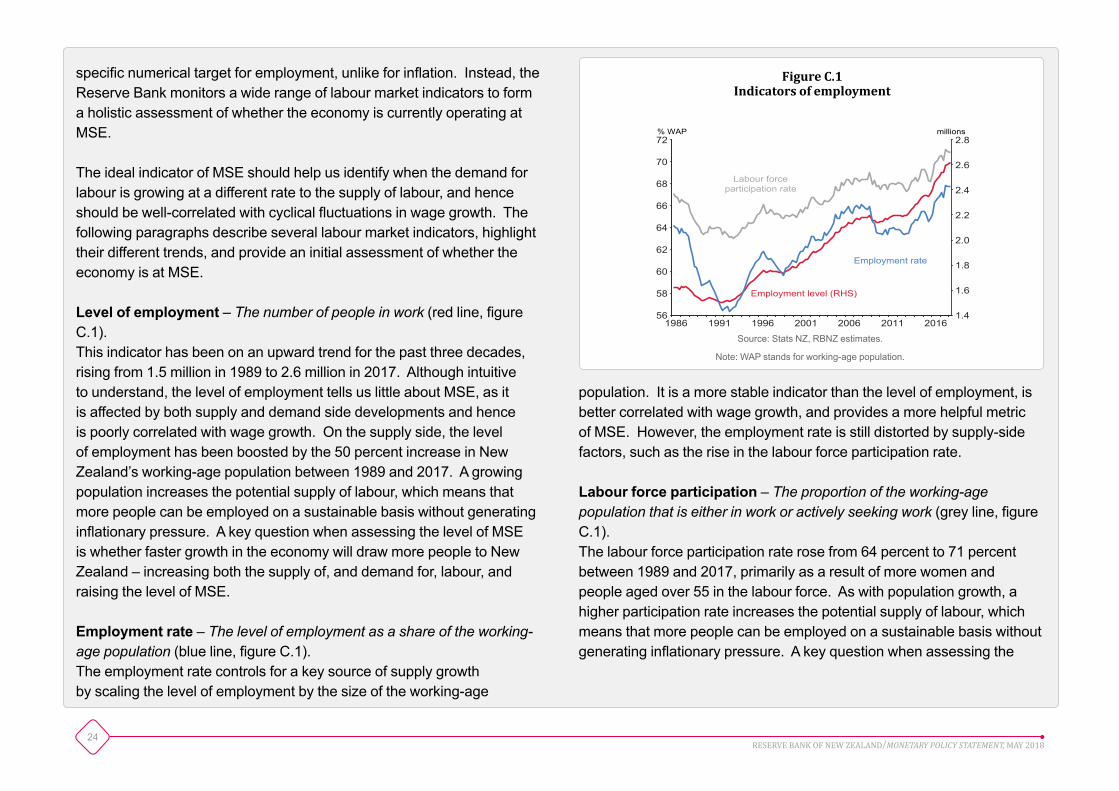
Level of employment – The number of people in work (red line, figure C.1). This indicator has been on an upward trend for the past three decades, rising from 1.5 million in 1989 to 2.6 million in 2017. Although intuitive to understand, the level of employment tells us little about MSE, as it is affected by both supply and demand side developments and hence is poorly correlated with wage growth. On the supply side, the level of employment has been boosted by the 50 percent increase in New Zealand’s working-age population between 1989 and 2017. A growing population increases the potential supply of labour, which means that more people can be employed on a sustainable basis without generating inflationary pressure. A key question when assessing the level of MSE is whether faster growth in the economy will draw more people to New Zealand – increasing both the supply of, and demand for, labour, and raising the level of MSE.
Employment rate – The level of employment as a share of the working- age population (blue line, figure C.1). The employment rate controls for a key source of supply growth by scaling the level of employment by the size of the working-age
population. It is a more stable indicator than the level of employment, is better correlated with wage growth, and provides a more helpful metric of MSE. However, the employment rate is still distorted by supply-side factors, such as the rise in the labour force participation rate.
Labour force participation – The proportion of the working-age population that is either in work or actively seeking work (grey line, figure C.1). The labour force participation rate rose from 64 percent to 71 percent between 1989 and 2017, primarily as a result of more women and people aged over 55 in the labour force. As with population growth, a higher participation rate increases the potential supply of labour, which means that more people can be employed on a sustainable basis without generating inflationary pressure. A key question when assessing the
1986 1991 1996 2001 2006 2011 2016 1.4
1.6
1.8
2.0
2.2
2.4
2.6
2.8
56
58
60
62
64
66
68
70
72% WAP millions
Employment rate
Employment level (RHS)
Labour forceparticipation rate
Figure C.1Indicators of employment
Source: Stats NZ, RBNZ estimates.
Note: WAP stands for working-age population.
25RESERVE BANK OF NEW ZEALAND/MONETARY POLICY STATEMENT, MAY 2018
0
2
4
6
8
10
12
14
16
18
0
2
4
6
8
10
12
14
16
18
Spai
nG
reec
eSl
ovak
Rep
ublic
Latv
iaPo
land
Euro
(19
coun
tries
)Tu
rkey
Portu
gal
Esto
nia
Italy
Fran
ceEU
(28
coun
tries
)Fi
nlan
dIre
land
Chile
Belg
ium
Hung
ary
Isra
elG
erm
any
Cana
daSw
eden
Slov
enia
OEC
DCz
ech
Repu
blic G7
Unite
d St
ates
Unite
d Ki
ngdo
mAu
stra
liaDe
nmar
kNe
w Ze
alan
dNe
ther
land
sAu
stria
Luxe
mbo
urg
Switz
erla
ndM
exico
Icel
and
Japa
nNo
rway
Sout
h Ko
rea
%%
Figure C.320-year average unemployment rates across the OECD
Source: OECD, RBNZ estimates.
Note: 20-year averages are used here as an imperfect proxy for structural unemployment rates.
1990 1994 1998 2002 2006 2010 2014 0
2
4
6
8
10
12
0
2
4
6
8
10
12% %
Unemploymentrate
12 months + < 1 month
1-12 months
Non-specified
Figure C.2Unemployment rate by duration
Source: Stats NZ, RBNZ estimates.
level of MSE is whether a strong labour market will draw more people into the labour force and raise the participation rate further.
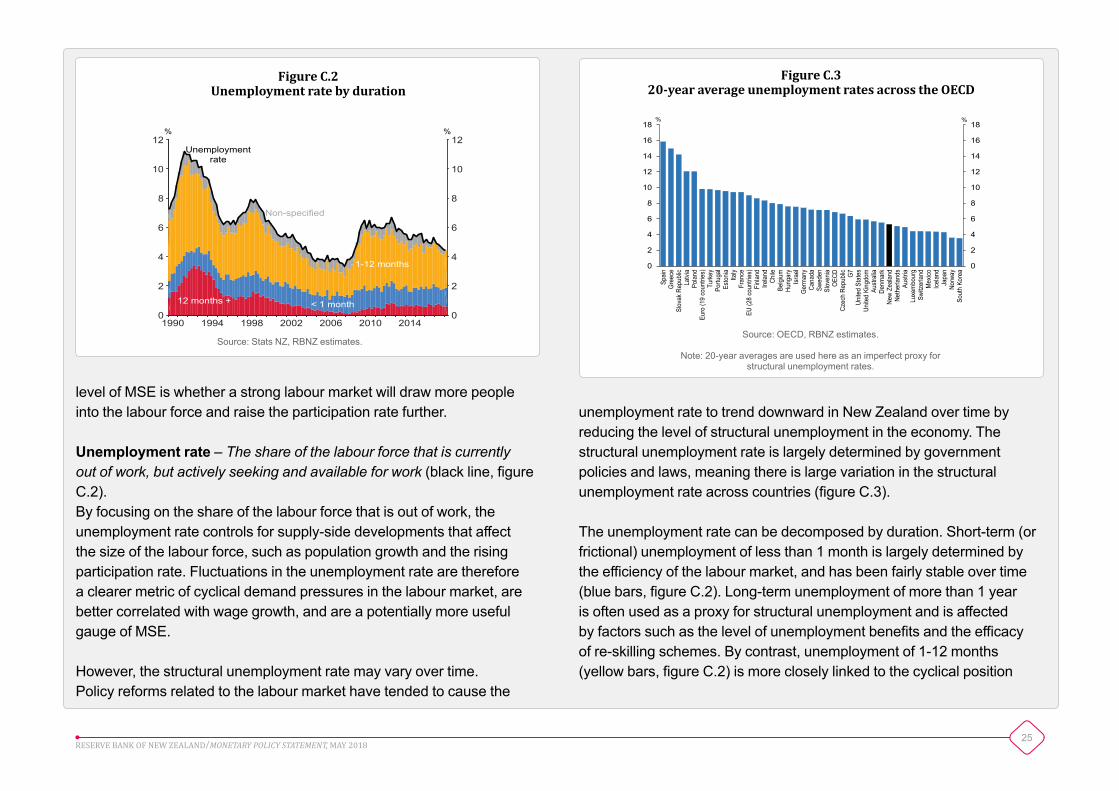
Unemployment rate – The share of the labour force that is currently out of work, but actively seeking and available for work (black line, figure C.2). By focusing on the share of the labour force that is out of work, the unemployment rate controls for supply-side developments that affect the size of the labour force, such as population growth and the rising participation rate. Fluctuations in the unemployment rate are therefore a clearer metric of cyclical demand pressures in the labour market, are better correlated with wage growth, and are a potentially more useful gauge of MSE.
However, the structural unemployment rate may vary over time. Policy reforms related to the labour market have tended to cause the
unemployment rate to trend downward in New Zealand over time by reducing the level of structural unemployment in the economy. The structural unemployment rate is largely determined by government policies and laws, meaning there is large variation in the structural unemployment rate across countries (figure C.3).
The unemployment rate can be decomposed by duration. Short-term (or frictional) unemployment of less than 1 month is largely determined by the efficiency of the labour market, and has been fairly stable over time (blue bars, figure C.2). Long-term unemployment of more than 1 year is often used as a proxy for structural unemployment and is affected by factors such as the level of unemployment benefits and the efficacy of re-skilling schemes. By contrast, unemployment of 1-12 months (yellow bars, figure C.2) is more closely linked to the cyclical position

26RESERVE BANK OF NEW ZEALAND/MONETARY POLICY STATEMENT, MAY 2018
of the economy. The 1-12 month unemployment rate is also better correlated with wage growth than the headline unemployment rate, and hence could be a more useful gauge of demand pressures. However, accurately measuring cyclical unemployment is difficult. The 1-12 month unemployment rate currently stands at 2.6 percent, close to its post-2000 average.
NAIRU – The Non-Accelerating Inflation Rate of Unemployment (grey shading, figure C.4). Another more technical method of estimating the level of MSE is to use models to extract the trend component of the unemployment rate that is consistent with stable wage growth and inflation. One difficulty with such estimates is that they are subject to very wide error bands – the Reserve Bank’s estimates of the NAIRU range from 3.5 percent to 5.3 percent. The current unemployment rate of 4.4 percent falls in the middle of this wide band.
Underutilisation – A broader picture of spare capacity in the labour market. Underutilisation is made up of unemployment, underemployment, and the potential labour force (figure C.5).
Underemployment rate – The share of employed people who would prefer to work longer hours. All of the above labour market indicators have focused on metrics of employment in terms of the number of people in work, not how many hours those people actually work. One way to gauge the importance of the hours worked component of employment is to track the proportion of the labour force who say they are underemployed – people who have jobs, but would like to work more hours if they could. This metric has been fairly stable since 2010, but remains high relative to the mid-2000s. This metric suggests there is still some additional spare capacity in the
2005 2007 2009 2011 2013 2015 20170
2
4
6
8
10
12
14
16
0
2
4
6
8
10
12
14
16% %
Potential labour force
Underemployment
Unemployment
Underutilisation
Figure C.5Contributions to underutilisation
(share of the extended labour force)
Source: Stats NZ, RBNZ estimates.
2002 2005 2008 2011 2014 20170
1
2
3
4
5
6
7
8
0
1
2
3
4
5
6
7
8% %
Unemploymentrate
Annual LCIwage growth
NAIRUrange
Figure C.4Unemployment rate, wage growth and estimates of the NAIRU
Source: Stats NZ, RBNZ estimates.
Note: Shaded area indicates the range between maximum and minimum values from a suite of indicators of the NAIRU.

27RESERVE BANK OF NEW ZEALAND/MONETARY POLICY STATEMENT, MAY 2018
2002 2005 2008 2011 2014 2017-4
-3
-2
-1
0
1
2
3
4
-4
-3
-2
-1
0
1
2
3
4% %
Output gap
Labour market indicators
Figure C.6Employment gap metrics
(deviation from trend)
Source: Stats NZ, RBNZ estimates.
Note: Labour market indicators include a range of employment gaps and unemployment gaps. Employment gaps include HLFS and QES employment relative to trend.
Unemployment gaps include unemployment relative to multiple measures of NAIRU or trend unemployment.
labour market beyond what the headline unemployment rate would suggest. However, the underemployment rate is less well correlated with wage growth than the headline unemployment rate, suggesting we may want to place less weight on this metric.
Potential labour force – People who are not part of the formal labour force, but are either seeking work but not immediately available to work, or available to work but not currently seeking work. Another source of underutilisation that is not captured in conventional labour market statistics stems from the definition of unemployment, which requires individuals to be both available for work and actively seeking work. A proportion of the working-age population meet only one of these criteria, and are therefore on the fringe of the labour force but not technically included in it. This ‘potential labour force’ has been elevated since 2010, but has recently fallen, suggesting little additional spare capacity remains via this channel. As with the underemployment rate, the potential labour force is less well correlated with wage growth than the headline unemployment rate, suggesting less weight should be put on this metric.
Employment gaps – Deviations of employment (or unemployment) from an unobservable trend rate. The Reserve Bank already tracks a number of labour market indicators within its broader suite of capacity metrics. These metrics typically involve taking an observed series, such as the employment rate highlighted above, and calculating the deviation of that rate from an unobserved trend or MSE level. Various techniques are used to construct such trends, from statistical filters to structural models, with wide bands of uncertainty around each. The current range of indicators is shown in the blue lines in figure C.6. Overall, these suggest that the labour market has been tightening in recent years and most now suggest that the level of employment is close to its ‘trend’ level.

28RESERVE BANK OF NEW ZEALAND/MONETARY POLICY STATEMENT, MAY 2018
Chapter 4Prices and costs
• AnnualCPIinflationfellto1.1percentintheMarch2018quarter,reflectingafallintradablesinflationandtheremovaloffeesforfirst-yeartertiaryeducation.Inflationisexpectedtoaverage1.4percentin2018,lowerthanprojectedintheFebruaryStatement.
• Measuresofunderlyinginflationremainsubdued,despitesparecapacityhavingbeenabsorbedgraduallyoverseveralyears.Non-tradablesinflation,coreinflation,andwageinflationareallbelowtheirhistoricalaverages.
• Ariseincapacitypressureisexpectedtogenerateanincreaseinnon-tradablesinflationoverthemediumterm,leadingCPIinflationtosettlenearthetargetmid-point.
Consumer price inflation
Annual CPI inflation declined from 1.6 percent in the December 2017 quarter to 1.1 percent in the March 2018 quarter. The fall in headline inflation was largely due to lower tradables inflation. The decline in tertiary education prices also reduced headline inflation, following the introduction of the Government’s first-year fees-free policy. Non-tradables inflation, core inflation, and wage inflation all remained below average.
Over the next year, annual CPI inflation is expected to be lower than projected in the February Statement (figure 4.1), reflecting a weaker outlook for tradables inflation.
Annual CPI inflation is expected to increase over the medium term and settle around the target mid-point. Stimulatory monetary policy supports GDP growth, leading to a rise in capacity pressure and non-tradables inflation. Tradables inflation increases only gradually, and remains below average at the end of the projection.

29RESERVE BANK OF NEW ZEALAND/MONETARY POLICY STATEMENT, MAY 2018
Underlying inflation and expectations
The Bank uses a number of measures of core inflation to abstract from idiosyncratic price movements and to estimate the underlying trend in inflation. These measures seek to look through temporary volatility, such as price movements related to international commodity prices or government policy changes, giving a clearer assessment of inflationary pressure in the economy. Core inflation measures continue to point to subdued underlying inflationary pressure (figure 4.2).
Long-term inflation expectations remain well anchored close to 2 percent. Short-term inflation expectations have increased from a year ago, and are also close to 2 percent (figure 4.3). This is consistent with the lift in headline inflation in 2017. Short-term measures of expectations may temporarily decline in coming quarters due to lower headline inflation this year.
2005 2008 2011 2014 2017 20200
1
2
3
4
5
6
0
1
2
3
4
5
6% %
Projection
MayMPS
FebMPS
Figure 4.1CPI inflation
(annual)
Source: Stats NZ, RBNZ estimates.
2000 2003 2006 2009 2012 2015 0
1
2
3
4
5
0
1
2
3
4
5% %
1-year
10-year
2-year
Figure 4.3Inflation expectations
(annual)
Source: RBNZ estimates.
Note: Inflation expectation measures are estimates drawn at each time horizon from the RBNZ inflation expectations curve, based on surveys of businesses and professional forecasters at
different horizons.
2000 2003 2006 2009 2012 2015 0
1
2
3
4
5
0
1
2
3
4
5% %
Sectoral factor model
CPI less food and energy
Figure 4.2Core inflation measures(annual, excluding GST)
Source: Stats NZ, RBNZ estimates.

30RESERVE BANK OF NEW ZEALAND/MONETARY POLICY STATEMENT, MAY 2018
2005 2008 2011 2014 2017 20201
2
3
4
5
6
1
2
3
4
5
6% %
Projection
MayMPS
FebMPS
Figure 4.5Non-tradables inflation
(annual)
Source: Stats NZ, RBNZ estimates.
Note: The dashed line represents the post-2000 average of realised annual non-tradables inflation.
2000 2003 2006 2009 2012 2015 0
2
4
6
8
10
0
2
4
6
8
10% %
Non-tradables
Construction costs
Non-tradables ex.construction costs
Figure 4.4Non-tradables and construction cost inflation
(annual)
Source: Stats NZ, RBNZ estimates.
Non-tradables inflation and wages
Annual non-tradables inflation remained below average at 2.3 percent in the March 2018 quarter. Domestic inflation has remained subdued, despite spare capacity having been absorbed gradually over several years. In part, this appears to be a consequence of low CPI inflation between 2012 and 2016. At present, businesses appear to be placing more weight on past inflation outcomes than on their expectations of future inflation when making pricing decisions. Other factors, such as technological developments and the globalisation of labour markets, may also be acting to suppress prices.
The fall in annual non-tradables inflation in the March quarter reflected a drop in education prices due to the introduction of fees-free tertiary education for first-year students. Housing-related components have continued to support non-tradables inflation. However, inflation in construction costs (excluding land) has declined over the past year as growth in residential construction and house price inflation have slowed (figure 4.4). Non-tradables inflation excluding construction costs is still subdued.
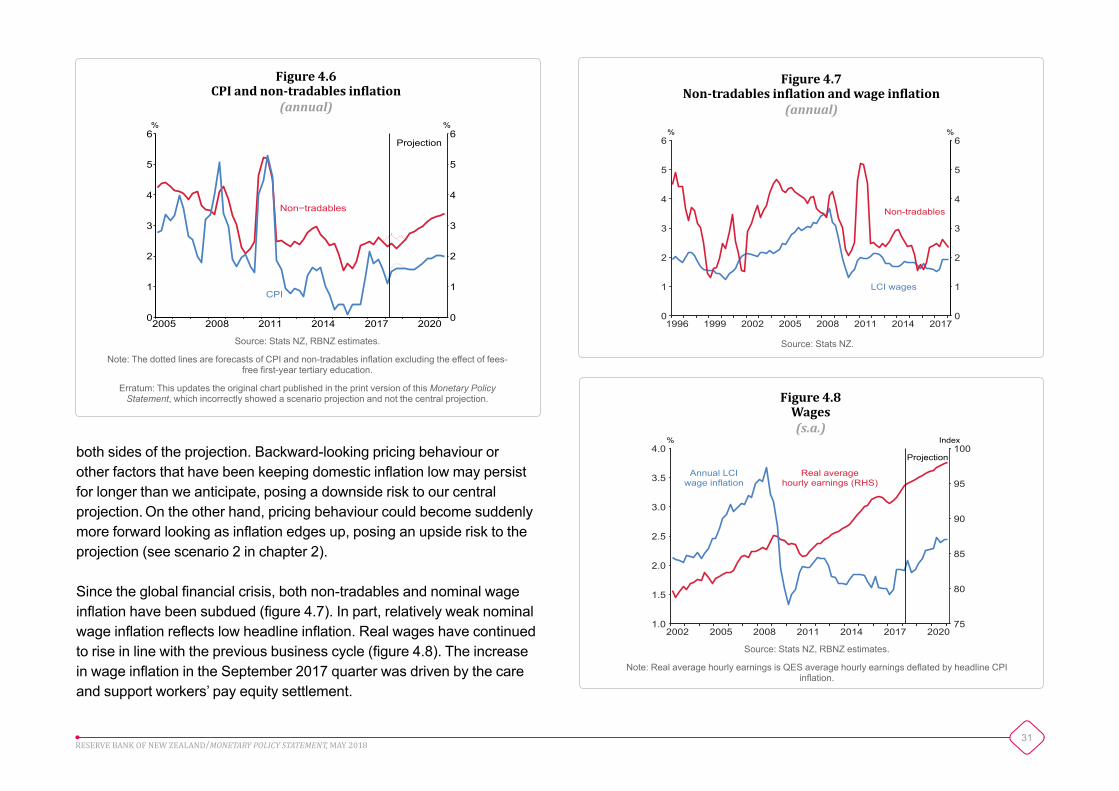
Non-tradables inflation is expected to increase over the medium term (figure 4.5). The increase is expected to begin in 2019 as the effect of the recent fall in education prices drops out of the annual calculation (figure 4.6). Non-tradables inflation continues to rise beyond 2019, a result of the gradual increase in capacity pressure expected over the projection, as discussed in chapter 3.
The risks to non-tradables inflation appear balanced over the medium term. A key assumption is that past low inflation continues to weigh on pricing behaviour over the projection, but that this effect will gradually diminish as headline inflation rises. This assumption poses risks to
31RESERVE BANK OF NEW ZEALAND/MONETARY POLICY STATEMENT, MAY 2018
2005 2008 2011 2014 2017 2020 0
1
2
3
4
5
6
0
1
2
3
4
5
6% %
Non−tradables
CPI
Projection
Figure 4.6CPI and non-tradables inflation
(annual)
Source: Stats NZ, RBNZ estimates.
Note: The dotted lines are forecasts of CPI and non-tradables inflation excluding the effect of fees-free first-year tertiary education.
Erratum: This updates the original chart published in the print version of this Monetary Policy Statement, which incorrectly showed a scenario projection and not the central projection.
2002 2005 2008 2011 2014 2017 202075
80
85
90
95
100
1.0
1.5
2.0
2.5
3.0
3.5
4.0% Index
Annual LCIwage inflation
Real averagehourly earnings (RHS)
Projection
Figure 4.8Wages(s.a.)
Source: Stats NZ, RBNZ estimates.
Note: Real average hourly earnings is QES average hourly earnings deflated by headline CPI inflation.
1996 1999 2002 2005 2008 2011 2014 20170
1
2
3
4
5
6
0
1
2
3
4
5
6% %
Non-tradables
LCI wages
Figure 4.7Non-tradables inflation and wage inflation
(annual)
Source: Stats NZ.
both sides of the projection. Backward-looking pricing behaviour or other factors that have been keeping domestic inflation low may persist for longer than we anticipate, posing a downside risk to our central projection. On the other hand, pricing behaviour could become suddenly more forward looking as inflation edges up, posing an upside risk to the projection (see scenario 2 in chapter 2).
Since the global financial crisis, both non-tradables and nominal wage inflation have been subdued (figure 4.7). In part, relatively weak nominal wage inflation reflects low headline inflation. Real wages have continued to rise in line with the previous business cycle (figure 4.8). The increase in wage inflation in the September 2017 quarter was driven by the care and support workers’ pay equity settlement.

32RESERVE BANK OF NEW ZEALAND/MONETARY POLICY STATEMENT, MAY 2018
2015 2016 2017-3
-2
-1
0
1
2
-3
-2
-1
0
1
2% %
Tradables
Fuel
Food
Other
Figure 4.10Contributions to annual tradables inflation
Source: Stats NZ, RBNZ estimates.
2005 2008 2011 2014 2017 2020-4
-2
0
2
4
6
8
-4
-2
0
2
4
6
8% %
Projection
MayMPS
FebMPS
Figure 4.9Tradables inflation
(annual)
Source: Stats NZ, RBNZ estimates.
Note: The dashed line represents the post-2000 average of realised annual tradables inflation.
The rise in capacity pressure, increases in the minimum wage, and rising headline inflation are expected to generate higher wage inflation. There is a risk that minimum wage increases pass through to aggregate wage inflation to a greater extent than currently assumed.
Tradables inflation and external prices
Volatility in headline CPI inflation over the past year has largely reflected food and fuel costs. Annual tradables inflation declined to -0.4 percent in the March 2018 quarter (figure 4.9). The effect of high food prices over 2017 has faded, resulting in lower tradables inflation. Food prices are expected to weigh on inflation over the next year as the weather-related increase seen in 2017 reverses (figure 4.10). In addition, subdued global
2002 2005 2008 2011 2014 2017 20201.00
1.05
1.10
1.15
1.20
1.25
1.30
1.00
1.05
1.10
1.15
1.20
1.25
1.30Index Index
Projection
Figure 4.11Import prices
(world terms, s.a.)
Source: Stats NZ, RBNZ estimates.
33RESERVE BANK OF NEW ZEALAND/MONETARY POLICY STATEMENT, MAY 2018
2002 2005 2008 2011 2014 2017 202050
55
60
65
70
75
80
85
50
55
60
65
70
75
80
85Index Index
Projection
Figure 4.12New Zealand dollar TWI
Source: RBNZ estimates.
inflationary pressure appears to be dampening a range of tradable-goods prices.
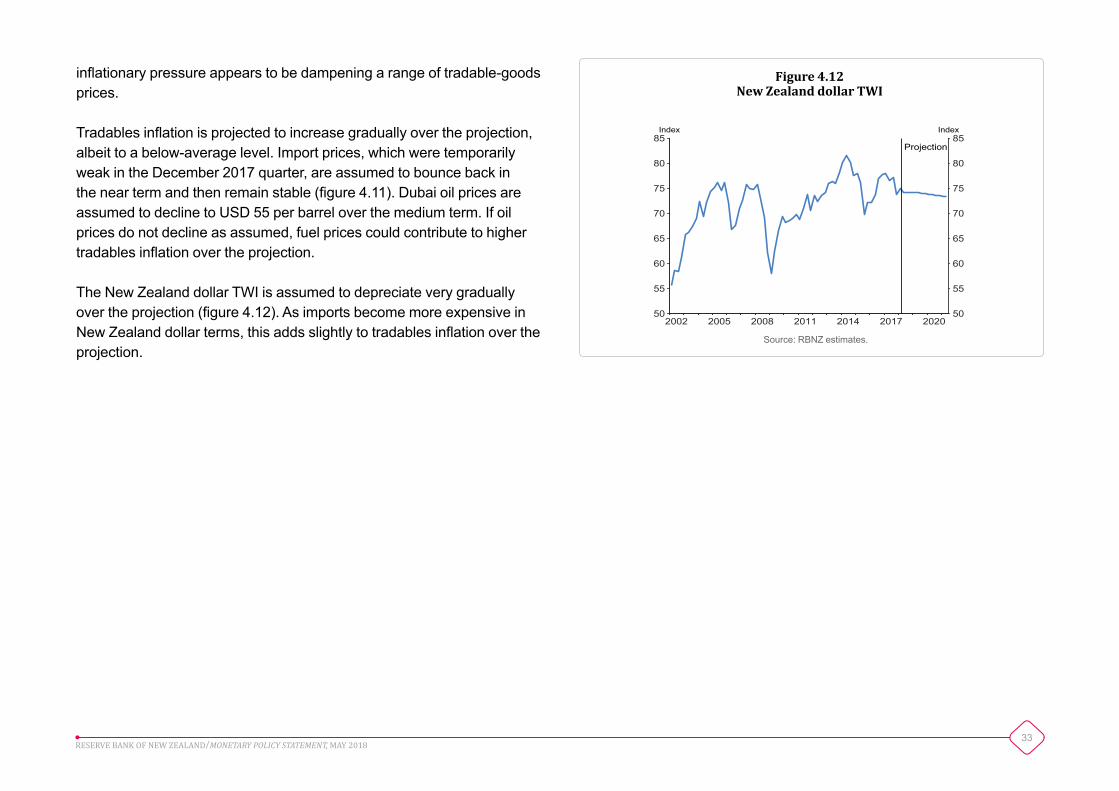
Tradables inflation is projected to increase gradually over the projection, albeit to a below-average level. Import prices, which were temporarily weak in the December 2017 quarter, are assumed to bounce back in the near term and then remain stable (figure 4.11). Dubai oil prices are assumed to decline to USD 55 per barrel over the medium term. If oil prices do not decline as assumed, fuel prices could contribute to higher tradables inflation over the projection.
The New Zealand dollar TWI is assumed to depreciate very gradually over the projection (figure 4.12). As imports become more expensive in New Zealand dollar terms, this adds slightly to tradables inflation over the projection.
34RESERVE BANK OF NEW ZEALAND/MONETARY POLICY STATEMENT, MAY 2018
Chapter 5International and financial markets developments
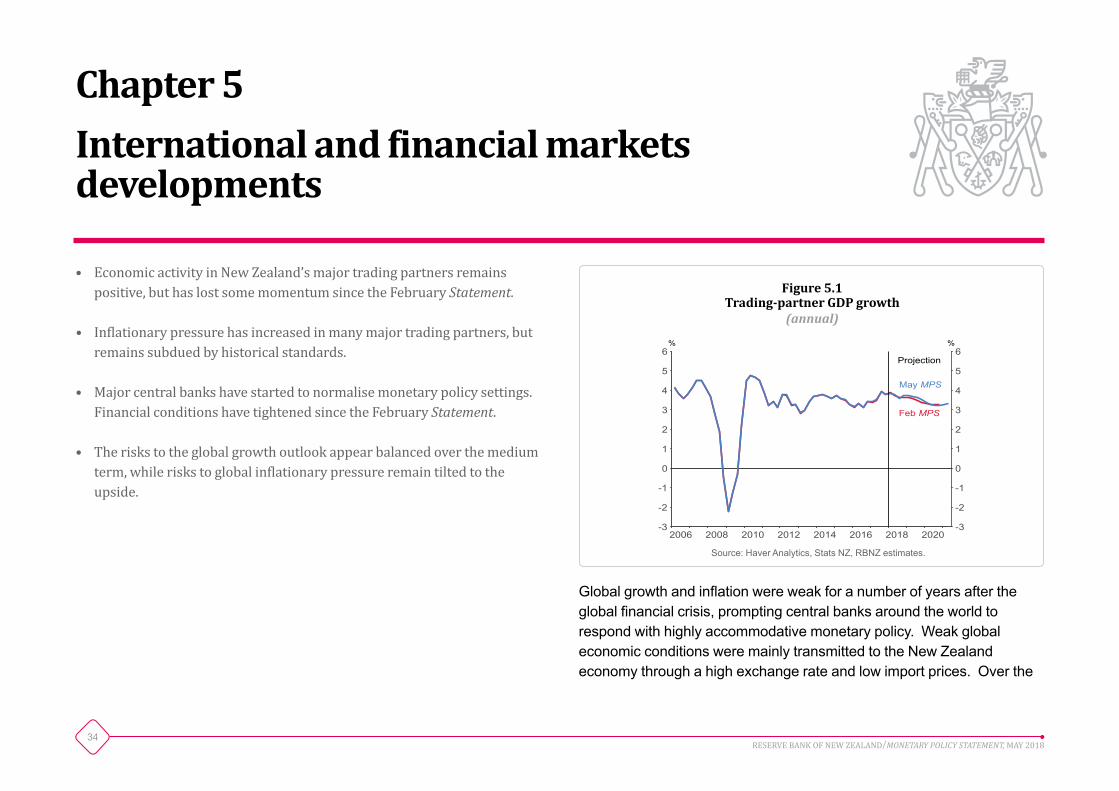
• EconomicactivityinNewZealand’smajortradingpartnersremainspositive,buthaslostsomemomentumsincetheFebruaryStatement.
• Inflationarypressurehasincreasedinmanymajortradingpartners,butremainssubduedbyhistoricalstandards.
• Majorcentralbankshavestartedtonormalisemonetarypolicysettings.FinancialconditionshavetightenedsincetheFebruaryStatement.
• Theriskstotheglobalgrowthoutlookappearbalancedoverthemediumterm,whileriskstoglobalinflationarypressureremaintiltedtotheupside.
Figure 5.1Trading-partner GDP growth
(annual)
2006 2008 2010 2012 2014 2016 2018 2020-3
-2
-1
0
1
2
3
4
5
6
-3
-2
-1
0
1
2
3
4
5
6% %
Feb MPS
May MPS
Projection
Source: Haver Analytics, Stats NZ, RBNZ estimates.
Global growth and inflation were weak for a number of years after the global financial crisis, prompting central banks around the world to respond with highly accommodative monetary policy. Weak global economic conditions were mainly transmitted to the New Zealand economy through a high exchange rate and low import prices. Over the
35RESERVE BANK OF NEW ZEALAND/MONETARY POLICY STATEMENT, MAY 2018
2007 2009 2011 2013 2015 201735
40
45
50
55
60
65
35
40
45
50
55
60
65Index Index
US ISM composite
Euro area composite
China manufacturing
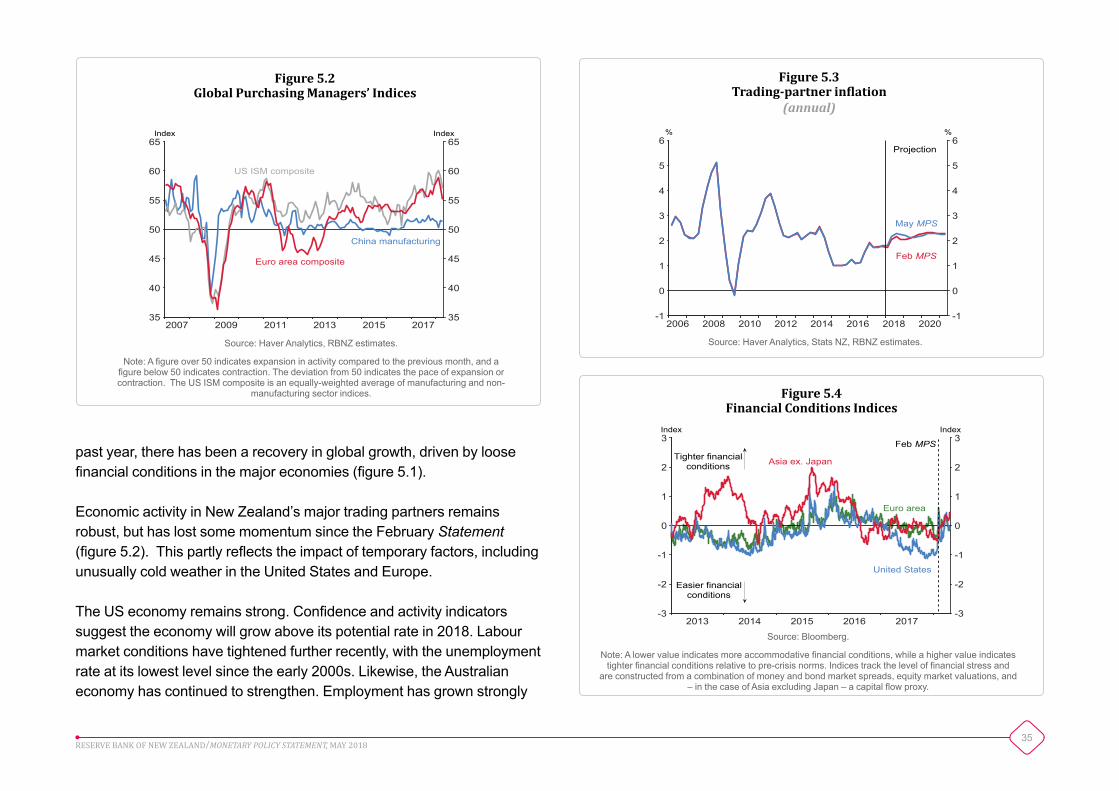
Figure 5.2Global Purchasing Managers’ Indices
Source: Haver Analytics, RBNZ estimates.
Note: A figure over 50 indicates expansion in activity compared to the previous month, and a figure below 50 indicates contraction. The deviation from 50 indicates the pace of expansion or contraction. The US ISM composite is an equally-weighted average of manufacturing and non-
manufacturing sector indices.
2013 2014 2015 2016 2017-3
-2
-1
0
1
2
3
-3
-2
-1
0
1
2
3Index Index
Euro area
United States
Asia ex. JapanTighter financialconditions
Easier financialconditions
Feb MPS
Figure 5.4Financial Conditions Indices
Source: Bloomberg.
Note: A lower value indicates more accommodative financial conditions, while a higher value indicates tighter financial conditions relative to pre-crisis norms. Indices track the level of financial stress and
are constructed from a combination of money and bond market spreads, equity market valuations, and – in the case of Asia excluding Japan – a capital flow proxy.
2006 2008 2010 2012 2014 2016 2018 2020-1
0
1
2
3
4
5
6
-1
0
1
2
3
4
5
6% %
Projection
May MPS
Feb MPS
Figure 5.3Trading-partner inflation
(annual)
Source: Haver Analytics, Stats NZ, RBNZ estimates.
past year, there has been a recovery in global growth, driven by loose financial conditions in the major economies (figure 5.1).
Economic activity in New Zealand’s major trading partners remains robust, but has lost some momentum since the February Statement (figure 5.2). This partly reflects the impact of temporary factors, including unusually cold weather in the United States and Europe.
The US economy remains strong. Confidence and activity indicators suggest the economy will grow above its potential rate in 2018. Labour market conditions have tightened further recently, with the unemployment rate at its lowest level since the early 2000s. Likewise, the Australian economy has continued to strengthen. Employment has grown strongly

36RESERVE BANK OF NEW ZEALAND/MONETARY POLICY STATEMENT, MAY 2018
over the past year, and business surveys suggest that labour market conditions in Australia have continued to tighten.
Inflationary pressure has increased in many major trading partners, but remains subdued by historical standards. In the United States, wage growth has risen in recent months, and inflation has increased. Wage inflation has also increased in the euro area. However, inflation and wage growth remain low in Australia. In most economies, inflation is expected to continue to move closer towards central banks’ targets (figure 5.3).
As economic conditions have improved and inflationary pressure has risen, major central banks are starting to normalise monetary policy settings. The Federal Reserve, Bank of England, and Bank of Canada have all raised policy interest rates over the past year. The Federal Reserve has started reducing its balance sheet, while the European Central Bank has cut its monthly asset purchases.
Global financial conditions have tightened since the February Statement, with lower equity prices, wider credit spreads, increased market volatility,
and higher bank funding costs (figure 5.4). This has been partially driven by higher inflationary pressure and monetary policy normalisation. Tighter financial conditions and higher bank funding costs have not had a major impact on the New Zealand financial system to date (see box D).
The risks around trading-partner growth are balanced. The rebound in economic activity appears to be broad-based. In addition, fiscal policy stimulus will support US economic activity and increase demand in other countries. On the downside, geopolitical tensions, including a global trade war, could reduce global GDP growth and trade, and reduce New Zealand’s export volumes.
The risks around trading-partner inflation are on the upside. Capacity pressure in major economies could build faster than expected. If inflation picks up faster than expected, central banks may tighten monetary policy more quickly. Alternatively, financial markets may push interest rates higher if the outlook for inflation and economic activity becomes more uncertain (see scenario 1 in chapter 2). The impact of tighter financial conditions on New Zealand will depend on which of these two drivers is more dominant.

37RESERVE BANK OF NEW ZEALAND/MONETARY POLICY STATEMENT, MAY 2018
Box D
The impact of US dollar funding pressures on New Zealand banks
The cost of borrowing US dollars at short terms has increased markedly since the February Statement. Corporates in New Zealand and abroad use these markets to raise US dollars before swapping back to their local currency. For New Zealand banks, higher US dollar borrowing costs typically feed through into their cost of funds, which could flow through to retail interest rates in New Zealand. However, to date the impact on New Zealand banks’ funding costs appears to be modest (figure D.1).
While the primary driver of the pressure in US dollar markets remains unclear, the moves are not regarded by market commentators as being indicative of broader credit stress in the banking sector. For non-US-domiciled borrowers, the cost of accessing US dollars via foreign exchange markets has not increased. Further, the cost of insuring bank debt (as measured by credit default swaps) has been stable relative to that seen during previous episodes of bank stress.
Possible explanations for the pressures in US dollar funding markets are centred on increased supply of short-term US dollar debt combined with a decrease in demand from some investors. These explanations include:
• the US branches and subsidiaries of foreign banks having increased their issuance in short-term US dollar debt markets, after new US taxes on intra-company money flows increased the cost of borrowing from their parent companies;
2012 2013 2014 2015 2016 20171.5
2.0
2.5
3.0
3.5
4.0
4.5
5.0
5.5
6.0
1.5
2.0
2.5
3.0
3.5
4.0
4.5
5.0
5.5
6.0% %
Estimated weighted-average cost of new fundingRetail and corporate depositsForeign short-term wholesaleForeign term wholesaleDomestic term wholesale90-day interest rateOCR
Figure D.1Banks’ marginal funding costs
Source: Bloomberg, RBNZ estimates, interest.co.nz.
Note: The shaded areas measure the contribution of each funding source to overall marginal funding costs.
• US multinationals having possibly reduced the investment of their offshore profits in short-term US dollar assets, following recent US tax changes that encourage the repatriation of these offshore funds;
• the US Treasury having increased its issuance of short-term debt to help fund the growing federal deficit following the suspension of the debt ceiling; and
• the Federal Reserve’s shrinking balance sheet gradually reducing liquidity.
New Zealand banks appear to have been largely resilient to US dollar funding pressures thus far. Banks are well positioned, having reduced

38RESERVE BANK OF NEW ZEALAND/MONETARY POLICY STATEMENT, MAY 2018
their reliance on short-term wholesale funding over recent years. The lack of spillover also reflects that bank balance sheets are well funded at present. In particular, banks have seen steady growth in domestic term deposits at the same time as demand for credit from households and businesses has declined.
Nevertheless, some New Zealand dollar funding markets have followed offshore markets in repricing higher. Domestic 90-day bank bill rates
have risen around 15 basis points since the February Statement, and this is feeding into longer-term interest rates. The cost of swapping offshore funding into New Zealand dollars has increased by up to 15 basis points (depending on the term) since the beginning of the year. If this trend continues, it is likely to put pressure on banks’ net interest margins, and it is possible that retail interest rates could rise.

39RESERVE BANK OF NEW ZEALAND/MONETARY POLICY STATEMENT, MAY 2018
Chapter 6Statistical appendix
6.1 Key forecast variables 40
6.2 Measures of inflation, inflation expectations, and asset prices 41
6.3 Measures of labour market conditions 42
6.4 Composition of real GDP growth 43
6.5 Summary of economic projections 44

40RESERVE BANK OF NEW ZEALAND/MONETARY POLICY STATEMENT, MAY 2018
GDP growth CPI inflation CPI inflation TWI OCRQuarterly Quarterly Annual
2016 Mar 1.1 0.2 0.4 72.2 2.4 Jun 1.1 0.4 0.4 73.6 2.3 Sep 0.7 0.3 0.4 77.0 2.1 Dec 0.4 0.4 1.3 77.6 1.92017 Mar 0.7 1.0 2.2 77.9 1.8 Jun 0.9 0.0 1.7 76.5 1.8 Sep 0.6 0.5 1.9 77.1 1.8 Dec 0.6 0.1 1.6 73.8 1.82018 Mar 0.7 0.5 1.1 74.9 1.8 Jun 0.8 0.4 1.5 74.1 1.8 Sep 0.9 0.6 1.6 74.1 1.8 Dec 0.8 0.1 1.6 74.1 1.82019 Mar 0.8 0.5 1.6 74.1 1.8 Jun 0.8 0.4 1.6 74.0 1.8 Sep 0.8 0.6 1.6 74.0 1.9 Dec 0.8 0.2 1.7 73.9 1.92020 Mar 0.8 0.6 1.8 73.7 2.0 Jun 0.7 0.6 1.9 73.6 2.1 Sep 0.8 0.6 1.9 73.5 2.2 Dec 0.7 0.3 2.0 73.5 2.32021 Mar 0.7 0.6 2.0 73.3 2.3
Jun 0.5 0.6 2.0 73.2 2.4
Table 6.1 Key forecast variables
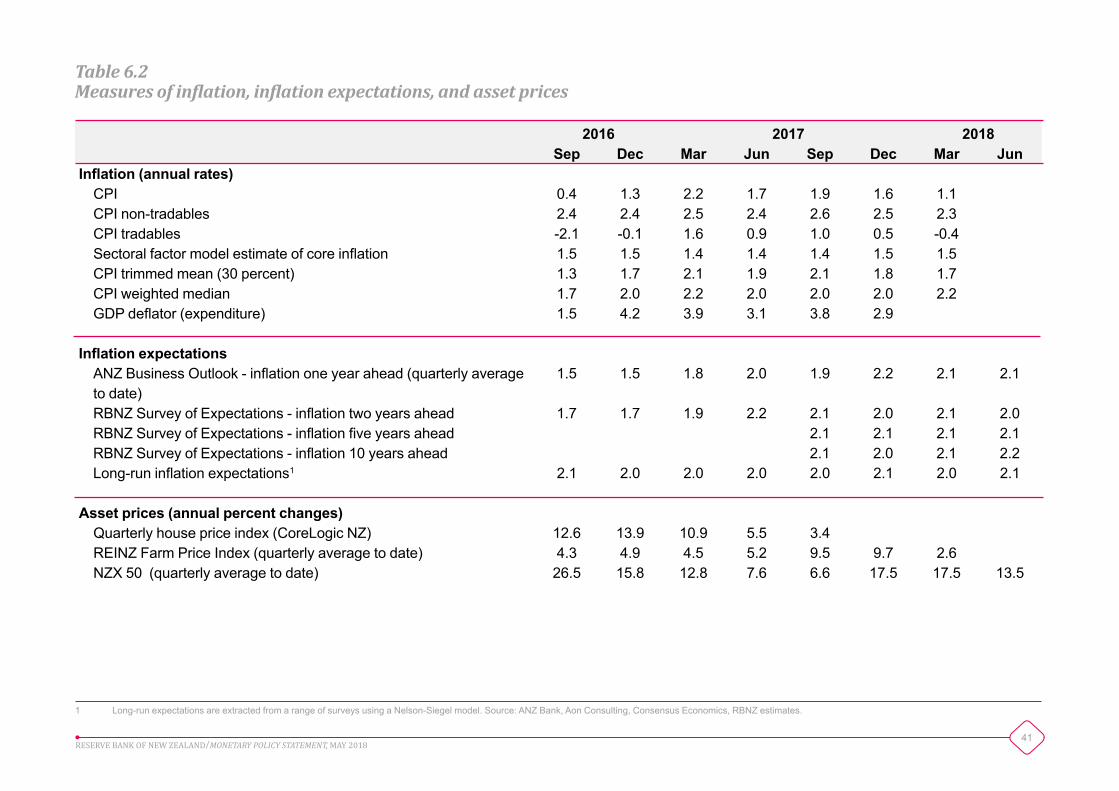
41RESERVE BANK OF NEW ZEALAND/MONETARY POLICY STATEMENT, MAY 2018
2016 2017 2018Sep Dec Mar Jun Sep Dec Mar Jun
Inflation (annual rates)CPI 0.4 1.3 2.2 1.7 1.9 1.6 1.1CPI non-tradables 2.4 2.4 2.5 2.4 2.6 2.5 2.3CPI tradables -2.1 -0.1 1.6 0.9 1.0 0.5 -0.4Sectoral factor model estimate of core inflation 1.5 1.5 1.4 1.4 1.4 1.5 1.5CPI trimmed mean (30 percent) 1.3 1.7 2.1 1.9 2.1 1.8 1.7CPI weighted median 1.7 2.0 2.2 2.0 2.0 2.0 2.2GDP deflator (expenditure) 1.5 4.2 3.9 3.1 3.8 2.9
Inflation expectationsANZ Business Outlook - inflation one year ahead (quarterly average to date)
1.5 1.5 1.8 2.0 1.9 2.2 2.1 2.1
RBNZ Survey of Expectations - inflation two years ahead 1.7 1.7 1.9 2.2 2.1 2.0 2.1 2.0RBNZ Survey of Expectations - inflation five years ahead 2.1 2.1 2.1 2.1RBNZ Survey of Expectations - inflation 10 years ahead 2.1 2.0 2.1 2.2Long-run inflation expectations1 2.1 2.0 2.0 2.0 2.0 2.1 2.0 2.1
Asset prices (annual percent changes)Quarterly house price index (CoreLogic NZ) 12.6 13.9 10.9 5.5 3.4REINZ Farm Price Index (quarterly average to date) 4.3 4.9 4.5 5.2 9.5 9.7 2.6NZX 50 (quarterly average to date) 26.5 15.8 12.8 7.6 6.6 17.5 17.5 13.5
Table 6.2 Measures of inflation, inflation expectations, and asset prices
1 Long-run expectations are extracted from a range of surveys using a Nelson-Siegel model. Source: ANZ Bank, Aon Consulting, Consensus Economics, RBNZ estimates.
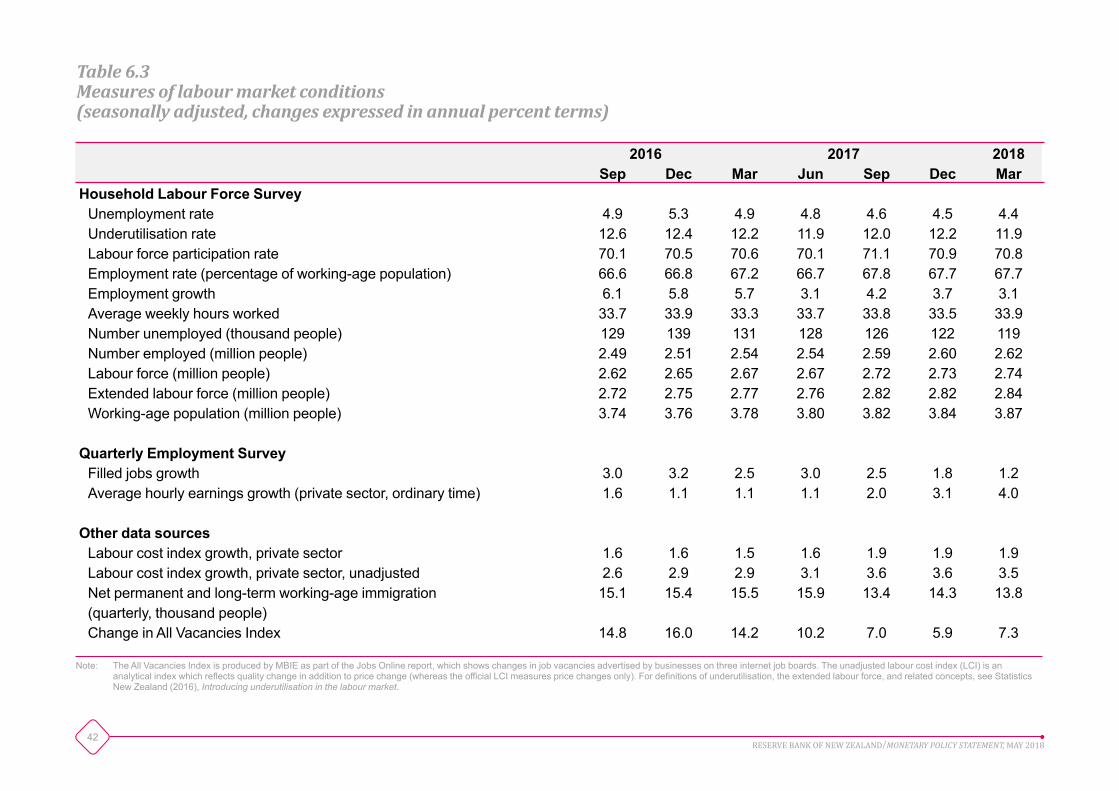
42RESERVE BANK OF NEW ZEALAND/MONETARY POLICY STATEMENT, MAY 2018
2016 2017 2018Sep Dec Mar Jun Sep Dec Mar
Household Labour Force SurveyUnemployment rate 4.9 5.3 4.9 4.8 4.6 4.5 4.4Underutilisation rate 12.6 12.4 12.2 11.9 12.0 12.2 11.9Labour force participation rate 70.1 70.5 70.6 70.1 71.1 70.9 70.8Employment rate (percentage of working-age population) 66.6 66.8 67.2 66.7 67.8 67.7 67.7Employment growth 6.1 5.8 5.7 3.1 4.2 3.7 3.1Average weekly hours worked 33.7 33.9 33.3 33.7 33.8 33.5 33.9Number unemployed (thousand people) 129 139 131 128 126 122 119Number employed (million people) 2.49 2.51 2.54 2.54 2.59 2.60 2.62Labour force (million people) 2.62 2.65 2.67 2.67 2.72 2.73 2.74Extended labour force (million people) 2.72 2.75 2.77 2.76 2.82 2.82 2.84Working-age population (million people) 3.74 3.76 3.78 3.80 3.82 3.84 3.87
Quarterly Employment SurveyFilled jobs growth 3.0 3.2 2.5 3.0 2.5 1.8 1.2Average hourly earnings growth (private sector, ordinary time) 1.6 1.1 1.1 1.1 2.0 3.1 4.0
Other data sourcesLabour cost index growth, private sector 1.6 1.6 1.5 1.6 1.9 1.9 1.9Labour cost index growth, private sector, unadjusted 2.6 2.9 2.9 3.1 3.6 3.6 3.5Net permanent and long-term working-age immigration (quarterly, thousand people)
15.1 15.4 15.5 15.9 13.4 14.3 13.8
Change in All Vacancies Index 14.8 16.0 14.2 10.2 7.0 5.9 7.3
Table 6.3 Measures of labour market conditions (seasonally adjusted, changes expressed in annual percent terms)
Note: The All Vacancies Index is produced by MBIE as part of the Jobs Online report, which shows changes in job vacancies advertised by businesses on three internet job boards. The unadjusted labour cost index (LCI) is an analytical index which reflects quality change in addition to price change (whereas the official LCI measures price changes only). For definitions of underutilisation, the extended labour force, and related concepts, see Statistics New Zealand (2016), Introducing underutilisation in the labour market.

43RESERVE BANK OF NEW ZEALAND/MONETARY POLICY STATEMENT, MAY 2018
Actuals ProjectionsMarch year 2011 2012 2013 2014 2015 2016 2017 2018 2019 2020 2021
Final consumption expenditurePrivate 2.3 3.2 2.3 3.8 3.2 3.9 5.5 4.1 3.5 2.5 2.3Public authority 1.9 1.7 -0.2 2.1 3.2 2.5 2.1 5.1 2.9 1.4 0.4
Total 2.2 2.9 1.7 3.4 3.2 3.6 4.7 4.3 3.3 2.2 1.9
Gross fixed capital formationResidential 1.7 3.0 17.6 15.1 8.2 7.6 9.5 0.8 0.9 5.4 8.5Other 4.3 6.9 1.6 8.1 8.3 3.8 4.2 5.1 4.5 4.3 4.7
Total 3.7 6.0 5.0 9.8 8.2 4.7 5.5 4.0 3.6 4.6 5.7
Final domestic expenditure 2.5 3.5 2.4 4.7 4.3 3.8 4.9 4.2 3.4 2.8 2.8Stockbuilding1 0.7 0.3 -0.3 -0.2 0.5 -0.3 -0.1 -0.2 0.2 0.1 0.0Gross national expenditure 3.3 4.0 2.0 4.5 4.6 3.3 4.8 4.1 3.8 2.9 2.8
Exports of goods and services 2.8 2.3 3.1 -0.1 4.2 5.8 0.7 4.0 2.7 4.6 3.1Imports of goods and services 11.4 6.7 1.3 8.1 7.5 2.1 5.1 6.5 5.0 3.4 2.4
Expenditure on GDP 1.0 2.7 2.5 2.0 3.5 4.4 3.6 3.3 3.0 3.2 3.1
GDP (production) 1.6 2.3 2.2 2.6 3.7 3.6 3.8 2.8 3.1 3.3 3.1GDP (production, March qtr to March qtr) 1.2 3.0 1.8 3.2 3.7 4.0 3.0 2.9 3.3 3.2 2.9
Table 6.4 Composition of real GDP growth (annual average percent change, seasonally adjusted, unless specified otherwise)
1 Percentage point contribution to the growth rate of GDP.

44RESERVE BANK OF NEW ZEALAND/MONETARY POLICY STATEMENT, MAY 2018
Actuals ProjectionsMarch year 2011 2012 2013 2014 2015 2016 2017 2018 2019 2020 2021
Price measuresCPI 4.5 1.6 0.9 1.5 0.3 0.4 2.2 1.1 1.6 1.8 2.0Labour costs 2.0 2.1 1.8 1.7 1.8 1.8 1.5 1.9 2.0 2.3 2.4Export prices (in New Zealand dollars) 7.9 -2.7 -4.9 11.5 -9.1 -0.2 4.2 3.4 1.1 1.0 1.7Import prices (in New Zealand dollars) 3.4 -1.7 -3.9 -3.0 -3.4 1.1 0.6 1.4 1.7 0.6 0.8
Monetary conditionsOCR (year average) 2.8 2.5 2.5 2.5 3.4 2.9 2.0 1.8 1.8 1.9 2.2TWI (year average) 69.0 72.2 74.0 77.6 79.3 72.6 76.5 75.6 74.1 73.9 73.5
OutputGDP (production, annual average % change) 1.6 2.3 2.2 2.6 3.7 3.6 3.8 2.8 3.1 3.3 3.1Potential output (annual average % change) 1.4 1.7 2.0 2.4 2.9 3.0 3.2 3.2 3.0 2.9 2.9Output gap (% of potential GDP, year average) -2.1 -1.5 -1.3 -1.2 -0.4 0.2 0.7 0.3 0.4 0.7 0.9
Labour marketTotal employment (seasonally adjusted) 1.6 0.6 0.2 3.7 3.2 2.0 5.7 3.1 1.9 1.7 1.5Unemployment rate (March qtr, seasonally adjusted) 6.0 6.3 5.7 5.5 5.4 5.2 4.9 4.4 4.3 4.2 4.2Trend labour productivity 1.1 1.0 0.8 0.5 0.2 0.0 -0.1 0.1 0.5 0.9 1.2
Key balancesGovernment operating balance (% of GDP, year to June) -8.9 -4.3 -2.0 -1.2 0.2 0.7 1.5 1.1 1.0 1.6 2.0Current account balance (% of GDP) -2.8 -3.2 -3.7 -2.6 -3.6 -2.7 -2.7 -2.7 -3.5 -3.0 -2.7Terms of trade (SNA measure, annual average % change) 7.9 1.6 -4.3 11.7 -0.3 -3.0 2.7 4.4 -1.8 0.1 0.6Household saving rate (% of disposable income) 2.1 2.4 0.5 0.1 -1.5 -1.3 -2.8 -2.8 -1.9 -1.4 -0.7
World economyTrading-partner GDP (annual average % change) 4.4 3.4 3.3 3.5 3.7 3.4 3.3 3.8 3.7 3.6 3.2Trading-partner CPI (TWI weighted) 3.2 2.7 2.3 2.3 1.0 1.2 1.9 1.8 2.2 2.2 2.3
Table 6.5 Summary of economic projections (annual percent change, unless specified otherwise)