may 2017 - juvlon...
TRANSCRIPT

May 2017

2
Equity Market Outlook
O v e r v i e wThe MarketTechnicals (Data Source : Bloomberg)
Apr-17 Mar-17Investments by Institutions in the cash segment (Rs. Cr)
Avg Advance Decline Ratio
Valuation Ratios
Apr-17 Mar-17
Apr-17 10 Year Average
Apr-17Indices Movement Last 1 Yr
None of the aforesaid recommendations are based on any assumptions. These are purely for reference and the investors are requested to consult their financial advisors before investing.
Global economy
According to the International Monetary Fund (IMF), the global economy is finally witnessing some momentum after six years of disappointing growth. The economic think-tank raised the global economic growth outlook to 3.5% this year from January's forecast of 3.4% on the back of rebound in investment, trade and manufacturing. However, it said structural impediments such as low productivity growth and high income inequality will likely persist and could stall a stronger recovery.
The IMF maintained US economic growth outlook at 2.3% for 2017. Growth rates for 2017 and 2018 are higher than 1.6% forecast for 2016 owing to planned fiscal stimulus and an uptick in confidence under Donald Trump's presidential leadership. President Trump proposed cutting the US corporate tax rate from 35% to 15% to boost job growth in the world's largest economy and massive reforms in the country's tax code.
The European Central Bank (ECB) kept interest rates and stimulus program unchanged in the latest policy meeting even though it accepted that the region's economy is improving. The IMF raised economic growth outlook for 2017 to 1.7% from the earlier projection of 1.6% because of mildly expansionary fiscal stance, accommodative financial conditions, a weak euro and beneficial spillovers from a likely US fiscal stimulus. However, the IMF warned the outlook was clouded by Brexit and election uncertainties.
The UK economy's better-than-expected performance since the Brexit vote in June 2016 referendum prompted the IMF to raise the country's growth forecast for the second time in three months. It now expects the economy to grow 2% in 2017 against January's forecast of 1.5% and October 2016's forecast of 1.1%.
In Asia, the Asian Development Bank (ADB) said a number of countries still face many challenges and need to take measures to become resilient to external vulnerability and shocks. The IMF upgraded Japan's economic growth outlook to 1.2% in 2017 and 0.6 % in 2018 from a January projection of 0.8% and 0.5%, respectively, though it warned that a shrinking labour force and below-forecast inflation would curb longer-term growth. The Bank of Japan (BoJ), in its latest policy meeting, kept monetary policy steady and raised its real GDP forecast for fiscal 2017-18 to 1.6% from 1.5%.
Source: CRISIL Research
Fundamentals and economics:
Growth
India's gross domestic product (GDP) grew at 7.0% in the October-December 2016 compared to revised growth of 7.4% in the July-September quarter. During the December 2016 quarter, manufacturing sector grew by 8.3% year on year against 6.9% in the preceding quarter. Similarly, agriculture rose by 6% against 3.8%.
According to the second advance estimates released by the Central Statistics Office, India's GDP growth rate for 2016-17 is estimated at 7.1% compared with 7.9% growth in 2015-16. Agriculture, forestry and fishing sectors are expected to expand 4.4% in 2016-17 from 0.8%. On the other hand, growth in mining and quarrying is likely to slow to 1.3% after recording a growth of 12.3% in 2015-16. Growth in manufacturing is expected to slow to 7.7% (from 10.6%) while construction activities is likely to grow by 3.1% (from 2.8%).
After expanding 3.3% (upward revision) in January 2017, the Index of Industrial Production (IIP) contracted 1.2% in February 2017. Cumulatively, therefore, IIP grew a meagre 0.4% during April-February in fiscal 2017 compared with 2.6% in the same period last fiscal. Decline in IIP was on account of a fall in the manufacturing sector and poor growth in the electricity sector. These sectors de-grew 2% and 0.3%, respectively. Fifteen out of 22 manufacturing industries grew over the year. The mining sector displayed healthy growth of 3.3%, suggesting increased production activity on account of firming up of commodity prices.
BSE 1.20 1.14
NSE 1.23 1.04
FIIs (Net Purchases / Sales) -2209 34366
MFs (Net Purchases / Sales)* 9918 4196
MF Data till Apr 27
P/E ratio- Sensex 22.63 18.50
P/E ratio- Nifty 23.37 18.19
Price/Book Value Ratio-Sensex 2.95 3.06
Price/Book Value Ratio-Nifty 3.52 2.94
Dividend Yield-Sensex 1.37 1.39
Dividend Yield-Nifty 1.25 1.36
S&P BSE Sensex 1.01% 16.84%
Nifty 50 1.42% 18.53%
S&P BSE Auto 3.50% 23.35%
S&P BSE Bankex 3.70% 32.49%
S&P BSE Capital Goods 8.63% 35.32%
S&P BSE Consumer Durables 1.42% 31.28%
S&P BSE Fast Moving Consumer Goods 1.53% 22.28%
S&P BSE Healthcare -1.91% -3.61%
S&P BSE Information Technology -7.20% -15.10%
S&P BSE Metal -4.24% 42.02%
S&P BSE MidCap 4.98% 34.01%
S&P BSE Oil & Gas 6.57% 54.50%
S&P BSE PSU 4.92% 43.90%
S&P BSE Realty 20.25% 41.81%
S&P BSE SmallCap 6.50% 39.49%
S&P BSE Teck Index -5.57% -10.97%

3
O v e r v i e wThe MarketEquity Market Outlook
None of the aforesaid recommendations are based on any assumptions. These are purely for reference and the investors are requested to consult their financial advisors before investing.
and trade and credit advances. Loans recorded net inflows of $20.4 billion in the third quarter of fiscal 2017, as against an outflow of $0.8 billion a year ago. Net inflows into financial derivatives rose to $3.1 billion from $0.3 billion. Trade and credit advances increased to $3 billion from -$1.8 billion, while reserve assets increased to $1.2 billion from -$4.1 billion.
However, portfolio investment saw record-high capital outflows to the tune of $11.3 billion, as against net inflows of $0.6 billion last year. Foreign portfolio investors withdrew capital from debt as well as equity markets, owing to the sudden shock given to the economy by the demonetisation exercise, and rising US government bond yields. There was greater outflow from debt market ($6.8 billion) than equity (-$4.5 billion), because of declining yield spread. There were also net outflows of $18.5 billion from non-resident deposits, compared with inflows of $1.6 billion a year ago, owing to redemption of foreign currency non-resident (FCNR (B)) deposits. Foreign direct investment declined marginally to $9.8 billion from $10.7 billion.
Source: CCER
Currency
The rupee ended higher against the US dollar in April, with the exchange rate settling at Rs 64.25 on April 28 as against Rs 64.85 per dollar on March 31. The local unit benefitted from intermittent dollar sales by exporters and foreign banks. Intra-month, US President Donald Trump's remarks about the dollar being too strong triggered greenback sales and aided the rupee. Taking cues from other international events, the rupee also strengthened after centrist candidate Emmanuel Macron garnered the most votes in the first round of the presidential elections in France. The IMD's monsoon forecast for the year also bolstered the Indian currency. Sporadic risk aversion owing to uncertainty over US policy on Syria and North Korea coupled with UK Prime Minister Theresa May's move to hold early general elections this year erased some rupee gains. Dollar gains on expectations that President Trump would announce tax reforms for economic growth and job creation weighed on the rupee further.
Source: CRISIL Research
Market sentiment
Flows
Foreign institutional investors (FIIs) turned sellers of equities in April 2017 after robust buying last month. They sold equities worth Rs 10.95 billion in April (until April 27, 2017) compared to buying of Rs 344 billion in March 2017. Mutual funds remained buyers of equities in March 2017. They bought equities worth Rs 89.16 billion in April (until April 25, 2017) compared to buying of Rs 41.96 billion in March 2017.
-2.00-1.000.001.002.003.004.005.006.007.00
CPI WPI
Deficit
India's fiscal deficit in the April-February 2017 period stood at Rs 6.06 trillion or 113.4% of the budgeted target for 2016-17. The fiscal deficit was 107.1% of the full-year target during the same period a year ago.
India's current account deficit (CAD) widened modestly to $7.9 billion (1.4% of GDP) in the third quarter of fiscal 2017 from $7.1 billion (1.4% of GDP) on-year. It was, however, a significant jump from $3.4 billion (0.6% of GDP) in the second quarter. The increase in CAD was owing to a fall in services trade surplus, and net income receipts from abroad. Imports growing faster than exports in information technology (IT), IT enabled services (ITeS) and financial services skewed the services trade balance. However, lower goods trade deficit contained the rise in deficit.
In fiscal 2017 so far (April-December 2016), CAD has averaged 0.7% of GDP. CCER expect this to nudge up in the last quarter, as figures for the first two months of the quarter tell us goods exports grew an average 10.9% on-year, while imports grew 16.2%. Services trade surplus declined further to $5.2 billion in January 2017, from $5.7 billion on-year. CCER expect CAD to average 0.9% of GDP in fiscal 2017, but still end lower than 1.1% of GDP in fiscal 2016.
Capital flows (comprising capital account and financial account balance) increased 7.8% on-year to $7.4 billion in the third quarter. Capital flows had declined by 53% to $4.3 billion in the previous quarter. The growth in capital flows was driven by loans, financial derivatives, reserve assets,
Source: Mospi.nic.in, CCER
Inflation
India's Consumer Price Index (CPI)-based inflation rose 16 basis points (bps) to 3.81% in March 2017 from 3.65% in the previous month. The rise was attributed to higher inflation in fuel, housing and clothing, and footwear. Fuel inflation jumped in March 2017 led by rising global oil prices. Average global crude oil prices were 40% higher on-year in the month, and about 3% higher in fiscal 2017, pushing up the imported component of inflation. That was reflected in fuel inflation (petrol, diesel, fuel and light), which rose to 8.4% in March from 6.5% in February.
Wholesale price inflation (WPI) eased to 5.70% in March 2017 from 6.55% in February 2017. Prices of cereals, pulses, milk, eggs, meat & fish and condiment & spices declined in the month. However, the food inflation rose to 3.12% in March 2017 from 2.69% in February 2017 owing to the sharp jump in the vegetable prices. Fuel and power inflation fell 290 basis points to 18.16% while core (non-food, non-fuel) inflation fell 60 bps to 3.1%.
Source: Mospi.nic.in, CRISIL Centre for Economic Research (CCER)
Inflation
Source: SEBI
2.0
0.3
-1.3
1.22.1
-2.4
-0.7
0.7
-1.8
5.7
-0.1
3.3
-1.2-3.00
-2.00
-1.00
0.00
1.00
2.00
3.00
4.00
5.00
6.00
7.00
Index of Industrial Production (IIP)
-30,000
-20,000
-10,000
-
10,000
20,000
30,000
40,000
Cr.
FII Flows
-2000
0
2000
4000
6000
8000
10000
12000
14000
16000MF Flows
Cr.

4
O v e r v i e wThe Market
None of the aforesaid recommendations are based on any assumptions. These are purely for reference and the investors are requested to consult their financial advisors before investing.
Our Recommendations
Investors may continue with their SIPs in pure equity funds. Volatility due to global factors may continue to stay in the near term. Investors with an intent to benefit from volatility are recommended for lump-sum investments in dynamic asset allocation funds. For tactical allocation, investors could consider thematic funds which focus on infrastructure theme.
ICICI Prudential Value Discovery FundICICI Prudential Top 100 FundICICI Prudential Multicap FundICICI Prudential Focused Bluechip Equity FundICICI Prudential Select Large Cap Fund
Pure Equity Funds
These funds are positioned aggressively to gain from recovery in the economy and commodity prices. These funds aim to generate long term wealth creation.
Our Recommendations – Equity Schemes
Asset Allocation Funds
ICICI Prudential Balanced Advantage Fund
ICICI Prudential Balanced Fund
ICICI Prudential Dynamic Plan
Theme-based funds
ICICI Prudential Infrastructure Fund Investors should invest in this thematic fund for tactical allocation. It would be a high risk investment option.
These funds aim to benefit from volatility and can be suitable for investors aiming to participate in equities with lower volatility.
Equity market valuations as displayed by composite index show that the market valuations are in the zone where investors are recommended to invest in equities systematically. We believe investors looking to benefit from volatility could consider dynamic asset allocation funds. Meanwhile, investors with aggressive risk appetite may consider investing lump-sum in pure equity funds.
Equity Valuation Index
Equity valuation index is calculated by assigning equal weights to Price to equity (PE), Price to book (PB), G-Sec*PE and Market Cap to Gross Domestic Product (GDP).
Equity Valuation Index
Market Outlook and Triggers
Macroeconomic factors remain stable and fiscal consolidation continues to be in positive territory. Meanwhile, an improving external environment, stronger consumption and robust public capital expenditure augur well for earnings. As consumption increases we believe that the capacity utilisation can also rise, and corporates would report increase in earnings without additional capital expenditure. The resultant operating leverage could lead to higher earnings.
With the government taking legislative steps to implement GST (Goods and Services Tax) within the second half of the calendar year 2017, there is likelihood that macro numbers could improve further. The implementation of GST could benefit organised businesses. As tax compliance increases, more businesses could shift from unorganised to organised segments of the economy. We believe that the valuations are fair. However, as earnings increase, Price-to-Earnings (PE) can re-rate
Market Performance
Indian equity indices continued to trend up for the fourth consecutive month. S&P BSE Sensex raced above the 30,000-mark for the first time and Nifty 50 touched a record high intermittently. Subsequently, S&P BSE Sensex and Nifty 50 slipped to close the month at 29,918 and 9,304 points, rising 1.01% and 1.42%, respectively. Rally in global equities with few positive domestic cues supported the bullish sentiment.
The market was mainly boosted by buying in the index heavyweight and strengthening of the rupee against the dollar. Better-than-expected corporate earnings from few index major augured well for the indices. Robust buying by domestic institutional investors (DIIs) also brought in gains.
Most S&P BSE Sectoral indices ended higher in April 2017. S&P BSE Realty surged 20.25% after the RBI allowed banks to invest in real estate investment trusts and infrastructure investment trusts. Capital goods put up an impressive performance thanks to stock-specific developments and after data showed domestic manufacturing Purchasing Manufacturing Index (PMI) rose to a five-month high in March 2017. S&P BSE Capital Goods rose around 9%. Oil and gas shares gained momentum amid reports that state-owned oil retailers might review their product prices daily supported the market further. S&P BSE Oil & Gas rose 6.57%. S&P BSE IT was the top sectoral loser, down 7.20%.
Source: NSE, BSE
towards the higher-end. Hence, PE may expand more than its long-term average.
We believe investors should continue to remain over-weight in equities, as reasonable growth is expected from equity markets over the next two-to-three years. The returns in equities could be front-ended i.e. returns can come before earnings growth is reported. Investors could consider investing in large-cap and multicap funds for generating long-term wealth. However, as the uncertainty of global events cannot be ruled out, we believe that the equity market may continue to be volatile in the short term. Hence, investors who aim to benefit from volatility can be overweight in equity by investing lump-sum in dynamic asset allocation funds. ICICI Prudential Infrastructure Fund could be a favourable choice for investors with high risk appetite who may benefit from government's focus on infrastructure building in India.
106.4
40
60
80
100
120
140
160
Book Profits / Stay Invested
Invest Systematically
Invest in Equities
Aggressively Invest in Equities

Note: None of the aforesaid recommendations are based on any assumptions. These are purely for reference and the investors are requested to consult their financial advisors
before investing.
O v e r v i e wThe MarketFixed Income Market Outlook
Average Liquidity Support by RBI
Rs -4.18 trillion Includes: LAF, MSF, SLF & Term Repo
Bank Credit Growth
5.5%
Bank Deposit Growth
11.6%
Money Market
Tenure
Change in basis points (bps)
CD
1M
Change CP Change
3M
6M
12M
Bond Market Change in basis points
Tenure G-Sec ChangeAAA
CBChange
1Y
3Y
5Y
10Y
Macro Economy Data Release
IndicatorLatest
Update
Previous
Update
IIP
GDP
USD/INR
WPI
CPI
Month Overview (as on April 28, 2017)
6.50
6.80
7.16
7.30
0
30
3
-5
6.48
6.78
7.02
6.96
24
21
20
27
7.09
7.31
7.47
7.73
29
8
7
13
-1.2% (Feb)
7.0% (3QFY17)
64.25 (Apr)
5.70% (Mar)
3.81% (Mar)
3.3% (Jan)
7.4% (2QFY17)
64.85 (Mar)
6.55% (Feb)
3.65% (Feb)
5
22
19
11
6.15
6.32
6.49
6.60
INDICATORS
Credit Markets
Credit Spreads
Credit Spreads as on April 30, 2017
Tenure 6M 1Y 2Y 3Y 5Y 7Y 10Y 15Y
AAA 0.44% 0.75% 0.64% 0.56% 0.32% 0.62% 0.65% 0.09%
AA+ 0.66% 1.01% 0.86% 0.86% 0.68% 0.95% 0.99% 0.44%
AA 0.91% 1.26% 1.11% 1.13% 0.97% 1.24% 1.47% 0.81%
AA- 1.05% 1.41% 1.36% 1.45% 1.30% 1.60% 1.87% 1.30%
A+ 1.31% 1.65% 1.57% 1.74% 1.59% 1.84% 2.21% 1.64%
A 1.48% 1.82% 1.89% 2.06% 1.93% 2.19% 2.46% 1.89%
A- 1.80% 2.14% 2.28% 2.73% 2.53% 2.86% 3.06% 2.55%
LAF – Liquidity Adjustment Facility, MSF – Marginal Standing Facility, SLF – Standing Liquidity Facility, CP - Commercial Paper, CD – Certificate of Deposit, CB – Corporate Bond, IIP – India Industrial Production, CPI – Consumer Price Index, WPI – Wholesale Price Index, CAD – Current Account Deficit, GDP – Gross Domestic Product
Source: CRISIL
Data Source – RBI, Mospi.Nic.in, CRISIL Fixed Income Database
Credit Ratio
CRISIL's rating actions during fiscal 2017 underscore credit quality of India Inc is gradually recovering. CRISIL's credit ratio for fiscal 2017 was 1.22 times, similar to the 1.29 times seen for fiscal 2016. The improvement was driven by firm commodity prices, stable macros, improving capital structure and lower interest costs. Going forward, CRISIL expect gradual improvement in credit quality to sustain. In all, there were 1,335 upgrades and 1,092 downgrades, during the year. Like last fiscal, upgrades were driven by consumption-linked sectors, while downgrades were led by investment-linked sectors. The impact of demonetisation on credit quality is expected to be transient.
Source: CRISIL
Bank Credit / Deposit Growth
Bank credit growth rose to 5.5% year-on-year in the fortnight ended April 14, 2017 compared with 4.4% on-year in the fortnight ended March 17, 2017. Non-food bank credit rose to Rs 75.83 trillion as on April 14, 2017 compared with outstanding credit of Rs 75.09 trillion as on March 17, 2017. Time deposit growth fell to 10.6% on-year in the fortnight ended April 14, 2017 against 11.2% on-year in the fortnight ended March 17, 2017. Demand deposits witnessed 21.1% on-year growth in the fortnight ended April 14, 2017 compared with 30.6% on-year growth in the fortnight ended March 17, 2017. India's M3 money supply rose 7.1% on-year in the fortnight ended April 14, 2017 compared with 10.4% a year ago. Reserve money fell 12.0% on-year in the week ended April 21, 2017 compared with growth of 14.3% a year ago.
Source: RBI
Our Outlook
A credit ratio in FY17 has printed at a healthy 1.22 times. This improvement goes on to show that the credit cycle has bottomed out. With the commodity prices being stable, commodity-led businesses and financial companies that were heavily invested in these sectors will witness further improvement. As capacity utilisation is low, we do not expect further investment in capital expenditure, thus, these companies are expected to repay their loans and reduce debt, thereby improving the balance sheet. Credit profile of many corporates has been improving and we have witnessed upgrades in our portfolios of companies engaged in various sectors. Therefore, it reflects that economic recovery cycle is well underway, and that the credit market is gradually improving.
Inflation
India's Consumer Price Index (CPI)-based inflation rose 16 basis points (bps) to 3.81% in March 2017 from 3.65% in the previous month. The rise was attributed to higher inflation in fuel, housing and clothing, and footwear. Fuel inflation jumped in March 2017 led by rising global oil prices. Average global crude oil prices were 40% higher year-on-year in the month, and about 3% higher in fiscal 2017, pushing up the imported component of inflation. That was reflected in fuel inflation (petrol, diesel, fuel and light), which rose to 8.4% in March from 6.5% in February. Food inflation was unchanged from the previous month, at 2%, as inflation in fruits, vegetables, eggs and meat rose; while that in pulses, cereals and sugar, inflation slipped. However, food inflation dropped to 4.2% in fiscal 2017 from 4.9% in fiscal 2016.
Wholesale price inflation (WPI) eased to 5.70% in March 2017 from 6.55% in February 2017. Food inflation rose to 3.12% in March 2017 from 2.69% in February 2017 owing to the sharp jump in the vegetable prices. Fuel and power inflation fell 290 basis points to 18.16% while core (non-food, non-fuel) inflation fell 60 bps to 3.1%.
Source: Mospi.Nic.in, CRISIL Centre for Economic Research (CCER)
Currency in circulation dropped 17.8% on-year in the week ended April 21, 2017 against 15.5% growth a year ago. Average liquidity was in surplus at 4.18 trillion vis-a-vis the surplus of Rs. 4.54 trillion in February 2017.
Source: RBI, CRISIL Fixed Income Database
Money Markets
INDICATORS
Liquidity
Our Outlook
Interbank call money rates remained below the repo rate of 6.25% in the month owing to comfortable liquidity in the system. As demand for funds remained low owing to ample surplus cash balance, the central bank regularly held reverse repo auctions during the month. Meanwhile, the RBI's Monetary Policy Committee (MPC), during its review meeting on Thursday, April 6, narrowed the policy rate corridor from 50 basis points (bps) to 25 bps, bringing the reverse repo rate to 6% and the marginal standing facility (MSF) rate to 6.5%. This will now help mop up
Spread Market Data in basis points
Tenure AAA AA A
1Y
3Y
5Y
10Y
0.75%
0.56%
0.32%
0.65%
1.26%
1.13%
0.97%
1.47%
1.82%
2.06%
1.93%
2.46%
5
O v e r v i e wThe MarketFixed Income Market Outlook
Note: None of the aforesaid recommendations are based on any assumptions. These are purely for reference and the investors are requested to consult their financial advisors before investing. 6
Physical assets
Indian gold prices (up 1%) ended higher in April to close at Rs 28,880 per 10 grams on April 28 vis-à-vis Rs 28,590 per 10 grams on March 31 on the National Commodity and Derivatives Exchange (NCDEX), following upbeat global trend amid improved buying by local jewelers.
Source: NCDEX
Government Borrowing
In the Union Budget 2017-18, the government pegged the net market borrowing at Rs 3.48 trillion after taking into account the buyback of Rs 750 billion in FY18 compared to Rs 4.07 trillion (after cancelling Rs 180 billion of auctions in January 2017) in FY17. The gross market borrowing has been set
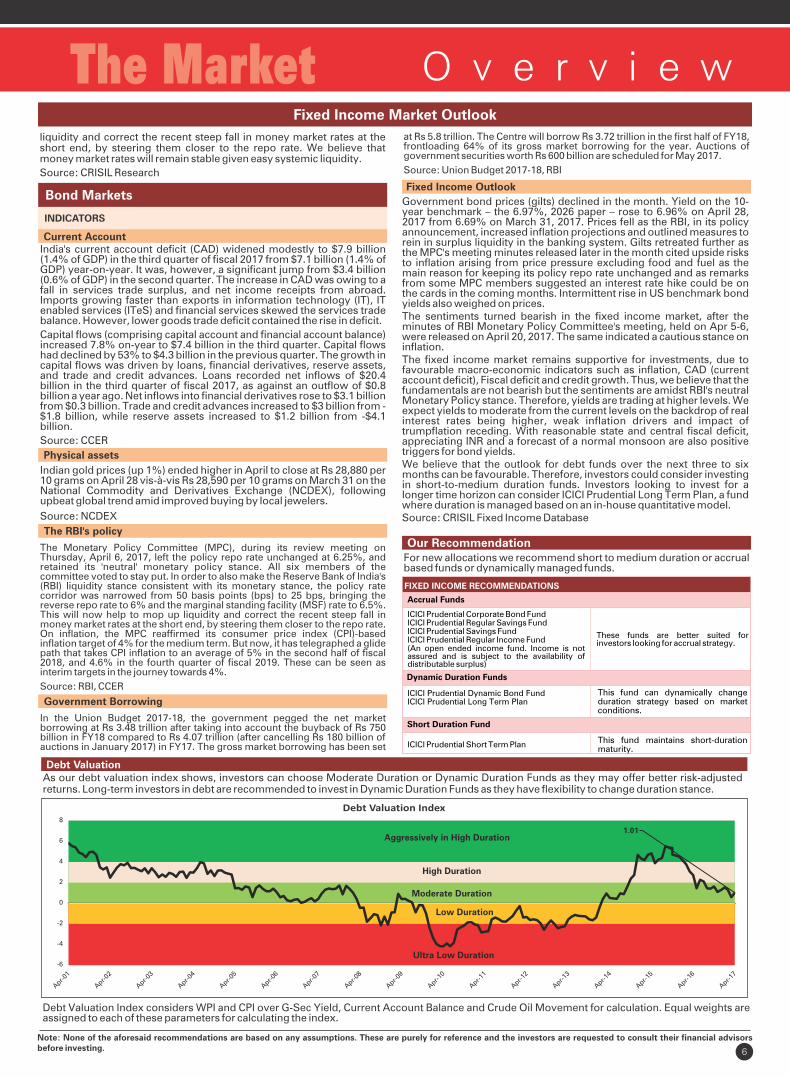
Debt ValuationAs our debt valuation index shows, investors can choose Moderate Duration or Dynamic Duration Funds as they may offer better risk-adjusted returns. Long-term investors in debt are recommended to invest in Dynamic Duration Funds as they have flexibility to change duration stance.
The RBI's policy
The Monetary Policy Committee (MPC), during its review meeting on Thursday, April 6, 2017, left the policy repo rate unchanged at 6.25%, and retained its 'neutral' monetary policy stance. All six members of the committee voted to stay put. In order to also make the Reserve Bank of India's (RBI) liquidity stance consistent with its monetary stance, the policy rate corridor was narrowed from 50 basis points (bps) to 25 bps, bringing the reverse repo rate to 6% and the marginal standing facility (MSF) rate to 6.5%. This will now help to mop up liquidity and correct the recent steep fall in money market rates at the short end, by steering them closer to the repo rate. On inflation, the MPC reaffirmed its consumer price index (CPI)-based inflation target of 4% for the medium term. But now, it has telegraphed a glide path that takes CPI inflation to an average of 5% in the second half of fiscal 2018, and 4.6% in the fourth quarter of fiscal 2019. These can be seen as interim targets in the journey towards 4%.
Source: RBI, CCER
at Rs 5.8 trillion. The Centre will borrow Rs 3.72 trillion in the first half of FY18, frontloading 64% of its gross market borrowing for the year. Auctions of government securities worth Rs 600 billion are scheduled for May 2017.
Source: Union Budget 2017-18, RBI
INDICATORS
Bond Markets
Current Account India's current account deficit (CAD) widened modestly to $7.9 billion (1.4% of GDP) in the third quarter of fiscal 2017 from $7.1 billion (1.4% of GDP) year-on-year. It was, however, a significant jump from $3.4 billion (0.6% of GDP) in the second quarter. The increase in CAD was owing to a fall in services trade surplus, and net income receipts from abroad. Imports growing faster than exports in information technology (IT), IT enabled services (ITeS) and financial services skewed the services trade balance. However, lower goods trade deficit contained the rise in deficit.
Capital flows (comprising capital account and financial account balance) increased 7.8% on-year to $7.4 billion in the third quarter. Capital flows had declined by 53% to $4.3 billion in the previous quarter. The growth in capital flows was driven by loans, financial derivatives, reserve assets, and trade and credit advances. Loans recorded net inflows of $20.4 billion in the third quarter of fiscal 2017, as against an outflow of $0.8 billion a year ago. Net inflows into financial derivatives rose to $3.1 billion from $0.3 billion. Trade and credit advances increased to $3 billion from -$1.8 billion, while reserve assets increased to $1.2 billion from -$4.1 billion.
Source: CCER
Debt Valuation Index considers WPI and CPI over G-Sec Yield, Current Account Balance and Crude Oil Movement for calculation. Equal weights are assigned to each of these parameters for calculating the index.
Debt Valuation Index
liquidity and correct the recent steep fall in money market rates at the short end, by steering them closer to the repo rate. We believe that money market rates will remain stable given easy systemic liquidity.
Source: CRISIL Research
Fixed Income Outlook
Government bond prices (gilts) declined in the month. Yield on the 10-year benchmark – the 6.97%, 2026 paper – rose to 6.96% on April 28, 2017 from 6.69% on March 31, 2017. Prices fell as the RBI, in its policy announcement, increased inflation projections and outlined measures to rein in surplus liquidity in the banking system. Gilts retreated further as the MPC's meeting minutes released later in the month cited upside risks to inflation arising from price pressure excluding food and fuel as the main reason for keeping its policy repo rate unchanged and as remarks from some MPC members suggested an interest rate hike could be on the cards in the coming months. Intermittent rise in US benchmark bond yields also weighed on prices. The sentiments turned bearish in the fixed income market, after the minutes of RBI Monetary Policy Committee's meeting, held on Apr 5-6, were released on April 20, 2017. The same indicated a cautious stance on inflation. The fixed income market remains supportive for investments, due to favourable macro-economic indicators such as inflation, CAD (current account deficit), Fiscal deficit and credit growth. Thus, we believe that the fundamentals are not bearish but the sentiments are amidst RBI's neutral Monetary Policy stance. Therefore, yields are trading at higher levels. We expect yields to moderate from the current levels on the backdrop of real interest rates being higher, weak inflation drivers and impact of trumpflation receding. With reasonable state and central fiscal deficit, appreciating INR and a forecast of a normal monsoon are also positive triggers for bond yields.We believe that the outlook for debt funds over the next three to six months can be favourable. Therefore, investors could consider investing in short-to-medium duration funds. Investors looking to invest for a longer time horizon can consider ICICI Prudential Long Term Plan, a fund where duration is managed based on an in-house quantitative model.Source: CRISIL Fixed Income Database
Accrual Funds
This fund can dynamically change duration strategy based on market conditions.
These funds are better suited for investors looking for accrual strategy.
Dynamic Duration Funds
FIXED INCOME RECOMMENDATIONS
Our RecommendationFor new allocations we recommend short to medium duration or accrual based funds or dynamically managed funds.
ICICI Prudential Corporate Bond FundICICI Prudential Regular Savings FundICICI Prudential Savings FundICICI Prudential Regular Income Fund(An open ended income fund. Income is not assured and is subject to the availability of distributable surplus)
ICICI Prudential Dynamic Bond FundICICI Prudential Long Term Plan
Short Duration Fund
ICICI Prudential Short Term PlanThis fund maintains short-duration maturity.
1.01
-6
-4
-2
0
2
4
6
8
Aggressively in High Duration
High Duration
Moderate Duration
Low Duration
Ultra Low Duration

7
Fund Name Brief Description Page No.
Index
Large Cap
ICICI Prudential Focused Bluechip Equity Fund IPFBEF Diversified Largecap Equity fund focussed on Top 200 stocks by Market capitalisation 9
ICICI Prudential Select Large Cap Fund IPSLCF Concentrated Large Cap Fund 10
Large & Mid-cap
A large and mid cap equity Fund with high variation in sector allocation ICICI Prudential Top 100 Fund IPT100F compared to benchmark 11
Multi-cap
ICICI Prudential Dynamic Plan IPDP Conservative multi-cap Fund investing in equity and debt. 12
ICICI Prudential Multicap Fund IPMULTIF Diversified equity fund investing in a mix of large, mid and small cap stocks 13
Value Style
ICICI Prudential Dividend Yield Equity Fund IPDYEF Equity Fund which invests in high dividend yield stocks 14
ICICI Prudential Value Discovery Fund IPVDF Diversified Value Style Investing with flexicap approach 15
Mid Cap
ICICI Prudential Midcap Fund IPMIDF Diversified Mid-Cap Oriented Fund 16
Thematic/Sectoral
ICICI Prudential Infrastructure Fund IPIF Thematic Fund encompassing Infrastructure 17
ICICI Prudential Technology Fund IPTF Technology Sector Oriented Fund 18
ICICI Prudential FMCG Fund IPFF FMCG Sector Oriented Fund 19
ICICI Prudential Banking & Financial Services Fund IPBFSF Banking & Financial Services Sector Oriented Fund 20
ICICI Prudential Exports and Other Services Fund IPEOSF Exports and Services Industry Oriented Thematic Fund 21
Tax Planning
ICICI Prudential Long Term Equity Fund (Tax Saving) IPLTEF(TS) Open Ended Equity Scheme with Tax Saving advantage 22
International
Open ended Fund of Funds Scheme investing in overseas mutual fund schemes ICICI Prudential Global Stable Equity Fund IPGSEF 23 which invest in stable companies globally
ICICI Prudential US Bluechip Equity Fund IPUSBEF International Equity Scheme investing in Companies listed on the US Stock Markets 24
ICICI Prudential Indo Asia Equity Fund IPIAEF Blend of Indian & Asian Equities (through an International Fund) Fund 25
Arbitrage
ICICI Prudential Equity - Arbitrage Fund IPEAF Equity Arbitrage Fund 26-27
Close Ended Equity Funds
ICICI Prudential Growth Fund - Series 1 IPGF1 Close ended equity scheme 28
ICICI Prudential Growth Fund - Series 2 IPGF2 Close ended equity scheme 29
ICICI Prudential Growth Fund - Series 3 IPGF3 Close ended equity scheme 30
ICICI Prudential Growth Fund - Series 4 IPGF4 Close ended equity scheme 31
ICICI Prudential Growth Fund - Series 5 IPGF5 Close ended equity scheme 32
ICICI Prudential Growth Fund - Series 6 IPGF6 Close ended equity scheme 33
ICICI Prudential Growth Fund - Series 7 IPGF7 Close ended equity scheme 34
ICICI Prudential Growth Fund - Series 8 IPGF8 Close ended equity scheme 35
ICICI Prudential Value Fund - Series 1 IPVF1 Close ended equity scheme 36
ICICI Prudential Value Fund - Series 2 IPVF2 Close ended equity scheme 37
ICICI Prudential Value Fund - Series 3 IPVF3 Close ended equity scheme 38
ICICI Prudential Value Fund - Series 4 IPVF4 Close ended equity scheme 39
ICICI Prudential Value Fund - Series 5 IPVF5 Close ended equity scheme 40
ICICI Prudential Value Fund - Series 6 IPVF6 Close ended equity scheme 41
ICICI Prudential Value Fund - Series 7 IPVF7 Close ended equity scheme 42
ICICI Prudential Value Fund - Series 8 IPVF8 Close ended equity scheme 43
ICICI Prudential Value Fund - Series 9 IPVF9 Close ended equity scheme 44
ICICI Prudential Value Fund - Series 10 IPVF10 Close ended equity scheme 45
ICICI Prudential Value Fund - Series 11 IPVF11 Close ended equity scheme 46
ICICI Prudential Value Fund - Series 12 IPVF12 Close ended equity scheme 47
ICICI Prudential India Recovery Fund – Series 1 IPIRF1 Close ended equity scheme 48
ICICI Prudential India Recovery Fund – Series 2 IPIRF2 Close ended equity scheme 49
ICICI Prudential India Recovery Fund - Series 3 IPIRF3 Close ended equity scheme 50
ICICI Prudential India Recovery Fund - Series 4 IPIRF4 Close ended equity scheme 51
ICICI Prudential India Recovery Fund - Series 5 IPIRF5 Close ended equity scheme 52
ICICI Prudential India Recovery Fund - Series 7 IPIRF7 Close ended equity scheme 53
ICICI Prudential Business Cycle Fund - Series 1 IPBCF1 Close ended equity scheme 54
ICICI Prudential Business Cycle Fund - Series 2 IPBCF2 Close ended equity scheme 55
ICICI Prudential Business Cycle Fund - Series 3 IPBCF3 Close ended equity scheme 56
ICICI Prudential R.I.G.H.T (Rewards of investing & generation ofIPRIGHT Closed Ended ELSS 57
healthy tax savings) Fund
Balanced
ICICI Prudential Balanced Fund IPBF A balanced Fund with allocation to equity (ranging from 65-80%) and Debt. 58
ICICI Prudential Child Care Plan (Gift Plan) IPCCP(GP) Diversified Long Term Child Benefit Oriented Plan 59
Equity Oriented Dynamic Asset Allocation
ICICI Prudential Balanced Advantage Fund IPBAF Asset Allocation Fund with equity exposure ranging between 30-80% and has exposure to debt. 60
Asset Allocation Fund with allocation to equity (range 20% -40%), ICICI Prudential Equity Income Fund IPEIF 61 arbitrage and fixed income.
Index and ETFs
ICICI Prudential Nifty 100 iWIN ETF IPN100ETF Exchange Traded Nifty 100 ETF 62
ICICI Prudential Nifty Index Fund IPNIF Nifty Index Fund 63
ICICI Prudential Nifty iWIN ETF IPNETF Exchange Traded Nifty Fund 64
ICICI Prudential Nifty Next 50 Index Fund IPNN50IF Index Fund 65
ICICI Prudential NV20 iWIN ETF IPNV20ETF An open-ended Index Exchange Traded Fund 66
ICICI Prudential Sensex iWIN ETF IPSETF Exchange Traded Sensex Fund 67
ICICI Prudential Midcap Select iWIN ETF IPMSETF An open-ended Index Exchange Traded Fund 68
Gold Funds & ETFs
ICICI Prudential Gold iWIN ETF IPGETF Gold Exchange Traded Fund 69
ICICI Prudential Regular Gold Savings Fund IPRGSF Open Ended Fund of Funds Scheme investing in Gold iWIN ETF 70
MIP
ICICI Prudential MIP 25 (An open ended Income fund. Monthly income is IPMIP25 Hybrid Fund which generally invests 0-25% in Equity 71
not assured and is subject to the availability of distributable surplus.)
ICICI Prudential Monthly Income Plan (An open ended income fund.
Monthly income is not assured and is subject to the availability of IPMIP Hybrid Fund which generally invests 0-15% in Equity 72distributable surplus.)
Equity Funds
Abbreviations
Hybrid Funds

Debt Funds
8
Fund Name Brief Description Page No.
Hybrid Others
ICICI Prudential Child Care Plan (Study Plan) IPCCP(SP) Child Benefit Oriented Plan 74
Liquid
ICICI Prudential Money Market Fund IPMMF Open Ended Money Market Fund 75
Ultra Short Term
ICICI Prudential Savings Fund IPSF Ultra Short Term Income Fund with exposure to Floating rate instruments 76
ICICI Prudential Ultra Short Term Plan IPUSTP Ultra Short Term Income Fund with moderate duration 77
Short Term
ICICI Prudential Dynamic Bond Fund IPDBF Actively Managed Dynamic Bond Fund with 1 - 5 years Modified duration range 78
ICICI Prudential Short Term Plan IPSTP Short Term Income Fund 79
Credit Opportunities
ICICI Prudential Regular Savings Fund IPRSF Retail Debt-Accrual Fund 80
ICICI Prudential Corporate Bond Fund IPCBF Medium Term Income Fund investing in Corporate Bonds 81
Income
ICICI Prudential Income Opportunities Fund IPIOF Long Term Income Fund investing predominantly in higher maturity corporate bonds 82
ICICI Prudential Income Plan IPIP Long Term Income Fund with high duration strategy 83
ICICI Prudential Long Term Plan IPLTP Dynamic Income Fund with 1 to 10 years Modified Duration range 84
Gilt Short Term
ICICI Prudential Gilt Fund Treasury Plan PF Option IPGFTP(PF) Short Term Gilt Fund 85
ICICI Prudential Short Term Gilt Fund IPSTGF Short Term Gilt Fund 86
Gilt Long Term
ICICI Prudential Constant Maturity Gilt Fund IPCMGF Open Ended GIlt Fund with static duration strategy 87
ICICI Prudential Gilt Fund Investment Plan PF Option IPGFIP(PF) Gilt Fund with very high duration strategy 88
ICICI Prudential Long Term Gilt Fund IPLTGF Gilt Fund with high duration strategy 89
ICICI Prudential Advisor Series IPAS Fund of Funds Scheme 90
Annexure for Returns of all the Schemes 91-117
Systematic Investment Plan (SIP) Performance of Select Schemes 118-120
Annexure - I 121
Annexure - II 122
Dividend History for all Schemes 122-130
Investment Objective of all the schemes 131-134
Schedule 1: One Liner Definitions 135
Schedule 2: How To Read Factsheet 136-137
Statutory Details & Risk Factors 138
IndexAbbreviations
ICICI Prudential Regular Income Fund (An open ended income fund. IPRIF A hybrid debt Fund which generally invests 0-5% in Equity 73
Income is not assured and is subject to the availability of distributable surplus.)

Style Box
Quantitative Indicators
Fund Details
• Top Ten HoldingsDerivatives are considered at exposure value.
Fund Managers** :Manish Gunwani(Managing this fund from Jan 2012 &Overall 20 years of experience)
Indicative Investment Horizon: 5 yearsand above
Inception/Allotment date: 23-May-08
Options :Growth & Dividend(dividend payout*** and re-investment facility available)
Application Amount for freshSubscription :Rs.5,000 (plus in multiples of Re.1)
Min.Addl.Investment :Rs.500 (plus in multiples of Re.1) (w.e.f. 10-January-17)
Exit load for Redemption / Switchout :- Lumpsum & SIP / STP / SWP OptionUpto 1 Year from allotment - 1% of appli-cable NAV, more than 1 Year - Nil
##SIP :Monthly Frequency: Rs. 500/- and in multiple of Rs. 1/-Quarterly Frequency: Rs. 5,000/- and in multiple of Rs. 1/-
&&SWP :Rs. 500/- and in multiples of Rs. 1/-
STP/ Flex STP/ Value STP *:Daily Frequency: Rs. 250/- and inmultiples of Rs. 50/-Weekly, Monthly and Quarterly Frequency: Rs. 1,000/- and in multiples of Rs. 1/-
Min.Redemption Amt. :500/- or all units where amount is below 500/-
9
Std Dev (Annualised) : 14.10% Sharpe Ratio : 0.78
Average P/E : 22.41 Average P/BV : 6.56 Average Dividend Yield : 1.18
Portfolio Beta : 1.00 R squared : 0.96
Portfolio turnover has been computed as the ratio of the lower value of purchase and sales, to the average net assets in the past one year (since inception for schemes that have not completed a year). The figures are not netted for derivative transactions.Risk-free rate based on the last Overnight MIBOR cut-off of 6.18%**In addition to the fund manager managing this fund, the ADR/GDR exposure is managed by Mr. Ihab Dalwai.@@ Total Expense Ratio is weighted average for the month. Ratio excludes service tax on management fees and includes B-15 clawback reversal, if any.##
Minimum number of installments for monthly frequency will be 6 and for Quarterly frequency will be 4. w.e.f February 01, 2017.* Minimum number of installments for daily, weekly and monthly frequency will be 6 and for Quarterly frequency will be 4. w.e.f February 01, 2017. Refer page No. 137 for definition of Flex STP and Value STP.&& Minimum number of installments for both monthly and quarterly will be 2. w.e.f February 01, 2017.*** In case the unit holder has opted for dividend payout option, the minimum amount for dividend payout shall be 100 (net of dividend distribution tax and other statutory levy, if any), else the dividend would be mandatorily reinvested.
Style Box Returns of ICICI Prudential Focused Bluechip Equity Fund - Growth Option as on April 30, 2017 - (IPFBEF)
Monthly AAUM as on 30-Apr-17 : Rs. 12974.07 crores
Portfolio as on April 30, 2017
ICICI Prudential Focused Bluechip Equity FundAn Open Ended Equity Fund
Auto 7.95% 0.73%• Maruti Suzuki India Ltd. 3.75% Tata Motors Ltd. 2.20% TVS Motor Company Ltd. 0.90% TVS Motor Company Ltd. - Futures 0.73% Tata Motors Ltd. - DVR 0.87% Ashok Leyland Ltd. 0.25% Auto Ancillaries 2.84% • Motherson Sumi Systems Ltd. 2.84% Banks 26.00% 0.42%• HDFC Bank Ltd. 7.30% • ICICI Bank Ltd. 6.84% • State Bank Of India 4.29% State Bank Of India - Futures 0.27%• Axis Bank Ltd. 3.59% Axis Bank Ltd. - Futures 0.16% IndusInd Bank Ltd. 2.58% Yes Bank Ltd. 1.09% Kotak Mahindra Bank Ltd. 0.31% Cement 1.44% ACC Ltd. 1.01% Ambuja Cements Ltd. 0.43% Construction Project 2.80% • Larsen & Toubro Ltd. 2.80% Consumer Non Durables 9.31% 0.46%• ITC Ltd. 4.22% Hindustan Unilever Ltd. 2.19% Hindustan Unilever Ltd. - Futures 0.46% Britannia Industries Ltd. 1.70% Dabur India Ltd. 1.08% Asian Paints Ltd. 0.12% Ferrous Metals 1.75% Tata Steel Ltd. 1.37% Steel Authority Of India Ltd. 0.37% Finance 5.89% • Bajaj Finserv Ltd. 4.03% HDFC Ltd. 1.25% Muthoot Finance Ltd. 0.60% Gas 1.34% GAIL (India) Ltd. 1.34% Industrial Products 0.65% Cummins India Ltd. 0.65% Media & Entertainment 0.50% Zee Entertainment Enterprises Ltd. 0.50% Minerals/Mining 0.47%
Coal India Ltd. 0.47% Non - Ferrous Metals 1.93% Hindalco Industries Ltd. 1.93% Petroleum Products 5.03% 0.60% Reliance Industries Ltd. 2.23% Castrol India Ltd. 1.09% Indian Oil Corporation Ltd. 1.03% Bharat Petroleum Corporation Ltd. 0.68% Bharat Petroleum Corporation Ltd. - Futures 0.60% Pharmaceuticals 7.38% 0.13% Cipla Ltd. 2.80% Cipla Ltd. - Futures 0.13% Sun Pharmaceutical Industries Ltd. 2.50% Lupin Ltd. 1.24% Biocon Ltd. 0.41% Dr. Reddy's Laboratories Ltd. 0.25% Divi's Laboratories Ltd. 0.17% Power 4.01% Power Grid Corporation Of India Ltd. 1.95% NTPC Ltd. 1.82% Tata Power Company Ltd. 0.24% Retailing 1.20% Avenue Supermarts Ltd. 1.20% Software 8.30% • Infosys Ltd. 3.42% Tech Mahindra Ltd. 1.95% Wipro Ltd. 1.70% HCL Technologies Ltd. 1.24% Telecom - Equipment & Accessories 0.08% Bharti Infratel Ltd. 0.08% Telecom - Services 2.72% Bharti Airtel Ltd. 2.53% Idea Cellular Ltd. 0.19% Transportation 3.08% Interglobe Aviation Ltd. 1.83% Container Corporation Of India Ltd. 1.24% Units of Mutual Fund 0.23% ICICI Prudential Nifty 100 iWIN ETF 0.23% Short Term Debt and net current assets 2.76% Total Net Assets 100.00%
NAV (As on 28-Apr-17):IPFBEF Growth Option : 35.07IPFBEF Dividend Option : 22.07IPFBEF Direct Plan Growth Option : 36.40IPFBEF Direct Plan Dividend Option : 30.66
Closing AUM as on 30-Apr-17 : Rs. 13155.67 crores
Benchmark Std Dev (Annualised) : 13.79%
Entry load : Nil
Dividend History : Refer page no. from 122 to 130
SIP Returns : Refer page no. from 118 to 120
Total Expense Ratio @@ :
IPFBEF : 2.07% p. a.
IPFBEF Direct Plan : 1.13% p. a.
Investment Objective : Refer page no. from 131 to 134
Riskometer
• Long term wealth creation solution
• A focused large cap equity fund that aims for growth by investing in companies in the large cap category
This Product is suitable for investors who are seeking*:
*Investors should consult their financial advisers if in doubt about whether the product is suitable for them.
Annual Portfolio Turnover Ratio : Equity - 0.57 times, Others (Debt and Derivatives) - 1.00 times Combined Annual Portfolio Turnover Ratio : 1.57 times
Company/Issuer % to % to NAV NAV Derivatives
Company/Issuer % to % to NAV NAV Derivatives
Notes:1. Different plans shall have different expense structure. The performance details provided herein are of ICICI Prudential Focused Bluechip Equity Fund.2. The scheme is currently managed by Manish Gunwani. Mr. Manish Gunwani has been managing this fund since Jan 2012. Total Schemes managed by the Fund Manager is 12 (11 are jointly managed). Refer annexure from page no. 91 for performance of other schemes currently managed by Manish Gunwani. 3. Date of inception:23-May-08.4. Past performance may or may not be sustained in future and the same may not necessarily provide the basis for comparison with other investment.5. Load is not considered for computation of returns.6. In case, the start/end date of the concerned period is a nonbusiness date (NBD), the NAV of the previous date is considered for computation of returns. The NAV per unit shown in the table is as on the start date of the said period
Scheme
NAV (Rs.) Per Unit (as on April 28,2017 : 35.07)
CAGR (%)
10.00
Nifty 50 Index (Benchmark)
Since inception
CurrentValue of
Investment of Rs. 10000
CAGR (%) Current Value of
Investment of Rs. 10000
1 Year 3 Year 5 Year
CAGR (%) Current Value of
Investment of Rs. 10000
CAGR (%) Current Value of
Investment of Rs. 10000
28.38 21.66 16.14
Particulars
23.64 12357.29 17.44 16191.14 16.80 21728.62 15.07 35070.00
18.58 11852.59 11.60 13894.11 12.14 17728.25 7.32 18809.17

Fund Managers **:
Mrinal Singh(Managing this fund since Dec, 2015 &Overall 14 years of experience)Vinay Sharma (Managing this fund since Apr, 2014 &Overall 11 years of experience)
Indicative Investment Horizon : 5 years and above
Inception/Allotment date: 28-May-09
NAV (As on 28-Apr-17):IPSLCF Growth Option : 26.62IPSLCF Dividend Option : 18.95IPSLCF Direct Plan Growth Option : 27.75IPSLCF Direct Plan Dividend Option : 26.88
Options :Growth, Dividend(dividend payout*** and re-investment facility available)
Application Amount for freshSubscription :Rs.5,000 (plus in multiples of Re.1)
Min.Addl.Investment :Rs.1,000 (plus in multiples of Re.1)
Exit load for Redemption / Switchout :- Lumpsum Investment OptionWithin 1 Year from allotment - 1% ofapplicable NAV, more than 1 Year - Nil
Min.Redemption Amt. :500/- or all units where amount is below 500/-
Std Dev (Annualised) : 14.51% Sharpe Ratio : 0.60
Average P/E : 20.73 Average P/BV : 5.68 Average Dividend Yield : 1.26
Portfolio Beta : 0.99 R squared : 0.93
Note : Default trigger is now set at 50% of the appreciation of NAV.Portfolio turnover has been computed as the ratio of the lower value of purchase and sales, to the average net assets in the past one year (since inception for schemes that have not completed a year). The figures are not netted for derivative transactions.Risk-free rate based on the last Overnight MIBOR cut-off of 6.18%**In addition to the fund manager managing this fund, the ADR/GDR exposure is managed by Mr. Ihab Dalwai.@@ Total Expense Ratio is weighted average for the month. Ratio excludes service tax on management fees and includes B-15 clawback reversal, if any.## Minimum number of installments for monthly frequency will be 6 and for Quarterly frequency will be 4. w.e.f February 01, 2017.* Minimum number of installments for daily, weekly and monthly frequency will be 6 and for Quarterly frequency will be 4. w.e.f February 01, 2017. Refer page No. 137 for definition of Flex STP and Value STP.&&
Minimum number of installments for both monthly and quarterly will be 2. w.e.f February 01, 2017.*** In case the unit holder has opted for dividend payout option, the minimum amount for dividend payout shall be 100 (net of dividend distribution tax and other statutory levy, if any), else the dividend would be mandatorily reinvested.
• Top Ten Holdings
Portfolio as on April 30, 2017
Monthly AAUM as on 30-Apr-17 : Rs. 758.69 crores
##SIP :Monthly Frequency: Rs. 1,000/- and in multiple of Rs. 1/-Quarterly Frequency: Rs. 5,000/- and in multiple of Rs. 1/-
STP/ Flex STP/ Value STP * :Daily Frequency: Rs. 250/- and in multiples of Rs. 50/-Weekly, Monthly and Quarterly Frequency: Rs. 1,000/- and in multiples of Rs. 1/-
Closing AUM as on 30-Apr-17 : Rs. 764.26 crores
Benchmark Std Dev (Annualised) : 14.17%
10
Style Box Returns of ICICI Prudential Select Large Cap Fund - Growth Option as on April 30, 2017 - (IPSLCF)
ICICI Prudential Select Large Cap FundAn Open Ended Equity Fund
Entry load : Nil
RiskometerThis Product is suitable for investors who are seeking*:
• Long term wealth creation solution
• An equity fund that aims to generate capital appreciation by investing in equity or equity related securities of companies forming part of S&P BSE 100 Index
*Investors should consult their financial advisers if in doubt about whether the product is suitable for them.
&&SWP :Rs. 500/- and in multiples of Rs. 1/-
Annual Portfolio Turnover Ratio : Equity - 0.61 times, Others (Debt and Derivatives) - 0.11 times Combined Annual Portfolio Turnover Ratio : 0.72 times
Auto 11.94%
• Mahindra & Mahindra Ltd. 8.08%
Tata Motors Ltd. 3.86%
Banks 18.09%
• HDFC Bank Ltd. 10.38%
• ICICI Bank Ltd. 7.71%
Construction Project 10.56%
• Larsen & Toubro Ltd. 10.56%
Consumer Non Durables 4.53%
Hindustan Unilever Ltd. 4.53%
Non - Ferrous Metals 5.31%
• Hindalco Industries Ltd. 5.31%
Petroleum Products 6.72%
• Indian Oil Corporation Ltd. 6.72%
Pharmaceuticals 14.48%
• Sun Pharmaceutical Industries Ltd. 8.10%
• Cipla Ltd. 6.38%
Power 5.09%
Power Grid Corporation Of India Ltd. 5.09%
Software 18.86%
• Wipro Ltd. 7.82%
• Infosys Ltd. 6.10%
HCL Technologies Ltd. 4.94%
Short Term Debt and net current assets 4.43%
Total Net Assets 100.00%
Company/Issuer % to NAV
Dividend History : Refer page no. from 122 to 130
SIP Returns : Refer page no. from 118 to 120
Total Expense Ratio @@ :
IPSLCF : 2.65% p. a.
IPSLCF Direct Plan : 1.65% p. a.
Investment Objective : Refer page no. from 131 to 134
Notes:1. Different plans shall have different expense structure. The performance details provided herein are of ICICI Prudential Select Large Cap Fund.2. The scheme is currently managed by Mrinal Singh and Vinay Sharma. Mr. Mrinal Singh has been managing this fund since Dec 2015. Total Schemes managed by the Fund Manager . Refer annexure from page no. 91 for performance of other schemes currently is 15 (14 are jointly managed [Excludes FoF Schemes])managed by Mrinal Singh. Mr. Vinay Sharma has been managing this fund since Apr 2014 . Total Schemes managed by the Fund Manager Refer annexure from is 9 (7 are jointly managed).page no. 91 for performance of other schemes currently managed by Vinay Sharma .3. Date of inception: 28-May-09.4. Past performance may or may not be sustained in future and the same may not necessarily provide the basis for comparison with other investment.5. Load is not considered for computation of returns.6. In case, the start/end date of the concerned period is a nonbusiness date (NBD), the NAV of the previous date is considered for computation of returns. The NAV per unit shown in the table is as on the start date of the said period
Scheme
Nifty 50 Index (Additional Benchmark)
NAV (Rs.) Per Unit (as on April 28,2017 : 26.62)
CAGR (%)
10.00
S&P BSE 100 Index (Benchmark)
Since inception
CurrentValue of
Investment of Rs. 10000
CAGR (%) Current Value of
Investment of Rs. 10000
1 Year 3 Year 5 Year
CAGR (%) Current Value of
Investment of Rs. 10000
CAGR (%) Current Value of
Investment of Rs. 10000
21.89 17.62 13.47
Particulars
21.67 12160.80 14.76 15107.83 14.60 19762.44 13.15 26620.00
21.33 12127.04 12.94 14399.76 12.92 18354.60 10.70 22382.50
18.58 11852.59 11.60 13894.11 12.14 17728.25 10.11 21452.24

11
Fund Details
Quantitative Indicators
Style Box
Portfolio as on April 30, 2017
Fund Managers** :
Sankaran Naren (Managing this fund from Feb 2012, earlier managed from Aug 2009 to Feb 2011 & has Overall 26 Years of experience)Mittul Kalawadia(Managing this fund since Feb, 2012 & Overall 10 Years of experience)
Inception/Allotment date: 09-Jul-98
Indicative Investment Horizon: 5 yearsand above
NAV (As on 28-Apr-17):IPT100F Growth Option : 297.04IPT100F Dividend Option : 18.06IPT100F Direct Plan Growth Option : 308.02IPT100F Direct Plan Dividend Option : 23.36
Options :Growth, Dividend(dividend payout*** and re-investment facility available)
Application Amount for freshSubscription :Rs.5,000 (plus in multiples of Re.1)
Min.Addl.Investment :Rs.1,000 (plus in multiples of Re.1)
Exit load for Redemption / Switchout :- Lumpsum & SIP / STP / SWP OptionWithin 1 Year from allotment - 1% ofapplicable NAV, more than 1 Year - Nil
&&SWP :Rs. 500/- and in multiples of Rs. 1/-
STP/ Flex STP/ Value STP * :Daily Frequency: Rs. 250/- and in multiples of Rs. 50/-Weekly, Monthly and Quarterly Frequency: Rs. 1,000/- and in multiples of Rs. 1/-
Min.Redemption Amt. :500/- or all units where amount is below 500/-
Std Dev (Annualised) : 14.18% Sharpe Ratio : 0.77
Average P/E : 18.18 Average P/BV : 4.09 Average Dividend Yield : 1.47
Portfolio Beta : 0.97 R squared : 0.89
Portfolio turnover has been computed as the ratio of the lower value of purchase and sales, to the average net assets in the past one year (since inception for schemes that have not completed a year). The figures are not netted for derivative transactions.Risk-free rate based on the last Overnight MIBOR cut-off of 6.18%
**In addition to the fund manager managing this fund, the ADR/GDR exposure is managed by Mr. Ihab Dalwai.Industry classification is done as per Global Industry Classification Standard (GICS) by MSCI and Standard & Poor’s for Foreign Equity@@ Total Expense Ratio is weighted average for the month. Ratio excludes service tax on management fees and includes B-15 clawback reversal, if any.
• Top Ten Holdings
Returns of ICICI Prudential Top 100 Fund - Growth Option as on April 30, 2017 - (IPT100F)
Monthly AAUM as on 30-Apr-17 : Rs. 2171.93 crores
ICICI Prudential Top 100 FundAn Open Ended Equity Fund
Closing AUM as on 30-Apr-17 : Rs. 2356.71 crores
Benchmark Std Dev (Annualised) : 13.79%
Entry load : Nil
RiskometerThis Product is suitable for investors who are seeking*:
• Long term wealth creation solution
• An equity fund that aims to provide long term capital appreciation by predominantly investing in equity and equity related securities.
*Investors should consult their financial advisers if in doubt about whether the product is suitable for them.
Annual Portfolio Turnover Ratio : Equity - 1.08 times, Others (Debt and Derivatives) - 0.18 times Combined Annual Portfolio Turnover Ratio : 1.26 times
DisclaimerThe Global Industry Classification Standard (“GICS”) was developed by and is the exclusive property and a service mark of MSCI Inc. (“MSCI”) and Standard & Poor’s Financial Services LLC (“S&P”) and is licensed for use by ICICI Prudential Asset Management Company Ltd. Neither MSCI, S&P nor any other party involved in making or compiling the GICS or any GICS classifications makes any express or implied warranties or representations with respect to such standard or classification (or the results to be obtained by the use thereof), and all such parties hereby expressly disclaim all warranties of originality, accuracy, completeness, merchantability and fitness for a particular purpose with respect to any of such standard or classification. Without limiting any of the foregoing, in no event shall MSCI, S&P, any of their affiliates or any third party involved in making or compiling the GICS or any GICS classifications have any liability for any direct, indirect, special, punitive, consequential or any other damages (including lost profits) even if notified of the possibility of such damages.##
Minimum number of installments for monthly frequency will be 6 and for Quarterly frequency will be 4. w.e.f February 01, 2017.* Minimum number of installments for daily, weekly and monthly frequency will be 6 and for Quarterly frequency will be 4. w.e.f February 01, 2017. Refer page No. 137 for definition of Flex STP and Value STP.&&
Minimum number of installments for both monthly and quarterly will be 2. w.e.f February 01, 2017.*** In case the unit holder has opted for dividend payout option, the minimum amount for dividend payout shall be 100 (net of dividend distribution tax and other statutory levy, if any), else the dividend would be mandatorily reinvested.
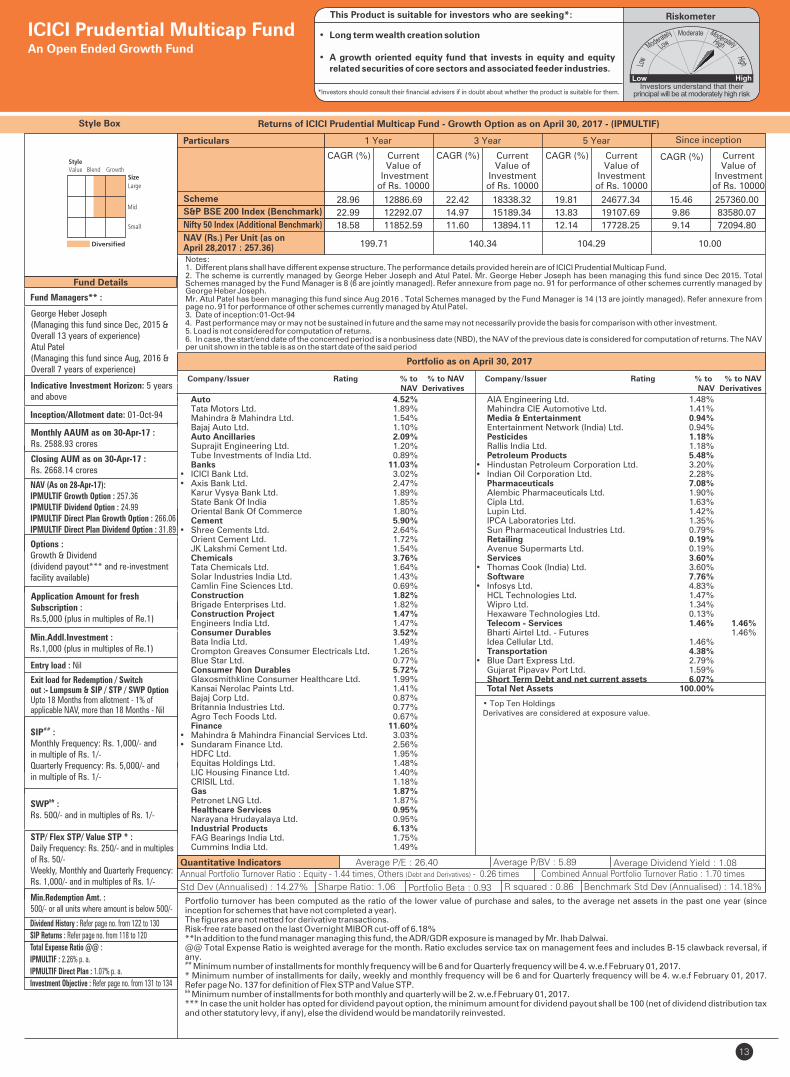
Auto 5.89% Mahindra & Mahindra Ltd. 2.83% Tata Motors Ltd. 2.46% Tata Motors Ltd. - DVR 0.59% Auto Ancillaries 0.69% Apollo Tyres Ltd. 0.69% Banks 17.95%• ICICI Bank Ltd. 6.50%• State Bank Of India 3.69%• HDFC Bank Ltd. 3.49% Axis Bank Ltd. 2.81% The Federal Bank Ltd. 1.46% Chemicals 4.35%• Tata Chemicals Ltd. 4.35% Construction Project 4.37% Larsen & Toubro Ltd. 2.85% Ashoka Buildcon Ltd. 1.52% Consumer Non Durables 7.77% ITC Ltd. 1.88% Britannia Industries Ltd. 1.64% Hindustan Unilever Ltd. 1.59% Mcleod Russel India Ltd. 1.20% Glaxosmithkline Consumer Healthcare Ltd. 1.19% Coffee Day Enterprises Pvt. Ltd. 0.27% Ferrous Metals 3.81%• Tata Steel Ltd. 3.81% Finance 5.23% IDFC Ltd. 2.47% BSE Ltd. 1.28% Sundaram Finance Ltd. 0.86% Bajaj Finserv Ltd. 0.62% Minerals/Mining 1.32% Coal India Ltd. 1.32% Non - Ferrous Metals 1.64% Hindalco Industries Ltd. 1.64%
Oil 2.37% Oil & Natural Gas Corporation Ltd. 2.37% Pesticides 0.85% Rallis India Ltd. 0.85% Petroleum Products 2.80% Indian Oil Corporation Ltd. 2.80% Pharmaceuticals 6.59% Cipla Ltd. 2.43% Sun Pharmaceutical Industries Ltd. 2.40% Lupin Ltd. 1.14% Divi's Laboratories Ltd. 0.62% Power 7.43%• Power Grid Corporation Of India Ltd. 4.99% Tata Power Company Ltd. 1.30% NTPC Ltd. 1.14% Services 1.18% Thomas Cook (India) Ltd. 1.18% Software 8.98%• Infosys Ltd. 3.93%• Tech Mahindra Ltd. 3.15% HCL Technologies Ltd. 1.90% Telecom - Services 7.16%• Bharti Airtel Ltd. 6.79% Idea Cellular Ltd. 0.37% Transportation 4.04%• The Great Eastern Shipping Company Ltd. 3.01% Container Corporation Of India Ltd. 1.03% Short Term Debt and net current assets 5.57% Total Net Assets 100.00%
Company/Issuer % to NAV Company/Issuer % to NAV
Dividend History : Refer page no. from 122 to 130
SIP Returns : Refer page no. from 118 to 120
Total Expense Ratio @@ :
IPT100F : 2.39% p. a.
IPT100F Direct Plan : 1.06% p. a.
Investment Objective : Refer page no. from 131 to 134
##SIP :Monthly Frequency: Rs. 1,000/- and in multiple of Rs. 1/-Quarterly Frequency: Rs. 5,000/- and in multiple of Rs. 1/-
Notes:1. Different plans shall have different expense structure. The performance details provided herein are of ICICI Prudential Top 100 Fund.2. The scheme is currently managed by Sankaran Naren and Mittul Kalawadia. Mr. Sankaran Naren has been managing this fund since Feb 2012. Total Schemes managed by the Fund Manager . Refer annexure from page no. 91 for performance of other schemes currently managed by Sankaran is 14 (14 are jointly managed) Naren.Mr. Mittul Kalawadia has been managing this fund since Apr 2014 . Total Schemes managed by the Fund Manager Refer annexure from is 8 (8 are jointly managed).page no. 91 for performance of other schemes currently managed by Mittul Kalawadia .3. Date of inception:09-Jul-98.4. Past performance may or may not be sustained in future and the same may not necessarily provide the basis for comparison with other investment.5. Load is not considered for computation of returns.6. In case, the start/end date of the concerned period is a nonbusiness date (NBD), the NAV of the previous date is considered for computation of returns. The NAV per unit shown in the table is as on the start date of the said period
Scheme
NAV (Rs.) Per Unit (as on April 28,2017 : 297.04)
CAGR (%)
10.00
Nifty 50 Index (Benchmark)
Since inception
CurrentValue of
Investment of Rs. 10000
CAGR (%) Current Value of
Investment of Rs. 10000
1 Year 3 Year 5 Year
CAGR (%) Current Value of
Investment of Rs. 10000
CAGR (%) Current Value of
Investment of Rs. 10000
229.52 183.95 135.69
Particulars
29.51 12941.79 17.34 16147.87 16.97 21891.08 19.75 297040.00
18.58 11852.59 11.60 13894.11 12.14 17728.25 12.82 96811.30
Returns of ICICI Prudential Dynamic Plan - Growth Option as on April 30, 2017 - (IPDP)
Portfolio as on April 30, 2017
Quantitative Indicators
• Top Ten Holdings@Short Term < 8 Years, Long Term > 8 Years.
Derivatives are considered at exposure value.
Std Dev (Annualised) : 13.53% Sharpe Ratio : 0.75
Average P/E : 20.19 Average P/BV : 4.22 Average Dividend Yield : 1.18
Portfolio Beta : 0.91 R squared : 0.86
# Automatic Withdrawal Plan (AWP) feature will allow investors to redeem a fixed sum of money periodically at the prevailing Net Asset Value (NAV) depending on the option chosen by the investor. For more details of this feature, Investors are requested to visit the website of the AMC viz., www.icicipruamc.comPortfolio turnover has been computed as the ratio of the lower value of purchase and sales, to the average net assets in the past one year (since inception for schemes that have not completed a year). The figures are not netted for derivative transactions.Risk-free rate based on the last Overnight MIBOR cut-off of 6.18%.**In addition to the fund manager managing this fund, the ADR/GDR exposure is managed by Mr. Ihab Dalwai.Industry classification is done as per Global Industry Classification Standard (GICS) by MSCI and Standard & Poor’s for Foreign Equity@@ Total Expense Ratio is weighted average for the month. Ratio excludes service tax on management fees and includes B-15 clawback reversal, if any.DisclaimerThe Global Industry Classification Standard (“GICS”) was developed by and is the exclusive property and a service mark of MSCI Inc. (“MSCI”) and Standard & Poor’s Financial Services LLC (“S&P”) and is licensed for use by ICICI Prudential Asset Management Company Ltd. Neither MSCI, S&P nor any other party involved in making or compiling the GICS or any GICS classifications makes any express or implied warranties or representations with respect to such standard or classification (or the results to be obtained by the use thereof), and all such parties hereby expressly disclaim all warranties of originality, accuracy, completeness, merchantability and fitness for a particular purpose with respect to any of such standard or classification. Without limiting any of the foregoing, in no event shall MSCI, S&P, any of their affiliates or any third party involved in making or compiling the GICS or any GICS classifications have any liability for any direct, indirect, special, punitive, consequential or any other damages (including lost profits) even if notified of the possibility of such damages.## Minimum number of installments for monthly frequency will be 6 and for Quarterly frequency will be 4. w.e.f February 01, 2017.* Minimum number of installments for daily, weekly and monthly frequency will be 6 and for Quarterly frequency will be 4. w.e.f February 01, 2017. Refer page No. 137 for definition of Flex STP and Value STP.&&
Minimum number of installments for both monthly and quarterly will be 2. w.e.f February 01, 2017.*** In case the unit holder has opted for dividend payout option, the minimum amount for dividend payout shall be 100 (net of dividend distribution tax and other statutory levy, if any), else the dividend would be mandatorily reinvested.
Fund Managers** :
Sankaran Naren (Managing this fund from Feb 2012, earlier managed from Sep 2006 to Feb 2011 and & has Overall 26 Years of experience)Atul Patel(Managing this fund since Apr, 2016 &Overall 7 years of experience)Indicative Investment Horizon: 5 yearsand aboveInception/Allotment date: 31-Oct-02
NAV (As on 28-Apr-17):IPDP Growth Option : 231.4592IPDP Dividend Option : 22.9771IPDP Direct Plan Growth Option : 239.1858IPDP Direct Plan Dividend Option : 26.2495
Options :Growth & Dividend(dividend payout*** and re-investment facility available)
Application Amount for freshSubscription :Rs.5,000 (plus in multiples of Re.1)
Min.Addl.Investment :Rs.1,000 (plus in multiples of Re.1)
Exit load for Redemption / Switch#out :- Lumpsum & SIP / STP / SWP / AWP
Upto 10% of units within 1 Year from the date of allotment - Nil More than 10% of units within 1 Year from the date of allotment - 1% of applicable Net Asset Value (NAV) After 1 Year from the date of allotment - Nil w.e.f. 10th November 2016.
&&SWP :Rs. 500/- and in multiples of Rs. 1/-
STP/ Flex STP/ Value STP * :Daily Frequency: Rs. 250/- and in multiples of Rs. 50/-Weekly, Monthly and Quarterly Frequency: Rs. 1,000/- and in multiples of Rs. 1/-
Min.Redemption Amt. :500/- or all units where amount is below 500/-
Fund Details
12
Style Box
Monthly AAUM as on 30-Apr-17 : Rs. 6399.06 crores
Net Equity Level : 83.10%
ICICI Prudential Dynamic PlanAn Open Ended Diversified Equity Fund
Closing AUM as on 30-Apr-17 : Rs. 6449.65 crores
Benchmark Std Dev (Annualised) : 13.79%
Entry load : Nil
RiskometerThis Product is suitable for investors who are seeking*:
• Long term wealth creation solution • A diversifed equity fund that aims for growth by investing in equity
and debt (for defensive considerations)
*Investors should consult their financial advisers if in doubt about whether the product is suitable for them.
Annual Portfolio Turnover Ratio : Equity - 1.36 times, Others (Debt and Derivatives) - 1.35 times Combined Annual Portfolio Turnover Ratio : 2.71 times
Dividend History : Refer page no. from 122 to 130
SIP Returns : Refer page no. from 118 to 120
Total Expense Ratio @@ :
IPDP : 2.16% p. a.
IPDP Direct Plan : 1.38% p. a.
Investment Objective : Refer page no. from 131 to 134
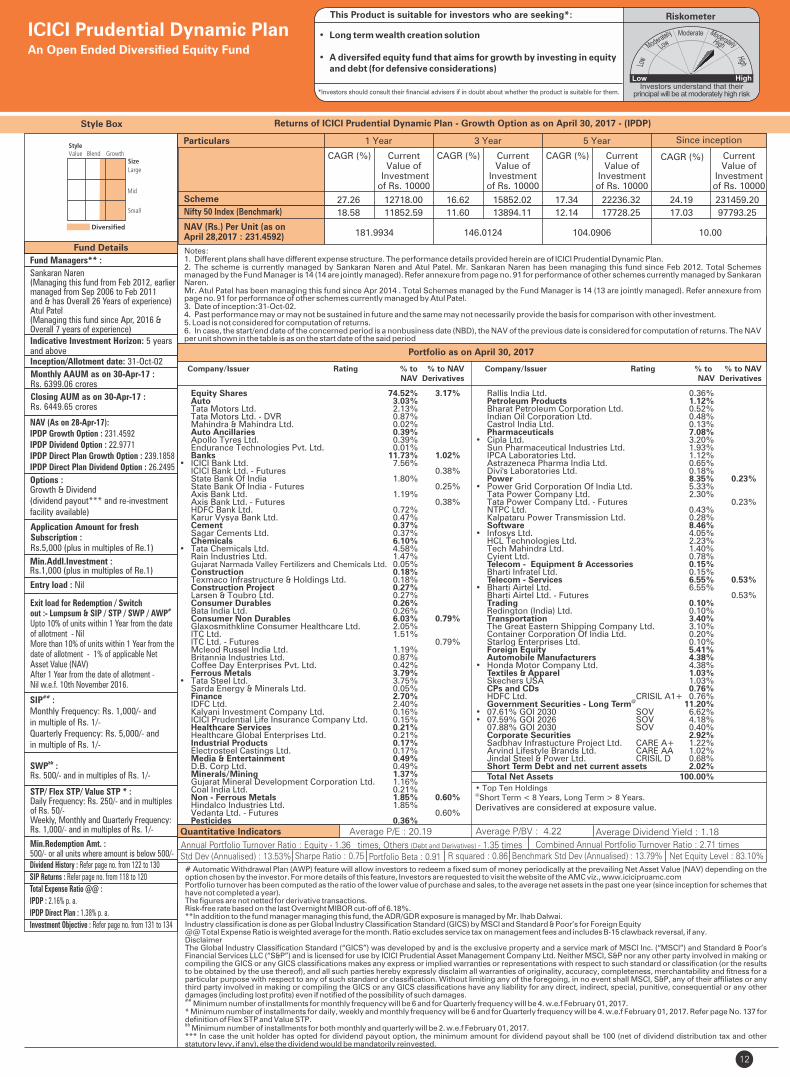
Equity Shares 74.52% 3.17% Auto 3.03% Tata Motors Ltd. 2.13% Tata Motors Ltd. - DVR 0.87% Mahindra & Mahindra Ltd. 0.02% Auto Ancillaries 0.39% Apollo Tyres Ltd. 0.39% Endurance Technologies Pvt. Ltd. 0.01% Banks 11.73% 1.02%• ICICI Bank Ltd. 7.56% ICICI Bank Ltd. - Futures 0.38% State Bank Of India 1.80% State Bank Of India - Futures 0.25% Axis Bank Ltd. 1.19% Axis Bank Ltd. - Futures 0.38% HDFC Bank Ltd. 0.72% Karur Vysya Bank Ltd. 0.47% Cement 0.37% Sagar Cements Ltd. 0.37% Chemicals 6.10% • Tata Chemicals Ltd. 4.58% Rain Industries Ltd. 1.47% Gujarat Narmada Valley Fertilizers and Chemicals Ltd. 0.05% Construction 0.18% Texmaco Infrastructure & Holdings Ltd. 0.18% Construction Project 0.27% Larsen & Toubro Ltd. 0.27% Consumer Durables 0.26% Bata India Ltd. 0.26% Consumer Non Durables 6.03% 0.79% Glaxosmithkline Consumer Healthcare Ltd. 2.05% ITC Ltd. 1.51% ITC Ltd. - Futures 0.79% Mcleod Russel India Ltd. 1.19% Britannia Industries Ltd. 0.87% Coffee Day Enterprises Pvt. Ltd. 0.42% Ferrous Metals 3.79% • Tata Steel Ltd. 3.75% Sarda Energy & Minerals Ltd. 0.05% Finance 2.70% IDFC Ltd. 2.40% Kalyani Investment Company Ltd. 0.16% ICICI Prudential Life Insurance Company Ltd. 0.15% Healthcare Services 0.21% Healthcare Global Enterprises Ltd. 0.21% Industrial Products 0.17% Electrosteel Castings Ltd. 0.17% Media & Entertainment 0.49% D.B. Corp Ltd. 0.49% Minerals/Mining 1.37% Gujarat Mineral Development Corporation Ltd. 1.16% Coal India Ltd. 0.21% Non - Ferrous Metals 1.85% 0.60% Hindalco Industries Ltd. 1.85% Vedanta Ltd. - Futures 0.60% Pesticides 0.36%
Rallis India Ltd. 0.36% Petroleum Products 1.12% Bharat Petroleum Corporation Ltd. 0.52% Indian Oil Corporation Ltd. 0.48% Castrol India Ltd. 0.13% Pharmaceuticals 7.08% • Cipla Ltd. 3.20% Sun Pharmaceutical Industries Ltd. 1.93% IPCA Laboratories Ltd. 1.12% Astrazeneca Pharma India Ltd. 0.65% Divi's Laboratories Ltd. 0.18% Power 8.35% 0.23%• Power Grid Corporation Of India Ltd. 5.33% Tata Power Company Ltd. 2.30% Tata Power Company Ltd. - Futures 0.23% NTPC Ltd. 0.43% Kalpataru Power Transmission Ltd. 0.28% Software 8.46% • Infosys Ltd. 4.05% HCL Technologies Ltd. 2.23% Tech Mahindra Ltd. 1.40% Cyient Ltd. 0.78% Telecom - Equipment & Accessories 0.15% Bharti Infratel Ltd. 0.15% Telecom - Services 6.55% 0.53%• Bharti Airtel Ltd. 6.55% Bharti Airtel Ltd. - Futures 0.53% Trading 0.10% Redington (India) Ltd. 0.10% Transportation 3.40% The Great Eastern Shipping Company Ltd. 3.10% Container Corporation Of India Ltd. 0.20% Starlog Enterprises Ltd. 0.10% Foreign Equity 5.41% Automobile Manufacturers 4.38% • Honda Motor Company Ltd. 4.38% Textiles & Apparel 1.03% Skechers USA 1.03% CPs and CDs 0.76% HDFC Ltd. CRISIL A1+ 0.76%
@ Government Securities - Long Term 11.20% • 07.61% GOI 2030 SOV 6.62% • 07.59% GOI 2026 SOV 4.18% 07.88% GOI 2030 SOV 0.40% Corporate Securities 2.92% Sadbhav Infrastucture Project Ltd. CARE A+ 1.22% Arvind Lifestyle Brands Ltd. CARE AA 1.02% Jindal Steel & Power Ltd. CRISIL D 0.68% Short Term Debt and net current assets 2.02% Total Net Assets 100.00%
Company/Issuer Rating % to % to NAV NAV Derivatives
Company/Issuer Rating % to % to NAV NAV Derivatives
##SIP :Monthly Frequency: Rs. 1,000/- and in multiple of Rs. 1/-Quarterly Frequency: Rs. 5,000/- and in multiple of Rs. 1/-
Notes:1. Different plans shall have different expense structure. The performance details provided herein are of ICICI Prudential Dynamic Plan.2. The scheme is currently managed by Sankaran Naren and Atul Patel. Mr. Sankaran Naren has been managing this fund since Feb 2012. Total Schemes managed by the Fund Manager . Refer annexure from page no. 91 for performance of other schemes currently managed by Sankaran is 14 (14 are jointly managed) Naren.Mr. Atul Patel has been managing this fund since Apr 2014 . Total Schemes managed by the Fund Manager is 14 (13 are jointly managed). Refer annexure from page no. 91 for performance of other schemes currently managed by Atul Patel .3. Date of inception:31-Oct-02.4. Past performance may or may not be sustained in future and the same may not necessarily provide the basis for comparison with other investment.5. Load is not considered for computation of returns.6. In case, the start/end date of the concerned period is a nonbusiness date (NBD), the NAV of the previous date is considered for computation of returns. The NAV per unit shown in the table is as on the start date of the said period
Scheme
NAV (Rs.) Per Unit (as on April 28,2017 : 231.4592)
CAGR (%)
10.00
Nifty 50 Index (Benchmark)
Since inception
CurrentValue of
Investment of Rs. 10000
CAGR (%) Current Value of
Investment of Rs. 10000
1 Year 3 Year 5 Year
CAGR (%) Current Value of
Investment of Rs. 10000
CAGR (%) Current Value of
Investment of Rs. 10000
181.9934 146.0124 104.0906
Particulars
27.26 12718.00 16.62 15852.02 17.34 22236.32 24.19 231459.20
18.58 11852.59 11.60 13894.11 12.14 17728.25 17.03 97793.25
13
Style Box
Fund Details
Quantitative Indicators
Fund Managers** :
George Heber Joseph(Managing this fund since Dec, 2015 &Overall 13 years of experience)Atul Patel(Managing this fund since Aug, 2016 &Overall 7 years of experience)
Indicative Investment Horizon: 5 years and above
Inception/Allotment date: 01-Oct-94
NAV (As on 28-Apr-17):IPMULTIF Growth Option : 257.36IPMULTIF Dividend Option : 24.99IPMULTIF Direct Plan Growth Option : 266.06IPMULTIF Direct Plan Dividend Option : 31.89
Options :Growth & Dividend(dividend payout*** and re-investment facility available)
Application Amount for freshSubscription :Rs.5,000 (plus in multiples of Re.1)
Min.Addl.Investment :Rs.1,000 (plus in multiples of Re.1)
Exit load for Redemption / Switchout :- Lumpsum & SIP / STP / SWP OptionUpto 18 Months from allotment - 1% of applicable NAV, more than 18 Months - Nil
&&SWP :Rs. 500/- and in multiples of Rs. 1/-
STP/ Flex STP/ Value STP * :Daily Frequency: Rs. 250/- and in multiples of Rs. 50/-Weekly, Monthly and Quarterly Frequency: Rs. 1,000/- and in multiples of Rs. 1/-
Min.Redemption Amt. : 500/- or all units where amount is below 500/-
Std Dev (Annualised) : 14.27% Sharpe Ratio: 1.06
Average P/E : 26.40 Average P/BV : 5.89 Average Dividend Yield : 1.08
Portfolio Beta : 0.93 R squared : 0.86
Portfolio turnover has been computed as the ratio of the lower value of purchase and sales, to the average net assets in the past one year (since inception for schemes that have not completed a year). The figures are not netted for derivative transactions.Risk-free rate based on the last Overnight MIBOR cut-off of 6.18%**In addition to the fund manager managing this fund, the ADR/GDR exposure is managed by Mr. Ihab Dalwai.@@ Total Expense Ratio is weighted average for the month. Ratio excludes service tax on management fees and includes B-15 clawback reversal, if any.## Minimum number of installments for monthly frequency will be 6 and for Quarterly frequency will be 4. w.e.f February 01, 2017.* Minimum number of installments for daily, weekly and monthly frequency will be 6 and for Quarterly frequency will be 4. w.e.f February 01, 2017. Refer page No. 137 for definition of Flex STP and Value STP.&&
Minimum number of installments for both monthly and quarterly will be 2. w.e.f February 01, 2017.*** In case the unit holder has opted for dividend payout option, the minimum amount for dividend payout shall be 100 (net of dividend distribution tax and other statutory levy, if any), else the dividend would be mandatorily reinvested.
• Top Ten HoldingsDerivatives are considered at exposure value.
Portfolio as on April 30, 2017
Returns of ICICI Prudential Multicap Fund - Growth Option as on April 30, 2017 - (IPMULTIF)
Monthly AAUM as on 30-Apr-17 : Rs. 2588.93 crores
Closing AUM as on 30-Apr-17 : Rs. 2668.14 crores
ICICI Prudential Multicap Fund
Benchmark Std Dev (Annualised) : 14.18%
An Open Ended Growth Fund
Entry load : Nil
RiskometerThis Product is suitable for investors who are seeking*:
• Long term wealth creation solution
• A growth oriented equity fund that invests in equity and equity related securities of core sectors and associated feeder industries.
*Investors should consult their financial advisers if in doubt about whether the product is suitable for them.
Annual Portfolio Turnover Ratio : Equity - 1.44 times, Others (Debt and Derivatives) - 0.26 times Combined Annual Portfolio Turnover Ratio : 1.70 times
Dividend History : Refer page no. from 122 to 130
SIP Returns : Refer page no. from 118 to 120
Total Expense Ratio @@ :
IPMULTIF : 2.26% p. a.
IPMULTIF Direct Plan : 1.07% p. a.
Investment Objective : Refer page no. from 131 to 134
##SIP :Monthly Frequency: Rs. 1,000/- and in multiple of Rs. 1/-Quarterly Frequency: Rs. 5,000/- and in multiple of Rs. 1/-
Auto 4.52% Tata Motors Ltd. 1.89% Mahindra & Mahindra Ltd. 1.54% Bajaj Auto Ltd. 1.10% Auto Ancillaries 2.09% Suprajit Engineering Ltd. 1.20% Tube Investments of India Ltd. 0.89% Banks 11.03% • ICICI Bank Ltd. 3.02% • Axis Bank Ltd. 2.47% Karur Vysya Bank Ltd. 1.89% State Bank Of India 1.85% Oriental Bank Of Commerce 1.80% Cement 5.90% • Shree Cements Ltd. 2.64% Orient Cement Ltd. 1.72% JK Lakshmi Cement Ltd. 1.54% Chemicals 3.76% Tata Chemicals Ltd. 1.64% Solar Industries India Ltd. 1.43% Camlin Fine Sciences Ltd. 0.69% Construction 1.82% Brigade Enterprises Ltd. 1.82% Construction Project 1.47% Engineers India Ltd. 1.47% Consumer Durables 3.52% Bata India Ltd. 1.49% Crompton Greaves Consumer Electricals Ltd. 1.26% Blue Star Ltd. 0.77% Consumer Non Durables 5.72% Glaxosmithkline Consumer Healthcare Ltd. 1.99% Kansai Nerolac Paints Ltd. 1.41% Bajaj Corp Ltd. 0.87% Britannia Industries Ltd. 0.77% Agro Tech Foods Ltd. 0.67% Finance 11.60% • Mahindra & Mahindra Financial Services Ltd. 3.03% • Sundaram Finance Ltd. 2.56% HDFC Ltd. 1.95% Equitas Holdings Ltd. 1.48% LIC Housing Finance Ltd. 1.40% CRISIL Ltd. 1.18% Gas 1.87% Petronet LNG Ltd. 1.87% Healthcare Services 0.95% Narayana Hrudayalaya Ltd. 0.95% Industrial Products 6.13% FAG Bearings India Ltd. 1.75% Cummins India Ltd. 1.49%
AIA Engineering Ltd. 1.48% Mahindra CIE Automotive Ltd. 1.41% Media & Entertainment 0.94% Entertainment Network (India) Ltd. 0.94% Pesticides 1.18% Rallis India Ltd. 1.18% Petroleum Products 5.48% • Hindustan Petroleum Corporation Ltd. 3.20% • Indian Oil Corporation Ltd. 2.28% Pharmaceuticals 7.08% Alembic Pharmaceuticals Ltd. 1.90% Cipla Ltd. 1.63% Lupin Ltd. 1.42% IPCA Laboratories Ltd. 1.35% Sun Pharmaceutical Industries Ltd. 0.79% Retailing 0.19% Avenue Supermarts Ltd. 0.19% Services 3.60% • Thomas Cook (India) Ltd. 3.60% Software 7.76% • Infosys Ltd. 4.83% HCL Technologies Ltd. 1.47% Wipro Ltd. 1.34% Hexaware Technologies Ltd. 0.13% Telecom - Services 1.46% 1.46% Bharti Airtel Ltd. - Futures 1.46% Idea Cellular Ltd. 1.46% Transportation 4.38% • Blue Dart Express Ltd. 2.79% Gujarat Pipavav Port Ltd. 1.59% Short Term Debt and net current assets 6.07% Total Net Assets 100.00%
Company/Issuer Rating % to % to NAV NAV Derivatives
Company/Issuer Rating % to % to NAV NAV Derivatives
Notes:1. Different plans shall have different expense structure. The performance details provided herein are of ICICI Prudential Multicap Fund.2. The scheme is currently managed by George Heber Joseph and Atul Patel. Mr. George Heber Joseph has been managing this fund since Dec 2015. Total Schemes managed by the Fund Manager . Refer annexure from page no. 91 for performance of other schemes currently managed byis 8 (6 are jointly managed) George Heber Joseph.Mr. Atul Patel has been managing this fund since Aug 2016 . Total Schemes managed by the Fund Manager is 14 (13 are jointly managed). Refer annexure from page no. 91 for performance of other schemes currently managed by Atul Patel .3. Date of inception:01-Oct-944. Past performance may or may not be sustained in future and the same may not necessarily provide the basis for comparison with other investment.5. Load is not considered for computation of returns.6. In case, the start/end date of the concerned period is a nonbusiness date (NBD), the NAV of the previous date is considered for computation of returns. The NAV per unit shown in the table is as on the start date of the said period
Scheme
Nifty 50 Index (Additional Benchmark)
NAV (Rs.) Per Unit (as on April 28,2017 : 257.36)
CAGR (%)
10.00
S&P BSE 200 Index (Benchmark)
Since inception
CurrentValue of
Investment of Rs. 10000
CAGR (%) Current Value of
Investment of Rs. 10000
1 Year 3 Year 5 Year
CAGR (%) Current Value of
Investment of Rs. 10000
CAGR (%) Current Value of
Investment of Rs. 10000
199.71 140.34 104.29
Particulars
28.96 12886.69 22.42 18338.32 19.81 24677.34 15.46 257360.00
22.99 12292.07 14.97 15189.34 13.83 19107.69 9.86 83580.07
18.58 11852.59 11.60 13894.11 12.14 17728.25 9.14 72094.80

14
Auto Ancillaries 2.42%
Exide Industries Ltd. 2.42%
Banks 23.80%
• ICICI Bank Ltd. 5.05%
• The South Indian Bank Ltd. 5.00%
• Karur Vysya Bank Ltd. 3.76%
• The Jammu & Kashmir Bank Ltd. 3.73%
• Union Bank Of India 3.30%
The Federal Bank Ltd. 2.96%
Cement 2.26%
JK Lakshmi Cement Ltd. 2.26%
Chemicals 3.77%
• Tata Chemicals Ltd. 3.77%
Consumer Durables 0.98%
V.I.P. Industries Ltd. 0.98%
Consumer Non Durables 5.77%
Hindustan Unilever Ltd. 3.27%
Bajaj Corp Ltd. 2.51%
Finance 3.68%
PNB Housing Finance Ltd. 2.17%
BSE Ltd. 1.51%
Gas 4.65%
Aegis Logistics Ltd. 2.59%
Mahanagar Gas Ltd. 2.06%
Industrial Products 7.33%
• Cummins India Ltd. 5.02%
AIA Engineering Ltd. 2.32%
Media & Entertainment 2.76%
Hathway Cable & Datacom Ltd. 1.79%
D.B. Corp Ltd. 0.97%
Minerals/Mining 0.95%
Coal India Ltd. 0.95%
Style Box
Company/Issuer % to NAV
Note : - “Portfolio Beta, Standard Deviation, R Squared, Sharpe Ratio and Tracking Error of the Scheme is not computed owing to the short time frame since launch of the Scheme.”Portfolio turnover has been computed as the ratio of the lower value of purchase and sales, to the average net assets in the past one year (since inception for schemes that have not completed a year). The figures are not netted for derivative transactions.**In addition to the fund manager managing this fund, the ADR/GDR exposure is managed by Mr. Ihab Dalwai.@@ Total Expense Ratio is weighted average for the month. Ratio excludes service tax on management fees and includes B-15 clawback reversal, if any.## Minimum number of installments for monthly frequency will be 6 and for Quarterly frequency will be 4. w.e.f February 01, 2017.* Minimum number of installments for daily, weekly and monthly frequency will be 6 and for Quarterly frequency will be 4. w.e.f February 01, 2017. Refer page No. 137 for definition of Flex STP and Value STP.&& Minimum number of installments for both monthly and quarterly will be 2. w.e.f February 01, 2017.*** In case the unit holder has opted for dividend payout option, the minimum amount for dividend payout shall be 100 (net of dividend distribution tax and other statutory levy, if any), else the dividend would be mandatorily reinvested.
Fund Managers** :
Vinay Sharma(Managing this fund since May, 2014 &Overall 11 Years of experience)Mrinal Singh(Managing this fund since May, 2014 &Overall 14 Years of experience)
Indicative Investment Horizon: 5 years and above
Inception/Allotment date: 16-May-14
NAV (As on 28-Apr-17):IPDYEF Growth Option : 15.90IPDYEF Dividend Option : 14.73IPDYEF Direct Plan Growth Option : 16.22IPDYEF Direct Plan Dividend Option : 15.03
Fund Details
• Top Ten Holdings
Diversified
Quantitative Indicators: Average P/E : 19.34 Average P/BV : 5.42 Average Dividend Yield: 1.92
Monthly AAUM as on 30-Apr-17 : Rs. 200.06 crores
Closing AUM as on 30-Apr-17 : Rs. 199.12 crores
Company/Issuer % to NAV
ICICI Prudential Dividend Yield Equity FundAn Open Ended Equity Scheme
Returns of ICICI Prudential Dividend Yield Equity Fund - Growth Option as on - (IPDYEF)April 30, 2017
Portfolio as on April 30, 2017
Pesticides 2.45%
Rallis India Ltd. 2.45%
Petroleum Products 5.00%
• Indian Oil Corporation Ltd. 3.49%
Bharat Petroleum Corporation Ltd. 1.51%
Pharmaceuticals 3.30%
Unichem Laboratories Ltd. 3.30%
Power 2.24%
NTPC Ltd. 2.24%
Software 16.46%
• HCL Technologies Ltd. 5.50%
• Infosys Ltd. 4.87%
NIIT Technologies Ltd. 2.03%
Persistent Systems Ltd. 1.85%
Larsen & Toubro Infotech Ltd. 1.17%
Oracle Financial Services Software Ltd. 1.04%
Transportation 6.64%
Gateway Distriparks Ltd. 3.01%
Interglobe Aviation Ltd. 2.14%
VRL Logistics Ltd. 1.18%
The Great Eastern Shipping Company Ltd. 0.31%
Short Term Debt and net current assets 5.52%
Total Net Assets 100.00%
Riskometer
• Long term wealth creation solution
• An open ended equity fund that aims for growth by primarily investing in equity and equity related instruments, which offer attractive dividend yield.
*Investors should consult their financial advisers if in doubt about whether the product is suitable for them.
This Product is suitable for investors who are seeking*:
Options :Growth & Dividend(dividend payout*** and re-investment facility available)Application Amount for freshSubscription :Rs.5,000 (plus in multiples of Re.1)
Min.Addl.Investment :Rs.1,000 (plus in multiples of Re.1)
Exit load for Redemption / Switch out:- Lumpsum Investment OptionWithin 1 Year from allotment - 1% of applicable NAV, more than 1 Year -Nil
SIP :##
Monthly Frequency: Rs. 1,000/- and in multiple of Rs. 1/-Quarterly Frequency: Rs. 5,000/- and in multiple of Rs. 1/-
&&SWP :Rs. 500/- and in multiples of Rs. 1/-
Min.Redemption Amt. :500/- or all units where amount is below 500/-
Entry load : Nil
STP/ Flex STP/ Value STP * :Daily Frequency: Rs. 250/- and in multiples of Rs. 50/-Weekly, Monthly and Quarterly Frequency: Rs. 1,000/- and in multiples of Rs. 1/-
Annual Portfolio Turnover Ratio : Equity - 0.51 times, Others (Debt and Derivatives) - 0.00 times Combined Annual Portfolio Turnover Ratio : 0.51 timesDividend History : Refer page no. from 122 to 130
SIP Returns : Refer page no. from 118 to 120
Total Expense Ratio @@ :
IPDYEF : 2.60% p. a.
IPDYEF Direct Plan : 2.00% p. a.
Investment Objective : Refer page no. from 131 to 134
Notes:1. Different plans shall have different expense structure. The performance details provided herein are of ICICI Prudential Dividend Yield Equity Fund.2. The scheme is currently managed by Vinay Sharma and Mrinal Singh. Mr. Vinay Sharma has been managing this fund since . Total Schemes managed May 2014by the Fund Manager Refer annexure from page no. 91 for performance of other schemes currently managed by Vinay Sharma.is 9 (7 are jointly managed).Mr. Mrinal Singh has been managing this fund since . Total Schemes managed by the Fund Manager May 2014 is 15 (14 are jointly managed [Excludes FoF Schemes]) . Refer annexure from page no. 91 for performance of other schemes currently managed by Mrinal Singh.3. Date of inception: 16-May-14.4. As the Scheme has completed more than 1 year but less than 3 years, the performance details of only since inception and 1 year are provided herein5. Past performance may or may not be sustained in future and the same may not necessarily provide the basis for comparison with other investment.6. Load is not considered for computation of returns.7. In case, the start/end date of the concerned period is a nonbusiness date (NBD), the NAV of the previous date is considered for computation of returns. The NAV per unit shown in the table is as on the start date of the said period
Scheme
Nifty 50 Index (Additional Benchmark)
NAV (Rs.) Per Unit (as on April 28,2017 : 15.90)
CAGR (%)
10.00
Nifty Dividend Opportunities 50 Index (Benchmark)
Since inception
CurrentValue of
Investment of Rs. 10000
CAGR (%) Current Value of
Investment of Rs. 10000
1 Year 3 Year 5 Year
CAGR (%) Current Value of
Investment of Rs. 10000
CAGR (%) Current Value of
Investment of Rs. 10000
11.68 - -
Particulars
36.25 13613.01 - - - - 17.00 15900.00
26.50 12641.88 - - - - 7.68 12443.42
18.58 11852.59 - - - - 9.05 12916.91

Fund Details
Quantitative Indicators
Portfolio as on April 30, 2017
Returns of ICICI Prudential Value Discovery Fund - Growth Option as on April 30, 2017 - (IPVDF)Style Box
15
Inception/Allotment date: 16-Aug-04
Fund Managers** :
Mrinal Singh(Managing this fund since Feb 2011 &Overall 14 years of experience)
Indicative Investment Horizon: 5 yearsand above
NAV (As on 28-Apr-17):IPVDF Growth Option : 134.19IPVDF Dividend Option : 31.75IPVDF Direct Plan Growth Option : 139.95IPVDF Direct Plan Dividend Option : 50.93
Options :Growth & Dividend(dividend payout*** and re-investment facility available)
Application Amount for freshSubscription :Rs.1,000 (plus in multiples of Re.1)
Min.Addl.Investment :Rs.500 (plus in multiples of Re.1) (w.e.f. 10-January-17)
Exit load for Redemption / Switchout :- Lumpsum & SIP / STP / SWP OptionUpto 12 Months from allotment - 1%of applicable NAV, more than 12Months - Nil
##SIP :Monthly Frequency: Rs. 500/- and in multiple of Rs. 1/-Quarterly Frequency: Rs. 5,000/- and in multiple of Rs. 1/-
&&SWP :Rs. 500/- and in multiples of Rs. 1/-
STP/ Flex STP/ Value STP * :Daily Frequency: Rs. 250/- and in multiples of Rs. 50/-Weekly, Monthly and Quarterly Frequency: Rs. 1,000/- and in multiples of Rs. 1/-
Min.Redemption Amt. :500/- or all units where amount is below 500/-
• Top Ten Holdings
Std Dev (Annualised) : 15.82% Sharpe Ratio : 1.04
Average P/E : 18.63 Average P/BV : 4.23 Average Dvidend Yield : 1.20
Portfolio Beta : 1.01 R squared : 0.86
Portfolio turnover has been computed as the ratio of the lower value of purchase and sales, to the average net assets in the past one year (since inception for schemes that have not completed a year). The figures are not netted for derivative transactions.Risk-free rate based on the last Overnight MIBOR cut-off of 6.18%**In addition to the fund manager managing this fund, the ADR/GDR exposure is managed by Mr. Ihab Dalwai.@@ Total Expense Ratio is weighted average for the month. Ratio excludes service tax on management fees and includes B-15 clawback reversal, if any.##
Minimum number of installments for monthly frequency will be 6 and for Quarterly frequency will be 4. w.e.f February 01, 2017.* Minimum number of installments for daily, weekly and monthly frequency will be 6 and for Quarterly frequency will be 4. w.e.f February 01, 2017. Refer page No. 137 for definition of Flex STP and Value STP.&&
Minimum number of installments for both monthly and quarterly will be 2. w.e.f February 01, 2017.*** In case the unit holder has opted for dividend payout option, the minimum amount for dividend payout shall be 100 (net of dividend distribution tax and other statutory levy, if any), else the dividend would be mandatorily reinvested.
Monthly AAUM as on 30-Apr-17 :Rs. 17163.49 crores
Closing AUM as on 30-Apr-17 :Rs. 17305.79 crores
ICICI Prudential Value Discovery FundAn Open Ended Diversified Equity Fund
Auto 4.99%
• Mahindra & Mahindra Ltd. 3.71%
Tata Motors Ltd. 1.29%
Auto Ancillaries 4.19%
Exide Industries Ltd. 1.67%
Amara Raja Batteries Ltd. 1.54%
Balkrishna Industries Ltd. 0.97%
Banks 16.48%
• HDFC Bank Ltd. 8.36%
• ICICI Bank Ltd. 5.43%
Axis Bank Ltd. 1.54%
Karur Vysya Bank Ltd. 0.68%
The Jammu & Kashmir Bank Ltd. 0.47%
Cement 0.90%
Birla Corporation Ltd. 0.90%
Construction Project 11.53%
• Larsen & Toubro Ltd. 9.16%
Sadbhav Engineering Ltd. 1.78%
GMR Infrastructure Ltd. 0.59%
Consumer Durables 0.75%
Blue Star Ltd. 0.75%
Consumer Non Durables 0.66%
United Spirits Ltd. 0.66%
Finance 4.62%
• Bajaj Finserv Ltd. 2.91%
Max Financial Services Ltd. 1.71%
Gas 1.64%
Petronet LNG Ltd. 1.64%
Industrial Capital Goods 1.92%
Bharat Electronics Ltd. 1.27%
Bharat Heavy Electricals Ltd. 0.65%
Industrial Products 1.17%
Bharat Forge Ltd. 1.17%
Non - Ferrous Metals 1.36%
Hindalco Industries Ltd. 1.36%
Pesticides 2.06%
PI Industries Ltd. 2.06%
Petroleum Products 2.70%
• Indian Oil Corporation Ltd. 2.70%
Pharmaceuticals 9.94%
• Sun Pharmaceutical Industries Ltd. 7.86%
Cipla Ltd. 1.54%
Divi's Laboratories Ltd. 0.53%
Power 5.97%
• NTPC Ltd. 4.74%
Power Grid Corporation Of India Ltd. 1.23%
Software 15.84%
• Wipro Ltd. 7.83%
• Infosys Ltd. 4.57%
HCL Technologies Ltd. 1.74%
Mphasis Ltd. 0.73%
Mindtree Ltd. 0.52%
Persistent Systems Ltd. 0.44%
Transportation 5.09%
Container Corporation Of India Ltd. 2.48%
Gujarat Pipavav Port Ltd. 0.92%
The Great Eastern Shipping Company Ltd. 0.88%
Gateway Distriparks Ltd. 0.82%
Short Term Debt and net current assets 8.19%
Total Net Assets 100.00%
Company/Issuer Rating % to NAV
Benchmark Std Dev (Annualised) : 14.54%
Entry load : Nil
RiskometerThis Product is suitable for investors who are seeking*:
• Long term wealth creation solution
• A diversified equity fund that aims to generate returns by investing in stocks with attractive valuations
*Investors should consult their financial advisers if in doubt about whether the product is suitable for them.
Annual Portfolio Turnover Ratio : Equity - 0.32 times, Others (Debt and Derivatives) - 0.37 times Combined Annual Portfolio Turnover Ratio : 0.69 times
Company/Issuer Rating % to NAV
Dividend History : Refer page no. from 122 to 130
SIP Returns : Refer page no. from 118 to 120
Total Expense Ratio @@ :
IPVDF : 2.14% p. a.
IPVDF Direct Plan : 0.88% p. a.
Investment Objective : Refer page no. from 131 to 134
Notes:1. Different plans shall have different expense structure. The performance details provided herein are of ICICI Prudential Value Discovery Fund.2. The scheme is currently managed by Mrinal Singh. Mr. Mrinal Singh has been managing this fund since Feb 2011. Total Schemes managed by the Fund Manager . Refer annexure from page no. 91 for performance of other schemes currently managed by Mrinal is 15 (14 are jointly managed [Excludes FoF Schemes]) Singh.3. Date of inception:16-Aug-04.4. Past performance may or may not be sustained in future and the same may not necessarily provide the basis for comparison with other investment.5. Load is not considered for computation of returns.6. In case, the start/end date of the concerned period is a nonbusiness date (NBD), the NAV of the previous date is considered for computation of returns. The NAV per unit shown in the table is as on the start date of the said period
Scheme
Nifty 50 Index (Additional Benchmark)
NAV (Rs.) Per Unit (as on April 28,2017 : 134.19)
CAGR (%)
10.00
S&P BSE 500 Index (Benchmark)
Since inception
CurrentValue of
Investment of Rs. 10000
CAGR (%) Current Value of
Investment of Rs. 10000
1 Year 3 Year 5 Year
CAGR (%) Current Value of
Investment of Rs. 10000
CAGR (%) Current Value of
Investment of Rs. 10000
112.20 71.04 49.40
Particulars
19.66 11959.89 23.64 18889.36 22.14 27163.97 22.67 134190.00
24.80 12472.70 15.89 15558.63 14.15 19376.31 15.61 63194.68
18.58 11852.59 11.60 13894.11 12.14 17728.25 14.86 58181.22

16
**In addition to the fund manager managing this fund, the ADR/GDR exposure is managed by Mr. Ihab Dalwai.@@ Total Expense Ratio is weighted average for the month. Ratio excludes service tax on management fees and includes B-15 clawback reversal, if any.## Minimum number of installments for monthly frequency will be 6 and for Quarterly frequency will be 4. w.e.f February 01, 2017.* Minimum number of installments for daily, weekly and monthly frequency will be 6 and for Quarterly frequency will be 4. w.e.f February 01, 2017. Refer page No. 137 for definition of Flex STP and Value STP.&&
Minimum number of installments for both monthly and quarterly will be 2. w.e.f February 01, 2017.*** In case the unit holder has opted for dividend payout option, the minimum amount for dividend payout shall be 100 (net of dividend distribution tax and other statutory levy, if any), else the dividend would be mandatorily reinvested.
Refer Disclaimer of India Index Services & Products Limited (IISL) on page no. 120.
Quantitative Indicators
Style Box
Fund Details
Fund Managers** :
Mittul Kalawadia(Managing this fund since Apr, 2016 &Overall 10 years of experience)Mrinal Singh(Managing this fund since May 2011 &Overall 14 years of experience)
Indicative Investment Horizon: 5 years and above
Inception/Allotment date: 28-Oct-04
NAV (As on 28-Apr-17):IPMIDF Growth Option : 90.24IPMIDF Dividend Option : 27.19IPMIDF Direct Plan Growth Option : 93.47IPMIDF Direct Plan Dividend Option : 32.26
Options :Growth & Dividend(dividend payout*** and re-investment facility available)
Application Amount for freshSubscription :Rs.5,000 (plus in multiples of Re.1)
Min.Addl.Investment :Rs.1,000 (plus in multiples of Re.1)
Exit load for Redemption / Switch out:- Lumpsum & SIP / STP / SWP OptionWithin 1 Year from allotment - 1% ofapplicable NAV, more than 1 Year -Nil
##SIP :Monthly Frequency: Rs. 1,000/- and in multiple of Rs. 1/-Quarterly Frequency: Rs. 5,000/- and in multiple of Rs. 1/-
&&SWP :Rs. 500/- and in multiples of Rs. 1/-
STP/ Flex STP/ Value STP * :Daily Frequency: Rs. 250/- and in multiples of Rs. 50/-Weekly, Monthly and Quarterly Frequency: Rs. 1,000/- and in multiples of Rs. 1/-
Min.Redemption Amt. :500/- or all units where amount is below 500/-
Std Dev (Annualised) : 18.38% Sharpe Ratio : 1.14
Average P/E : 23.83 Average P/BV : 4.38 Average Dividend Yield : 1.15
Portfolio Beta : 1.03 R squared : 0.88
Portfolio turnover has been computed as the ratio of the lower value of purchase and sales, to the average net assets in the past one year (since inception for schemes that have not completed a year).The figures are not netted for derivative transactions. The Nifty Midcap 100 Index has been renamed to Nifty Free Float Midcap 100 with effect from 01 April 2016 as per NSE circular dated 28 March 2016Risk-free rate based on the last Overnight MIBOR cut-off of 6.18%
• Top Ten Holdings
Portfolio as on April 30, 2017
Returns of ICICI Prudential Midcap Fund - Growth Option as on April 30, 2017 - (IPMIDF)
Monthly AAUM as on 30-Apr-17 : Rs. 1251.10 crores
Closing AUM as on 30-Apr-17 : Rs. 1271.74 crores
Auto Ancillaries 6.27%• Exide Industries Ltd. 3.30% Endurance Technologies Pvt. Ltd. 2.01% Precision Camshafts Ltd. 0.96% Banks 10.44%• The Jammu & Kashmir Bank Ltd. 3.68%• HDFC Bank Ltd. 3.06% The South Indian Bank Ltd. 2.17% Karur Vysya Bank Ltd. 1.53% Cement 3.79% Shree Cements Ltd. 1.67% Sagar Cements Ltd. 1.34% JK Cement Ltd. 0.78% Chemicals 6.20%• Tata Chemicals Ltd. 3.80% Clariant Chemicals (India) Ltd. 1.36% Deepak Nitrite Ltd. 1.03% Construction Project 11.14%• Engineers India Ltd. 3.99%• Ashoka Buildcon Ltd. 3.39% NCC Ltd. 2.56% GMR Infrastructure Ltd. 0.76% Gammon Infrastructure Projects Ltd. 0.44% Consumer Durables 4.59% Bata India Ltd. 2.34% Sheela Foam Ltd. 1.15% Orient Paper & Industries Ltd. 1.10% Consumer Non Durables 1.99% United Spirits Ltd. 1.13% Manpasand Beverages Ltd. 0.86% Ferrous Metals 0.11% Tata Metaliks Ltd. 0.11% Finance 8.51%• Bajaj Finserv Ltd. 5.71% Bharat Financial Inclusion Ltd. 2.80% Gas 7.21%• Petronet LNG Ltd. 5.31% Indraprastha Gas Ltd. 1.90% Industrial Capital Goods 1.34% Bharat Electronics Ltd. 1.34%
Industrial Products 5.79%• Elgi Equipments Ltd. 3.31% FAG Bearings India Ltd. 2.48% Media & Entertainment 2.08% Inox Leisure Ltd. 1.17% Music Broadcast Ltd. 0.90% Non - Ferrous Metals 2.66% Hindalco Industries Ltd. 2.66% Pesticides 1.33% Rallis India Ltd. 1.33% Petroleum Products 1.52% Castrol India Ltd. 1.52% Pharmaceuticals 6.87% Unichem Laboratories Ltd. 2.41% IPCA Laboratories Ltd. 2.38% Cipla Ltd. 2.08% Power 0.32% Ksk Energy Ventures Ltd. 0.32% Retailing 3.01%• Avenue Supermarts Ltd. 3.01% Services 1.42% Thomas Cook (India) Ltd. 1.42% Software 3.17% Persistent Systems Ltd. 1.50% Larsen & Toubro Infotech Ltd. 0.98% Mphasis Ltd. 0.69% Textile Products 2.63% Welspun India Ltd. 2.14% Mayur Uniquoters Ltd. 0.48% Transportation 1.46% Gujarat Pipavav Port Ltd. 1.46% Short Term Debt and net current assets 6.15% Total Net Assets 100.00%
ICICI Prudential Midcap FundAn Open Ended Diversified Equity Fund
Company/Issuer % to NAVCompany/Issuer % to NAV
Benchmark Std Dev (Annualised) : 16.83%
Entry load : Nil
RiskometerThis Product is suitable for investors who are seeking*:
• Long term wealth creation solution
• An equity fund that aims for capital appreciation by investing in mid cap stocks.
*Investors should consult their financial advisers if in doubt about whether the product is suitable for them.
Annual Portfolio Turnover Ratio : Equity - 0.45 times, Others (Debt and Derivatives) - 0.16 times Combined Annual Portfolio Turnover Ratio : 0.61 times
Dividend History : Refer page no. from 122 to 130
SIP Returns : Refer page no. from 118 to 120
Total Expense Ratio @@ :
IPMIDF : 2.40% p. a.
IPMIDF Direct Plan : 1.27% p. a.
Investment Objective : Refer page no. from 131 to 134
Notes:1. Different plans shall have different expense structure. The performance details provided herein are of ICICI Prudential Midcap Fund.2. The scheme is currently managed by Mittul Kalawadia and Mrinal Singh. Mr. Mittul Kalawadia has been managing this fund since Apr 2016. Total Schemes managed by the Fund Manager is 8 (8 are jointly managed). Refer annexure from page no. 91 for performance of other schemes currently managed by Mittul Kalawadia.Mr. Mrinal Singh has been managing this fund since May 2011. Total Schemes managed by the Fund Manager is 15 (14 are jointly managed [Excludes FoF Schemes]). Refer annexure from page no. 91 for performance of other schemes currently managed by Mrinal Singh .3. Date of inception: 28-Oct-04.4. Past performance may or may not be sustained in future and the same may not necessarily provide the basis for comparison with other investment.5. Load is not considered for computation of returns.6. In case, the start/end date of the concerned period is a nonbusiness date (NBD), the NAV of the previous date is considered for computation of returns. The NAV per unit shown in the table is as on the start date of the said period
Scheme
Nifty 50 Index (Additional Benchmark)
NAV (Rs.) Per Unit (as onApril 28,2017 : 90.24)
CAGR (%)
10.00
Nifty Free Float Midcap 100 Index (Benchmark)
Since inception
CurrentValue of
Investment of Rs. 10000
CAGR (%) Current Value of
Investment of Rs. 10000
1 Year 3 Year 5 Year
CAGR (%) Current Value of
Investment of Rs. 10000
CAGR (%) Current Value of
Investment of Rs. 10000
66.87 42.35 31.33
Particulars
35.06 13494.84 28.71 21308.15 23.58 28803.06 19.23 90240.00
37.19 13706.74 27.25 20591.04 19.35 24208.71 17.76 77245.65
18.58 11852.59 11.60 13894.11 12.14 17728.25 14.04 51686.30

17
Fund Details
Portfolio as on April 30, 2017
Style Box
Quantitative Indicators
Returns of ICICI Prudential Infrastructure Fund - Growth Option as on April 30, 2017 - (IPIF)
Fund Managers** :
Sankaran Naren(Managing this fund since Dec, 2015 &Overall 26 years of experience)Atul Patel(Managing this fund since Aug, 2016 &Overall 7 years of experience)
Indicative Investment Horizon: 5 years and above
Inception/Allotment date: 31-Aug-05
NAV (As on 28-Apr-17):IPIF Growth Option : 48.79IPIF Dividend Option : 15.03IPIF Direct Plan Growth Option : 50.14IPIF Direct Plan Dividend Option : 17.54
Options :Growth & Dividend(dividend payout*** and re-investment facility available)
Application Amount for freshSubscription :Rs.5,000 (plus in multiples of Re.1)
Min.Addl. Investment :Rs.1,000 (plus in multiples of Re.1)
Exit load for Redemption / Switch out:- Lumpsum & SIP / STP / SWP OptionUpto 1 Year from allotment - 1% of ap-plicable NAV, more than 1 Year - Nil
##SIP :Monthly Frequency: Rs. 1,000/- and in multiple of Rs. 1/-Quarterly Frequency: Rs. 5,000/- and in multiple of Rs. 1/-
&&SWP :Rs. 500/- and in multiples of Rs. 1/-
STP/ Flex STP/ Value STP * :Daily Frequency: Rs. 250/- and in multiples of Rs. 50/-Weekly, Monthly and Quarterly Frequency: Rs. 1,000/- and in multiples of Rs. 1/-
Min.Redemption Amt. :500/- or all units where amount is below 500/-
• Top Ten HoldingsDerivatives are considered at exposure value.
Std Dev (Annualised) : 21.27% Sharpe Ratio : 0.62
Average P/E : 20.50 Average P/BV : 2.76 Average Dividend Yield : 1.49
Portfolio Beta : 0.89 R squared : 0.87
Portfolio turnover has been computed as the ratio of the lower value of purchase and sales, to the average net assets in the past one year (since inception for schemes that have not completed a year). The figures are not netted for derivative transactions.Risk-free rate based on the last Overnight MIBOR cut-off of 6.18%**In addition to the fund manager managing this fund, the ADR/GDR exposure is managed by Mr. Ihab Dalwai.@@ Total Expense Ratio is weighted average for the month. Ratio excludes service tax on management fees and includes B-15 clawback reversal, if any.## Minimum number of installments for monthly frequency will be 6 and for Quarterly frequency will be 4. w.e.f February 01, 2017.* Minimum number of installments for daily, weekly and monthly frequency will be 6 and for Quarterly frequency will be 4. w.e.f February 01, 2017. Refer page No. 137 for definition of Flex STP and Value STP.&&
Minimum number of installments for both monthly and quarterly will be 2. w.e.f February 01, 2017.*** In case the unit holder has opted for dividend payout option, the minimum amount for dividend payout shall be 100 (net of dividend distribution tax and other statutory levy, if any), else the dividend would be mandatorily reinvested.
Monthly AAUM as on 30-Apr-17 : Rs. 1550.47 crores
Closing AUM as on 30-Apr-17 : Rs. 1590.38 crores
ICICI Prudential Infrastructure FundAn Open Ended Equity Fund
Benchmark Std Dev (Annualised) : 22.22%
Entry load : Nil
RiskometerThis Product is suitable for investors who are seeking*:
• Long term wealth creation solution
• An equity fund that aims for growth by primarily investing in securities of companies belonging to infrastructure and allied sectors.
*Investors should consult their financial advisers if in doubt about whether the product is suitable for them.
Annual Portfolio Turnover Ratio : Equity - 0.81 times, Others (Debt and Derivatives) - 0.51 times Combined Annual Portfolio Turnover Ratio : 1.32 times
Dividend History : Refer page no. from 122 to 130
SIP Returns : Refer page no. from 118 to 120
Total Expense Ratio @@ :
IPIF : 2.35% p. a.
IPIF Direct Plan : 1.63% p. a.
Investment Objective : Refer page no. from 131 to 134
Banks 9.46% 0.34%• ICICI Bank Ltd. 7.47% Axis Bank Ltd. 1.28% State Bank Of India 0.72% State Bank Of India - Futures 0.34% Cement 3.73% JK Lakshmi Cement Ltd. 2.46% Orient Cement Ltd. 1.27% Construction 8.02% KNR Constructions Ltd. 3.03% ITD Cementation India Ltd. 2.31% Brigade Enterprises Ltd. 2.15% IRB Infrastructure Developers Ltd. 0.53% Construction Project 12.60% • Larsen & Toubro Ltd. 5.38% • Ashoka Buildcon Ltd. 4.03% NCC Ltd. 1.28% Supreme Infrastructure India Ltd. 0.70% Sadbhav Engineering Ltd. 0.52% Gammon Infrastructure Projects Ltd. 0.38% Voltas Ltd. 0.32% Ferrous Metals 0.48% 2.56% Tata Steel Ltd. 0.48% Tata Steel Ltd. - Futures 2.56% Finance 2.33% IDFC Ltd. 1.33% BSE Ltd. 1.00% Gas 1.44% GAIL (India) Ltd. 1.44% Industrial Capital Goods 3.22% Triveni Turbine Ltd. 1.30% TD Power Systems Ltd. 0.86% Thermax Ltd. 0.74% Easun Reyrolle Ltd. 0.33% Industrial Products 3.55% FAG Bearings India Ltd. 2.74% WPIL Ltd. 0.81% Minerals/Mining 5.39% • Coal India Ltd. 3.99% Gujarat Mineral Development Corporation Ltd. 1.39%
Non - Ferrous Metals 1.06% Hindalco Industries Ltd. 1.06% Petroleum Products 1.10% Indian Oil Corporation Ltd. - Futures 1.10% Power 20.78% • Power Grid Corporation Of India Ltd. 5.89% • Kalpataru Power Transmission Ltd. 4.88% • Tata Power Company Ltd. 4.56% NTPC Ltd. 3.16% CESC Ltd. 1.75% Gujarat Industries Power Company Ltd. 0.34% Ksk Energy Ventures Ltd. 0.21% Telecom - Equipment & Accessories 1.21% Astra Microwave Products Ltd. 1.21% Telecom - Services 6.54% • Bharti Airtel Ltd. 6.54% Transportation 10.83% • Gujarat Pipavav Port Ltd. 3.82% • Container Corporation Of India Ltd. 3.68% The Great Eastern Shipping Company Ltd. 1.91% Gateway Distriparks Ltd. 1.42% Short Term Debt and net current assets 5.34% Total Net Assets 100.00%
Company/Issuer % to % to NAV NAV Derivatives
Company/Issuer % to % to NAV NAV Derivatives
Notes:1. Different plans shall have different expense structure. The performance details provided herein are of ICICI Prudential Infrastructure Fund.2. The scheme is currently managed by Sankaran Naren and Atul Patel. Mr. Sankaran Naren has been managing this fund since Dec 2015. Total Schemes managed by the Fund Manager . Refer annexure from page no. 91 for performance of other schemes currently managed by Sankaran is 14 (14 are jointly managed) Naren.Mr. Atul Patel has been managing this fund since Aug 2016 . Total Schemes managed by the Fund Manager is 14 (13 are jointly managed). Refer annexure from page no. 91 for performance of other schemes currently managed by Atul Patel .3. Date of inception:31-Aug-05.4. Past performance may or may not be sustained in future and the same may not necessarily provide the basis for comparison with other investment.5. Load is not considered for computation of returns.6. In case, the start/end date of the concerned period is a nonbusiness date (NBD), the NAV of the previous date is considered for computation of returns. The NAV per unit shown in the table is as on the start date of the said period
Scheme
Nifty 50 Index (Additional Benchmark)
NAV (Rs.) Per Unit (as on April 28,2017 : 48.79)
CAGR (%)
10.00
Nifty Infrastructure Index (Benchmark)
Since inception
CurrentValue of
Investment of Rs. 10000
CAGR (%) Current Value of
Investment of Rs. 10000
1 Year 3 Year 5 Year
CAGR (%) Current Value of
Investment of Rs. 10000
CAGR (%) Current Value of
Investment of Rs. 10000
36.91 29.27 24.69
Particulars
32.29 13218.64 18.59 16668.94 14.60 19761.04 14.55 48790.00
23.45 12338.01 7.65 12474.18 6.62 13776.87 5.51 18698.37
18.58 11852.59 11.60 13894.11 12.14 17728.25 12.38 39016.42

18
Fund Details
Quantitative Indicators
Style Box
Company/Issuer % to NAV
Fund Managers** :
Mr. Ashwin Jain (Managing this fund since Oct, 2016 & Overall 9 years of experience)
Indicative Investment Horizon: 5 yearsand above
Inception/Allotment date: 03-Mar-00
Monthly AAUM as on 30-Apr-17 : Rs. 261.09 crores
Closing AUM as on 30-Apr-17 : Rs. 249.24 crores
NAV (As on 28-Apr-17):IPTF Growth Option : 39.07IPTF Dividend Option : 26.28IPTF Direct Plan Growth Option : 40.32IPTF Direct Plan Dividend Option : 37.68
Options :Growth & Dividend(dividend payout*** and re-investment facility available)
Application Amount for freshSubscription :Rs.5,000 (plus in multiples of Re.1)
Min.Addl.Investment :Rs.1,000 (plus in multiples of Re.1)
Exit load for Redemption / Switchout :- Lumpsum & SIP / STP / SWP OptionUpto 1 Year from allotment - 1% ofapplicable NAV, more than 1 Year - Nil
SIP :##
Monthly Frequency: Rs. 1,000/- and in multiple of Rs. 1/-Quarterly Frequency: Rs. 5,000/- and in multiple of Rs. 1/-
&&SWP :Rs. 500/- and in multiples of Rs. 1/-
STP/ Flex STP/ Value STP * :Daily Frequency: Rs. 250/- and in multiples of Rs. 50/-Weekly, Monthly and Quarterly Frequency: Rs. 1,000/- and in multiples of Rs. 1/-
Min.Redemption Amt. : 500/- or all units where amount is below 500/- Std Dev (Annualised) : 16.30% Sharpe Ratio : 0.22
Average P/E : 16.31 Average P/BV : 3.48 Average Dividend Yield : 2.17
Portfolio Beta : 0.87 R squared : 0.90
Portfolio turnover has been computed as the ratio of the lower value of purchase and sales, to the average net assets in the past one year (since inception for schemes that have not completed a year). The figures are not netted for derivative transactions.The S&P BSE IT index has been replaced with new index, namely S&P BSE Information Technology vide a press release by BSE and S&P Dow Jones Indices. Risk-free rate based on the last Overnight MIBOR cut-off of 6.18%**In addition to the fund manager managing this fund, the ADR/GDR exposure is managed by Mr. Ihab Dalwai.@@ Total Expense Ratio is weighted average for the month. Ratio excludes service tax on management fees and includes B-15 clawback reversal, if any.## Minimum number of installments for monthly frequency will be 6 and for Quarterly frequency will be 4. w.e.f February 01, 2017.* Minimum number of installments for daily, weekly and monthly frequency will be 6 and for Quarterly frequency will be 4. w.e.f February 01, 2017. Refer page No. 137 for definition of Flex STP and Value STP.&& Minimum number of installments for both monthly and quarterly will be 2. w.e.f February 01, 2017.*** In case the unit holder has opted for dividend payout option, the minimum amount for dividend payout shall be 100 (net of dividend distribution tax and other statutory levy, if any), else the dividend would be mandatorily reinvested.
^ Value Less than 0.01% of NAV.
Portfolio as on April 30, 2017
Returns of ICICI Prudential Technology Fund - Growth Option as on April 30, 2017 - (IPTF)
Software 94.72%Infosys Ltd. 22.69%HCL Technologies Ltd. 13.36%Wipro Ltd. 11.55%Tech Mahindra Ltd. 10.37%Larsen & Toubro Infotech Ltd. 9.66%Cyient Ltd. 9.23%Oracle Financial Services Software Ltd. 8.80%Nucleus Software Exports Ltd. 5.16%Mindtree Ltd. 3.89%Ampersand Software Applications Ltd. ^SIP Technologies & Exports Ltd. ^Short Term Debt and net current assets 5.28%Total Net Assets 100.00%
ICICI Prudential Technology FundAn Open Ended Equity Fund
Benchmark Std Dev (Annualised) : 17.76%
Entry load : Nil
Riskometer
• Long term wealth creation solution
• An equity fund that predominantly invests in equity and equity related securities of technology and technology dependent companies.
*Investors should consult their financial advisers if in doubt about whether the product is suitable for them.
This Product is suitable for investors who are seeking*:
Annual Portfolio Turnover Ratio : Equity - 0.30 times, Others (Debt and Derivatives) - 0.00 times Combined Annual Portfolio Turnover Ratio : 0.30 times
Dividend History : Refer page no. from 122 to 130
SIP Returns : Refer page no. from 118 to 120
Total Expense Ratio @@ :
IPTF : 2.66% p. a.
IPTF Direct Plan : 1.97% p. a.
Investment Objective : Refer page no. from 131 to 134
Mr. Manish Gunwani (Managing this fund since Oct, 2016 & Overall 20 years of experience)
Notes:1. Different plans shall have different expense structure. The performance details provided herein are of ICICI Prudential Technology Fund.2. The scheme is currently managed by Manish Gunwani and Ashwin Jain. Mr. Manish Gunwani has been managing this fund since Oct 2016. Total Schemes managed by the Fund Manager Refer annexure from page no. 91 for performance of other schemes currently managed by Manish is 12 (11 are jointly managed).Gunwani.Mr. Ashwin Jain has been managing this fund since Oct 2016. Total Schemes managed by the Fund Manager ). Refer annexure from is 3 (3 are jointly managedpage no. 91 for performance of other schemes currently managed by Ashwin Jain. 3. Date of inception: 03-Mar-00.4. Past performance may or may not be sustained in future and the same may not necessarily provide the basis for comparison with other investment.5. Load is not considered for computation of returns.6. In case, the start/end date of the concerned period is a nonbusiness date (NBD), the NAV of the previous date is considered for computation of returns. The NAV per unit shown in the table is as on the start date of the said period
Scheme
Nifty 50 Index (Additional Benchmark)
NAV (Rs.) Per Unit (as on April 28,2017 : 39.07)
CAGR (%)
10.00
S&P BSE Information Technology (Benchmark)
Since inception
CurrentValue of
Investment of Rs. 10000
CAGR (%) Current Value of
Investment of Rs. 10000
1 Year 3 Year 5 Year
CAGR (%) Current Value of
Investment of Rs. 10000
CAGR (%) Current Value of
Investment of Rs. 10000
41.65 30.34 18.36
Particulars
-6.21 9380.55 8.80 12877.39 16.31 21279.96 8.26 39070.00
-15.14 8489.71 3.20 10990.90 11.02 16862.67 1.59 13101.07
18.58 11852.59 11.60 13894.11 12.14 17728.25 10.58 56183.88

19
Fund Details
Quantitative Indicators
Style Box
Company/Issuer % to NAV
Fund Managers** :
Vinay Sharma (Managing this fund since Apr, 2014 &Overall 11 years of experience)
Indicative Investment Horizon: 5 yearsand above
Inception/Allotment date: 31-Mar-99
Monthly AAUM as on 30-Apr-17 :Rs. 302.4 crores
Closing AUM as on 30-Apr-17 : Rs. 304.2 crores
NAV (As on 28-Apr-17):IPFF Growth Option : 191.34IPFF Dividend Option : 68.84IPFF Direct Plan Growth Option : 196.76IPFF Direct Plan Dividend Option : 92.78
Options :Growth & Dividend(dividend payout*** and re-investment facility available)
Application Amount for freshSubscription :Rs.5,000 (plus in multiples of Re.1)
Min.Addl.Investment :Rs.1,000 (plus in multiples of Re.1)
Exit load for Redemption / Switchout :- Lumpsum & SIP / STP / SWP OptionUpto 1 Year from allotment - 1% ofapplicable NAV, more than 1 Year - Nil
SIP :##
Monthly Frequency: Rs. 1,000/- and in multiple of Rs. 1/-Quarterly Frequency: Rs. 5,000/- and in multiple of Rs. 1/-
&&SWP :Rs. 500/- and in multiples of Rs. 1/-
STP/ Flex STP/ Value STP * :Daily Frequency: Rs. 250/- and in multiples of Rs. 50/-Weekly, Monthly and Quarterly Frequency: Rs. 1,000/- and in multiples of Rs. 1/-
Min.Redemption Amt. :500/- or all units where amount is below 500/-
Portfolio turnover has been computed as the ratio of the lower value of purchase and sales, to the average net assets in the past one year (since inception for schemes that have not completed a year). The figures are not netted for derivative transactions.Risk-free rate based on the last Overnight MIBOR cut-off of 6.18%
**In addition to the fund manager managing this fund, the ADR/GDR exposure is managed by Mr. Ihab Dalwai.@@ Total Expense Ratio is weighted average for the month. Ratio excludes service tax on management fees and includes B-15 clawback reversal, if any.## Minimum number of installments for monthly frequency will be 6 and for Quarterly frequency will be 4. w.e.f February 01, 2017.* Minimum number of installments for daily, weekly and monthly frequency will be 6 and for Quarterly frequency will be 4. w.e.f February 01, 2017. Refer page No. 137 for definition of Flex STP and Value STP.&& Minimum number of installments for both monthly and quarterly will be 2. w.e.f February 01, 2017.
*** In case the unit holder has opted for dividend payout option, the minimum amount for dividend payout shall be 100 (net of dividend distribution tax and other statutory levy, if any), else the dividend would be mandatorily reinvested.
Std Dev (Annualised) : 13.19% Sharpe Ratio : 0.75
Average P/E : 38.14 Average P/BV : 12.31 Average Dividend Yield : 1.22
Portfolio Beta : 0.89 R squared : 0.83
• Top Ten Holdings
Portfolio as on April 30, 2017
Returns of ICICI Prudential FMCG Fund - Growth Option as on April 30, 2017 - (IPFF)
Chemicals 4.43%
• Pidilite Industries Ltd. 4.43%
Consumer Durables 10.04%
• Bata India Ltd. 3.20%
V.I.P. Industries Ltd. 3.05%
Sheela Foam Ltd. 2.34%
Titan Company Ltd. 1.02%
La Opala RG Ltd. 0.43%
Consumer Non Durables 76.74%
• ITC Ltd. 31.15%
• Hindustan Unilever Ltd. 5.57%
• Jubilant Foodworks Ltd. 5.55%
• Britannia Industries Ltd. 4.33%
• Manpasand Beverages Ltd. 4.19%
• Nestle India Ltd. 3.90%
• Bajaj Corp Ltd. 3.82%
• Procter & Gamble Hygiene and Health Care Ltd. 3.15%
Eveready Industries (India) Ltd. 3.15%
Colgate - Palmolive (India) Ltd. 3.13%
SH Kelkar & Co. Ltd. 1.86%
Dabur India Ltd. 1.68%
Coffee Day Enterprises Pvt. Ltd. 1.63%
Emami Ltd. 1.59%
Glaxosmithkline Consumer Healthcare Ltd. 1.11%
Asian Paints Ltd. 0.93%
Retailing 3.86%
Trent Ltd. 2.25%
Aditya Birla Fashion and Retail Ltd. 1.62%
Short Term Debt and net current assets 4.93%
Total Net Assets 100.00%
ICICI Prudential FMCG FundAn Open Ended Equity Fund
Benchmark Std Dev (Annualised) : 13.46%
Entry load : Nil
Riskometer
• Long term wealth creation solution
• An equity fund that primarily invests in a select group of companies in the FMCG sector.
*Investors should consult their financial advisers if in doubt about whether the product is suitable for them.
This Product is suitable for investors who are seeking*:
Annual Portfolio Turnover Ratio : Equity - 0.28 times, Others (Debt and Derivatives) - 0.00 times Combined Annual Portfolio Turnover Ratio : 0.28 timesDividend History : Refer page no. from 122 to 130
SIP Returns : Refer page no. from 118 to 120
Total Expense Ratio @@ :
IPFF : 2.64% p. a.
IPFF Direct Plan : 2.17% p. a.
Investment Objective : Refer page no. from 131 to 134
Notes:1. Different plans shall have different expense structure. The performance details provided herein are of ICICI Prudential FMCG Fund.2. The scheme is currently managed by Vinay Sharma. Mr. Vinay Sharma has been managing this fund since Apr 2014. Total Schemes managed by the Fund Manager Refer annexure from page no. 91 for performance of other schemes currently managed by Vinay Sharma.is 9 (7 are jointly managed).3. Date of inception:31-Mar-99.4. Past performance may or may not be sustained in future and the same may not necessarily provide the basis for comparison with other investment.5. Load is not considered for computation of returns.6. In case, the start/end date of the concerned period is a nonbusiness date (NBD), the NAV of the previous date is considered for computation of returns. The NAV per unit shown in the table is as on the start date of the said period
Scheme
Nifty 50 Index (Additional Benchmark)
NAV (Rs.) Per Unit (as on April 28,2017 : 191.34)
CAGR (%)
10.00
Nifty FMCG Index (Benchmark)
Since inception
CurrentValue of
Investment of Rs. 10000
CAGR (%) Current Value of
Investment of Rs. 10000
1 Year 3 Year 5 Year
CAGR (%) Current Value of
Investment of Rs. 10000
CAGR (%) Current Value of
Investment of Rs. 10000
157.89 121.55 91.12
Particulars
21.25 12118.56 16.34 15741.67 16.00 20998.68 17.72 191340.00
20.01 11995.01 10.46 13472.41 14.30 19502.22 11.72 74208.41
18.58 11852.59 11.60 13894.11 12.14 17728.25 12.65 86304.44
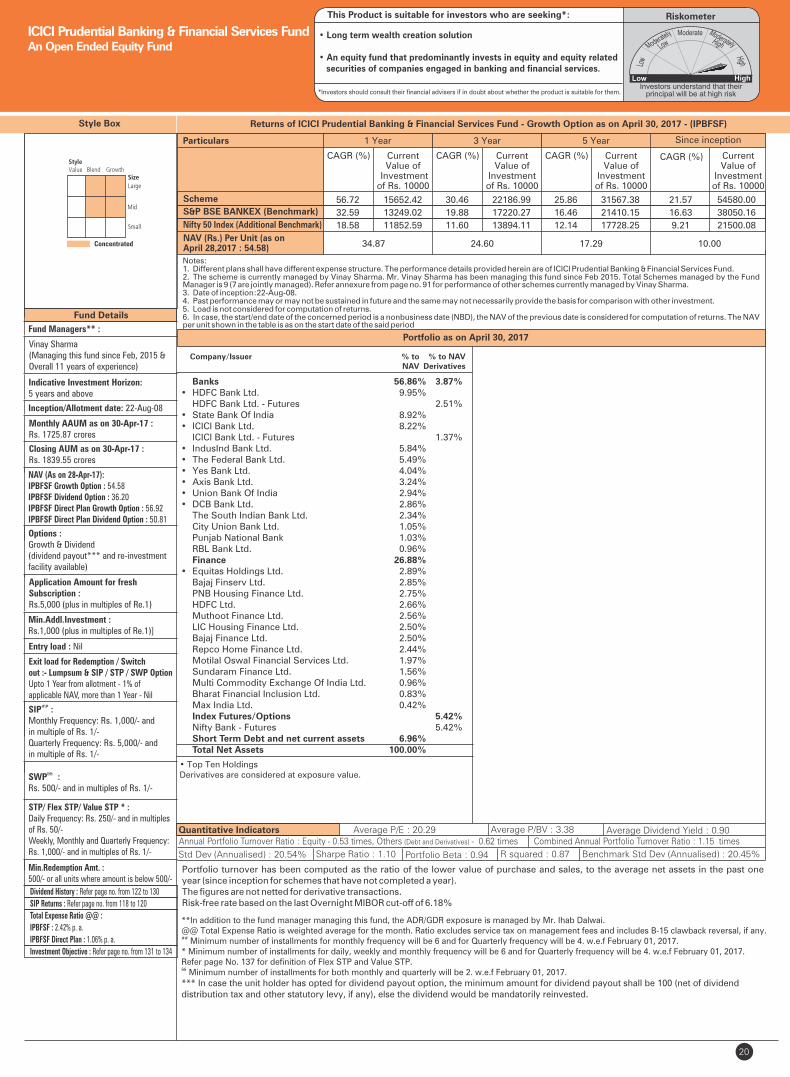
20
Fund Details
Quantitative Indicators
Portfolio turnover has been computed as the ratio of the lower value of purchase and sales, to the average net assets in the past one year (since inception for schemes that have not completed a year). The figures are not netted for derivative transactions.Risk-free rate based on the last Overnight MIBOR cut-off of 6.18%
**In addition to the fund manager managing this fund, the ADR/GDR exposure is managed by Mr. Ihab Dalwai.@@ Total Expense Ratio is weighted average for the month. Ratio excludes service tax on management fees and includes B-15 clawback reversal, if any.##
Minimum number of installments for monthly frequency will be 6 and for Quarterly frequency will be 4. w.e.f February 01, 2017.* Minimum number of installments for daily, weekly and monthly frequency will be 6 and for Quarterly frequency will be 4. w.e.f February 01, 2017.Refer page No. 137 for definition of Flex STP and Value STP.&& Minimum number of installments for both monthly and quarterly will be 2. w.e.f February 01, 2017.
*** In case the unit holder has opted for dividend payout option, the minimum amount for dividend payout shall be 100 (net of dividend distribution tax and other statutory levy, if any), else the dividend would be mandatorily reinvested.
Fund Managers** :
Vinay Sharma(Managing this fund since Feb, 2015 &Overall 11 years of experience)
Indicative Investment Horizon: 5 years and above
Inception/Allotment date: 22-Aug-08
NAV (As on 28-Apr-17):IPBFSF Growth Option : 54.58IPBFSF Dividend Option : 36.20IPBFSF Direct Plan Growth Option : 56.92IPBFSF Direct Plan Dividend Option : 50.81
Options :Growth & Dividend(dividend payout*** and re-investment facility available)
Application Amount for freshSubscription :Rs.5,000 (plus in multiples of Re.1)
Min.Addl.Investment :Rs.1,000 (plus in multiples of Re.1)]
Exit load for Redemption / Switchout :- Lumpsum & SIP / STP / SWP OptionUpto 1 Year from allotment - 1% ofapplicable NAV, more than 1 Year - Nil
SIP :##
Monthly Frequency: Rs. 1,000/- and in multiple of Rs. 1/-Quarterly Frequency: Rs. 5,000/- and in multiple of Rs. 1/-
&&SWP :Rs. 500/- and in multiples of Rs. 1/-
STP/ Flex STP/ Value STP * :Daily Frequency: Rs. 250/- and in multiples of Rs. 50/-Weekly, Monthly and Quarterly Frequency: Rs. 1,000/- and in multiples of Rs. 1/-
Min.Redemption Amt. :500/- or all units where amount is below 500/-
Std Dev (Annualised) : 20.54% Sharpe Ratio : 1.10
Average P/E : 20.29 Average P/BV : 3.38 Average Dividend Yield : 0.90
Portfolio Beta : 0.94 R squared : 0.87
Style Box
Portfolio as on April 30, 2017
Returns of ICICI Prudential Banking & Financial Services Fund - Growth Option as on April 30, 2017 - (IPBFSF)
• Top Ten HoldingsDerivatives are considered at exposure value.
Concentrated
Monthly AAUM as on 30-Apr-17 :Rs. 1725.87 crores
ICICI Prudential Banking & Financial Services FundAn Open Ended Equity Fund
Closing AUM as on 30-Apr-17 : Rs. 1839.55 crores
Benchmark Std Dev (Annualised) : 20.45%
Entry load : Nil
RiskometerThis Product is suitable for investors who are seeking*:
• Long term wealth creation solution
• An equity fund that predominantly invests in equity and equity related securities of companies engaged in banking and financial services.
*Investors should consult their financial advisers if in doubt about whether the product is suitable for them.
Annual Portfolio Turnover Ratio : Equity - 0.53 times, Others (Debt and Derivatives) - 0.62 times Combined Annual Portfolio Turnover Ratio : 1.15 times
Dividend History : Refer page no. from 122 to 130
SIP Returns : Refer page no. from 118 to 120
Total Expense Ratio @@ :
IPBFSF : 2.42% p. a.
IPBFSF Direct Plan : 1.06% p. a.
Investment Objective : Refer page no. from 131 to 134
Banks 56.86% 3.87%• HDFC Bank Ltd. 9.95% HDFC Bank Ltd. - Futures 2.51%• State Bank Of India 8.92% • ICICI Bank Ltd. 8.22% ICICI Bank Ltd. - Futures 1.37%• IndusInd Bank Ltd. 5.84% • The Federal Bank Ltd. 5.49% • Yes Bank Ltd. 4.04% • Axis Bank Ltd. 3.24% • Union Bank Of India 2.94% • DCB Bank Ltd. 2.86% The South Indian Bank Ltd. 2.34% City Union Bank Ltd. 1.05% Punjab National Bank 1.03% RBL Bank Ltd. 0.96% Finance 26.88% • Equitas Holdings Ltd. 2.89% Bajaj Finserv Ltd. 2.85% PNB Housing Finance Ltd. 2.75% HDFC Ltd. 2.66% Muthoot Finance Ltd. 2.56% LIC Housing Finance Ltd. 2.50% Bajaj Finance Ltd. 2.50% Repco Home Finance Ltd. 2.44% Motilal Oswal Financial Services Ltd. 1.97% Sundaram Finance Ltd. 1.56% Multi Commodity Exchange Of India Ltd. 0.96% Bharat Financial Inclusion Ltd. 0.83% Max India Ltd. 0.42% Index Futures/Options 5.42% Nifty Bank - Futures 5.42% Short Term Debt and net current assets 6.96% Total Net Assets 100.00%
Company/Issuer % to % to NAV NAV Derivatives
Notes:1. Different plans shall have different expense structure. The performance details provided herein are of ICICI Prudential Banking & Financial Services Fund.2. The scheme is currently managed by Vinay Sharma. Mr. Vinay Sharma has been managing this fund since Feb 2015. Total Schemes managed by the Fund Manager Refer annexure from page no. 91 for performance of other schemes currently managed by Vinay Sharma.is 9 (7 are jointly managed).3. Date of inception:22-Aug-08.4. Past performance may or may not be sustained in future and the same may not necessarily provide the basis for comparison with other investment.5. Load is not considered for computation of returns.6. In case, the start/end date of the concerned period is a nonbusiness date (NBD), the NAV of the previous date is considered for computation of returns. The NAV per unit shown in the table is as on the start date of the said period
Scheme
Nifty 50 Index (Additional Benchmark)
NAV (Rs.) Per Unit (as on April 28,2017 : 54.58)
CAGR (%)
10.00
S&P BSE BANKEX (Benchmark)
Since inception
CurrentValue of
Investment of Rs. 10000
CAGR (%) Current Value of
Investment of Rs. 10000
1 Year 3 Year 5 Year
CAGR (%) Current Value of
Investment of Rs. 10000
CAGR (%) Current Value of
Investment of Rs. 10000
34.87 24.60 17.29
Particulars
56.72 15652.42 30.46 22186.99 25.86 31567.38 21.57 54580.00
32.59 13249.02 19.88 17220.27 16.46 21410.15 16.63 38050.16
18.58 11852.59 11.60 13894.11 12.14 17728.25 9.21 21500.08

21
Fund Managers** :
Manish Gunwani(Managing this fund since Dec, 2015 &Overall 20 years of experience)Ashwin Jain(Managing this fund since Aug, 2016 &Overall 9 years of experience)
Indicative Investment Horizon: 5 yearsand above
Inception/Allotment date: 30-Nov-05
NAV (As on 28-Apr-17):IPEOSF Growth Option : 52.62IPEOSF Dividend Option : 28.17IPEOSF Direct Plan Growth Option : 54.22IPEOSF Direct Plan Dividend Option : 39.00
Application Amount for freshSubscription :Rs.5,000 (plus in multiples of Re.1)
Min.Addl.Investment :Rs.1,000 (plus in multiples of Re.1)
Exit load for Redemption / Switchout :- Lumpsum & SIP / STP / SWP OptionUpto 1 Year from allotment - 1% ofapplicable NAV, more than 1 Year - Nil
SIP :##
Monthly Frequency: Rs. 1,000/- and in multiple of Rs. 1/-Quarterly Frequency: Rs. 5,000/- and in multiple of Rs. 1/-
&&SWP :Rs. 500/- and in multiples of Rs. 1/-
STP/ Flex STP/ Value STP * :Daily Frequency: Rs. 250/- and in multiples of Rs. 50/-Weekly, Monthly and Quarterly Frequency: Rs. 1,000/- and in multiples of Rs. 1/-
Min.Redemption Amt. :500/- or all units where amount is below 500/-
Portfolio turnover has been computed as the ratio of the lower value of purchase and sales, to the average net assets in the past one year (since inception for schemes that have not completed a year). The figures are not netted for derivative transactions.Risk-free rate based on the last Overnight MIBOR cut-off of 6.18%**In addition to the fund manager managing this fund, the ADR/GDR exposure is managed by Mr. Ihab Dalwai.@@ Total Expense Ratio is weighted average for the month. Ratio excludes service tax on management fees and includes B-15 clawback reversal, if any.## Minimum number of installments for monthly frequency will be 6 and for Quarterly frequency will be 4. w.e.f February 01, 2017.* Minimum number of installments for daily, weekly and monthly frequency will be 6 and for Quarterly frequency will be 4. w.e.f February 01, 2017. Refer page No. 137 for definition of Flex STP and Value STP.&& Minimum number of installments for both monthly and quarterly will be 2. w.e.f February 01, 2017.*** In case the unit holder has opted for dividend payout option, the minimum amount for dividend payout shall be 100 (net of dividend distribution tax and other statutory levy, if any), else the dividend would be mandatorily reinvested.
Std Dev (Annualised) : 13.98% Sharpe Ratio : 1.07
Average P/E : 27.74 Average P/BV : 4.68 Average Dividend Yield : 0.81
Portfolio Beta : 0.58 R squared : 0.39
Style Box
• Top Ten Holdings
Portfolio as on April 30, 2017
Returns of ICICI Prudential Exports and Other Services Fund - Growth Option as on April 30, 2017 - (IPEOSF)
Monthly AAUM as on 30-Apr-17 : Rs. 651.09 crores
Closing AUM as on 30-Apr-17 :Rs. 647.17 crores
Auto Ancillaries 5.83%
• Motherson Sumi Systems Ltd. 5.45%
Precision Camshafts Ltd. 0.39%
Banks 7.70%
• ICICI Bank Ltd. 4.00%
Oriental Bank Of Commerce 3.70%
Construction 7.87%
• Godrej Properties Ltd. 5.60%
Brigade Enterprises Ltd. 2.26%
Finance 4.42%
• IDFC Ltd. 4.42%
Healthcare Services 5.13%
• Narayana Hrudayalaya Ltd. 5.13%
Hotels, Resorts And Other Recreational Activities 2.76%
The Indian Hotels Company Ltd. 2.76%
Media & Entertainment 5.55%
PVR Ltd. 3.59%
Inox Leisure Ltd. 1.96%
Pharmaceuticals 20.35%
• Astrazeneca Pharma India Ltd. 4.84%
Cipla Ltd. 3.70%
Pfizer Ltd. 3.48%
Abbott India Ltd. 2.35%
Lupin Ltd. 2.04%
IPCA Laboratories Ltd. 2.03%
Unichem Laboratories Ltd. 1.90%
Retailing 3.49%
Trent Ltd. 3.49%
Software 12.97%
• HCL Technologies Ltd. 6.04%
• Tech Mahindra Ltd. 4.42%
Larsen & Toubro Infotech Ltd. 2.52%
Transportation 20.29%
• Spicejet Ltd. 7.87%
• VRL Logistics Ltd. 6.71%
Container Corporation Of India Ltd. 3.05%
Gujarat Pipavav Port Ltd. 2.66%
Short Term Debt and net current assets 3.65%
Total Net Assets 100.00%
ICICI Prudential Exports and Other Services FundAn Open Ended Equity Fund
Company/Issuer % to NAV Company/Issuer % to NAV
Benchmark Std Dev (Annualised) : 15.01%
Entry load : Nil
RiskometerThis Product is suitable for investors who are seeking*:
• Long term wealth creation solution
• An equity fund that aims for growth by predominantly investing in companies belonging to the service industry.
*Investors should consult their financial advisers if in doubt about whether the product is suitable for them.
Annual Portfolio Turnover Ratio : Equity - 0.51 times, Others (Debt and Derivatives) - 0.14 times Combined Annual Portfolio Turnover Ratio : 0.65 times
Options :Growth & Dividend(dividend payout*** and re-investment facility available)
Dividend History : Refer page no. from 122 to 130
SIP Returns : Refer page no. from 118 to 120
Total Expense Ratio @@ :
IPEOSF : 2.47% p. a.
IPEOSF Direct Plan : 1.96% p. a.
Investment Objective : Refer page no. from 131 to 134
Notes:1. Different plans shall have different expense structure. The performance details provided herein are of ICICI Prudential Exports and Other Services Fund.2. The scheme is currently managed by Manish Gunwani and Ashwin Jain. Mr. Manish Gunwani has been managing this fund since Dec 2015. Total Schemes managed by the Fund Manager Refer annexure from page no. 91 for performance of other schemes currently managed by Manish is 12 (11 are jointly managed).Gunwani.Mr. Ashwin Jain has been managing this fund since Aug 2016. Total Schemes managed by the Fund Manager ). Refer annexure from is 3 (3 are jointly managedpage no. 91 for performance of other schemes currently managed by Ashwin Jain. 3. Date of inception: 30-Nov-05.4. Past performance may or may not be sustained in future and the same may not necessarily provide the basis for comparison with other investment.5. Load is not considered for computation of returns.6. In case, the start/end date of the concerned period is a nonbusiness date (NBD), the NAV of the previous date is considered for computation of returns. The NAV per unit shown in the table is as on the start date of the said period
Scheme
Nifty 50 Index (Additional Benchmark)
NAV (Rs.) Per Unit (as on April 28,2017 : 52.62)
CAGR (%)
10.00
Nifty Services Sector Index (Benchmark)
Since inception
CurrentValue of
Investment of Rs. 10000
CAGR (%) Current Value of
Investment of Rs. 10000
1 Year 3 Year 5 Year
CAGR (%) Current Value of
Investment of Rs. 10000
CAGR (%) Current Value of
Investment of Rs. 10000
44.02 28.91 16.24
Particulars
19.60 11953.66 22.12 18201.31 26.52 32401.48 15.66 52620.00
18.15 11809.56 13.92 14779.01 13.87 19141.75 11.65 35201.78
18.58 11852.59 11.60 13894.11 12.14 17728.25 11.62 35079.84
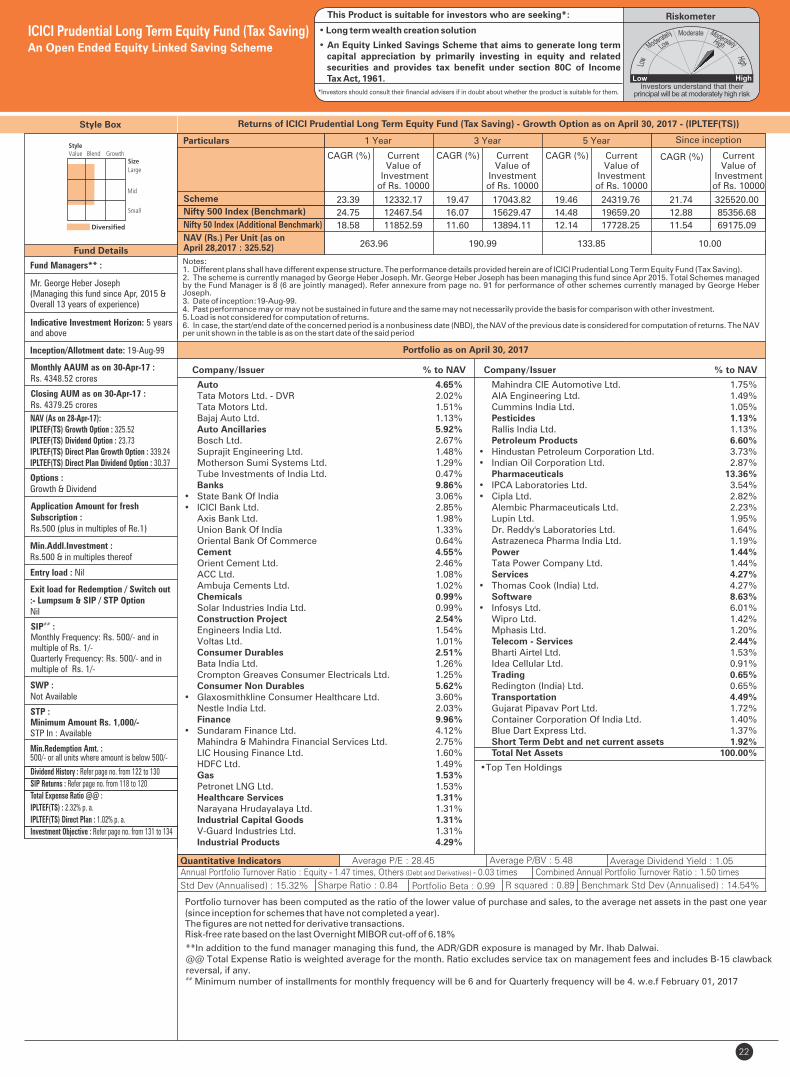
22
Fund Details
Portfolio as on April 30, 2017
Quantitative Indicators
Style Box
Fund Managers** :
Mr. George Heber Joseph(Managing this fund since Apr, 2015 &Overall 13 years of experience)
Indicative Investment Horizon: 5 yearsand above
Inception/Allotment date: 19-Aug-99
NAV (As on 28-Apr-17):IPLTEF(TS) Growth Option : 325.52IPLTEF(TS) Dividend Option : 23.73IPLTEF(TS) Direct Plan Growth Option : 339.24IPLTEF(TS) Direct Plan Dividend Option : 30.37
Options :Growth & Dividend
Application Amount for freshSubscription :Rs.500 (plus in multiples of Re.1)
Min.Addl.Investment :Rs.500 & in multiples thereof
Exit load for Redemption / Switch out:- Lumpsum & SIP / STP OptionNil
Min.Redemption Amt. :500/- or all units where amount is below 500/-
Std Dev (Annualised) : 15.32% Sharpe Ratio : 0.84
Average P/E : 28.45 Average P/BV : 5.48 Average Dividend Yield : 1.05
Portfolio Beta : 0.99 R squared : 0.89
• Top Ten Holdings
Returns of ICICI Prudential Long Term Equity Fund (Tax Saving) - Growth Option as on April 30, 2017 - (IPLTEF(TS))
Auto 4.65% Tata Motors Ltd. - DVR 2.02% Tata Motors Ltd. 1.51% Bajaj Auto Ltd. 1.13% Auto Ancillaries 5.92% Bosch Ltd. 2.67% Suprajit Engineering Ltd. 1.48% Motherson Sumi Systems Ltd. 1.29% Tube Investments of India Ltd. 0.47% Banks 9.86%• State Bank Of India 3.06%• ICICI Bank Ltd. 2.85% Axis Bank Ltd. 1.98% Union Bank Of India 1.33% Oriental Bank Of Commerce 0.64% Cement 4.55% Orient Cement Ltd. 2.46% ACC Ltd. 1.08% Ambuja Cements Ltd. 1.02% Chemicals 0.99% Solar Industries India Ltd. 0.99% Construction Project 2.54% Engineers India Ltd. 1.54% Voltas Ltd. 1.01% Consumer Durables 2.51% Bata India Ltd. 1.26% Crompton Greaves Consumer Electricals Ltd. 1.25% Consumer Non Durables 5.62%• Glaxosmithkline Consumer Healthcare Ltd. 3.60% Nestle India Ltd. 2.03% Finance 9.96%• Sundaram Finance Ltd. 4.12% Mahindra & Mahindra Financial Services Ltd. 2.75% LIC Housing Finance Ltd. 1.60% HDFC Ltd. 1.49% Gas 1.53% Petronet LNG Ltd. 1.53% Healthcare Services 1.31% Narayana Hrudayalaya Ltd. 1.31% Industrial Capital Goods 1.31% V-Guard Industries Ltd. 1.31% Industrial Products 4.29%
Monthly AAUM as on 30-Apr-17 : Rs. 4348.52 crores
Closing AUM as on 30-Apr-17 : Rs. 4379.25 crores
Company/Issuer % to NAV
Mahindra CIE Automotive Ltd. 1.75% AIA Engineering Ltd. 1.49% Cummins India Ltd. 1.05% Pesticides 1.13% Rallis India Ltd. 1.13% Petroleum Products 6.60%• Hindustan Petroleum Corporation Ltd. 3.73%• Indian Oil Corporation Ltd. 2.87% Pharmaceuticals 13.36%• IPCA Laboratories Ltd. 3.54%• Cipla Ltd. 2.82% Alembic Pharmaceuticals Ltd. 2.23% Lupin Ltd. 1.95% Dr. Reddy's Laboratories Ltd. 1.64% Astrazeneca Pharma India Ltd. 1.19% Power 1.44% Tata Power Company Ltd. 1.44% Services 4.27%• Thomas Cook (India) Ltd. 4.27% Software 8.63%• Infosys Ltd. 6.01% Wipro Ltd. 1.42% Mphasis Ltd. 1.20% Telecom - Services 2.44% Bharti Airtel Ltd. 1.53% Idea Cellular Ltd. 0.91% Trading 0.65% Redington (India) Ltd. 0.65% Transportation 4.49% Gujarat Pipavav Port Ltd. 1.72% Container Corporation Of India Ltd. 1.40% Blue Dart Express Ltd. 1.37% Short Term Debt and net current assets 1.92% Total Net Assets 100.00%
ICICI Prudential Long Term Equity Fund (Tax Saving)An Open Ended Equity Linked Saving Scheme
Benchmark Std Dev (Annualised) : 14.54%
Entry load : Nil
RiskometerThis Product is suitable for investors who are seeking*:
• Long term wealth creation solution
• An Equity Linked Savings Scheme that aims to generate long term capital appreciation by primarily investing in equity and related securities and provides tax benefit under section 80C of Income Tax Act, 1961.
*Investors should consult their financial advisers if in doubt about whether the product is suitable for them.
Annual Portfolio Turnover Ratio : Equity - 1.47 times, Others (Debt and Derivatives) - 0.03 times Combined Annual Portfolio Turnover Ratio : 1.50 times
Company/Issuer % to NAV
Dividend History : Refer page no. from 122 to 130
SIP Returns : Refer page no. from 118 to 120
Total Expense Ratio @@ :
IPLTEF(TS) : 2.32% p. a.
IPLTEF(TS) Direct Plan : 1.02% p. a.
Investment Objective : Refer page no. from 131 to 134
**In addition to the fund manager managing this fund, the ADR/GDR exposure is managed by Mr. Ihab Dalwai.@@ Total Expense Ratio is weighted average for the month. Ratio excludes service tax on management fees and includes B-15 clawback reversal, if any.##
Minimum number of installments for monthly frequency will be 6 and for Quarterly frequency will be 4. w.e.f February 01, 2017
Portfolio turnover has been computed as the ratio of the lower value of purchase and sales, to the average net assets in the past one year (since inception for schemes that have not completed a year). The figures are not netted for derivative transactions.Risk-free rate based on the last Overnight MIBOR cut-off of 6.18%
SIP :## Monthly Frequency: Rs. 500/- and in multiple of Rs. 1/-Quarterly Frequency: Rs. 500/- and in multiple of Rs. 1/-
SWP :Not Available
STP :Minimum Amount Rs. 1,000/-STP In : Available
Notes:1. Different plans shall have different expense structure. The performance details provided herein are of ICICI Prudential Long Term Equity Fund (Tax Saving).2. The scheme is currently managed by George Heber Joseph. Mr. George Heber Joseph has been managing this fund since Apr 2015. Total Schemes managed by the Fund Manager . Refer annexure from page no. 91 for performance of other schemes currently managed by George Heber is 8 (6 are jointly managed) Joseph.3. Date of inception:19-Aug-99.4. Past performance may or may not be sustained in future and the same may not necessarily provide the basis for comparison with other investment.5. Load is not considered for computation of returns.6. In case, the start/end date of the concerned period is a nonbusiness date (NBD), the NAV of the previous date is considered for computation of returns. The NAV per unit shown in the table is as on the start date of the said period
Scheme
Nifty 50 Index (Additional Benchmark)
NAV (Rs.) Per Unit (as on April 28,2017 : 325.52)
CAGR (%)
10.00
Nifty 500 Index (Benchmark)
Since inception
CurrentValue of
Investment of Rs. 10000
CAGR (%) Current Value of
Investment of Rs. 10000
1 Year 3 Year 5 Year
CAGR (%) Current Value of
Investment of Rs. 10000
CAGR (%) Current Value of
Investment of Rs. 10000
263.96 190.99 133.85
Particulars
23.39 12332.17 19.47 17043.82 19.46 24319.76 21.74 325520.00
24.75 12467.54 16.07 15629.47 14.48 19659.20 12.88 85356.68
18.58 11852.59 11.60 13894.11 12.14 17728.25 11.54 69175.09

23
Style Box
Fund Details
Returns of ICICI Prudential Global Stable Equity Fund - Growth Option as on April 30, 2017 - (IPGSEF)
Company/Issuer % to NAV
Fund Managers :
Ihab Dalwai (Managing this fund since Oct, 2016 & overall 5 years of experience)Rohan Maru(Managing this fund since Sep, 2013 &Overall 8 Years of experience)
Indicative Investment Horizon: 5 yearsand more.
Inception/Allotment date: 13-Sep-13
Options :Growth & Dividend (dividend payout*** and re-investment facility available)
Application Amount for freshSubscription :Rs.5,000 (plus in multiples of Re.1)
Min.Addl.Investment :Rs.1000 (plus in multiples of Re.1)
Exit load for Redemption / Switch out:- Lumpsum & SIP / STP Option:For redemption/switch-out of units upto3 months from the date of allotment -3% of applicable NAVFor redemption/switch-out of units from3 months upto 18 months from the dateof allotment - 1% of applicable NAVFor redemption/switch-out of unitsmore than 18 months from the date ofallotment - Nil
SIP :##
Monthly Frequency: Rs. 1,000/- and in multiple of Rs. 1/-Quarterly Frequency: Rs. 5,000/- and in multiple of Rs. 1/-
&&SWP :Rs. 500/- and in multiples of Rs. 1/-
STP/ Flex STP/ Value STP * :Daily Frequency: Rs. 250/- and in multiples of Rs. 50/-Weekly, Monthly and Quarterly Frequency: Rs. 1,000/- and in multiples of Rs. 1/-
Min.Redemption Amt. : 500/- or all units where amount is below 500/-
Investors may please note that they will be bearing the expenses of this Scheme in addition to the expenses of the underlying Schemes in which this Scheme makes investment.
@@ Total Expense Ratio is weighted average for the month. Ratio excludes service tax on management fees and includes B-15 clawback reversal, if any.
## Minimum number of installments for monthly frequency will be 6 and for Quarterly frequency will be 4. w.e.f February 01, 2017.* Minimum number of installments for daily, weekly and monthly frequency will be 6 and for Quarterly frequency will be 4. w.e.f February 01, 2017. Refer page No. 137 for definition of Flex STP and Value STP.&& Minimum number of installments for both monthly and quarterly will be 2. w.e.f February 01, 2017.*** In case the unit holder has opted for dividend payout option, the minimum amount for dividend payout shall be 100 (net of dividend distribution tax and other statutory levy, if any), else the dividend would be mandatorily reinvested.
Portfolio as on April 30, 2017
ICICI Prudential Global Stable Equity FundAn Open Ended Fund of Funds Scheme
Entry load : Nil
RiskometerThis Product is suitable for investors who are seeking*:
• Long term wealth creation solution
• An open-ended fund of funds scheme that seeks to provide adequate returns by investing in the units of one or more overseas mutual fund schemes, which have the mandate to invest globally
*Investors should consult their financial advisers if in doubt about whether the product is suitable for them.
NAV (As on 28-Apr-17):IPGSEF Growth Option : 13.06IPGSEF Dividend Option : 13.06IPGSEF Direct Plan Growth Option : 13.43IPGSEF Direct Plan Dividend Option : 13.43
OVERSEAS MUTUAL FUND UNITS 99.09%
Nordea 1 - Global Stable Equity Fund - Unhedged 99.09%
Short Term Debt and net current assets 0.91%
Total Net Assets 100.00%
Monthly AAUM as on 30-Apr-17 : Rs. 95.19 crores
Closing AUM as on 30-Apr-17 : Rs. 95.07 crores
Dividend History : Refer page no. from 122 to 130
SIP Returns : Refer page no. from 118 to 120
Total Expense Ratio @@ :
IPGSEF : 1.96% p. a.
IPGSEF Direct Plan : 1.68% p. a.
Investment Objective : Refer page no. from 131 to 134
Notes:1. Different plans shall have different expense structure. The performance details provided herein are of ICICI Prudential Global Stable Equity Fund.2. The scheme is currently managed by Ihab Dalwai and Rohan Maru. Mr. Ihab Dalwai has been managing this fund since Oct 2016. Total Schemes managed by the Fund Manager Refer annexure from page no. 91 for performance of other schemes currently managed by Ihab Dalwai.is 3.Mr. Rohan Maru has been managing this fund since Sep 2013. Total Schemes managed by the Fund Manager ). Refer annexure from is 5 (3 are jointly managedpage no. 91 for performance of other schemes currently managed by Rohan Maru. 3. Date of inception: 13-Sep-13.4. As the Scheme has completed more than 3 year but less than 5 years, the performance details of since inception,1 year and 3 years are provided herein.5. Past performance may or may not be sustained in future and the same may not necessarily provide the basis for comparison with other investment.6. Load is not considered for computation of returns.7. In case, the start/end date of the concerned period is a nonbusiness date (NBD), the NAV of the previous date is considered for computation of returns. The NAV per unit shown in the table is as on the start date of the said period
Scheme
Nifty 50 Index (Additional Benchmark)
NAV (Rs.) Per Unit (as on April 28,2017 : 13.06)
CAGR (%)
10.00
MSCI World - Net Return Index (Benchmark)
Since inception
CurrentValue of
Investment of Rs. 10000
CAGR (%) Current Value of
Investment of Rs. 10000
1 Year 3 Year 5 Year
CAGR (%) Current Value of
Investment of Rs. 10000
CAGR (%) Current Value of
Investment of Rs. 10000
12.84 10.46 -
Particulars
1.72 10171.34 7.69 12485.66 - - 7.64 13060.00
10.72 11069.07 7.90 12559.82 - - 8.02 13225.33
18.58 11852.59 11.60 13894.11 - - 13.65 15902.73
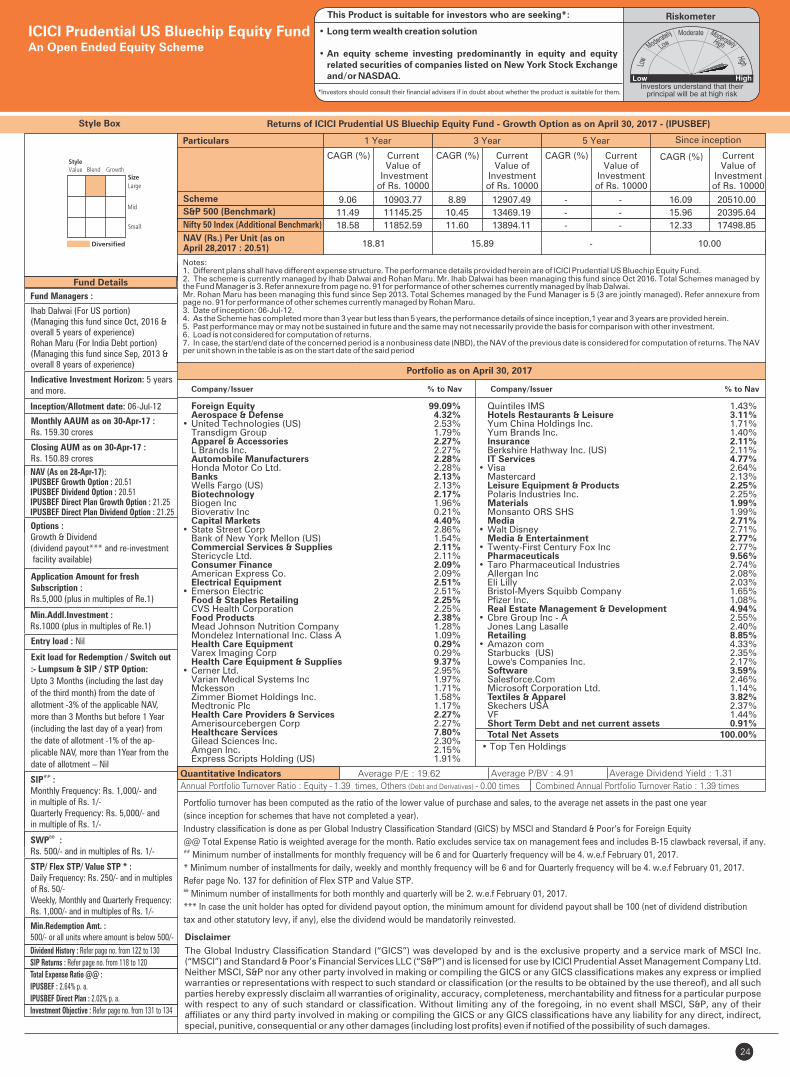
2324
Fund Details
Quantitative Indicators
Portfolio turnover has been computed as the ratio of the lower value of purchase and sales, to the average net assets in the past one year
(since inception for schemes that have not completed a year).
Industry classification is done as per Global Industry Classification Standard (GICS) by MSCI and Standard & Poor’s for Foreign Equity
@@ Total Expense Ratio is weighted average for the month. Ratio excludes service tax on management fees and includes B-15 clawback reversal, if any.## Minimum number of installments for monthly frequency will be 6 and for Quarterly frequency will be 4. w.e.f February 01, 2017.
* Minimum number of installments for daily, weekly and monthly frequency will be 6 and for Quarterly frequency will be 4. w.e.f February 01, 2017.
Refer page No. 137 for definition of Flex STP and Value STP.&& Minimum number of installments for both monthly and quarterly will be 2. w.e.f February 01, 2017.
*** In case the unit holder has opted for dividend payout option, the minimum amount for dividend payout shall be 100 (net of dividend distribution
tax and other statutory levy, if any), else the dividend would be mandatorily reinvested.
Style Box
Company/Issuer % to Nav Company/Issuer % to Nav
Fund Managers :
Ihab Dalwai (For US portion)(Managing this fund since Oct, 2016 & overall 5 years of experience)Rohan Maru (For India Debt portion)(Managing this fund since Sep, 2013 &overall 8 years of experience)
Indicative Investment Horizon: 5 yearsand more.
Inception/Allotment date: 06-Jul-12
Options :Growth & Dividend (dividend payout*** and re-investment facility available)
Application Amount for freshSubscription :Rs.5,000 (plus in multiples of Re.1)
Min.Addl.Investment :Rs.1000 (plus in multiples of Re.1)
Exit load for Redemption / Switch out
:- Lumpsum & SIP / STP Option:
Upto 3 Months (including the last day
of the third month) from the date of
allotment -3% of the applicable NAV,
more than 3 Months but before 1 Year
(including the last day of a year) from
the date of allotment -1% of the ap-
plicable NAV, more than 1Year from the
date of allotment – Nil
SIP :##
Monthly Frequency: Rs. 1,000/- and in multiple of Rs. 1/-Quarterly Frequency: Rs. 5,000/- and in multiple of Rs. 1/-
&&SWP :Rs. 500/- and in multiples of Rs. 1/-
STP/ Flex STP/ Value STP * :Daily Frequency: Rs. 250/- and in multiples of Rs. 50/-Weekly, Monthly and Quarterly Frequency: Rs. 1,000/- and in multiples of Rs. 1/-
Min.Redemption Amt. : 500/- or all units where amount is below 500/- Disclaimer
The Global Industry Classification Standard (“GICS”) was developed by and is the exclusive property and a service mark of MSCI Inc. (“MSCI”) and Standard & Poor’s Financial Services LLC (“S&P”) and is licensed for use by ICICI Prudential Asset Management Company Ltd. Neither MSCI, S&P nor any other party involved in making or compiling the GICS or any GICS classifications makes any express or implied warranties or representations with respect to such standard or classification (or the results to be obtained by the use thereof), and all such parties hereby expressly disclaim all warranties of originality, accuracy, completeness, merchantability and fitness for a particular purpose with respect to any of such standard or classification. Without limiting any of the foregoing, in no event shall MSCI, S&P, any of their affiliates or any third party involved in making or compiling the GICS or any GICS classifications have any liability for any direct, indirect, special, punitive, consequential or any other damages (including lost profits) even if notified of the possibility of such damages.
• Top Ten Holdings
Portfolio as on April 30, 2017
Returns of ICICI Prudential US Bluechip Equity Fund - Growth Option as on April 30, 2017 - (IPUSBEF)
Average P/E : 19.62 Average P/BV : 4.91 Average Dividend Yield : 1.31
ICICI Prudential US Bluechip Equity FundAn Open Ended Equity Scheme
Entry load : Nil
RiskometerThis Product is suitable for investors who are seeking*:
• Long term wealth creation solution
• An equity scheme investing predominantly in equity and equity related securities of companies listed on New York Stock Exchange and/or NASDAQ.
*Investors should consult their financial advisers if in doubt about whether the product is suitable for them.
NAV (As on 28-Apr-17):IPUSBEF Growth Option : 20.51IPUSBEF Dividend Option : 20.51IPUSBEF Direct Plan Growth Option : 21.25IPUSBEF Direct Plan Dividend Option : 21.25
Foreign Equity 99.09% Aerospace & Defense 4.32%• United Technologies (US) 2.53% Transdigm Group 1.79% Apparel & Accessories 2.27% L Brands Inc. 2.27% Automobile Manufacturers 2.28% Honda Motor Co Ltd. 2.28% Banks 2.13% Wells Fargo (US) 2.13% Biotechnology 2.17% Biogen Inc 1.96% Bioverativ Inc 0.21% Capital Markets 4.40%• State Street Corp 2.86% Bank of New York Mellon (US) 1.54% Commercial Services & Supplies 2.11% Stericycle Ltd. 2.11% Consumer Finance 2.09% American Express Co. 2.09% Electrical Equipment 2.51%• Emerson Electric 2.51% Food & Staples Retailing 2.25% CVS Health Corporation 2.25% Food Products 2.38% Mead Johnson Nutrition Company 1.28% Mondelez International Inc. Class A 1.09% Health Care Equipment 0.29% Varex Imaging Corp 0.29% Health Care Equipment & Supplies 9.37%• Cerner Ltd. 2.95% Varian Medical Systems Inc 1.97% Mckesson 1.71% Zimmer Biomet Holdings Inc. 1.58% Medtronic Plc 1.17% Health Care Providers & Services 2.27% Amerisourcebergen Corp 2.27% Healthcare Services 7.80% Gilead Sciences Inc. 2.30% Amgen Inc. 2.15% Express Scripts Holding (US) 1.91%
Monthly AAUM as on 30-Apr-17 :Rs. 159.30 crores
Closing AUM as on 30-Apr-17 : Rs. 150.89 crores
Quintiles IMS 1.43% Hotels Restaurants & Leisure 3.11% Yum China Holdings Inc. 1.71% Yum Brands Inc. 1.40% Insurance 2.11% Berkshire Hathway Inc. (US) 2.11% IT Services 4.77%• Visa 2.64% Mastercard 2.13% Leisure Equipment & Products 2.25% Polaris Industries Inc. 2.25% Materials 1.99% Monsanto ORS SHS 1.99% Media 2.71%• Walt Disney 2.71% Media & Entertainment 2.77%• Twenty-First Century Fox Inc 2.77% Pharmaceuticals 9.56%• Taro Pharmaceutical Industries 2.74% Allergan Inc 2.08% Eli Lilly 2.03% Bristol-Myers Squibb Company 1.65% Pfizer Inc. 1.08% Real Estate Management & Development 4.94%• Cbre Group Inc - A 2.55% Jones Lang Lasalle 2.40% Retailing 8.85%• Amazon com 4.33% Starbucks (US) 2.35% Lowe's Companies Inc. 2.17% Software 3.59% Salesforce.Com 2.46% Microsoft Corporation Ltd. 1.14% Textiles & Apparel 3.82% Skechers USA 2.37% VF 1.44% Short Term Debt and net current assets 0.91% Total Net Assets 100.00%
Annual Portfolio Turnover Ratio : Equity - 1.39 times, Others (Debt and Derivatives) - 0.00 times Combined Annual Portfolio Turnover Ratio : 1.39 times
Dividend History : Refer page no. from 122 to 130
SIP Returns : Refer page no. from 118 to 120
Total Expense Ratio @@ :
IPUSBEF : 2.64% p. a.
IPUSBEF Direct Plan : 2.02% p. a.
Investment Objective : Refer page no. from 131 to 134
Notes:1. Different plans shall have different expense structure. The performance details provided herein are of ICICI Prudential US Bluechip Equity Fund.2. The scheme is currently managed by Ihab Dalwai and Rohan Maru. Mr. Ihab Dalwai has been managing this fund since Oct 2016. Total Schemes managed by the Fund Manager Refer annexure from page no. 91 for performance of other schemes currently managed by Ihab Dalwai.is 3.Mr. Rohan Maru has been managing this fund since Sep 2013. Total Schemes managed by the Fund Manager ). Refer annexure from is 5 (3 are jointly managedpage no. 91 for performance of other schemes currently managed by Rohan Maru. 3. Date of inception: 06-Jul-12.4. As the Scheme has completed more than 3 year but less than 5 years, the performance details of since inception,1 year and 3 years are provided herein.5. Past performance may or may not be sustained in future and the same may not necessarily provide the basis for comparison with other investment.6. Load is not considered for computation of returns.7. In case, the start/end date of the concerned period is a nonbusiness date (NBD), the NAV of the previous date is considered for computation of returns. The NAV per unit shown in the table is as on the start date of the said period
Scheme
Nifty 50 Index (Additional Benchmark)
NAV (Rs.) Per Unit (as on April 28,2017 : 20.51)
CAGR (%)
10.00
S&P 500 (Benchmark)
Since inception
CurrentValue of
Investment of Rs. 10000
CAGR (%) Current Value of
Investment of Rs. 10000
1 Year 3 Year 5 Year
CAGR (%) Current Value of
Investment of Rs. 10000
CAGR (%) Current Value of
Investment of Rs. 10000
18.81 15.89 -
Particulars
9.06 10903.77 8.89 12907.49 - - 16.09 20510.00
11.49 11145.25 10.45 13469.19 - - 15.96 20395.64
18.58 11852.59 11.60 13894.11 - - 12.33 17498.85

25
Fund Details
Quantitative Indicators
Style Box
Fund Managers :
Sankaran Naren (India Portion)(Managing this fund from Feb, 2015 &Overall 26 years of experience)Atul Patel (India Portion)(Managing this fund since Feb, 2015 &Overall 7 Years of experience)Ihab Dalwai (Asia Portion)(Managing this fund since Oct, 2016 & overall 5 years of experience)
Indicative Investment Horizon: 5 yearsand above
Inception/Allotment date: 18-Oct-2007
Monthly AAUM as on 30-Apr-17 : Rs. 167.21 crores
Closing AUM as on 30-Apr-17 : Rs. 169.67 crores
NAV (As on 28-Apr-17):IPIAEF Growth Option : 25.60IPIAEF Dividend Option : 17.99IPIAEF Direct Plan Growth Option : 26.16IPIAEF Direct Plan Dividend Option : 26.17
Options :Growth & Dividend(dividend payout*** and re-investment facility available)
Application Amount for freshSubscription :Rs.5,000 (plus in multiples of Re.1)
Min.Addl.Investment :Rs.1,000 (plus in multiples of Re.1)
Entry load : Nil
Exit load for Redemption / Switchout :- Lumpsum & SIP / STP / SWP OptionUpto 1 Year from allotment - 1% ofapplicable NAV, more than 1 Year - Nil
SIP :##
Monthly Frequency: Rs. 1,000/- and in multiple of Rs. 1/-Quarterly Frequency: Rs. 5,000/- and in multiple of Rs. 1/-
&&SWP :Rs. 500/- and in multiples of Rs. 1/-
STP/ Flex STP/ Value STP * :Daily Frequency: Rs. 250/- and in multiples of Rs. 50/-Weekly, Monthly and Quarterly Frequency: Rs. 1,000/- and in multiples of Rs. 1/-
Min.Redemption Amt. :500/- or all units where amount is below 500/-
Portfolio turnover has been computed as the ratio of the lower value of purchase and sales, to the average net assets in the past one year (since inception for schemes that have not completed a year). The figures are not netted for derivative transactions.Risk-free rate based on the last Overnight MIBOR cut-off of 6.18%.@@ Total Expense Ratio is weighted average for the month. Ratio excludes service tax on management fees and includes B-15 clawback reversal, if any.##
Minimum number of installments for monthly frequency will be 6 and for Quarterly frequency will be 4. w.e.f February 01, 2017.* Minimum number of installments for daily, weekly and monthly frequency will be 6 and for Quarterly frequency will be 4. w.e.f February 01, 2017. Refer page No. 137 for definition of Flex STP and Value STP.&&
Minimum number of installments for both monthly and quarterly will be 2. w.e.f February 01, 2017.*** In case the unit holder has opted for dividend payout option, the minimum amount for dividend payout shall be 100 (net of dividend distribution tax and other statutory levy, if any), else the dividend would be mandatorily reinvested.
Std Dev (Annualised) : 14.69% Sharpe Ratio : 0.96
Average P/E : 20.38 Average P/BV : 2.70 Average Dividend Yield : 1.25
Portfolio Beta : 1.14 R squared : 0.80
Portfolio as on April 30, 2017
Returns of ICICI Prudential Indo Asia Equity Fund - Growth Option as on April 30, 2017 - (IPIAEF)
• Top Ten HoldingsDerivatives are considered at exposure value.
ICICI Prudential Indo Asia Equity FundAn Open Ended Diversified Equity Fund
Benchmark Std Dev (Annualised) : 11.47%
RiskometerThis Product is suitable for investors who are seeking*:
• Long term wealth creation solution
• A diversified equity fund that invests in equity and units of equity funds of companies, which are primarily active in Asia pacific region.
*Investors should consult their financial advisers if in doubt about whether the product is suitable for them.
Annual Portfolio Turnover Ratio : Equity - 0.91 times, Others (Debt and Derivatives) - 0.91 times Combined Annual Portfolio Turnover Ratio : 1.82 times
Dividend History : Refer page no. from 122 to 130
SIP Returns : Refer page no. from 118 to 120
Total Expense Ratio @@ :
IPIAEF : 2.56% p. a.
IPIAEF Direct Plan : 1.98% p. a.
Investment Objective : Refer page no. from 131 to 134
IOF Asian Equity Fund 10.39% • Eastspring Inv Asian Equity Fund - Class E 10.39% Banks 8.33% 6.54%• ICICI Bank Ltd. 8.33% • State Bank Of India - Futures 6.54% Cement 11.58% • JK Lakshmi Cement Ltd. 6.69% Orient Cement Ltd. 4.89% Chemicals 8.90% • Tata Chemicals Ltd. 8.90% Construction 21.99% • PNC Infratech Ltd. 9.29% • KNR Constructions Ltd. 7.08% • Brigade Enterprises Ltd. 5.63% Ferrous Metals 6.23% • Tata Steel Ltd. 6.23% Media & Entertainment 3.38% HT Media Limited 3.38% Minerals/Mining 3.78% Coal India Ltd. 3.78% Pharmaceuticals 10.49% • IPCA Laboratories Ltd. 5.40% Cipla Ltd. 5.08% Telecom - Services 4.19% Bharti Airtel Ltd. 4.19% Short Term Debt and net current assets 4.19% Total Net Assets 100.00%
Company/Issuer % to % to NAV NAV Derivatives
Notes:1. Different plans shall have different expense structure. The performance details provided herein are of ICICI Prudential Indo Asia Equity Fund.2. The scheme is currently managed by Sankaran Naren, Atul Patel and Ihab Dalwai. Mr. Sankaran Naren has been managing this fund since Feb 2015. Total Schemes managed by the Fund Manager ). Refer annexure from page no. 91 for performance of other schemes currently managed byis 14 (14 are jointly managed Sankaran Naren.Mr. Atul Patel has been managing this fund since Feb 2015. Total Schemes managed by the Fund Manager ). Refer annexure from is 14 (13 are jointly managedpage no. 91 for performance of other schemes currently managed by Atul Patel. Mr. Ihab Dalwai has been managing this fund since Oct 2016. Total Schemes managed by the Fund Manager Refer annexure from page no. 91 for performance is 3.of other schemes currently managed by Ihab Dalwai.3. Date of inception:18-Oct-07.4. Past performance may or may not be sustained in future and the same may not necessarily provide the basis for comparison with other investment.5. Load is not considered for computation of returns.6. In case, the start/end date of the concerned period is a nonbusiness date (NBD), the NAV of the previous date is considered for computation of returns. The NAV per unit shown in the table is as on the start date of the said period
Scheme
Nifty 50 Index (Additional Benchmark)
NAV (Rs.) Per Unit (as on April 28,2017 : 25.60)
CAGR (%)
10.00
65% Nifty 50 + 35% MSCI Asia ex - Japan Index (Benchmark)
Since inception
CurrentValue of
Investment of Rs. 10000
CAGR (%) Current Value of
Investment of Rs. 10000
1 Year 3 Year 5 Year
CAGR (%) Current Value of
Investment of Rs. 10000
CAGR (%) Current Value of
Investment of Rs. 10000
19.32 14.41 10.68
Particulars
32.61 13250.52 21.13 17765.44 19.12 23970.04 10.36 25600.00
17.16 11711.28 9.39 13085.05 10.55 16507.50 5.76 17052.98
18.58 11852.59 11.60 13894.11 12.14 17728.25 5.97 17387.50
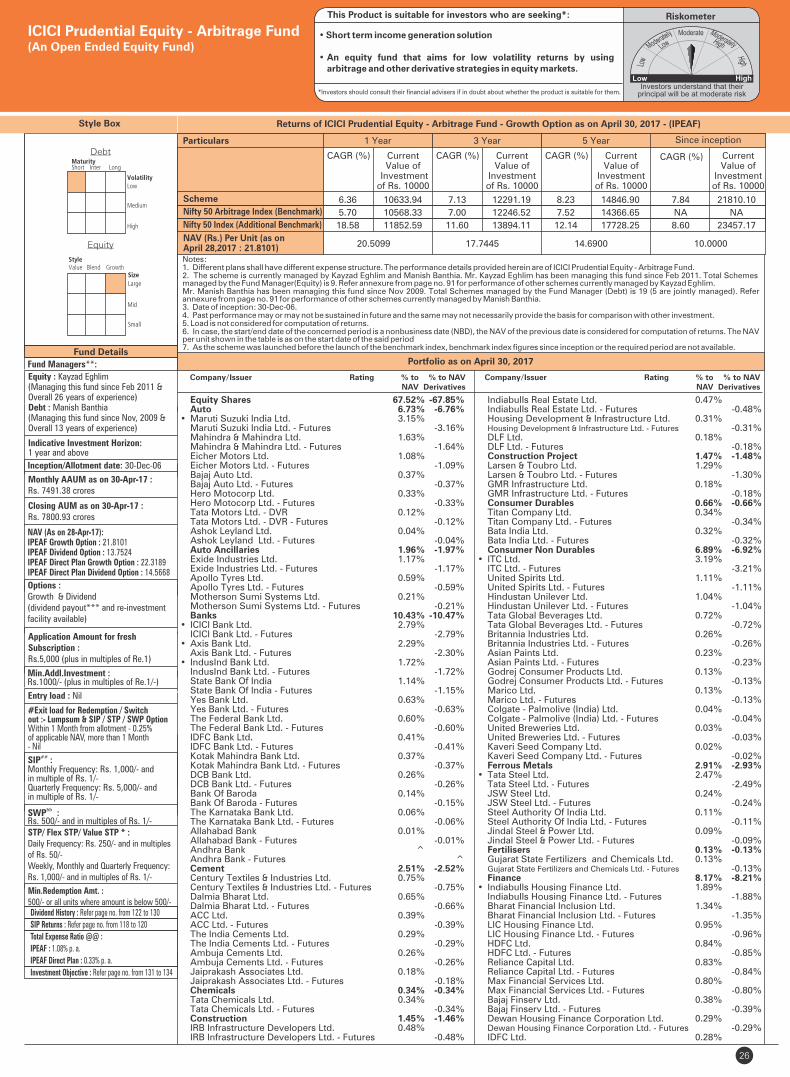
Equity Shares 67.52% -67.85% Auto 6.73% -6.76%• Maruti Suzuki India Ltd. 3.15% Maruti Suzuki India Ltd. - Futures -3.16% Mahindra & Mahindra Ltd. 1.63% Mahindra & Mahindra Ltd. - Futures -1.64% Eicher Motors Ltd. 1.08% Eicher Motors Ltd. - Futures -1.09% Bajaj Auto Ltd. 0.37% Bajaj Auto Ltd. - Futures -0.37% Hero Motocorp Ltd. 0.33% Hero Motocorp Ltd. - Futures -0.33% Tata Motors Ltd. - DVR 0.12% Tata Motors Ltd. - DVR - Futures -0.12% Ashok Leyland Ltd. 0.04% Ashok Leyland Ltd. - Futures -0.04% Auto Ancillaries 1.96% -1.97% Exide Industries Ltd. 1.17% Exide Industries Ltd. - Futures -1.17% Apollo Tyres Ltd. 0.59% Apollo Tyres Ltd. - Futures -0.59% Motherson Sumi Systems Ltd. 0.21% Motherson Sumi Systems Ltd. - Futures -0.21% Banks 10.43% -10.47%• ICICI Bank Ltd. 2.79% ICICI Bank Ltd. - Futures -2.79%• Axis Bank Ltd. 2.29% Axis Bank Ltd. - Futures -2.30%• IndusInd Bank Ltd. 1.72% IndusInd Bank Ltd. - Futures -1.72% State Bank Of India 1.14% State Bank Of India - Futures -1.15% Yes Bank Ltd. 0.63% Yes Bank Ltd. - Futures -0.63% The Federal Bank Ltd. 0.60% The Federal Bank Ltd. - Futures -0.60% IDFC Bank Ltd. 0.41% IDFC Bank Ltd. - Futures -0.41% Kotak Mahindra Bank Ltd. 0.37% Kotak Mahindra Bank Ltd. - Futures -0.37% DCB Bank Ltd. 0.26% DCB Bank Ltd. - Futures -0.26% Bank Of Baroda 0.14% Bank Of Baroda - Futures -0.15% The Karnataka Bank Ltd. 0.06% The Karnataka Bank Ltd. - Futures -0.06% Allahabad Bank 0.01% Allahabad Bank - Futures -0.01% Andhra Bank ^ Andhra Bank - Futures ^ Cement 2.51% -2.52% Century Textiles & Industries Ltd. 0.75% Century Textiles & Industries Ltd. - Futures -0.75% Dalmia Bharat Ltd. 0.65% Dalmia Bharat Ltd. - Futures -0.66% ACC Ltd. 0.39% ACC Ltd. - Futures -0.39% The India Cements Ltd. 0.29% The India Cements Ltd. - Futures -0.29% Ambuja Cements Ltd. 0.26% Ambuja Cements Ltd. - Futures -0.26% Jaiprakash Associates Ltd. 0.18% Jaiprakash Associates Ltd. - Futures -0.18% Chemicals 0.34% -0.34% Tata Chemicals Ltd. 0.34% Tata Chemicals Ltd. - Futures -0.34% Construction 1.45% -1.46% IRB Infrastructure Developers Ltd. 0.48% IRB Infrastructure Developers Ltd. - Futures -0.48%
26
Fund Details
Style Box
Equity
Debt
Fund Managers**:
Equity : Kayzad Eghlim (Managing this fund since Feb 2011 & Overall 26 years of experience)Debt : Manish Banthia (Managing this fund since Nov, 2009 & Overall 13 years of experience)
Inception/Allotment date: 30-Dec-06
Monthly AAUM as on 30-Apr-17 : Rs. 7491.38 crores
Closing AUM as on 30-Apr-17 :Rs. 7800.93 crores
NAV (As on 28-Apr-17):IPEAF Growth Option : 21.8101IPEAF Dividend Option : 13.7524IPEAF Direct Plan Growth Option : 22.3189IPEAF Direct Plan Dividend Option : 14.5668
Options :Growth & Dividend(dividend payout*** and re-investment facility available)
Application Amount for freshSubscription :Rs.5,000 (plus in multiples of Re.1)
Min.Addl.Investment :Rs.1000/- (plus in multiples of Re.1/-)
#Exit load for Redemption / Switchout :- Lumpsum & SIP / STP / SWP OptionWithin 1 Month from allotment - 0.25%of applicable NAV, more than 1 Month- Nil
SIP :##
Monthly Frequency: Rs. 1,000/- and in multiple of Rs. 1/-Quarterly Frequency: Rs. 5,000/- and in multiple of Rs. 1/-
&&SWP :Rs. 500/- and in multiples of Rs. 1/-STP/ Flex STP/ Value STP * :Daily Frequency: Rs. 250/- and in multiples of Rs. 50/-Weekly, Monthly and Quarterly Frequency: Rs. 1,000/- and in multiples of Rs. 1/-
Portfolio as on April 30, 2017
Returns of ICICI Prudential Equity - Arbitrage Fund - Growth Option as on April 30, 2017 - (IPEAF)
Company/Issuer Rating % to % to NAV NAV Derivatives
Indiabulls Real Estate Ltd. 0.47% Indiabulls Real Estate Ltd. - Futures -0.48% Housing Development & Infrastructure Ltd. 0.31% Housing Development & Infrastructure Ltd. - Futures -0.31% DLF Ltd. 0.18% DLF Ltd. - Futures -0.18% Construction Project 1.47% -1.48% Larsen & Toubro Ltd. 1.29% Larsen & Toubro Ltd. - Futures -1.30% GMR Infrastructure Ltd. 0.18% GMR Infrastructure Ltd. - Futures -0.18% Consumer Durables 0.66% -0.66% Titan Company Ltd. 0.34% Titan Company Ltd. - Futures -0.34% Bata India Ltd. 0.32% Bata India Ltd. - Futures -0.32% Consumer Non Durables 6.89% -6.92%• ITC Ltd. 3.19% ITC Ltd. - Futures -3.21% United Spirits Ltd. 1.11% United Spirits Ltd. - Futures -1.11% Hindustan Unilever Ltd. 1.04% Hindustan Unilever Ltd. - Futures -1.04% Tata Global Beverages Ltd. 0.72% Tata Global Beverages Ltd. - Futures -0.72% Britannia Industries Ltd. 0.26% Britannia Industries Ltd. - Futures -0.26% Asian Paints Ltd. 0.23% Asian Paints Ltd. - Futures -0.23% Godrej Consumer Products Ltd. 0.13% Godrej Consumer Products Ltd. - Futures -0.13% Marico Ltd. 0.13% Marico Ltd. - Futures -0.13% Colgate - Palmolive (India) Ltd. 0.04% Colgate - Palmolive (India) Ltd. - Futures -0.04% United Breweries Ltd. 0.03% United Breweries Ltd. - Futures -0.03% Kaveri Seed Company Ltd. 0.02% Kaveri Seed Company Ltd. - Futures -0.02% Ferrous Metals 2.91% -2.93%• Tata Steel Ltd. 2.47% Tata Steel Ltd. - Futures -2.49% JSW Steel Ltd. 0.24% JSW Steel Ltd. - Futures -0.24% Steel Authority Of India Ltd. 0.11% Steel Authority Of India Ltd. - Futures -0.11% Jindal Steel & Power Ltd. 0.09% Jindal Steel & Power Ltd. - Futures -0.09% Fertilisers 0.13% -0.13% Gujarat State Fertilizers and Chemicals Ltd. 0.13% Gujarat State Fertilizers and Chemicals Ltd. - Futures -0.13% Finance 8.17% -8.21%• Indiabulls Housing Finance Ltd. 1.89% Indiabulls Housing Finance Ltd. - Futures -1.88% Bharat Financial Inclusion Ltd. 1.34% Bharat Financial Inclusion Ltd. - Futures -1.35% LIC Housing Finance Ltd. 0.95% LIC Housing Finance Ltd. - Futures -0.96% HDFC Ltd. 0.84% HDFC Ltd. - Futures -0.85% Reliance Capital Ltd. 0.83% Reliance Capital Ltd. - Futures -0.84% Max Financial Services Ltd. 0.80% Max Financial Services Ltd. - Futures -0.80% Bajaj Finserv Ltd. 0.38% Bajaj Finserv Ltd. - Futures -0.39% Dewan Housing Finance Corporation Ltd. 0.29% Dewan Housing Finance Corporation Ltd. - Futures -0.29% IDFC Ltd. 0.28%
Company/Issuer Rating % to % to NAV NAV Derivatives
ICICI Prudential Equity - Arbitrage Fund(An Open Ended Equity Fund)
Entry load : Nil
RiskometerThis Product is suitable for investors who are seeking*:
• Short term income generation solution
• An equity fund that aims for low volatility returns by using arbitrage and other derivative strategies in equity markets.
*Investors should consult their financial advisers if in doubt about whether the product is suitable for them.
Indicative Investment Horizon: 1 year and above
Dividend History : Refer page no. from 122 to 130
SIP Returns : Refer page no. from 118 to 120
Total Expense Ratio @@ :
IPEAF : 1.08% p. a.
IPEAF Direct Plan : 0.33% p. a.
Investment Objective : Refer page no. from 131 to 134
Min.Redemption Amt. :500/- or all units where amount is below 500/-
Notes:1. Different plans shall have different expense structure. The performance details provided herein are of ICICI Prudential Equity - Arbitrage Fund.2. The scheme is currently managed by Kayzad Eghlim and Manish Banthia. Mr. Kayzad Eghlim has been managing this fund since Feb 2011. Total Schemes managed by the Fund Manager Refer annexure from page no. 91 for performance of other schemes currently managed by Kayzad Eghlim.(Equity) is 9.Mr. has been managing this fund since . Total Schemes managed by the Fund Manager . Refer Manish Banthia Nov 2009 (Debt) is 19 (5 are jointly managed)annexure from page no. 91 for performance of other schemes currently managed by . Manish Banthia3. Date of inception: 30-Dec-06.4. Past performance may or may not be sustained in future and the same may not necessarily provide the basis for comparison with other investment.5. Load is not considered for computation of returns.6. In case, the start/end date of the concerned period is a nonbusiness date (NBD), the NAV of the previous date is considered for computation of returns. The NAV per unit shown in the table is as on the start date of the said period7. As the scheme was launched before the launch of the benchmark index, benchmark index figures since inception or the required period are not available.
Scheme
Nifty 50 Index (Additional Benchmark)
NAV (Rs.) Per Unit (as on April 28,2017 : 21.8101)
CAGR (%)
10.0000
Nifty 50 Arbitrage Index (Benchmark)
Since inception
CurrentValue of
Investment of Rs. 10000
CAGR (%) Current Value of
Investment of Rs. 10000
1 Year 3 Year 5 Year
CAGR (%) Current Value of
Investment of Rs. 10000
CAGR (%) Current Value of
Investment of Rs. 10000
20.5099 17.7445 14.6900
Particulars
6.36 10633.94 7.13 12291.19 8.23 14846.90 7.84 21810.10
5.70 10568.33 7.00 12246.52 7.52 14366.65 NA NA
18.58 11852.59 11.60 13894.11 12.14 17728.25 8.60 23457.17

IDFC Ltd. - Futures -0.28% Mahindra & Mahindra Financial Services Ltd. 0.24% Mahindra & Mahindra Financial Services Ltd. - Futures -0.24% Power Finance Corporation Ltd. 0.12% Power Finance Corporation Ltd. - Futures -0.12% IFCI Ltd. 0.12% IFCI Ltd. - Futures -0.12% Shriram Transport Finance Company Ltd. 0.07% Shriram Transport Finance Company Ltd. - Futures -0.07% Equitas Holdings Ltd. 0.03% Equitas Holdings Ltd. - Futures -0.03% Gas 0.22% -0.22% Petronet LNG Ltd. 0.12% Petronet LNG Ltd. - Futures -0.13% GAIL (India) Ltd. 0.07% GAIL (India) Ltd. - Futures -0.07% Indraprastha Gas Ltd. 0.03% Indraprastha Gas Ltd. - Futures -0.03% Industrial Capital Goods 1.36% -1.37% Bharat Electronics Ltd. 0.92% Bharat Electronics Ltd. - Futures -0.92% Bharat Heavy Electricals Ltd. 0.40% Bharat Heavy Electricals Ltd. - Futures -0.40% Siemens Ltd. 0.04% Siemens Ltd. - Futures -0.04% Industrial Products 0.35% -0.36% Sintex Industries Ltd. 0.26% Sintex Industries Ltd. - Futures -0.26% Cummins India Ltd. 0.10% Cummins India Ltd. - Futures -0.10% Media & Entertainment 1.66% -1.67% Zee Entertainment Enterprises Ltd. 0.65% Zee Entertainment Enterprises Ltd. - Futures -0.65% Dish TV India Ltd. 0.40% Dish TV India Ltd. - Futures -0.40% Sun TV Network Ltd. 0.39% Sun TV Network Ltd. - Futures -0.39% TV18 Broadcast Ltd. 0.22% TV18 Broadcast Ltd. - Futures -0.22% Minerals/Mining 0.23% -0.23% Coal India Ltd. 0.17% Coal India Ltd. - Futures -0.17% NMDC Ltd. 0.07% NMDC Ltd. - Futures -0.07% Non - Ferrous Metals 1.24% -1.25% Hindalco Industries Ltd. 1.07% Hindalco Industries Ltd. - Futures -1.08% Hindustan Zinc Ltd. 0.17% Hindustan Zinc Ltd. - Futures -0.17% Oil 0.88% -0.88% Oil & Natural Gas Corporation Ltd. 0.88% Oil & Natural Gas Corporation Ltd. - Futures -0.88% Pesticides 0.84% -0.85% UPL Ltd. 0.84% UPL Ltd. - Futures -0.85% Petroleum Products 4.24% -4.25%• Reliance Industries Ltd. 1.65% Reliance Industries Ltd. - Futures -1.66% Castrol India Ltd. 1.25% Castrol India Ltd. - Futures -1.25% Bharat Petroleum Corporation Ltd. 1.10% Bharat Petroleum Corporation Ltd. - Futures -1.11% Indian Oil Corporation Ltd. 0.17% Indian Oil Corporation Ltd. - Futures -0.17% Hindustan Petroleum Corporation Ltd. 0.06% Hindustan Petroleum Corporation Ltd. - Futures -0.06% Pharmaceuticals 5.31% -5.33% Sun Pharmaceutical Industries Ltd. 1.54% Sun Pharmaceutical Industries Ltd. - Futures -1.54% Aurobindo Pharma Ltd. 1.06% Aurobindo Pharma Ltd. - Futures -1.06% Divi's Laboratories Ltd. 0.97% Divi's Laboratories Ltd. - Futures -0.97% Dr. Reddy's Laboratories Ltd. 0.70% Dr. Reddy's Laboratories Ltd. - Futures -0.70% Biocon Ltd. 0.38%
27
• Top Ten HoldingsDerivatives are considered at exposure value.@Short Term < 8 Years, Long Term > 8 Years.^ Value Less than 0.01% of NAV.^^ CRISIL has rated AA and company has put a withdrawalrequest for the CRISIL rating.
Quantitative Indicators
# Exit Load : Nil exit load for STP to ICICI Prudential Dynamic Plan, ICICI Prudential Focused Bluechip Equity Fund,ICICI Prudential Value Discovery Fund, ICICI Prudential Infrastructure Fund,ICICI Prudential Long Term Equity Fund (Tax Saving), ICICI Prudential Top 100 Fund, ICICI Prudential Multicap Fund ,ICICI Prudential Midcap Fund, ICICI Prudential Exports and Other Services Fund,ICICI Prudential Banking & Financial Services Fund, ICICI Prudential Technology Fund,ICICI Prudential FMCG Fund, ICICI Prudential Balanced Advantage Fund,ICICI Prudential Child Care Plan-Gift Plan, ICICI Prudential Dividend Yield Equity Fund,ICICI Prudential Indo Asia Equity Fund, ICICI Prudential Select Large Cap Fund, ICICI Prudential Nifty Index Fund, ICICI Prudential Nifty Next 50 Index Fund and ICICI Prudential Balanced Fund.ICICI Prudential Blended Plan - Plan A(Merging Scheme) has been merged into ICICI Prudential Equity - Arbitrage Fund(Surviving Scheme) after the close of business hours on April 22, 2016.Portfolio turnover has been computed as the ratio of the lower value of purchase and sales, to the average net assets in the past one year (since inception for schemes that have not completed a year). The figures are not netted for derivative transactions.Risk-free rate based on the last Overnight MIBOR cut-off of 6.18%**In addition to the fund manager managing this fund, the ADR/GDR exposure is managed by Mr. Ihab Dalwai.@@ Total Expense Ratio is weighted average for the month. Ratio excludes service tax on management fees and includes B-15 clawback reversal, if any.## Minimum number of installments for monthly frequency will be 6 and for Quarterly frequency will be 4. w.e.f February 01, 2017.* Minimum number of installments for daily, weekly and monthly frequency will be 6 and for Quarterly frequency will be 4. w.e.f February 01, 2017. Refer page No. 137 for definition of Flex STP and Value STP.&& Minimum number of installments for both monthly and quarterly will be 2. w.e.f February 01, 2017.*** In case the unit holder has opted for dividend payout option, the minimum amount for dividend payout shall be 100 (net of dividend distribution tax and other statutory levy, if any), else the dividend would be mandatorily reinvested.
Sharpe Ratio : 1.32
Average P/E : 22.32 Average P/BV : 5.94 Average Dividend Yield : 1.36
Portfolio Beta : 0.54 Std Dev (Annualised) : 0.54% Benchmark Std Dev (Annualised) : 0.73%
Portfolio as on April 30, 2017
Company/Issuer Rating % to % to NAV NAV Derivatives
Biocon Ltd. - Futures -0.38% Cipla Ltd. 0.26% Cipla Ltd. - Futures -0.27% Strides Shasun Ltd. 0.20% Strides Shasun Ltd. - Futures -0.20% Wockhardt Ltd. 0.11% Wockhardt Ltd. - Futures -0.11% Glenmark Pharmaceuticals Ltd. 0.10% Glenmark Pharmaceuticals Ltd. - Futures -0.10% Power 4.39% -4.42% Power Grid Corporation Of India Ltd. 1.08% Power Grid Corporation Of India Ltd. - Futures -1.09% NTPC Ltd. 0.90% NTPC Ltd. - Futures -0.91% Tata Power Company Ltd. 0.81% Tata Power Company Ltd. - Futures -0.81% CESC Ltd. 0.69% CESC Ltd. - Futures -0.69% Reliance Infrastructure Ltd. 0.63% Reliance Infrastructure Ltd. - Futures -0.63% PTC India Ltd. 0.14% PTC India Ltd. - Futures -0.14% Reliance Power Ltd. 0.09% Reliance Power Ltd. - Futures -0.09% NHPC Ltd. 0.06% NHPC Ltd. - Futures -0.06% Services 0.94% -0.94% Aditya Birla Nuvo Ltd. 0.94% Aditya Birla Nuvo Ltd. - Futures -0.94% Software 0.22% -0.23% Oracle Financial Services Software Ltd. 0.19% Oracle Financial Services Software Ltd. - Futures -0.19% Tech Mahindra Ltd. 0.03% Tech Mahindra Ltd. - Futures -0.03% Hexaware Technologies Ltd. 0.01% Hexaware Technologies Ltd. - Futures -0.01% Telecom - Equipment & Accessories 0.84% -0.85% Bharti Infratel Ltd. 0.84% Bharti Infratel Ltd. - Futures -0.85% Telecom - Services 0.76% -0.77% Tata Communications Ltd. 0.65% Tata Communications Ltd. - Futures -0.65% Idea Cellular Ltd. 0.11% Idea Cellular Ltd. - Futures -0.11% Textile Products 0.11% -0.11% Arvind Ltd. 0.11% Arvind Ltd. - Futures -0.11% Transportation 0.27% -0.27% Adani Ports and Special Economic Zone Ltd. 0.27% Adani Ports and Special Economic Zone Ltd. - Futures -0.27% Debt Holdings 28.69%
@ Government Securities - Short Term 0.68% 08.03% Uttar Pradesh SDL 2020 SOV 0.48% 08.20% Punjab SDL 2019 SOV 0.20% Corporate Securities 3.94% • Tata Capital Financial Services Ltd. ICRA AA+ 2.58% Vodafone Mobile Services Ltd.^^ FITCH AAA 0.65% Tata Motors Ltd. CARE AA+ 0.65% HDFC Ltd. CRISIL AAA 0.07% CPs and CDs 6.60% • HDFC Ltd. CRISIL A1+ 5.37% Bahadur Chand Investments Private Ltd. ICRA A1+ 1.23% Cash, Call, CBLO & Term Deposits 17.47% Net Current Assets 3.79% Total Net Assets 100.00%
Company/Issuer Rating % to % to NAV NAV Derivatives
ICICI Prudential Equity - Arbitrage Fund(An Open Ended Equity Fund)
R squared : 0.52
RiskometerThis Product is suitable for investors who are seeking*:
• Short term income generation solution
• An equity fund that aims for low volatility returns by using arbitrage and other derivative strategies in equity markets.
*Investors should consult their financial advisers if in doubt about whether the product is suitable for them.
Annual Portfolio Turnover Ratio : Equity - 1.59 times, Others (Debt and Derivatives) - 9.51 times Combined Annual Portfolio Turnover Ratio : 11.10 times

28
Style Box
Note : - “Portfolio Beta, Standard Deviation, R Squared, Sharpe Ratio and Tracking Error of the Scheme is not computed owing to the short time frame since launch of the Scheme.”Portfolio turnover has been computed as the ratio of the lower value of purchase and sales, to the average net assets in the past one year (since inception for schemes that have not completed a year). The figures are not netted for derivative transactions.**In addition to the fund manager managing this fund, the ADR/GDR exposure is managed by Mr. Ihab Dalwai.@@ Total Expense Ratio is weighted average for the month. Ratio excludes service tax on management fees and includes B-15 clawback reversal, if any.
Fund Managers** :
Manish Gunwani(Managing this fund since June, 2014 &Overall 20 years of experience)Atul Patel(Managing this fund since Feb, 2015 &Overall 7 Years of experience)
Indicative Investment Horizon: 3 years
Inception/Allotment date: 20-Jun-14
NAV (As on 28-Apr-17):IPGF1 Dividend Option : 12.30IPGF1 Direct Plan Dividend Option : 12.85
Options :Only Dividend payout facility available
Application Amount for freshSubscription :Not available
Min.Addl.Investment :Not available
Exit load for Redemption / Switch out:- Lumpsum Investment OptionNot Available
SIP :Not Available
SWP :Not Available
Min.Redemption Amt. :No redemption/repurchase of units shall be allowed prior to the maturity of the Scheme. Investors wishing to exit may do so, only in demat mode, by selling through BSE Limited or any of the stock exchange(s) where units of the Scheme will be listed as the Trustee may decide from time to time.
Fund Details
• Top Ten HoldingsDerivatives are considered at exposure value.
Diversified
Quantitative Indicators:
Monthly AAUM as on 30-Apr-17 : Rs. 620.84 crores
Closing AUM as on 30-Apr-17 : Rs. 591.97 crores
Average P/E : 33.47 Average P/BV : 7.57 Average Dividend Yield : 1.13
ICICI Prudential Growth Fund – Series 1A Close ended equity scheme
Returns of ICICI Prudential Growth Fund - Series 1 - Dividend Option as on April 30, 2017 - (IPGF1)
Portfolio as on April 30, 2017
Entry load : Nil
RiskometerThis Product is suitable for investors who are seeking*:
• Long term wealth creation solution
• A close ended diversifed equity fund that aims to provide capital appreciation by investing in equity and equity related instruments.
*Investors should consult their financial advisers if in doubt about whether the product is suitable for them.
Annual Portfolio Turnover Ratio : Equity - 0.56 times, Others (Debt and Derivatives) - 0.32 times Combined Annual Portfolio Turnover Ratio : 0.88 times
Dividend History : Refer page no. from 122 to 130
SIP Returns : Refer page no. from 118 to 120
Total Expense Ratio @@ :
IPGF1 : 2.40% p. a.
IPGF1 Direct Plan : 1.21% p. a.
Investment Objective : Refer page no. from 131 to 134
Auto 4.69% • Maruti Suzuki India Ltd. 3.72% Tata Motors Ltd. 0.97% Auto Ancillaries 2.74% Motherson Sumi Systems Ltd. 2.74% Banks 25.47% • ICICI Bank Ltd. 8.58% • HDFC Bank Ltd. 8.46% • State Bank Of India 4.35% Axis Bank Ltd. 2.63% Union Bank Of India 1.45% Cement 3.52% • Shree Cements Ltd. 3.52% Construction Project 5.21% • Larsen & Toubro Ltd. 5.21% Consumer Non Durables 11.46% Jubilant Foodworks Ltd. 2.50% Glaxosmithkline Consumer Healthcare Ltd. 2.37% Britannia Industries Ltd. 2.36% Hindustan Unilever Ltd. 2.21% Bajaj Corp Ltd. 2.02% Ferrous Metals 2.14% Tata Steel Ltd. 2.14% Finance 3.51% Bajaj Finserv Ltd. 2.21% HDFC Ltd. 1.30% Media & Entertainment 0.43% D.B. Corp Ltd. 0.43% Pharmaceuticals 9.84% • Cipla Ltd. 5.47% • IPCA Laboratories Ltd. 3.42% Divi's Laboratories Ltd. 0.96% Software 10.33% • HCL Technologies Ltd. 4.82% Infosys Ltd. 2.91% Info Edge (India) Ltd. 2.61%
Company/Issuer % to % to NAV NAV Derivatives
Company/Issuer % to % to NAV NAV Derivatives
Textile Products 3.70% • Page Industries Ltd. 3.70% Transportation 2.45% Container Corporation Of India Ltd. 2.45% Index Futures/Options 3.15% Nifty 50 Index - Futures 3.15% Short Term Debt and net current assets 11.36% Total Net Assets 100.00%
Notes:1. Different plans shall have different expense structure. The performance details provided herein are of ICICI Prudential Growth Fund - Series 1.2. The scheme is currently managed by and . Mr. has been managing this fund since . Total Schemes Manish Gunwani Atul Patel Manish Gunwani June 2014managed by the Fund Manager Refer annexure from page no. 91 for performance of other schemes currently managed by is 12 (11 are jointly managed). Manish Gunwani.Mr. has been managing this fund since . Total Schemes managed by the Fund Manager ). Refer annexure from Atul Patel Feb 2015 is 14 (13 are jointly managedpage no. 91 for performance of other schemes currently managed by . Atul Patel3. Date of inception: 20-Jun-14.4. Performance of dividend option would be Net of Dividend distribution tax, if any.5. As the Scheme has completed more than 1 year but less than 3 years, the performance details of only since inception and 1 year are provided herein.6. Past performance may or may not be sustained in future and the same may not necessarily provide the basis for comparison with other investment.7. Load is not considered for computation of returns.8. In case, the start/end date of the concerned period is a nonbusiness date (NBD), the NAV of the previous date is considered for computation of returns. The NAV per unit shown in the table is as on the start date of the said period
Scheme
NAV (Rs.) Per Unit (as on April 28,2017 : 12.30)
CAGR (%)
10.00
Nifty 50 Index (Benchmark)
Since inception
CurrentValue of
Investment of Rs. 10000
CAGR (%) Current Value of
Investment of Rs. 10000
1 Year 3 Year 5 Year
CAGR (%) Current Value of
Investment of Rs. 10000
CAGR (%) Current Value of
Investment of Rs. 10000
11.02 - -
Particulars
28.00 12791.74 - - - - 17.68 15923.68
18.58 11852.59 - - - - 7.78 12386.49

29
Style Box
Note : - “Portfolio Beta, Standard Deviation, R Squared, Sharpe Ratio and Tracking Error of the Scheme is not computed owing to the short time frame since launch of the Scheme.”Portfolio turnover has been computed as the ratio of the lower value of purchase and sales, to the average net assets in the past one year (since inception for schemes that have not completed a year). The figures are not netted for derivative transactions.**In addition to the fund manager managing this fund, the ADR/GDR exposure is managed by Mr. Ihab Dalwai.@@ Total Expense Ratio is weighted average for the month. Ratio excludes service tax on management fees and includes B-15 clawback reversal, if any.
Fund Managers** :
Vinay Sharma(Managing this fund since August, 2014 &Overall 11 years of experience)Mrinal Singh (Managing this fund since Aug, 2016 & Overall 14 years of experience)
Indicative Investment Horizon: 3.5 years
Inception/Allotment date: 01-Aug-14
NAV (As on 28-Apr-17):IPGF2 Dividend Option : 13.37IPGF2 Direct Plan Dividend Option : 13.94
Options :Only Dividend payout facility available
Application Amount for freshSubscription :Not available
Min.Addl.Investment :Not available
Exit load for Redemption / Switch out:- Lumpsum Investment OptionNil
SIP :Not Available
SWP :Not Available
Min.Redemption Amt. :No redemption/repurchase of units shall be allowed prior to the maturity of the Scheme. Investors wishing to exit may do so, only in demat mode, by selling through BSE Limited or any of the stock exchange(s) where units of the Scheme will be listed as the Trustee may decide from time to time.
Fund Details
Diversified
Quantitative Indicators:
• Top Ten HoldingsDerivatives are considered at exposure value.
Monthly AAUM as on 30-Apr-17 :Rs. 515.92 crores
Closing AUM as on 30-Apr-17 :Rs. 497.69 crores
ICICI Prudential Growth Fund – Series 2A Close ended equity scheme
Average P/E : 24.62 Average P/BV : 5.32 Average Dividend Yield : 1.09
Portfolio as on April 30, 2017
Returns of ICICI Prudential Growth Fund - Series 2 - Dividend Option as on April 30, 2017 - (IPGF2)
Entry load : Nil
RiskometerThis Product is suitable for investors who are seeking*:
• Long term wealth creation solution
• A close ended diversifed equity fund that aims to provide capital appreciation by investing in equity and equity related instruments.
*Investors should consult their financial advisers if in doubt about whether the product is suitable for them.
Annual Portfolio Turnover Ratio : Equity - 0.44 times, Others (Debt and Derivatives) - 0.03 times Combined Annual Portfolio Turnover Ratio : 0.47 times
Dividend History : Refer page no. from 122 to 130
SIP Returns : Refer page no. from 118 to 120
Total Expense Ratio @@ :
IPGF2 : 2.44% p. a.
IPGF2 Direct Plan : 1.23% p. a.
Investment Objective : Refer page no. from 131 to 134
Notes:1. Different plans shall have different expense structure. The performance details provided herein are of ICICI Prudential Growth Fund - Series 2.2. The scheme is currently managed by Vinay Sharma and Mrinal Singh. Mr. Vinay Sharma has been managing this fund since . Total Schemes managed Aug 2014by the Fund Manager Refer annexure from page no. 91 for performance of other schemes currently managed by Vinay Sharma.is 9 (7 are jointly managed).Mr. Mrinal Singh has been managing this fund since . Total Schemes managed by the Fund Manager Aug 2016 is 15 (14 are jointly managed [Excludes FoF Schemes]) . Refer annexure from page no. 91 for performance of other schemes currently managed by Mrinal Singh.3. Date of inception: 01-Aug-14.4. Performance of dividend option would be Net of Dividend distribution tax, if any.5. As the Scheme has completed more than 1 year but less than 3 years, the performance details of only since inception and 1 year are provided herein.6. Past performance may or may not be sustained in future and the same may not necessarily provide the basis for comparison with other investment.7. Load is not considered for computation of returns.8. In case, the start/end date of the concerned period is a nonbusiness date (NBD), the NAV of the previous date is considered for computation of returns. The NAV per unit shown in the table is as on the start date of the said period
Scheme
NAV (Rs.) Per Unit (as on April 28,2017 : 13.37)
CAGR (%)
10.00
Nifty 50 Index (Benchmark)
Since inception
CurrentValue of
Investment of Rs. 10000
CAGR (%) Current Value of
Investment of Rs. 10000
1 Year 3 Year 5 Year
CAGR (%) Current Value of
Investment of Rs. 10000
CAGR (%) Current Value of
Investment of Rs. 10000
11.38 - -
Particulars
30.91 13081.08 - - - - 18.28 15847.08
18.58 11852.59 - - - - 7.64 12237.98
Auto 6.47% • Tata Motors Ltd. 4.86% TVS Motor Company Ltd. 1.61% Banks 25.63% 1.12%• HDFC Bank Ltd. 7.96% • ICICI Bank Ltd. 6.14% ICICI Bank Ltd. - Futures 1.12%• The Federal Bank Ltd. 4.28% Union Bank Of India 2.26% State Bank Of India 1.98% Karur Vysya Bank Ltd. 1.97% DCB Bank Ltd. 1.04% Cement 6.00% • Shree Cements Ltd. 3.40% • Prism Cement Ltd. 2.60% Chemicals 1.81% Solar Industries India Ltd. 1.81% Consumer Durables 2.07% V.I.P. Industries Ltd. 2.07% Consumer Non Durables 3.95% • Nestle India Ltd. 3.33% Manpasand Beverages Ltd. 0.62% Finance 4.97% • Muthoot Finance Ltd. 2.66% Bajaj Finserv Ltd. 2.31% Gas 2.15% Aegis Logistics Ltd. 2.15% Media & Entertainment 2.18% Inox Leisure Ltd. 2.18% Pesticides 2.13% Rallis India Ltd. 2.13% Pharmaceuticals 6.91% Cipla Ltd. 2.30% Alembic Pharmaceuticals Ltd. 2.16% Pfizer Ltd. 1.43% Unichem Laboratories Ltd. 1.03%
Retailing 2.52% Aditya Birla Fashion and Retail Ltd. 2.52% Services 2.26% Thomas Cook (India) Ltd. 2.26% Software 16.48% • HCL Technologies Ltd. 4.60% • Infosys Ltd. 4.57% NIIT Technologies Ltd. 2.13% Tech Mahindra Ltd. 1.87% Info Edge (India) Ltd. 1.51% Quick Heal Technologies Ltd. 0.91% Persistent Systems Ltd. 0.89% Textile Products 2.25% SRF Ltd. 2.25% Transportation 2.11% Container Corporation Of India Ltd. 2.11% Short Term Debt and net current assets 8.99% Total Net Assets 100.00%
Company/Issuer % to % to NAV NAV Derivatives
Company/Issuer % to % to NAV NAV Derivatives

30
Style Box
Note : - “Portfolio Beta, Standard Deviation, R Squared, Sharpe Ratio and Tracking Error of the Scheme is not computed owing to the short time frame since launch of the Scheme.” Portfolio turnover has been computed as the ratio of the lower value of purchase and sales, to the average net assets in the past one year (since inception for schemes that have not completed a year). The figures are not netted for derivative transactions.**In addition to the fund manager managing this fund, the ADR/GDR exposure is managed by Mr. Ihab Dalwai. @@ Total Expense Ratio is weighted average for the month. Ratio excludes service tax on management fees and includes B-15 clawback reversal, if any.
Fund Managers** :
Manish Gunwani(Managing this fund since Oct, 2014 &Overall 20 years of experience)Ashwin Jain(Managing this fund since Oct, 2014 &Overall 9 years of experience)
Indicative Investment Horizon: 3.5 years
Inception/Allotment date: 10-Oct-14
NAV (As on 28-Apr-17):IPGF3 Dividend Option : 12.75IPGF3 Direct Plan Dividend Option : 13.24
Options :Only Dividend payout facility available
Application Amount for freshSubscription :Not available
Min.Addl.Investment :Not available
Exit load for Redemption / Switch out:- Lumpsum Investment OptionNil
SIP :Not Available
SWP :Not Available
Min.Redemption Amt. :No redemption/repurchase of units shall be allowed prior to the maturity of the Scheme. Investors wishing to exit may do so, only in demat mode, by selling through BSE Limited or any of the stock exchange(s) where units of the Scheme will be listed as the Trustee may decide from time to time.
Fund Details
Diversified
Quantitative Indicators: Average P/E : 18.70 Average P/BV : 5.29 Average Dividend Yield : 0.90
• Top Ten HoldingsDerivatives are considered at exposure value.
Monthly AAUM as on 30-Apr-17 :Rs. 375.64 crores
Closing AUM as on 30-Apr-17 :Rs. 357.68 crores
ICICI Prudential Growth Fund – Series 3A Close ended equity scheme
Entry load : Nil
Riskometer
• Long term wealth creation solution
• A close ended diversified equity fund that aims to provide capital appreciation by investing in equity and equity related instruments.
*Investors should consult their financial advisers if in doubt about whether the product is suitable for them.
This Product is suitable for investors who are seeking*:
Annual Portfolio Turnover Ratio : Equity - 0.61 times, Others (Debt and Derivatives) - 0.07 times Combined Annual Portfolio Turnover Ratio : 0.68 times
Portfolio as on April 30, 2017
Returns of ICICI Prudential Growth Fund - Series 3 - Dividend Option as on April 30, 2017 - (IPGF3)
Dividend History : Refer page no. from 122 to 130
SIP Returns : Refer page no. from 118 to 120
Total Expense Ratio @@ :
IPGF3 : 2.52% p. a.
IPGF3 Direct Plan : 1.34% p. a.
Investment Objective : Refer page no. from 131 to 134
Auto 4.38%
• Maruti Suzuki India Ltd. 4.38%
Auto Ancillaries 3.54%
Motherson Sumi Systems Ltd. 3.54%
Banks 17.89%
• HDFC Bank Ltd. 7.95%
• ICICI Bank Ltd. 5.87%
Axis Bank Ltd. 4.07%
Cement 4.17%
• JK Lakshmi Cement Ltd. 4.17%
Construction 4.50%
KNR Constructions Ltd. 3.04%
Poddar Housing and Development Ltd. 1.47%
Finance 16.92%
• Bajaj Finserv Ltd. 5.87%
• BSE Ltd. 5.24%
IDFC Ltd. 3.45%
LIC Housing Finance Ltd. 2.35%
Industrial Products 1.79%
WPIL Ltd. 1.79%
Petroleum Products 2.01%
Castrol India Ltd. 2.01%
Pharmaceuticals 15.21%
Abbott India Ltd. 3.76%
Cipla Ltd. 3.47%
Pfizer Ltd. 3.18%
Unichem Laboratories Ltd. 2.04%
Sun Pharmaceutical Industries Ltd. 1.95%
Divi's Laboratories Ltd. 0.81%
Software 11.20%
• HCL Technologies Ltd. 4.94%
• Tech Mahindra Ltd. 4.22%
Larsen & Toubro Infotech Ltd. 2.03%
Textile Products 2.76%
SRF Ltd. 2.76%
Transportation 11.04%
• VRL Logistics Ltd. 6.87%
• Spicejet Ltd. 4.17%
Index Futures/Options 0.39%
Nifty 50 Index - Futures 0.39%
Short Term Debt and net current assets 4.21%
Total Net Assets 100.00%
Company/Issuer % to % to NAV NAV Derivatives
Company/Issuer % to % to NAV NAV Derivatives
Notes:1. Different plans shall have different expense structure. The performance details provided herein are of ICICI Prudential Growth Fund - Series 3.2. The scheme is currently managed by Manish Gunwani and Ashwin Jain. Mr. Manish Gunwani has been managing this fund since Oct 2014. Total Schemes managed by the Fund Manager Refer annexure from page no. 91 for performance of other schemes currently managed by Manish is 12 (11 are jointly managed).Gunwani.Mr. Ashwin Jain has been managing this fund since Oct 2014. Total Schemes managed by the Fund Manager ). Refer annexure from is 3 (3 are jointly managedpage no. 91 for performance of other schemes currently managed by Ashwin Jain. 3. Date of inception: 10-Oct-14.4. Performance of dividend option would be Net of Dividend distribution tax, if any.5. As the Scheme has completed more than 1 year but less than 3 years, the performance details of only since inception and 1 year are provided herein.6. Past performance may or may not be sustained in future and the same may not necessarily provide the basis for comparison with other investment.7. Load is not considered for computation of returns.8. In case, the start/end date of the concerned period is a nonbusiness date (NBD), the NAV of the previous date is considered for computation of returns. The NAV per unit shown in the table is as on the start date of the said period
Scheme
NAV (Rs.) Per Unit (as on April 28,2017 : 12.75)
CAGR (%)
10.00
Nifty 50 Index (Benchmark)
Since inception
CurrentValue of
Investment of Rs. 10000
CAGR (%) Current Value of
Investment of Rs. 10000
1 Year 3 Year 5 Year
CAGR (%) Current Value of
Investment of Rs. 10000
CAGR (%) Current Value of
Investment of Rs. 10000
10.24 - -
Particulars
24.59 12451.17 - - - - 11.93 13330.60
18.58 11852.59 - - - - 6.84 11837.29

31
Style Box
Note : - “Portfolio Beta, Standard Deviation, R Squared, Sharpe Ratio and Tracking Error of the Scheme is not computed owing to the short time frame since launch of the Scheme.”Portfolio turnover has been computed as the ratio of the lower value of purchase and sales, to the average net assets in the past one year (since inception for schemes that have not completed a year). The figures are not netted for derivative transactions.**In addition to the fund manager managing this fund, the ADR/GDR exposure is managed by Mr. Ihab Dalwai.@@ Total Expense Ratio is weighted average for the month. Ratio excludes service tax on management fees and includes B-15 clawback reversal, if any.
Fund Managers** :
Vinay Sharma(Managing this fund since Nov, 2014 &Overall 11 years of experience)Mrinal Singh (Managing this fund since Aug, 2016 & Overall 14 years of experience)
Indicative Investment Horizon: 3.5 years
Inception/Allotment date: 01-Nov-14
NAV (As on 28-Apr-17):IPGF4 Dividend Option : 13.12IPGF4 Direct Plan Dividend Option : 13.66
Options :Only Dividend payout facility available
Application Amount for freshSubscription :Not available
Min.Addl.Investment :Not available
Exit load for Redemption / Switch out:- Lumpsum Investment OptionNil
SIP :Not Available
SWP :Not Available
Min.Redemption Amt. :No redemption/repurchase of units shall be allowed prior to the maturity of the Scheme. Investors wishing to exit may do so, only in demat mode, by selling through BSE Limited or any of the stock exchange(s) where units of the Scheme will be listed as the Trustee may decide from time to time.
Fund Details
Diversified
Quantitative Indicators: Average P/E : 24.06 Average P/BV : 5.15 Average Dividend Yield : 1.13
Monthly AAUM as on 30-Apr-17 :Rs. 190.09 crores
Closing AUM as on 30-Apr-17 : Rs. 182.30 crores
ICICI Prudential Growth Fund – Series 4A Close ended equity scheme
Entry load : Nil
RiskometerThis Product is suitable for investors who are seeking*:
• Long term wealth creation solution
• A close ended diversified equity fund that aims to provide capital appreciation by investing in equity and equity related instruments.
*Investors should consult their financial advisers if in doubt about whether the product is suitable for them.
Annual Portfolio Turnover Ratio : Equity - 0.51 times, Others (Debt and Derivatives) - 0.12 times Combined Annual Portfolio Turnover Ratio : 0.63 times
Portfolio as on April 30, 2017
Returns of ICICI Prudential Growth Fund - Series 4 - Dividend Option as on April 30, 2017 - (IPGF4)
• Top Ten HoldingsDerivatives are considered at exposure value.
Dividend History : Refer page no. from 122 to 130
SIP Returns : Refer page no. from 118 to 120
Total Expense Ratio @@ :
IPGF4 : 2.58% p. a.
IPGF4 Direct Plan : 1.26% p. a.
Investment Objective : Refer page no. from 131 to 134
Auto 7.79%
• Maruti Suzuki India Ltd. 4.36%
• Tata Motors Ltd. 3.43%
Auto Ancillaries 4.41%
• Motherson Sumi Systems Ltd. 4.41%
Banks 20.46% 2.50%
• ICICI Bank Ltd. 6.90%
• HDFC Bank Ltd. 6.83%
Yes Bank Ltd. 2.19%
State Bank Of India 2.13%
IndusInd Bank Ltd. 1.57%
Union Bank Of India 0.85%
Union Bank Of India - Futures 2.50%
Cement 6.77%
• Shree Cements Ltd. 3.43%
JK Lakshmi Cement Ltd. 3.34%
Chemicals 4.60%
• Tata Chemicals Ltd. 4.60%
Consumer Durables 3.26%
V.I.P. Industries Ltd. 3.26%
Consumer Non Durables 1.94%
Manpasand Beverages Ltd. 1.94%
Finance 2.98%
Bajaj Finserv Ltd. 2.98%
Industrial Capital Goods 3.42%
Bharat Electronics Ltd. 3.42%
Industrial Products 3.29%
Cummins India Ltd. 3.29%
Media & Entertainment 3.29%
Inox Leisure Ltd. 3.29%
Pesticides 3.00%
Rallis India Ltd. 3.00%
Petroleum Products 3.68%
• Indian Oil Corporation Ltd. 3.68%
Pharmaceuticals 8.35%
Lupin Ltd. 2.71%
IPCA Laboratories Ltd. 2.24%
Unichem Laboratories Ltd. 1.94%
Pfizer Ltd. 1.46%
Services 2.25%
Thomas Cook (India) Ltd. 2.25%
Software 13.93%
• HCL Technologies Ltd. 5.09%
• Infosys Ltd. 4.15%
Persistent Systems Ltd. 2.76%
Larsen & Toubro Infotech Ltd. 1.93%
Transportation 2.13%
Interglobe Aviation Ltd. 2.13%
Short Term Debt and net current assets 1.95%
Total Net Assets 100.00%
Company/Issuer % to % to NAV NAV Derivatives
Company/Issuer % to % to NAV NAV Derivatives
Notes:1. Different plans shall have different expense structure. The performance details provided herein are of ICICI Prudential Growth Fund - Series 4.2. The scheme is currently managed by Vinay Sharma and Mrinal Singh. Mr. Vinay Sharma has been managing this fund since Nov 2014. Total Schemes managed by the Fund Manager Refer annexure from page no. 91 for performance of other schemes currently managed by Vinay Sharma.is 9 (7 are jointly managed).Mr. Mrinal Singh has been managing this fund since . Total Schemes managed by the Fund Manager Aug 2016 is 15 (14 are jointly managed [Excludes FoF Schemes]) . Refer annexure from page no. 91 for performance of other schemes currently managed by Mrinal Singh.3. Date of inception: 01-Nov-14.4. Performance of dividend option would be Net of Dividend distribution tax, if any.5. As the Scheme has completed more than 1 year but less than 3 years, the performance details of only since inception and 1 year are provided herein.6. Past performance may or may not be sustained in future and the same may not necessarily provide the basis for comparison with other investment.7. Load is not considered for computation of returns.8. In case, the start/end date of the concerned period is a nonbusiness date (NBD), the NAV of the previous date is considered for computation of returns. The NAV per unit shown in the table is as on the start date of the said period
Scheme
NAV (Rs.) Per Unit (as on April 28,2017 : 13.12)
CAGR (%)
10.00
Nifty 50 Index (Benchmark)
Since inception
CurrentValue of
Investment of Rs. 10000
CAGR (%) Current Value of
Investment of Rs. 10000
1 Year 3 Year 5 Year
CAGR (%) Current Value of
Investment of Rs. 10000
CAGR (%) Current Value of
Investment of Rs. 10000
11.35 - -
Particulars
28.76 12866.64 - - - - 16.42 14603.64
18.58 11852.59 - - - - 4.58 11179.80

32
Style Box
Note : - “Portfolio Beta, Standard Deviation, R Squared, Sharpe Ratio and Tracking Error of the Scheme is not computed owing to the short time frame since launch of the Scheme.”Portfolio turnover has been computed as the ratio of the lower value of purchase and sales, to the average net assets in the past one year (since inception for schemes that have not completed a year). The figures are not netted for derivative transactions.**In addition to the fund manager managing this fund, the ADR/GDR exposure is managed by Mr. Ihab Dalwai.@@ Total Expense Ratio is weighted average for the month. Ratio excludes service tax on management fees and includes B-15 clawback reversal, if any.
Fund Managers** :
Vinay Sharma(Managing this fund since Dec, 2014 & Overall 11 years of experience) Mrinal Singh (Managing this fund since Aug, 2016 & Overall 14 years of experience)
Indicative Investment Horizon: 3.5 years
Inception/Allotment date: 19-Dec-14
NAV (As on 28-Apr-17):IPGF5 Dividend Option : 11.81IPGF5 Direct Plan Dividend Option : 12.26
Options :Only Dividend payout facility available
Application Amount for freshSubscription :Not available
Min.Addl.Investment :Not available
Entry load : Nil
Exit load for Redemption / Switch out:- Lumpsum Investment OptionNil
SIP :Not Available
SWP :Not Available
Min.Redemption Amt. :No redemption/repurchase of units shall be allowed prior to the maturity of the Scheme. Investors wishing to exit may do so, only in demat mode, by selling through BSE Limited or any of the stock exchange(s) where units of the Scheme will be listed as the Trustee may decide from time to time.
Fund Details
Diversified
Quantitative Indicators: Average P/E : 22.38 Average P/BV : 4.44 Average Dividend Yield : 1.00
Monthly AAUM as on 30-Apr-17 : Rs. 162.63 crores
Closing AUM as on 30-Apr-17 : Rs. 157.86 crores
ICICI Prudential Growth Fund – Series 5A Close ended equity scheme
RiskometerThis Product is suitable for investors who are seeking*:
• Long term wealth creation solution
• A close ended diversified equity fund that aims to provide capital appreciation by investing in equity and equity related instruments.
*Investors should consult their financial advisers if in doubt about whether the product is suitable for them.
Annual Portfolio Turnover Ratio : Equity - 0.64 times, Others (Debt and Derivatives) - 0.14 times Combined Annual Portfolio Turnover Ratio : 0.78 times
Portfolio as on April 30, 2017
Returns of ICICI Prudential Growth Fund - Series 5 - Dividend Option as on April 30, 2017 - (IPGF5)
• Top Ten HoldingsDerivatives are considered at exposure value.
Auto 3.84% • Tata Motors Ltd. 3.84% Auto Ancillaries 3.25% Amara Raja Batteries Ltd. 3.25% Banks 26.20% 3.23%• ICICI Bank Ltd. 7.89% • HDFC Bank Ltd. 6.66% • The South Indian Bank Ltd. 4.39% • Karur Vysya Bank Ltd. 4.03% The Federal Bank Ltd. 3.10% Union Bank Of India 0.13% Union Bank Of India - Futures 3.23% Cement 6.83% • Shree Cements Ltd. 3.43% JK Lakshmi Cement Ltd. 3.40% Construction Project 3.42% • Larsen & Toubro Ltd. 3.42% Consumer Durables 2.64% Bata India Ltd. 2.64% Consumer Non Durables 5.00% Jubilant Foodworks Ltd. 3.04% Manpasand Beverages Ltd. 1.95% Healthcare Services 3.19% Narayana Hrudayalaya Ltd. 3.19% Media & Entertainment 5.24% Inox Leisure Ltd. 2.76% Hathway Cable & Datacom Ltd. 2.48% Pesticides 1.63% Rallis India Ltd. 1.63% Pharmaceuticals 10.43% • Lupin Ltd. 3.72% Cipla Ltd. 2.94% IPCA Laboratories Ltd. 2.04% Pfizer Ltd. 1.72% Services 4.20% • Thomas Cook (India) Ltd. 4.20%
Software 10.29% • HCL Technologies Ltd. 4.65% Persistent Systems Ltd. 2.57% Quick Heal Technologies Ltd. 2.24% Tech Mahindra Ltd. 0.83% Transportation 2.13% Interglobe Aviation Ltd. 2.13% Short Term Debt and net current assets 8.48% Total Net Assets 100.00%
Dividend History : Refer page no. from 122 to 130
SIP Returns : Refer page no. from 118 to 120
Total Expense Ratio @@ :
IPGF5 : 2.60% p. a.
IPGF5 Direct Plan : 1.35% p. a.
Investment Objective : Refer page no. from 131 to 134
Company/Issuer % to % to NAV NAV Derivatives
Company/Issuer % to % to NAV NAV Derivatives
Notes:1. Different plans shall have different expense structure. The performance details provided herein are of ICICI Prudential Growth Fund - Series 5.2. The scheme is currently managed by Vinay Sharma and Mrinal Singh. Mr. Vinay Sharma has been managing this fund since Dec 2014. Total Schemes managed by the Fund Manager Refer annexure from page no. 91 for performance of other schemes currently managed by Vinay Sharma.is 9 (7 are jointly managed).Mr. Mrinal Singh has been managing this fund since . Total Schemes managed by the Fund Manager Aug 2016 is 15 (14 are jointly managed [Excludes FoF Schemes]) . Refer annexure from page no. 91 for performance of other schemes currently managed by Mrinal Singh.3. Date of inception: 19-Dec-14.4. Performance of dividend option would be Net of Dividend distribution tax, if any.5. As the Scheme has completed more than 1 year but less than 3 years, the performance details of only since inception and 1 year are provided herein.6. Past performance may or may not be sustained in future and the same may not necessarily provide the basis for comparison with other investment.7. Load is not considered for computation of returns.8. In case, the start/end date of the concerned period is a nonbusiness date (NBD), the NAV of the previous date is considered for computation of returns. The NAV per unit shown in the table is as on the start date of the said period
Scheme
NAV (Rs.) Per Unit (as on April 28,2017 : 11.81)
CAGR (%)
10.00
Nifty 50 Index (Benchmark)
Since inception
CurrentValue of
Investment of Rs. 10000
CAGR (%) Current Value of
Investment of Rs. 10000
1 Year 3 Year 5 Year
CAGR (%) Current Value of
Investment of Rs. 10000
CAGR (%) Current Value of
Investment of Rs. 10000
9.92 - -
Particulars
26.83 12674.31 - - - - 10.19 12572.92
18.58 11852.59 - - - - 5.36 11311.64

33
Style Box
Note : - “Portfolio Beta, Standard Deviation, R Squared, Sharpe Ratio and Tracking Error of the Scheme is not computed owing to the shorttime frame since launch of the Scheme.”Portfolio turnover has been computed as the ratio of the lower value of purchase and sales, to the average net assets in the past one year(since inception for schemes that have not completed a year). The figures are not netted for derivative transactions.**In addition to the fund manager managing this fund, the ADR/GDR exposure is managed by Mr. Ihab Dalwai.@@ Total Expense Ratio is weighted average for the month. Ratio excludes service tax on management fees and includes B-15 clawback reversal, if any.
Fund Managers** :
Vinay Sharma(Managing this fund since Jan, 2015 &Overall 11 years of experience)Mrinal Singh (Managing this fund since Aug, 2016 & Overall 14 years of experience)
Indicative Investment Horizon: 3.5 years
Inception/Allotment date: 07-Jan-15
NAV (As on 28-Apr-17):IPGF6 Dividend Option : 11.54IPGF6 Direct Plan Dividend Option : 11.99
Options :Only Dividend payout facility available
Application Amount for freshSubscription :Not available
Min.Addl.Investment :Not available
Entry load : Nil
Exit load for Redemption / Switch out:- Lumpsum Investment OptionNil
SIP :Not Available
SWP :Not Available
Min.Redemption Amt. :No redemption/repurchase of units shall be allowed prior to the maturity of the Scheme. Investors wishing to exit may do so, only in demat mode, by selling through BSE Limited or any of the stock exchange(s) where units of the Scheme will be listed as the Trustee may decide from time to time.
Fund Details
Diversified
Quantitative Indicators: Average P/E : 22.86 Average P/BV : 4.69 Average Dividend Yield : 1.03
Monthly AAUM as on 30-Apr-17 : Rs. 210.93 crores
Closing AUM as on 30-Apr-17 :Rs. 205.67 crores
ICICI Prudential Growth Fund – Series 6A Close ended equity scheme
RiskometerThis Product is suitable for investors who are seeking*:
• Long term wealth creation solution
• A close ended diversified equity fund that aims to provide capital appreciation by investing in equity and equity related instruments.
*Investors should consult their financial advisers if in doubt about whether the product is suitable for them.
Annual Portfolio Turnover Ratio : Equity - 0.70 times, Others (Debt and Derivatives) - 0.13 times Combined Annual Portfolio Turnover Ratio : 0.83 times
Returns of ICICI Prudential Growth Fund - Series 6 - Dividend Option as on April 30, 2017 - (IPGF6)
Portfolio as on April 30, 2017
Dividend History : Refer page no. from 122 to 130
SIP Returns : Refer page no. from 118 to 120
Total Expense Ratio @@ :
IPGF6 : 2.57% p. a.
IPGF6 Direct Plan : 1.30% p. a.
Investment Objective : Refer page no. from 131 to 134
• Top Ten HoldingsDerivatives are considered at exposure value.
Company/Issuer % to % to NAV NAV Derivatives
Company/Issuer % to % to NAV NAV Derivatives
Auto 4.50%
• Tata Motors Ltd. 4.50%
Auto Ancillaries 3.30%
Motherson Sumi Systems Ltd. 3.30%
Banks 24.76% 3.30%
• ICICI Bank Ltd. 7.82%
• HDFC Bank Ltd. 6.63%
• Karur Vysya Bank Ltd. 4.03%
• The Federal Bank Ltd. 3.65%
The South Indian Bank Ltd. 2.61%
Union Bank Of India 0.02%
Union Bank Of India - Futures 3.30%
Cement 6.79%
• Shree Cements Ltd. 3.41%
• JK Lakshmi Cement Ltd. 3.38%
Construction 3.38%
Brigade Enterprises Ltd. 2.12%
Poddar Housing and Development Ltd. 1.26%
Construction Project 3.44%
• Larsen & Toubro Ltd. 3.44%
Consumer Durables 2.59%
Bata India Ltd. 2.59%
Consumer Non Durables 4.95%
Jubilant Foodworks Ltd. 3.01%
Manpasand Beverages Ltd. 1.95%
Healthcare Services 2.77%
Narayana Hrudayalaya Ltd. 2.77%
Media & Entertainment 5.49%
Hathway Cable & Datacom Ltd. 3.30%
Inox Leisure Ltd. 2.19%
Pesticides 2.54%
Rallis India Ltd. 2.54%
Pharmaceuticals 7.14%
• Lupin Ltd. 3.63%
IPCA Laboratories Ltd. 2.05%
Pfizer Ltd. 1.46%
Services 3.23%
Thomas Cook (India) Ltd. 3.23%
Software 11.42%
• HCL Technologies Ltd. 4.31%
Persistent Systems Ltd. 2.66%
NIIT Technologies Ltd. 2.24%
Quick Heal Technologies Ltd. 2.21%
Transportation 2.12%
Interglobe Aviation Ltd. 2.12%
Short Term Debt and net current assets 8.25%
Total Net Assets 100.00%
Notes:1. Different plans shall have different expense structure. The performance details provided herein are of ICICI Prudential Growth Fund - Series 6.2. The scheme is currently managed by Vinay Sharma and Mrinal Singh. Mr. Vinay Sharma has been managing this fund since Jan 2015. Total Schemes managed by the Fund Manager Refer annexure from page no. 91 for performance of other schemes currently managed by Vinay Sharma.is 9 (7 are jointly managed).Mr. Mrinal Singh has been managing this fund since . Total Schemes managed by the Fund Manager Aug 2016 is 15 (14 are jointly managed [Excludes FoF Schemes]) . Refer annexure from page no. 91 for performance of other schemes currently managed by Mrinal Singh.3. Date of inception: 07-Jan-15.4. Performance of dividend option would be Net of Dividend distribution tax, if any.5. As the Scheme has completed more than 1 year but less than 3 years, the performance details of only since inception and 1 year are provided herein.6. Past performance may or may not be sustained in future and the same may not necessarily provide the basis for comparison with other investment.7. Load is not considered for computation of returns.8. In case, the start/end date of the concerned period is a nonbusiness date (NBD), the NAV of the previous date is considered for computation of returns. The NAV per unit shown in the table is as on the start date of the said period
Scheme
NAV (Rs.) Per Unit (as on April 28,2017 : 11.54)
CAGR (%)
10.00
Nifty 50 Index (Benchmark)
Since inception
CurrentValue of
Investment of Rs. 10000
CAGR (%) Current Value of
Investment of Rs. 10000
1 Year 3 Year 5 Year
CAGR (%) Current Value of
Investment of Rs. 10000
CAGR (%) Current Value of
Investment of Rs. 10000
9.73 - -
Particulars
26.56 12647.41 - - - - 9.41 12305.93
18.58 11852.59 - - - - 6.18 11483.50

34
Style Box
Note : - “Portfolio Beta, Standard Deviation, R Squared, Sharpe Ratio and Tracking Error of the Scheme is not computed owing to the shorttime frame since launch of the Scheme.”Portfolio turnover has been computed as the ratio of the lower value of purchase and sales, to the average net assets in the past one year(since inception for schemes that have not completed a year). The figures are not netted for derivative transactions.**In addition to the fund manager managing this fund, the ADR/GDR exposure is managed by Mr. Ihab Dalwai.@@ Total Expense Ratio is weighted average for the month. Ratio excludes service tax on management fees and includes B-15 clawback reversal, if any.
Fund Managers** :
Manish Gunwani(Managing this fund since Jan, 2015 &Overall 20 years of experience)Atul Patel(Managing this fund since Feb, 2015 &Overall 7 Years of experience)
Indicative Investment Horizon: 3.5 years
Inception/Allotment date: 22-Jan-15
NAV (As on 28-Apr-17):IPGF7 Dividend Option : 11.87IPGF7 Direct Plan Dividend Option : 12.25
Options :Only Dividend payout facility available
Application Amount for freshSubscription :Not available
Min.Addl.Investment :Not available
Exit load for Redemption / Switch out:- Lumpsum Investment OptionNil
SIP :Not Available
SWP :Not Available
Min.Redemption Amt. :No redemption/repurchase of units shall be allowed prior to the maturity of the Scheme. Investors wishing to exit may do so, only in demat mode, by selling through BSE Limited or any of the stock exchange(s) where units of the Scheme will be listed as the Trustee may decide from time to time.
Fund Details
Diversified
Quantitative Indicators: Average P/E : 25.50 Average P/BV : 4.80 Average Dividend Yield : 0.80
• Top Ten Holdings
Monthly AAUM as on 30-Apr-17 : Rs. 107.31 crores
Closing AUM as on 30-Apr-17 : Rs. 103.80 crores
ICICI Prudential Growth Fund – Series 7A Close ended equity scheme
Entry load : Nil
RiskometerThis Product is suitable for investors who are seeking*:
• Long term wealth creation solution
• A close ended diversified equity fund that aims to provide capital appreciation by investing in equity and equity related instruments.
*Investors should consult their financial advisers if in doubt about whether the product is suitable for them.
Annual Portfolio Turnover Ratio : Equity - 0.79 times, Others (Debt and Derivatives) - 0.03 times Combined Annual Portfolio Turnover Ratio : 0.82 times
Returns of ICICI Prudential Growth Fund - Series 7 - Dividend Option as on April 30, 2017 - (IPGF7)
Portfolio as on April 30, 2017
Dividend History : Refer page no. from 122 to 130
SIP Returns : Refer page no. from 118 to 120
Total Expense Ratio @@ :
IPGF7 : 2.68% p. a.
IPGF7 Direct Plan : 1.53% p. a.
Investment Objective : Refer page no. from 131 to 134
Company/Issuer % to NAV
Auto 3.39%
Maruti Suzuki India Ltd. 3.39%
Auto Ancillaries 4.53%
• Motherson Sumi Systems Ltd. 4.53%
Banks 20.85%
• ICICI Bank Ltd. 7.88%
• HDFC Bank Ltd. 5.68%
State Bank Of India 4.20%
Axis Bank Ltd. 3.09%
Cement 5.58%
• JK Lakshmi Cement Ltd. 5.58%
Construction 14.72%
• KNR Constructions Ltd. 7.53%
• PNC Infratech Ltd. 7.18%
Construction Project 0.44%
Supreme Infrastructure India Ltd. 0.44%
Consumer Non Durables 3.87%
Glaxosmithkline Consumer Healthcare Ltd. 3.87%
Finance 4.39%
Sundaram Finance Ltd. 4.39%
Healthcare Services 2.65%
Narayana Hrudayalaya Ltd. 2.65%
Industrial Products 5.38%
• Cummins India Ltd. 5.38%
Pharmaceuticals 13.43%
• Cipla Ltd. 5.04%
Alembic Pharmaceuticals Ltd. 4.42%
IPCA Laboratories Ltd. 3.96%
Services 3.44%
Thomas Cook (India) Ltd. 3.44%
Software 9.50%
• HCL Technologies Ltd. 4.95%
• Info Edge (India) Ltd. 4.54%
Short Term Debt and net current assets 7.82%
Total Net Assets 100.00%
Company/Issuer % to NAV
Notes:1. Different plans shall have different expense structure. The performance details provided herein are of ICICI Prudential Growth Fund - Series 7.2. The scheme is currently managed by and . Mr. has been managing this fund since Jan 2015. Total Schemes Manish Gunwani Atul Patel Manish Gunwanimanaged by the Fund Manager Refer annexure from page no. 91 for performance of other schemes currently managed by Ihab is 12 (11 are jointly managed).Manish Gunwani.Mr. has been managing this fund since . Total Schemes managed by the Fund Manager ). Refer annexure from Atul Patel Feb 2015 is 14 (13 are jointly managedpage no. 91 for performance of other schemes currently managed by . Atul Patel3. Date of inception: 22-Jan-15.4. Performance of dividend option would be Net of Dividend distribution tax, if any.5. As the Scheme has completed more than 1 year but less than 3 years, the performance details of only since inception and 1 year are provided herein.6. Past performance may or may not be sustained in future and the same may not necessarily provide the basis for comparison with other investment.7. Load is not considered for computation of returns.8. In case, the start/end date of the concerned period is a nonbusiness date (NBD), the NAV of the previous date is considered for computation of returns. The NAV per unit shown in the table is as on the start date of the said period
Scheme
NAV (Rs.) Per Unit (as on April 28,2017 : 11.87)
CAGR (%)
10.00
Nifty 50 Index (Benchmark)
Since inception
CurrentValue of
Investment of Rs. 10000
CAGR (%) Current Value of
Investment of Rs. 10000
1 Year 3 Year 5 Year
CAGR (%) Current Value of
Investment of Rs. 10000
CAGR (%) Current Value of
Investment of Rs. 10000
9.62 - -
Particulars
31.39 13129.16 - - - - 10.86 12630.25
18.58 11852.59 - - - - 2.69 10619.36

35
Style Box
Note : - “Portfolio Beta, Standard Deviation, R Squared, Sharpe Ratio and Tracking Error of the Scheme is not computed owing to the shorttime frame since launch of the Scheme.”Portfolio turnover has been computed as the ratio of the lower value of purchase and sales, to the average net assets in the past one year(since inception for schemes that have not completed a year). The figures are not netted for derivative transactions.**In addition to the fund manager managing this fund, the ADR/GDR exposure is managed by Mr. Ihab Dalwai.@@ Total Expense Ratio is weighted average for the month. Ratio excludes service tax on management fees and includes B-15 clawback reversal, if any.
Fund Managers** :
George Heber Joseph(Managing this fund since Apr, 2015 &Overall 13 years of experience)Chintan Haria(Managing this fund since Jan, 2015 & Overall 10 years of experience)
Indicative Investment Horizon: 3 years
Inception/Allotment date: 30-Jan-15
NAV (As on 28-Apr-17):IPGF8 Dividend Option : 10.15IPGF8 Direct Plan Dividend Option : 10.21
Options :Only Dividend payout facility available
Application Amount for freshSubscription :Not available
Min.Addl.Investment :Not available
Exit load for Redemption / Switch out:- Lumpsum Investment OptionNil
SIP :Not Available
SWP :Not Available
Min.Redemption Amt. :No redemption/repurchase of units shall be allowed prior to the maturity of the Scheme. Investors wishing to exit may do so, only in demat mode, by selling through BSE Limited or any of the stock exchange(s) where units of the Scheme will be listed as the Trustee may decide from time to time.
Fund Details
Diversified
Quantitative Indicators: Average P/E : 24.79 Average P/BV : 6.19 Average Dividend Yield : 1.12
• Top Ten HoldingsDerivatives are considered at exposure value.
Monthly AAUM as on 30-Apr-17 :Rs. 72.70 crores
Closing AUM as on 30-Apr-17 : Rs. 70.48 crores
ICICI Prudential Growth Fund – Series 8A Close ended equity scheme
Entry load : Nil
RiskometerThis Product is suitable for investors who are seeking*:
• Long term wealth creation solution
• A close ended diversified equity fund that aims to provide capital appreciation by investing in equity and equity related instruments.
*Investors should consult their financial advisers if in doubt about whether the product is suitable for them.
Auto 11.31%
• Tata Motors Ltd. 6.18%
Mahindra & Mahindra Ltd. 5.14%
Banks 6.96%
Axis Bank Ltd. 4.80%
Oriental Bank Of Commerce 2.16%
Construction Project 5.43%
• Larsen & Toubro Ltd. 5.43%
Consumer Non Durables 6.79%
• Glaxosmithkline Consumer Healthcare Ltd. 6.79%
Finance 12.31%
• CRISIL Ltd. 7.03%
• Sundaram Finance Ltd. 5.28%
Petroleum Products 14.13%
• Hindustan Petroleum Corporation Ltd. 8.05%
• Indian Oil Corporation Ltd. 6.08%
Pharmaceuticals 10.41%
• Cipla Ltd. 8.07%
Astrazeneca Pharma India Ltd. 2.34%
Services 7.91%
• Thomas Cook (India) Ltd. 7.91%
Software 4.84%
Tata Consultancy Services Ltd. 4.84%
OPTIONS 6.39%
• Nifty 50 Index 6.39%
Short Term Debt and net current assets 13.52%
Total Net Assets 100.00%
Company/Issuer % to % to NAV NAV Derivatives
Annual Portfolio Turnover Ratio : Equity - 2.13 times, Others (Debt and Derivatives) - 0.00 times Combined Annual Portfolio Turnover Ratio : 2.13 times
Returns of ICICI Prudential Growth Fund - Series 8 - Dividend Option as on April 30, 2017 - (IPGF8)
Portfolio as on April 30, 2017
Dividend History : Refer page no. from 122 to 130
SIP Returns : Refer page no. from 118 to 120
Total Expense Ratio @@ :
IPGF8 : 2.70% p. a.
IPGF8 Direct Plan : 1.34% p. a.
Investment Objective : Refer page no. from 131 to 134
Notes:1. Different plans shall have different expense structure. The performance details provided herein are of ICICI Prudential Growth Fund - Series 8.2. The scheme is currently managed by George Heber Joseph and Chintan Haria. Mr. George Heber Joseph has been managing this fund since Apr 2015. Total Schemes managed by the Fund Manager Refer annexure from page no. 91 for performance of other schemes currently managed by is 8 (6 are jointly managed).George Heber Joseph.Mr. Chintan Haria has been managing this fund since . Total Schemes managed by the Fund Manager ). Refer annexure from Jan 2015 is 3 (3 are jointly managedpage no. 91 for performance of other schemes currently managed by Chintan Haria. 3. Date of inception: 30-Jan-15.4. Performance of dividend option would be Net of Dividend distribution tax, if any.5. As the Scheme has completed more than 1 year but less than 3 years, the performance details of only since inception and 1 year are provided herein.6. Past performance may or may not be sustained in future and the same may not necessarily provide the basis for comparison with other investment.7. Load is not considered for computation of returns.8. In case, the start/end date of the concerned period is a nonbusiness date (NBD), the NAV of the previous date is considered for computation of returns. The NAV per unit shown in the table is as on the start date of the said period
Scheme
NAV (Rs.) Per Unit (as on April 28,2017 : 10.15)
CAGR (%)
10.00
Nifty 50 Index (Benchmark)
Since inception
CurrentValue of
Investment of Rs. 10000
CAGR (%) Current Value of
Investment of Rs. 10000
1 Year 3 Year 5 Year
CAGR (%) Current Value of
Investment of Rs. 10000
CAGR (%) Current Value of
Investment of Rs. 10000
8.15 - -
Particulars
29.98 12988.44 - - - - 2.57 10585.58
18.58 11852.59 - - - - 2.47 10562.10

�
Quantitative Indicators
36
Style Box
Fund Details
Portfolio turnover has been computed as the ratio of the lower value of purchase and sales, to the average net assets in the past one year (since inception for schemes that have not completed a year). The figures are not netted for derivative transactions.Risk-free rate based on the last Overnight MIBOR cut-off of 6.18%**In addition to the fund manager managing this fund, the ADR/GDR exposure is managed by Mr. Ihab Dalwai.@@ Total Expense Ratio is weighted average for the month. Ratio excludes service tax on management fees and includes B-15 clawback reversal, if any.
Fund Managers** :
Sankaran Naren (Managing this fund since Nov, 2013 & Overall 26 Years of experience)Mittul Kalawadia (Managing this fund since Nov, 2013 & Overall 10 Years of experience)
Indicative Investment Horizon: 3 years
Inception/Allotment date: 07-Nov-13
NAV (As on 28-Apr-17):IPVF1 Dividend Option : 13.37IPVF1 Direct Plan Dividend Option : 14.05
Options :Only Dividend payout facility availableDividend Transfer Plan
Application Amount for freshSubscription :Not available
Min.Addl.Investment :Not available
Exit load for Redemption / Switch out:- Lumpsum Investment OptionNil
SIP :Not Available
SWP :Not Available
Min.Redemption Amt. :No redemption/repurchase of units shall beallowed prior to the maturity of the Scheme.Investors wishing to exit may do so, only indemat mode, by selling through BSE Limitedor any of the stock exchange(s) where unitsof the Scheme will be listed as the Trusteemay decide from time to time.
Average P/E : 20.55 Average P/BV : 4.78 Average Dividend Yield : 1.40
Monthly AAUM as on 30-Apr-17 : Rs. 281.91 crores
Closing AUM as on 30-Apr-17 : Rs. 270.13 crores
Returns of ICICI Prudential Value Fund - Series 1 - Dividend Option as on April 30, 2017 - (IPVF1)
Portfolio as on April 30, 2017
• Top Ten Holdings
ICICI Prudential Value Fund - Series 1A Close ended equity scheme
Entry load : Nil
RiskometerThis Product is suitable for investors who are seeking*:
• Long term wealth creation solution
• A close ended diversified equity fund that aims to provide capital appreciation by investing in a well diversified portfolio of stocks through fundamental analysis.
*Investors should consult their financial advisers if in doubt about whether the product is suitable for them.
Annual Portfolio Turnover Ratio : Equity - 0.66 times, Others (Debt and Derivatives) - 0.32 times Combined Annual Portfolio Turnover Ratio : 0.98 times
Company/Issuer % to NAV
Auto 3.47%
Maruti Suzuki India Ltd. 3.47%
Auto Ancillaries 6.63%
Exide Industries Ltd. 3.52%
Motherson Sumi Systems Ltd. 3.10%
Banks 14.41%
• State Bank Of India 5.18%
• ICICI Bank Ltd. 4.79%
• HDFC Bank Ltd. 4.44%
Chemicals 4.69%
• Rain Industries Ltd. 4.69%
Construction Project 2.26%
Engineers India Ltd. 2.26%
Consumer Durables 1.26%
Blue Star Ltd. 1.26%
Consumer Non Durables 1.44%
Bajaj Corp Ltd. 1.44%
Ferrous Metals 1.96%
Tata Steel Ltd. 1.96%
Finance 8.84%
• Bajaj Finserv Ltd. 5.34%
IDFC Ltd. 3.50%
Gas 1.35%
GAIL (India) Ltd. 1.35%
Minerals/Mining 3.36%
Coal India Ltd. 3.36%
Pesticides 5.68%
• Rallis India Ltd. 5.68%
Petroleum Products 5.93%
Mangalore Refinery and Petrochemicals Ltd. 2.58%
Reliance Industries Ltd. 2.24%
Castrol India Ltd. 1.11%
Pharmaceuticals 18.07%
• Unichem Laboratories Ltd. 8.86%
• Cipla Ltd. 6.49%
Sun Pharmaceutical Industries Ltd. 2.72%
Power 5.70%
Power Grid Corporation Of India Ltd. 3.39%
NTPC Ltd. 1.24%
Gujarat Industries Power Company Ltd. 1.07%
Retailing 0.16%
Avenue Supermarts Ltd. 0.16%
Software 5.08%
• Wipro Ltd. 5.08%
Transportation 4.20%
• The Great Eastern Shipping Company Ltd. 4.20%
Short Term Debt and net current assets 5.50%
Total Net Assets 100.00%
Company/Issuer % to NAV
Dividend History : Refer page no. from 122 to 130
SIP Returns : Refer page no. from 118 to 120
Total Expense Ratio @@ :
IPVF1 : 2.54% p. a.
IPVF1 Direct Plan : 0.73% p. a.
Investment Objective : Refer page no. from 131 to 134
Std Dev (Annualised) : 15.93% Sharpe Ratio : 0.96 Portfolio Beta : 1.02 R squared : 0.87 Benchmark Std Dev (Annualised) : 14.54%
Notes:1. Different plans shall have different expense structure. The performance details provided herein are of ICICI Prudential Value Fund - Series 1.2. The scheme is currently managed by Sankaran Naren and Mittul Kalawadia. Mr. Sankaran Naren has been managing this fund since Nov 2013. Total Schemes managed by the Fund Manager . Refer annexure from page no. 91 for performance of other schemes currently managed by Sankaran is 14 (14 are jointly managed) Naren.Mr. Mittul Kalawadia has been managing this fund since Nov 2013 . Total Schemes managed by the Fund Manager Refer annexure is 8 (8 are jointly managed).from page no. 91 for performance of other schemes currently managed by Mittul Kalawadia .3. Date of inception: 07-Nov-13.4. Performance of dividend option would be Net of Dividend distribution tax, if any.5. As the Scheme has completed more than 3 year but less than 5 years, the performance details of since inception,1 year and 3 years are provided herein.6. Past performance may or may not be sustained in future and the same may not necessarily provide the basis for comparison with other investment.7. Load is not considered for computation of returns.8. In case, the start/end date of the concerned period is a nonbusiness date (NBD), the NAV of the previous date is considered for computation of returns. The NAV per unit shown in the table is as on the start date of the said period
Scheme
Nifty 50 Index (Additional Benchmark)
NAV (Rs.) Per Unit (as on April 28,2017 : 13.37)
CAGR (%)
10.00
S&P BSE 500 Index (Benchmark)
Since inception
CurrentValue of
Investment of Rs. 10000
CAGR (%) Current Value of
Investment of Rs. 10000
1 Year 3 Year 5 Year
CAGR (%) Current Value of
Investment of Rs. 10000
CAGR (%) Current Value of
Investment of Rs. 10000
12.77 11.43 -
Particulars
28.83 12873.99 22.31 18285.22 - - 25.60 22077.22
24.80 12472.70 15.89 15558.63 - - 16.75 17125.67
18.58 11852.59 11.60 13894.11 - - 12.46 15037.46

�
Style Box
Fund Details
Fund Managers** :
Indicative Investment Horizon: 3 years
Inception/Allotment date: 06-Dec-13
NAV (As on 28-Apr-17):IPVF2 Dividend Option : 13.25IPVF2 Direct Plan Dividend Option : 13.98
Options : Only Dividend payout facility available
Application Amount for fresh Subscription : Not available
Min.Addl.Investment : Not available
Entry load : Nil
Exit load for Redemption / Switch out :- Lumpsum Investment OptionNil
SIP : Not Available
SWP : Not Available
Min.Redemption Amt. : No redemption/repurchase of units shall be allowed prior to the maturity of the Scheme.Investors wishing to exit may do so, only in demat mode, by selling through BSE Limited or any of the stock exchange(s) where units of the Scheme will be listed as the Trustee may decide from time to time.
Sankaran Naren (Managing this fund since Dec, 2013 & Overall 26 Years of experience)Atul Patel(Managing this fund since Dec, 2013 & Overall 7 Years of experience)
37
Portfolio turnover has been computed as the ratio of the lower value of purchase and sales, to the average net assets in the past one year (since inception for schemes that have not completed a year). The figures are not netted for derivative transactions.Risk-free rate based on the last Overnight MIBOR cut-off of 6.18%**In addition to the fund manager managing this fund, the ADR/GDR exposure is managed by Mr. Ihab Dalwai.@@ Total Expense Ratio is weighted average for the month. Ratio excludes service tax on management fees and includes B-15 clawback reversal, if any.
Monthly AAUM as on 30-Apr-17 : Rs. 185.39 crores
Closing AUM as on 30-Apr-17 : Rs. 177.69 crores
Quantitative Indicators Average P/E : 20.87 Average P/BV : 7.04 Average Dividend Yield : 1.35
Returns of ICICI Prudential Value Fund - Series 2 - Dividend Option as on April 30, 2017 - (IPVF2)
Portfolio as on April 30, 2017
• Top Ten HoldingsDerivatives are considered at exposure value.
ICICI Prudential Value Fund - Series 2A Close ended equity scheme
RiskometerThis Product is suitable for investors who are seeking*:
• Long term wealth creation solution
• A close ended diversified equity fund that aims to provide capital appreciation by investing in a well diversified portfolio of stocks through fundamental analysis.
*Investors should consult their financial advisers if in doubt about whether the product is suitable for them.
Annual Portfolio Turnover Ratio : Equity - 0.68 times, Others (Debt and Derivatives) - 0.57 times Combined Annual Portfolio Turnover Ratio : 1.25 times
Dividend History : Refer page no. from 122 to 130
SIP Returns : Refer page no. from 118 to 120
Total Expense Ratio @@ :
IPVF2 : 2.58% p. a.
IPVF2 Direct Plan : 2.05% p. a.
Investment Objective : Refer page no. from 131 to 134 Std Dev (Annualised) : 15.71% Sharpe Ratio : 1.08 Portfolio Beta : 1.01 R squared : 0.87 Benchmark Std Dev (Annualised) : 14.54%
Notes:1. Different plans shall have different expense structure. The performance details provided herein are of ICICI Prudential Value Fund - Series 2.2. The scheme is currently managed by Sankaran Naren and Atul Patel. Mr. Sankaran Naren has been managing this fund since Dec 2013. Total Schemes managed by the Fund Manager . Refer annexure from page no. 91 for performance of other schemes currently managed by Sankaran is 14 (14 are jointly managed) Naren.Mr. Atul Patel has been managing this fund since Dec 2013 . Total Schemes managed by the Fund Manager is 14 (13 are jointly managed). Refer annexure from page no. 91 for performance of other schemes currently managed by Atul Patel .3. Date of inception: 06-Dec-13.4. Performance of dividend option would be Net of Dividend distribution tax, if any.5. As the Scheme has completed more than 3 year but less than 5 years, the performance details of since inception,1 year and 3 years are provided herein.6. Past performance may or may not be sustained in future and the same may not necessarily provide the basis for comparison with other investment.7. Load is not considered for computation of returns.8. In case, the start/end date of the concerned period is a nonbusiness date (NBD), the NAV of the previous date is considered for computation of returns. The NAV per unit shown in the table is as on the start date of the said period
Scheme
Nifty 50 Index (Additional Benchmark)
NAV (Rs.) Per Unit (as on April 28,2017 : 13.25)
CAGR (%)
10.00
S&P BSE 500 Index (Benchmark)
Since inception
CurrentValue of
Investment of Rs. 10000
CAGR (%) Current Value of
Investment of Rs. 10000
1 Year 3 Year 5 Year
CAGR (%) Current Value of
Investment of Rs. 10000
CAGR (%) Current Value of
Investment of Rs. 10000
12.50 10.84 -
Particulars
30.83 13072.95 24.27 19179.51 - - 26.18 22022.48
24.80 12472.70 15.89 15558.63 - - 16.65 16867.74
18.58 11852.59 11.60 13894.11 - - 12.38 14862.94
Company/Issuer % to % to NAV NAV Derivatives
Company/Issuer % to % to NAV NAV Derivatives
Auto 6.59%
Maruti Suzuki India Ltd. 3.88%
Tata Motors Ltd. 2.71%
Auto Ancillaries 4.50%
• Motherson Sumi Systems Ltd. 4.50%
Banks 23.46%
• ICICI Bank Ltd. 8.45%
• HDFC Bank Ltd. 6.97%
State Bank Of India 3.42%
The Federal Bank Ltd. 2.49%
Axis Bank Ltd. 2.12%
Cement 4.41%
• JK Lakshmi Cement Ltd. 4.41%
Construction 5.78%
• PNC Infratech Ltd. 5.78%
Consumer Durables 1.33%
V.I.P. Industries Ltd. 1.33%
Consumer Non Durables 11.91%
• Glaxosmithkline Consumer Healthcare Ltd. 6.34%
Hindustan Unilever Ltd. 3.40%
Bajaj Corp Ltd. 2.17%
Ferrous Metals 1.96%
Tata Steel Ltd. 1.96%
Finance 8.97%
• Bajaj Finserv Ltd. 4.59%
• Sundaram Finance Ltd. 4.37%
Minerals/Mining 2.62%
Coal India Ltd. 2.62%
Pharmaceuticals 6.88%
Cipla Ltd. 3.92%
Sun Pharmaceutical Industries Ltd. 1.81%
Divi's Laboratories Ltd. 1.15%
Power 7.82%
Power Grid Corporation Of India Ltd. 4.10%
Tata Power Company Ltd. 3.72%
Software 7.53%
• HCL Technologies Ltd. 4.17%
Infosys Ltd. 3.36%
Index Futures/Options 4.29%
• Nifty 50 Index - Futures 4.29%
Short Term Debt and net current assets 1.97%
Total Net Assets 100.00%

Style Box
Fund Details
• Top Ten HoldingsDerivatives are considered at exposure value.
38
Fund Managers** :
Sankaran Naren (Managing this fund since Mar, 2014 & Overall 26 Years of experience)Chintan Haria (Managing this fund since Mar, 2014 & Overall 10 Years of experience)
Indicative Investment Horizon: 3 years
Inception/Allotment date: 20-Mar-14
NAV (As on 28-Apr-17):IPVF3 Dividend Option : 12.12IPVF3 Direct Plan Dividend Option : 12.78
Options :Only Dividend payout facility available
Application Amount for freshSubscription :Not available
Min.Addl.Investment :Not available
Exit load for Redemption / Switch out:- Lumpsum Investment OptionNil
SIP :Not Available
SWP :Not Available
No redemption/repurchase of units shall beallowed prior to the maturity of the Scheme.Investors wishing to exit may do so, only indemat mode, by selling through BSE Limitedor any of the stock exchange(s) where unitsof the Scheme will be listed as the Trusteemay decide from time to time.
Min.Redemption Amt. :
Portfolio turnover has been computed as the ratio of the lower value of purchase and sales, to the average net assets in the past one year (since inception for schemes that have not completed a year). The figures are not netted for derivative transactions.**In addition to the fund manager managing this fund, the ADR/GDR exposure is managed by Mr. Ihab Dalwai.@@ Total Expense Ratio is weighted average for the month. Ratio excludes service tax on management fees and includes B-15 clawback reversal, if any.
Quantitative Indicators Average P/E : 19.83 Average P/BV : 3.24 Average Dividend Yield : 1.49
Monthly AAUM as on 30-Apr-17 :Rs. 70.63 crores
Closing AUM as on 30-Apr-17 : Rs. 67.31 crores
Returns of ICICI Prudential Value Fund - Series 3 - Dividend Option as on April 30, 2017 - (IPVF3)
Portfolio as on April 30, 2017
ICICI Prudential Value Fund - Series 3A Close ended equity scheme
Entry load : Nil
RiskometerThis Product is suitable for investors who are seeking*:
• Long term wealth creation solution
• A close ended equity fund that aims to provide capital appreciation by investing in a well diversified portfolio of stocks through fundamental analysis.
*Investors should consult their financial advisers if in doubt about whether the product is suitable for them.
Annual Portfolio Turnover Ratio : Equity - 0.92 times, Others (Debt and Derivatives) - 0.81 times Combined Annual Portfolio Turnover Ratio : 1.73 times
Dividend History : Refer page no. from 122 to 130
SIP Returns : Refer page no. from 118 to 120
Total Expense Ratio @@ :
IPVF3 : 2.70% p. a.
IPVF3 Direct Plan : 1.20% p. a.
Investment Objective : Refer page no. from 131 to 134
Auto 4.45%
Tata Motors Ltd. - DVR 4.45%
Banks 19.06%
• State Bank Of India 5.88%
• ICICI Bank Ltd. 5.68%
The South Indian Bank Ltd. 4.45%
Axis Bank Ltd. 3.04%
Cement 3.04%
Orient Cement Ltd. 3.04%
Chemicals 9.76%
• Tata Chemicals Ltd. 9.76%
Construction Project 2.84%
NCC Ltd. 2.84%
Consumer Non Durables 8.26%
• ITC Ltd. 8.26%
Ferrous Metals 5.02%
• Tata Steel Ltd. 5.02%
Finance 6.03%
ICICI Prudential Life Insurance Company Ltd. 4.40%
IDFC Ltd. 1.63%
Pharmaceuticals 3.56%
Cipla Ltd. 3.56%
Power 7.66%
• Tata Power Company Ltd. 5.01%
Gujarat Industries Power Company Ltd. 2.65%
Software 9.60%
• HCL Technologies Ltd. 4.83%
• Tech Mahindra Ltd. 4.77%
Telecom - Services 10.56%
• Bharti Airtel Ltd. 10.56%
Transportation 3.15%
Interglobe Aviation Ltd. 3.15%
Index Futures/Options 4.58%
• Nifty 50 Index - Futures 4.58%
Short Term Debt and net current assets 2.44%
Total Net Assets 100.00%
Company/Issuer % to % to NAV NAV Derivatives
Company/Issuer % to % to NAV NAV Derivatives
Notes:1. Different plans shall have different expense structure. The performance details provided herein are of ICICI Prudential Value Fund - Series 3.2. The scheme is currently managed by Sankaran Naren and . Mr. Sankaran Naren has been managing this fund since . Total Schemes Chintan Haria Mar 2014managed by the Fund Manager . Refer annexure from page no. 91 for performance of other schemes currently managed by Sankaran is 14 (14 are jointly managed) Naren.Mr. Chintan Haria has been managing this fund since . Total Schemes managed by the Fund Manager ). Refer annexure from Mar 2014 is 3 (3 are jointly managedpage no. 91 for performance of other schemes currently managed by Chintan Haria.3. Date of inception: 20-Mar-14.4. Performance of dividend option would be Net of Dividend distribution tax, if any.5. As the Scheme has completed more than 3 year but less than 5 years, the performance details of since inception,1 year and 3 years are provided herein.6. Past performance may or may not be sustained in future and the same may not necessarily provide the basis for comparison with other investment.7. Load is not considered for computation of returns.8. In case, the start/end date of the concerned period is a nonbusiness date (NBD), the NAV of the previous date is considered for computation of returns. The NAV per unit shown in the table is as on the start date of the said period
Scheme
Nifty 50 Index (Additional Benchmark)
NAV (Rs.) Per Unit (as on April 28,2017 : 12.12)
CAGR (%)
10.00
S&P BSE 500 Index (Benchmark)
Since inception
CurrentValue of
Investment of Rs. 10000
CAGR (%) Current Value of
Investment of Rs. 10000
1 Year 3 Year 5 Year
CAGR (%) Current Value of
Investment of Rs. 10000
CAGR (%) Current Value of
Investment of Rs. 10000
11.95 10.78 -
Particulars
26.15 12607.47 23.79 18957.61 - - 25.84 20436.30
24.80 12472.70 15.89 15558.63 - - 16.98 16285.73
18.58 11852.59 11.60 13894.11 - - 12.32 14351.24
Std Dev (Annualised) : 16.41% Sharpe Ratio : 1.01 Portfolio Beta : 1.02 R squared : 0.81 Benchmark Std Dev (Annualised) : 14.54%

Style Box
Note : - “Portfolio Beta, Standard Deviation, R Squared, Sharpe Ratio and Tracking Error of the Scheme is not computed owing to the short time frame since launch of the Scheme.”Portfolio turnover has been computed as the ratio of the lower value of purchase and sales, to the average net assets in the past one year (since inception for schemes that have not completed a year). The figures are not netted for derivative transactions. **In addition to the fund manager managing this fund, the ADR/GDR exposure is managed by Mr. Ihab Dalwai.@@ Total Expense Ratio is weighted average for the month. Ratio excludes service tax on management fees and includes B-15 clawback reversal, if any.
Fund Managers** :
Mrinal Singh (Managing this fund since May, 2014 & Overall 14 years of experience)Rajat Chandak (Managing this fund since May, 2014 & 8 years of experience)
Indicative Investment Horizon: 3 years
Inception/Allotment date: 08-May-14
SWP :Not Available
Min.Redemption Amt. :No redemption/repurchase of units shall be allowed prior to the maturity of the Scheme.Investors wishing to exit may do so, only in demat mode, by selling through BSE Limited or any of the stock exchange(s) where unitsof the Scheme will be listed as the Trustee may decide from time to time.
SIP :Not Available
NAV (As on 28-Apr-17):IPVF4 Growth Option : 19.88IPVF4 Dividend Option : 11.91IPVF4 Direct Plan Growth Option : 20.39IPVF4 Direct Plan Dividend Option : 12.28
Option:Cumulative & Dividend payout option
Application Amount for freshSubscription :Not available
Min.Addl.Investment :Not available
Exit load for Redemption / Switchout :- Lumpsum Investment OptionNil
39
Fund Details
Diversified
Quantitative Indicators Average P/E : 30.35 Average P/BV : 9.78 Average Dividend Yield : 1.01
Monthly AAUM as on 30-Apr-17 : Rs. 179.43 crores
Closing AUM as on 30-Apr-17 :Rs. 174.21 crores
• Top Ten Holdings
ICICI Prudential Value Fund - Series 4A Close ended equity scheme
Returns of ICICI Prudential Value Fund - Series 4 - Growth Option as on April 30, 2017 - (IPVF4)
Portfolio as on April 30, 2017
Entry load : Nil
RiskometerThis Product is suitable for investors who are seeking*:
• Long term wealth creation solution
• A close ended diversified equity fund that aims to provide capital appreciation by investing in a well diversified portfolio of stocks through fundamental analysis.
*Investors should consult their financial advisers if in doubt about whether the product is suitable for them.
Auto 4.25%
• Maruti Suzuki India Ltd. 4.25%
Auto Ancillaries 4.33%
• Motherson Sumi Systems Ltd. 4.33%
Banks 14.06%
• ICICI Bank Ltd. 5.71%
• State Bank Of India 4.18%
• HDFC Bank Ltd. 4.16%
Construction 2.00%
KNR Constructions Ltd. 2.00%
Consumer Non Durables 10.12%
• Britannia Industries Ltd. 4.31%
• Hindustan Unilever Ltd. 4.21%
Bajaj Corp Ltd. 1.60%
Finance 3.18%
• HDFC Ltd. 3.18%
Industrial Products 1.59%
Astral Poly Technik Ltd. 1.59%
Media & Entertainment 3.90%
• PVR Ltd. 3.90%
Pesticides 1.74%
Rallis India Ltd. 1.74%
Pharmaceuticals 6.94%
Cipla Ltd. 3.12%
Sun Pharmaceutical Industries Ltd. 2.39%
IPCA Laboratories Ltd. 1.42%
Services 1.88%
Thomas Cook (India) Ltd. 1.88%
Software 3.18%
• Tech Mahindra Ltd. 3.18%
Short Term Debt and net current assets 42.84%
Total Net Assets 100.00%
Company/Issuer % to NAV Company/Issuer % to NAV
Annual Portfolio Turnover Ratio : Equity - 0.69 times, Others (Debt and Derivatives) - 0.00 times Combined Annual Portfolio Turnover Ratio : 0.69 times
Dividend History : Refer page no. from 122 to 130
SIP Returns : Refer page no. from 118 to 120
Total Expense Ratio @@ :
IPVF4 : 2.59% p. a.
IPVF4 Direct Plan : 1.64% p. a.
Investment Objective : Refer page no. from 131 to 134
Notes:1. Different plans shall have different expense structure. The performance details provided herein are of ICICI Prudential Value Fund - Series 4.2. The scheme is currently managed Mrinal Singh . Mr. Mrinal Singh has been managing this fund since . Total Schemes managed by and Rajat Chandak May 2014the Fund Manager . Refer annexure from page no. 91 for performance of other schemes currently managed is 15 (14 are jointly managed [Excludes FoF Schemes])by Mrinal Singh.Mr. has been managing this fund since . Total Schemes managed by the Fund Manager . Refer annexure from Rajat Chandak May 2014 is 9 (5 are jointly managed)page no. 91 for performance of other schemes currently managed by . Rajat Chandak3. Date of inception: 08-May-14.4. As the Scheme has completed more than 1 year but less than 3 years, the performance details of only since inception and 1 year are provided herein.5. Past performance may or may not be sustained in future and the same may not necessarily provide the basis for comparison with other investment.6. Load is not considered for computation of returns.7. In case, the start/end date of the concerned period is a nonbusiness date (NBD), the NAV of the previous date is considered for computation of returns. The NAV per unit shown in the table is as on the start date of the said period
Scheme
Nifty 50 Index (Additional Benchmark)
NAV (Rs.) Per Unit (as on April 28,2017 : 19.88)
CAGR (%)
10.00
S&P BSE 500 Index (Benchmark)
Since inception
CurrentValue of
Investment of Rs. 10000
CAGR (%) Current Value of
Investment of Rs. 10000
1 Year 3 Year 5 Year
CAGR (%) Current Value of
Investment of Rs. 10000
CAGR (%) Current Value of
Investment of Rs. 10000
16.34 - -
Particulars
21.73 12166.46 - - - - 25.98 19880.00
24.80 12472.70 - - - - 16.13 15604.08
18.58 11852.59 - - - - 11.89 13970.36
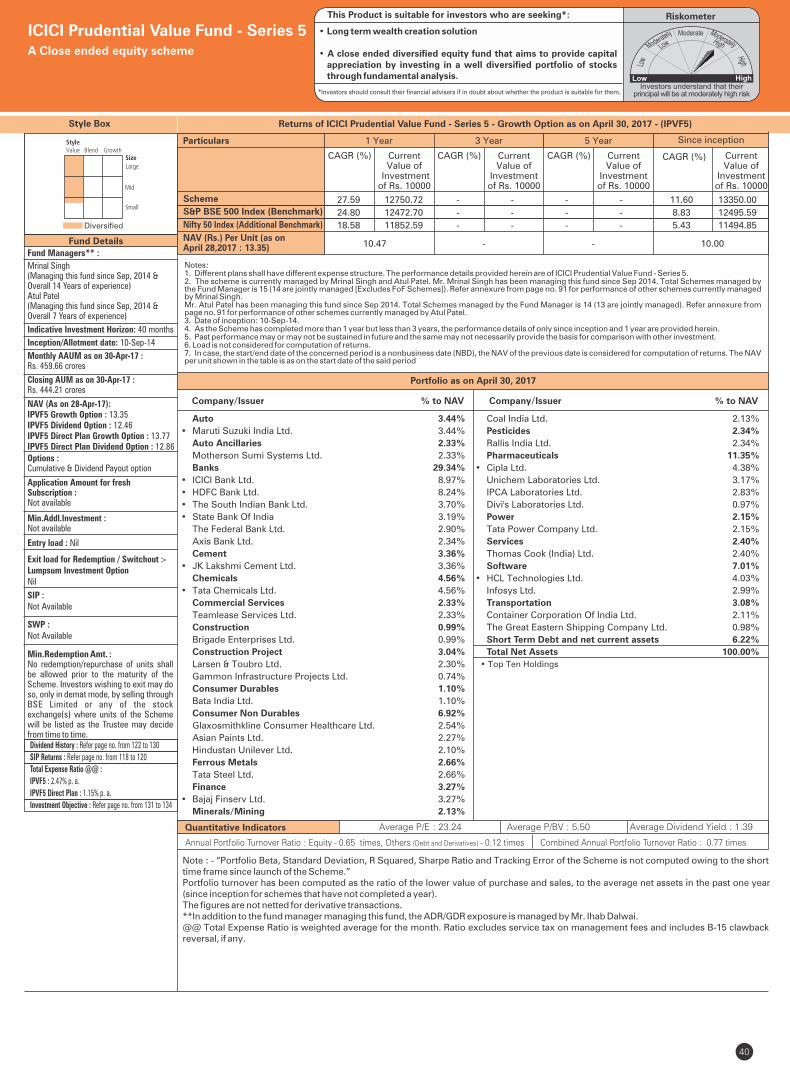
Style Box
Note : - “Portfolio Beta, Standard Deviation, R Squared, Sharpe Ratio and Tracking Error of the Scheme is not computed owing to the short time frame since launch of the Scheme.”Portfolio turnover has been computed as the ratio of the lower value of purchase and sales, to the average net assets in the past one year (since inception for schemes that have not completed a year). The figures are not netted for derivative transactions.**In addition to the fund manager managing this fund, the ADR/GDR exposure is managed by Mr. Ihab Dalwai.@@ Total Expense Ratio is weighted average for the month. Ratio excludes service tax on management fees and includes B-15 clawback reversal, if any.
Fund Managers** :
Mrinal Singh(Managing this fund since Sep, 2014 &Overall 14 Years of experience)Atul Patel(Managing this fund since Sep, 2014 &Overall 7 Years of experience)
Indicative Investment Horizon: 40 months
Inception/Allotment date: 10-Sep-14
SWP :Not Available
Min.Redemption Amt. :No redemption/repurchase of units shall be allowed prior to the maturity of the Scheme. Investors wishing to exit may do so, only in demat mode, by selling through BSE Limited or any of the stock exchange(s) where units of the Scheme will be listed as the Trustee may decide from time to time.
SIP :Not Available
NAV (As on 28-Apr-17):IPVF5 Growth Option : 13.35IPVF5 Dividend Option : 12.46IPVF5 Direct Plan Growth Option : 13.77IPVF5 Direct Plan Dividend Option : 12.86Options :Cumulative & Dividend Payout option
Application Amount for freshSubscription :Not available
Min.Addl.Investment :Not available
Exit load for Redemption / Switchout :- Lumpsum Investment OptionNil
40
Fund Details
Diversified
Quantitative Indicators Average P/E : 23.24 Average P/BV : 5.50 Average Dividend Yield : 1.39
• Top Ten Holdings
Monthly AAUM as on 30-Apr-17 : Rs. 459.66 crores
Closing AUM as on 30-Apr-17 : Rs. 444.21 crores
ICICI Prudential Value Fund - Series 5A Close ended equity scheme
Portfolio as on April 30, 2017
Returns of ICICI Prudential Value Fund - Series 5 - Growth Option as on April 30, 2017 - (IPVF5)
Entry load : Nil
RiskometerThis Product is suitable for investors who are seeking*:
• Long term wealth creation solution
• A close ended diversified equity fund that aims to provide capital appreciation by investing in a well diversified portfolio of stocks through fundamental analysis.
*Investors should consult their financial advisers if in doubt about whether the product is suitable for them.
Annual Portfolio Turnover Ratio : Equity - 0.65 times, Others (Debt and Derivatives) - 0.12 times Combined Annual Portfolio Turnover Ratio : 0.77 times
Dividend History : Refer page no. from 122 to 130
SIP Returns : Refer page no. from 118 to 120
Total Expense Ratio @@ :
IPVF5 : 2.47% p. a.
IPVF5 Direct Plan : 1.15% p. a.
Investment Objective : Refer page no. from 131 to 134
Auto 3.44%
• Maruti Suzuki India Ltd. 3.44%
Auto Ancillaries 2.33%
Motherson Sumi Systems Ltd. 2.33%
Banks 29.34%
• ICICI Bank Ltd. 8.97%
• HDFC Bank Ltd. 8.24%
• The South Indian Bank Ltd. 3.70%
• State Bank Of India 3.19%
The Federal Bank Ltd. 2.90%
Axis Bank Ltd. 2.34%
Cement 3.36%
• JK Lakshmi Cement Ltd. 3.36%
Chemicals 4.56%
• Tata Chemicals Ltd. 4.56%
Commercial Services 2.33%
Teamlease Services Ltd. 2.33%
Construction 0.99%
Brigade Enterprises Ltd. 0.99%
Construction Project 3.04%
Larsen & Toubro Ltd. 2.30%
Gammon Infrastructure Projects Ltd. 0.74%
Consumer Durables 1.10%
Bata India Ltd. 1.10%
Consumer Non Durables 6.92%
Glaxosmithkline Consumer Healthcare Ltd. 2.54%
Asian Paints Ltd. 2.27%
Hindustan Unilever Ltd. 2.10%
Ferrous Metals 2.66%
Tata Steel Ltd. 2.66%
Finance 3.27%
• Bajaj Finserv Ltd. 3.27%
Minerals/Mining 2.13%
Coal India Ltd. 2.13%
Pesticides 2.34%
Rallis India Ltd. 2.34%
Pharmaceuticals 11.35%
• Cipla Ltd. 4.38%
Unichem Laboratories Ltd. 3.17%
IPCA Laboratories Ltd. 2.83%
Divi's Laboratories Ltd. 0.97%
Power 2.15%
Tata Power Company Ltd. 2.15%
Services 2.40%
Thomas Cook (India) Ltd. 2.40%
Software 7.01%
• HCL Technologies Ltd. 4.03%
Infosys Ltd. 2.99%
Transportation 3.08%
Container Corporation Of India Ltd. 2.11%
The Great Eastern Shipping Company Ltd. 0.98%
Short Term Debt and net current assets 6.22%
Total Net Assets 100.00%
Company/Issuer % to NAV Company/Issuer % to NAV
Notes:1. Different plans shall have different expense structure. The performance details provided herein are of ICICI Prudential Value Fund - Series 5.2. The scheme is currently managed by and . Mr. Mrinal Singh has been managing this fund since . Total Schemes managed by Mrinal Singh Atul Patel Sep 2014the Fund Manager . Refer annexure from page no. 91 for performance of other schemes currently managed is 15 (14 are jointly managed [Excludes FoF Schemes])by Mrinal Singh.Mr. has been managing this fund since Sep 2014. Total Schemes managed by the Fund Manager ). Refer annexure from Atul Patel is 14 (13 are jointly managedpage no. 91 for performance of other schemes currently managed by . Atul Patel3. Date of inception: 10-Sep-14.4. As the Scheme has completed more than 1 year but less than 3 years, the performance details of only since inception and 1 year are provided herein.5. Past performance may or may not be sustained in future and the same may not necessarily provide the basis for comparison with other investment.6. Load is not considered for computation of returns.7. In case, the start/end date of the concerned period is a nonbusiness date (NBD), the NAV of the previous date is considered for computation of returns. The NAV per unit shown in the table is as on the start date of the said period
Scheme
Nifty 50 Index (Additional Benchmark)
NAV (Rs.) Per Unit (as on April 28,2017 : 13.35)
CAGR (%)
10.00
S&P BSE 500 Index (Benchmark)
Since inception
CurrentValue of
Investment of Rs. 10000
CAGR (%) Current Value of
Investment of Rs. 10000
1 Year 3 Year 5 Year
CAGR (%) Current Value of
Investment of Rs. 10000
CAGR (%) Current Value of
Investment of Rs. 10000
10.47 - -
Particulars
27.59 12750.72 - - - - 11.60 13350.00
24.80 12472.70 - - - - 8.83 12495.59
18.58 11852.59 - - - - 5.43 11494.85

Style Box
Note : - “Portfolio Beta, Standard Deviation, R Squared, Sharpe Ratio and Tracking Error of the Scheme is not computed owing to the short time frame since launch of the Scheme.”Portfolio turnover has been computed as the ratio of the lower value of purchase and sales, to the average net assets in the past one year (since inception for schemes that have not completed a year). The figures are not netted for derivative transactions.**In addition to the fund manager managing this fund, the ADR/GDR exposure is managed by Mr. Ihab Dalwai.@@ Total Expense Ratio is weighted average for the month. Ratio excludes service tax on management fees and includes B-15 clawback reversal, if any.
Fund Managers** :
Sankaran Naren(Managing this fund since Mar, 2015 &Overall 26 years of experience)Atul Patel(Managing this fund since Mar, 2015 &Overall 7 years of experience)
Indicative Investment Horizon : 1186 Days
Inception/Allotment date: 31-Mar-15
SWP :Not Available
Min.Redemption Amt. :No redemption/repurchase of units shall be allowed prior to the maturity of the Scheme. Investors wishing to exit may do so, only in demat mode, by selling through BSE Limited or any of the stock exchange(s) where units of the Scheme will be listed as the Trustee may decide from time to time.
SIP :Not Available
NAV (As on 28-Apr-17):IPVF6 Growth Option : 11.33IPVF6 Dividend Option : 10.56IPVF6 Direct Plan Growth Option : 11.69IPVF6 Direct Plan Dividend Option : 10.92
Options :Cumulative & Dividend Payout option
Application Amount for freshSubscription :Not available
Min.Addl.Investment :Not available
Exit load for Redemption / Switchout :- Lumpsum Investment OptionNil
41
Fund Details
Quantitative Indicators Average P/E : 22.28 Average P/BV : 4.32 Average Dividend Yield : 1.34
Diversified
ICICI Prudential Value Fund - Series 6A Close ended equity scheme
Monthly AAUM as on 30-Apr-17 : Rs. 226.64 crores
Closing AUM as on 30-Apr-17 :Rs. 221.37 crores
Entry load : Nil
Riskometer
• Long term wealth creation solution
• A close ended diversified equity fund that aims to provide capital appreciation by investing in a well diversified portfolio of stocks through fundamental analysis.
This Product is suitable for investors who are seeking*:
*Investors should consult their financial advisers if in doubt about whether the product is suitable for them.
Annual Portfolio Turnover Ratio : Equity - 0.65 times, Others (Debt and Derivatives) - 0.00 times Combined Annual Portfolio Turnover Ratio : 0.65 times
Returns of ICICI Prudential Value Fund - Series 6 - Growth Option as on April 30, 2017 - (IPVF6)
Portfolio as on April 30, 2017
Auto 2.70%
Maruti Suzuki India Ltd. 2.70%
Auto Ancillaries 4.53%
• Motherson Sumi Systems Ltd. 4.53%
Banks 21.84%
• ICICI Bank Ltd. 8.19%
• HDFC Bank Ltd. 7.83%
State Bank Of India 3.21%
Axis Bank Ltd. 2.60%
Cement 3.35%
• JK Lakshmi Cement Ltd. 3.35%
Chemicals 6.05%
• Tata Chemicals Ltd. 6.05%
Construction 1.98%
Brigade Enterprises Ltd. 1.98%
Construction Project 1.32%
Ashoka Buildcon Ltd. 1.32%
Consumer Non Durables 9.98%
• Glaxosmithkline Consumer Healthcare Ltd. 3.70%
• Bajaj Corp Ltd. 3.29%
Jubilant Foodworks Ltd. 2.99%
Finance 7.21%
• BSE Ltd. 4.86%
IDFC Ltd. 2.35%
Media & Entertainment 1.87%
D.B. Corp Ltd. 1.87%
Pesticides 2.77%
Rallis India Ltd. 2.77%
Pharmaceuticals 7.39%
Cipla Ltd. 3.27%
Pfizer Ltd. 2.59%
Divi's Laboratories Ltd. 1.52%
Company/Issuer % to % to NAV NAV Derivatives
Company/Issuer % to % to NAV NAV Derivatives
Software 9.10%
• HCL Technologies Ltd. 3.75%
Infosys Ltd. 2.74%
Mphasis Ltd. 2.61%
OPTIONS 10.33%
• Nifty 50 Index 10.33%
Short Term Debt and net current assets 9.59%
Total Net Assets 100.00%
• Top Ten HoldingsDerivatives are considered at exposure value.
Dividend History : Refer page no. from 122 to 130
SIP Returns : Refer page no. from 118 to 120
Total Expense Ratio @@ :
IPVF6 : 2.36% p. a.
IPVF6 Direct Plan : 0.92% p. a.
Investment Objective : Refer page no. from 131 to 134
Notes:1. Different plans shall have different expense structure. The performance details provided herein are of ICICI Prudential Value Fund - Series 6.2. The scheme is currently managed by Sankaran Naren and Atul Patel. Mr. Sankaran Naren has been managing this fund since Mar 2015. Total Schemes managed by the Fund Manager . Refer annexure from page no. 91 for performance of other schemes currently managed by Sankaran is 14 (14 are jointly managed) Naren.Mr. Atul Patel has been managing this fund since Mar 2015. Total Schemes managed by the Fund Manager is 14 (13 are jointly managed). Refer annexure from page no. 91 for performance of other schemes currently managed by Atul Patel .3. Date of inception: 31-Mar-15.4. As the Scheme has completed more than 1 year but less than 3 years, the performance details of only since inception and 1 year are provided herein.5. Past performance may or may not be sustained in future and the same may not necessarily provide the basis for comparison with other investment.6. Load is not considered for computation of returns.7. In case, the start/end date of the concerned period is a nonbusiness date (NBD), the NAV of the previous date is considered for computation of returns. The NAV per unit shown in the table is as on the start date of the said period
Scheme
Nifty 50 Index (Additional Benchmark)
NAV (Rs.) Per Unit (as on April 28,2017 : 11.33)
CAGR (%)
10.00
S&P BSE 500 Index (Benchmark)
Since inception
CurrentValue of
Investment of Rs. 10000
CAGR (%) Current Value of
Investment of Rs. 10000
1 Year 3 Year 5 Year
CAGR (%) Current Value of
Investment of Rs. 10000
CAGR (%) Current Value of
Investment of Rs. 10000
9.12 - -
Particulars
24.31 12423.25 - - - - 6.19 11330.00
24.80 12472.70 - - - - 8.05 11747.25
18.58 11852.59 - - - - 4.50 10957.54

Style Box
Note : - “Portfolio Beta, Standard Deviation, R Squared, Sharpe Ratio and Tracking Error of the Scheme is not computed owing to the short time frame since launch of the Scheme.”Portfolio turnover has been computed as the ratio of the lower value of purchase and sales, to the average net assets in the past one year (since inception for schemes that have not completed a year). The figures are not netted for derivative transactions.**In addition to the fund manager managing this fund, the ADR/GDR exposure is managed by Mr. Ihab Dalwai.@@ Total Expense Ratio is weighted average for the month. Ratio excludes service tax on management fees and includes B-15 clawback reversal, if any.
Fund Managers** :
Atul Patel(Managing this fund since Jun, 2015 &Overall 7 years of experience)
Indicative Investment Horizon : 1100 Days
Inception/Allotment date: 08-Jun-15
SWP :Not Available
Min.Redemption Amt. :No redemption/repurchase of units shall be allowed prior to the maturity of the Scheme. Investors wishing to exit may do so, only in demat mode, by selling through BSE Limited or any of the stock exchange(s) where units of the Scheme will be listed as the Trustee may decide from time to time.
SIP :Not Available
NAV (As on 28-Apr-17):IPVF7 Dividend Option : 12.55IPVF7 Direct Plan Dividend Option : 12.84
Options :Dividend payout option
Application Amount for freshSubscription :Not available
Min.Addl.Investment :Not available
Exit load for Redemption / Switchout :- Lumpsum Investment OptionNil
42
Fund Details
Quantitative Indicators
Benchmark
Average P/E : 19.83 Average P/BV : 4.22 Average Dividend Yield : 1.02
S&P BSE 500 Index
Diversified
ICICI Prudential Value Fund – Series 7A Close ended equity scheme
Monthly AAUM as on 30-Apr-17 : Rs. 13.48 crores
Closing AUM as on 30-Apr-17 : Rs. 12.93 crores
• Top Ten HoldingsDerivatives are considered at exposure value.
Company/Issuer % to % to NAV NAV Derivatives
Auto Ancillaries 4.47%
• Motherson Sumi Systems Ltd. 4.47%
Banks 24.26%
• HDFC Bank Ltd. 9.57%
• ICICI Bank Ltd. 8.38%
State Bank Of India 3.16%
Axis Bank Ltd. 3.15%
Cement 5.16%
• JK Lakshmi Cement Ltd. 5.16%
Chemicals 5.77%
• Tata Chemicals Ltd. 5.77%
Construction 14.74%
• KNR Constructions Ltd. 7.70%
• PNC Infratech Ltd. 7.04%
Consumer Non Durables 6.85%
Bajaj Corp Ltd. 3.45%
Glaxosmithkline Consumer Healthcare Ltd. 3.39%
Ferrous Metals 2.33%
Tata Steel Ltd. 2.33%
Finance 4.58%
• Sundaram Finance Ltd. 4.58%
Pharmaceuticals 3.60%
Cipla Ltd. 3.60%
Services 4.75%
• Thomas Cook (India) Ltd. 4.75%
Software 4.41%
Infosys Ltd. 4.41%
Textile Products 6.07%
Mayur Uniquoters Ltd. 3.60%
SRF Ltd. 2.47%
OPTIONS 11.42%
Entry load : Nil
Riskometer This Product is suitable for investors who are seeking*:
• Long term wealth creation solution
• A close ended diversified equity fund that aims to provide capital appreciation by investing in a well diversified portfolio of stocks through fundamental analysis.
*Investors should consult their financial advisers if in doubt about whether the product is suitable for them.
Annual Portfolio Turnover Ratio : Equity - 0.96 times, Others (Debt and Derivatives) - 0.00 times Combined Annual Portfolio Turnover Ratio : 0.96 times
Portfolio as on April 30, 2017
Returns of ICICI Prudential Value Fund - Series 7 - Growth Option as on April 30, 2017 - (IPVF7)
Company/Issuer % to % to NAV NAV Derivatives
• Nifty 50 Index 11.42%
Short Term Debt and net current assets 1.60%
Total Net Assets 100.00%
Dividend History : Refer page no. from 122 to 130
SIP Returns : Refer page no. from 118 to 120
Total Expense Ratio @@ :
IPVF7 : 2.50% p. a.
IPVF7 Direct Plan : 1.61% p. a.
Investment Objective : Refer page no. from 131 to 134
Notes:1. Different plans shall have different expense structure. The performance details provided herein are of ICICI Prudential Value Fund - Series 7.2. The scheme is currently managed by Atul Patel. Mr. Atul Patel has been managing this fund since Jun 2015. Total Schemes managed by the Fund Manager is 14 (13 are jointly managed). Refer annexure from page no. 91 for performance of other schemes currently managed by Atul Patel.3. Date of inception: 08-Jun-15.4. As the Scheme has completed more than 1 year but less than 3 years, the performance details of only since inception and 1 year are provided herein.5. Past performance may or may not be sustained in future and the same may not necessarily provide the basis for comparison with other investment.6. Load is not considered for computation of returns.7. In case, the start/end date of the concerned period is a nonbusiness date (NBD), the NAV of the previous date is considered for computation of returns. The NAV per unit shown in the table is as on the start date of the said period
Scheme
Nifty 50 Index (Additional Benchmark)
NAV (Rs.) Per Unit (as on April 28,2017 : 12.55)
CAGR (%)
10.00
S&P BSE 500 Index (Benchmark)
Since inception
CurrentValue of
Investment of Rs. 10000
CAGR (%) Current Value of
Investment of Rs. 10000
1 Year 3 Year 5 Year
CAGR (%) Current Value of
Investment of Rs. 10000
CAGR (%) Current Value of
Investment of Rs. 10000
9.56 - -
Particulars
40.57 14044.35 - - - - 16.87 13426.40
24.80 12472.70 - - - - 11.94 12376.40
18.58 11852.59 - - - - 8.00 11566.23

Style Box
Note : - “Portfolio Beta, Standard Deviation, R Squared, Sharpe Ratio and Tracking Error of the Scheme is not computed owing to the short ime frame since launch of the Scheme.”Portfolio turnover has been computed as the ratio of the lower value of purchase and sales, to the average net assets in the past one year (since inception for schemes that have not completed a year). The figures are not netted for derivative transactions.**In addition to the fund manager managing this fund, the ADR/GDR exposure is managed by Mr. Ihab Dalwai.@@ Total Expense Ratio is weighted average for the month. Ratio excludes service tax on management fees and includes B-15 clawback reversal, if any.
Fund Managers** :
Manish Gunwani(Managing this fund since Aug, 2015 &Overall 20 years of experience)George Heber Joseph(Managing this fund since Aug, 2015 &Overall 13 years of experience)
Indicative Investment Horizon : 1100 Days
Inception/Allotment date: 06-Aug-15
SWP :Not Available
Min.Redemption Amt. :No redemption/repurchase of units shall be allowed prior to the maturity of the Scheme. Investors wishing to exit may do so, only in demat mode, by selling through BSE Limited or any of the stock exchange(s) where units of the Scheme will be listed as the Trustee may decide from time to time.
SIP :Not Available
NAV (As on 28-Apr-17):IPVF8 Dividend Option : 11.74IPVF8 Direct Plan Dividend Option : 12.05
Options :Dividend payout option
Application Amount for freshSubscription :Not available
Min.Addl.Investment :Not available
Exit load for Redemption / Switchout :- Lumpsum Investment OptionNil
43
Fund Details
Quantitative Indicators
Benchmark
Average P/E : 22.14 Average P/BV : 5.17 Average Dividend Yield : 0.89
S&P BSE 500 Index
• Top Ten Holdings
Diversified
ICICI Prudential Value Fund – Series 8A Close ended equity scheme
Entry load : Nil
Riskometer This Product is suitable for investors who are seeking*:
• Long term wealth creation solution
• A close ended diversified equity fund that aims to provide capital appreciation by investing in a well diversified portfolio of stocks through fundamental analysis.
*Investors should consult their financial advisers if in doubt about whether the product is suitable for them.
Monthly AAUM as on 30-Apr-17 : Rs. 313.18 crores
Closing AUM as on 30-Apr-17 :Rs. 300.20 crores
Annual Portfolio Turnover Ratio : Equity - 1.26 times, Others (Debt and Derivatives) - 0.00 times Combined Annual Portfolio Turnover Ratio : 1.26 times
Auto 8.43%
• Tata Motors Ltd. 4.76%
Mahindra & Mahindra Ltd. 3.67%
Banks 7.93%
• Axis Bank Ltd. 4.74%
Oriental Bank Of Commerce 3.19%
Cement 4.27%
Prism Cement Ltd. 3.79%
JK Lakshmi Cement Ltd. 0.47%
Chemicals 3.35%
Camlin Fine Sciences Ltd. 3.35%
Construction 5.96%
• Brigade Enterprises Ltd. 5.96%
Consumer Durables 0.67%
Bata India Ltd. 0.67%
Consumer Non Durables 3.16%
Bajaj Corp Ltd. 3.16%
Finance 9.91%
• Sundaram Finance Ltd. 4.98%
• Equitas Holdings Ltd. 4.93%
Healthcare Services 3.02%
Narayana Hrudayalaya Ltd. 3.02%
Industrial Capital Goods 3.37%
TD Power Systems Ltd. 3.37%
Industrial Products 4.44%
• AIA Engineering Ltd. 4.44%
Petroleum Products 8.41%
• Hindustan Petroleum Corporation Ltd. 8.41%
Pharmaceuticals 14.86%
• Astrazeneca Pharma India Ltd. 5.90%
• Alembic Pharmaceuticals Ltd. 5.76%
IPCA Laboratories Ltd. 3.20%
Company/Issuer % to NAV
Dividend History : Refer page no. from 122 to 130
SIP Returns : Refer page no. from 118 to 120
Total Expense Ratio @@ :
IPVF8 : 2.33% p. a.
IPVF8 Direct Plan : 1.44% p. a.
Investment Objective : Refer page no. from 131 to 134
Services 8.88%
• Thomas Cook (India) Ltd. 8.88%
Software 3.27%
Mphasis Ltd. 2.51%
Hexaware Technologies Ltd. 0.47%
Mindtree Ltd. 0.29%
Textile Products 4.09%
Mayur Uniquoters Ltd. 4.09%
Short Term Debt and net current assets 5.97%
Total Net Assets 100.00%
Company/Issuer % to NAV
Portfolio as on April 30, 2017
Returns of ICICI Prudential Value Fund - Series 8 - Growth Option as on April 30, 2017 - (IPVF8)
Notes:1. Different plans shall have different expense structure. The performance details provided herein are of ICICI Prudential Value Fund - Series 8.2. The scheme is currently managed by Manish Gunwani and George Heber Joseph. Mr. Manish Gunwani has been managing this fund since Aug 2015. Total Schemes managed by the Fund Manager Refer annexure from page no. 91 for performance of other schemes currently managed by is 12 (11 are jointly managed).Manish Gunwani.Mr. George Heber Joseph has been managing this fund since Aug 2015. Total Schemes managed by the Fund Manager Refer is 8 (6 are jointly managed).annexure from page no. 91 for performance of other schemes currently managed by George Heber Joseph.3. Date of inception: 06-Aug-15.4. As the Scheme has completed more than 1 year but less than 3 years, the performance details of only since inception and 1 year are provided herein.5. Past performance may or may not be sustained in future and the same may not necessarily provide the basis for comparison with other investment.6. Load is not considered for computation of returns.7. In case, the start/end date of the concerned period is a nonbusiness date (NBD), the NAV of the previous date is considered for computation of returns. The NAV per unit shown in the table is as on the start date of the said period
Scheme
Nifty 50 Index (Additional Benchmark)
NAV (Rs.) Per Unit (as on April 28,2017 : 11.74)
CAGR (%)
10.00
S&P BSE 500 Index (Benchmark)
Since inception
CurrentValue of
Investment of Rs. 10000
CAGR (%) Current Value of
Investment of Rs. 10000
1 Year 3 Year 5 Year
CAGR (%) Current Value of
Investment of Rs. 10000
CAGR (%) Current Value of
Investment of Rs. 10000
9.77 - -
Particulars
27.97 12788.64 - - - - 13.75 12494.50
24.80 12472.70 - - - - 7.87 11398.96
18.58 11852.59 - - - - 4.74 10832.96

Style Box
Fund Managers** :
Mr. S. Naren (Managing this fund since November 2016 & Overall 26 Years of experience)Mr. Atul Patel (Managing this fund since November 2016 & Overall 7 Years of experience)
Indicative Investment Horizon : 1099 Days
Inception/Allotment date: 29-Oct-16
SWP :Not Available
Min.Redemption Amt. :No redemption/repurchase of units shall be allowed prior to the maturity of the Scheme. Investors wishing to exit may do so by selling their units through stock exchanges. The Scheme shall be fully redeemed on the date of maturity and redemption proceeds shall be paid out within 10 business days, subject to availability of all relevant documents and details.
SIP :Not Available
NAV (As on 28-Apr-17):IPVF9 Growth Option : 11.27IPVF9 Dividend Option : 11.27IPVF9 Direct Plan Growth Option : 11.35IPVF9 Direct Plan Dividend Option : 11.35
Options :Growth Option & Dividend Option
Application Amount for freshSubscription :Rs.5,000 (plus in multiple of Rs.10)
Min.Addl.Investment :Not available
Exit load for Redemption / Switchout :- Lumpsum Investment OptionNot applicable
44
Fund Details
Diversified
Portfolio as on April 30, 2017
Quantitative Indicators
Benchmark
Average P/E : 27.58 Average P/BV : 5.23 Average Dividend Yield : 1.30
S&P BSE 500 Index
ICICI Prudential Value Fund - Series 9A Close ended equity scheme
RiskometerThis Product is suitable for investors who are seeking*:
*Investors should consult their financial advisers if in doubt about whether the product is suitable for them.
Monthly AAUM as on 30-Apr-17 : Rs. 286.83 crores
Closing AUM as on 30-Apr-17 : Rs. 292.84 crores
• Top Ten Holdings
Entry load : Not applicable
Annual Portfolio Turnover Ratio : Equity - 0.37 times, Others (Debt and Derivatives) - 0.14 times Combined Annual Portfolio Turnover Ratio : 0.51 times
Dividend History : Refer page no. from 122 to 130
SIP Returns : Refer page no. from 118 to 120
Total Expense Ratio @@ :
IPVF9 : 2.34% p. a.
IPVF9 Direct Plan : 1.04% p. a.
Investment Objective : Refer page no. from 131 to 134
Company/Issuer % to NAV
Banks 15.75%
• ICICI Bank Ltd. 8.36%
• HDFC Bank Ltd. 7.39%
Cement 12.93%
• Orient Cement Ltd. 6.73%
• JK Lakshmi Cement Ltd. 6.20%
Chemicals 8.38%
• Tata Chemicals Ltd. 8.38%
Construction 13.10%
• PNC Infratech Ltd. 7.78%
KNR Constructions Ltd. 5.31%
Consumer Non Durables 12.39%
• Britannia Industries Ltd. 7.06%
Glaxosmithkline Consumer Healthcare Ltd. 5.33%
Finance 4.98%
Sundaram Finance Ltd. 4.98%
Minerals/Mining 4.32%
Coal India Ltd. 4.32%
Pharmaceuticals 13.35%
• IPCA Laboratories Ltd. 7.23%
• Cipla Ltd. 6.12%
Software 5.62%
• HCL Technologies Ltd. 5.62%
Short Term Debt and net current assets 9.18%
Total Net Assets 100.00%
Note : - “Portfolio Beta, Standard Deviation, R Squared, Sharpe Ratio and Tracking Error of the Scheme is not computed owing to the short ime frame since launch of the Scheme.”Portfolio turnover has been computed as the ratio of the lower value of purchase and sales, to the average net assets in the past one year (since inception for schemes that have not completed a year). The figures are not netted for derivative transactions.**In addition to the fund manager managing this fund, the ADR/GDR exposure is managed by Mr. Ihab Dalwai.@@ Total Expense Ratio is weighted average for the month. Ratio excludes service tax on management fees and includes B-15 clawback reversal, if any.
• Long term wealth creation solution
• A close ended diversified equity fund that aims to provide capital appreciation by investing in a well diversified portfolio of stocks through fundamental analysis.
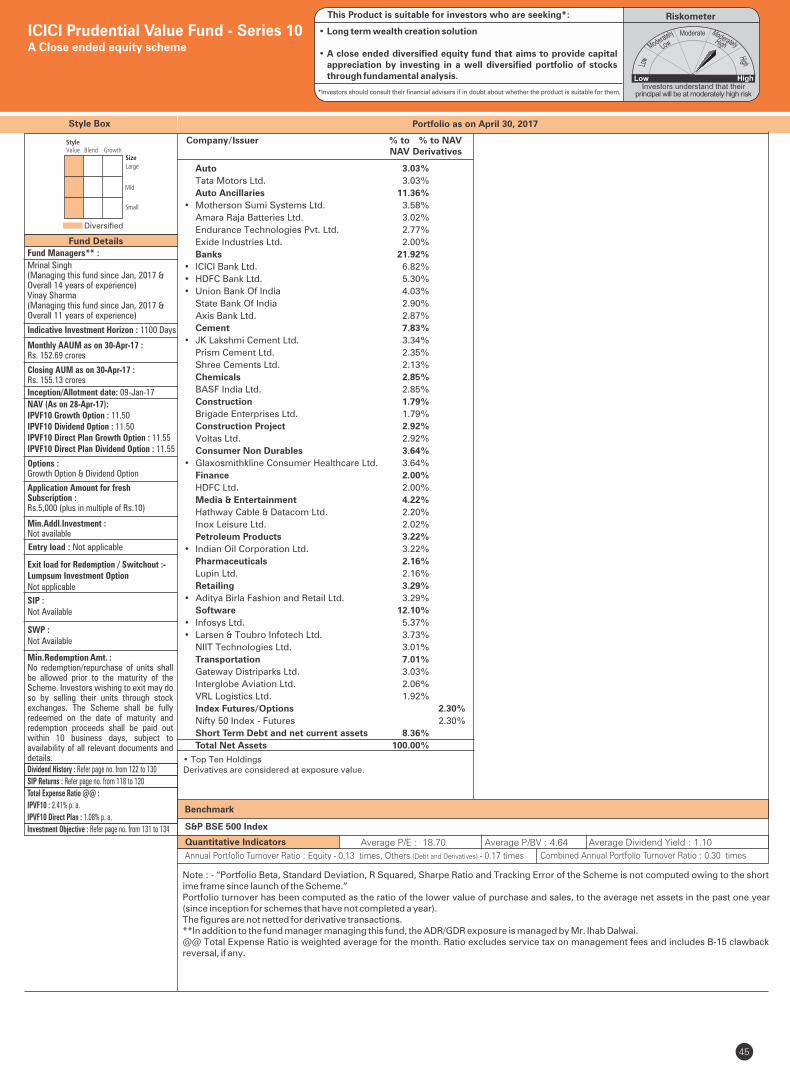
Style Box
Fund Managers** :
Indicative Investment Horizon : 1100 Days
Inception/Allotment date: 09-Jan-17
SWP :Not Available
Min.Redemption Amt. :No redemption/repurchase of units shall be allowed prior to the maturity of the Scheme. Investors wishing to exit may do so by selling their units through stock exchanges. The Scheme shall be fully redeemed on the date of maturity and redemption proceeds shall be paid out within 10 business days, subject to availability of all relevant documents and details.
SIP :Not Available
NAV (As on 28-Apr-17):IPVF10 Growth Option : 11.50IPVF10 Dividend Option : 11.50IPVF10 Direct Plan Growth Option : 11.55IPVF10 Direct Plan Dividend Option : 11.55
Options :Growth Option & Dividend Option
Application Amount for freshSubscription :Rs.5,000 (plus in multiple of Rs.10)
Min.Addl.Investment :Not available
Exit load for Redemption / Switchout :- Lumpsum Investment OptionNot applicable
45
Fund Details
Diversified
Portfolio as on April 30, 2017
Quantitative Indicators
Benchmark
Average P/E : 18.70 Average P/BV : 4.64 Average Dividend Yield : 1.10
S&P BSE 500 Index
ICICI Prudential Value Fund - Series 10A Close ended equity scheme
RiskometerThis Product is suitable for investors who are seeking*:
*Investors should consult their financial advisers if in doubt about whether the product is suitable for them.
Monthly AAUM as on 30-Apr-17 : Rs. 152.69 crores
Closing AUM as on 30-Apr-17 :Rs. 155.13 crores
• Top Ten HoldingsDerivatives are considered at exposure value.
Entry load : Not applicable
Annual Portfolio Turnover Ratio : Equity - 0.13 times, Others (Debt and Derivatives) - 0.17 times Combined Annual Portfolio Turnover Ratio : 0.30 times
Dividend History : Refer page no. from 122 to 130
SIP Returns : Refer page no. from 118 to 120
Total Expense Ratio @@ :
IPVF10 : 2.41% p. a.
IPVF10 Direct Plan : 1.08% p. a.
Investment Objective : Refer page no. from 131 to 134
Auto 3.03%
Tata Motors Ltd. 3.03%
Auto Ancillaries 11.36%
• Motherson Sumi Systems Ltd. 3.58%
Amara Raja Batteries Ltd. 3.02%
Endurance Technologies Pvt. Ltd. 2.77%
Exide Industries Ltd. 2.00%
Banks 21.92%
• ICICI Bank Ltd. 6.82%
• HDFC Bank Ltd. 5.30%
• Union Bank Of India 4.03%
State Bank Of India 2.90%
Axis Bank Ltd. 2.87%
Cement 7.83%
• JK Lakshmi Cement Ltd. 3.34%
Prism Cement Ltd. 2.35%
Shree Cements Ltd. 2.13%
Chemicals 2.85%
BASF India Ltd. 2.85%
Construction 1.79%
Brigade Enterprises Ltd. 1.79%
Construction Project 2.92%
Voltas Ltd. 2.92%
Consumer Non Durables 3.64%
• Glaxosmithkline Consumer Healthcare Ltd. 3.64%
Finance 2.00%
HDFC Ltd. 2.00%
Media & Entertainment 4.22%
Hathway Cable & Datacom Ltd. 2.20%
Inox Leisure Ltd. 2.02%
Petroleum Products 3.22%
• Indian Oil Corporation Ltd. 3.22%
Pharmaceuticals 2.16%
Lupin Ltd. 2.16%
Retailing 3.29%
• Aditya Birla Fashion and Retail Ltd. 3.29%
Software 12.10%
• Infosys Ltd. 5.37%
• Larsen & Toubro Infotech Ltd. 3.73%
NIIT Technologies Ltd. 3.01%
Transportation 7.01%
Gateway Distriparks Ltd. 3.03%
Interglobe Aviation Ltd. 2.06%
VRL Logistics Ltd. 1.92%
Index Futures/Options 2.30%
Nifty 50 Index - Futures 2.30%
Short Term Debt and net current assets 8.36%
Total Net Assets 100.00%
Note : - “Portfolio Beta, Standard Deviation, R Squared, Sharpe Ratio and Tracking Error of the Scheme is not computed owing to the short ime frame since launch of the Scheme.”Portfolio turnover has been computed as the ratio of the lower value of purchase and sales, to the average net assets in the past one year (since inception for schemes that have not completed a year). The figures are not netted for derivative transactions.**In addition to the fund manager managing this fund, the ADR/GDR exposure is managed by Mr. Ihab Dalwai.@@ Total Expense Ratio is weighted average for the month. Ratio excludes service tax on management fees and includes B-15 clawback reversal, if any.
• Long term wealth creation solution
• A close ended diversified equity fund that aims to provide capital appreciation by investing in a well diversified portfolio of stocks through fundamental analysis.
Mrinal Singh (Managing this fund since Jan, 2017 & Overall 14 years of experience)Vinay Sharma(Managing this fund since Jan, 2017 & Overall 11 years of experience)
Company/Issuer % to % to NAV NAV Derivatives

Style Box
Fund Managers** :
Indicative Investment Horizon : 1100 Days
Inception/Allotment date: 25-Jan-17
SWP :Not Available
Min.Redemption Amt. :No redemption/repurchase of units shall be allowed prior to the maturity of the Scheme. Investors wishing to exit may do so by selling their units through stock exchanges. The Scheme shall be fully redeemed on the date of maturity and redemption proceeds shall be paid out within 10 business days, subject to availability of all relevant documents and details.
SIP :Not Available
NAV (As on 28-Apr-17):IPVF11 Growth Option : 10.88IPVF11 Dividend Option : 10.88IPVF11 Direct Plan Growth Option : 10.92IPVF11 Direct Plan Dividend Option : 10.92
Options :Growth Option & Dividend Option
Application Amount for freshSubscription :Rs.5,000 (plus in multiple of Rs.10)
Min.Addl.Investment :Not available
Exit load for Redemption / Switchout :- Lumpsum Investment OptionNot applicable
46
Fund Details
Diversified
Portfolio as on April 30, 2017
Quantitative Indicators
Benchmark
Average P/E : 31.29 Average P/BV : 6.75 Average Dividend Yield : 0.85
S&P BSE 500 Index
ICICI Prudential Value Fund - Series 11A Close ended equity scheme
RiskometerThis Product is suitable for investors who are seeking*:
*Investors should consult their financial advisers if in doubt about whether the product is suitable for them.
Monthly AAUM as on 30-Apr-17 :Rs. 132.30 crores
Closing AUM as on 30-Apr-17 : Rs. 137.82 crores
• Top Ten HoldingsDerivatives are considered at exposure value.
Entry load : Not applicable
Annual Portfolio Turnover Ratio : Equity - 0.10 times, Others (Debt and Derivatives) - 0.00 times Combined Annual Portfolio Turnover Ratio : 0.10 times
Dividend History : Refer page no. from 122 to 130
SIP Returns : Refer page no. from 118 to 120
Total Expense Ratio @@ :
IPVF11 : 2.44% p. a.
IPVF11 Direct Plan : 1.14% p. a.
Investment Objective : Refer page no. from 131 to 134
Auto 5.79%
• TVS Motor Company Ltd. 5.79%
Auto Ancillaries 9.12%
• Motherson Sumi Systems Ltd. 9.12%
Banks 11.86%
• State Bank Of India 4.98%
• ICICI Bank Ltd. 4.69%
Union Bank Of India 2.19%
Cement 7.45%
• JK Lakshmi Cement Ltd. 4.59%
ACC Ltd. 2.86%
Construction 4.86%
• KNR Constructions Ltd. 4.86%
Construction Project 2.23%
Larsen & Toubro Ltd. 2.23%
Consumer Durables 4.72%
• Orient Paper & Industries Ltd. 4.72%
Consumer Non Durables 8.19%
• Britannia Industries Ltd. 5.35%
ITC Ltd. 2.84%
Ferrous Metals 2.86%
Tata Metaliks Ltd. 2.86%
Finance 6.63%
• Mahindra & Mahindra Financial Services Ltd. 4.17%
Equitas Holdings Ltd. 2.47%
Industrial Products 2.00%
Astral Poly Technik Ltd. 2.00%
Media & Entertainment 5.50%
• PVR Ltd. 5.50%
Petroleum Products 1.95%
Indian Oil Corporation Ltd. 1.95%
Pharmaceuticals 5.29%
Sun Pharmaceutical Industries Ltd. 2.75%
Cipla Ltd. 2.54%
Retailing 3.82%
Trent Ltd. 3.82%
Software 6.34%
HCL Technologies Ltd. 3.53%
Larsen & Toubro Infotech Ltd. 2.81%
Textile Products 3.16%
S. P. Apparels Ltd. 3.16%
Transportation 3.41%
Interglobe Aviation Ltd. 3.41%
OPTIONS 3.41%
Nifty 50 Index 3.41%
Short Term Debt and net current assets 1.40%
Total Net Assets 100.00%
Note : - “Portfolio Beta, Standard Deviation, R Squared, Sharpe Ratio and Tracking Error of the Scheme is not computed owing to the short ime frame since launch of the Scheme.”Portfolio turnover has been computed as the ratio of the lower value of purchase and sales, to the average net assets in the past one year (since inception for schemes that have not completed a year). The figures are not netted for derivative transactions.**In addition to the fund manager managing this fund, the ADR/GDR exposure is managed by Mr. Ihab Dalwai.@@ Total Expense Ratio is weighted average for the month. Ratio excludes service tax on management fees and includes B-15 clawback reversal, if any.
• Long term wealth creation solution
• A close ended diversified equity fund that aims to provide capital appreciation by investing in a well diversified portfolio of stocks through fundamental analysis.
Manish Gunwani(Managing this fund since Jan, 2017 & Overall 20 Years of experience)Rajat Chandak(Managing this fund since Jan, 2017 & Overall 8 Years of experience)
Company/Issuer % to % to NAV NAV Derivatives

Style Box
Fund Managers** :
Indicative Investment Horizon : 1360 Days
Inception/Allotment date: 17-Apr-2017
SWP :Not Applicable
Min.Redemption Amt. :No redemption/repurchase of units shall be allowed prior to the maturity of the Scheme. Investors wishing to exit may do so by selling their units through stock exchanges. The Scheme shall be fully redeemed on the date of maturity and redemption proceeds shall be paid out within 10 business days, subject to availability of all relevant documents and details.
SIP :Not Applicable
NAV (As on 28-Apr-17):IPVF12 Dividend Option : 10.09IPVF12 Direct Plan Dividend Option : 10.10
Options : Dividend Option
Application Amount for freshSubscription :Rs.5,000 (plus in multiple of Rs.10)
Min.Addl.Investment :Not Applicable
Exit load for Redemption / Switchout :- Lumpsum Investment OptionNot applicable
47
Fund Details
Diversified
Portfolio as on April 30, 2017
Quantitative Indicators
Benchmark
Average P/E : 22.06 Average P/BV : 2.63 Average Dividend Yield : 1.00
S&P BSE 500 Index
ICICI Prudential Value Fund - Series 12A Close ended equity scheme
RiskometerThis Product is suitable for investors who are seeking*:
*Investors should consult their financial advisers if in doubt about whether the product is suitable for them.
Monthly AAUM as on 30-Apr-17 : Rs. 286.97 crores
Closing AUM as on 30-Apr-17 : Rs. 669.26 crores
• Top Ten HoldingsDerivatives are considered at exposure value.
Entry load : Not applicable
Annual Portfolio Turnover Ratio : Equity - 0.00 times, Others (Debt and Derivatives) - 0.10 times Combined Annual Portfolio Turnover Ratio : 0.10 times
Dividend History : Refer page no. from 122 to 130
SIP Returns : Refer page no. from 118 to 120
Total Expense Ratio @@ :
IPVF11 : 2.35% p. a.
IPVF11 Direct Plan : 0.49% p. a.
Investment Objective : Refer page no. from 131 to 134
Auto 5.12%
• Mahindra & Mahindra Ltd. 5.12%
Banks 9.77% 6.77%
• ICICI Bank Ltd. - Futures 6.77%
• Axis Bank Ltd. 4.94%
• State Bank Of India 4.83%
Construction 5.63%
• Brigade Enterprises Ltd. 3.48%
KNR Constructions Ltd. 2.15%
Construction Project 9.11%
• Larsen & Toubro Ltd. 5.08%
• Engineers India Ltd. 4.04%
Consumer Non Durables 1.48%
United Spirits Ltd. 1.48%
Finance 4.88%
Mahindra & Mahindra Financial Services Ltd. 3.05%
IDFC Ltd. 1.82%
Gas 2.94%
Petronet LNG Ltd. 2.94%
Petroleum Products 4.67%
• Hindustan Petroleum Corporation Ltd. 4.67%
Power 3.80%
• Tata Power Company Ltd. - Futures 3.80%
Telecom - Services 7.97%
• Bharti Airtel Ltd. 5.06%
Idea Cellular Ltd. 2.91%
Short Term Debt and net current assets 37.84%
Total Net Assets 100.00%
Note : - “Portfolio Beta, Standard Deviation, R Squared, Sharpe Ratio and Tracking Error of the Scheme is not computed owing to the short ime frame since launch of the Scheme.”Portfolio turnover has been computed as the ratio of the lower value of purchase and sales, to the average net assets in the past one year (since inception for schemes that have not completed a year). The figures are not netted for derivative transactions.**In addition to the fund manager managing this fund, the ADR/GDR exposure is managed by Mr. Ihab Dalwai.@@ Total Expense Ratio is weighted average for the month. Ratio excludes service tax on management fees and includes B-15 clawback reversal, if any.
• Long term wealth creation solution
• A close ended diversified equity fund that aims to provide capital appreciation by investing in a well diversified portfolio of stocks through fundamental analysis.
Company/Issuer % to % to NAV NAV Derivatives
S. Naren (Managing this fund since April, 2017 & Overall 20 Years of experience)George Joseph(Managing this fund since April, 2017 & Overall 8 Years of experience)

• Top Ten Holdings
Style Box
Note : - “Portfolio Beta, Standard Deviation, R Squared, Sharpe Ratio and Tracking Error of the Scheme is not computed owing to the short time frame since launch of the Scheme.”Portfolio turnover has been computed as the ratio of the lower value of purchase and sales, to the average net assets in the past one year (since inception for schemes that have not completed a year). The figures are not netted for derivative transactions.**In addition to the fund manager managing this fund, the ADR/GDR exposure is managed by Mr. Ihab Dalwai.@@ Total Expense Ratio is weighted average for the month. Ratio excludes service tax on management fees and includes B-15 clawback reversal, if any.
Fund Managers** :
Mrinal Singh(Managing this fund since Mar, 2015 &Overall 14 years of experience)Mittul Kalawadia(Managing this fund since Apr, 2016 &Overall 10 years of experience)
Indicative Investment Horizon : 3.5 years
Inception/Allotment date: 27-Mar-15
SWP :Not Available
Min.Redemption Amt. :No redemption/repurchase of units shall be allowed prior to the maturity of the Scheme. Investors wishing to exit may do so, only in demat mode, by selling through BSE Limited or any of the stock exchange(s) where units of the Scheme will be listed as the Trustee may decide from time to time.
SIP :Not Available
NAV (As on 28-Apr-17):IPIRF1 Dividend Option : 12.08IPIRF1 Direct Plan Dividend Option : 12.49
Options :Only Dividend payout facility available
Application Amount for freshSubscription :Not available
Min.Addl.Investment :Not available
Exit load for Redemption / Switchout :- Lumpsum Investment OptionNil
48
Fund Details
Diversified
Quantitative Indicators Average P/E : 23.02 Average P/BV : 5.27 Average Dividend Yield : 1.21
Monthly AAUM as on 30-Apr-17 : Rs. 301.60 crores
Closing AUM as on 30-Apr-17 : Rs. 293.35 crores
ICICI Prudential India Recovery Fund – Series 1A Close ended equity scheme
Entry load : Nil
RiskometerThis Product is suitable for investors who are seeking*:
• Long term wealth creation solution
• A close ended equity fund that aims to provide capital appreciation by investing in equity and equity related securities that are likely to benefit from recovery in the Indian economy.
*Investors should consult their financial advisers if in doubt about whether the product is suitable for them.
Annual Portfolio Turnover Ratio : Equity - 0.28 times, Others (Debt and Derivatives) - 0.02 times Combined Annual Portfolio Turnover Ratio : 0.30 times
Auto 3.24%
• TVS Motor Company Ltd. 3.24%
Auto Ancillaries 5.16%
• Motherson Sumi Systems Ltd. 5.16%
Banks 20.07%
• HDFC Bank Ltd. 9.55%
• State Bank Of India 5.19%
ICICI Bank Ltd. 3.09%
The Jammu & Kashmir Bank Ltd. 2.25%
Cement 3.19%
Orient Cement Ltd. 3.19%
Construction Project 18.87%
• Ashoka Buildcon Ltd. 6.48%
• Larsen & Toubro Ltd. 5.58%
• NCC Ltd. 4.52%
Engineers India Ltd. 2.10%
Gammon Infrastructure Projects Ltd. 0.19%
Consumer Durables 4.41%
Bata India Ltd. 2.52%
Orient Paper & Industries Ltd. 1.89%
Consumer Non Durables 2.94%
Jubilant Foodworks Ltd. 2.94%
Ferrous Metals 4.40%
• Tata Steel Ltd. 3.27%
Steel Authority Of India Ltd. 1.14%
Finance 6.65%
• Bajaj Finserv Ltd. 4.11%
Ujjivan Financial Services Ltd. 2.54%
Industrial Capital Goods 2.00%
Triveni Turbine Ltd. 2.00%
Industrial Products 2.74%
Elgi Equipments Ltd. 2.74%
Company/Issuer % to NAV
Portfolio as on April 30, 2017
Minerals/Mining 3.34%
Gujarat Mineral Development Corporation Ltd. 1.69%
Coal India Ltd. 1.64%
Petroleum Products 2.09%
Castrol India Ltd. 2.09%
Power 10.64%
• CESC Ltd. 4.60%
NTPC Ltd. 3.15%
Tata Power Company Ltd. 2.51%
Ksk Energy Ventures Ltd. 0.39%
Retailing 0.18%
Avenue Supermarts Ltd. 0.18%
Short Term Debt and net current assets 10.07%
Total Net Assets 100.00%
Company/Issuer % to NAV
Returns of ICICI Prudential India Recovery Fund – Series 1 - Dividend Option as on April 30, 2017 - (IPIRF1)
Dividend History : Refer page no. from 122 to 130
SIP Returns : Refer page no. from 118 to 120
Total Expense Ratio @@ :
IPIRF1 : 2.33% p. a.
IPIRF1 Direct Plan : 1.23% p. a.
Investment Objective : Refer page no. from 131 to 134
Notes:1. Different plans shall have different expense structure. The performance details provided herein are of ICICI Prudential India Recovery Fund - Series 1.2. The scheme is currently managed by Mrinal Singh and Mittul Kalawadia. Mr. Mrinal Singh has been managing this fund since Mar 2015. Total Schemes managed by the Fund Manager . Refer annexure from page no. 91 for performance of other schemes is 15 (14 are jointly managed [Excludes FoF Schemes])currently managed by Mrinal Singh.Mr. Mittul Kalawadia has been managing this fund since Apr 2016 . Total Schemes managed by the Fund Manager Refer annexure from is 8 (8 are jointly managed).page no. 91 for performance of other schemes currently managed by Mittul Kalawadia.3. Date of inception: 27-Mar-15.4. Performance of dividend option would be Net of Dividend distribution tax, if any.5. As the Scheme has completed more than 1 year but less than 3 years, the performance details of only since inception and 1 year are provided herein.6. Past performance may or may not be sustained in future and the same may not necessarily provide the basis for comparison with other investment.7. Load is not considered for computation of returns.8. In case, the start/end date of the concerned period is a nonbusiness date (NBD), the NAV of the previous date is considered for computation of returns. The NAV per unit shown in the table is as on the start date of the said period
Scheme
Nifty 50 Index (Additional Benchmark)
NAV (Rs.) Per Unit (as on April 28,2017 : 12.08)
CAGR (%)
10.00
S&P BSE 500 Index (Benchmark)
Since inception
CurrentValue of
Investment of Rs. 10000
CAGR (%) Current Value of
Investment of Rs. 10000
1 Year 3 Year 5 Year
CAGR (%) Current Value of
Investment of Rs. 10000
CAGR (%) Current Value of
Investment of Rs. 10000
9.57 - -
Particulars
34.27 13415.67 - - - - 12.70 12838.79
24.80 12472.70 - - - - 8.98 11969.64
18.58 11852.59 - - - - 5.36 11154.06

Style Box
Note : - “Portfolio Beta, Standard Deviation, R Squared, Sharpe Ratio and Tracking Error of the Scheme is not computed owing to the short time frame since launch of the Scheme.”Portfolio turnover has been computed as the ratio of the lower value of purchase and sales, to the average net assets in the past one year (since inception for schemes that have not completed a year). The figures are not netted for derivative transactions.**In addition to the fund manager managing this fund, the ADR/GDR exposure is managed by Mr. Ihab Dalwai.@@ Total Expense Ratio is weighted average for the month. Ratio excludes service tax on management fees and includes B-15 clawback reversal, if any.
Fund Managers** :
Mrinal Singh(Managing this fund since Apr, 2015 &Overall 14 years of experience)Mittul Kalawadia(Managing this fund since Apr, 2016 &Overall 10 years of experience)
Indicative Investment Horizon : 3.5 years
Inception/Allotment date: 08-Apr-15
SWP :Not Available
Min.Redemption Amt. :No redemption/repurchase of units shall be allowed prior to the maturity of the Scheme. Investors wishing to exit may do so, only in demat mode, by selling through BSE Limited or any of the stock exchange(s) where units of the Scheme will be listed as the Trustee may decide from time to time.
SIP :Not Available
NAV (As on 28-Apr-17):IPIRF2 Dividend Option : 13.01IPIRF2 Direct Plan Dividend Option : 13.47
Options :Only Dividend payout facility available
Application Amount for freshSubscription :Not available
Min.Addl.Investment :Not available
Entry load : Nil
Exit load for Redemption / Switchout :- Lumpsum Investment OptionNil
49
Fund Details
Diversified
Quantitative Indicators
Benchmark
Average P/E : 21.87 Average P/BV : 4.45 Average Dividend Yield : 0.90
S&P BSE 500 Index
• Top Ten HoldingsDerivatives are considered at exposure value.
Auto 5.94%
• TVS Motor Company Ltd. 3.30%
V.S.T Tillers Tractors Ltd. 2.65%
Auto Ancillaries 3.83%
• Motherson Sumi Systems Ltd. 3.83%
Banks 17.75% 2.12%
• HDFC Bank Ltd. 7.60%
HDFC Bank Ltd. - Futures 2.12%
• State Bank Of India 5.27%
• ICICI Bank Ltd. 4.88%
Cement 1.73%
Orient Cement Ltd. 1.73%
Construction 11.60%
• KNR Constructions Ltd. 11.60%
Construction Project 18.68%
• Ashoka Buildcon Ltd. 5.79%
• Larsen & Toubro Ltd. 5.69%
• NCC Ltd. 5.08%
Engineers India Ltd. 2.14%
Consumer Durables 2.08%
Bata India Ltd. 2.08%
Consumer Non Durables 2.94%
Jubilant Foodworks Ltd. 2.94%
Ferrous Metals 3.26%
Tata Steel Ltd. 3.26%
Finance 2.88%
Ujjivan Financial Services Ltd. 1.58%
IDFC Ltd. 1.30%
Gas 2.04%
Indraprastha Gas Ltd. 2.04%
Industrial Capital Goods 1.14%
Triveni Turbine Ltd. 1.14%
ICICI Prudential India Recovery Fund – Series 2A Close ended equity scheme
RiskometerThis Product is suitable for investors who are seeking*:
• Long term wealth creation solution
• A close ended equity fund that aims to provide capital appreciation by investing in equity and equity related securities that are likely to benefit from recovery in the Indian economy.
*Investors should consult their financial advisers if in doubt about whether the product is suitable for them.
Annual Portfolio Turnover Ratio : Equity - 0.36 times, Others (Debt and Derivatives) - 0.16 times Combined Annual Portfolio Turnover Ratio : 0.52 times
Monthly AAUM as on 30-Apr-17 : Rs. 377.30 crores
Closing AUM as on 30-Apr-17 : Rs. 362.72 crores
Portfolio as on April 30, 2017
Returns of ICICI Prudential India Recovery Fund – Series 2 - Dividend Option as on April 30, 2017 - (IPIRF2)
Dividend History : Refer page no. from 122 to 130
SIP Returns : Refer page no. from 118 to 120
Total Expense Ratio @@ :
IPIRF2 : 2.32% p. a.
IPIRF2 Direct Plan : 0.32% p. a.
Investment Objective : Refer page no. from 131 to 134
Industrial Products 3.10%
Elgi Equipments Ltd. 3.10%
Petroleum Products 2.13%
Castrol India Ltd. 2.13%
Power 8.75%
• Power Grid Corporation Of India Ltd. 8.53%
Ksk Energy Ventures Ltd. 0.22%
Retailing 0.18%
Avenue Supermarts Ltd. 0.18%
Transportation 1.65%
VRL Logistics Ltd. 1.65%
Short Term Debt and net current assets 8.18%
Total Net Assets 100.00%
Notes:1. Different plans shall have different expense structure. The performance details provided herein are of ICICI Prudential India Recovery Fund - Series 2.2. The scheme is currently managed by Mrinal Singh and Mittul Kalawadia. Mr. Mrinal Singh has been managing this fund since Apr 2015. Total Schemes managed by the Fund Manager . Refer annexure from page no. 91 for performance of other schemes is 15 (14 are jointly managed [Excludes FoF Schemes])currently managed by Mrinal Singh.Mr. Mittul Kalawadia has been managing this fund since Apr 2016 . Total Schemes managed by the Fund Manager Refer annexure from is 8 (8 are jointly managed).page no. 91 for performance of other schemes currently managed by Mittul Kalawadia.3. Date of inception: 08-Apr-15.4. Performance of dividend option would be Net of Dividend distribution tax, if any.5. As the Scheme has completed more than 1 year but less than 3 years, the performance details of only since inception and 1 year are provided herein.6. Past performance may or may not be sustained in future and the same may not necessarily provide the basis for comparison with other investment.7. Load is not considered for computation of returns.8. In case, the start/end date of the concerned period is a nonbusiness date (NBD), the NAV of the previous date is considered for computation of returns. The NAV per unit shown in the table is as on the start date of the said period
Scheme
Nifty 50 Index (Additional Benchmark)
NAV (Rs.) Per Unit (as onApril 28,2017 : 13.01)
CAGR (%)
10.00
S&P BSE 500 Index (Benchmark)
Since inception
CurrentValue of
Investment of Rs. 10000
CAGR (%) Current Value of
Investment of Rs. 10000
1 Year 3 Year 5 Year
CAGR (%) Current Value of
Investment of Rs. 10000
CAGR (%) Current Value of
Investment of Rs. 10000
10.05 - -
Particulars
29.54 12945.27 - - - - 13.64 13010.00
24.80 12472.70 - - - - 6.52 11388.25
18.58 11852.59 - - - - 3.23 10676.64
Company/Issuer % to % to NAV NAV Derivatives
Company/Issuer % to % to NAV NAV Derivatives

Style Box
Note : - “Portfolio Beta, Standard Deviation, R Squared, Sharpe Ratio and Tracking Error of the Scheme is not computed owing to the short time frame since launch of the Scheme.”Portfolio turnover has been computed as the ratio of the lower value of purchase and sales, to the average net assets in the past one year (since inception for schemes that have not completed a year). The figures are not netted for derivative transactions.**In addition to the fund manager managing this fund, the ADR/GDR exposure is managed by Mr. Ihab Dalwai.@@ Total Expense Ratio is weighted average for the month. Ratio excludes service tax on management fees and includes B-15 clawback reversal, if any.
Fund Managers** :
Mrinal Singh(Managing this fund since Aug, 2015 &Overall 14 years of experience)Mittul Kalawadia(Managing this fund since Apr, 2016 &Overall 10 years of experience)
Indicative Investment Horizon : 1100 Days
Inception/Allotment date: 28-Aug-15
SWP :Not Available
Min.Redemption Amt. :No redemption/repurchase of units shall be allowed prior to the maturity of the Scheme. Investors wishing to exit may do so, only in demat mode, by selling through BSE Limited or any of the stock exchange(s) where units of the Scheme will be listed as the Trustee may decide from time to time.
SIP :Not Available
NAV (As on 28-Apr-17):IPIRF3 Growth Option : 13.16IPIRF3 Dividend Option : 13.16IPIRF3 Direct Plan Growth Option : 13.49IPIRF3 Direct Plan Dividend Option : 13.49
Options :Cumulative & Dividend payout option
Application Amount for freshSubscription :Not available
Min.Addl.Investment :Not available
Exit load for Redemption / Switchout :- Lumpsum Investment OptionNil
50
Fund Details
Diversified
Quantitative Indicators
Benchmark
Average P/E : 22.33 Average P/BV : 4.78 Average Dividend Yield : 1.02
S&P BSE 500 Index
Company/Issuer % to NAV
• Top Ten Holdings
ICICI Prudential India Recovery Fund – Series 3A Close ended equity scheme
Auto 6.45%
• TVS Motor Company Ltd. 6.45%
Auto Ancillaries 4.95%
• Motherson Sumi Systems Ltd. 4.95%
Banks 17.51%
• HDFC Bank Ltd. 7.87%
• State Bank Of India 5.01%
• ICICI Bank Ltd. 4.64%
Cement 3.97%
• JK Lakshmi Cement Ltd. 3.97%
Construction Project 12.68%
• Larsen & Toubro Ltd. 5.52%
• NCC Ltd. 5.09%
Voltas Ltd. 2.06%
Consumer Durables 4.36%
Bata India Ltd. 2.48%
Orient Paper & Industries Ltd. 1.88%
Consumer Non Durables 2.80%
Jubilant Foodworks Ltd. 2.80%
Ferrous Metals 3.19%
Tata Steel Ltd. 3.19%
Finance 8.23%
• Multi Commodity Exchange Of India Ltd. 4.77%
IDFC Ltd. 1.93%
Ujjivan Financial Services Ltd. 1.52%
Gas 2.01%
Indraprastha Gas Ltd. 2.01%
Industrial Capital Goods 8.04%
Bharat Heavy Electricals Ltd. 2.71%
TD Power Systems Ltd. 2.36%
Thermax Ltd. 1.69%
Triveni Turbine Ltd. 1.28%
Pesticides 1.55%
Entry load : Nil
RiskometerThis Product is suitable for investors who are seeking*:
• Long term wealth creation solution
• A close ended equity fund that aims to provide capital appreciation by investing in equity and equity related securities that are likely to benefit from recovery in the Indian economy.
*Investors should consult their financial advisers if in doubt about whether the product is suitable for them.
Monthly AAUM as on 30-Apr-17 :Rs. 166.35 crores
Closing AUM as on 30-Apr-17 :Rs. 160.85 crores
Annual Portfolio Turnover Ratio : Equity - 0.32 times, Others (Debt and Derivatives) - 0.03 times Combined Annual Portfolio Turnover Ratio : 0.35 times
Dividend History : Refer page no. from 122 to 130
SIP Returns : Refer page no. from 118 to 120
Total Expense Ratio @@ :
IPIRF3 : 2.40% p. a.
IPIRF3 Direct Plan : 1.91% p. a.
Investment Objective : Refer page no. from 131 to 134
Portfolio as on April 30, 2017
Company/Issuer % to NAV
Rallis India Ltd. 1.55%
Petroleum Products 2.07%
Castrol India Ltd. 2.07%
Power 7.72%
• CESC Ltd. 4.70%
PTC India Ltd. 3.02%
Retailing 0.18%
Avenue Supermarts Ltd. 0.18%
Services 0.57%
Thomas Cook (India) Ltd. 0.57%
Transportation 0.88%
VRL Logistics Ltd. 0.88%
Short Term Debt and net current assets 12.83%
Total Net Assets 100.00%
Returns of ICICI Prudential India Recovery Fund – Series 3 - Dividend Option as on April 30, 2017 - (IPIRF3)
Notes:1. Different plans shall have different expense structure. The performance details provided herein are of ICICI Prudential India Recovery Fund - Series 3.2. The scheme is currently managed by Mrinal Singh and Mittul Kalawadia. Mr. Mrinal Singh has been managing this fund since Aug 2015. Total Schemes managed by the Fund Manager . Refer annexure from page no. 91 for performance of other schemes is 15 (14 are jointly managed [Excludes FoF Schemes])currently managed by Mrinal Singh.Mr. Mittul Kalawadia has been managing this fund since Apr 2016 . Total Schemes managed by the Fund Manager Refer annexure from is 8 (8 are jointly managed).page no. 91 for performance of other schemes currently managed by Mittul Kalawadia.3. Date of inception: 28-Aug-15.4. Performance of dividend option would be Net of Dividend distribution tax, if any.5. As the Scheme has completed more than 1 year but less than 3 years, the performance details of only since inception and 1 year are provided herein.6. Past performance may or may not be sustained in future and the same may not necessarily provide the basis for comparison with other investment.7. Load is not considered for computation of returns.8. In case, the start/end date of the concerned period is a nonbusiness date (NBD), the NAV of the previous date is considered for computation of returns. The NAV per unit shown in the table is as on the start date of the said period
Scheme
Nifty 50 Index (Additional Benchmark)
NAV (Rs.) Per Unit (as on April 28,2017 : 13.16)
CAGR (%)
10.00
S&P BSE 500 Index (Benchmark)
Since inception
CurrentValue of
Investment of Rs. 10000
CAGR (%) Current Value of
Investment of Rs. 10000
1 Year 3 Year 5 Year
CAGR (%) Current Value of
Investment of Rs. 10000
CAGR (%) Current Value of
Investment of Rs. 10000
9.86 - -
Particulars
33.57 13346.86 - - - - 17.89 13160.00
24.80 12472.70 - - - - 13.10 12279.76
18.58 11852.59 - - - - 9.46 11627.23

51
Fund Managers** :
Manish Gunwani(Managing this fund since Feb, 2016 &Overall 20 years of experience)Rajat Chandak(Managing this fund since Feb, 2016 &Overall 8 years of experience)
Indicative Investment Horizon : ~3 Years
Inception/Allotment date: 25-Feb-16
NAV (As on 28-Apr-17):IPIRF4 Growth Option : 13.99IPIRF4 Dividend Option : 13.15IPIRF4 Direct Plan Growth Option : 14.22IPIRF4 Direct Plan Dividend Option : 13.38
Options :Cumulative & Dividend payout option
Application Amount for freshSubscription :Not available
Min.Addl.Investment :Not available
Exit load for Redemption / Switch out :- Lumpsum Investment OptionNil
SIP :Not Available
SWP :Not Available
Min.Redemption Amt. :
Style Box
Monthly AAUM as on 30-Apr-17 : Rs. 37.91 crores
Closing AUM as on 30-Apr-17 : Rs. 37.74 crores
ICICI Prudential India Recovery Fund - Series 4A Close ended equity scheme
Entry load : Nil
RiskometerThis Product is suitable for investors who are seeking*:
• Long term wealth creation solution
• A close ended equity fund that aims to provide capital appreciation by investing in equity and equity related securities that are likely to benefit from recovery in the Indian economy.
*Investors should consult their financial advisers if in doubt about whether the product is suitable for them.
No redemption/repurchase of units shall be allowed prior to the maturity of the Scheme. Investors wishing to exit may do so, only in demat mode, by selling through BSE Limited or any of the stock exchange(s) where units of the Scheme will be listed as the Trustee may decide from time to time.
Benchmark
S&P BSE 500 Index
Note : - “Portfolio Beta, Standard Deviation, R Squared, Sharpe Ratio and Tracking Error of the Scheme is not computed owing to the short time frame since launch of the Scheme.”Portfolio turnover has been computed as the ratio of the lower value of purchase and sales, to the average net assets in the past one year (since inception for schemes that have not completed a year). The figures are not netted for derivative transactions.**In addition to the fund manager managing this fund, the ADR/GDR exposure is managed by Mr. Ihab Dalwai.@@ Total Expense Ratio is weighted average for the month. Ratio excludes service tax on management fees and includes B-15 clawback reversal, if any.
Auto 11.78%
• Maruti Suzuki India Ltd. 7.29%
• TVS Motor Company Ltd. 4.49%
Auto Ancillaries 6.82%
• Motherson Sumi Systems Ltd. 6.82%
Banks 33.88%
• HDFC Bank Ltd. 9.44%
• ICICI Bank Ltd. 5.82%
• State Bank Of India 5.44%
Axis Bank Ltd. 4.05%
Yes Bank Ltd. 3.93%
Kotak Mahindra Bank Ltd. 3.20%
IndusInd Bank Ltd. 1.99%
Cement 2.13%
Ultratech Cement Ltd. 2.13%
Consumer Non Durables 13.26%
• Britannia Industries Ltd. 8.26%
• Hindustan Unilever Ltd. 5.00%
Pharmaceuticals 8.43%
Sun Pharmaceutical Industries Ltd. 4.31%
Cipla Ltd. 4.12%
Retailing 2.85%
Avenue Supermarts Ltd. 2.85%
Software 5.95%
• HCL Technologies Ltd. 5.95%
Textile Products 6.52%
• Page Industries Ltd. 6.52%
Transportation 6.39%
Interglobe Aviation Ltd. 3.49%
Container Corporation Of India Ltd. 2.90%
Short Term Debt and net current assets 1.99%
Total Net Assets 100.00%
Quantitative Indicators Average P/E : 30.25 Average P/BV : 10.63 Average Dividend Yield : 0.96
Annual Portfolio Turnover Ratio : Equity - 0.90 times, Others (Debt and Derivatives) - 0.01 times Combined Annual Portfolio Turnover Ratio : 0.91 times
• Top Ten Holdings
Dividend History : Refer page no. from 122 to 130
SIP Returns : Refer page no. from 118 to 120
Total Expense Ratio @@ :
IPIRF4 : 2.50% p. a.
IPIRF4 Direct Plan : 1.23% p. a.
Investment Objective : Refer page no. from 131 to 134
Notes:1. Different plans shall have different expense structure. The performance details provided herein are of ICICI Prudential India Recovery Fund - Series 4.2. The scheme is currently managed by Manish Gunwani and Rajat Chandak. Mr. Manish Gunwani has been managing this fund since Feb 2016. Total Schemes managed by the Fund Manager Refer annexure from page no. 91 for performance of other schemes currently managed by Manish is 12 (11 are jointly managed).Gunwani.Mr. Rajat Chandak has been managing this fund since Feb 2016 . Total Schemes managed by the Fund Manager is 9 (5 are jointly managed). Refer annexure from page no. 91 for performance of other schemes currently managed by Rajat Chandak.3. Date of inception: 25-Feb-16.4. Performance of dividend option would be Net of Dividend distribution tax, if any.5. As the Scheme has completed more than 1 year but less than 3 years, the performance details of only since inception and 1 year are provided herein.6. Past performance may or may not be sustained in future and the same may not necessarily provide the basis for comparison with other investment.7. Load is not considered for computation of returns.8. In case, the start/end date of the concerned period is a nonbusiness date (NBD), the NAV of the previous date is considered for computation of returns. The NAV per unit shown in the table is as on the start date of the said period
Scheme
Nifty 50 Index (Additional Benchmark)
NAV (Rs.) Per Unit (as on April 28,2017 : 13.99)
CAGR (%)
10.00
S&P BSE 500 Index (Benchmark)
Since inception
CurrentValue of
Investment of Rs. 10000
CAGR (%) Current Value of
Investment of Rs. 10000
1 Year 3 Year 5 Year
CAGR (%) Current Value of
Investment of Rs. 10000
CAGR (%) Current Value of
Investment of Rs. 10000
11.10 - -
Particulars
26.12 12603.60 - - - - 33.15 13990.00
24.80 12472.70 - - - - 34.26 14126.34
18.58 11852.59 - - - - 27.92 13347.56
Company/Issuer % to NAV
Portfolio as on April 30, 2017
Company/Issuer % to NAV
Returns of ICICI Prudential India Recovery Fund – Series 4 - Dividend Option as on April 30, 2017 - (IPIRF4)
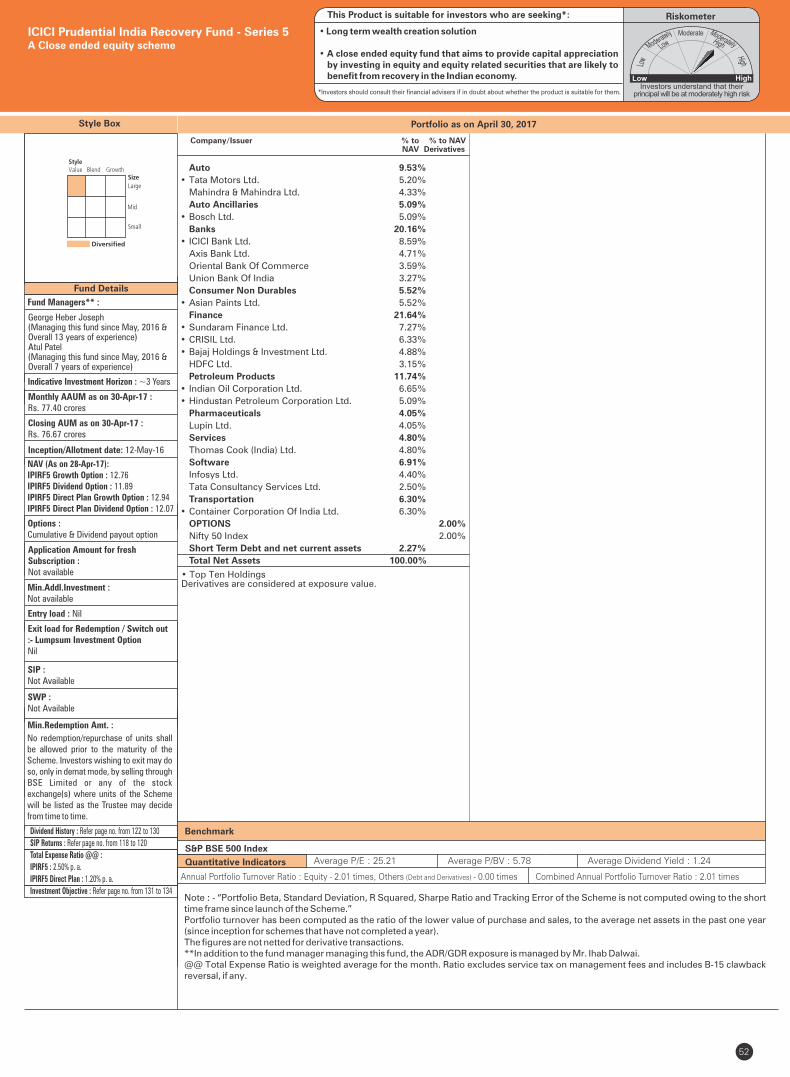
52
Fund Managers** :
George Heber Joseph(Managing this fund since May, 2016 &Overall 13 years of experience)Atul Patel(Managing this fund since May, 2016 &Overall 7 years of experience)
Indicative Investment Horizon : ~3 Years
Inception/Allotment date: 12-May-16
NAV (As on 28-Apr-17):IPIRF5 Growth Option : 12.76IPIRF5 Dividend Option : 11.89IPIRF5 Direct Plan Growth Option : 12.94IPIRF5 Direct Plan Dividend Option : 12.07
Options :Cumulative & Dividend payout option
Application Amount for freshSubscription :Not available
Min.Addl.Investment :Not available
Exit load for Redemption / Switch out :- Lumpsum Investment OptionNil
SIP :Not Available
SWP :Not Available
Min.Redemption Amt. :
Style Box Portfolio as on April 30, 2017
Monthly AAUM as on 30-Apr-17 : Rs. 77.40 crores
Closing AUM as on 30-Apr-17 : Rs. 76.67 crores
ICICI Prudential India Recovery Fund - Series 5A Close ended equity scheme
Entry load : Nil
RiskometerThis Product is suitable for investors who are seeking*:
• Long term wealth creation solution
• A close ended equity fund that aims to provide capital appreciation by investing in equity and equity related securities that are likely to benefit from recovery in the Indian economy.
*Investors should consult their financial advisers if in doubt about whether the product is suitable for them.
No redemption/repurchase of units shall be allowed prior to the maturity of the Scheme. Investors wishing to exit may do so, only in demat mode, by selling through BSE Limited or any of the stock exchange(s) where units of the Scheme will be listed as the Trustee may decide from time to time.
Benchmark
S&P BSE 500 Index
Note : - “Portfolio Beta, Standard Deviation, R Squared, Sharpe Ratio and Tracking Error of the Scheme is not computed owing to the short time frame since launch of the Scheme.”Portfolio turnover has been computed as the ratio of the lower value of purchase and sales, to the average net assets in the past one year (since inception for schemes that have not completed a year). The figures are not netted for derivative transactions.**In addition to the fund manager managing this fund, the ADR/GDR exposure is managed by Mr. Ihab Dalwai.@@ Total Expense Ratio is weighted average for the month. Ratio excludes service tax on management fees and includes B-15 clawback reversal, if any.
Quantitative Indicators Average P/E : 25.21 Average P/BV : 5.78 Average Dividend Yield : 1.24
• Top Ten HoldingsDerivatives are considered at exposure value.
Auto 9.53%
• Tata Motors Ltd. 5.20%
Mahindra & Mahindra Ltd. 4.33%
Auto Ancillaries 5.09%
• Bosch Ltd. 5.09%
Banks 20.16%
• ICICI Bank Ltd. 8.59%
Axis Bank Ltd. 4.71%
Oriental Bank Of Commerce 3.59%
Union Bank Of India 3.27%
Consumer Non Durables 5.52%
• Asian Paints Ltd. 5.52%
Finance 21.64%
• Sundaram Finance Ltd. 7.27%
• CRISIL Ltd. 6.33%
• Bajaj Holdings & Investment Ltd. 4.88%
HDFC Ltd. 3.15%
Petroleum Products 11.74%
• Indian Oil Corporation Ltd. 6.65%
• Hindustan Petroleum Corporation Ltd. 5.09%
Pharmaceuticals 4.05%
Lupin Ltd. 4.05%
Services 4.80%
Thomas Cook (India) Ltd. 4.80%
Software 6.91%
Infosys Ltd. 4.40%
Tata Consultancy Services Ltd. 2.50%
Transportation 6.30%
• Container Corporation Of India Ltd. 6.30%
OPTIONS 2.00%
Nifty 50 Index 2.00%
Short Term Debt and net current assets 2.27%
Total Net Assets 100.00%
Company/Issuer % to % to NAV NAV Derivatives
Annual Portfolio Turnover Ratio : Equity - 2.01 times, Others (Debt and Derivatives) - 0.00 times Combined Annual Portfolio Turnover Ratio : 2.01 times
Dividend History : Refer page no. from 122 to 130
SIP Returns : Refer page no. from 118 to 120
Total Expense Ratio @@ :
IPIRF5 : 2.50% p. a.
IPIRF5 Direct Plan : 1.20% p. a.
Investment Objective : Refer page no. from 131 to 134

53
Fund Managers** :
Sankaran Naren(Managing this fund since Mar, 2015 &Overall 26 years of experience)Atul Patel(Managing this fund since Mar, 2015 &Overall 7 years of experience)
Indicative Investment Horizon : ~3 Years
Inception/Allotment date: 22-Jun-16
NAV (As on 28-Apr-17):IPIRF7 Dividend Option : 11.30IPIRF7 Direct Plan Dividend Option : 11.46
Options :Cumulative & Dividend payout option
Application Amount for freshSubscription :Not available
Min.Addl.Investment :Not available
Exit load for Redemption / Switch out :- Lumpsum Investment OptionNil
SIP :Not Available
SWP :Not Available
Min.Redemption Amt. :
Style Box Portfolio as on April 30, 2017
Monthly AAUM as on 30-Apr-17 : Rs. 49.31 crores
Closing AUM as on 30-Apr-17 : Rs. 47.33 crores
ICICI Prudential India Recovery Fund - Series 7A Close ended equity scheme
Entry load : Nil
RiskometerThis Product is suitable for investors who are seeking*:
• Long term wealth creation solution
• A close ended equity fund that aims to provide capital appreciation by investing in equity and equity related securities that are likely to benefit from recovery in the Indian economy.
*Investors should consult their financial advisers if in doubt about whether the product is suitable for them.
No redemption/repurchase of units shall be allowed prior to the maturity of the Scheme. Investors wishing to exit may do so, only in demat mode, by selling through BSE Limited or any of the stock exchange(s) where units of the Scheme will be listed as the Trustee may decide from time to time.
Benchmark
S&P BSE 500 Index
Note : - “Portfolio Beta, Standard Deviation, R Squared, Sharpe Ratio and Tracking Error of the Scheme is not computed owing to the short time frame since launch of the Scheme.”Portfolio turnover has been computed as the ratio of the lower value of purchase and sales, to the average net assets in the past one year (since inception for schemes that have not completed a year). The figures are not netted for derivative transactions.**In addition to the fund manager managing this fund, the ADR/GDR exposure is managed by Mr. Ihab Dalwai.@@ Total Expense Ratio is weighted average for the month. Ratio excludes service tax on management fees and includes B-15 clawback reversal, if any.
Quantitative Indicators Average P/E : 16.51 Average P/BV : 3.66 Average Dividend Yield : 1.47
• Top Ten Holdings
Annual Portfolio Turnover Ratio : Equity - 0.44 times, Others (Debt and Derivatives) - 0.00 times Combined Annual Portfolio Turnover Ratio : 0.44 times
Dividend History : Refer page no. from 122 to 130
SIP Returns : Refer page no. from 118 to 120
Total Expense Ratio @@ :
IPIRF7 : 2.50% p. a.
IPIRF7 Direct Plan : 1.28% p. a.
Investment Objective : Refer page no. from 131 to 134
Company/Issuer % to NAV
Auto 2.75%
Maruti Suzuki India Ltd. 2.75%
Banks 21.23%
• HDFC Bank Ltd. 8.58%
• ICICI Bank Ltd. 8.24%
• State Bank Of India 4.41%
Cement 5.16%
• JK Lakshmi Cement Ltd. 5.16%
Chemicals 6.24%
• Tata Chemicals Ltd. 6.24%
Construction 6.67%
• KNR Constructions Ltd. 6.67%
Construction Project 4.88%
• Larsen & Toubro Ltd. 4.88%
Consumer Non Durables 1.95%
Glaxosmithkline Consumer Healthcare Ltd. 1.95%
Ferrous Metals 4.27%
• Tata Steel Ltd. 4.27%
Minerals/Mining 3.71%
Coal India Ltd. 3.71%
Petroleum Products 2.83%
Indian Oil Corporation Ltd. 2.83%
Pharmaceuticals 10.50%
• Cipla Ltd. 5.18%
Sun Pharmaceutical Industries Ltd. 3.72%
Divi's Laboratories Ltd. 1.60%
Power 5.33%
• Power Grid Corporation Of India Ltd. 5.33%
Services 3.25%
Thomas Cook (India) Ltd. 3.25%
Software 7.26%
HCL Technologies Ltd. 3.96%
Infosys Ltd. 3.30%
Telecom - Services 3.23%
Bharti Airtel Ltd. 3.23%
Short Term Debt and net current assets 10.75%
Total Net Assets 100.00%

Style Box
Note : - “Portfolio Beta, Standard Deviation, R Squared, Sharpe Ratio and Tracking Error of the Scheme is not computed owing to the short time frame since launch of the Scheme.”Portfolio turnover has been computed as the ratio of the lower value of purchase and sales, to the average net assets in the past one year (since inception for schemes that have not completed a year). The figures are not netted for derivative transactions.**In addition to the fund manager managing this fund, the ADR/GDR exposure is managed by Mr. Ihab Dalwai.@@ Total Expense Ratio is weighted average for the month. Ratio excludes service tax on management fees and includes B-15 clawback reversal, if any.
Fund Managers** :
Mrinal Singh(Managing this fund since Oct, 2015 &Overall 14 years of experience)Mittul Kalawadia(Managing this fund since Apr, 2016 &Overall 10 years of experience)
Indicative Investment Horizon : 1281 Days
Inception/Allotment date: 07-Oct-15
SWP :Not Available
Min.Redemption Amt. :No redemption/repurchase of units shall be allowed prior to the maturity of the Scheme. Investors wishing to exit may do so, only in demat mode, by selling through BSE Limited or any of the stock exchange(s) where units of the Scheme will be listed as the Trustee may decide from time to time.
SIP :Not Available
NAV (As on 28-Apr-17):IPBCF1 Growth Option : 12.27IPBCF1 Dividend Option : 12.27IPBCF1 Direct Plan Growth Option : 12.53IPBCF1 Direct Plan Dividend Option : 12.53
Options :Cumulative & Dividend payout option
Application Amount for freshSubscription :Not available
Min.Addl.Investment :Not available
Exit load for Redemption / Switchout :- Lumpsum Investment OptionNil
54
Fund Details
Diversified
Quantitative Indicators
Benchmark
Average P/E : 24.00 Average P/BV : 4.87 Average Dividend Yield : 0.93
S&P BSE 500 Index
ICICI Prudential Business Cycle Fund - Series 1A Close ended equity scheme
Entry load : Nil
RiskometerThis Product is suitable for investors who are seeking*:
• Long term wealth creation solution
• A close ended equity fund that aims to provide capital appreciation by investing in equity and equity related securities with focus on riding business cycles through dynamic allocation between various sectors and stocks.
*Investors should consult their financial advisers if in doubt about whether the product is suitable for them.
Monthly AAUM as on 30-Apr-17 : Rs. 322.40 crores
Closing AUM as on 30-Apr-17 : Rs. 313.80 crores
Annual Portfolio Turnover Ratio : Equity - 0.77 times, Others (Debt and Derivatives) - 0.22 times Combined Annual Portfolio Turnover Ratio : 0.99 times
• Top Ten HoldingsDerivatives are considered at exposure value.
Auto 0.75% 3.14% TVS Motor Company Ltd. 0.75% TVS Motor Company Ltd. - Futures 3.14% Auto Ancillaries 4.82% • Motherson Sumi Systems Ltd. 4.82% Banks 15.49% 2.13%• HDFC Bank Ltd. 5.66% • State Bank Of India 4.96% • ICICI Bank Ltd. 4.87% ICICI Bank Ltd. - Futures 2.13% Cement 9.14% JK Lakshmi Cement Ltd. 3.54% Orient Cement Ltd. 3.46% Sagar Cements Ltd. 2.14% Chemicals 1.04% Deepak Nitrite Ltd. 1.04% Construction Project 15.38% • Larsen & Toubro Ltd. 7.82% • Ashoka Buildcon Ltd. 4.04% Engineers India Ltd. 3.51% Consumer Durables 2.47% Bata India Ltd. 2.47% Consumer Non Durables 2.90% Jubilant Foodworks Ltd. 2.90% Ferrous Metals 0.22% Tata Metaliks Ltd. 0.22% Industrial Capital Goods 5.75% TD Power Systems Ltd. 2.52% Bharat Electronics Ltd. 2.22% Triveni Turbine Ltd. 1.00% Industrial Products 4.28% • FAG Bearings India Ltd. 4.28% Petroleum Products 2.04% Castrol India Ltd. 2.04% Pharmaceuticals 5.64% • Sun Pharmaceutical Industries Ltd. 3.64%
Dividend History : Refer page no. from 122 to 130
SIP Returns : Refer page no. from 118 to 120
Total Expense Ratio @@ :
IPBCF1 : 2.33% p. a.
IPBCF1 Direct Plan : 1.08% p. a.
Investment Objective : Refer page no. from 131 to 134
Portfolio as on April 30, 2017
Returns of ICICI Prudential Business Cycle Fund - Series 1 - Dividend Option as on April 30, 2017 - ( )IPBCF1
Unichem Laboratories Ltd. 1.99% Power 4.53% • CESC Ltd. 4.53% Retailing 3.56% • Avenue Supermarts Ltd. 3.56% Services 3.25% Thomas Cook (India) Ltd. 3.25% Transportation 4.41% Gujarat Pipavav Port Ltd. 2.83% VRL Logistics Ltd. 1.59% Short Term Debt and net current assets 9.06% Total Net Assets 100.00%
Notes:1. Different plans shall have different expense structure. The performance details provided herein are of ICICI Prudential Business Cycle Fund - Series 1.2. The scheme is currently managed by Mrinal Singh and Mittul Kalawadia. Mr. Mrinal Singh has been managing this fund since Oct 2015. Total Schemes managed by the Fund Manager . Refer annexure from page no. 91 for performance of other schemes is 15 (14 are jointly managed [Excludes FoF Schemes])currently managed by Mrinal Singh.Mr. Mittul Kalawadia has been managing this fund since Apr 2016 . Total Schemes managed by the Fund Manager Refer annexure from is 8 (8 are jointly managed).page no. 91 for performance of other schemes currently managed by Mittul Kalawadia.3. Date of inception: 07-Oct-15.4. Performance of dividend option would be Net of Dividend distribution tax, if any.5. As the Scheme has completed more than 1 year but less than 3 years, the performance details of only since inception and 1 year are provided herein.6. Past performance may or may not be sustained in future and the same may not necessarily provide the basis for comparison with other investment.7. Load is not considered for computation of returns.8. In case, the start/end date of the concerned period is a nonbusiness date (NBD), the NAV of the previous date is considered for computation of returns. The NAV per unit shown in the table is as on the start date of the said period
Scheme
Nifty 50 Index (Additional Benchmark)
NAV (Rs.) Per Unit (as on April 28,2017 : 12.27)
CAGR (%)
10.00
S&P BSE 500 Index (Benchmark)
Since inception
CurrentValue of
Investment of Rs. 10000
CAGR (%) Current Value of
Investment of Rs. 10000
1 Year 3 Year 5 Year
CAGR (%) Current Value of
Investment of Rs. 10000
CAGR (%) Current Value of
Investment of Rs. 10000
9.74 - -
Particulars
26.06 12597.54 - - - - 14.02 12270.00
24.80 12472.70 - - - - 12.49 12014.64
18.58 11852.59 - - - - 8.63 11377.76
Company/Issuer % to % to NAV NAV Derivatives
Company/Issuer % to % to NAV NAV Derivatives
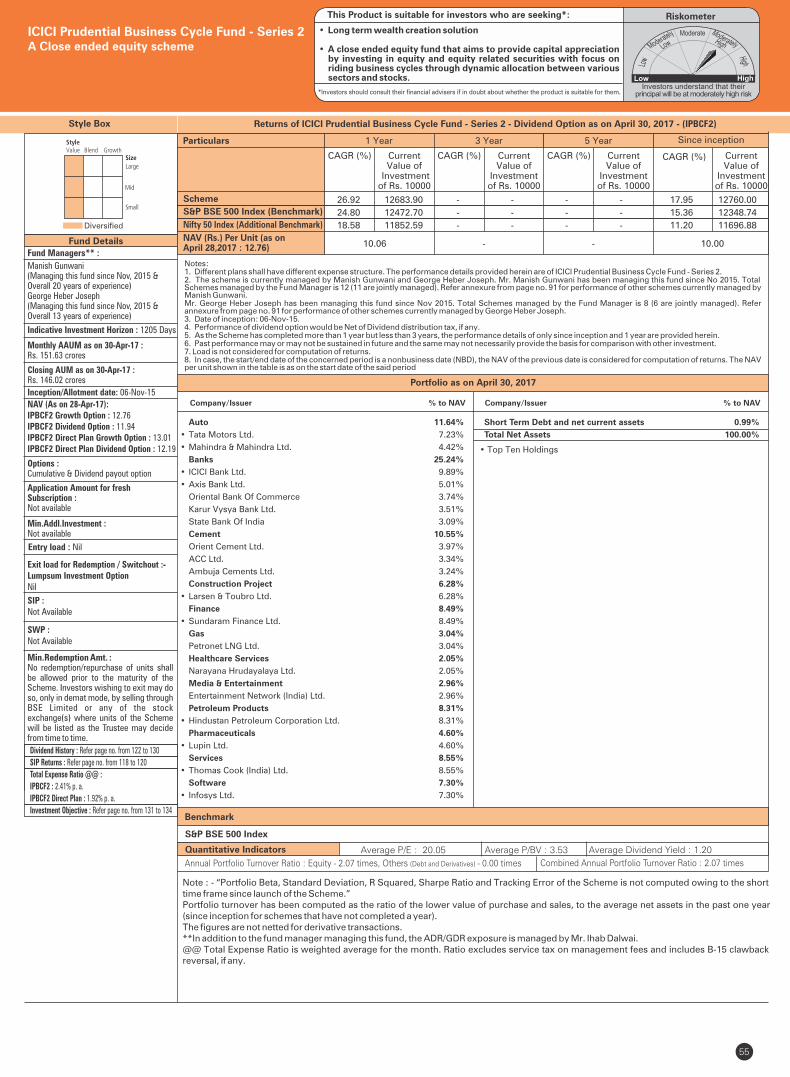
Style Box
Note : - “Portfolio Beta, Standard Deviation, R Squared, Sharpe Ratio and Tracking Error of the Scheme is not computed owing to the short time frame since launch of the Scheme.”Portfolio turnover has been computed as the ratio of the lower value of purchase and sales, to the average net assets in the past one year (since inception for schemes that have not completed a year). The figures are not netted for derivative transactions.**In addition to the fund manager managing this fund, the ADR/GDR exposure is managed by Mr. Ihab Dalwai.@@ Total Expense Ratio is weighted average for the month. Ratio excludes service tax on management fees and includes B-15 clawback reversal, if any.
Fund Managers** :
Manish Gunwani(Managing this fund since Nov, 2015 &Overall 20 years of experience)George Heber Joseph(Managing this fund since Nov, 2015 &Overall 13 years of experience)
Indicative Investment Horizon : 1205 Days
Inception/Allotment date: 06-Nov-15
SWP :Not Available
Min.Redemption Amt. :No redemption/repurchase of units shall be allowed prior to the maturity of the Scheme. Investors wishing to exit may do so, only in demat mode, by selling through BSE Limited or any of the stock exchange(s) where units of the Scheme will be listed as the Trustee may decide from time to time.
SIP :Not Available
NAV (As on 28-Apr-17):IPBCF2 Growth Option : 12.76IPBCF2 Dividend Option : 11.94IPBCF2 Direct Plan Growth Option : 13.01IPBCF2 Direct Plan Dividend Option : 12.19
Options :Cumulative & Dividend payout option
Application Amount for freshSubscription :Not available
Min.Addl.Investment :Not available
Exit load for Redemption / Switchout :- Lumpsum Investment OptionNil
55
Fund Details
Diversified
Quantitative Indicators
Benchmark
Average P/E : 20.05 Average P/BV : 3.53 Average Dividend Yield : 1.20
S&P BSE 500 Index
ICICI Prudential Business Cycle Fund - Series 2A Close ended equity scheme
RiskometerThis Product is suitable for investors who are seeking*:
• Long term wealth creation solution
• A close ended equity fund that aims to provide capital appreciation by investing in equity and equity related securities with focus on riding business cycles through dynamic allocation between various sectors and stocks.
*Investors should consult their financial advisers if in doubt about whether the product is suitable for them.
Monthly AAUM as on 30-Apr-17 : Rs. 151.63 crores
Closing AUM as on 30-Apr-17 : Rs. 146.02 crores
Company/Issuer % to NAV
Auto 11.64%
• Tata Motors Ltd. 7.23%
• Mahindra & Mahindra Ltd. 4.42%
Banks 25.24%
• ICICI Bank Ltd. 9.89%
• Axis Bank Ltd. 5.01%
Oriental Bank Of Commerce 3.74%
Karur Vysya Bank Ltd. 3.51%
State Bank Of India 3.09%
Cement 10.55%
Orient Cement Ltd. 3.97%
ACC Ltd. 3.34%
Ambuja Cements Ltd. 3.24%
Construction Project 6.28%
• Larsen & Toubro Ltd. 6.28%
Finance 8.49%
• Sundaram Finance Ltd. 8.49%
Gas 3.04%
Petronet LNG Ltd. 3.04%
Healthcare Services 2.05%
Narayana Hrudayalaya Ltd. 2.05%
Media & Entertainment 2.96%
Entertainment Network (India) Ltd. 2.96%
Petroleum Products 8.31%
• Hindustan Petroleum Corporation Ltd. 8.31%
Pharmaceuticals 4.60%
• Lupin Ltd. 4.60%
Services 8.55%
• Thomas Cook (India) Ltd. 8.55%
Software 7.30%
• Infosys Ltd. 7.30%
• Top Ten Holdings
Entry load : Nil
Annual Portfolio Turnover Ratio : Equity - 2.07 times, Others (Debt and Derivatives) - 0.00 times Combined Annual Portfolio Turnover Ratio : 2.07 times
Dividend History : Refer page no. from 122 to 130
SIP Returns : Refer page no. from 118 to 120
Total Expense Ratio @@ :
IPBCF2 : 2.41% p. a.
IPBCF2 Direct Plan : 1.92% p. a.
Investment Objective : Refer page no. from 131 to 134
Portfolio as on April 30, 2017
Returns of ICICI Prudential Business Cycle Fund - Series 2 - Dividend Option as on April 30, 2017 - ( 2)IPBCF
Short Term Debt and net current assets 0.99%
Total Net Assets 100.00%
Company/Issuer % to NAV
Notes:1. Different plans shall have different expense structure. The performance details provided herein are of ICICI Prudential Business Cycle Fund - Series 2.2. The scheme is currently managed by Manish Gunwani and George Heber Joseph. Mr. Manish Gunwani has been managing this fund since No 2015. Total Schemes managed by the Fund Manager Refer annexure from page no. 91 for performance of other schemes currently managed by is 12 (11 are jointly managed).Manish Gunwani.Mr. George Heber Joseph has been managing this fund since Nov 2015. Total Schemes managed by the Fund Manager Refer is 8 (6 are jointly managed).annexure from page no. 91 for performance of other schemes currently managed by George Heber Joseph.3. Date of inception: 06-Nov-15.4. Performance of dividend option would be Net of Dividend distribution tax, if any.5. As the Scheme has completed more than 1 year but less than 3 years, the performance details of only since inception and 1 year are provided herein.6. Past performance may or may not be sustained in future and the same may not necessarily provide the basis for comparison with other investment.7. Load is not considered for computation of returns.8. In case, the start/end date of the concerned period is a nonbusiness date (NBD), the NAV of the previous date is considered for computation of returns. The NAV per unit shown in the table is as on the start date of the said period
Scheme
Nifty 50 Index (Additional Benchmark)
NAV (Rs.) Per Unit (as on April 28,2017 : 12.76)
CAGR (%)
10.00
S&P BSE 500 Index (Benchmark)
Since inception
CurrentValue of
Investment of Rs. 10000
CAGR (%) Current Value of
Investment of Rs. 10000
1 Year 3 Year 5 Year
CAGR (%) Current Value of
Investment of Rs. 10000
CAGR (%) Current Value of
Investment of Rs. 10000
10.06 - -
Particulars
26.92 12683.90 - - - - 17.95 12760.00
24.80 12472.70 - - - - 15.36 12348.74
18.58 11852.59 - - - - 11.20 11696.88

56
Fund Managers** :
Sankaran Naren(Managing this fund since Jan, 2016 &Overall 26 years of experience)Mittul Kalawadia(Managing this fund since Jan, 2016 &Overall 10 years of experience)
Indicative Investment Horizon : ~3 Years
Inception/Allotment date: 28-Jan-16
NAV (As on 28-Apr-17):IPBCF3 Growth Option : 15.19IPBCF3 Dividend Option : 14.27IPBCF3 Direct Plan Growth Option : 15.47IPBCF3 Direct Plan Dividend Option : 14.55
Options :Cumulative & Dividend payout option
Application Amount for freshSubscription :Not available
Min.Addl.Investment :Not available
Exit load for Redemption / Switch out :- Lumpsum Investment OptionNil
SIP :Not Available
SWP :Not Available
Min.Redemption Amt. :
Style Box Returns of ICICI Prudential Business Cycle Fund - Series 3 - Dividend Option as on April 30, 2017 - ( 3)IPBCF
Monthly AAUM as on 30-Apr-17 : Rs. 18.33 crores
Closing AUM as on 30-Apr-17 : Rs. 18.37 crores
ICICI Prudential Business Cycle Fund - Series 3A Close ended equity scheme
Entry load : Nil
RiskometerThis Product is suitable for investors who are seeking*:
• Long term wealth creation solution
• A close ended equity fund that aims to provide capital appreciation by investing in equity and equity related securities with focus on riding business cycles through dynamic allocation between various sectors and stocks.
*Investors should consult their financial advisers if in doubt about whether the product is suitable for them.
No redemption/repurchase of units shall be allowed prior to the maturity of the Scheme. Investors wishing to exit may do so, only in demat mode, by selling through BSE Limited or any of the stock exchange(s) where units of the Scheme will be listed as the Trustee may decide from time to time.
Benchmark
S&P BSE 500 Index
Note : - “Portfolio Beta, Standard Deviation, R Squared, Sharpe Ratio and Tracking Error of the Scheme is not computed owing to the short time frame since launch of the Scheme.”Portfolio turnover has been computed as the ratio of the lower value of purchase and sales, to the average net assets in the past one year (since inception for schemes that have not completed a year). The figures are not netted for derivative transactions.**In addition to the fund manager managing this fund, the ADR/GDR exposure is managed by Mr. Ihab Dalwai.@@ Total Expense Ratio is weighted average for the month. Ratio excludes service tax on management fees and includes B-15 clawback reversal, if any.
Cement 7.69%
• JK Lakshmi Cement Ltd. 4.13%
Prism Cement Ltd. 3.55%
Chemicals 4.37%
Rain Industries Ltd. 2.49%
Atul Ltd. 1.88%
Construction Project 3.85%
Engineers India Ltd. 3.85%
Ferrous Metals 3.43%
Tata Steel Ltd. 3.09%
Tata Metaliks Ltd. 0.34%
Gas 11.66%
• GAIL (India) Ltd. 6.57%
• Petronet LNG Ltd. 5.09%
Industrial Capital Goods 7.54%
• Bharat Electronics Ltd. 5.67%
Triveni Turbine Ltd. 1.87%
Minerals/Mining 4.63%
Coal India Ltd. 3.21%
Gujarat Mineral Development Corporation Ltd. 1.42%
Non - Ferrous Metals 0.83%
Hindustan Zinc Ltd. 0.83%
Petroleum Products 7.86%
• Indian Oil Corporation Ltd. 5.79%
Castrol India Ltd. 2.07%
Pharmaceuticals 4.25%
• Cipla Ltd. 4.25%
Power 22.19%
• Power Grid Corporation Of India Ltd. 7.36%
• NTPC Ltd. 5.08%
• CESC Ltd. 4.88%
Quantitative Indicators Average P/E : 20.48 Average P/BV : 4.07 Average Dividend Yield : 1.74
Annual Portfolio Turnover Ratio : Equity - 0.88 times, Others (Debt and Derivatives) - 0.32 times Combined Annual Portfolio Turnover Ratio : 1.20 times
• Top Ten Holdings
Dividend History : Refer page no. from 122 to 130
SIP Returns : Refer page no. from 118 to 120
Total Expense Ratio @@ :
IPBCF3 : 2.50% p. a.
IPBCF3 Direct Plan : 1.30% p. a.
Investment Objective : Refer page no. from 131 to 134
• Tata Power Company Ltd. 4.87%
Retailing 0.17%
Avenue Supermarts Ltd. 0.17%
Software 3.50%
HCL Technologies Ltd. 3.50%
Textile Products 3.59%
SRF Ltd. 1.99%
Mayur Uniquoters Ltd. 1.60%
Transportation 2.72%
The Great Eastern Shipping Company Ltd. 2.72%
Short Term Debt and net current assets 11.72%
Total Net Assets 100.00%
Company/Issuer % to NAV
Portfolio as on April 30, 2017
Company/Issuer % to NAV
Notes:1. Different plans shall have different expense structure. The performance details provided herein are of ICICI Prudential Business Cycle Fund - Series 3.2. The scheme is currently managed by Sankaran Naren and Mittul Kalawadia. Mr. Sankaran Naren has been managing this fund since Jan 2016. Total Schemes managed by the Fund Manager is 14 (14 are jointly managed). Refer annexure from page no. 91 for performance of other schemes currently managed by Sankaran Naren.Mr. Mittul Kalawadia has been managing this fund since Jan 2016 . Total Schemes managed by the Fund Manager is 8 (8 are jointly managed). Refer annexure from page no. 91 for performance of other schemes currently managed by Mittul Kalawadia.3. Date of inception: 28-Jan-16.4. Performance of dividend option would be Net of Dividend distribution tax, if any.5. As the Scheme has completed more than 1 year but less than 3 years, the performance details of only since inception and 1 year are provided herein.6. Past performance may or may not be sustained in future and the same may not necessarily provide the basis for comparison with other investment.7. Load is not considered for computation of returns.8. In case, the start/end date of the concerned period is a nonbusiness date (NBD), the NAV of the previous date is considered for computation of returns. The NAV per unit shown in the table is as on the start date of the said period
Scheme
Nifty 50 Index (Additional Benchmark)
NAV (Rs.) Per Unit (as on April 28,2017 : 15.19)
CAGR (%)
10.00
S&P BSE 500 Index (Benchmark)
Since inception
CurrentValue of
Investment of Rs. 10000
CAGR (%) Current Value of
Investment of Rs. 10000
1 Year 3 Year 5 Year
CAGR (%) Current Value of
Investment of Rs. 10000
CAGR (%) Current Value of
Investment of Rs. 10000
11.02 - -
Particulars
37.96 13784.03 - - - - 39.74 15190.00
24.80 12472.70 - - - - 24.66 13170.17
18.58 11852.59 - - - - 19.80 12531.30

57
�
Quantitative Indicators:
Fund Details
Company/Issuer % to NAV
Fund Managers** :
Manish Gunwani(Managing this fund from Jan 2012 &Overall 20 years of experience)
Rajat Chandak(Managing this fund from Apr 2014 &Overall 8 years of experience)
Indicative Investment Horizon:5 years and above
Inception/Allotment date: 26-Sep-09
Monthly AAUM as on 30-Apr-17 : Rs. 52.16 crores
Closing AUM as on 30-Apr-17 : Rs. 52.53 crores
NAV (As on 28-Apr-17):IPRIGHT Growth Option : 35.70IPRIGHT Dividend Option : 25.10
Std Dev (Annualised) : 14.65% Sharpe Ratio : 1.02
Average P/E : 34.63 Average P/BV : 8.45 Average Dividend Yield: 0.75
Portfolio Beta : 0.93 R squared : 0.77
Portfolio turnover has been computed as the ratio of the lower value of purchase and sales, to the average net assets in the past one year (since inception for schemes that have not completed a year). The figures are not netted for derivative transactions.Risk-free rate based on the last Overnight MIBOR cut-off of 6.18%.**In addition to the fund manager managing this fund, the ADR/GDR exposure is managed by Mr. Ihab Dalwai.@@ Total Expense Ratio is weighted average for the month. Ratio excludes service tax on management fees and includes B-15 clawback reversal, if any.
Style Box
• Top Ten Holdings
Portfolio as on April 30, 2017
Returns of ICICI Prudential R.I.G.H.T Fund - Growth Option as on April 30, 2017 - (IPRIGHT)
Auto 9.38%
• Maruti Suzuki India Ltd. 6.51%
Tata Motors Ltd. 2.87%
Auto Ancillaries 11.10%
• Motherson Sumi Systems Ltd. 11.10%
Banks 27.03%
• HDFC Bank Ltd. 9.42%
• ICICI Bank Ltd. 6.02%
• State Bank Of India 5.16%
City Union Bank Ltd. 3.34%
Axis Bank Ltd. 3.09%
Cement 4.61%
• Shree Cements Ltd. 4.61%
Construction Project 2.23%
Larsen & Toubro Ltd. 2.23%
Consumer Non Durables 8.43%
• Britannia Industries Ltd. 6.43%
Bajaj Corp Ltd. 2.00%
Industrial Products 3.89%
Astral Poly Technik Ltd. 3.89%
Pharmaceuticals 16.22%
• Cipla Ltd. 4.76%
• Natco Pharma Ltd. 4.67%
Sun Pharmaceutical Industries Ltd. 4.45%
Lupin Ltd. 2.34%
Services 4.80%
• Thomas Cook (India) Ltd. 4.80%
Software 1.71%
Tech Mahindra Ltd. 1.71%
Textile Products 4.16%
Page Industries Ltd. 4.16%
Short Term Debt and net current assets 6.43%
Total Net Assets 100.00%
ICICI Prudential R.I.G.H.T(Rewards of investing & generation of healthy tax savings) FundA Closed Ended Equity Linked Savings Scheme
Benchmark Std Dev (Annualised) : 13.79%
RiskometerThis Product is suitable for investors who are seeking*:
• Long term wealth creation solution
• A Closed Ended equity linked savings scheme (ELSS)
*Investors should consult their financial advisers if in doubt about whether the product is suitable for them.
Annual Portfolio Turnover Ratio : Equity - 0.31 times, Others (Debt and Derivatives) - 0.00 times Combined Annual Portfolio Turnover Ratio : 0.31 times
Dividend History : Refer page no. from 122 to 130
SIP Returns : Refer page no. from 118 to 120
Total Expense Ratio @@ :
IPRIGHT : 2.55% p. a.
Investment Objective : Refer page no. from 131 to 134
Notes:1. Different plans shall have different expense structure. The performance details provided herein are of ICICI Prudential R.I.G.H.T.2. The scheme is currently managed . Mr. has been managing this fund since . Total Schemes Manish Gunwani and Rajat Chandak Manish Gunwani Jan 2012managed by the Fund Manager . Refer annexure from page no. 91 for performance of other schemes currently managed by Manish is 12 (11 are jointly managed) Gunwani.Mr. has been managing this fund since Apr 2014. Total Schemes managed by the Fund Manager . Refer annexure from Rajat Chandak is 9 (5 are jointly managed)page no. 91 for performance of other schemes currently managed by . Rajat Chandak3. Date of inception: 26-Sep-09.4. Past performance may or may not be sustained in future and the same may not necessarily provide the basis for comparison with other investment.5. Load is not considered for computation of returns.6. In case, the start/end date of the concerned period is a nonbusiness date (NBD), the NAV of the previous date is considered for computation of returns. The NAV per unit shown in the table is as on the start date of the said period
Scheme
NAV (Rs.) Per Unit (as on April 28,2017 : 35.70)
CAGR (%)
10.00
Nifty 50 Index (Benchmark)
Since inception
CurrentValue of
Investment of Rs. 10000
CAGR (%) Current Value of
Investment of Rs. 10000
1 Year 3 Year 5 Year
CAGR (%) Current Value of
Investment of Rs. 10000
CAGR (%) Current Value of
Investment of Rs. 10000
27.73 19.60 13.17
Particulars
28.83 12874.14 22.15 18214.29 22.09 27107.06 18.25 35700.00
18.58 11852.59 11.60 13894.11 12.14 17728.25 8.64 18762.14

58
Fund Details
Rating Profile (as % of debt component)
Quantitative Indicators – Equity Component
Quantitative Indicators – Debt Component
# Automatic Withdrawal Plan (AWP) feature will allow investors to redeem a fixed sum of money periodically at the prevailing Net Asset Value (NAV) depending on the option chosen by the investor. For more details of this feature, Investors are requested to visit the website of the AMC viz., www.icicipruamc.comThe existing Crisil Balanced Fund Index has been renamed to Crisil Balanced Fund- Aggressive Index' w.e.f. 4th April 2016 as per 'Crisil Indices- Annual Criteria Review-2016.Portfolio turnover has been computed as the ratio of the lower value of purchase and sales, to the average net assets in the past one year (since inception for schemes that have not completed a year). The figures are not netted for derivative transactions.Risk-free rate based on the last Overnight MIBOR cut-off of 6.18%**In addition to the fund manager managing this fund, the ADR/GDR exposure is managed by Mr. Ihab Dalwai.@@ Total Expense Ratio is weighted average for the month. Ratio excludes service tax on management fees and includes B-15 clawback reversal, if any.##
Minimum number of installments for monthly frequency will be 6 and for Quarterly frequency will be 4. w.e.f February 01, 2017.* Minimum number of installments for daily, weekly and monthly frequency will be 6 and for Quarterly frequency will be 4. w.e.f February 01, 2017. Refer page No. 137 for definition of Flex STP and Value STP.&&
Minimum number of installments for both monthly and quarterly will be 2. w.e.f February 01, 2017.*** In case the unit holder has opted for dividend payout option, the minimum amount for dividend payout shall be 100 (net of dividend distribution tax and other statutory levy , if any), else the dividend would be mandatorily reinvested.
Style Box
Fund Managers** :
Equity : Sankaran Naren(Managing this fund since Dec, 2015 &Overall 26 years of experience)Atul Patel(Managing this fund since Aug, 2016 &Overall 7 years of experience)Debt : Manish Banthia (Managing this fund since Sep, 2013 & Overall 13 years of experience)Indicative Investment Horizon:3 yrs & moreInception/Allotment date: 03-Nov-99
Monthly AAUM as on 30-Apr-17 : Rs. 9935.11 crores
Closing AUM as on 30-Apr-17 :Rs. 10813.96 crores
NAV (As on 28-Apr-17):IPBF Growth Option : 115.44IPBF Monthly Dividend Option : 24.70IPBF Direct Plan Growth Option : 120.76IPBF Direct Plan Monthly Dividend Option : 29.81
Options :Growth & Dividend (Monthly, Half Yearly & Annual)(dividend payout*** and re-investment facility available)
Application Amount for freshSubscription :Rs.5,000 (plus in multiples of Re.1)
Min.Addl.Investment :Rs.1,000 (plus in multiples of Re.1)
Exit load for Redemption / Switch#out :- Lumpsum & SIP / STP / SWP / AWP
Upto 10% of units within 1 Year from the date of allotment - Nil More than 10% of units within 1 Year from the date of allotment - 1% of applicable Net Asset Value (NAV) After 1 Year from the date of allotment - Nil w.e.f. 10th November 2016.
##SIP :Monthly Frequency: Rs. 1,000/- and in multiple of Rs. 1/-Quarterly Frequency: Rs. 5,000/- and in multiple of Rs. 1/-
&&SWP :Rs. 500/- and in multiples of Rs. 1/-
STP/ Flex STP/ Value STP * :Daily Frequency: Rs. 250/- and in multiples of Rs. 50/-Weekly, Monthly and Quarterly Frequency: Rs. 1,000/- and in multiples of Rs. 1/-
Min.Redemption Amt. :500/- or all units where amount is below 500/-
Average Maturity : 7.73 Years Modified Duration : 4.89 Years Yield To Maturity : 7.72%
Average P/E : 20.30 Average P/BV: 4.70 Average Dividend Yield : 1.44 Sharpe Ratio: 1.14
Portfolio Beta: 1.11 R squared : 0.85 Std Dev (Annualised) : 11.16%
• Top Ten HoldingsDerivatives are considered at exposure value.@Short Term < 8 Years, Long Term > 8 Years.
^ Value Less than 0.01% of NAV.
Portfolio as on April 30, 2017
Returns of ICICI Prudential Balanced Fund - Growth Option as on April 30, 2017 - (IPBF)
Diversified
Equity
Debt
Net Equity Level : 68.06%
ICICI Prudential Balanced Fund(An Open Ended Balanced Fund)
Benchmark Std Dev (Annualised) : 9.27%
Entry load : Nil
RiskometerThis Product is suitable for investors who are seeking*:
• long term wealth creation solution
• A balanced fund aiming for long term capital appreciation and current income by investing in equity as well as fixed income securities.
*Investors should consult their financial advisers if in doubt about whether the product is suitable for them.
Annual Portfolio Turnover Ratio : Equity - 0.83 times, Others (Debt and Derivatives) - 1.44 times Combined Annual Portfolio Turnover Ratio : 2.27 times
Dividend History : Refer page no. from 122 to 130
SIP Returns : Refer page no. from 118 to 120
Total Expense Ratio @@ :
IPBF : 2.20% p. a.
IPBF Direct Plan : 0.84% p. a.
Investment Objective : Refer page no. from 131 to 134
Equity Shares 65.07% 3.00% Auto 5.23% • Tata Motors Ltd. 3.28% Mahindra & Mahindra Ltd. 1.25% Tata Motors Ltd. - DVR 0.70% Auto Ancillaries 0.22% Exide Industries Ltd. 0.22% Banks 11.48% 1.20%• ICICI Bank Ltd. 6.21% ICICI Bank Ltd. - Futures 0.88% State Bank Of India 1.67% HDFC Bank Ltd. 1.43% Axis Bank Ltd. 1.18% The Federal Bank Ltd. 0.45% The Federal Bank Ltd. - Futures 0.33% The South Indian Bank Ltd. 0.40% Oriental Bank Of Commerce 0.15% Cement 0.26% Orient Cement Ltd. 0.25% JK Lakshmi Cement Ltd. 0.01% Chemicals 3.43% 0.18%• Tata Chemicals Ltd. 3.43% Tata Chemicals Ltd. - Futures 0.18% Construction 0.24% IRB Infrastructure Developers Ltd. 0.24% Construction Project 4.45% Larsen & Toubro Ltd. 2.75% Engineers India Ltd. 0.78% Ashoka Buildcon Ltd. 0.49% NCC Ltd. 0.43% Consumer Non Durables 5.29% ITC Ltd. 2.06% Hindustan Unilever Ltd. 1.34% Glaxosmithkline Consumer Healthcare Ltd. 1.28% Colgate - Palmolive (India) Ltd. 0.30% Asian Paints Ltd. 0.23% Britannia Industries Ltd. 0.09% Ferrous Metals 2.77% 0.44%• Tata Steel Ltd. 2.77% Tata Steel Ltd. - Futures 0.44% Finance 1.37% IDFC Ltd. 1.28% ICICI Prudential Life Insurance Company Ltd. 0.09% Healthcare Services 0.49% Narayana Hrudayalaya Ltd. 0.48% Healthcare Global Enterprises Ltd. 0.01% Hotels, Resorts And Other Recreational Activities ^ The Indian Hotels Company Ltd. ^ Industrial Capital Goods 0.50% Bharat Electronics Ltd. 0.50% Minerals/Mining 0.64% Coal India Ltd. 0.64% Non - Ferrous Metals 1.79% Hindalco Industries Ltd. 1.79% Oil 0.51% Oil & Natural Gas Corporation Ltd. 0.51% Petroleum Products 2.41% Castrol India Ltd. 1.02% Indian Oil Corporation Ltd. 0.77% Bharat Petroleum Corporation Ltd. 0.62% Pharmaceuticals 4.63% Cipla Ltd. 2.70% Sun Pharmaceutical Industries Ltd. 0.79% IPCA Laboratories Ltd. 0.48% Alembic Pharmaceuticals Ltd. 0.28% Divi's Laboratories Ltd. 0.18% Unichem Laboratories Ltd. 0.17% Sanofi India Ltd. 0.03% Power 7.97% 0.12%• Power Grid Corporation Of India Ltd. 3.10% Tata Power Company Ltd. 1.90% Tata Power Company Ltd. - Futures 0.12% NTPC Ltd. 1.44% CESC Ltd. 0.87% Gujarat Industries Power Company Ltd. 0.67% Services 0.18% Thomas Cook (India) Ltd. 0.18% Software 6.08% • Infosys Ltd. 3.02% HCL Technologies Ltd. 1.52% Tech Mahindra Ltd. 1.51% Larsen & Toubro Infotech Ltd. 0.04% Telecom - Equipment & Accessories 0.16% Bharti Infratel Ltd. 0.16% Telecom - Services 4.77% 1.06%• Bharti Airtel Ltd. 4.27% Bharti Airtel Ltd. - Futures 1.06% Idea Cellular Ltd. 0.50%
Transportation 0.19% Interglobe Aviation Ltd. 0.15% Container Corporation Of India Ltd. 0.04% Debt Holdings 34.05% Government Securities 13.32%
@ Short Term 0.42% 08.02% Tamil Nadu SDL 2025 SOV 0.09% 07.91% Tamil Nadu SDL 2024 SOV 0.09% 07.67% Tamil Nadu SDL 2023 SOV 0.09% 08.05% Telangana SDL 2025 SOV 0.05% 07.94% Telangana SDL 2024 SOV 0.05% 07.70% Telangana SDL 2023 SOV 0.05%
@ Long Term 12.90% • 07.61% GOI 2030 SOV 5.54% 08.13% GOI 2045 SOV 1.08% 07.59% GOI 2026 SOV 1.01% 08.60% GOI 2028 SOV 1.00% 07.88% GOI 2030 SOV 0.91% 06.79% GOI 2029 SOV 0.77% 07.73% GOI 2034 SOV 0.47% 07.59% GOI 2029 SOV 0.19% 08.24% Tamil Nadu SDL 2028 SOV 0.10% 08.14% Himachal Pradesh SDL 2028 SOV 0.09% 08.05% Tamil Nadu SDL 2031 SOV 0.09% 08.04% Tamil Nadu SDL 2029 SOV 0.09% 08.01% Himachal Pradesh SDL 2031 SOV 0.09% 08.01% Tamil Nadu SDL 2030 SOV 0.09% 07.94% Himachal Pradesh SDL 2032 SOV 0.09% 07.96% Himachal Pradesh SDL 2029 SOV 0.09% 07.92% Tamil Nadu SDL 2032 SOV 0.09% 07.89% Himachal Pradesh SDL 2030 SOV 0.09% 07.90% Tamil Nadu SDL 2027 SOV 0.09% 07.70% Tamil Nadu SDL 2029 SOV 0.09% 07.70% Tamil Nadu SDL 2030 SOV 0.09% 07.70% Tamil Nadu SDL 2031 SOV 0.09% 07.70% Tamil Nadu SDL 2028 SOV 0.09% 07.68% Tamil Nadu SDL 2026 SOV 0.09% 07.70% Tamil Nadu SDL 2032 SOV 0.09% 08.27% Telangana SDL 2028 SOV 0.05% 08.08% Telangana SDL 2031 SOV 0.05% 08.07% Telangana SDL 2029 SOV 0.05% 08.04% Telangana SDL 2030 SOV 0.05% 07.95% Telangana SDL 2032 SOV 0.05% 07.93% Telangana SDL 2027 SOV 0.05% 07.71% Telangana SDL 2026 SOV 0.05% Corporate Securities 14.98% • ICICI Bank Ltd. ICRA AA+ 3.86% • State Bank Of India CRISIL AA+ 3.21% IndusInd Bank Ltd. CRISIL AA 2.32% Axis Bank Ltd. CRISIL AA 1.60% Geetanjali Trading & Investments Pvt. Ltd. BWR AAA 1.59% Hindalco Industries Ltd. CRISIL AA- 0.97% Vedanta Ltd. CRISIL AA 0.46% ICICI Bank Ltd. ICRA AAA 0.46% Axis Bank Ltd. CRISIL AAA 0.37% Tata Steel Ltd. BWR AA 0.06% NHPC Ltd. FITCH AAA 0.06% IDBI Bank Ltd. ICRA A+ 0.01% Cash, Call, CBLO & Term Deposits 5.76% Net Current Assets 0.88% Total Net Assets 100.00%
Company/Issuer Rating % to % to NAV NAV Derivatives
Company/Issuer Rating % to % to NAV NAV Derivatives
Notes:1. Different plans shall have different expense structure. The performance details provided herein are of ICICI Prudential Balanced Fund.2. The scheme is currently managed by Sankaran Naren, Atul Patel and . Mr. Sankaran Naren has been managing this fund since Dec 2015. Total Schemes Manish Banthiamanaged by the Fund Manager . Refer annexure from page no. 91 for performance of other schemes currently managed by Sankaran (Equity) is 14 (14 are jointly managed) Naren.Mr. Atul Patel has been managing this fund since Aug 2016. Total Schemes managed by the Fund Manager . Refer annexure from page no. (Equity) is 14 (13 are jointly managed)91 for performance of other schemes currently managed by Atul Patel .Mr. has been managing this fund since Sep 2013. Total Schemes managed by the Fund Manager . Refer annexure from page Manish Banthia (Debt) is 19 (5 are jointly managedno. 91 for performance of other schemes currently managed by .Manish Banthia3. Date of inception: 03-Nov-99.4. Past performance may or may not be sustained in future and the same may not necessarily provide the basis for comparison with other investment.5. Load is not considered for computation of returns.6. In case, the start/end date of the concerned period is a nonbusiness date (NBD), the NAV of the previous date is considered for computation of returns. The NAV per unit shown in the table is as on the start date of the said period7. As the scheme was launched before the launch of the benchmark index, benchmark index figures since inception or the required period are not available.
Scheme
Nifty 50 Index (Additional Benchmark)
CAGR (%)
CRISIL Balanced Fund – Aggressive Index (Benchmark)
Since inception
CurrentValue of
Investment of Rs. 10000
CAGR (%) Current Value of
Investment of Rs. 10000
1 Year 3 Year 5 Year
CAGR (%) Current Value of
Investment of Rs. 10000
CAGR (%) Current Value of
Investment of Rs. 10000
NAV (Rs.) Per Unit (as on April 28,2017 : 115.44) 10.0091.84 66.93 48.91
Particulars
1 Year T Bill (Additional Benchmark)
7.75%
39.10%
0.04%
41.71%
11.40%
0% 10% 20% 30% 40% 50%
AAA and Equivalent
AA and Equivalent
A and Equivalent
Sovereign Securities
CBLO, Term Deposits & Current Assets
25.78 12569.69 19.95 17247.87 18.75 23602.54 15.01 115440.00
15.73 11568.61 11.62 13902.94 11.40 17149.70 NA NA
18.58 11852.59 11.60 13894.11 12.14 17728.25 11.78 70145.13
6.63 10661.58 7.75 12509.00 7.41 14292.58 6.48 29991.03

59
Fund Details
Quantitative Indicators
Style Box
Fund Managers** :
Equity: George Heber Joseph(Managing this fund since Apr, 2015 &Overall 13 years of experience)Debt : Manish Banthia(Managing this fund since Jan, 2015 &Overall 13 years of experience)
Indicative Investment Horizon:5 years and above
Inception/Allotment date: 31-Aug-01
Monthly AAUM as on 30-Apr-17 : Rs. 403.91 crores
Closing AUM as on 30-Apr-17 : Rs. 405.57 crores
NAV (As on 28-Apr-17):IPCCP(GP) Growth Option : 124.54IPCCP(GP) Direct Plan Growth Option : 128.62
Options : Growth Option(dividend payout*** and re-investment facility available)###Application Amount for freshSubscription :Rs.5,000 (plus in multiples of Re.1)
Min.Addl.Investment :Rs.1,000 (plus in multiples of Re.1)
Exit load for Redemption / Switchout :- Lumpsum & SIP / STP / SWPOptionWitin 1 Year from allotment - 3% of applicable NAV, Within 2 Years from allotment - 2% of applicable NAV, Within 3 Years from allotment - 1% of applicable NAV, more than 3 Years - Nil
##SIP :Monthly Frequency: Rs. 1,000/- and in multiple of Rs. 1/-Quarterly Frequency: Rs. 5,000/- and in multiple of Rs. 1/-
&&SWP :Rs. 500/- and in multiples of Rs. 1/-
STP/ Flex STP/ Value STP * :Daily Frequency: Rs. 250/- and in multiples of Rs. 50/-Weekly, Monthly and Quarterly Frequency: Rs. 1,000/- and in multiples of Rs. 1/-
Min.Redemption Amt. :500/- or all units where amount is below 500/-
Portfolio turnover has been computed as the ratio of the lower value of purchase and sales, to the average net assets in the past one year (since inception for schemes that have not completed a year). The figures are not netted for derivative transactions.Risk-free rate based on the last Overnight MIBOR cut-off of 6.18%
**In addition to the fund manager managing this fund, the ADR/GDR exposure is managed by Mr. Ihab Dalwai.@@ Total Expense Ratio is weighted average for the month. Ratio excludes service tax on management fees and includes B-15 clawback reversal, if any.##
Minimum number of installments for monthly frequency will be 6 and for Quarterly frequency will be 4. w.e.f February 01, 2017.* Minimum number of installments for daily, weekly and monthly frequency will be 6 and for Quarterly frequency will be 4. w.e.f February 01, 2017. Refer page No. 67 for definition of Flex STP and Value STP.&& Minimum number of installments for both monthly and quarterly will be 2. w.e.f February 01, 2017.*** In case the unit holder has opted for dividend payout option, the minimum amount for dividend payout shall be 100 (net of dividend distribution tax and other statutory levy, if any), else the dividend would be mandatorily reinvested.
Std Dev (Annualised) : 14.48% Sharpe Ratio : 0.83
Average P/E : 31.08 Average P/BV : 9.22 Average Dividend Yield : 0.97
Portfolio Beta : 1.38 R squared : 0.78
Portfolio as on April 30, 2017
Returns of ICICI Prudential Child Care Plan (Gift Plan) - Growth Option as on April 30, 2017 - (IPCCP(GP))
• Top Ten Holdings@Short Term < 8 Years, Long Term > 8 Years.
Note : As per the addendum dated 01-Oct-14, the ”Lock in” feature has been introduced in the Schemes for the unit holders less than 18 years of age (Minor) as on the date of application. If the ”Lock in” feature is selected while making the application, the investment amount would be subject to lock in until the minor unit holder either attains the age of 18 years or completes 3 years from date of allotment, whichever is later.###The third party maximum investment limit in ICICI Prudential Child Care Plan - Gift Plan has been removed with effect from April 13, 2015. The existing Crisil Balanced Fund Index has been renamed to Crisil Balanced Fund- Aggressive Index' w.e.f. 4th April 2016 as per 'Crisil Indices- Annual Criteria Review-2016.
Net Equity Level : 79.35%
ICICI Prudential Child Care Plan (Gift Plan)(An Open Ended Fund)
Company/Issuer Rating % to NAV
Auto 7.78%
Tata Motors Ltd. 4.28%
Mahindra & Mahindra Ltd. 3.50%
Auto Ancillaries 2.82%
Bosch Ltd. 2.82%
Banks 6.65%
• ICICI Bank Ltd. 4.50%
Oriental Bank Of Commerce 2.16%
Consumer Durables 0.26%
Bata India Ltd. 0.26%
Consumer Non Durables 16.50%
• Nestle India Ltd. 4.99%
• Glaxosmithkline Consumer Healthcare Ltd. 4.31%
Britannia Industries Ltd. 3.25%
Bajaj Corp Ltd. 2.61%
Agro Tech Foods Ltd. 1.35%
Finance 8.88%
• Sundaram Finance Ltd. 7.21%
LIC Housing Finance Ltd. 1.67%
Healthcare Services 0.91%
Narayana Hrudayalaya Ltd. 0.91%
Industrial Products 2.07%
AIA Engineering Ltd. 2.07%
Petroleum Products 4.30%
• Hindustan Petroleum Corporation Ltd. 4.30%
Pharmaceuticals 11.10%
• Alembic Pharmaceuticals Ltd. 4.78%
IPCA Laboratories Ltd. 2.75%
Astrazeneca Pharma India Ltd. 1.42%
Cipla Ltd. 1.14%
Sanofi India Ltd. 1.00%
Services 7.20%
• Thomas Cook (India) Ltd. 7.20%
Software 2.60%
Hexaware Technologies Ltd. 2.60%
Transportation 8.28%
• Blue Dart Express Ltd. 8.28%@ Government Securities - Long Term 18.59%
• 08.17% GOI 2044 SOV 10.52%
• 07.61% GOI 2030 SOV 6.34%
06.79% GOI 2029 SOV 0.96%
07.59% GOI 2026 SOV 0.77%
Short Term Debt and net current assets 2.07%
Total Net Assets 100.00%
Benchmark Std Dev (Annualised) : 9.27%
Entry load : Nil
RiskometerThis Product is suitable for investors who are seeking*:
• Long term wealth creation solution
• A diversified equity fund that aims to generate capital appreciation by investing in equity and equity related securities.
*Investors should consult their financial advisers if in doubt about whether the product is suitable for them.
Annual Portfolio Turnover Ratio : Equity - 1.61 times, Others (Debt and Derivatives) - 0.19 times Combined Annual Portfolio Turnover Ratio : 1.80 times
Company/Issuer Rating % to NAV
Dividend History : Refer page no. from 122 to 130
SIP Returns : Refer page no. from 118 to 120
Total Expense Ratio @@ :
IPCCP(GP) : 2.57% p. a.
IPCCP(GP) Direct Plan : 1.98% p. a.
Investment Objective : Refer page no. from 131 to 134
Notes:1. Different plans shall have different expense structure. The performance details provided herein are of ICICI Prudential Child Care Plan (Gift Plan).2. The scheme is currently managed by George Heber Joseph and Manish Banthia. Mr. George Heber Joseph has been managing this fund since Apr 2015. Total Schemes managed by the Fund Manager . Refer annexure from page no. 91 for performance of other schemes currently (Equity) is 8 (6 are jointly managed)managed by George Heber Joseph. Mr. Manish Banthia has been managing this fund since Jan 2015. Total Schemes managed by the Fund Manager . Refer (Debt) is 19 (5 are jointly managed)annexure from page no. 91 for performance of other schemes currently managed by Manish Banthia. 3. Date of inception:31-Aug-01.4. Past performance may or may not be sustained in future and the same may not necessarily provide the basis for comparison with other investment.5. Load is not considered for computation of returns.6. In case, the start/end date of the concerned period is a nonbusiness date (NBD), the NAV of the previous date is considered for computation of returns. The NAV per unit shown in the table is as on the start date of the said period7. As the scheme was launched before the launch of the benchmark index, benchmark index figures since inception or the required period are not available.
Scheme
Nifty 50 Index (Additional Benchmark)
NAV (Rs.) Per Unit (as on April 28,2017 : 124.54)
CAGR (%)
10.00
CRISIL Balanced Fund – Aggressive Index (Benchmark)
Since inception
CurrentValue of
Investment of Rs. 10000
CAGR (%) Current Value of
Investment of Rs. 10000
1 Year 3 Year 5 Year
CAGR (%) Current Value of
Investment of Rs. 10000
CAGR (%) Current Value of
Investment of Rs. 10000
101.15 74.75 55.71
Particulars
23.19 12312.41 18.57 16660.87 17.47 22355.05 17.46 124540.00
15.73 11568.61 11.62 13902.94 11.40 17149.70 NA NA
18.58 11852.59 11.60 13894.11 12.14 17728.25 14.91 88294.66

Equity Shares 65.11% -15.01% Auto 3.84% -0.16%• Maruti Suzuki India Ltd. 2.10% Maruti Suzuki India Ltd. - Futures -0.09% Tata Motors Ltd. 0.94% TVS Motor Company Ltd. 0.73% Mahindra & Mahindra Ltd. 0.07% Mahindra & Mahindra Ltd. - Futures -0.07% Auto Ancillaries 4.42% -0.21%• Motherson Sumi Systems Ltd. 2.77% Bosch Ltd. 0.81% Bosch Ltd. - Futures -0.21% Amara Raja Batteries Ltd. 0.50% Exide Industries Ltd. 0.35% Banks 10.67% -2.23%• HDFC Bank Ltd. 3.89% HDFC Bank Ltd. - Futures -1.01%• ICICI Bank Ltd. 2.50% ICICI Bank Ltd. - Futures -0.35% Axis Bank Ltd. 1.69% Axis Bank Ltd. - Futures -0.60% State Bank Of India 1.48% IndusInd Bank Ltd. 0.45% Union Bank Of India 0.35% Kotak Mahindra Bank Ltd. 0.32% Kotak Mahindra Bank Ltd. - Futures -0.28% Cement 0.20% -0.19% Dalmia Bharat Ltd. 0.12% Dalmia Bharat Ltd. - Futures -0.12% Ambuja Cements Ltd. 0.08% Ambuja Cements Ltd. - Futures -0.07% Chemicals 0.53% Tata Chemicals Ltd. 0.53% Construction 0.98% Sobha Ltd. 0.43% Godrej Properties Ltd. 0.36% Brigade Enterprises Ltd. 0.19% Construction Project 1.49% -0.85% Larsen & Toubro Ltd. 1.49% Larsen & Toubro Ltd. - Futures -0.85% Consumer Durables 0.87% Whirlpool of India Ltd. 0.51% Crompton Greaves Consumer Electricals Ltd. 0.36% Consumer Non Durables 9.15% -1.37%• Hindustan Unilever Ltd. 2.55% Hindustan Unilever Ltd. - Futures -1.14% Britannia Industries Ltd. 1.88% ITC Ltd. 1.80% Dabur India Ltd. 0.79% Dabur India Ltd. - Futures -0.22% Jubilant Foodworks Ltd. 0.47% Procter & Gamble Hygiene and Health Care Ltd. 0.47% Bajaj Corp Ltd. 0.45% Glaxosmithkline Consumer Healthcare Ltd. 0.44% Colgate - Palmolive (India) Ltd. 0.21% Colgate - Palmolive (India) Ltd. - Futures -0.01% United Breweries Ltd. 0.08% Ferrous Metals 1.08% Steel Authority Of India Ltd. 0.72% Tata Steel Ltd. 0.36% Finance 5.04% -0.93%• Bajaj Finserv Ltd. 2.64% Sundaram Finance Ltd. 0.78% HDFC Ltd. 0.77% HDFC Ltd. - Futures -0.72% LIC Housing Finance Ltd. 0.53% LIC Housing Finance Ltd. - Futures -0.11% Muthoot Finance Ltd. 0.22% Max Financial Services Ltd. 0.11% Max Financial Services Ltd. - Futures -0.11% Gas 0.27% GAIL (India) Ltd. 0.27% Healthcare Services 0.28% Narayana Hrudayalaya Ltd. 0.28% Hotels, Resorts And Other Recreational Activities 0.13% The Indian Hotels Company Ltd. 0.13% Industrial Capital Goods 0.62% Bharat Heavy Electricals Ltd. 0.30% Bharat Electronics Ltd. 0.27% Thermax Ltd. 0.05% Industrial Products 0.22% FAG Bearings India Ltd. 0.22% Media & Entertainment 0.87% PVR Ltd. 0.87% Minerals/Mining 0.99% -0.33% Coal India Ltd. 0.99% Coal India Ltd. - Futures -0.33% Non - Ferrous Metals 0.20% Hindalco Industries Ltd. 0.20% Oil 0.25% Oil India Ltd. 0.25% Pesticides 0.25% PI Industries Ltd. 0.25% Petroleum Products 2.88% -0.66% Castrol India Ltd. 1.05% Reliance Industries Ltd. 0.70% Reliance Industries Ltd. - Futures -0.65% Indian Oil Corporation Ltd. 0.64% Indian Oil Corporation Ltd. - Futures -0.01% Bharat Petroleum Corporation Ltd. 0.48% Bharat Petroleum Corporation Ltd. - Futures ^ Pharmaceuticals 6.02% -0.18% Cipla Ltd. 1.59% Lupin Ltd. 1.12% Sun Pharmaceutical Industries Ltd. 1.08% Sun Pharmaceutical Industries Ltd. - Futures -0.18% Pfizer Ltd. 0.61%
60
Equity
Debt
Fund Details
Style Box
Fund Managers** :
Equity : Manish Gunwani (Managing this fund from Jan 2012 &Overall 20 years of experience)Rajat Chandak(Managing this fund since Sep, 2015 &Overall 8 years of experience)Debt : Manish Banthia (Managing this fund since Nov, 2009 & Overall 13 years of experience)
Indicative Investment Horizon:3yrs & more
Inception/Allotment date: 30-Dec-06
Monthly AAUM as on 30-Apr-17 : Rs. 18439.31 crores
Closing AUM as on 30-Apr-17 : Rs. 18645.13 crores
NAV (As on 28-Apr-17):IPBAF Growth Option : 30.57IPBAF Dividend Option : 16.28IPBAF Direct Plan Growth Option : 32.10IPBAF Direct Plan Dividend Option : 19.40
# Automatic Withdrawal Plan (AWP) feature will allow investors to redeem a fixed sum of money periodically at the prevailing Net Asset Value (NAV) depending on the option chosen by the investor. For more details of this feature, Investors are requested to visit the website of the AMC viz., www.icicipruamc.comThe existing Crisil Balanced Fund Index has been renamed to Crisil Balanced Fund- Aggressive Index' w.e.f. 4th April 2016 as per 'Crisil Indices- Annual Criteria Review-2016.Portfolio turnover has been computed as the ratio of the lower value of purchase and sales, to the average net assets in the past one year (sinceinception for schemes that have not completed a year). The figures are not netted for derivative transactions.Risk-free rate based on the last Overnight MIBOR cut-off of 6.18%**In addition to the fund manager managing this fund, the ADR/GDR exposure is managed by Mr. Ihab Dalwai.@@ Total Expense Ratio is weighted average for the month. Ratio excludes service tax on management fees and includes B-15 clawback reversal, if any.##
Minimum number of installments for monthly frequency will be 6 and for Quarterly frequency will be 4. w.e.f February 01, 2017.* Minimum number of installments for daily, weekly and monthly frequency will be 6 and for Quarterly frequency will be 4. w.e.f February 01, 2017. Refer page No. 67 for definition of Flex STP and Value STP.&&
Minimum number of installments for both monthly and quarterly will be 2. w.e.f February 01, 2017.*** In case the unit holder has opted for dividend payout option, the minimum amount for dividend payout shall be 100 (net of dividend distribution tax and other statutory levy, if any), else the dividend would be mandatorily reinvested.
Sharpe Ratio : 0.92 Portfolio Beta : 0.90 R squared : 0.87
• Top Ten HoldingsDerivatives are considered at exposure value.@Short Term < 8 Years, Long Term > 8 Years.
^ Value Less than 0.01% of NAV.
Portfolio as on April 30, 2017
Returns of ICICI Prudential Balanced Advantage Fund - Growth Option as on April 30, 2017 - (IPBAF)
Company/Issuer Rating % to % to NAV NAV Derivatives
Quantitative Indicators – Debt Component Average Maturity : 4.11 Years Modified Duration : 2.80 Years Yield To Maturity : 7.68%
Quantitative Indicators – Equity Component
Benchmark Std Dev (Annualised) : 9.27% Net Equity Level : 50.11%
Dr. Reddy's Laboratories Ltd. 0.50% Biocon Ltd. 0.34% Alembic Pharmaceuticals Ltd. 0.19% IPCA Laboratories Ltd. 0.18% Abbott India Ltd. 0.17% Divi's Laboratories Ltd. 0.12% Astrazeneca Pharma India Ltd. 0.10% Power 2.19% -0.39% NTPC Ltd. 1.50% NTPC Ltd. - Futures -0.31% Power Grid Corporation Of India Ltd. 0.69% Power Grid Corporation Of India Ltd. - Futures -0.08% Retailing 0.38% Avenue Supermarts Ltd. 0.38% Services 0.39% Thomas Cook (India) Ltd. 0.39% Software 7.84% -1.90%• Infosys Ltd. 2.14% Infosys Ltd. - Futures -1.06% HCL Technologies Ltd. 1.92% HCL Technologies Ltd. - Futures -0.84% Tech Mahindra Ltd. 1.81% Info Edge (India) Ltd. 0.97% Wipro Ltd. 0.90% Larsen & Toubro Infotech Ltd. 0.10% Telecom - Services 1.17% Bharti Airtel Ltd. 1.17% Textile Products 0.01% Page Industries Ltd. 0.01% Transportation 1.88% Container Corporation Of India Ltd. 0.91% Interglobe Aviation Ltd. 0.69% The Great Eastern Shipping Company Ltd. 0.25% Spicejet Ltd. 0.03% Index Futures/Options -5.62% Nifty 50 Index - Futures -5.62% Units of Mutual Fund 1.25% ICICI Prudential Nifty iWIN ETF 1.17% ICICI Prudential Midcap Select iWIN ETF 0.04% ICICI Prudential NV20 iWIN ETF 0.04% Debt Holdings 33.09% CPs and CDs 0.08% Reliance Capital Ltd. ICRA A1+ 0.08% Government Securities 10.12%
@ Short Term 0.44% 07.16% GOI 2023 SOV 0.24% 07.35% GOI 2024 SOV 0.11% 08.01% Telangana SDL 2025 SOV 0.03% 07.87% Telangana SDL 2024 SOV 0.03% 07.63% Telangana SDL 2023 SOV 0.03%
@ Long Term 9.68% • 07.61% GOI 2030 SOV 4.43% 07.88% GOI 2030 SOV 1.51% 07.59% GOI 2026 SOV 1.25% 07.73% GOI 2034 SOV 0.56% 07.59% GOI 2029 SOV 0.49% 06.79% GOI 2029 SOV 0.24% 08.15% GOI 2026 SOV 0.13% 08.27% Karnataka SDL 2026 SOV 0.08% 08.30% Rajasthan SDL 2026 SOV 0.08% 08.22% Tamil Nadu SDL 2025 SOV 0.06% 07.72% Tamil Nadu SDL 2029 SOV 0.05% 07.72% Tamil Nadu SDL 2030 SOV 0.05% 07.72% Tamil Nadu SDL 2031 SOV 0.05% 07.72% Tamil Nadu SDL 2028 SOV 0.05% 07.72% Tamil Nadu SDL 2032 SOV 0.05% 07.70% Tamil Nadu SDL 2029 SOV 0.05% 07.70% Tamil Nadu SDL 2030 SOV 0.05% 07.70% Tamil Nadu SDL 2031 SOV 0.05% 07.70% Tamil Nadu SDL 2028 SOV 0.05% 07.70% Tamil Nadu SDL 2032 SOV 0.05% 08.17% GOI 2044 SOV 0.03% 08.13% GOI 2045 SOV 0.03% 08.27% Telangana SDL 2028 SOV 0.03% 08.17% Tamil Nadu SDL 2025 SOV 0.03% 08.04% Telangana SDL 2031 SOV 0.03% 08.08% Telangana SDL 2029 SOV 0.03% 07.96% Telangana SDL 2032 SOV 0.03% 07.95% Telangana SDL 2032 SOV 0.03% 07.98% Telangana SDL 2030 SOV 0.03% 07.81% Telangana SDL 2027 SOV 0.03% 07.62% Telangana SDL 2026 SOV 0.03% Corporate Securities 16.28% • State Bank Of India CRISIL AA+ 3.52% • ICICI Bank Ltd. ICRA AA+ 2.70% Hindalco Industries Ltd. CRISIL AA- 1.87% ICICI Bank Ltd. ICRA AAA 1.75% Axis Bank Ltd. CRISIL AA 1.56% IndusInd Bank Ltd. CRISIL AA 1.08% Credila Financial Services Pvt. Ltd. CRISIL AA+ 0.94% Tata International Ltd. CARE A+ 0.80% Tata Motors Finance Solutions Pvt. Ltd. CRISIL AA 0.74% IDBI Bank Ltd. ICRA A+ 0.58% Tata Steel Ltd. BWR AA 0.36% Daimler Financial Services India Pvt. Ltd. FITCH AAA 0.21% Vedanta Ltd. CRISIL AA 0.14% NTPC Ltd. CRISIL AAA 0.02% Cash, Call, CBLO & Term Deposits 6.61% Net Current Assets 0.55% Total Net Assets 100.00%
Company/Issuer Rating % to % to NAV NAV Derivatives
ICICI Prudential Balanced Advantage Fund(An Open Ended Equity Fund)
Std Dev (Annualised) : 8.89%
Options :Growth & Dividend (Monthly Dividend& Dividend Others)(dividend payout*** and re-investment facility available)
Application Amount for freshSubscription :Rs.5,000 (plus in multiples of Re.1)
Min.Addl.Investment :Rs.1000/- (plus in multiples of Re.1/-)
Exit load for Redemption / Switch#out :- Lumpsum & SIP / STP / SWP / AWP
Upto 15% of units within 18 months from the date of allotment – Nil More than 15% of units within 18 months from the date of allotment – 1% of applicable NAV After 18 months from the date of allotment – Nil w.e.f. 10th November 2016.
##SIP :Monthly Frequency: Rs. 1,000/- and in multiple of Rs. 1/-Quarterly Frequency: Rs. 5,000/- and in multiple of Rs. 1/-
&&SWP :Rs. 500/- and in multiples of Rs. 1/-
STP/ Flex STP/ Value STP * :Daily Frequency: Rs. 250/- and in multiples of Rs. 50/-Weekly, Monthly and Quarterly Frequency: Rs. 1,000/- and in multiples of Rs. 1/-
Min.Redemption Amt. :500/- or all units where amount is below 500/-
Entry load : Nil
RiskometerThis Product is suitable for investors who are seeking*:
• long term wealth creation solution
• An equity fund that aims for growth by investing in equity and derivatives.
*Investors should consult their financial advisers if in doubt about whether the product is suitable for them.
Average P/E : 25.81 Average P/BV : 8.64 Average Dividend Yield : 1.24
Annual Portfolio Turnover Ratio : Equity - 0.38 times, Others (Debt and Derivatives) - 3.49 times Combined Annual Portfolio Turnover Ratio : 3.87 times
Dividend History : Refer page no. from 122 to 130
SIP Returns : Refer page no. from 118 to 120
Total Expense Ratio @@ :
IPBAF : 2.17% p. a.
IPBAF Direct Plan : 0.79% p. a.
Investment Objective : Refer page no. from 131 to 134
Notes:1. Different plans shall have different expense structure. The performance details provided herein are of ICICI Prudential Balanced Advantage Fund.2. The scheme is currently managed , and Manish Banthia. Mr. has been managing this fund since . Total Schemes Manish Gunwani Rajat Chandak Manish Gunwani Jan 2012managed by the Fund Manager . Refer annexure from page no. 91 for performance of other schemes currently managed byManish Gunwani.(Equity) is 12 (11 are jointly managed) Mr. has been managing this fund since . Total Schemes managed by the Fund Manager . Refer annexure from page Rajat Chandak Sep 2015 (Equity) is 9 (5 are jointly managed)no. 91 for performance of other schemes currently managed by . Rajat ChandakMr. Manish Banthia has been managing this fund since . Total Schemes managed by the Fund Manager . Refer annexure from page Nov 2009 (Debt) is 19 (5 are jointly managed)no. 91 for performance of other schemes currently managed by Manish Banthia. 3. Date of inception: 30-Dec-06.4. Past performance may or may not be sustained in future and the same may not necessarily provide the basis for comparison with other investment.5. Load is not considered for computation of returns.6. In case, the start/end date of the concerned period is a nonbusiness date (NBD), the NAV of the previous date is considered for computation of returns. The NAV per unit shown in the table is as on the start date of the said period
Scheme
Nifty 50 Index (Additional Benchmark)
NAV (Rs.) Per Unit (as on April 28,2017 : 30.57)
CAGR (%)
10.00
CRISIL Balanced Fund – Aggressive Index (Benchmark)
Since inception
CurrentValue of
Investment of Rs. 10000
CAGR (%) Current Value of
Investment of Rs. 10000
1 Year 3 Year 5 Year
CAGR (%) Current Value of
Investment of Rs. 10000
CAGR (%) Current Value of
Investment of Rs. 10000
26.19 20.16 14.78
Particulars
16.77 11672.39 14.90 15163.69 15.65 20683.36 11.42 30570.00
15.73 11568.61 11.62 13902.94 11.40 17149.70 9.03 24427.37
18.58 11852.59 11.60 13894.11 12.14 17728.25 8.60 23457.17

Style Box
Fund Managers** :
Equity : Sankaran Naren(Managing this fund since Dec, 2014 & Overall 26 years of experience)Chintan Haria(Managing this fund since Dec, 2014 & Overall 10 years of experience)Kayzad Eghlim(Managing this fund since Apr 2017 &Overall 26 years of experience)Debt : Manish Banthia(Managing this fund since Dec, 2014 & Overall 13 years of experience)
Indicative Investment Horizon: 3 years and above
Inception/Allotment date: 05-Dec-14
NAV (As on 28-Apr-17):IPEIF Growth Option : 12.16IPEIF Direct Plan Growth Option : 12.42
Options :Cumulative, AEP Option (Appreciation and Regular) and Dividend (dividend payout*** and re-investment facility available)
Application Amount for freshSubscription :Rs.5,000 (plus in multiples of Re.1)
Min.Addl.Investment :Rs.1000/- (plus in multiples of Re.1/-)
Exit load for Redemption / Switchout :- #Lumpsum / AWP Investment Option
Upto 10% of units within 1 Year from the date of allotment – Nil More than 10% of units within 1 Year from the date of allotment – 1% of applicable NAV $$ After 1 year from the date of allotment – Nil w.e.f. 2nd May 2017.
Fund Details
• Top Ten HoldingsDerivatives are considered at exposure value.@Short Term < 8 Years, Long Term > 8 Years.
Company/Issuer Rating % to % to NAV NAV Derivatives
Company/Issuer Rating % to % to NAV NAV Derivatives
Equity Shares 66.41% -35.49% Auto 2.72% -0.71% Tata Motors Ltd. 2.00% Tata Motors Ltd. - DVR 0.40% Tata Motors Ltd. - Futures -0.38% Maruti Suzuki India Ltd. 0.33% Maruti Suzuki India Ltd. - Futures -0.33% Auto Ancillaries 0.48% -0.48% Motherson Sumi Systems Ltd. 0.48% Motherson Sumi Systems Ltd. - Futures -0.48% Banks 12.18% -5.95%• Axis Bank Ltd. 5.01% Axis Bank Ltd. - Futures -3.49%• ICICI Bank Ltd. 4.37% ICICI Bank Ltd. - Futures -0.50% HDFC Bank Ltd. 1.26% HDFC Bank Ltd. - Futures -1.25% State Bank Of India 1.22% State Bank Of India - Futures -0.70% The Federal Bank Ltd. 0.32% Cement 0.07% -0.07% ACC Ltd. 0.07% ACC Ltd. - Futures -0.07% Chemicals 2.01% -1.20% Tata Chemicals Ltd. 2.01% Tata Chemicals Ltd. - Futures -1.20% Construction Project 3.34% -2.08%• Larsen & Toubro Ltd. 3.34% Larsen & Toubro Ltd. - Futures -2.08% Consumer Non Durables 3.63% -2.63% ITC Ltd. 2.09% ITC Ltd. - Futures -1.11% Hindustan Unilever Ltd. 1.29% Hindustan Unilever Ltd. - Futures -1.29% Tata Global Beverages Ltd. 0.23% Tata Global Beverages Ltd. - Futures -0.23% Glaxosmithkline Consumer Healthcare Ltd. 0.02% Ferrous Metals 2.14% -1.32% Tata Steel Ltd. 2.14% Tata Steel Ltd. - Futures -1.32% Finance 3.48% -1.42% IDFC Ltd. 2.25% IDFC Ltd. - Futures -0.19% HDFC Ltd. 1.22% HDFC Ltd. - Futures -1.23% Minerals/Mining 2.56% -1.63% Coal India Ltd. 2.41% Coal India Ltd. - Futures -1.63% Gujarat Mineral Development Corporation Ltd. 0.15% Non - Ferrous Metals 1.09% -0.49% Hindalco Industries Ltd. 0.60% Hindustan Zinc Ltd. 0.49% Hindustan Zinc Ltd. - Futures -0.49% Oil 0.62% -0.63% Oil India Ltd. 0.51% Oil India Ltd. - Futures -0.51% Oil & Natural Gas Corporation Ltd. 0.12% Oil & Natural Gas Corporation Ltd. - Futures -0.12% Petroleum Products 6.15% -3.80%• Reliance Industries Ltd. 2.83% Reliance Industries Ltd. - Futures -2.83% Bharat Petroleum Corporation Ltd. 1.21% Bharat Petroleum Corporation Ltd. - Futures -0.43% Indian Oil Corporation Ltd. 1.06% Indian Oil Corporation Ltd. - Futures -0.53% Castrol India Ltd. 1.06% Pharmaceuticals 7.68% -4.19% Sun Pharmaceutical Industries Ltd. 2.74% Sun Pharmaceutical Industries Ltd. - Futures -1.48% Cipla Ltd. 1.76% Cipla Ltd. - Futures -0.92% Aurobindo Pharma Ltd. 1.43% Aurobindo Pharma Ltd. - Futures -1.43% Lupin Ltd. 1.39% Divi's Laboratories Ltd. 0.23% Divi's Laboratories Ltd. - Futures -0.23% Dr. Reddy's Laboratories Ltd. 0.14%
Monthly AAUM as on 30-Apr-17 :Rs. 1566.57 crores
Closing AUM as on 30-Apr-17 : Rs. 1658.74 crores
Debt
Diversified
Equity
Dr. Reddy's Laboratories Ltd. - Futures -0.14% Power 5.14% -1.84% Power Grid Corporation Of India Ltd. 2.14% Power Grid Corporation Of India Ltd. - Futures -1.31% NTPC Ltd. 1.78% NTPC Ltd. - Futures -0.18% Tata Power Company Ltd. 0.82% CESC Ltd. 0.40% CESC Ltd. - Futures -0.36% Services 0.03% Thomas Cook (India) Ltd. 0.03% Software 6.61% -3.69% Infosys Ltd. 2.64% Infosys Ltd. - Futures -1.15% Wipro Ltd. 1.63% Wipro Ltd. - Futures -1.58% Tata Consultancy Services Ltd. 0.98% Tech Mahindra Ltd. 0.64% Tech Mahindra Ltd. - Futures -0.64% HCL Technologies Ltd. 0.44% HCL Technologies Ltd. - Futures -0.31% Cyient Ltd. 0.27% Telecom - Services 4.61% -1.76%• Bharti Airtel Ltd. 4.61% Bharti Airtel Ltd. - Futures -1.76% Transportation 1.86% -1.62% Container Corporation Of India Ltd. 0.92% Container Corporation of India Ltd. - Futures -0.92% Adani Ports and Special Economic Zone Ltd. 0.69% Adani Ports and Special Economic Zone Ltd. - Futures -0.69% The Great Eastern Shipping Company Ltd. 0.25% Debt Holdings 32.85%
@ Government Securities - Long Term 10.00% • 07.61% GOI 2030 SOV 6.20% • 07.73% GOI 2034 SOV 2.78% 08.13% GOI 2045 SOV 0.64% 07.59% GOI 2026 SOV 0.37% Corporate Securities 16.17% • ICICI Bank Ltd. ICRA AA+ 5.16% • IndusInd Bank Ltd. CRISIL AA 3.03% • Axis Bank Ltd. CRISIL AA 2.98% Hindalco Industries Ltd. CRISIL AA- 1.58% Vedanta Ltd. CRISIL AA 1.56% State Bank Of India CRISIL AA+ 1.49% Power Grid Corporation Of India Ltd. CRISIL AAA 0.31% NTPC Ltd. CRISIL AAA 0.06% Cash, Call, CBLO & Term Deposits 6.68% Net Current Assets 0.74% Total Net Assets 100.00%
ICICI Prudential Equity Income FundAn Open ended equity scheme
Entry load : Nil
Rating Profile (as % of debt component)
RiskometerThis Product is suitable for investors who are seeking*:
• Long term wealth creation solution
• An equity scheme that seeks to generate regular income through investments in fixed income securities, arbitrage and other derivative strategies and aim for long term capital appreciation by investing in equity and equity related instruments.
*Investors should consult their financial advisers if in doubt about whether the product is suitable for them.
# Automatic Withdrawal Plan (AWP) feature will allow investors to redeem a fixed sum of money periodically at the prevailing Net Asset Value (NAV) depending on the option chosen by the investor. For more details of this feature, Investors are requested to visit the website of the AMC viz., www.icicipruamc.com$$ Switches made to equity schemes (open and closed ended*) within 1 Year from the date of allotment – Nil. *Closed ended equity schemes during their New Fund Offer Period.Note : - “Portfolio Beta, Standard Deviation, R Squared, Sharpe Ratio and Tracking Error of the Scheme is not computed owing to the short time frame since launch of the Scheme.”Portfolio turnover has been computed as the ratio of the lower value of purchase and sales, to the average net assets in the past one year (since inception for schemes that have not completed a year). The figures are not netted for derivative transactions.**In addition to the fund manager managing this fund, the ADR/GDR exposure is managed by Mr. Ihab Dalwai.@@ Total Expense Ratio is weighted average for the month. Ratio excludes service tax on management fees and includes B-15 clawback reversal, if any.##
Minimum number of installments for monthly frequency will be 6 and for Quarterly frequency will be 4. w.e.f February 01, 2017.* Minimum number of installments for daily, weekly and monthly frequency will be 6 and for Quarterly frequency will be 4. w.e.f February 01, 2017. Refer page No. 137 for definition of Flex STP and Value STP.&& Minimum number of installments for both monthly and quarterly will be 2. w.e.f February 01, 2017.*** In case the unit holder has opted for dividend payout option, the minimum amount for dividend payout shall be 100 (net of dividend distribution tax and other statutory levy, if any), else the dividend would be mandatorily reinvested.
&&SWP :Rs. 500/- and in multiples of Rs. 1/-
Min.Redemption Amt. :500/- or all units where amount is below 500/-
##SIP :Monthly Frequency: Rs. 1,000/- and in multiple of Rs. 1/-Quarterly Frequency: Rs. 5,000/- and in multiple of Rs. 1/-
61
Quantitative Indicators – Equity Component Average P/E : 18.89 Average P/BV : 4.94 Average Dividend Yield : 1.62STP/ Flex STP/ Value STP * :Daily Frequency: Rs. 250/- and in multiples of Rs. 50/-Weekly, Monthly and Quarterly Frequency: Rs. 1,000/- and in multiples of Rs. 1/-
Net Equity Level : 30.92%
Quantitative Indicators – Debt Component Average Maturity : 3.31 Years Modified Duration : 2.08 Years Yield To Maturity : 7.85%
Annual Portfolio Turnover Ratio : Equity - 0.24 times, Others (Debt and Derivatives) - 5.41 times Combined Annual Portfolio Turnover Ratio : 5.65 times
Portfolio as on April 30, 2017
Returns of ICICI Prudential Equity Income Fund - Growth Option as on - (IPEIF)April 30, 2017
Dividend History : Refer page no. from 122 to 130
SIP Returns : Refer page no. from 118 to 120
Total Expense Ratio @@ :
IPEIF : 1.57% p. a.
IPEIF Direct Plan : 0.61% p. a.
Investment Objective : Refer page no. from 131 to 134
Notes:1. Different plans shall have different expense structure. The performance details provided herein are of ICICI Prudential Equity Income Fund.2. The scheme is currently managed , , Kayzad Eghlim and Manish Banthia. Mr. Sankaran Naren has been managing this fund since Dec 2014. by Sankaran Naren Chintan HariaTotal Schemes managed by the Fund Manager . Refer annexure from page no. 91 for performance of other schemes currently managed by (Equity) is 14 (14 are jointly managed)Sankaran Naren.Mr. has been managing this fund since . Total Schemes managed by the Fund Manager . Refer annexure from page no. Chintan Haria Dec 2014 (Equity) is 3 (3 are jointly managed)91 for performance of other schemes currently managed by . Chintan HariaMr. has been managing this fund since Apr 2017. Total Schemes managed by the Fund Manager . Refer annexure from page no. 91 for performance of Kayzad Eghlim (Equity) is 9other schemes currently managed by .Kayzad EghlimMr. Manish Banthia has been managing this fund since . Total Schemes managed by the Fund Manager . Refer annexure from page Dec 2014 (Debt) is 19 (5 are jointly managed)no. 91 for performance of other schemes currently managed by Manish Banthia. 3. Date of inception: 05-Dec-14.4. As the Scheme has completed more than 1 year but less than 3 years, the performance details of only since inception and 1 year are provided herein.5. Past performance may or may not be sustained in future and the same may not necessarily provide the basis for comparison with other investment.6. Load is not considered for computation of returns.7. In case, the start/end date of the concerned period is a nonbusiness date (NBD), the NAV of the previous date is considered for computation of returns. The NAV per unit shown in the table is as on the start date of the said period
Scheme
Nifty 50 Index (Additional Benchmark)
NAV (Rs.) Per Unit (as on April 28,2017 : 12.16)
CAGR (%)
10.00
30% Nifty 50 + 40% CRISIL Liquid Fund Index + 30% CRISIL Short Term Bond Fund Index (Benchmark)
Since inception
CurrentValue of
Investment of Rs. 10000
CAGR (%) Current Value of
Investment of Rs. 10000
1 Year 3 Year 5 Year
CAGR (%) Current Value of
Investment of Rs. 10000
CAGR (%) Current Value of
Investment of Rs. 10000
10.61 - -
Particulars
14.65 11460.89 - - - - 8.50 12160.00
11.06 11103.25 - - - - 7.03 11767.55
18.58 11852.59 - - - - 3.65 10896.84
0.54%
22.87%
14.48%
62.11%
0% 10% 20% 30% 40% 50% 60% 70%
AAA and Equivalent
AA and Equivalent
Sovereign Securities
CBLO, Term Deposits & Current Assets
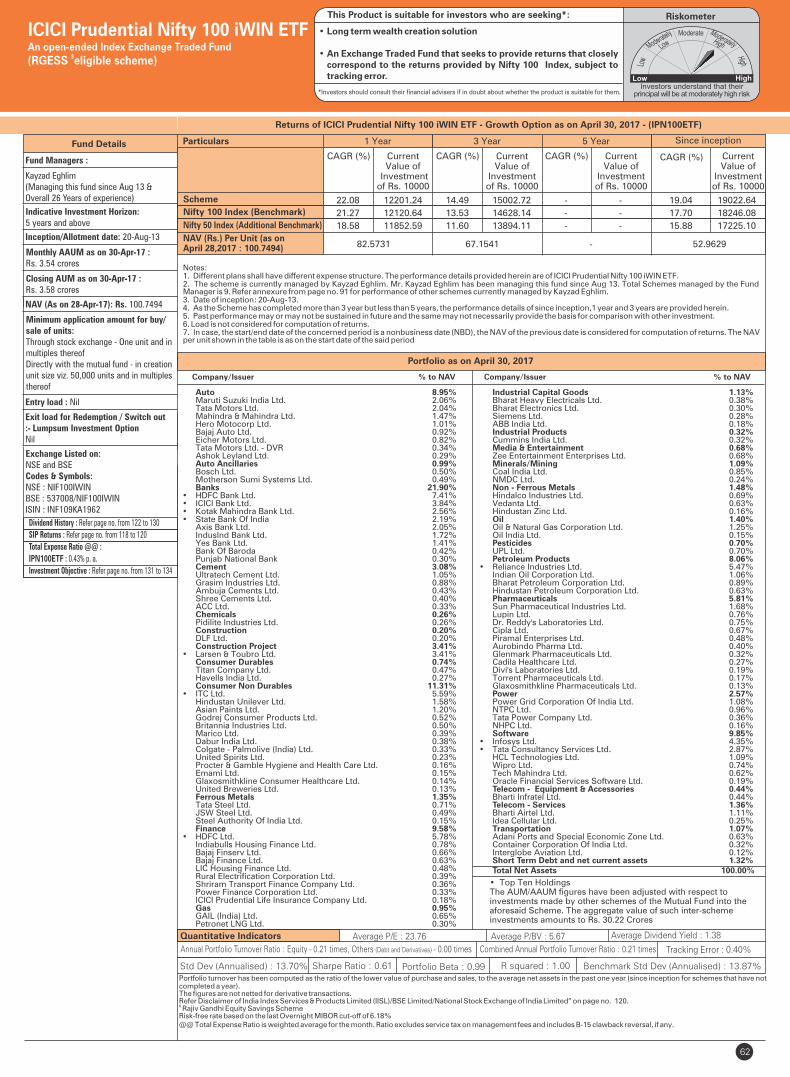
62
Fund Details
Quantitative Indicators
Company/Issuer % to NAV
Fund Managers :
Kayzad Eghlim(Managing this fund since Aug 13 &Overall 26 Years of experience)
Indicative Investment Horizon: 5 years and above
Inception/Allotment date: 20-Aug-13
Monthly AAUM as on 30-Apr-17 :Rs. 3.54 crores
Closing AUM as on 30-Apr-17 : Rs. 3.58 crores
NAV (As on 28-Apr-17): Rs. 100.7494
Minimum application amount for buy/sale of units:Through stock exchange - One unit and inmultiples thereofDirectly with the mutual fund - in creationunit size viz. 50,000 units and in multiplesthereof
Exit load for Redemption / Switch out:- Lumpsum Investment OptionNil
Exchange Listed on:NSE and BSECodes & Symbols:NSE : NIF100IWINBSE : 537008/NIF100IWINISIN : INF109KA1962
Average P/E : 23.76 Average P/BV : 5.67 Average Dividend Yield : 1.38
Portfolio turnover has been computed as the ratio of the lower value of purchase and sales, to the average net assets in the past one year (since inception for schemes that have not completed a year). The figures are not netted for derivative transactions.Refer Disclaimer of India Index Services & Products Limited (IISL)/BSE Limited/National Stock Exchange of India Limited” on page no. 120.$ Rajiv Gandhi Equity Savings SchemeRisk-free rate based on the last Overnight MIBOR cut-off of 6.18%@@ Total Expense Ratio is weighted average for the month. Ratio excludes service tax on management fees and includes B-15 clawback reversal, if any.
Company/Issuer % to NAV
Portfolio as on April 30, 2017
• Top Ten HoldingsThe AUM/AAUM figures have been adjusted with respect to investments made by other schemes of the Mutual Fund into the aforesaid Scheme. The aggregate value of such inter-scheme investments amounts to Rs. 30.22 Crores
Auto 8.95% Maruti Suzuki India Ltd. 2.06% Tata Motors Ltd. 2.04% Mahindra & Mahindra Ltd. 1.47% Hero Motocorp Ltd. 1.01% Bajaj Auto Ltd. 0.92% Eicher Motors Ltd. 0.82% Tata Motors Ltd. - DVR 0.34% Ashok Leyland Ltd. 0.29% Auto Ancillaries 0.99% Bosch Ltd. 0.50% Motherson Sumi Systems Ltd. 0.49% Banks 21.90%• HDFC Bank Ltd. 7.41%• ICICI Bank Ltd. 3.84%• Kotak Mahindra Bank Ltd. 2.56%• State Bank Of India 2.19% Axis Bank Ltd. 2.05% IndusInd Bank Ltd. 1.72% Yes Bank Ltd. 1.41% Bank Of Baroda 0.42% Punjab National Bank 0.30% Cement 3.08% Ultratech Cement Ltd. 1.05% Grasim Industries Ltd. 0.88% Ambuja Cements Ltd. 0.43% Shree Cements Ltd. 0.40% ACC Ltd. 0.33% Chemicals 0.26% Pidilite Industries Ltd. 0.26% Construction 0.20% DLF Ltd. 0.20% Construction Project 3.41%• Larsen & Toubro Ltd. 3.41% Consumer Durables 0.74% Titan Company Ltd. 0.47% Havells India Ltd. 0.27% Consumer Non Durables 11.31%• ITC Ltd. 5.59% Hindustan Unilever Ltd. 1.58% Asian Paints Ltd. 1.20% Godrej Consumer Products Ltd. 0.52% Britannia Industries Ltd. 0.50% Marico Ltd. 0.39% Dabur India Ltd. 0.38% Colgate - Palmolive (India) Ltd. 0.33% United Spirits Ltd. 0.23% Procter & Gamble Hygiene and Health Care Ltd. 0.16% Emami Ltd. 0.15% Glaxosmithkline Consumer Healthcare Ltd. 0.14% United Breweries Ltd. 0.13% Ferrous Metals 1.35% Tata Steel Ltd. 0.71% JSW Steel Ltd. 0.49% Steel Authority Of India Ltd. 0.15% Finance 9.58%• HDFC Ltd. 5.78% Indiabulls Housing Finance Ltd. 0.78% Bajaj Finserv Ltd. 0.66% Bajaj Finance Ltd. 0.63% LIC Housing Finance Ltd. 0.48% Rural Electrification Corporation Ltd. 0.39% Shriram Transport Finance Company Ltd. 0.36% Power Finance Corporation Ltd. 0.33% ICICI Prudential Life Insurance Company Ltd. 0.18% Gas 0.95% GAIL (India) Ltd. 0.65% Petronet LNG Ltd. 0.30%
Industrial Capital Goods 1.13% Bharat Heavy Electricals Ltd. 0.38% Bharat Electronics Ltd. 0.30% Siemens Ltd. 0.28% ABB India Ltd. 0.18% Industrial Products 0.32% Cummins India Ltd. 0.32% Media & Entertainment 0.68% Zee Entertainment Enterprises Ltd. 0.68% Minerals/Mining 1.09% Coal India Ltd. 0.85% NMDC Ltd. 0.24% Non - Ferrous Metals 1.48% Hindalco Industries Ltd. 0.69% Vedanta Ltd. 0.63% Hindustan Zinc Ltd. 0.16% Oil 1.40% Oil & Natural Gas Corporation Ltd. 1.25% Oil India Ltd. 0.15% Pesticides 0.70% UPL Ltd. 0.70% Petroleum Products 8.06%• Reliance Industries Ltd. 5.47% Indian Oil Corporation Ltd. 1.06% Bharat Petroleum Corporation Ltd. 0.89% Hindustan Petroleum Corporation Ltd. 0.63% Pharmaceuticals 5.81% Sun Pharmaceutical Industries Ltd. 1.68% Lupin Ltd. 0.76% Dr. Reddy's Laboratories Ltd. 0.75% Cipla Ltd. 0.67% Piramal Enterprises Ltd. 0.48% Aurobindo Pharma Ltd. 0.40% Glenmark Pharmaceuticals Ltd. 0.32% Cadila Healthcare Ltd. 0.27% Divi's Laboratories Ltd. 0.19% Torrent Pharmaceuticals Ltd. 0.17% Glaxosmithkline Pharmaceuticals Ltd. 0.13% Power 2.57% Power Grid Corporation Of India Ltd. 1.08% NTPC Ltd. 0.96% Tata Power Company Ltd. 0.36% NHPC Ltd. 0.16% Software 9.85%• Infosys Ltd. 4.35%• Tata Consultancy Services Ltd. 2.87% HCL Technologies Ltd. 1.09% Wipro Ltd. 0.74% Tech Mahindra Ltd. 0.62% Oracle Financial Services Software Ltd. 0.19% Telecom - Equipment & Accessories 0.44% Bharti Infratel Ltd. 0.44% Telecom - Services 1.36% Bharti Airtel Ltd. 1.11% Idea Cellular Ltd. 0.25% Transportation 1.07% Adani Ports and Special Economic Zone Ltd. 0.63% Container Corporation Of India Ltd. 0.32% Interglobe Aviation Ltd. 0.12% Short Term Debt and net current assets 1.32% Total Net Assets 100.00%
Returns of ICICI Prudential Nifty 100 iWIN ETF - Growth Option as on - (IPN100ETF)April 30, 2017
ICICI Prudential Nifty 100 iWIN ETF An open-ended Index Exchange Traded Fund
$(RGESS eligible scheme)
Entry load : Nil
RiskometerThis Product is suitable for investors who are seeking*:
• Long term wealth creation solution
• An Exchange Traded Fund that seeks to provide returns that closely correspond to the returns provided by Nifty 100 Index, subject to tracking error.
*Investors should consult their financial advisers if in doubt about whether the product is suitable for them.
Annual Portfolio Turnover Ratio : Equity - 0.21 times, Others (Debt and Derivatives) - 0.00 times Combined Annual Portfolio Turnover Ratio : 0.21 times
Dividend History : Refer page no. from 122 to 130
SIP Returns : Refer page no. from 118 to 120
Total Expense Ratio @@ :
: 0.43% p. a.IPN100ETF
Investment Objective : Refer page no. from 131 to 134
Std Dev (Annualised) : 13.70% Sharpe Ratio : 0.61 Portfolio Beta : 0.99 R squared : 1.00 Benchmark Std Dev (Annualised) : 13.87%
Tracking Error : 0.40%
Notes:1. Different plans shall have different expense structure. The performance details provided herein are of ICICI Prudential Nifty 100 iWIN ETF.2. The scheme is currently managed by Kayzad Eghlim. Mr. Kayzad Eghlim has been managing this fund since Aug 13. Total Schemes managed by the Fund Manager Refer annexure from page no. 91 for performance of other schemes currently managed by Kayzad Eghlim. is 9.3. Date of inception: 20-Aug-13.4. As the Scheme has completed more than 3 year but less than 5 years, the performance details of since inception,1 year and 3 years are provided herein.5. Past performance may or may not be sustained in future and the same may not necessarily provide the basis for comparison with other investment.6. Load is not considered for computation of returns.7. In case, the start/end date of the concerned period is a nonbusiness date (NBD), the NAV of the previous date is considered for computation of returns. The NAV per unit shown in the table is as on the start date of the said period
Scheme
Nifty 50 Index (Additional Benchmark)
NAV (Rs.) Per Unit (as on April 28,2017 : 100.7494)
CAGR (%)
52.9629
Nifty 100 Index (Benchmark)
Since inception
CurrentValue of
Investment of Rs. 10000
CAGR (%) Current Value of
Investment of Rs. 10000
1 Year 3 Year 5 Year
CAGR (%) Current Value of
Investment of Rs. 10000
CAGR (%) Current Value of
Investment of Rs. 10000
82.5731 67.1541 -
Particulars
22.08 12201.24 14.49 15002.72 - - 19.04 19022.64
21.27 12120.64 13.53 14628.14 - - 17.70 18246.08
18.58 11852.59 11.60 13894.11 - - 15.88 17225.10

Quantitative Indicators
Fund Managers :
Kayzad Eghlim(Managing this fund since August 09 &Overall 26 Years of experience)
Indicative Investment Horizon: 5 years and above
Inception/Allotment date: 26-Feb-02
Monthly AAUM as on 30-Apr-17 : Rs. 264.18 crores
Closing AUM as on 30-Apr-17 : Rs. 259.86 crores
NAV (As on 28-Apr-17):IPNIF Growth Option : 89.2320IPNIF Dividend Option : 11.8814IPNIF Direct Plan Growth Option : 90.7359IPNIF Direct Plan Dividend Option : 12.2007
Options :#Growth and Dividend option
(dividend payout*** and re-investment facility available)
Application Amount for freshSubscription :Rs.5,000 (plus in multiples of Re.1)
Min.Addl.Investment :Rs.1,000 (plus in multiples of Re.1)
Exit load for Redemption / Switchout :- Lumpsum & SIP / STP / SWPOptionNil
SIP :##
Monthly Frequency: Rs. 1,000/- and in multiple of Rs. 1/-Quarterly Frequency: Rs. 5,000/- and in multiple of Rs. 1/-
&&SWP :Rs. 500/- and in multiples of Rs. 1/-
STP/ Flex STP/ Value STP * :Daily Frequency: Rs. 250/- and in multiples of Rs. 50/-Weekly, Monthly and Quarterly Frequency: Rs. 1,000/- and in multiples of Rs. 1/-
Min.Redemption Amt. :500/- or all units where amount is below 500/-
Std Dev (Annualised) : 13.89%
Average P/E : 22.76 Average P/BV : 5.33 Average Dividend Yield: 1.38
Sharpe Ratio : 0.46 Portfolio Beta : 1.01
Tracking Error : 0.22%
R squared : 1.00
#Dividend Option is introduced under IPNIF and IPNIF Direct plans with effect from September 07, 2015.Portfolio turnover has been computed as the ratio of the lower value of purchase and sales, to the average net assets in the past one year (since inception for schemes that have not completed a year). The figures are not netted for derivative transactions.Risk-free rate based on the last Overnight MIBOR cut-off of 6.18%Refer Disclaimer of India Index Services & Products Limited (IISL) on page no. 120.@@ Total Expense Ratio is weighted average for the month. Ratio excludes service tax on management fees and includes B-15 clawback reversal, if any.## Minimum number of installments for monthly frequency will be 6 and for Quarterly frequency will be 4. w.e.f February 01, 2017.* Minimum number of installments for daily, weekly and monthly frequency will be 6 and for Quarterly frequency will be 4. w.e.f February 01, 2017. Refer page No. 137 for definition of Flex STP and Value STP.&& Minimum number of installments for both monthly and quarterly will be 2. w.e.f February 01, 2017.*** In case the unit holder has opted for dividend payout option, the minimum amount for dividend payout shall be 100 (net of dividend distribution tax and other statutory levy, if any), else the dividend would be mandatorily reinvested.
63
Fund Details
Portfolio as on April 30, 2017
Returns of ICICI Prudential Nifty Index Fund - Growth Option as on - (IPNIF)April 30, 2017
• Top Ten HoldingsDerivatives are considered at exposure value.
Auto 10.26% Maruti Suzuki India Ltd. 2.43% Tata Motors Ltd. 2.42% Mahindra & Mahindra Ltd. 1.75% Hero Motocorp Ltd. 1.19% Bajaj Auto Ltd. 1.09% Eicher Motors Ltd. 0.98% Tata Motors Ltd. - DVR 0.40% Auto Ancillaries 0.59% Bosch Ltd. 0.59% Banks 25.58% • HDFC Bank Ltd. 8.77% • ICICI Bank Ltd. 4.55% • Kotak Mahindra Bank Ltd. 3.03% • State Bank Of India 2.59% Axis Bank Ltd. 2.43% IndusInd Bank Ltd. 2.04% Yes Bank Ltd. 1.67% Bank Of Baroda 0.50% Cement 3.18% Ultratech Cement Ltd. 1.24% Grasim Industries Ltd. 1.04% Ambuja Cements Ltd. 0.51% ACC Ltd. 0.39% Construction Project 4.03% • Larsen & Toubro Ltd. 4.03% Consumer Non Durables 9.92% • ITC Ltd. 6.62% Hindustan Unilever Ltd. 1.87% Asian Paints Ltd. 1.42% Ferrous Metals 0.85% Tata Steel Ltd. 0.85% Finance 7.76% • HDFC Ltd. 6.84% Indiabulls Housing Finance Ltd. 0.92% Gas 0.76% GAIL (India) Ltd. 0.76% Media & Entertainment 0.81% Zee Entertainment Enterprises Ltd. 0.81% Minerals/Mining 1.01% Coal India Ltd. 1.01% Non - Ferrous Metals 0.82%
Hindalco Industries Ltd. 0.82% Oil 1.48% Oil & Natural Gas Corporation Ltd. 1.48% Petroleum Products 8.79% • Reliance Industries Ltd. 6.48% Indian Oil Corporation Ltd. 1.26% Bharat Petroleum Corporation Ltd. 1.05% Pharmaceuticals 5.04% Sun Pharmaceutical Industries Ltd. 1.99% Lupin Ltd. 0.90% Dr. Reddy's Laboratories Ltd. 0.88% Cipla Ltd. 0.79% Aurobindo Pharma Ltd. 0.48% Power 2.85% Power Grid Corporation Of India Ltd. 1.28% NTPC Ltd. 1.14% Tata Power Company Ltd. 0.43% Software 11.44% • Infosys Ltd. 5.15% • Tata Consultancy Services Ltd. 3.39% HCL Technologies Ltd. 1.29% Wipro Ltd. 0.88% Tech Mahindra Ltd. 0.73% Telecom - Equipment & Accessories 0.52% Bharti Infratel Ltd. 0.52% Telecom - Services 1.32% Bharti Airtel Ltd. 1.32% Transportation 0.74% Adani Ports and Special Economic Zone Ltd. 0.74% Index Futures/Options 1.62% Nifty 50 Index - Futures 1.62% Short Term Debt and net current assets 0.63% Total Net Assets 100.00%
Company/Issuer % to % to NAV NAV Derivatives
Company/Issuer % to % to NAV NAV Derivatives
ICICI Prudential Nifty Index Fund (An Open Ended Index Fund)
Benchmark Std Dev (Annualised) : 13.79%
Entry load : Nil
RiskometerThis Product is suitable for investors who are seeking*:
• Long term wealth creation solution
• An index fund that seeks to track returns by investing in a basket of Nifty 50 Index stocks and aims to achieve returns of the stated index, subject to tracking error.
*Investors should consult their financial advisers if in doubt about whether the product is suitable for them.
Annual Portfolio Turnover Ratio : Equity - 0.26 times, Others (Debt and Derivatives) - 0.76 times Combined Annual Portfolio Turnover Ratio : 1.02 times
Dividend History : Refer page no. from 122 to 130
SIP Returns : Refer page no. from 118 to 120
Total Expense Ratio @@ :
IPNIF : 0.93% p. a.
IPNIF Direct Plan : 0.49% p. a.
Investment Objective : Refer page no. from 131 to 134
Notes:1. Different plans shall have different expense structure. The performance details provided herein are of ICICI Prudential Nifty Index Fund.2. The scheme is currently managed by Kayzad Eghlim. Mr. Kayzad Eghlim has been managing this fund since Aug 09. Total Schemes managed by the Fund Manager Refer annexure from page no. 91 for performance of other schemes currently managed by Kayzad Eghlim. is 9.3. Date of inception: 26-Feb-02.4. Past performance may or may not be sustained in future and the same may not necessarily provide the basis for comparison with other investment.5. Load is not considered for computation of returns.6. In case, the start/end date of the concerned period is a nonbusiness date (NBD), the NAV of the previous date is considered for computation of returns. The NAV per unit shown in the table is as on the start date of the said period
Scheme
NAV (Rs.) Per Unit (as on April 28,2017 : 89.2320)
CAGR (%)
10.0000
Nifty 50 Index (Benchmark)
Since inception
CurrentValue of
Investment of Rs. 10000
CAGR (%) Current Value of
Investment of Rs. 10000
1 Year 3 Year 5 Year
CAGR (%) Current Value of
Investment of Rs. 10000
CAGR (%) Current Value of
Investment of Rs. 10000
75.1016 63.1126 48.9131
Particulars
18.87 11881.50 12.25 14138.54 12.78 18242.97 15.51 89232.00
18.58 11852.59 11.60 13894.11 12.14 17728.25 14.51 78224.74

Quantitative Indicators
Fund Details
Fund Managers :
Kayzad Eghlim(Managing this fund since March 13 &Overall 26 Years of experience)
Indicative Investment Horizon: 5 years and above
Inception/Allotment date : 20-Mar-13
Monthly AAUM as on 30-Apr-17 : Rs. 775.70 crores
Closing AUM as on 30-Apr-17 :Rs. 789.27 crores
Minimum application amount for buy/sale of units:Through Stock Exchange - One unitDirectly with the mutual fund - in creationunit size viz. 50,000 units and in multiplesthereof
Exit load for Redemption / Switch out:- Lumpsum Investment OptionNil
Exchange Listed on:NSE and BSECodes & Symbols:NSE : NIFTYIWINBSE : 537007/NIFTYIWINISIN : INF109K012R6
NAV (As on 28-Apr-17): Rs. 94.7377
Average P/E : 22.76 Average P/BV : 5.33 Average Dividend Yield : 1.38
Portfolio turnover has been computed as the ratio of the lower value of purchase and sales, to the average net assets in the past one year (since inception for schemes that have not completed a year). The figures are not netted for derivative transactions.Refer Disclaimer of India Index Services & Products Limited (IISL)/BSE Limited/National Stock Exchange of India Limited” on page no. 120.$ Rajiv Gandhi Equity Savings SchemeRisk-free rate based on the last Overnight MIBOR cut-off of 6.18%@@ Total Expense Ratio is weighted average for the month. Ratio excludes service tax on management fees and includes B-15 clawback reversal, if any.
64
• Top Ten HoldingsThe AUM/AAUM figures have been adjusted with respect to investments made by other schemes of the Mutual Fund into the aforesaid Scheme. The aggregate value of such inter-scheme investments amounts to Rs. 219.14 Crores
Returns of ICICI Prudential Nifty iWIN ETF - Growth Option as on - (IPNETF)April 30, 2017
Portfolio as on April 30, 2017
Auto 10.48% Maruti Suzuki India Ltd. 2.49% Tata Motors Ltd. 2.47% Mahindra & Mahindra Ltd. 1.78% Hero Motocorp Ltd. 1.22% Bajaj Auto Ltd. 1.12% Eicher Motors Ltd. 1.00% Tata Motors Ltd. - DVR 0.41% Auto Ancillaries 0.60% Bosch Ltd. 0.60% Banks 26.15%• HDFC Bank Ltd. 8.97%• ICICI Bank Ltd. 4.65%• Kotak Mahindra Bank Ltd. 3.09%• State Bank Of India 2.65% Axis Bank Ltd. 2.48% IndusInd Bank Ltd. 2.08% Yes Bank Ltd. 1.71% Bank Of Baroda 0.51% Cement 3.25% Ultratech Cement Ltd. 1.27% Grasim Industries Ltd. 1.07% Ambuja Cements Ltd. 0.52% ACC Ltd. 0.39% Construction Project 4.12%• Larsen & Toubro Ltd. 4.12% Consumer Non Durables 10.14%• ITC Ltd. 6.77% Hindustan Unilever Ltd. 1.92% Asian Paints Ltd. 1.45% Ferrous Metals 0.86% Tata Steel Ltd. 0.86% Finance 7.93%• HDFC Ltd. 6.99% Indiabulls Housing Finance Ltd. 0.94% Gas 0.78% GAIL (India) Ltd. 0.78% Media & Entertainment 0.83% Zee Entertainment Enterprises Ltd. 0.83% Minerals/Mining 1.03% Coal India Ltd. 1.03%
Non - Ferrous Metals 0.83% Hindalco Industries Ltd. 0.83% Oil 1.51% Oil & Natural Gas Corporation Ltd. 1.51% Petroleum Products 8.98%• Reliance Industries Ltd. 6.62% Indian Oil Corporation Ltd. 1.29% Bharat Petroleum Corporation Ltd. 1.07% Pharmaceuticals 5.15% Sun Pharmaceutical Industries Ltd. 2.03% Lupin Ltd. 0.92% Dr. Reddy's Laboratories Ltd. 0.90% Cipla Ltd. 0.81% Aurobindo Pharma Ltd. 0.49% Power 2.92% Power Grid Corporation Of India Ltd. 1.31% NTPC Ltd. 1.17% Tata Power Company Ltd. 0.44% Software 11.70%• Infosys Ltd. 5.27%• Tata Consultancy Services Ltd. 3.47% HCL Technologies Ltd. 1.32% Wipro Ltd. 0.90% Tech Mahindra Ltd. 0.75% Telecom - Equipment & Accessories 0.53% Bharti Infratel Ltd. 0.53% Telecom - Services 1.35% Bharti Airtel Ltd. 1.35% Transportation 0.76% Adani Ports and Special Economic Zone Ltd. 0.76% Short Term Debt and net current assets 0.09% Total Net Assets 100.00%
ICICI Prudential Nifty iWIN ETFAn open-ended Index Exchange Traded Fund
$(RGESS eligible scheme)
Entry load : Nil
RiskometerThis Product is suitable for investors who are seeking*:
• Long term wealth creation solution
• An Exchange Traded Fund that aims to provide returns that closely correspond to the returns provided by Nifty 50 Index, subject to tracking error.
*Investors should consult their financial advisers if in doubt about whether the product is suitable for them.
Annual Portfolio Turnover Ratio : Equity - 0.23 times, Others (Debt and Derivatives) - 0.00 times Combined Annual Portfolio Turnover Ratio : 0.23 times
Std Dev (Annualised) : 13.82% Sharpe Ratio : 0.50 Portfolio Beta : 1.00 R squared : 1.00 Benchmark Std Dev (Annualised) : 13.79% Tracking Error : 0.07%
Company/Issuer % to NAV Company/Issuer % to NAV
Dividend History : Refer page no. from 122 to 130
SIP Returns : Refer page no. from 118 to 120
Total Expense Ratio @@ :
IPNETF : 0.05% p. a.
Investment Objective : Refer page no. from 131 to 134
Notes:1. Different plans shall have different expense structure. The performance details provided herein are of ICICI Prudential Nifty iWIN ETF.2. The scheme is currently managed by Kayzad Eghlim. Mr. Kayzad Eghlim has been managing this fund since March 13. Total Schemes managed by the Fund Manager Refer annexure from page no. 91 for performance of other schemes currently managed by Kayzad Eghlim. is 9.3. Date of inception: 20-Mar-13.4. As the Scheme has completed more than 3 year but less than 5 years, the performance details of since inception,1 year and 3 years are provided herein.5. Past performance may or may not be sustained in future and the same may not necessarily provide the basis for comparison with other investment.6. Load is not considered for computation of returns.7. In case, the start/end date of the concerned period is a nonbusiness date (NBD), the NAV of the previous date is considered for computation of returns. The NAV per unit shown in the table is as on the start date of the said period
Scheme
NAV (Rs.) Per Unit (as on April 28,2017 : 94.7377)
CAGR (%)
57.0270
Nifty 50 Index (Benchmark)
Since inception
CurrentValue of
Investment of Rs. 10000
CAGR (%) Current Value of
Investment of Rs. 10000
1 Year 3 Year 5 Year
CAGR (%) Current Value of
Investment of Rs. 10000
CAGR (%) Current Value of
Investment of Rs. 10000
81.1747 67.7752 -
Particulars
20.02 11995.96 12.85 14367.62 - - 13.91 17075.56
18.58 11852.59 11.60 13894.11 - - 12.69 16338.95

Fund Details
Quantitative Indicators
Company/Issuer % to NAV
Portfolio turnover has been computed as the ratio of the lower value of purchase and sales, to the average net assets in the past one year (since inception for schemes that have not completed a year). The figures are not netted for derivative transactions.Risk-free rate based on the last Overnight MIBOR cut-off of 6.18%Refer Disclaimer of India Index Services & Products Limited (IISL) on page no. 120.@@ Total Expense Ratio is weighted average for the month. Ratio excludes service tax on management fees and includes B-15 clawback reversal, if any.## Minimum number of installments for monthly frequency will be 6 and for Quarterly frequency will be 4. w.e.f February 01, 2017.* Minimum number of installments for daily, weekly and monthly frequency will be 6 and for Quarterly frequency will be 4. w.e.f February 01, 2017. Refer page No. 137 for definition of Flex STP and Value STP.&&
Minimum number of installments for both monthly and quarterly will be 2. w.e.f February 01, 2017.*** In case the unit holder has opted for dividend payout option, the minimum amount for dividend payout shall be 100 (net of dividend distribution tax and other statutory levy, if any), else the dividend would be mandatorily reinvested.
Fund Managers :
Kayzad Eghlim(Managing this fund since inception &Overall 26 Years of experience)
Indicative Investment Horizon: 5 years and above
Inception/Allotment date: 25-Jun-10
Monthly AAUM as on 30-Apr-17 : Rs. 59.08 crores
Closing AUM as on 30-Apr-17 : Rs. 62.25 crores
NAV (As on 28-Apr-17):IPNN50IF Growth Option : 23.2778IPNN50IF Dividend Option : 23.2778IPNN50IF Direct Plan Growth Option : 23.7447IPNN50IF Direct Plan Dividend Option : 23.7383
Options :Growth & Dividend(dividend payout*** and re-investment facility available)
Application Amount for freshSubscription :Rs.5,000 (plus multiples of Re.1/-)
Min.Addl.Investment : Rs.1000/- (plusmultiples of Re.1/-)
Exit load for Redemption / Switchout :- Lumpsum & SIP / STP / SWP OptionUpto 7 Days from allotment - 0.25% ofapplicable NAV, more than 7 Days - Nil
SIP :##
Monthly Frequency: Rs. 1,000/- and in multiple of Rs. 1/-Quarterly Frequency: Rs. 5,000/- and in multiple of Rs. 1/-
&&SWP :Rs. 500/- and in multiples of Rs. 1/-
STP/ Flex STP/ Value STP * :Daily Frequency: Rs. 250/- and in multiples of Rs. 50/-Weekly, Monthly and Quarterly Frequency: Rs. 1,000/- and in multiples of Rs. 1/-
Min.Redemption Amt. :500/- or all units where amount is below 500/-
Std Dev (Annualised) : 15.65% Sharpe Ratio : 1.10
Average P/E : 28.89 Average P/BV : 7.38 Average Dividend Yield : 1.39
Portfolio Beta : 0.97 R squared : 1.00
Portfolio as on April 30, 2017
Returns of ICICI Prudential Nifty Next 50 Index Fund - Growth Option as on - (IPNN50IF)April 30, 2017
Auto 1.75% Ashok Leyland Ltd. 1.75% Auto Ancillaries 3.01%• Motherson Sumi Systems Ltd. 3.01% Banks 1.81% Punjab National Bank 1.81% Cement 2.41% Shree Cements Ltd. 2.41% Chemicals 1.60% Pidilite Industries Ltd. 1.60% Construction 1.20% DLF Ltd. 1.20% Consumer Durables 4.49% Titan Company Ltd. 2.83% Havells India Ltd. 1.66% Consumer Non Durables 17.86%• Godrej Consumer Products Ltd. 3.17%• Britannia Industries Ltd. 3.07% Marico Ltd. 2.35% Dabur India Ltd. 2.33% Colgate - Palmolive (India) Ltd. 1.99% United Spirits Ltd. 1.38% Procter & Gamble Hygiene and Health Care Ltd. 1.00% Emami Ltd. 0.94% Glaxosmithkline Consumer Healthcare Ltd. 0.87% United Breweries Ltd. 0.76% Ferrous Metals 3.88%• JSW Steel Ltd. 2.98% Steel Authority Of India Ltd. 0.90% Finance 18.39%• Bajaj Finserv Ltd. 3.99%• Bajaj Finance Ltd. 3.83%• LIC Housing Finance Ltd. 2.92% Rural Electrification Corporation Ltd. 2.37% Shriram Transport Finance Company Ltd. 2.18% Power Finance Corporation Ltd. 2.01% ICICI Prudential Life Insurance Company Ltd. 1.09% Gas 1.83% Petronet LNG Ltd. 1.83% Industrial Capital Goods 6.88% Bharat Heavy Electricals Ltd. 2.30%
Bharat Electronics Ltd. 1.83% Siemens Ltd. 1.69% ABB India Ltd. 1.08% Industrial Products 1.95% Cummins India Ltd. 1.95% Minerals/Mining 1.45% NMDC Ltd. 1.45% Non - Ferrous Metals 4.83%• Vedanta Ltd. 3.85% Hindustan Zinc Ltd. 0.98% Oil 0.91% Oil India Ltd. 0.91% Pesticides 4.24%• UPL Ltd. 4.24% Petroleum Products 3.85%• Hindustan Petroleum Corporation Ltd. 3.85% Pharmaceuticals 9.43% Piramal Enterprises Ltd. 2.92% Glenmark Pharmaceuticals Ltd. 1.97% Cadila Healthcare Ltd. 1.63% Divi's Laboratories Ltd. 1.16% Torrent Pharmaceuticals Ltd. 1.00% Glaxosmithkline Pharmaceuticals Ltd. 0.76% Power 0.99% NHPC Ltd. 0.99% Software 1.13% Oracle Financial Services Software Ltd. 1.13% Telecom - Services 1.52% Idea Cellular Ltd. 1.52% Transportation 2.68% Container Corporation Of India Ltd. 1.93% Interglobe Aviation Ltd. 0.75% Short Term Debt and net current assets 1.89% Total Net Assets 100.00%
• Top Ten Holdings
65
Tracking Error : 0.59%
ICICI Prudential Nifty Next 50 Index Fund(An Open Ended Index Fund)
Benchmark Std Dev (Annualised) : 16.07%
Entry load : Nil
RiskometerThis Product is suitable for investors who are seeking*:
• Long term wealth creation solution
• An index fund that invests in companies that form part of the Nifty Next 50 Index and aims to achieve returns of the stated index, subject to tracking error.
*Investors should consult their financial advisers if in doubt about whether the product is suitable for them.
Annual Portfolio Turnover Ratio : Equity - 0.54 times, Others (Debt and Derivatives) - 0.00 times Combined Annual Portfolio Turnover Ratio : 0.54 times
Company/Issuer % to NAV
Dividend History : Refer page no. from 122 to 130
SIP Returns : Refer page no. from 118 to 120
Total Expense Ratio @@ :
IPNN50IF : 0.81% p. a.
IPNN50IF Direct Plan : 0.42% p. a.
Investment Objective : Refer page no. from 131 to 134
Notes:1. Different plans shall have different expense structure. The performance details provided herein are of ICICI Prudential Nifty Next 50 Index Fund.2. The scheme is currently managed by Kayzad Eghlim. Mr. Kayzad Eghlim has been managing this fund since inception. Total Schemes managed by the Fund Manager Refer annexure from page no. 91 for performance of other schemes currently managed by Kayzad Eghlim. is 9.3. Date of inception:25-Jun-10.4. Past performance may or may not be sustained in future and the same may not necessarily provide the basis for comparison with other investment.5. Load is not considered for computation of returns.6. In case, the start/end date of the concerned period is a nonbusiness date (NBD), the NAV of the previous date is considered for computation of returns. The NAV per unit shown in the table is as on the start date of the said period
Scheme
Nifty 50 Index (Additional Benchmark)
NAV (Rs.) Per Unit (as on April 28,2017 : 23.2778)
CAGR (%)
10.0000
Nifty Next 50 Index (Benchmark)
Since inception
CurrentValue of
Investment of Rs. 10000
CAGR (%) Current Value of
Investment of Rs. 10000
1 Year 3 Year 5 Year
CAGR (%) Current Value of
Investment of Rs. 10000
CAGR (%) Current Value of
Investment of Rs. 10000
16.8755 12.0279 9.0676
Particulars
38.06 13793.84 24.64 19353.17 20.76 25671.40 13.13 23277.80
36.34 13622.80 24.69 19373.68 20.83 25741.21 13.32 23544.63
18.58 11852.59 11.60 13894.11 12.14 17728.25 8.66 17657.93

66
Style Box Portfolio as on April 30, 2017
RiskometerThis Product is suitable for investors who are seeking*:
• Long term wealth creation solution
• An Exchange Traded Fund that aims to provide returns that closely correspond to the returns provided by Nifty 50 Value 20 Index, Subject to tracking error.
*Investors should consult their financial advisers if in doubt about whether the product is suitable for them.
Benchmark
Nifty 50 Value 20 Index
Note : - “Portfolio Beta, Standard Deviation, R Squared, Sharpe Ratio and Tracking Error of the Scheme is not computed owing to the short time frame since launch of the Scheme.”Portfolio turnover has been computed as the ratio of the lower value of purchase and sales, to the average net assets in the past one year (since inception for schemes that have not completed a year). The figures are not netted for derivative transactions.@@ Total Expense Ratio is weighted average for the month. Ratio excludes service tax on management fees and includes B-15 clawback reversal, if any.
Quantitative Indicators Average P/E : 17.87 Average P/BV : 5.11 Average Dividend Yield : 1.90
• Top Ten HoldingsThe AUM/AAUM figures have been adjusted with respect to investments made by other schemes of the Mutual Fund into the aforesaid Scheme. The aggregate value of such inter-scheme investments amounts to Rs. 6.63 Crores
Annual Portfolio Turnover Ratio : Equity - 0.77 times, Others (Debt and Derivatives) - 0.00 times Combined Annual Portfolio Turnover Ratio : 0.77 times
ICICI Prudential NV20 iWIN ETF(An open-ended Index Exchange Traded Fund)
Company/Issuer % to NAV
Auto 5.53%
Hero Motocorp Ltd. 2.88%
Bajaj Auto Ltd. 2.65%
Banks 28.42%
• ICICI Bank Ltd. 11.01%
• State Bank Of India 6.28%
• Axis Bank Ltd. 5.88%
• Yes Bank Ltd. 4.04%
Bank Of Baroda 1.20%
Consumer Non Durables 4.54%
• Hindustan Unilever Ltd. 4.54%
Ferrous Metals 2.04%
Tata Steel Ltd. 2.04%
Gas 1.85%
GAIL (India) Ltd. 1.85%
Minerals/Mining 2.45%
Coal India Ltd. 2.45%
Oil 3.58%
• Oil & Natural Gas Corporation Ltd. 3.58%
Petroleum Products 17.15%
• Reliance Industries Ltd. 14.60%
Bharat Petroleum Corporation Ltd. 2.54%
Power 2.76%
NTPC Ltd. 2.76%
Software 25.93%
• Infosys Ltd. 12.47%
• Tata Consultancy Services Ltd. 8.21%
HCL Technologies Ltd. 3.12%
Wipro Ltd. 2.12%
Telecom - Services 3.19%
• Bharti Airtel Ltd. 3.19%
Short Term Debt and net current assets 2.57%
Total Net Assets 100.00%
Fund Details
Fund Managers :
Kayzad Eghlim (Managing this fund since June 2016 & Overall 26 Years of experience)
Indicative Investment Horizon: 5 years and above
Inception/Allotment date: 17-June-16
Monthly AAUM as on 30-Apr-17 : Rs. 0.48 crores
Closing AUM as on 30-Apr-17 : Rs. 0.48 crores
NAV (As on 28-Apr-17): Rs. 40.0700
Minimum Application Amount :Through stock exchange – One unitand in multiples thereof Directly with the mutual fund – in creation unit size viz. 25,000 and in multiples thereof
Exit load for Redemption / Switch out:- Lumpsum Investment OptionNil
Exchange Listed on:NSE and BSECodes & Symbols:NSE: NV20IWINBSE: 539945/NV20IWINISIN: INF109KB1WY5
Entry load : Nil
Dividend History : Refer page no. from 122 to 130
SIP Returns : Refer page no. from 118 to 120
Total Expense Ratio @@ :
IPNV20ETF : 0.45% p. a.
Investment Objective : Refer page no. from 131 to 134

67
Fund Details
Quantitative Indicators
Fund Managers :
Kayzad Eghlim(Managing this fund since August 09 &Overall 26 Years of experience)
Indicative Investment Horizon: 5 years and above
Inception/Allotment date: 10-Jan-03
Monthly AAUM as on 30-Apr-17 : Rs. 5.26 crores
Closing AUM as on 30-Apr-17 : Rs. 4.66 crores
NAV (As on 28-Apr-17): Rs. 309.2325
Minimum application amount for buy/sale of units:Through Stock Exchange - One unitDirectly with the mutual fund - in creationunit size viz. 10,000 units and in multiplesthereof
*Exit load for Redemption / Switch out:- Lumpsum Investment OptionNil
Exchange Listed on:NSE and BSECodes & Symbols:NSE : SENSEXIWINBSE : 555555/SENSEXIWINISIN : INF346A01034
Portfolio turnover has been computed as the ratio of the lower value of purchase and sales, to the average net assets in the past one year (since inception for schemes that have not completed a year). The figures are not netted for derivative transactions.Risk-free rate based on the last Overnight MIBOR cut-off of 6.18%Refer Disclaimer of NSE and BSE on page no. 120.@@ Total Expense Ratio is weighted average for the month. Ratio excludes service tax on management fees and includes B-15 clawback reversal, if any.
Std Dev (Annualised) : 13.46% Sharpe Ratio : 0.41
Average P/E : 20.98 Average P/BV : 5.52 Average Dividend Yield : 1.44
Portfolio Beta : 0.99 R squared : 1.00
• Top Ten Holdings
Portfolio as on April 30, 2017
Returns of ICICI Prudential Sensex iWIN ETF - Growth Option as on - (IPSETF)April 30, 2017
Auto 11.50%
• Tata Motors Ltd. 3.19%
Maruti Suzuki India Ltd. 3.13%
Mahindra & Mahindra Ltd. 2.24%
Hero Motocorp Ltd. 1.53%
Bajaj Auto Ltd. 1.41%
Banks 23.49%
• HDFC Bank Ltd. 11.24%
• ICICI Bank Ltd. 5.84%
• State Bank Of India 3.33%
Axis Bank Ltd. 3.08%
Construction Project 5.06%
• Larsen & Toubro Ltd. 5.06%
Consumer Non Durables 12.76%
• ITC Ltd. 8.54%
Hindustan Unilever Ltd. 2.40%
Asian Paints Ltd. 1.82%
Ferrous Metals 1.09%
Tata Steel Ltd. 1.09%
Finance 8.79%
• HDFC Ltd. 8.79%
Gas 0.96%
GAIL (India) Ltd. 0.96%
Minerals/Mining 1.24%
Coal India Ltd. 1.24%
Oil 1.81%
Oil & Natural Gas Corporation Ltd. 1.81%
Petroleum Products 8.32%
• Reliance Industries Ltd. 8.32%
Pharmaceuticals 5.82%
Sun Pharmaceutical Industries Ltd. 2.50%
Lupin Ltd. 1.16%
Dr. Reddy's Laboratories Ltd. 1.15%
Cipla Ltd. 1.02%
Power 3.11%
Power Grid Corporation Of India Ltd. 1.65%
NTPC Ltd. 1.46%
Software 12.11%
• Infosys Ltd. 6.63%
• Tata Consultancy Services Ltd. 4.36%
Wipro Ltd. 1.13%
Telecom - Services 1.69%
Bharti Airtel Ltd. 1.69%
Transportation 1.05%
Adani Ports and Special Economic Zone Ltd. 1.05%
Short Term Debt and net current assets 1.21%
Total Net Assets 100.00%
Tracking error : 4.33%
* Exit Load : Investors, other than Authorised Participants, can sell units in less than Creation Unit Size of the Scheme directly to the Mutual Fund in the following cases:• if the traded price of the ETF units is at a discount of more than 3% to the NAV for continuous 30 days; or • if discount of bid price to applicable NAV is more than 3% over a period of 7 consecutive trading days; or• if no quotes are available on exchange for 3 consecutive trading days; or• when the total bid size on the exchange(s) is less than half of creation unit size daily, averaged over a period of 7 consecutive trading days.Under these circumstances, investors, as specified above, can redeem units of the Scheme directly with the fund house without any payment of exit load.
ICICI Prudential Sensex iWIN ETFAn open-ended exchange listed index linked growth scheme
$(RGESS eligible scheme)
Tracking Error: 4.34%Benchmark Std Dev (Annualised) : 13.54%
Entry load : Nil
RiskometerThis Product is suitable for investors who are seeking*:
• Long term wealth creation solution
• An Exchange Traded Fund that aims to provide returns that closely correspond to the returns of the securities represented by S&P BSE SENSEX, subject to tracking error.
*Investors should consult their financial advisers if in doubt about whether the product is suitable for them.
Annual Portfolio Turnover Ratio : Equity - 2.47 times, Others (Debt and Derivatives) - 0.00 times Combined Annual Portfolio Turnover Ratio : 2.47 times
Company/Issuer % to NAV Company/Issuer % to NAV
Dividend History : Refer page no. from 122 to 130
SIP Returns : Refer page no. from 118 to 120
Total Expense Ratio @@ :
IPSETF : 0.08% p. a.
Investment Objective : Refer page no. from 131 to 134
Notes:1. Different plans shall have different expense structure. The performance details provided herein are of ICICI Prudential Sensex iWIN ETF.2. The scheme is currently managed by Kayzad Eghlim. Mr. Kayzad Eghlim has been managing this fund since Aug 09. Total Schemes managed by the Fund Manager Refer annexure from page no. 91 for performance of other schemes currently managed by Kayzad Eghlim. is 9.3. Date of inception:10-Jan-03.4. Past performance may or may not be sustained in future and the same may not necessarily provide the basis for comparison with other investment.5. Load is not considered for computation of returns.6. In case, the start/end date of the concerned period is a nonbusiness date (NBD), the NAV of the previous date is considered for computation of returns. The NAV per unit shown in the table is as on the start date of the said period
Scheme
Nifty 50 Index (Additional Benchmark)
NAV (Rs.) Per Unit (as on April 28,2017 : 309.2325)
CAGR (%)
33.5900
S&P BSE SENSEX (Benchmark)
Since inception
CurrentValue of
Investment of Rs. 10000
CAGR (%) Current Value of
Investment of Rs. 10000
1 Year 3 Year 5 Year
CAGR (%) Current Value of
Investment of Rs. 10000
CAGR (%) Current Value of
Investment of Rs. 10000
261.9422 246.5980 185.9921
Particulars
18.11 11805.37 11.43 13831.86 12.90 18338.99 17.59 101545.34
16.89 11683.85 10.11 13345.82 11.56 17275.09 16.52 89069.63
18.58 11852.59 11.60 13894.11 12.14 17728.25 16.24 86128.67

68
Style Box Portfolio as on April 30, 2017
RiskometerThis Product is suitable for investors who are seeking*:
• Long term wealth creation solution
• An Exchange Traded Fund that seeks to provide returns that closely correspond to the returns provided by S&P BSE Midcap Select Index, Subject to tracking error.
*Investors should consult their financial advisers if in doubt about whether the product is suitable for them.
Benchmark
S&P BSE Midcap Select Index
Note : - “Portfolio Beta, Standard Deviation, R Squared, Sharpe Ratio and Tracking Error of the Scheme is not computed owing to the short time frame since launch of the Scheme.”Portfolio turnover has been computed as the ratio of the lower value of purchase and sales, to the average net assets in the past one year (since inception for schemes that have not completed a year). The figures are not netted for derivative transactions.@@ Total Expense Ratio is weighted average for the month. Ratio excludes service tax on management fees and includes B-15 clawback reversal, if any.
Quantitative Indicators Average P/E : 24.22 Average P/BV : 6.17 Average Dividend Yield : 1.40
• Top Ten HoldingsThe AUM/AAUM figures have been adjusted with respect to investments made by other schemes of the Mutual Fund into the aforesaid Scheme. The aggregate value of such inter-scheme investments amounts to Rs. 7.64 Crores
Annual Portfolio Turnover Ratio : Equity - 0.81 times, Others (Debt and Derivatives) - 0.00 times Combined Annual Portfolio Turnover Ratio : 0.81 times
ICICI Prudential Midcap Select iWIN ETF(An Open-ended Index Exchange Traded Fund)
Company/Issuer % to NAV
Auto 2.71% Ashok Leyland Ltd. 2.71% Auto Ancillaries 7.63%• MRF Ltd. 3.65% Exide Industries Ltd. 2.35% Amara Raja Batteries Ltd. 1.63% Chemicals 2.56% Tata Chemicals Ltd. 2.56% Consumer Durables 4.41% Havells India Ltd. 2.55% Rajesh Exports Ltd. 1.86% Consumer Non Durables 6.70%• Marico Ltd. 3.62% Colgate - Palmolive (India) Ltd. 3.08% Ferrous Metals 4.61%• JSW Steel Ltd. 4.61% Finance 22.90%• Indiabulls Housing Finance Ltd. 6.85%• Bajaj Finserv Ltd. 6.14%• LIC Housing Finance Ltd. 4.51% Shriram Transport Finance Company Ltd. 3.34% Mahindra & Mahindra Financial Services Ltd. 2.05% Gas 3.54%• Petronet LNG Ltd. 3.54% Healthcare Services 2.10% Apollo Hospitals Enterprise Ltd. 2.10% Industrial Capital Goods 2.27% Bharat Electronics Ltd. 2.27% Industrial Products 6.15% Bharat Forge Ltd. 3.13% Cummins India Ltd. 3.02% Pesticides 6.36%• UPL Ltd. 6.36% Petroleum Products 5.94%• Hindustan Petroleum Corporation Ltd. 5.94% Pharmaceuticals 9.40%• Piramal Enterprises Ltd. 4.60% Glenmark Pharmaceuticals Ltd. 3.02% Divi's Laboratories Ltd. 1.78% Power 5.20% Tata Power Company Ltd. 3.39% Reliance Infrastructure Ltd. 1.81% Software 1.75% Oracle Financial Services Software Ltd. 1.75% Textile Products 1.83% Page Industries Ltd. 1.83% Transportation 2.85% Container Corporation Of India Ltd. 2.85% Short Term Debt and net current assets 1.09% Total Net Assets 100.00%
Fund Details
Fund Managers :
Kayzad Eghlim (Managing this fund since July 2016 & Overall 26 Years of experience)
Indicative Investment Horizon: 5 years and above
Inception/Allotment date: 04-July-16
Monthly AAUM as on 30-Apr-17 : Rs. 1.24 crores
Closing AUM as on 30-Apr-17 : Rs. 1.28 crores
NAV (As on 28-Apr-17): Rs. 64.4200
Minimum Application Amount :Through stock exchange – One unit and in multiples thereof Directly with the mutual fund – in creation unit size viz. 50,000 andin multiples thereof
Exit load for Redemption / Switch out:- Lumpsum Investment OptionNil
Exchange Listed on:NSE and BSECodes & Symbols:NSE: MIDCAPIWINBSE: 539980/MIDCAPIWIN ISIN: INF109KB1XT3
Entry load : Nil
Dividend History : Refer page no. from 122 to 130
SIP Returns : Refer page no. from 118 to 120
Total Expense Ratio @@ :
MIDETF : 0.45% p. a.
Investment Objective : Refer page no. from 131 to 134

Fund Managers :
Fund Details
Portfolio as on April 30, 2017
Company/Issuer % to NAV
Quantitative Indicators
@ Benchmark against domestic price of gold as derived from the LBMA AM Fixing prices.
@@ Total Expense Ratio is weighted average for the month. Ratio excludes service tax on management fees and includes B-15 clawback reversal, if any.
Manish Banthia (Managing this fund since Sep, 2012 & Overall 13 years of experience)
Indicative Investment Horizon:5 years & more
Inception/Allotment date: 24-Aug-10
Monthly AAUM as on 30-Apr-17 : Rs. 109.26 crores
Closing AUM as on 30-Apr-17 : Rs. 108.75 crores
NAV (As on 28-Apr-17): Rs. 272.8940
Minimum application amount for buy/sale of units:Through the Stock Exchange - One unit(One Unit - apprx 1gm Gold)Directly with the mutual fund - 10,000units (One Unit - apprx 1/10th of 1 gram of Gold)
Exit load for Redemption / Switchout :- Lumpsum & SIP / STP / SWP OptionNil
Exchange Listed on:NSE and BSECodes & Symbols:NSE : GOLDIWINBSE : 533244/GOLDIWINISIN : INF109K01FV4
69
Returns of ICICI Prudential Gold iWIN ETF - Growth Option as on April 30, 2017 - (IPGETF)
Tracking Error (Annualised) : 0.10%
Tracking error : 0.10%
Gold 99.13%
Gold (995 Purity) 99.13%
Short Term Debt and net current assets 0.87%
Total Net Assets 100.00%
ICICI Prudential Gold iWIN ETF(An Open ended Exchange Traded Fund)
Entry load : Nil
RiskometerThis Product is suitable for investors who are seeking*:
• Long term wealth creation solution
• A Gold exchange traded fund that seeks to provide investment returns that closely track domestic prices of Gold, subject to tracking error.
*Investors should consult their financial advisers if in doubt about whether the product is suitable for them.
Dividend History : Refer page no. from 122 to 130
SIP Returns : Refer page no. from 118 to 120
Total Expense Ratio @@ :
IPGETF : 0.91% p. a.
Investment Objective : Refer page no. from 131 to 134
Notes:1. Different plans shall have different expense structure. The performance details provided herein are of ICICI Prudential Gold iWIN ETF.2. The scheme is currently managed by Manish Banthia. Mr. has been managing this fund since . Total Schemes managed by the Fund Manish Banthia Sep 2012Manager . Refer annexure from page no. 91 for performance of other schemes currently managed by . is 19 (5 are jointly managed) Manish Banthia3. Date of inception: 24-Aug-10.4. Past performance may or may not be sustained in future and the same may not necessarily provide the basis for comparison with other investment.5. Load is not considered for computation of returns.6. In case, the start/end date of the concerned period is a nonbusiness date (NBD), the NAV of the previous date is considered for computation of returns. The NAV per unit shown in the table is as on the start date of the said period
Scheme
NAV (Rs.) Per Unit (as on April 28,2017 : 272.8940)
CAGR (%)
1892.4600
LBMA AM Fixing Prices (Benchmark)
Since inception
CurrentValue of
Investment of Rs. 10000
CAGR (%) Current Value of
Investment of Rs. 10000
1 Year 3 Year 5 Year
CAGR (%) Current Value of
Investment of Rs. 10000
CAGR (%) Current Value of
Investment of Rs. 10000
2866.9993 2697.6413 2882.3190
Particulars
-4.83 9518.45 0.39 10116.02 -1.09 9467.86 5.63 14420.07
-3.90 9610.84 1.32 10400.63 -0.17 9916.73 6.72 15443.99

Fund Details
Portfolio as on April 30, 2017
For Schemes which have discontinued fresh subscriptions with effect from October 01,2012,the dividend declared will be compulsorily paid out under the “dividend payout “option.“Investors may please note that they will be bearing the expenses of the relevant fund of fund scheme in addition to the expenses of the underlying schemes in which the fund of fund scheme makes investment.”@@ Total Expense Ratio is weighted average for the month. Ratio excludes service tax on management fees and includes B-15 clawback reversal, if any.## Minimum number of installments for monthly frequency will be 6 and for Quarterly frequency will be 4. w.e.f February 01, 2017.* Minimum number of installments for daily, weekly and monthly frequency will be 6 and for Quarterly frequency will be 4. w.e.f February 01, 2017. Refer page No. 137 for definition of Flex STP and Value STP.&& Minimum number of installments for both monthly and quarterly will be 2. w.e.f February 01, 2017.*** In case the unit holder has opted for dividend payout option, the minimum amount for dividend payout shall be 100 (net of dividend distribution tax and other statutory levy, if any), else the dividend would be mandatorily reinvested.
Fund Managers :
Manish Banthia (Managing this fund since Sep, 2012 & Overall 13 years of experience)
Indicative Investment Horizon:5 years and above
Inception/Allotment date: 11-Oct-11
Monthly AAUM as on 30-Apr-17 : Rs. 55.33 crores
Closing AUM as on 30-Apr-17 : Rs. 54.84 crores
Options :Growth and Dividend(dividend payout*** and re-investment facility available)
Dividend facility :Payout and Reinvestment.
Min. Application Amount for freshSubscription :Rs.5,000 and in multiples of Re. 1thereafter
Min. Additional Investment :Rs.1,000 and in multiples of Re. 1thereafter
Exit load for Redemption / Switchout :- Lumpsum & SIP / STP / SWP OptionUpto 15 Months from allotment - 2% ofapplicable NAV, more than 15 Months- Nil
Cut off time (Purchase, Switch &Redemption) :3.00 pm
Benchmark : Domestic Gold Price
SIP :##
Monthly Frequency: Rs. 1,000/- and in multiple of Rs. 1/-Quarterly Frequency: Rs. 5,000/- and in multiple of Rs. 1/-
&&SWP :Rs. 500/- and in multiples of Rs. 1/-
STP/ Flex STP/ Value STP * :Daily Frequency: Rs. 250/- and in multiples of Rs. 50/-Weekly, Monthly and Quarterly Frequency: Rs. 1,000/- and in multiples of Rs. 1/-
Redemption :Generally T+3 at specified RBI locations500/- or all units where amount is below 500/-
70
Returns of ICICI Prudential Regular Gold Savings Fund - Growth Option as on April 30, 2017 - (IPRGSF)
NAV (As on 28-Apr-17):IPRGSF Growth Option : 10.3393IPRGSF Dividend Option : 10.3393IPRGSF Direct Plan Growth Option : 10.4347IPRGSF Direct Plan Dividend Option : 10.4351
ICICI Prudential Regular Gold Savings Fund(An Open Ended Fund of Funds Scheme investing in Gold iWIN ETF)
Company/Issuer % to NAV
Mutual Fund 100.00%
ICICI Prudential Gold iWIN ETF 100.00%
Short Term Debt and net current assets ^
Total Net Assets 100.00%
Entry load : Nil
RiskometerThis Product is suitable for investors who are seeking*:
• Long term wealth creation solution • A fund of funds scheme with the primary objective to generate returns by investing in units of ICICI Prudential Gold iWIN ETF.
*Investors should consult their financial advisers if in doubt about whether the product is suitable for them.
Dividend History : Refer page no. from 122 to 130
SIP Returns : Refer page no. from 118 to 120
Total Expense Ratio @@ :
IPRGSF : 0.50% p. a.
IPRGSF Direct Plan : 0.09% p. a.
Investment Objective : Refer page no. from 131 to 134
Notes:1. Different plans shall have different expense structure. The performance details provided herein are of ICICI Prudential Regular Gold Savings Fund.2. The scheme is currently managed by Manish Banthia. Mr. has been managing this fund since . Total Schemes managed by the Fund Manish Banthia Sep 2012Manager . Refer annexure from page no. 91 for performance of other schemes currently managed by . is 19 (5 are jointly managed) Manish Banthia3. Date of inception: 11-Oct-11.4. Past performance may or may not be sustained in future and the same may not necessarily provide the basis for comparison with other investment.5. Load is not considered for computation of returns.6. In case, the start/end date of the concerned period is a nonbusiness date (NBD), the NAV of the previous date is considered for computation of returns. The NAV per unit shown in the table is as on the start date of the said period
Scheme
NAV (Rs.) Per Unit (as on April 28,2017 : 10.3393)
CAGR (%)
10.0000
LBMA AM Fixing Prices (Benchmark)
Since inception
CurrentValue of
Investment of Rs. 10000
CAGR (%) Current Value of
Investment of Rs. 10000
1 Year 3 Year 5 Year
CAGR (%) Current Value of
Investment of Rs. 10000
CAGR (%) Current Value of
Investment of Rs. 10000
10.5076 10.6929 10.7170
Particulars
-1.61 9839.83 -1.12 9669.31 -0.72 9647.57 0.60 10339.30
-3.90 9610.84 1.32 10400.63 -0.17 9916.73 1.63 10936.82
^ Value Less than 0.01% of NAV.

71
• Top Ten Holdings@Short Term < 8 Years, Long Term > 8 Years.
^^ CRISIL has rated AA and company has put a withdrawal request for the CRISIL rating.
Style Box
Fund Details
Quantitative Indicators – Debt Component
Quantitative Indicators – Equity Component
Average Maturity : 9.75 Years Modified Duration : 5.74 Years Yield To Maturity : 8.56%
Average P/E : 29.89 Average P/B : 8.11 Average Dividend Yield : 0.70
Portfolio turnover has been computed as the ratio of the lower value of purchase and sales, to the average net assets in the past one year (since inception for schemes that have not completed a year). The figures are not netted for derivative transactions.Risk-free rate based on the last Overnight MIBOR cut-off of 6.18%# Automatic Withdrawal Plan (AWP) feature will allow investors to redeem a fixed sum of money periodically at the prevailing Net Asset Value (NAV) depending on the option chosen by the investor. For more details of this feature, Investors are requested to visit the website of the AMC viz., www.icicipruamc.com**In addition to the fund manager managing this fund, the ADR/GDR exposure is managed by Mr. Ihab Dalwai.@@ Total Expense Ratio is weighted average for the month. Ratio excludes service tax on management fees and includes B-15 clawback reversal, if any.##
Minimum number of installments for monthly frequency will be 6 and for Quarterly frequency will be 4. w.e.f February 01, 2017.* Minimum number of installments for daily, weekly and monthly frequency will be 6 and for Quarterly frequency will be 4. w.e.f February 01, 2017. Refer page No. 137 for definition of Flex STP and Value STP.&&
Minimum number of installments for both monthly and quarterly will be 2. w.e.f February 01, 2017.*** In case the unit holder has opted for dividend payout option, the minimum amount for dividend payout shall be 100 (net of dividend distribution tax and other statutory levy, if any), else the dividend would be mandatorily reinvested.
Equity
Exit load for Redemption / Switch out :-#Lumpsum & SIP / STP / SWP / AWP
Fund Managers** :
Indicative Investment Horizon: 3 years & above
Inception/Allotment date: 30-Mar-04
NAV (As on 28-Apr-17):IPMIP25 Growth Option : 36.9664IPMIP25 Dividend Option : 14.0381IPMIP25 Direct Plan Growth Option : 38.1829IPMIP25 Direct Plan Dividend Option : 15.1690
&&SWP :
Rs. 500/- and in multiples of Rs. 1/-
STP/ Flex STP/ Value STP * :Daily Frequency: Rs. 250/- and in multiples of Rs. 50/-Weekly, Monthly and Quarterly Frequency: Rs. 1,000/- and in multiples of Rs. 1/-
Equity : Rajat Chandak(Managing this fund since Feb, 2015 &Overall 8 years of experience)Debt : Manish Banthia (Managing this fund since Sep, 2013 & Overall 13 years of experience)
Application Amount for freshSubscription :Rs.5,000 (plus in multiples of Re.1)
Options : Growth / Growth AEP (Regularand Appreciation), Dividend (Monthly, Quarterly and Half-yearly).(dividend payout*** and re-investmentfacility available)
Min.Addl.Investment :
Rs.500/- & in multiples thereof
Upto 10% of units within 1 Year from the date of allotment - Nil More than 10% of units within 1 Year from the date of allotment - 1% of applicable Net Asset Value (NAV) After 1 Year from the date of allotment - Nil w.e.f. 10th November 2016.
##SIP :Monthly Frequency: Rs. 1,000/- and in multiple of Rs. 1/-Quarterly Frequency: Rs. 5,000/- and in multiple of Rs. 1/-
Min.Redemption Amt. :
500/- or all units where amount is below 500/-
Monthly AAUM as on 30-Apr-17 :Rs. 1288.45 crores
Closing AUM as on 30-Apr-17 : Rs. 1305.51 crores
Portfolio as on April 30, 2017
Returns of ICICI Prudential MIP 25 - Growth Option as on April 30, 2017 - (IPMIP25)
Equity
Equity Shares 25.30% Auto 2.60% Maruti Suzuki India Ltd. 1.47% TVS Motor Company Ltd. 1.12% Auto Ancillaries 1.46% Motherson Sumi Systems Ltd. 1.46% Banks 4.87% HDFC Bank Ltd. 1.32% State Bank Of India 0.82% ICICI Bank Ltd. 0.73% Axis Bank Ltd. 0.72% Oriental Bank Of Commerce 0.66% IndusInd Bank Ltd. 0.61% Cement 1.20% JK Lakshmi Cement Ltd. 0.93% Prism Cement Ltd. 0.27% Construction 0.92% KNR Constructions Ltd. 0.92% Construction Project 0.57% Larsen & Toubro Ltd. 0.57% Consumer Non Durables 3.03% Britannia Industries Ltd. 1.17% ITC Ltd. 0.81% Hindustan Unilever Ltd. 0.53% Colgate - Palmolive (India) Ltd. 0.52% Ferrous Metals 0.23% Steel Authority Of India Ltd. 0.23% Finance 3.20% Bajaj Finserv Ltd. 0.83% Bharat Financial Inclusion Ltd. 0.74% Sundaram Finance Ltd. 0.55% Equitas Holdings Ltd. 0.54% HDFC Ltd. 0.53% Industrial Products 0.48% Astral Poly Technik Ltd. 0.48% Media & Entertainment 1.68% PVR Ltd. 1.33% D.B. Corp Ltd. 0.35% Pharmaceuticals 2.33% Natco Pharma Ltd. 0.93% Cipla Ltd. 0.58% IPCA Laboratories Ltd. 0.45% Lupin Ltd. 0.37% Retailing 0.60% Avenue Supermarts Ltd. 0.60% Software 0.48% Tech Mahindra Ltd. 0.48% Textile Products 1.35% SRF Ltd. 0.70% Page Industries Ltd. 0.66% Transportation 0.31% Spicejet Ltd. 0.31%
Company/Issuer Rating % to NAV
Debt
Debt Holdings 72.59%@
Government Securities - Long Term 36.15%• 07.61% GOI 2030 SOV 17.37%• 07.88% GOI 2030 SOV 9.88%• 08.13% GOI 2045 SOV 6.10% 07.73% GOI 2034 SOV 1.57% 08.77% Uttar Pradesh SDL 2031 SOV 0.83% 08.17% GOI 2044 SOV 0.25% 06.79% GOI 2029 SOV 0.15% Corporate Securities 34.20%• Vedanta Ltd. CRISIL AA 7.68%• Reliance Utilities & Power Private Ltd. CRISIL AAA 4.75%• ICICI Bank Ltd. ICRA AAA 4.55%• Tata Steel Ltd. BWR AA 3.96%• Vodafone Mobile Services Ltd.^^ FITCH AAA 3.56%• IDBI Bank Ltd. ICRA A+ 2.73%• Jindal Steel & Power Ltd. CRISIL D 2.59% Mahanagar Telephone Nigam Ltd. CRISIL AAA 1.18% Reliance Gas Transporation Infrastructure Ltd. CRISIL AAA 1.16% Reliance Ports & Terminals Ltd. CRISIL AAA 0.75% The Indian Hotels Company Ltd. ICRA AA 0.41% Nuclear Power Corporation of India Ltd. CRISIL AAA 0.40% Power Grid Corporation Of India Ltd. CRISIL AAA 0.40% NHPC Ltd. FITCH AAA 0.08% Shriram Transport Finance Company Ltd. CRISIL AA+ 0.02% Cash, Call, CBLO & Term Deposits 2.24% Net Current Assets 2.11% Total Net Assets 100.00%
Company/Issuer Rating % to NAV
ICICI Prudential MIP 25(An Open Ended Income Scheme. Monthly income is not assured and is subject to the availability of distributable surplus.)
Entry load : Nil
Std Dev (Annualised) : 5.33% Sharpe Ratio : 1.33 Portfolio Beta : 1.30 R squared : 0.82 Benchmark Std Dev (Annualised) : 3.72%
RiskometerThis Product is suitable for investors who are seeking*:
• Medium to Long term regular income solution
• A hybrid fund that aims to generate regular income through investments primarily in debt and money market instruments and long term capital appreciation by investing a portion in equity.
*Investors should consult their financial advisers if in doubt about whether the product is suitable for them.
Annual Portfolio Turnover Ratio : Equity - 0.14 times, Others (Debt and Derivatives) - 1.51 times Combined Annual Portfolio Turnover Ratio : 1.65 times
Unrated also include D Rating
Rating Profile (as % of debt component)
Dividend History : Refer page no. from 122 to 130
SIP Returns : Refer page no. from 118 to 120
Total Expense Ratio @@ :
IPMIP25 : 2.09% p. a.
IPMIP25 Direct Plan : 1.46% p. a.
Investment Objective : Refer page no. from 131 to 134
Notes:1. Different plans shall have different expense structure. The performance details provided herein are of ICICI Prudential MIP 25.2. The scheme is currently managed and Manish Banthia. Mr. has been managing this fund since Feb 2015. Total Schemes managed Rajat Chandak Rajat Chandakby the Fund Manager . Refer annexure from page no. 91 for performance of other schemes currently managed by(Equity) is 9 (5 are jointly managed) Rajat Chandak.Mr. Manish Banthia has been managing this fund since Sep 2013. Total Schemes managed by the Fund Manager . Refer (Debt) is 19 (5 are jointly managed)annexure from page no. 91 for performance of other schemes currently managed by Manish Banthia. 3. Date of inception: 30-Mar-04 .4. Past performance may or may not be sustained in future and the same may not necessarily provide the basis for comparison with other investment.5. Load is not considered for computation of returns.6. In case, the start/end date of the concerned period is a nonbusiness date (NBD), the NAV of the previous date is considered for computation of returns. The NAV per unit shown in the table is as on the start date of the said period
Scheme
10 Year G Sec (Additional Benchmark)
NAV (Rs.) Per Unit (as on April 28,2017 : 36.9664)
CAGR (%)
10.0000
Crisil MIP Blended Index (Benchmark)
Since inception
CurrentValue of
Investment of Rs. 10000
CAGR (%) Current Value of
Investment of Rs. 10000
1 Year 3 Year 5 Year
CAGR (%) Current Value of
Investment of Rs. 10000
CAGR (%) Current Value of
Investment of Rs. 10000
31.9577 24.9897 20.8989
Particulars
15.72 11567.29 13.96 14792.65 12.09 17688.20 10.51 36966.40
11.42 11138.53 11.17 13736.77 9.85 15994.17 8.07 27599.23
9.64 10961.31 10.76 13584.03 8.51 15038.07 5.63 20491.68
22.52%
16.15%
3.65%
3.46%
48.40%
5.82%
0% 10% 20% 30% 40% 50% 60%
AAA and Equivalent
AA and Equivalent
A and Equivalent
Unrated
Sovereign Securities
CBLO & Current Assets

72
Fund Details
Quantitative Indicators – Equity Component
Equity
Debt
Style Box
Fund Managers** :
Indicative Investment Horizon:18 months and above
Inception/Allotment date: 10-Nov-00
Monthly AAUM as on 30-Apr-17 :Rs. 335.46 crores
Closing AUM as on 30-Apr-17 : Rs. 337.74 crores
NAV (As on 28-Apr-17):IPMIP Growth Option : 45.2666IPMIP Dividend Option : 12.5994IPMIP Direct Plan Growth Option : 46.4987IPMIP Direct Plan Dividend Option : 12.9570
Options :1. Growth2. AEP (Appreciation & Regular)3. Dividend (Monthly, Quarterly & Half Yearly)(dividend payout*** and re-investment facility available)
Application Amount for freshSubscription :a) Growth : Rs.5,000b) Dividend & AEP : Rs.25,000 (plus multiplesof Re.1)
Min.Addl.Investment :Rs.500/- & in multiples thereof under eachoption
Exit load for Redemption / Switch out:- Lumpsum & SIP / STP / SWP OptionUpto 1 Year from allotment - 1% of applicableNAV, more than 1 Year - Nil
##SIP :Monthly Frequency: Rs. 1,000/- and in multiple of Rs. 1/-Quarterly Frequency: Rs. 5,000/- and in multiple of Rs. 1/-
&&SWP :Rs. 500/- and in multiples of Rs. 1/-STP/ Flex STP/ Value STP * :Daily Frequency: Rs. 250/- and in multiples of Rs. 50/-Weekly, Monthly and Quarterly Frequency: Rs. 1,000/- and in multiples of Rs. 1/-
Min.Redemption Amt. :500/- or all units where amount is below 500/-
Portfolio turnover has been computed as the ratio of the lower value of purchase and sales, to the average net assets in the past one year (since inception for schemes that have not completed a year). The figures are not netted for derivative transactions.Risk-free rate based on the last Overnight MIBOR cut-off of 6.18%**In addition to the fund manager managing this fund, the ADR/GDR exposure is managed by Mr. Ihab Dalwai.@@ Total Expense Ratio is weighted average for the month. Ratio excludes service tax on management fees and includes B-15 clawback reversal, if any.## Minimum number of installments for monthly frequency will be 6 and for Quarterly frequency will be 4. w.e.f February 01, 2017.* Minimum number of installments for daily, weekly and monthly frequency will be 6 and for Quarterly frequency will be 4. w.e.f February 01, 2017. Refer page No. 137 for definition of Flex STP and Value STP.&& Minimum number of installments for both monthly and quarterly will be 2. w.e.f February 01, 2017.*** In case the unit holder has opted for dividend payout option, the minimum amount for dividend payout shall be 100 (net of dividend distribution tax and other statutory levy, if any), else the dividend would be mandatorily reinvested.
Average Maturity : 8.06 Years Modified Duration : 5.19 Years Yield To Maturity : 8.80%
Average P/E : 29.70 Average P/BV : 6.84 Average Dividend Yield : 0.65
• Top Ten Holdings@Short Term < 8 Years, Long Term >8 Years
Portfolio as on April 30, 2017
Returns of ICICI Prudential Monthly Income Plan - Growth Option as on April 30, 2017 - (IPMIP)
Company/Issuer Rating % to NAV
Company/Issuer Rating % to NAV
ICICI Prudential Monthly Income Plan(An Open Ended Income Scheme. Monthly income is not assuredand is subject to the availability of distributable surplus.)
Equity Shares 14.23%
Auto 2.04%
Maruti Suzuki India Ltd. 1.30%
TVS Motor Company Ltd. 0.46%
Tata Motors Ltd. 0.28%
Auto Ancillaries 1.59%
Motherson Sumi Systems Ltd. 1.59%
Banks 4.68%
HDFC Bank Ltd. 2.42%
State Bank Of India 1.30%
IndusInd Bank Ltd. 0.66%
Axis Bank Ltd. 0.31%
Construction Project 0.44%
Larsen & Toubro Ltd. 0.44%
Consumer Non Durables 1.35%
Britannia Industries Ltd. 0.82%
Asian Paints Ltd. 0.53%
Finance 0.34%
Equitas Holdings Ltd. 0.34%
Healthcare Services 0.20%
Narayana Hrudayalaya Ltd. 0.20%
Media & Entertainment 1.45%
PVR Ltd. 1.45%
Pharmaceuticals 1.26%
Lupin Ltd. 0.70%
Cipla Ltd. 0.56%
Software 0.51%
Larsen & Toubro Infotech Ltd. 0.51%
Transportation 0.38%
Spicejet Ltd. 0.38%
Debt Holdings 83.17%@ Government Securities - Long Term 27.24%
• 07.61% GOI 2030 SOV 23.45%
• 08.17% GOI 2044 SOV 3.79%
Corporate Securities 53.67%
• Tata Steel Ltd. BWR AA 13.73%
• IDBI Bank Ltd. ICRA A+ 10.73%
• Reliance Gas Transporation Infrastructure Ltd. CRISIL AAA 7.85%
• Reliance Utilities & Power Private Ltd. CRISIL AAA 6.12%
• Mahanagar Telephone Nigam Ltd. CRISIL AAA 4.57%
• The Indian Hotels Company Ltd. ICRA AA 3.16%
• Power Grid Corporation Of India Ltd. CRISIL AAA 3.06%
• Jindal Steel & Power Ltd. CRISIL D 3.00%
ICICI Bank Ltd. ICRA AAA 1.46%
Cash, Call, CBLO & Term Deposits 2.26%
Net Current Assets 2.60%
Total Net Assets 100.00%
Entry load : Nil
Std Dev (Annualised): 4.51% Sharpe Ratio : 1.11 Portfolio Beta : 1.11 R squared : 0.84 Benchmark Std Dev (Annualised) : 3.72%
RiskometerThis Product is suitable for investors who are seeking*:
• Medium term regular income solution
• A hybrid fund that aims to generate regular income through investments in fixed income securities with an aim to make regular dividend payment and seek for long term capital appreciation by investing a portion in equity.
*Investors should consult their financial advisers if in doubt about whether the product is suitable for them.
Annual Portfolio Turnover Ratio : Equity - 0.08 times, Others (Debt and Derivatives) - 1.07 times Combined Annual Portfolio Turnover Ratio : 1.15 times
Quantitative Indicators – Debt Component
Unrated also include D Rating
Rating Profile (as % of debt component)
Dividend History : Refer page no. from 122 to 130
SIP Returns : Refer page no. from 118 to 120
Total Expense Ratio @@ :
IPMIP : 2.27% p. a.
IPMIP Direct Plan : 1.80% p. a.
Investment Objective : Refer page no. from 131 to 134
Equity : Rajat Chandak(Managing the Equity Portion of this fundfrom Sep, 2012 & 8 years of experience)Debt : Manish Banthia(Managing this fund since Sep, 2013 &Overall 13 years of experience)
Notes:1. Different plans shall have different expense structure. The performance details provided herein are of ICICI Prudential Monthly Income Plan.2. The scheme is currently managed and Manish Banthia. Mr. has been managing this fund since . Total Schemes managed Rajat Chandak Rajat Chandak Sep 2012by the Fund Manager . Refer annexure from page no. 91 for performance of other schemes currently managed by(Equity) is 9 (5 are jointly managed) Rajat Chandak.Mr. Manish Banthia has been managing this fund since Sep 2013. Total Schemes managed by the Fund Manager . Refer (Debt) is 19 (5 are jointly managed)annexure from page no. 91 for performance of other schemes currently managed by Manish Banthia. 3. Date of inception: 10-Nov-00.4. Past performance may or may not be sustained in future and the same may not necessarily provide the basis for comparison with other investment.5. Load is not considered for computation of returns.6. In case, the start/end date of the concerned period is a nonbusiness date (NBD), the NAV of the previous date is considered for computation of returns. The NAV per unit shown in the table is as on the start date of the said period7. As the scheme was launched before the launch of the benchmark index, benchmark index figures since inception or the required period are not available.
Scheme
10 Year G Sec (Additional Benchmark)
NAV (Rs.) Per Unit (as on April 28,2017 : 45.2666)
CAGR (%)
10.0000
Crisil MIP Blended Index (Benchmark)
Since inception
CurrentValue of
Investment of Rs. 10000
CAGR (%) Current Value of
Investment of Rs. 10000
1 Year 3 Year 5 Year
CAGR (%) Current Value of
Investment of Rs. 10000
CAGR (%) Current Value of
Investment of Rs. 10000
40.0677 32.4986 27.6413
Particulars
13.01 11297.53 11.69 13928.78 10.37 16376.44 9.60 45266.60
11.42 11138.53 11.17 13736.77 9.85 15994.17 NA NA
9.64 10961.31 10.76 13584.03 8.51 15038.07 NA NA
26.89%
19.68%
12.51%
3.50%
31.76%
5.66%
0% 5% 10% 15% 20% 25% 30% 35%
AAA and Equivalent
AA and Equivalent
A and Equivalent
Unrated
Sovereign Securities
CBLO & Current Assets

73
Fund Details
Quantitative Indicators – Debt Component Average Maturity : 1.07 Years
Equity
Debt
Style Box
Fund Managers** :
Debt : Rahul Bhuskute(Managing this fund since Oct, 2014 &Overall 19 years of experience)Manish Banthia(Managing this fund since Nov, 2016 & Overall 13 years of experience)Equity : Rajat Chandak (Managing the Equity Portion of this fund from Sep, 2012 & 8 years of experience)
Indicative Investment Horizon:1 yr & aboveInception/Allotment date: 03-May-11
Monthly AAUM as on 30-Apr-17 : Rs. 2561.00 crores
Closing AUM as on 30-Apr-17 : Rs. 2550.80 crores
NAV (As on 28-Apr-17):IPRIF Growth Option : 16.4722IPRIF Dividend Option : 10.6754IPRIF Direct Plan Growth Option : 17.0737IPRIF Direct Plan Dividend Option : 10.7319
Options :1. Growth2. Dividend (Monthly, Quarterly, Half Yearly)(dividend payout*** and re-investment facility available)###Application Amount for freshSubscription :a) Growth & Dividend : Rs.5,000 (plusmultiples of Re.1)b) AEP : Rs.25,000 (plus multiples of Re.1)
Min.Addl.Investment :Rs.1000/- & in multiples thereof under eachoption
Exit load for Redemption / Switch out:- Lumpsum & SIP / STP / SWP OptionWithin 3 Months from allotment – 0.50% of applicable NAV, more than 3 Months - Nilw.e.f. 2nd May 2017.
##SIP :Monthly Frequency: Rs. 1,000/- and in multiple of Rs. 1/-Quarterly Frequency: Rs. 5,000/- and in multiple of Rs. 1/-
&&SWP :Rs. 500/- and in multiples of Rs. 1/-
STP/ Flex STP/ Value STP * :Daily Frequency: Rs. 250/- and in multiples of Rs. 50/-Weekly, Monthly and Quarterly Frequency: Rs. 1,000/- and in multiples of Rs. 1/-Min.Redemption Amt. :500/- or all units where amount is below 500/-
Modified Duration : 0.92 Years Yield To Maturity : 8.55%
###With effect from November 07, 2016, maximum Investment Amount per investor (based on Permanent Account Number of first holder) applicable at the time of investment shall not exceed Rs. 50
crore.Portfolio turnover has been computed as the ratio of the lower value of purchase and sales, to the average net assets in the past one year (since inception for schemes that have not completed a year). The figures are not netted for derivative transactions.Risk-free rate based on the last Overnight MIBOR cut-off of 6.18%**In addition to the fund manager managing this fund, the ADR/GDR exposure is managed by Mr. Ihab Dalwai.@@ Total Expense Ratio is weighted average for the month. Ratio excludes service tax on management fees and includes B-15 clawback reversal, if any.##
Minimum number of installments for monthly frequency will be 6 and for Quarterly frequency will be 4. w.e.f February 01, 2017.* Minimum number of installments for daily, weekly and monthly frequency will be 6 and for Quarterly frequency will be 4. w.e.f February 01, 2017. Refer page No. 137 for definition of Flex STP and Value STP.&&
Minimum number of installments for both monthly and quarterly will be 2. w.e.f February 01, 2017.*** In case the unit holder has opted for dividend payout option, the minimum amount for dividend payout shall be 100 (net of dividend distribution tax and other statutory levy, if any), else the dividend would be mandatorily reinvested.
Portfolio as on April 30, 2017
Returns of ICICI Prudential Regular Income Fund - Growth Option as on April 30, 2017 - (IPRIF)
ICICI Prudential Regular Income Fund(An Open Ended Income Scheme. Income is not assured and is subject to the availability of distributable surplus.)
• Top Ten HoldingsDerivatives are considered at exposure value.^ Value Less than 0.01% of NAV.
Company/Issuer Rating % to % to NAV NAV Derivatives
Entry load : Nil
Std Dev (Annualised): 1.69% Sharpe Ratio : 2.44 Portfolio Beta : 0.32 R squared : 0.50 Benchmark Std Dev (Annualised) : 3.72%
RiskometerThis Product is suitable for investors who are seeking*:
• Medium term regular income solution
• A hybrid fund that aims to generate regular income through investments primarily in debt and money market instruments and long term capital appreciation by investing a portion in equity.
*Investors should consult their financial advisers if in doubt about whether the product is suitable for them.
Quantitative Indicators – Equity Component
Rating Profile (as % of debt component)
Company/Issuer Rating % to % to NAV NAV Derivatives
Dividend History : Refer page no. from 122 to 130
SIP Returns : Refer page no. from 118 to 120
Total Expense Ratio @@ :
IPRIF : 1.55% p. a.
IPRIF Direct Plan : 0.87% p. a.
Investment Objective : Refer page no. from 131 to 134
Notes:1. Different plans shall have different expense structure. The performance details provided herein are of ICICI Prudential Regular Income Fund.2. The scheme is currently managed Manish Banthia and Rajat Chandak. Mr. has been managing this fund since . Total Rahul Bhuskute, Rahul Bhuskute Oct 2014Schemes managed by the Fund Manager . Refer annexure from page no. 91 for performance of other schemes currently managed by .(Debt) is 3 Rahul BhuskuteMr. Manish Banthia has been managing this fund since . Total Schemes managed by the Fund Manager . Refer Nov 2016 (Debt) is 19 (5 are jointly managed)annexure from page no. 91 for performance of other schemes currently managed by Manish Banthia. Mr. Rajat Chandak has been managing this fund since . Total Schemes managed by the Fund Manager . Refer Sep 2012 (Equity) is 9 (5 are jointly managed)annexure from page no. 91 for performance of other schemes currently managed by Rajat Chandak.3. Date of inception: 03-May-11.4. Past performance may or may not be sustained in future and the same may not necessarily provide the basis for comparison with other investment.5. Load is not considered for computation of returns.6. In case, the start/end date of the concerned period is a nonbusiness date (NBD), the NAV of the previous date is considered for computation of returns. The NAV per unit shown in the table is as on the start date of the said period
Scheme
10 Year G Sec (Additional Benchmark)
NAV (Rs.) Per Unit (as on April 28,2017 : 16.4722)
CAGR (%)
10.0000
Crisil MIP Blended Index (Benchmark)
Since inception
CurrentValue of
Investment of Rs. 10000
CAGR (%) Current Value of
Investment of Rs. 10000
1 Year 3 Year 5 Year
CAGR (%) Current Value of
Investment of Rs. 10000
CAGR (%) Current Value of
Investment of Rs. 10000
15.1061 12.1093 10.7005
Particulars
9.07 10904.34 10.81 13602.93 9.02 15393.86 8.69 16472.20
11.42 11138.53 11.17 13736.77 9.85 15994.17 9.26 17000.87
9.64 10961.31 10.76 13584.03 8.51 15038.07 7.82 15702.69
1.99%
55.16%
30.96%
0.53%
11.36%
0% 10% 20% 30% 40% 50% 60%
AAA and Equivalent
AA and Equivalent
A and Equivalent
Unrated
CBLO, Term Deposits & Current Assets
Equity Shares 4.56% -4.57% Auto ^ ^ Mahindra & Mahindra Ltd. ^ Mahindra & Mahindra Ltd. - Futures ^ Banks 0.64% -0.64% Axis Bank Ltd. 0.62% Axis Bank Ltd. - Futures -0.62% Kotak Mahindra Bank Ltd. 0.02% Kotak Mahindra Bank Ltd. - Futures -0.02% Construction Project 0.91% -0.91% Larsen & Toubro Ltd. 0.91% Larsen & Toubro Ltd. - Futures -0.91% Consumer Non Durables 0.25% -0.25% ITC Ltd. 0.18% ITC Ltd. - Futures -0.18% Asian Paints Ltd. 0.07% Asian Paints Ltd. - Futures -0.07% Ferrous Metals 0.57% -0.57% Tata Steel Ltd. 0.57% Tata Steel Ltd. - Futures -0.57% Industrial Capital Goods 0.14% -0.14% Bharat Heavy Electricals Ltd. 0.14% Bharat Heavy Electricals Ltd. - Futures -0.14% Minerals/Mining 0.06% -0.06% Coal India Ltd. 0.06% Coal India Ltd. - Futures -0.06% Oil 0.43% -0.43% Oil & Natural Gas Corporation Ltd. 0.43% Oil & Natural Gas Corporation Ltd. - Futures -0.43% Petroleum Products 1.26% -1.26% Reliance Industries Ltd. 0.84% Reliance Industries Ltd. - Futures -0.84% Bharat Petroleum Corporation Ltd. 0.30% Bharat Petroleum Corporation Ltd. - Futures -0.30% Hindustan Petroleum Corporation Ltd. 0.12% Hindustan Petroleum Corporation Ltd. - Futures -0.12% Pharmaceuticals 0.07% -0.06% Cipla Ltd. 0.07% Cipla Ltd. - Futures -0.06% Software 0.25% -0.24% HCL Technologies Ltd. 0.25% HCL Technologies Ltd. - Futures -0.24% Debt Holdings 88.65% Corporate Securities 88.65% • Bahadur Chand Investments Private Ltd. ICRA AA 6.47% (A Hero Group company)• Hinduja Leyland Finance Ltd. CARE A+ 4.29% • Prism Cement Ltd. ICRA A- 4.16% • Au Small Finance Bank Ltd. CRISIL A+ 4.12%• Parry Sugars Refinery India Private Ltd. CRISIL A+ 4.13% (Subsidiary of E.I.D - Parry (India) Limited)• Promont Hillside Private Ltd. (Subsidiary of CARE AA 4.01% Tata Housing Development Co. Ltd)• Indian Hospital Corporation Ltd. BWR AA- 3.94% • Pune Solapur Expressway Pvt. Ltd. ICRA A 3.14% (A Tata Group Company)• KRIBHCO Shyam Fertilizers Ltd. ICRA AA 3.14% • Avenue Supermarts Ltd. (D-Mart) CRISIL AA 2.60% Equitas Small Finance Bank Ltd. CARE A+ 2.54% Crompton Greaves Consumer Electricals Ltd. CRISIL AA 2.43% Godrej & Boyce Mfg. Co. Ltd. CRISIL AA 2.42% Century Textiles & Industries Ltd. CRISIL AA- 2.40%
Incline Realty Pvt. Ltd. (A Oberoi Group CARE AA+ 2.39% company) Bharat Financial Inclusion Ltd. CARE A+ 2.31% Emami Infrastucture Ltd. (secured by pledge BWR AA- 2.29% of equity shares of Emami Ltd.) Ma Multi-Trade Private Ltd. BWR A+ 2.16% Prime Publishing Pvt. Ltd. BWR AA- 1.99% Tube Investments of India Ltd. (Murugappa CRISIL AA 1.99% Holdings Ltd) Geetanjali Trading & Investments Pvt. Ltd. BWR AAA 1.99% (Promoter company of Asian Paints) Nirchem Cement Ltd. CRISIL AA 1.98% Sadbhav Infrastucture Project Ltd. CARE A+ 1.70% Vedanta Ltd. CRISIL AA 1.61% Essel Propack Ltd. CARE AA 1.59% Tata Housing Development Company Ltd. ICRA AA 1.49% Amri Hospitals Ltd (Secured by pledge of BWR AA- 1.44% equity shares of Emami Ltd) PVR Ltd. CRISIL AA- 1.33% Thomas Cook (India) Ltd. ICRA AA 1.31% Aspire Home Finance Corporation Ltd. ICRA AA- 1.23% (Subsidiary of Motilal Oswal Group) Techno Electric & Engineering Company Ltd. ICRA AA- 1.19% Anjani Portland Cement Ltd. CARE AA+ 1.19% NRB Bearings Ltd. CRISIL AA- 1.19% Mahindra Integrated Township Ltd. FITCH AA- 1.04% Prestige Estates Projects Ltd. ICRA A+ 1.03% Clp Wind Farms (India) Pvt. Ltd. FITCH AA 0.80% Equitas Finance Ltd. FITCH A+ 0.80% Ujjivan Financial Services Ltd. CARE A+ 0.59% Asian Satellite Broadcast Pvt. Ltd. UNRATED 0.53% (Promoter company of Essel Group) Blue Dart Express Ltd. ICRA AA 0.46% Muthoot Finance Ltd. CRISIL AA 0.43% Tata Realty & Infrastructure Ltd. CRISIL AA 0.40% Essel Mining & Industries Ltd. CRISIL AA 0.40% CBLO, Term Deposits & Net Current Assets 6.79% Total Net Assets 100.00%

74
Fund Details
Rating Profile (as % of debt component)
Style Box
Portfolio turnover has been computed as the ratio of the lower value of purchase and sales, to the average net assets in the past one year (since inception for schemes that have not completed a year). The figures are not netted for derivative transactions.Risk-free rate based on the last Overnight MIBOR cut-off of 6.18%**In addition to the fund manager managing this fund, the ADR/GDR exposure is managed by Mr. Ihab Dalwai.@@ Total Expense Ratio is weighted average for the month. Ratio excludes service tax on management fees and includes B-15 clawback reversal, if any.##
Minimum number of installments for monthly frequency will be 6 and for Quarterly frequency will be 4. w.e.f February 01, 2017.* Minimum number of installments for daily, weekly and monthly frequency will be 6 and for Quarterly frequency will be 4. w.e.f February 01, 2017. Refer page No. 137 for definition of Flex STP and Value STP.&&
Minimum number of installments for both monthly and quarterly will be 2. w.e.f February 01, 2017.*** In case the unit holder has opted for dividend payout option, the minimum amount for dividend payout shall be 100 (net of dividend distribution tax and other statutory levy, if any), else the dividend would be mandatorily reinvested.
Equity : Rajat Chandak (Managing the Equity Portion of this fund from Feb, 2012 & 8 years of experience)Debt : Manish Banthia (Managing this fund since Sep, 2013 & Overall 13 years of experience)
Fund Managers** :
Indicative Investment Horizon: 3 years and above
Inception/Allotment date: 31-Aug-01
Monthly AAUM as on 30-Apr-17 : Rs. 105.82 crores
Closing AUM as on 30-Apr-17 : Rs. 107.16 crores
NAV (As on 28-Apr-17):IPCCP(SP) Growth Option : 65.5069IPCCP(SP) Direct Plan Growth Option : 67.6921Options : Growth Option(dividend payout*** and re-investment facility available)
*Application Amount for freshSubscription :Rs.5,000 (plus in multiples of Re.1)
Min.Addl.Investment :Rs.1,000 (plus in multiples of Re.1)
Exit load for Redemption / Switch out :- Lumpsum & SIP / STP / SWP OptionWitin 1 Year from allotment - 3% of applicable NAV, Within 2 Years from allotment - 2% of applicable NAV, Within 3 Years from allotment - 1% of applicable NAV, more than 3 Years - Nil
SIP :##
Monthly Frequency: Rs. 1,000/- and in multiple of Rs. 1/-Quarterly Frequency: Rs. 5,000/- and in multiple of Rs. 1/-
&&SWP :Rs. 500/- and in multiples of Rs. 1/-
STP/ Flex STP/ Value STP * :Daily Frequency: Rs. 250/- and in multiples of Rs. 50/-Weekly, Monthly and Quarterly Frequency: Rs. 1,000/- and in multiples of Rs. 1/-
Min.Redemption Amt. :500/- or all units where amount is below 500/-
• Top Ten Holdings@Short Term < 8 Years, Long Term > 8 Years.^^ CRISIL has rated AA and company has put a withdrawal request for the CRISIL rating.
Equity
Debt
Portfolio as on April 30, 2017
Returns of ICICI Prudential Child Care Plan (Study Plan) - Growth Option as on April 30, 2017 - (IPCCP(SP))
Equity Shares 23.62% Auto 2.28% Maruti Suzuki India Ltd. 1.19% TVS Motor Company Ltd. 1.09% Auto Ancillaries 2.12%• Motherson Sumi Systems Ltd. 1.83% Amara Raja Batteries Ltd. 0.28% Banks 4.48%• HDFC Bank Ltd. 2.44% State Bank Of India 0.99% The Federal Bank Ltd. 0.60% ICICI Bank Ltd. 0.45% Construction 0.93% KNR Constructions Ltd. 0.93% Consumer Durables 0.65% Blue Star Ltd. 0.65% Consumer Non Durables 3.25% Britannia Industries Ltd. 1.01% Bajaj Corp Ltd. 1.01% Dabur India Ltd. 0.79% Colgate - Palmolive (India) Ltd. 0.43% Finance 0.96% Max Financial Services Ltd. 0.51% Equitas Holdings Ltd. 0.46% Healthcare Services 0.89% Narayana Hrudayalaya Ltd. 0.89% Industrial Products 0.17% Astral Poly Technik Ltd. 0.17% Media & Entertainment 1.17% PVR Ltd. 1.17% Pharmaceuticals 3.09% Natco Pharma Ltd. 1.62% Cipla Ltd. 0.58% Lupin Ltd. 0.50% Alembic Pharmaceuticals Ltd. 0.39% Services 1.28% Thomas Cook (India) Ltd. 1.28% Software 1.63% HCL Technologies Ltd. 0.87%
Company/Issuer Rating % to NAV
Company/Issuer Rating % to NAV
Note : As per the addendum dated 01-Oct-14, the ”Lock in” feature has been introduced in the Schemes for the unit holders less than 18 years of age (Minor) as on the date of application. If the ”Lock in” feature is selected while making the application, the investment amount would be subject to lock in until the minor unit holder either attains the age of 18 years or completes 3 years from date of allotment, whichever is later.*The third party maximum investment limit in ICICI Prudential Child Care Plan - Study Plan has been removed with effect from April 13, 2015.
Quantitative Indicators – Equity Component
Quantitative Indicators – Debt Component Modified Duration : 5.40 Years Yield To Maturity : 7.46%Average Maturity : 8.97 Years
Tech Mahindra Ltd. 0.77% Textile Products 0.72% Arvind Ltd. 0.72% Debt Holdings 73.64% Government Securities 41.34%
@ Short Term 3.77%• 07.35% GOI 2024 SOV 3.77%
@ Long Term 37.57%• 07.61% GOI 2030 SOV 33.59%• 08.17% GOI 2044 SOV 3.98% Corporate Securities 27.39%• Hindalco Industries Ltd. CRISIL AA- 6.85%• Power Finance Corporation Ltd. CRISIL AAA 6.07%• Reliance Gas Transporation Infrastructure Ltd. CRISIL AAA 4.95%• Vodafone Mobile Services Ltd.^^ FITCH AAA 3.77%• NHPC Ltd. FITCH AAA 2.92% Power Grid Corporation Of India Ltd. CRISIL AAA 1.47% Indian Railway Finance Corporation Ltd. CRISIL AAA 1.37% Cash, Call, CBLO & Term Deposits 4.91% Net Current Assets 2.73% Total Net Assets 100.00%
ICICI Prudential Child Care Plan (Study Plan)(An Open Ended Fund)
Entry load : Nil
Std Dev (Annualised) : 5.06% Sharpe Ratio : 1.90 Portfolio Beta : 0.99 R squared : 0.53 Benchmark Std Dev (Annualised) : 3.72%
RiskometerThis Product is suitable for investors who are seeking*:
• Long term regular income solution
• A hybrid fund that seeks to generate income by investing in debt, money market instruments and equity and equity related securities.
*Investors should consult their financial advisers if in doubt about whether the product is suitable for them.
Average P/E : 28.91 Average P/B : 7.48 Average Dividend Yield : 0.85
Annual Portfolio Turnover Ratio : Equity - 0.07 times, Others (Debt and Derivatives) - 0.82 times Combined Annual Portfolio Turnover Ratio : 0.89 times
Dividend History : Refer page no. from 122 to 130
SIP Returns : Refer page no. from 118 to 120
Total Expense Ratio @@ :
IPCCP(SP) : 1.39% p. a.
IPCCP(SP) Direct Plan : 0.74% p. a.
Investment Objective : Refer page no. from 131 to 134
Notes:1. Different plans shall have different expense structure. The performance details provided herein are of ICICI Prudential Child Care Plan (Study Plan).2. The scheme is currently managed Rajat Chandak and Mr. Rajat Chandak has been managing this fund since . Total Schemes managed Manish Banthia. Feb 2012by the Fund Manager is . Refer annexure from page no. 91 for performance of other schemes currently managed by Rajat (Equity) 9 (5 are jointly managed)Chandak.Mr. Manish Banthia has been managing this fund since 3. Total Schemes managed by the Fund Manager . Refer Sep 201 (Debt) is 19 (5 are jointly managed)annexure from page no. 91 for performance of other schemes currently managed by Manish Banthia.3. Date of inception: 31-Aug-01.4. Past performance may or may not be sustained in future and the same may not necessarily provide the basis for comparison with other investment.5. Load is not considered for computation of returns.6. In case, the start/end date of the concerned period is a nonbusiness date (NBD), the NAV of the previous date is considered for computation of returns. The NAV per unit shown in the table is as on the start date of the said period7. As the scheme was launched before the launch of the benchmark index, benchmark index figures since inception or the required period are not available.
Scheme
10 Year G Sec (Additional Benchmark)
NAV (Rs.) Per Unit (as on April 28,2017 : 65.5069)
CAGR (%)
10.0000
Crisil MIP Blended Index (Benchmark)
Since inception
CurrentValue of
Investment of Rs. 10000
CAGR (%) Current Value of
Investment of Rs. 10000
1 Year 3 Year 5 Year
CAGR (%) Current Value of
Investment of Rs. 10000
CAGR (%) Current Value of
Investment of Rs. 10000
56.9471 41.0349 31.9972
Particulars
15.08 11503.11 16.89 15963.70 15.42 20472.70 12.75 65506.90
11.42 11138.53 11.17 13736.77 9.85 15994.17 NA NA
9.64 10961.31 10.76 13584.03 8.51 15038.07 NA NA
26.90%
8.96%
54.13%
10.01%
0% 10% 20% 30% 40% 50% 60%
AAA and Equivalent
AA and Equivalent
Sovereign Securities
CBLO & Current Assets

75
Quantitative Indicators
Fund Details
Company/Issuer Rating % to NAV
For Schemes which have discontinued fresh subscriptions with effect from October 01,2012,the dividend declared will be compulsorily paid out under the “dividend payout “option.@@ Total Expense Ratio is weighted average for the month. Ratio excludes service tax on management fees and includes B-15 clawback reversal, if any.##
Minimum number of installments for monthly frequency will be 6 and for Quarterly frequency will be 4. w.e.f February 01, 2017.* Minimum number of installments for daily, weekly and monthly frequency will be 6 and for Quarterly frequency will be 4. w.e.f February 01, 2017. Refer page No. 137 for definition of Flex STP and Value STP.&& Minimum number of installments for both monthly and quarterly will be 2. w.e.f February 01, 2017.***This facility will be available with all frequencies except daily frequency. In case of daily frequency, dividend will be mandatorily reinvested. In case the unit holder has opted for dividend payout option, the minimum amount for dividend payout shall be 100 (net of dividend distribution tax and other statutory levy, if any), else the dividend would be mandatorily reinvested.
Notes to Numbers and Data in the Fact Sheet
1. Yield to maturity, modified duration and average maturity are the weighted average of these numbers, computed for each security in the portfolio, and weighted by the market value of each security to the total market value of the portfolio.
2. Average maturity for PTCs are weighted averages of tenor and quantity of cash flows until maturity.
3. Price/Earning Ratio, Price/Book Value Ratio, and Dividend Yield are based on the historical earnings and accounting numbers, and have been computed only for the invested portion of the portfolio.
4. Average days to reset is the weighted average of the next interest reset date of the floating rate bonds, weighted by their market values.
5. Dividends declared in a scheme have been separately disclosed.
6. The standard deviation is used to measure the volatility of returns.
7. Sharpe Ratio is the measure of the risk-adjusted performance. It is calculated by subtracting the risk-free rate from the average rate of return for a portfolio and dividing the result by the standard deviation of the portfolio returns.
8. Beta is the measure of the portfolio’s volatility to its respective benchmark.
9. R-squared is a measurement of how closely a portfolio’s performance correlates with the performance of benchmark index. A higher R-squared value indicates a more useful beta.
10. The Std. Dev., Sharpe Ratio, Portfolio Beta & R-squared are based on monthly returns calculated using last 3 years data.
11. Yield to Maturity has been computed basis Annualized Yield. Definitions of Investment Grade credit ratings• AAA (Highest Safety-Highest Credit Quality)
Denotes the lowest expectation of credit risk. They are assigned only in case of exceptionally strong capacity for payment of financial commitments. Any adverse changes in circumstances are most unlikely to affect the payments on the instrument
• AA (High Safety- Very High Credit Quality)
Denote expectations of very low credit risk. They indicate very strong capacity for payment of financial commitments. They differ only marginally in safety from ̀ AAA’ issues.
• A (Adequate Safety- High Credit Quality)
Denotes expectations of low credit risk. The capacity for payment of financial commitments is considered strong. This capacity may, nevertheless, be more vulnerable to changes in circumstances or in economic conditions than is the case for higher ratings.
• A1+ (Highest Credit Quality for the Short Term Instruments).
Rating by CRISIL/FITCH/ICRA. Indicates the strongest capacity for timely payment of financial commitments; may have an added “+” to denote relatively stronger credit quality.
• A suffix of ‘(SO)’ indicates instruments with structured obligation.
Fund Managers :
Rahul Goswami (Managing this fund since Oct, 2013 & Overall 20 years of experience)Nikhil Kabra(Managing this fund since Aug, 2016 & Overall 3 years of experience)
Indicative Investment Horizon:1 day and above
Inception/Allotment date:IPMMF Retail Option : 06-Mar-02IPMMF : 08-Mar-06
Monthly AAUM as on 30-Apr-17 :Rs. 15202.16 crores
Closing AUM as on 30-Apr-17 : Rs. 14949.80 crores
NAV (As on 28-Apr-17):IPMMF Growth Option : 225.4923IPMMF Direct Plan Growth Option : 226.1546
Option/ sub-options :Growth Options and Dividend (with Daily, Weekly, Monthly, Dividend Others frequencies)(dividend payout*** and re-investment facility available)
Application Amount for freshSubscription :Rs.500 (plus in multiples of Re.1)
Min.Addl.Investment :
Rs.1 (plus in multiples of Re.1)
(w.e.f. 01-Oct-16)
Exit Load : Nil
##SIP :Monthly Frequency: Rs. 500/- and in multiple of Rs. 1/-Quarterly Frequency: Rs. 5,000/- and in multiple of Rs. 1/-
&&SWP : Rs. 500/- and in multiples of Rs. 1/-
STP/ Flex STP/ Value STP * :Daily Frequency: Rs. 250/- and in multiples of Rs. 50/-Weekly, Monthly and Quarterly Frequency: Rs. 1,000/- and in multiples of Rs. 1/-
Min.Redemption Amt. :500/- or all units where amount is below 500/-
• Top Ten Holdings^^^HDFC Bank included in CP/CD is a Bills Rediscounting
Portfolio as on April 30, 2017
Returns of ICICI Prudential Money Market Fund - Growth Option as on - (IPMMF)April 30, 2017
Average Maturity : 44.00 Days Modified Duration : 41.37 Days Yield To Maturity : 6.42%
ICICI Prudential Money Market Fund(An Open Ended Money Market Fund)
Entry load : Nil
RiskometerThis Product is suitable for investors who are seeking*:
• Short term savings solution
• A Money Market Fund that seeks to provide reasonable returns, commensurate with low risk while providing a high level of liquidity.
*Investors should consult their financial advisers if in doubt about whether the product is suitable for them.
Company/Issuer Rating % to NAV
Dividend History : Refer page no. from 122 to 130
SIP Returns : Refer page no. from 118 to 120
Total Expense Ratio @@ :
IPMMF : 0.22% p. a.
IPMMF Direct Plan : 0.12% p. a.
Investment Objective : Refer page no. from 131 to 134
Rating Profile
Treasury Bills SOV 16.97% CPs and CDs 96.14%• HDFC Bank Ltd. CARE A1+ 11.52%• HDFC Ltd. CRISIL A1+ 9.92%• IDFC Bank Ltd. ICRA A1+ 6.32%• Aditya Birla Finance Ltd. ICRA A1+ 4.92%• Bajaj Finance Ltd. CRISIL A1+ 4.24%• NABARD CRISIL A1+ 3.33%• Khyati Realtors Private Ltd. CARE A1+ 3.32%• Tata Steel Ltd. FITCH A1+ 2.66%• Edelweiss Commodities Services Ltd. CRISIL A1+ 2.01%• IndusInd Bank Ltd. CRISIL A1+ 2.01% HDFC Bank Ltd.^^^ N/A 2.00% Axis Bank Ltd. CRISIL A1+ 1.99% Small Industries Development Bank Of India CARE A1+ 1.97% Tata Power Renewable Energy Ltd. CRISIL A1+ 1.90% Oriental Bank Of Commerce CRISIL A1+ 1.86% Kotak Mahindra Bank Ltd. CRISIL A1+ 1.79% JSW Steel Ltd. CARE A1+ 1.77% The Ramco Cements Ltd. ICRA A1+ 1.67% Piramal Finance Ltd. ICRA A1+ 1.60% Credit Suisse AG-Mumbai Branch CRISIL A1+ 1.55% Vedanta Ltd. CRISIL A1+ 1.53% Tata Capital Financial Services Ltd. ICRA A1+ 1.50% Vodafone India Ltd. CRISIL A1+ 1.33% Vardhman Textiles Ltd. CRISIL A1+ 1.33% Reliance Home Finance Ltd. ICRA A1+ 1.32% Standard Chartered Investment & Loan (India) Ltd. CRISIL A1+ 1.03% Dewan Housing Finance Corporation Ltd. CRISIL A1+ 1.00% Bharat Aluminium Co. Ltd. CRISIL A1+ 1.00% HDB Financial Services Ltd. CARE A1+ 0.99% Bahadur Chand Investments Private Ltd. ICRA A1+ 0.90% Tata Capital Housing Finance Ltd. CRISIL A1+ 0.74% Reliance Capital Ltd. ICRA A1+ 0.67% TVS Credit Services Ltd. CRISIL A1+ 0.67% RSPL Ltd. CRISIL A1+ 0.67% Tata Power Company Ltd. ICRA A1+ 0.67% Sundaram BNP Paribas Home Finance Ltd. CRISIL A1+ 0.67% Kotak Mahindra Investments Ltd. CRISIL A1+ 0.67% BASF India Ltd. CRISIL A1+ 0.67% Kotak Securities Ltd. ICRA A1+ 0.67% IIFL Wealth Finance Ltd. ICRA A1+ 0.67% Arvind Ltd. CARE A1+ 0.66%
Tube Investments of India Ltd. CRISIL A1+ 0.66% Krishak Bharati Co-operative Ltd. ICRA A1+ 0.63% Bombay Burmah Trading Corporation Ltd. FITCH A1+ 0.61% Trapti Trading & Investments Pvt. Ltd. ICRA A1+ 0.50% Gmmco Ltd. CARE A1+ 0.50% Murugappa Holdings Ltd. ICRA A1+ 0.47% Daimler Financial Services India Pvt. Ltd. FITCH A1+ 0.43% Viacom18 Media Pvt. Ltd. ICRA A1+ 0.33% Julius Baer Capital (India) Pvt. Ltd. FITCH A1+ 0.33% Cargill India Pvt. Ltd. ICRA A1+ 0.33% Ford Credit India Pvt. Ltd. FITCH A1+ 0.33% Motilal Oswal Securities Ltd. CRISIL A1+ 0.33% JK Tyre & Industries Ltd. CARE A1+ 0.33% Ashoka Buildcon Ltd. CRISIL A1+ 0.33% Kirloskar Ferrous Industries Ltd. ICRA A1+ 0.30% NRB Bearings Ltd. CRISIL A1+ 0.27% Monte Carlo Fashions Ltd. ICRA A1+ 0.27% Somany Ceramics Ltd. ICRA A1+ 0.27% PVR Ltd. ICRA A1+ 0.23% Indostar Capital Finance Ltd. CRISIL A1+ 0.23% Cholamandalam Investment And Finance Company Ltd. ICRA A1+ 0.20% Kotak Commodity Services Pvt. Ltd. ICRA A1+ 0.17% J M Financial Products Pvt. Ltd. ICRA A1+ 0.17% Transport Corporation Of India Ltd. ICRA A1+ 0.13% Ambadi Investments Private Ltd. CRISIL A1+ 0.09% Reliance Jio Infocomm Ltd. CARE A1+ 0.03% CBLO & Net Current Assets -13.11% Total Net Assets 100.00%
Notes:1. Different plans shall have different expense structure. The performance details provided herein are of ICICI Prudential Money Market Fund.2. The scheme is currently managed and . Mr. has been managing this fund since . Total Schemes managed Rahul Goswami Nikhil Kabra Rahul Goswami Oct 2013by the Fund Manager . Refer annexure from page no. 91 for performance of other schemes currently managed by .is 11 (9 are jointly managed) Rahul GoswamiMr. has been managing this fund since Aug 2016. Total Schemes managed by the Fund Manager . Refer annexure from Nikhil Kabra is 2 (2 are jointly managed)page no. 91 for performance of other schemes currently managed by . Nikhil Kabra3. Date of inception: 08-Mar-06.4. Past performance may or may not be sustained in future and the same may not necessarily provide the basis for comparison with other investment.5. Load is not considered for computation of returns.6. In case, the start/end date of the concerned period is a nonbusiness date (NBD), the NAV of the previous date is considered for computation of returns. The NAV per unit shown in the table is as on the start date of the said period
Scheme
1 Year T Bill (Additional Benchmark)
NAV (Rs.) Per Unit (as on April 28,2017 : 225.4923)
CAGR (%)
Crisil Liquid Fund Index (Benchmark)
Since inception
CurrentValue of
Investment of Rs. 10000
CAGR (%)
Current Value of
Investment of Rs. 10000
1 Year 3 Year 5 Year
CAGR (%)
Current Value of
Investment of Rs. 10000
CAGR (%)
Current Value of
Investment of Rs. 10000
225.2979
Particulars
22549.23
22420.38
19827.76
7 Days 15 Days 30 Days
224.9085 224.3816 210.5126 178.6648 149.6364 100.0000
6.30
6.09
1.04
6.32
6.35
0.12
6.45
6.32
2.39
7.14
7.06
6.63
10711.58
10704.48
10661.58
8.08
7.98
7.75
12620.97
12589.19
12509.00
8.55
8.32
7.41
15069.35
14906.55
14292.58
7.57
7.51
6.33
94.14%
2.00%
16.97%
-13.11%
-20% 0% 20% 40% 60% 80% 100%
AAA and Equivalent
Unrated
Sovereign Securities
CBLO & Current Assets
Unrated also inclue BRDS

76
Rating Profile
Fund Details
Portfolio as on April 30, 2017
Quantitative Indicators
Style Box
Fund Managers :Rahul Goswami (Managing this fund since Sep, 2012 & Overall 20 years of experience)Nikhil Kabra(Managing this fund since Aug, 2016 & Overall 3 years of experience)
Indicative Investment Horizon:30 day and above
Monthly AAUM as on 30-Apr-17 :Rs. 8996.79 crores
Closing AUM as on 30-Apr-17 : Rs. 9850.99 crores
NAV (As on 28-Apr-17):IPSF Growth Option : 245.8360IPSF Direct Plan Growth Option : 253.2725Option/ sub-options :Growth Options and Dividend (with Daily, Weekly, fortnightly, Monthly, Quarterly and dividend other frequencies)(dividend payout*** and re-investment facility available)Application Amount for fresh Subscription:Rs.5,000 (plus in multiples of Re.1)Min.Addl.Investment :Rs.1,000 (plus in multiples of Re.1)
Exit load for Redemption / Switch out :-Lumpsum & STP Option - Nil
##SIP :Monthly Frequency: Rs. 1,000/- and in multiple of Rs. 1/-Quarterly Frequency: Rs. 5,000/- and in multiple of Rs. 1/-
&&SWP :Rs. 500/- and in multiples of Rs. 1/-
STP/ Flex STP/ Value STP * :Daily Frequency: Rs. 250/- and in multiples of Rs. 50/-Weekly, Monthly and Quarterly Frequency: Rs. 1,000/- and in multiples of Rs. 1/-
Min.Redemption Amt. :500/- or all units where amount is below 500/-
Company/Issuer Rating % to NAV
• Top Ten Holdings@Short Term < 8 Years, Long Term > 8 Years.^^ CRISIL has rated AA and company has put a withdrawal request for the CRISIL rating.
For Schemes which have discontinued fresh subscriptions with effect from October 01,2012,the dividend declared will be compulsorily paid out under the “dividend payout “option.@@ Total Expense Ratio is weighted average for the month. Ratio excludes service tax on management fees and includes B-15 clawback reversal, if any.##
Minimum number of installments for monthly frequency will be 6 and for Quarterly frequency will be 4. w.e.f February 01, 2017.* Minimum number of installments for daily, weekly and monthly frequency will be 6 and for Quarterly frequency will be 4. w.e.f February 01, 2017. Refer page No. 137 for definition of Flex STP and Value STP.&&
Minimum number of installments for both monthly and quarterly will be 2. w.e.f February 01, 2017.*** This facility will be available with all frequencies except daily frequency. In case of daily frequency, dividend will be mandatorily reinvested. In case the unit holder has opted for dividend payout option, the minimum amount for dividend payout shall be 100 (net of dividend distribution tax and other statutory levy, if any), else the dividend would be mandatorily reinvested.
Returns of ICICI Prudential Savings Fund - Growth Option as on - (IPSF)April 30, 2017
Average Maturity : 1.27 Years Modified Duration : 1.04 Years Yield To Maturity : 7.75%
ICICI Prudential Savings Fund(An Open Ended Income Fund)
Inception/Allotment date: 28-Mar-03
Entry load : Nil
RiskometerThis Product is suitable for investors who are seeking*:
• Short term savings solution
• A debt fund that invests in debt and money market instruments of various maturities with an aim to maximise income while maintaining an optimum balance of yield, safety and liquidity.
*Investors should consult their financial advisers if in doubt about whether the product is suitable for them.
Company/Issuer Rating % to NAV
Dividend History : Refer page no. from 122 to 130
SIP Returns : Refer page no. from 118 to 120
Total Expense Ratio @@ :
IPSF : 1.33% p. a.
IPSF Direct Plan : 0.52% p. a.
Investment Objective : Refer page no. from 131 to 134
Notes:1. Different plans shall have different expense structure. The performance details provided herein are of ICICI Prudential Savings Fund.2. The scheme is currently managed and . Mr. has been managing this fund since . Total Schemes managed Rahul Goswami Nikhil Kabra Rahul Goswami Sep 2012by the Fund Manager . Refer annexure from page no. 91 for performance of other schemes currently managed by .is 11 (9 are jointly managed) Rahul GoswamiMr. has been managing this fund since Aug 2016. Total Schemes managed by the Fund Manager . Refer annexure from Nikhil Kabra is 2 (2 are jointly managed)page no. 91 for performance of other schemes currently managed by . Nikhil Kabra3. Date of inception: 17-Nov-05 (IPSF - Growth Option).4. Past performance may or may not be sustained in future and the same may not necessarily provide the basis for comparison with other investment.5. Load is not considered for computation of returns.6. In case, the start/end date of the concerned period is a nonbusiness date (NBD), the NAV of the previous date is considered for computation of returns. The NAV per unit shown in the table is as on the start date of the said period
Scheme
1 Year T Bill (Additional Benchmark)
NAV (Rs.) Per Unit (as on April 28,2017 : 245.8360)
CAGR (%)
100.0000
Crisil Liquid Fund Index (Benchmark)
Since inception
CurrentValue of
Investment of Rs. 10000
CAGR (%) Current Value of
Investment of Rs. 10000
1 Year 3 Year 5 Year
CAGR (%) Current Value of
Investment of Rs. 10000
CAGR (%) Current Value of
Investment of Rs. 10000
226.2864 191.7595 160.6417
Particulars
8.66 10863.93 8.64 12820.02 8.89 15303.37 8.17 24583.60
7.06 10704.48 7.98 12589.19 8.32 14906.55 7.44 22746.71
6.63 10661.58 7.75 12509.00 7.41 14292.58 6.24 20001.00
36.14%
50.21%
1.02%
7.80%
4.83%
0% 10% 20% 30% 40% 50% 60%
AAA and Equivalent
AA and Equivalent
A and Equivalent
Sovereign Securities
CBLO & Current Assets
Treasury Bills SOV 4.33%@
Government Securities - Short Term 3.47% 08.20% GOI 2022 SOV 1.38% 06.11% GOI Floater 2020 SOV 0.81% 08.48% Odisha SDL 2021 SOV 0.64% 07.75% Rajasthan SDL 2018 SOV 0.37% 08.58% West Bengal SDL 2020 SOV 0.26% CPs and CDs 9.72%• IDFC Bank Ltd. ICRA A1+ 4.02% Deutsche Investments India Pvt. Ltd. CRISIL A1+ 2.22% Bharat Financial Inclusion Ltd. ICRA A1+ 0.99% Equitas Finance Ltd. FITCH A1+ 0.99% Fullerton India Credit Co. Ltd. ICRA A1+ 0.98% HDFC Ltd. CRISIL A1+ 0.52% Corporate Securities 77.65%• Vodafone Mobile Services Ltd.^^ FITCH AAA 8.47%• Vedanta Ltd. CRISIL AA 6.15%• Talwandi Sabo Power Ltd. CRISIL AA 5.11%• Tata Capital Financial Services Ltd. ICRA AA+ 4.82%• JSW Steel Ltd. CARE AA- 4.56%• Power Finance Corporation Ltd. CRISIL AAA 4.41%• Bahadur Chand Investments Private Ltd. ICRA AA 4.21%• India Infoline Finance Ltd. ICRA AA 4.15%• India Infoline Housing Finance Ltd. ICRA AA 4.09% Incline Realty Pvt. Ltd. (A Oberoi Group company) CARE AA+ 3.10% Small Industries Development Bank Of India CARE AAA 3.04% Tata Motors Finance Solutions Pvt. Ltd. CRISIL AA 2.84% Coffee Day Enterprises Pvt. Ltd. (Secured by BWR AA- 2.80% pledge of equity shares of Mindtree Ltd.)
HDFC Ltd. CRISIL AAA 1.98% Indiabulls Housing Finance Ltd. CARE AAA 1.58% Tata Power Company Ltd. CARE AA 1.54% Tata Sons Ltd. CRISIL AAA 1.52% Reliance Gas Transporation Infrastructure Ltd. CRISIL AAA 1.35% NABARD CRISIL AAA 1.30% Essel Mining & Industries Ltd. CRISIL AA 1.28% Clp Wind Farms (India) Pvt. Ltd. FITCH AA 1.27% Tata Motors Ltd. CARE AA+ 1.11% Cholamandalam Investment And Finance Company Ltd. ICRA AA 1.09% Prism Cement Ltd. ICRA A- 1.02% Rural Electrification Corporation Ltd. CRISIL AAA 0.95% Nirchem Cement Ltd. CRISIL AA 0.92%
Daimler Financial Services India Pvt. Ltd. FITCH AAA 0.76% Piramal Finance Ltd. ICRA AA 0.51% TATA Advanced Materials Ltd. CRISIL AA+ 0.49% NABHA Power Ltd. ICRA AAA 0.44% LIC Housing Finance Ltd. CRISIL AAA 0.41% Sun Pharma Laboratories Ltd. ICRA AAA 0.17% Steel Authority Of India Ltd. FITCH AA 0.06% Tata Motors Finance Ltd. CRISIL AA 0.05% Piramal Enterprises Ltd. ICRA AA 0.05% Volkswagen Finance Pvt. Ltd. FITCH AAA 0.03% CBLO & Net Current Assets 4.83% Total Net Assets 100.00%

77
Portfolio as on April 30, 2017
Quantitative Indicators
Fund Details
Style Box
Company/Issuer Rating % to NAV
For Schemes which have discontinued fresh subscriptions with effect from October 01,2012,the dividend declared will be compulsorily paid out under the “dividend payout “option.@@ Total Expense Ratio is weighted average for the month. Ratio excludes service tax on management fees and includes B-15 clawback reversal, if any.$$ Inception date shown is the date from which units under the plans are available throughout.## Minimum number of installments for monthly frequency will be 6 and for Quarterly frequency will be 4. w.e.f February 01, 2017.* Minimum number of installments for daily, weekly and monthly frequency will be 6 and for Quarterly frequency will be 4. w.e.f February 01, 2017. Refer page No. 137 for definition of Flex STP and Value STP.&& Minimum number of installments for both monthly and quarterly will be 2. w.e.f February 01, 2017.***This facility will be available with all frequencies except daily frequency. In case of daily frequency, dividend will be mandatorily reinvested. In case the unit holder has opted for dividend payout option, the minimum amount for dividend payout shall be 100 (net of dividend distribution tax and other statutory levy, if any), else the dividend would be mandatorily reinvested.
Fund Managers :
Rohan Maru(Managing this fund since Jan, 2015& overall 8 years of experience)Chandni Gupta(Managing this fund since Aug, 2016 &Overall 9 years of experience)
Indicative Investment Horizon:1 month and above
Inception/Allotment date : 12-Jun-09
Monthly AAUM as on 30-Apr-17 : Rs. 8844.99 crores
Closing AUM as on 30-Apr-17 : Rs. 8672.45 crores
NAV (As on 28-Apr-17):IPUSTP Growth Option : 16.7759IPUSTP Direct Plan Growth Option : 17.1711
Option/ sub-options :Growth Options and Dividend (with Daily, Weekly, Fortnightly, Monthly, Quarterly and Half Yearly frequencies)(dividend payout*** and re-investment facility available)
Application Amount for freshSubscription :Rs.5,000 (plus in multiples of Re.1)
Min.Addl.Investment :Rs.1,000 (plus in multiples of Re.1)
Exit load for Redemption / Switch out:- Lumpsum & STP Option - Nil
##SIP :Monthly Frequency: Rs. 1,000/- and in multiple of Rs. 1/-Quarterly Frequency: Rs. 5,000/- and in multiple of Rs. 1/-
&&SWP :Rs. 500/- and in multiples of Rs. 1/-
STP/ Flex STP/ Value STP * :Daily Frequency: Rs. 250/- and in multiples of Rs. 50/-Weekly, Monthly and Quarterly Frequency: Rs. 1,000/- and in multiples of Rs. 1/-
Min.Redemption Amt. :500/- or all units where amount is below 500/-
• Top Ten Holdings&Please refer to annexure on “Pass Through Certificates Details”
for complete details.@Short Term < 8 Years, Long Term > 8 Years.^^ CRISIL has rated AA and company has put a withdrawal request for the CRISIL rating.
Returns of ICICI Prudential Ultra Short Term Plan - Growth Option as on - (IPUSTP)April 30, 2017
Average Maturity : 2.88 Years Modified Duration : 2.31 Years Yield To Maturity : 7.41%
ICICI Prudential Ultra Short Term Plan(An Open Ended Income Fund)
Entry load : Nil
RiskometerThis Product is suitable for investors who are seeking*:
• Short term savings solution
• A Debt Fund that aims to generate regular income by investing in debt and money market instruments of very short maturities.
*Investors should consult their financial advisers if in doubt about whether the product is suitable for them.
Company/Issuer Rating % to NAV
Dividend History : Refer page no. from 122 to 130
SIP Returns : Refer page no. from 118 to 120
Total Expense Ratio @@ :
IPUSTP : 0.58% p. a.
IPUSTP Direct Plan : 0.26% p. a.
Investment Objective : Refer page no. from 131 to 134
Rating Profile
Notes:1. Different plans shall have different expense structure. The performance details provided herein are of ICICI Prudential Ultra Short Term Plan.2. The scheme is currently managed and Chandni Gupta. Mr. has been managing this fund since . Total Schemes managed by Rohan Maru Rohan Maru Jan 2015the Fund Manager . Refer annexure from page no. 91 for performance of other schemes currently managed by .is 5 (3 are jointly managed) Rohan MaruMr. Chandni Gupta has been managing this fund since Aug 2016. Total Schemes managed by the Fund Manager . Refer annexure from is 3 (3 are jointly managed)page no. 91 for performance of other schemes currently managed by Chandni Gupta. 3. Date of inception $$ : 05-April-11 (IPUSTP - Growth Option).4. Past performance may or may not be sustained in future and the same may not necessarily provide the basis for comparison with other investment.5. Load is not considered for computation of returns.6. In case, the start/end date of the concerned period is a nonbusiness date (NBD), the NAV of the previous date is considered for computation of returns. The NAV per unit shown in the table is as on the start date of the said period
Scheme
1 Year T Bill (Additional Benchmark)
NAV (Rs.) Per Unit (as on April 28,2017 : 16.7759)
CAGR (%)
10.0000
CRISIL Short Term Bond Fund Index (Benchmark)
Since inception
CurrentValue of
Investment of Rs. 10000
CAGR (%) Current Value of
Investment of Rs. 10000
1 Year 3 Year 5 Year
CAGR (%) Current Value of
Investment of Rs. 10000
CAGR (%) Current Value of
Investment of Rs. 10000
15.4442 12.9517 10.9442
Particulars
8.65 10862.27 9.02 12952.66 8.92 15328.58 8.90 16775.90
8.70 10867.02 9.18 13010.59 9.05 15419.58 8.95 16820.49
6.63 10661.58 7.75 12509.00 7.41 14292.58 7.32 15349.57
62.06%
7.71%
29.25%
0.98%
0% 10% 20% 30% 40% 50% 60% 70%
AAA and Equivalent
AA and Equivalent
Sovereign Securities
CBLO & Current Assets
Government Securities 29.25%@
Short Term 28.10%• 08.48% Odisha SDL 2021 SOV 5.41%• 08.21% Haryana SDL 2022 SOV 4.39% 08.20% GOI 2022 SOV 3.14% 08.39% Andhra Pradesh SDL 2020 SOV 2.32% 07.16% GOI 2023 SOV 1.68% 08.01% Rajasthan SDL 2020 SOV 1.36% 08.24% Tamil Nadu SDL 2020 SOV 1.25% 08.52% Rajasthan SDL 2021 SOV 1.02% 08.15% Rajasthan SDL 2021 SOV 0.99% 08.39% Rajasthan SDL 2022 SOV 0.87% 08.13% GOI 2022 SOV 0.60% 06.93% Punjab SDL 2020 SOV 0.57% 08.49% Punjab SDL 2022 SOV 0.50% 08.32% Punjab SDL 2020 SOV 0.48% 08.57% Haryana SDL 2023 SOV 0.42% 08.44% Tamil Nadu SDL 2020 SOV 0.33% 08.37% Andhra Pradesh SDL 2020 SOV 0.30% 08.99% Madhya Pradesh SDL 2022 SOV 0.12% 08.76% Maharashtra SDL 2022 SOV 0.12% 08.53% Punjab SDL 2022 SOV 0.12% 08.11% Andhra Pradesh SDL 2020 SOV 0.12% 08.05% Telangana SDL 2025 SOV 0.12% 08.03% Madhya Pradesh SDL 2025 SOV 0.12% 07.94% Telangana SDL 2024 SOV 0.12% 07.92% Madhya Pradesh SDL 2024 SOV 0.12% 07.89% Himachal Pradesh SDL 2025 SOV 0.12% 07.72% Tamil Nadu SDL 2023 SOV 0.12% 07.70% Tamil Nadu SDL 2023 SOV 0.12% 07.70% Telangana SDL 2023 SOV 0.12% 07.68% Madhya Pradesh SDL 2023 SOV 0.12% 07.74% Himachal Pradesh SDL 2024 SOV 0.12% 07.72% Tamil Nadu SDL 2024 SOV 0.12% 07.72% Tamil Nadu SDL 2025 SOV 0.12% 07.70% Tamil Nadu SDL 2024 SOV 0.12% 07.70% Tamil Nadu SDL 2025 SOV 0.11% 07.51% Himachal Pradesh SDL 2023 SOV 0.11% 08.16% Tamil Nadu SDL 2020 SOV 0.09% 06.35% GOI 2020 SOV 0.06% 08.56% Maharashtra SDL 2021 SOV 0.04% 08.60% Maharashtra SDL 2021 SOV 0.04% 08.59% Gujarat SDL 2021 SOV 0.03%
@ Long Term 1.15% 07.93% Telangana SDL 2027 SOV 0.12% 07.91% Madhya Pradesh SDL 2027 SOV 0.12% 07.77% Himachal Pradesh SDL 2027 SOV 0.12% 07.72% Tamil Nadu SDL 2027 SOV 0.12% 07.72% Tamil Nadu SDL 2026 SOV 0.12% 07.71% Telangana SDL 2026 SOV 0.11% 07.70% Tamil Nadu SDL 2026 SOV 0.11% 07.70% Tamil Nadu SDL 2027 SOV 0.11% 07.69% Madhya Pradesh SDL 2026 SOV 0.11% 07.63% Himachal Pradesh SDL 2026 SOV 0.11% CPs and CDs 22.30%• HDFC Ltd. CRISIL A1+ 9.24%• NABARD CRISIL A1+ 4.86% Adani Ports and Special Economic Zone Ltd. ICRA A1+ 2.64%
IndusInd Bank Ltd. CRISIL A1+ 2.00% J M Financial Products Pvt. Ltd. CRISIL A1+ 1.13% Axis Bank Ltd. CRISIL A1+ 0.86% Standard Chartered Investment & Loan (India) Ltd. CRISIL A1+ 0.77% Daimler Financial Services India Pvt. Ltd. FITCH A1+ 0.57% Bajaj Finance Ltd. CRISIL A1+ 0.23% Corporate Securities 46.90%• LIC Housing Finance Ltd. CRISIL AAA 8.33%• Power Finance Corporation Ltd. CRISIL AAA 6.74%• Reliance Jio Infocomm Ltd. CRISIL AAA 3.96%• Axis Bank Ltd. CRISIL AAA 3.81%• Shriram Industrial Holdings Ltd. ICRA AA 3.69%• Vodafone Mobile Services Ltd.^^ FITCH AAA 3.56% ICICI Bank Ltd. ICRA AAA 3.37% HDFC Ltd. CRISIL AAA 2.64% State Bank Of India CRISIL AA+ 2.04% Tata Motors Finance Ltd. CRISIL AA 1.98% Mahindra Vehicle Manufacturers Ltd. ICRA AAA 1.79% ONGC Mangalore Petro Chemicals Ltd. FITCH AAA 1.44% NABARD CRISIL AAA 0.91% SP Jammu Udhampur Highway Ltd. ICRA AAA 0.60% Sun Pharma Laboratories Ltd. ICRA AAA 0.48% Export-Import Bank Of India CRISIL AAA 0.42% ICICI Home Finance Company Ltd. ICRA AAA 0.40% Mahindra & Mahindra Financial Services Ltd. FITCH AAA 0.32% Power Grid Corporation Of India Ltd. CRISIL AAA 0.20% Rural Electrification Corporation Ltd. CRISIL AAA 0.13% Ultratech Cement Ltd. CRISIL AAA 0.08%
& Pass Through Certificates 0.57% Sansar Trust September 2016 V (Originator is
Shriram Transport Finance Company Ltd.) CRISIL AAA(SO) 0.57% CBLO & Net Current Assets 0.98% Total Net Assets 100.00%

78
Fund Details
Rating Profile
Quantitative Indicators
Portfolio as on April 30, 2017
• Top Ten Holdings@Short Term < 8 Years, Long Term > 8 Years.^^ CRISIL has rated AA and company has put a withdrawal request for the CRISIL rating.
Company/Issuer % to NAVRating
Fund Managers :
Rahul Goswami (Managing this fund since Sep, 2012 & Overall 20 years of experience)
Indicative Investment Horizon:12 months & above
Inception/Allotment date: 12-Jun-09
Monthly AAUM as on 30-Apr-17 : Rs. 1373.18 crores
Closing AUM as on 30-Apr-17 :Rs. 1383.22 crores
NAV (As on 28-Apr-17):IPDBF Growth Option : 18.8267IPDBF Direct Plan Growth Option : 19.3407Option/ sub-options :Growth Options and Dividend Option(with Daily, Monthly, Quarterly, Half Yearly and Annual frequencies)(dividend payout*** and re-investment facility available)
Application Amount for freshSubscription :Rs.5,000 (plus in multiples of Re.1)
Min.Addl.Investment :Rs.1,000 (plus in multiples of Re.1)
Exit load for Redemption / Switch out:- Lumpsum & STP OptionWithin 3 Months from allotment - 1% ofapplicable NAV, more than 3 Months - Nil (w.e.f. 01-Apr-16)
##SIP :Monthly Frequency: Rs. 1,000/- and in multiple of Rs. 1/-Quarterly Frequency: Rs. 5,000/- and in multiple of Rs. 1/-
&&SWP :Rs. 500/- and in multiples of Rs. 1/-
STP/ Flex STP/ Value STP * :Daily Frequency: Rs. 250/- and in multiples of Rs. 50/-Weekly, Monthly and Quarterly Frequency: Rs. 1,000/- and in multiples of Rs. 1/-
Min.Redemption Amt. :500/- or all units where amount is below 500/-
For Schemes which have discontinued fresh subscriptions with effect from October 01,2012,the dividend declared will be compulsorily paid out under the “dividend payout “option.
@@ Total Expense Ratio is weighted average for the month. Ratio excludes service tax on management fees and includes B-15 clawback reversal, if any.## Minimum number of installments for monthly frequency will be 6 and for Quarterly frequency will be 4. w.e.f February 01, 2017.* Minimum number of installments for daily, weekly and monthly frequency will be 6 and for Quarterly frequency will be 4. w.e.f February 01, 2017. Refer page No. 137 for definition of Flex STP and Value STP.&& Minimum number of installments for both monthly and quarterly will be 2. w.e.f February 01, 2017.***This facility will be available with all frequencies except daily frequency. In case of daily frequency, dividend will be mandatorily reinvested. In case the unit holder has opted for dividend payout option, the minimum amount for dividend payout shall be 100 (net of dividend distribution tax and other statutory levy, if any), else the dividend would be mandatorily reinvested.
Government Securities 57.33%@ Short Term 26.96%
• 08.62% Maharashtra SDL 2023 SOV 6.07%• 08.21% Haryana SDL 2023 SOV 3.71%• 06.35% GOI 2024 SOV 3.35% 08.70% Kerala SDL 2022 SOV 1.90% 08.50% Punjab SDL 2025 SOV 1.88% 08.27% Rajasthan SDL 2022 SOV 1.12% 08.27% Rajasthan SDL 2023 SOV 1.12% 08.29% Rajasthan SDL 2024 SOV 1.12% 09.28% Uttar Pradesh SDL 2022 SOV 0.78% 08.48% Odisha SDL 2021 SOV 0.75% 08.02% Tamil Nadu SDL 2025 SOV 0.74% 08.21% Rajasthan SDL 2023 SOV 0.74% 07.91% Tamil Nadu SDL 2024 SOV 0.74% 07.67% Tamil Nadu SDL 2023 SOV 0.73% 08.72% Andhra Pradesh SDL 2022 SOV 0.38% 08.53% Punjab SDL 2022 SOV 0.38% 08.39% Rajasthan SDL 2023 SOV 0.37% 08.05% Telangana SDL 2025 SOV 0.37% 07.94% Telangana SDL 2024 SOV 0.37% 07.70% Telangana SDL 2023 SOV 0.36%
@ Long Term 30.37%• 06.97% GOI 2026 SOV 9.76%• 06.79% GOI 2029 SOV 5.98%• 08.15% GOI 2026 SOV 4.20%• 06.90% GOI 2026 SOV 3.80% 07.88% GOI 2030 SOV 1.88% 07.90% Tamil Nadu SDL 2027 SOV 0.74% 07.68% Tamil Nadu SDL 2026 SOV 0.73% 08.13% GOI 2045 SOV 0.38% 08.17% Tamil Nadu SDL 2025 SOV 0.37% 07.93% Telangana SDL 2027 SOV 0.37% 07.71% Tamil Nadu SDL 2029 SOV 0.36% 07.71% Tamil Nadu SDL 2030 SOV 0.36% 07.71% Telangana SDL 2026 SOV 0.36% 07.71% Tamil Nadu SDL 2031 SOV 0.36% 07.71% Tamil Nadu SDL 2028 SOV 0.36% 07.71% Tamil Nadu SDL 2032 SOV 0.36% Corporate Securities 30.83%• The Great Eastern Shipping Company Ltd. BWR AAA 9.57%• India Infoline Finance Ltd. ICRA AA 5.90%
Returns of ICICI Prudential Dynamic Bond Fund - Growth Option as on - (IPDBF)April 30, 2017
Average Maturity : 6.93 Years Modified Duration : 4.74 Years Yield To Maturity : 7.54%
ICICI Prudential Dynamic Bond Fund(An Open Ended Income Fund)
Entry load : Nil
RiskometerThis Product is suitable for investors who are seeking*:
• Medium term wealth creation solution
• A debt fund that invests in Debt and money market instruments with a view to provide regular income and growth of capital.
*Investors should consult their financial advisers if in doubt about whether the product is suitable for them.
Dividend History : Refer page no. from 122 to 130
SIP Returns : Refer page no. from 118 to 120
Total Expense Ratio @@ :
IPDBF : 1.31% p. a.
IPDBF Direct Plan : 0.31% p. a.
Investment Objective : Refer page no. from 131 to 134
Company/Issuer % to NAVRating
• Export-Import Bank Of India CRISIL AAA 3.38% Vodafone Mobile Services Ltd.^^ FITCH AAA 3.28% Clp Wind Farms (India) Pvt. Ltd. FITCH AA 2.87% SP Jammu Udhampur Highway Ltd. ICRA AAA 2.22% State Bank Of India CRISIL AA+ 1.83% Reliance Ports & Terminals Ltd. CRISIL AAA 1.78% CBLO & Net Current Assets 11.84% Total Net Assets 100.00%
Notes:1. Different plans shall have different expense structure. The performance details provided herein are of ICICI Prudential Dynamic Bond Fund.2. The scheme is currently managed . Mr. has been managing this fund since . Total Schemes managed by the Fund Rahul Goswami Rahul Goswami Sep 2012Manager . Refer annexure from page no. 91 for performance of other schemes currently managed by .is 11 (9 are jointly managed) Rahul Goswami3. Date of inception:12-Jun-09.4. Past performance may or may not be sustained in future and the same may not necessarily provide the basis for comparison with other investment.5. Load is not considered for computation of returns.6. In case, the start/end date of the concerned period is a nonbusiness date (NBD), the NAV of the previous date is considered for computation of returns. The NAV per unit shown in the table is as on the start date of the said period
Scheme
1 Year T Bill (Additional Benchmark)
NAV (Rs.) Per Unit (as on April 28,2017 : 18.8267)
CAGR (%)
10.0000
Crisil Composite Bond Fund Index (Benchmark)
Since inception
CurrentValue of
Investment of Rs. 10000
CAGR (%) Current Value of
Investment of Rs. 10000
1 Year 3 Year 5 Year
CAGR (%) Current Value of
Investment of Rs. 10000
CAGR (%) Current Value of
Investment of Rs. 10000
17.0872 13.7669 11.9360
Particulars
20.23%
10.60%
57.33%
11.84%
0% 10% 20% 30% 40% 50% 60% 70%
AAA and Equivalent
AA and Equivalent
Sovereign Securities
CBLO & Current Assets
10.21 11018.01 11.01 13675.34 9.55 15773.04 8.36 18826.70
10.07 11004.47 10.93 13646.82 9.28 15582.87 8.06 18419.97
6.63 10661.58 7.75 12509.00 7.41 14292.58 6.36 16255.34

79
Fund Details
Portfolio as on April 30, 2017
Rating Profile
Quantitative Indicators
Style Box
Company/Issuer Rating % to NAV
Fund Managers :
Manish Banthia (Managing this fund since Nov, 2009 & Overall 13 years of experience)
Indicative Investment Horizon:6 months and aboveInception/Allotment date:IPSTP : 25-Oct-01IPSTP Institutional Option : 03-Apr-03Monthly AAUM as on 30-Apr-17 : Rs. 8774.91 crores
Closing AUM as on 30-Apr-17 : Rs. 8700.73 croresNAV (As on 28-Apr-17):IPSTP Growth Option : 34.2061IPSTP Direct Plan Growth Option : 35.1405Option/ sub-options : Growth Optionsand Dividend Option, (with Monthly, Fortnightly and Half Yearly frequencies)(dividend payout*** and re-investment facility available)
Application Amount for freshSubscription :Rs.5,000 (plus in multiples of Re.1)
Min.Addl.Investment :Rs.1,000 (plus in multiples of Re.1)
Entry load : Nil
Exit load for Redemption / Switchout :- Lumpsum & SIP / STP OptionWithin 7 Days from allotment - 0.25% ofapplicable NAV, more than 7 Days - Nil(w.e.f. 03-May-16)
##SIP :Monthly Frequency: Rs. 1,000/- and in multiple of Rs. 1/-Quarterly Frequency: Rs. 5,000/- and in multiple of Rs. 1/-
&&SWP :Rs. 500/- and in multiples of Rs. 1/-
STP/ Flex STP/ Value STP * :Daily Frequency: Rs. 250/- and in multiples of Rs. 50/-Weekly, Monthly and Quarterly Frequency: Rs. 1,000/- and in multiples of Rs. 1/-
Min.Redemption Amt. :500/- or all units where amount is below 500/-
For Schemes which have discontinued fresh subscriptions with effect from October 01,2012,the dividend declared will be compulsorily paid out under the “dividend payout “option.
@@ Total Expense Ratio is weighted average for the month. Ratio excludes service tax on management fees and includes B-15 clawback reversal, if any.## Minimum number of installments for monthly frequency will be 6 and for Quarterly frequency will be 4. w.e.f February 01, 2017.* Minimum number of installments for daily, weekly and monthly frequency will be 6 and for Quarterly frequency will be 4. w.e.f February 01, 2017. Refer page No. 137 for definition of Flex STP and Value STP.&& Minimum number of installments for both monthly and quarterly will be 2. w.e.f February 01, 2017.*** This facility will be available with all frequencies except daily frequency. In case of daily frequency, dividend will be mandatorily reinvested. In case the unit holder has opted for dividend payout option, the minimum amount for dividend payout shall be 100 (net of dividend distribution tax and other statutory levy, if any), else the dividend would be mandatorily reinvested.
• Top Ten Holdings&Please refer to annexure on “Pass Through Certificates Details”
for complete details.@Short Term < 8 Years, Long Term > 8 Years.^^ CRISIL has rated AA and company has put a withdrawal request for the CRISIL rating.
Returns of ICICI Prudential Short Term Plan - Growth Option as on - (IPSTP)April 30, 2017
Average Maturity : 3.87 Years Modified Duration : 2.97 Years Yield To Maturity : 7.71%
Company/Issuer Rating % to NAV
Government Securities 33.04% Short Term@ 27.32%• 08.20% GOI 2022 SOV 5.15%• 08.39% Rajasthan SDL 2022 SOV 4.05% 08.48% Odisha SDL 2021 SOV 2.38% 08.53% Punjab SDL 2022 SOV 2.18% 08.57% Haryana SDL 2023 SOV 2.16% 08.64% Uttar Pradesh SDL 2023 SOV 1.20% 08.45% Punjab SDL 2023 SOV 0.66% 08.21% Haryana SDL 2022 SOV 0.59% 08.03% Madhya Pradesh SDL 2025 SOV 0.58% 07.92% Madhya Pradesh SDL 2024 SOV 0.58% 07.68% Madhya Pradesh SDL 2023 SOV 0.58% 08.52% Uttar Pradesh SDL 2022 SOV 0.42% 09.22% Tamil Nadu SDL 2021 SOV 0.31% 08.10% Uttar Pradesh SDL 2020 SOV 0.29% 08.02% Tamil Nadu SDL 2025 SOV 0.29% 07.91% Tamil Nadu SDL 2024 SOV 0.29% 08.39% Rajasthan SDL 2021 SOV 0.29% 07.67% Tamil Nadu SDL 2023 SOV 0.29% 07.54% Himachal Pradesh SDL 2023 SOV 0.29% 08.27% Rajasthan SDL 2022 SOV 0.28% 08.27% Rajasthan SDL 2023 SOV 0.28% 08.29% Rajasthan SDL 2024 SOV 0.28% 08.34% Punjab SDL 2020 SOV 0.28% 08.32% Punjab SDL 2020 SOV 0.28% 08.92% Punjab SDL 2022 SOV 0.24% 08.53% Jharkhand SDL 2022 SOV 0.24% 08.49% Punjab SDL 2022 SOV 0.24% 07.89% Himachal Pradesh SDL 2025 SOV 0.23% 07.71% Tamil Nadu SDL 2023 SOV 0.23% 07.74% Himachal Pradesh SDL 2024 SOV 0.23% 07.71% Tamil Nadu SDL 2024 SOV 0.23% 07.71% Tamil Nadu SDL 2025 SOV 0.23% 07.51% Himachal Pradesh SDL 2023 SOV 0.23% 08.94% Gujarat SDL 2022 SOV 0.12% 08.92% Karnataka SDL 2022 SOV 0.12% 09.60% Gujarat SDL 2018 SOV 0.12% 08.01% Telangana SDL 2025 SOV 0.12% 07.87% Telangana SDL 2024 SOV 0.12% 07.63% Telangana SDL 2023 SOV 0.11% 08.91% Punjab SDL 2022 SOV 0.09% 08.95% Maharashtra SDL 2022 SOV 0.06% 08.64% Andhra Pradesh SDL 2023 SOV 0.06% 08.51% Maharashtra SDL 2021 SOV 0.06% 08.11% Andhra Pradesh SDL 2020 SOV 0.06% 08.05% Telangana SDL 2025 SOV 0.06% 07.94% Telangana SDL 2024 SOV 0.06% 07.70% Telangana SDL 2023 SOV 0.06% 08.21% Rajasthan SDL 2022 SOV 0.02%
@ Long Term 5.72% 07.91% Madhya Pradesh SDL 2027 SOV 0.58% 07.69% Madhya Pradesh SDL 2026 SOV 0.57% 07.88% Punjab SDL 2027 SOV 0.43% 08.25% Madhya Pradesh SDL 2028 SOV 0.42% 08.06% Madhya Pradesh SDL 2031 SOV 0.41% 08.05% Madhya Pradesh SDL 2029 SOV 0.41% 08.02% Madhya Pradesh SDL 2030 SOV 0.41% 07.93% Madhya Pradesh SDL 2032 SOV 0.41% 07.90% Tamil Nadu SDL 2027 SOV 0.29% 07.68% Tamil Nadu SDL 2026 SOV 0.29% 07.77% Himachal Pradesh SDL 2027 SOV 0.23% 07.71% Tamil Nadu SDL 2027 SOV 0.23% 07.71% Tamil Nadu SDL 2026 SOV 0.23% 07.63% Himachal Pradesh SDL 2026 SOV 0.23% 07.81% Telangana SDL 2027 SOV 0.12% 07.62% Telangana SDL 2026 SOV 0.11% 08.24% Tamil Nadu SDL 2028 SOV 0.08% 08.05% Tamil Nadu SDL 2031 SOV 0.08% 08.04% Tamil Nadu SDL 2029 SOV 0.08% 07.93% Telangana SDL 2027 SOV 0.06% 07.71% Telangana SDL 2026 SOV 0.06% 08.15% GOI 2026 SOV 0.01% CPs and CDs 0.01% Kotak Mahindra Bank Ltd. CRISIL A1+ 0.01% Corporate Securities 54.73%• Power Finance Corporation Ltd. CRISIL AAA 9.59%
• HDFC Ltd. CRISIL AAA 5.29%• LIC Housing Finance Ltd. CRISIL AAA 4.84%• Axis Bank Ltd. CRISIL AAA 4.54%• Vodafone Mobile Services Ltd.^^ FITCH AAA 3.61%• Reliance Utilities & Power Private Ltd. CRISIL AAA 3.57%• Volkswagen Finance Pvt. Ltd. FITCH AAA 3.47%• Tata Steel Ltd. BWR AA 2.94% ONGC Mangalore Petro Chemicals Ltd. FITCH AAA 2.33% Daimler Financial Services India Pvt. Ltd. FITCH AAA 2.02% Tata Motors Finance Ltd. CRISIL AA 1.97% India Infoline Housing Finance Ltd. ICRA AA 1.16% NABARD CRISIL AAA 1.15% Tata Motors Finance Solutions Pvt. Ltd. CRISIL AA 1.05% Rural Electrification Corporation Ltd. CRISIL AAA 0.89% Reliance Gas Transporation Infrastructure Ltd. CRISIL AAA 0.85% Jagran Prakashan Ltd. CRISIL AA+ 0.76% Tata Motors Ltd. CARE AA+ 0.70% The Great Eastern Shipping Company Ltd. BWR AAA 0.70% ICICI Bank Ltd. ICRA AAA 0.58% National Highways Authority of India CRISIL AAA 0.58% The Indian Hotels Company Ltd. ICRA AA 0.54% Nirchem Cement Ltd. CRISIL AA 0.46% NHPC Ltd. ICRA AAA 0.42% Power Grid Corporation Of India Ltd. CRISIL AAA 0.36% India Infoline Finance Ltd. ICRA AA 0.29% Nuclear Power Corporation of India Ltd. CRISIL AAA 0.06%
& Pass Through Certificates 2.95% MFL Securitisation Trust XLII (Originator is Magma Fincorp Ltd.) ICRA AAA(SO) 1.14% MFL Securitisation Trust XLIX (Originator is Magma Fincorp Ltd.) CRISIL AAA(SO) 0.96% Sansar Trust September 2016 V (Originator is Shriram Transport Finance Company Ltd.) CRISIL AAA(SO) 0.86% CBLO & Net Current Assets 9.27% Total Net Assets 100.00%
ICICI Prudential Short Term Plan(An Open Ended Income Fund)
RiskometerThis Product is suitable for investors who are seeking*:
• Short term income generation and capital appreciation solution
• A debt fund that aims to generate income by investing in a range of debt and money market instruments of various maturities.
*Investors should consult their financial advisers if in doubt about whether the product is suitable for them.
Dividend History : Refer page no. from 122 to 130
SIP Returns : Refer page no. from 118 to 120
Total Expense Ratio @@ :
: 1.22% p. a.IPSTP
IPSTP Direct Plan : 0.35% p. a.
Investment Objective : Refer page no. from 131 to 134
Notes:1. Different plans shall have different expense structure. The performance details provided herein are of ICICI Prudential Short Term Plan.2. The scheme is currently managed Manish Banthia. Mr. Manish Banthia has been managing this fund since . Total Schemes managed by the Fund Nov 2009Manager . Refer annexure from page no. 91 for performance of other schemes currently managed by Manish Banthia. is 19 (5 are jointly managed) 3. Date of inception: 25-Oct-01.4. Past performance may or may not be sustained in future and the same may not necessarily provide the basis for comparison with other investment.5. Load is not considered for computation of returns.6. In case, the start/end date of the concerned period is a nonbusiness date (NBD), the NAV of the previous date is considered for computation of returns. The NAV per unit shown in the table is as on the start date of the said period7. As the scheme was launched before the launch of the benchmark index, benchmark index figures since inception or the required period are not available.
Scheme
1 Year T Bill (Additional Benchmark)
NAV (Rs.) Per Unit (as on April 28,2017 : 34.2061)
CAGR (%)
10.0000
CRISIL Short Term Bond Fund Index (Benchmark)
Since inception
CurrentValue of
Investment of Rs. 10000
CAGR (%) Current Value of
Investment of Rs. 10000
1 Year 3 Year 5 Year
CAGR (%) Current Value of
Investment of Rs. 10000
CAGR (%) Current Value of
Investment of Rs. 10000
31.2520 25.9007 21.9797
Particulars
9.48 10945.25 9.72 13206.63 9.25 15562.59 8.25 34206.10
8.70 10867.02 9.18 13010.59 9.05 15419.58 NA NA
6.63 10661.58 7.75 12509.00 7.41 14292.58 6.00 24715.80
47.82%
9.87%
33.04%
9.27%
0% 10% 20% 30% 40% 50% 60%
AAA and Equivalent
AA and Equivalent
Sovereign Securities
CBLO & Current Assets

80
Fund Details
Portfolio as on April 30, 2017
Quantitative Indicators
Company/Issuer Rating % to NAV
Style Box
Fund Managers :
Rahul Bhuskute (Managing this fund since Oct, 2013 & Overall 19 years of experience)Manish Banthia(Managing this fund since Nov, 2016 & Overall 13 years of experience)
Indicative Investment Horizon:3 years and above
Inception/Allotment date: 03-Dec-10
Monthly AAUM as on 30-Apr-17 : Rs. 7044.31 crores
Closing AUM as on 30-Apr-17 : Rs. 7101.88 croresNAV (As on 28-Apr-17):IPRSF Growth Option : 17.4426IPRSF Direct Plan Growth Option : 18.1357Option/ sub-options : Growth Options and Dividend Option (with Quarterly, Half Yearly and Annual frequencies)(dividend payout*** and re-investment facility available)###Application Amount for freshSubscription :Rs. 10,000 (plus in multiple of Re.1)
Min.Addl.Investment :Rs. 1,000/- (plus in multiple of Re. 1)
Exit load for Redemption / Switchout :- Lumpsum & SIP / STP / SWP #/ AWP10% of units within 1 Year from allotment - Nil.More than 10% of units, within 1 Year - 1% of applicable NAVMore than 1 Year - Nil (w.e.f. 05-Oct-16)
##SIP :Monthly Frequency: Rs. 1,000/- and in multiple of Rs. 1/-Quarterly Frequency: Rs. 5,000/- and in multiple of Rs. 1/-
&&SWP :Rs. 500/- and in multiples of Rs. 1/-
STP/ Flex STP/ Value STP * :Daily Frequency: Rs. 250/- and in multiples of Rs. 50/-Weekly, Monthly and Quarterly Frequency: Rs. 1,000/- and in multiples of Rs. 1/-
Min.Redemption Amt. :500/- or all units where amount is below 500/-
Returns of ICICI Prudential Regular Savings Fund - Growth Option as on - (IPRSF) April 30, 2017
Average Maturity : 2.59 Years Modified Duration : 2.00 Years Yield To Maturity : 9.07%
ICICI Prudential Regular Savings Fund(An Open Ended Income Fund)
# Automatic Withdrawal Plan (AWP) feature will allow investors to redeem a fixed sum of money periodically at the prevailing Net Asset Value (NAV) depending on the option chosen by the investor. For more details of this feature, Investors are requested to visit the website of the AMC viz., www.icicipruamc.com###Maximum Investment Amount :1)With effect from December 30, 2016, maximum Investment Amount per investor (based on Permanent Account Number of first holder) applicable at the time ofinvestment shall not exceed Rs. 50 crore except to the extent detailed in point no. 2 below.2) The AMC/Mutual Fund will accept amount greater than 50 crore, subject to the below limits: a) Maximum Investment Amount per investor across all folios does not exceed 100 crore, and b) The aggregate investmentsof all the investors with more than 50 crore but less than 100 crore, does not exceed 10% of the corpus of the Scheme (as on previous business day)For Schemes which have discontinued fresh subscriptions with effect from October 01,2012,the dividend declared will be compulsorily paid out under the “dividend payout “option.@@ Total Expense Ratio is weighted average for the month. Ratio excludes service tax on management fees and includes B-15 clawback reversal, if any.## Minimum number of installments for monthly frequency will be 6 and for Quarterly frequency will be 4. w.e.f February 01, 2017.* Minimum number of installments for daily, weekly and monthly frequency will be 6 and for Quarterly frequency will be 4. w.e.f February 01, 2017. Refer page No. 137 for definition of Flex STP and Value STP.&&
Minimum number of installments for both monthly and quarterly will be 2. w.e.f February 01, 2017.*** In case the unit holder has opted for dividend payout option, the minimum amount for dividend payout shall be 100 (net of dividend distribution tax and other statutory levy, if any), else the dividend would be mandatorily reinvested.
• Top Ten Holdings&Please refer to annexure on “Pass Through Certificates Details” for complete details.^^ CRISIL has rated AA and company has put a withdrawal request for the CRISIL rating.
Company/Issuer Rating % to NAV
Entry load : Nil
RiskometerThis Product is suitable for investors who are seeking*:
• Medium term savings solution
• A debt fund that aims to deliver consistent performance by investing in a basket of debt and money market instruments with a view to provide reasonable returns while maintaining optimum balance of safety, liquidity and yield.
*Investors should consult their financial advisers if in doubt about whether the product is suitable for them.
Rating Profile
Unrated also include D Rating
Dividend History : Refer page no. from 122 to 130
SIP Returns : Refer page no. from 118 to 120
Total Expense Ratio @@ :
IPRSF : 1.74% p. a.
IPRSF Direct Plan : 0.83% p. a.
Investment Objective : Refer page no. from 131 to 134
Notes:1. Different plans shall have different expense structure. The performance details provided herein are of ICICI Prudential Regular Savings Fund.2. The scheme is currently managed Manish Banthia. Mr. has been managing this fund since 3. Total Schemes managed Rahul Bhuskute, Rahul Bhuskute Oct 201by the Fund Manager . Refer annexure from page no. 91 for performance of other schemes currently managed by .(Debt) is 3 Rahul BhuskuteMr. Manish Banthia has been managing this fund since . Total Schemes managed by the Fund Manager . Refer annexure Nov 2016 is 19 (5 are jointly managed)from page no. 91 for performance of other schemes currently managed by Manish Banthia. 3. Date of inception:03-Dec-10.4. Past performance may or may not be sustained in future and the same may not necessarily provide the basis for comparison with other investment.5. Load is not considered for computation of returns.6. In case, the start/end date of the concerned period is a nonbusiness date (NBD), the NAV of the previous date is considered for computation of returns. The NAV per unit shown in the table is as on the start date of the said period
Scheme
1 Year T Bill (Additional Benchmark)
NAV (Rs.) Per Unit (as on April 28,2017 : 17.4426)
CAGR (%)
10.0000
Crisil Composite Bond Fund Index (Benchmark)
Since inception
CurrentValue of
Investment of Rs. 10000
CAGR (%) Current Value of
Investment of Rs. 10000
1 Year 3 Year 5 Year
CAGR (%) Current Value of
Investment of Rs. 10000
CAGR (%) Current Value of
Investment of Rs. 10000
15.9473 13.3203 11.2757
Particulars
9.40 10937.65 9.41 13094.75 9.12 15469.19 9.07 17442.60
10.07 11004.47 10.93 13646.82 9.28 15582.87 8.87 17234.24
6.63 10661.58 7.75 12509.00 7.41 14292.58 7.27 15677.02
10.95%
59.11%
23.28%
1.56%
5.10%
0% 10% 20% 30% 40% 50% 60% 70%
AAA and Equivalent
AA and Equivalent
A and Equivalent
Unrated
CBLO & Current Assets
Corporate Securities 91.75%• Vedanta Ltd. CRISIL AA 6.15%• JSW Steel Ltd. CARE AA- 3.88%• Au Small Finance Bank Ltd. CRISIL A+ 3.66%• Incline Realty Pvt. Ltd. (A Oberoi Group CARE AA+ 3.75% company)• Prestige Estates Projects Ltd. ICRA A+ 3.53%• Godrej & Boyce Mfg. Co. Ltd. CRISIL AA 3.53%• Ma Multi-Trade Private Ltd. (Secured by BWR A+ 3.13% pledge of equity shares of Bajaj Corp Ltd)• Welspun Renewables Energy Pvt Ltd. CARE AA 3.12% (Tata Power)• Indian Hospital Corporation Ltd. BWR AA- 2.99%• Essel Mining & Industries Ltd. (A Birla Group CRISIL AA 2.96% company) Aditya Birla Fashion and Retail Limited CRISIL AA 2.92% Power Finance Corporation Ltd. CRISIL AAA 2.57% Nirchem Cement Ltd. CRISIL AA 2.42% Hinduja Leyland Finance Ltd. CARE A+ 2.25% Aspire Home Finance Corporation Ltd. ICRA AA- 2.12% (Subsidiary of Motilal Oswal Group) Bharat Financial Inclusion Ltd. CARE A+ 2.03% Century Textiles & Industries Ltd. CRISIL AA- 1.96% Inox Air Products Ltd. CRISIL AA 1.84% Power Grid Corporation Of India Ltd. CRISIL AAA 1.75% Pune Solapur Expressway Pvt. Ltd. ICRA A 1.69% (A Tata Group Company) Jindal Steel & Power Ltd. CRISIL D 1.56% Promont Hillside Private Ltd. (Subsidiary of CARE AA 1.55% Tata Housing Development Co. Ltd) HPCL - Mittal Pipelines Ltd. ICRA AA 1.48% IndusInd Bank Ltd. CRISIL AA 1.41% Suntrack Commerce Private Ltd. (Secured by FITCH AA- 1.40% pledge of equity shares of Emami Ltd) Reliance Utilities & Power Private Ltd. CRISIL AAA 1.36% Hindalco Industries Ltd. CRISIL AA- 1.33% Tata Value Homes Ltd. CARE AA 1.27% Parry Sugars Refinery India Private Ltd. CRISIL A+ 1.18% (Subsidiary of E.I.D - Parry (India) Limited) Equitas Finance Ltd. FITCH A+ 1.13% Janalakshmi Financial Services Ltd. ICRA A+ 1.12% Rural Electrification Corporation Ltd. CRISIL AAA 1.07% Avenue Supermarts Ltd. (D-Mart) CRISIL AA 1.05% Silica Ceramica Pvt. Ltd. (Subsidiary of Prism FITCH A- 1.04% Cement) Samvardhana Motherson International Ltd. ICRA AA- 0.99% (Secured by pledge of equity shares of Motherson Sumi Systems Ltd) Ujjivan Financial Services Ltd. CARE A+ 0.97% Coffee Day Enterprises Pvt. Ltd. BWR AA- 0.85% Jhajjar Power Ltd. (A CLP Group company) FITCH AA+ 0.76% PVR Ltd. CRISIL AA- 0.74% Geetanjali Trading & Investments Pvt. Ltd. BWR AAA 0.71% (Promoter company of Asian Paints) Vodafone Mobile Services Ltd.^^ FITCH AAA 0.71% Tata Housing Development Company Ltd. ICRA AA 0.70%
The Indian Hotels Company Ltd. CARE AA+ 0.63% Mahindra World City (Jaipur) Ltd. FITCH AA- 0.60% Crompton Greaves Consumer Electricals Ltd. CRISIL AA 0.58% Nirma Ltd. CRISIL AA 0.56% NABARD CRISIL AAA 0.56% Tata Realty & Infrastructure Ltd. CRISIL AA 0.52% Equitas Small Finance Bank Ltd. CARE A+ 0.50% TGS Investment & Trade Pvt. Ltd. ICRA AA 0.49% Prism Cement Ltd. ICRA A- 0.49% AP Expressway Ltd. ICRA AAA 0.46% Manappuram Finance Ltd. CRISIL AA- 0.43% Thomas Cook (India) Ltd. ICRA AA 0.40% Mahindra Integrated Township Ltd. FITCH AA- 0.38% Tata Motors Ltd. CARE AA+ 0.38% KRIBHCO Shyam Fertilizers Ltd. ICRA AA 0.28% The Great Eastern Shipping Company Ltd. BWR AAA 0.28% Prime Publishing Pvt. Ltd. BWR AA- 0.26% Sadbhav Infrastucture Project Ltd. CARE A+ 0.24% JPL ICRA A- 0.24% Export-Import Bank Of India CRISIL AAA 0.22% Clp Wind Farms (India) Pvt. Ltd. FITCH AA 0.22% Muthoot Finance Ltd. CRISIL AA 0.14% HDFC Ltd. CRISIL AAA 0.09% IDBI Bank Ltd. ICRA A+ 0.07% Thomas Cook (India) Ltd. CRISIL AA- 0.05% Blue Dart Express Ltd. ICRA AA 0.02%
& Pass Through Certificates 3.16% Seagull Trust I (Originator is L&T Finance Ltd.) FITCH AA+(SO) 1.99% MFL Securitisation Trust XLIX (Originator is Magma Fincorp Ltd.) CRISIL AAA(SO) 1.17% CBLO & Net Current Assets 5.09% Total Net Assets 100.00%

81
Fund Details
Rating Profile
Portfolio as on April 30, 2017
Quantitative Indicators
Company/Issuer Rating % to NAV
Fund Managers :
Rahul Bhuskute (Managing this fund since Oct, 2013 & Overall 19 years of experience)Manish Banthia(Managing this fund since Nov, 2016 & Overall 13 years of experience)
Indicative Investment Horizon:3 years & aboveInception/Allotment date: 15-Sep-04
Monthly AAUM as on 30-Apr-17 : Rs. 6062.65 crores
Closing AUM as on 30-Apr-17 : Rs. 6154.52 crores
Option/ sub-options :Growth Option and Dividend Option (with Quarterly, Half yearly and Annual frequencies)(dividend payout*** and re-investment facility available)###Application Amount for freshSubscription :Rs. 5,000 (plus in multiples of Re.1)
Exit load for Redemption / Switch out:- Lumpsum & STP OptionWithin 1 Year from allotment - 1% ofapplicable NAV, more than 1 Year - Nil
##SIP :Monthly Frequency: Rs. 1,000/- and in multiple of Rs. 1/-Quarterly Frequency: Rs. 5,000/- and in multiple of Rs. 1/-
STP/ Flex STP/ Value STP * :Daily Frequency: Rs. 250/- and in multiples of Rs. 50/-Weekly, Monthly and Quarterly Frequency: Rs. 1,000/- and in multiples of Rs. 1/-
Min.Redemption Amt. :500/- or all units where amount is below 500/-
###With effect from 19-Feb-16, Maximum Investment Amount per investor (based on Permanent Account Number of first holder) applicable at the time of investment shall not exceed
Rs. 100 crore.For Schemes which have discontinued fresh subscriptions with effect from October 01,2012,the dividend declared will be compulsorily paid out under the “dividend payout “option.@@ Total Expense Ratio is weighted average for the month. Ratio excludes service tax on management fees and includes B-15 clawback reversal, if any.## Minimum number of installments for monthly frequency will be 6 and for Quarterly frequency will be 4. w.e.f February 01, 2017.* Minimum number of installments for daily, weekly and monthly frequency will be 6 and for Quarterly frequency will be 4. w.e.f February 01, 2017. Refer page No. 137 for definition of Flex STP and Value STP.&& Minimum number of installments for both monthly and quarterly will be 2. w.e.f February 01, 2017.*** In case the unit holder has opted for dividend payout option, the minimum amount for dividend payout shall be 100 (net of dividend distribution tax and other statutory levy, if any), else the dividend would be mandatorily reinvested.
Style Box Returns of ICICI Prudential Corporate Bond Fund - Growth Option as on - (IPCBF)April 30, 2017
NAV (As on 28-Apr-17):IPCBF Growth Option : 25.4389IPCBF Direct Plan Growth Option : 26.4020
Average Maturity : 4.04 Years Modified Duration : 2.99 Years Yield To Maturity : 8.31%
Min.Addl.Investment :Rs.1,000 (plus in multiples of Re.1)
• Top Ten Holdings&Please refer to annexure on “Pass Through Certificates Details”
for complete details.^^ CRISIL has rated AA and company has put a withdrawal request for the CRISIL rating.
ICICI Prudential Corporate Bond Fund(An Open Ended Income Fund)
Entry load : Nil
RiskometerThis Product is suitable for investors who are seeking*:
• Long term savings solution
• A debt fund that invests in debt and money market instruments of various maturities with a view to maximise income while maintaining optimum balance of yield, safety and liquidity.
*Investors should consult their financial advisers if in doubt about whether the product is suitable for them.
Company/Issuer Rating % to NAV
Dividend History : Refer page no. from 122 to 130
SIP Returns : Refer page no. from 118 to 120
Total Expense Ratio @@ :
IPCBF : 1.50% p. a.
IPCBF Direct Plan : 0.64% p. a.
Investment Objective : Refer page no. from 131 to 134
&&SWP :Rs. 500/- and in multiples of Rs. 1/-
Notes:1. Different plans shall have different expense structure. The performance details provided herein are of ICICI Prudential Corporate Bond Fund.2. The scheme is currently managed Manish Banthia. Mr. has been managing this fund since 3. Total Schemes managed Rahul Bhuskute, Rahul Bhuskute Oct 201by the Fund Manager . Refer annexure from page no. 91 for performance of other schemes currently managed by .(Debt) is 3 Rahul BhuskuteMr. Manish Banthia has been managing this fund since . Total Schemes managed by the Fund Manager . Refer annexure Nov 2016 is 19 (5 are jointly managed)from page no. 91 for performance of other schemes currently managed by Manish Banthia. 3. Date of inception: 15-Sep-04.4. Past performance may or may not be sustained in future and the same may not necessarily provide the basis for comparison with other investment.5. Load is not considered for computation of returns.6. In case, the start/end date of the concerned period is a nonbusiness date (NBD), the NAV of the previous date is considered for computation of returns. The NAV per unit shown in the table is as on the start date of the said period
Scheme
1 Year T Bill (Additional Benchmark)
NAV (Rs.) Per Unit (as on April 28,2017 : 25.4389)
CAGR (%)
10.0000
CRISIL Short Term Bond Fund Index (Benchmark)
Since inception
CurrentValue of
Investment of Rs. 10000
CAGR (%) Current Value of
Investment of Rs. 10000
1 Year 3 Year 5 Year
CAGR (%) Current Value of
Investment of Rs. 10000
CAGR (%) Current Value of
Investment of Rs. 10000
23.2818 19.2476 16.4089
Particulars
9.29 10926.52 9.75 13216.66 9.17 15503.11 7.68 25438.90
8.70 10867.02 9.18 13010.59 9.05 15419.58 7.59 25194.89
6.63 10661.58 7.75 12509.00 7.41 14292.58 6.10 21127.25
23.24%
72.70%
4.06%
0% 10% 20% 30% 40% 50% 60% 70% 80%
AAA and Equivalent
AA and Equivalent
CBLO & Current Assets
Corporate Securities 95.27%
• Welspun Renewables Energy Pvt Ltd. CARE AA 5.99% (Tata Power)
• Power Finance Corporation Ltd. CRISIL AAA 5.12%
• ICICI Bank Ltd. ICRA AA+ 4.09%
• Samvardhana Motherson International Ltd. ICRA AA- 3.95%
• Tata Steel Ltd. BWR AA 3.77%
• TGS Investment & Trade Pvt. Ltd. ICRA AA 3.47%
• Inox Air Products Ltd. CRISIL AA 2.97%
• Tata Realty & Infrastructure Ltd. CRISIL AA 2.80%
• Reliance Utilities & Power Private Ltd. CRISIL AAA 2.70%
• Rural Electrification Corporation Ltd. CRISIL AAA 2.69%
Jhajjar Power Ltd. (A CLP Group company) FITCH AA+ 2.65%
Vodafone Mobile Services Ltd.^^ FITCH AAA 2.47%
Axis Bank Ltd. CRISIL AA 2.17%
Crompton Greaves Consumer Electricals Ltd. CRISIL AA 2.15%
Godrej & Boyce Mfg. Co. Ltd. CRISIL AA 2.08%
Aditya Birla Fashion and Retail Limited CRISIL AA 1.95%
Export-Import Bank Of India CRISIL AAA 1.95%
Manappuram Finance Ltd. CRISIL AA- 1.94%
Hindalco Industries Ltd. CRISIL AA- 1.87%
Afcons Infrastructure Ltd. ICRA AA 1.87%
Avenue Supermarts Ltd. (D-Mart) CRISIL AA 1.86%
Tata Housing Development Company Ltd. ICRA AA 1.83%
NABARD CRISIL AAA 1.78%
Incline Realty Pvt. Ltd. (A Oberoi Group CARE AA+ 1.74% company)
Vedanta Ltd. CRISIL AA- 1.74%
The Great Eastern Shipping Company Ltd. BWR AAA 1.69%
The Indian Hotels Company Ltd. CARE AA+ 1.61%
Tata Value Homes Ltd. CARE AA 1.60%
Nirma Ltd. CRISIL AA 1.56%
Aspire Home Finance Corporation Ltd. ICRA AA- 1.54%
JSW Steel Ltd. CARE AA- 1.53%
Century Textiles & Industries Ltd. CRISIL AA- 1.45%
State Bank Of India CRISIL AA+ 1.45%
Mahindra World City (Jaipur) Ltd. FITCH AA- 1.35%
Essel Mining & Industries Ltd. (A Birla Group CRISIL AA 1.30% company)
Nirchem Cement Ltd. CRISIL AA 1.26%
Quess Corp Ltd. ICRA AA- 1.20%
Power Grid Corporation Of India Ltd. CRISIL AAA 1.19%
Muthoot Finance Ltd. CRISIL AA 1.16%
Bahadur Chand Investments Private Ltd. ICRA AA 1.14% (A Hero Group company)
NHPC Ltd. ICRA AAA 0.95%
Motilal Oswal Financial Services Ltd. ICRA AA 0.82%
Suraksha Realty Ltd. (Secured by pledge of FITCH AA- 0.67% equity shares of Sun Pharmaceuticals Industries)
Reliance Ports & Terminals Ltd. CRISIL AAA 0.64%
Patel KNR Heavy Infrastructures Ltd. CARE AAA 0.60% (National Highways Authority of India Project)
Thomas Cook (India) Ltd. CRISIL AA- 0.50%
Geetanjali Trading & Investments Pvt. Ltd. BWR AAA 0.49% (Promoter company of Asian Paints)
Reliance Gas Transporation Infrastructure Ltd. CRISIL AAA 0.47%
NTPC Ltd. CRISIL AAA 0.39%
Suraj Viniyog Pvt. Ltd. (Secured by pledge of BWR AA- 0.34 equity shares of Emami Ltd)
Piramal Enterprises Ltd. ICRA AA 0.33%
Amri Hospitals Ltd (Secured by pledge of equity BWR AA- 0.23% shares of Emami Ltd)
Tata Motors Ltd. CARE AA+ 0.10%
Nuclear Power Corporation of India Ltd. CRISIL AAA 0.09%
PVR Ltd. CRISIL AA- 0.02%
HDFC Ltd. CRISIL AAA 0.02%
Tata Capital Financial Services Ltd. CRISIL AA+ 0.01%& Pass Through Certificates 0.67%
Seagull Trust I (Originator is L&T Finance Ltd.) FITCH AA+(SO) 0.67%
CBLO & Net Current Assets 4.06%
Total Net Assets 100.00%

82
Fund Details
Rating Profile
Portfolio as on April 30, 2017
Quantitative Indicators
For Schemes which have discontinued fresh subscriptions with effect from October 01,2012,the dividend declared will be compulsorily paid out under the “dividend payout “option.
@@ Total Expense Ratio is weighted average for the month. Ratio excludes service tax on management fees and includes B-15 clawback reversal, if any.## Minimum number of installments for monthly frequency will be 6 and for Quarterly frequency will be 4. w.e.f February 01, 2017.* Minimum number of installments for daily, weekly and monthly frequency will be 6 and for Quarterly frequency will be 4. w.e.f February 01, 2017. Refer page No. 137 for definition of Flex STP and Value STP.&& Minimum number of installments for both monthly and quarterly will be 2. w.e.f February 01, 2017.*** In case the unit holder has opted for dividend payout option, the minimum amount for dividend payout shall be 100 (net of dividend distribution tax and other statutory levy, if any), else the dividend would be mandatorily reinvested.
Style Box
Fund Managers :
Manish Banthia(Managing this fund since Sep, 2013 & Overall13 years of experience)Indicative Investment Horizon:24 months & above
Inception/Allotment date: 18-Aug-08Monthly AAUM as on 30-Apr-17 : Rs. 4186.10 crores
Closing AUM as on 30-Apr-17 : Rs. 4218.82 crores
NAV (As on 28-Apr-17):IPIOF Growth Option : 23.0150IPIOF Direct Plan Growth Option : 23.3436
Application Amount for freshSubscription :Rs.5,000 (plus in multiples of Re.1)
Min.Addl.Investment :Rs.1,000 (plus in multiples of Re.1)
Exit load for Redemption / Switchout :- Lumpsum & SIP / STP / SWP OptionWithin 6 Months from allotment - 1% ofapplicable NAV, more than 6 Months - Nil
SIP :##
Monthly Frequency: Rs. 1,000/- and in multiple of Rs. 1/-Quarterly Frequency: Rs. 5,000/- and in multiple of Rs. 1/-
&&SWP :Rs. 500/- and in multiples of Rs. 1/-STP/ Flex STP/ Value STP * :Daily Frequency: Rs. 250/- and in multiples of Rs. 50/-Weekly, Monthly and Quarterly Frequency: Rs. 1,000/- and in multiples of Rs. 1/-
Min.Redemption Amt. :500/- or all units where amount is below 500/-
Option/ sub-options :Growth Options and Dividend (with Monthly, Quarterly and Half Yearly frequencies)(dividend payout*** and re-investment facility available)
Company/Issuer Rating % to NAV
CPs and CDs 9.03%
• HDFC Ltd. CRISIL A1+ 4.81%
NABARD CRISIL A1+ 2.95%
Credit Suisse AG-Mumbai Branch CRISIL A1+ 1.16%
Tata Capital Financial Services Ltd. ICRA A1+ 0.12%
Corporate Securities 85.42%
• Export-Import Bank Of India CRISIL AAA 9.57%
• Power Finance Corporation Ltd. CRISIL AAA 8.46%
• Nuclear Power Corporation of India Ltd. CRISIL AAA 8.18%
• Tata Sons Ltd. CRISIL AAA 7.96%
• Mahanagar Telephone Nigam Ltd. CRISIL AAA 7.51%
• Rural Electrification Corporation Ltd. CRISIL AAA 6.62%
• LIC Housing Finance Ltd. CRISIL AAA 6.40%
• Power Grid Corporation Of India Ltd. CRISIL AAA 5.05%
• Axis Bank Ltd. CRISIL AAA 4.83%
HDFC Bank Ltd. CRISIL AAA 4.77%
NTPC Ltd. CRISIL AAA 3.24%
ICICI Bank Ltd. ICRA AAA 3.11%
NHPC Ltd. ICRA AAA 2.99%
State Bank of India ICRA AAA 2.42%
The Great Eastern Shipping Company Ltd. BWR AAA 1.80%
HDFC Ltd. CRISIL AAA 1.31%
Vodafone Mobile Services Ltd.^^ FITCH AAA 1.20%
CBLO & Net Current Assets 5.55%
Total Net Assets 100.00%
Returns of ICICI Prudential Income Opportunities Fund - Growth Option as on April 30, 2017 - (IPIOF)
• Top Ten Holdings^^ CRISIL has rated AA and company has put a withdrawal request for the CRISIL rating.
Average Maturity : 5.47 Years Modified Duration : 3.90 Years Yield To Maturity : 7.63%
ICICI Prudential Income Opportunities Fund(An Open Ended Income Fund)
Entry load : Nil
RiskometerThis Product is suitable for investors who are seeking*:
• Long term savings solution
• A debt fund that invests in debt and money market instruments of various credit ratings and maturities with a view to maximising income while maintaining optimum balance of yield, safety and liquidity.
*Investors should consult their financial advisers if in doubt about whether the product is suitable for them.
Dividend History : Refer page no. from 122 to 130
SIP Returns : Refer page no. from 118 to 120
Total Expense Ratio @@ :
IPIOF : 0.99% p. a.
IPIOF Direct Plan : 0.40% p. a.
Investment Objective : Refer page no. from 131 to 134
Notes:1. Different plans shall have different expense structure. The performance details provided herein are of ICICI Prudential Income Opportunities Fund.2. The scheme is currently managed by Manish Banthia. Mr. has been managing this fund since . Total Schemes managed by the Fund Manish Banthia Sep 2013Manager . Refer annexure from page no. 91 for performance of other schemes currently managed by . is 19 (5 are jointly managed) Manish Banthia3. Date of inception:18-Aug-08.4. Past performance may or may not be sustained in future and the same may not necessarily provide the basis for comparison with other investment.5. Load is not considered for computation of returns.6. In case, the start/end date of the concerned period is a nonbusiness date (NBD), the NAV of the previous date is considered for computation of returns. The NAV per unit shown in the table is as on the start date of the said period
Scheme
10 Year G Sec (Additional Benchmark)
NAV (Rs.) Per Unit (as on April 28,2017 : 23.0150)
CAGR (%)
10.0000
Crisil Composite Bond Fund Index (Benchmark)
Since inception
CurrentValue of
Investment of Rs. 10000
CAGR (%) Current Value of
Investment of Rs. 10000
1 Year 3 Year 5 Year
CAGR (%) Current Value of
Investment of Rs. 10000
CAGR (%) Current Value of
Investment of Rs. 10000
21.1104 17.0507 14.4771
Particulars
9.05 10902.21 10.53 13497.98 9.72 15897.52 10.06 23015.00
10.07 11004.47 10.93 13646.82 9.28 15582.87 8.47 20282.43
9.64 10961.31 10.76 13584.03 8.51 15038.07 7.93 19428.04
94.45%
5.55%
0% 20% 40% 60% 80% 100%
AAA and Equivalent
CBLO & Current Assets

83
Style Box
Rating Profile
Portfolio as on April 30, 2017
Fund Details
Quantitative Indicators
Company/Issuer % to NAVRating
• Top Ten Holdings@Short Term < 8 Years, Long Term > 8 Years.
For Schemes which have discontinued fresh subscriptions with effect from October 01,2012,the dividend declared will be compulsorily paid out under the “dividend payout “option.@@ Total Expense Ratio is weighted average for the month. Ratio excludes service tax on management fees and includes B-15 clawback reversal, if any.## Minimum number of installments for monthly frequency will be 6 and for Quarterly frequency will be 4. w.e.f February 01, 2017.* Minimum number of installments for daily, weekly and monthly frequency will be 6 and for Quarterly frequency will be 4. w.e.f February 01, 2017. Refer page No. 137 for definition of Flex STP and Value STP.&& Minimum number of installments for both monthly and quarterly will be 2. w.e.f February 01, 2017.*** In case the unit holder has opted for dividend payout option, the minimum amount for dividend payout shall be 100 (net of dividend distribution tax and other statutory levy, if any), else the dividend would be mandatorily reinvested.
Fund Managers :
Manish Banthia(Managing this fund since Sep, 2013 & Overall13 years of experience)Indicative Investment Horizon:24 months & above
Inception/Allotment date: 09-Jul-98
Monthly AAUM as on 30-Apr-17 : Rs. 1915.11 crores
Closing AUM as on 30-Apr-17 : Rs. 1877.69 crores
NAV (As on 28-Apr-17):IPIP Growth Option : 52.1979IPIP Direct Plan Growth Option : 54.4787
Option/ sub-options : Growth Options andDividend Option (with Quarterly, HalfYearly and Annual frequencies)(dividend payout*** and re-investmentfacility available)
Application Amount for freshSubscription :Rs.5,000 (plus in multiples of Re.1)
Min.Addl.Investment :Rs.1,000 (plus in multiples of Re.1)
Exit load for Redemption / Switchout :- Lumpsum & SIP / STP / SWP OptionWithin 1 Month from allotment – 0.25% of applicable NAV, more than 1 Month - Nilw.e.f. 2nd May 2017.
##SIP :Monthly Frequency: Rs. 1,000/- and in multiple of Rs. 1/-Quarterly Frequency: Rs. 5,000/- and in multiple of Rs. 1/-
&&SWP :Rs. 500/- and in multiples of Rs. 1/-
STP/ Flex STP/ Value STP * :Daily Frequency: Rs. 250/- and in multiples of Rs. 50/-Weekly, Monthly and Quarterly Frequency: Rs. 1,000/- and in multiples of Rs. 1/-
Min.Redemption Amt. :500/- or all units where amount is below 500/-
Government Securities 69.13%@ Short Term 4.01%
08.02% Tamil Nadu SDL 2025 SOV 1.10% 07.91% Tamil Nadu SDL 2024 SOV 1.09% 07.67% Tamil Nadu SDL 2023 SOV 0.47% 08.05% Telangana SDL 2025 SOV 0.27% 08.01% Telangana SDL 2025 SOV 0.27% 07.94% Telangana SDL 2024 SOV 0.27% 07.87% Telangana SDL 2024 SOV 0.27% 07.70% Telangana SDL 2023 SOV 0.27%
@ Long Term 65.12%• 08.17% GOI 2044 SOV 19.42%• 07.73% GOI 2034 SOV 11.64%• 07.61% GOI 2030 SOV 6.62%• 08.13% GOI 2045 SOV 6.22%• 07.88% GOI 2030 SOV 3.66% 08.24% Tamil Nadu SDL 2028 SOV 1.12% 08.05% Tamil Nadu SDL 2031 SOV 1.11% 08.04% Tamil Nadu SDL 2029 SOV 1.11% 07.90% Tamil Nadu SDL 2027 SOV 1.09% 07.68% Tamil Nadu SDL 2026 SOV 1.07% 08.15% GOI 2026 SOV 1.05% 08.01% Tamil Nadu SDL 2030 SOV 0.92% 07.92% Tamil Nadu SDL 2032 SOV 0.91% 08.27% Telangana SDL 2028 SOV 0.55% 08.14% Himachal Pradesh SDL 2028 SOV 0.55% 08.01% Himachal Pradesh SDL 2031 SOV 0.54% 07.94% Himachal Pradesh SDL 2032 SOV 0.54% 07.96% Himachal Pradesh SDL 2029 SOV 0.54% 07.89% Himachal Pradesh SDL 2030 SOV 0.54% 07.72% Tamil Nadu SDL 2029 SOV 0.53% 07.72% Tamil Nadu SDL 2030 SOV 0.53% 07.72% Tamil Nadu SDL 2031 SOV 0.53% 07.72% Tamil Nadu SDL 2028 SOV 0.53% 07.72% Tamil Nadu SDL 2032 SOV 0.53% 08.08% Telangana SDL 2031 SOV 0.27% 08.04% Telangana SDL 2031 SOV 0.27% 08.07% Telangana SDL 2029 SOV 0.27% 08.08% Telangana SDL 2029 SOV 0.27% 08.04% Telangana SDL 2030 SOV 0.27% 07.96% Telangana SDL 2032 SOV 0.27%
Returns of ICICI Prudential Income Plan - Growth Option as on - (IPIP)April 30, 2017
Average Maturity : 14.89 Years Modified Duration : 7.61 Years Yield To Maturity : 7.94%
ICICI Prudential Income Plan(An Open Ended Income Fund)
Entry load : Nil
RiskometerThis Product is suitable for investors who are seeking*:
• Long term wealth creation solution
• A Debt Fund that invests in debt and money market instruments of various maturities with a view to maximise income while maintaining optimum balance of yield, safety and liquidity.
*Investors should consult their financial advisers if in doubt about whether the product is suitable for them.
Dividend History : Refer page no. from 122 to 130
SIP Returns : Refer page no. from 118 to 120
Total Expense Ratio @@ :
IPIP : 1.86% p. a.
IPIP Direct Plan : 0.81% p. a.
Investment Objective : Refer page no. from 131 to 134
07.95% Telangana SDL 2032 SOV 0.27% 07.98% Telangana SDL 2030 SOV 0.27% 07.93% Telangana SDL 2027 SOV 0.27% 07.81% Telangana SDL 2027 SOV 0.27% 07.71% Telangana SDL 2026 SOV 0.27% 07.62% Telangana SDL 2026 SOV 0.26% 08.53% Tamil Nadu SDL 2026 SOV 0.03% Corporate Securities 27.81%• The Great Eastern Shipping Company Ltd. BWR AAA 11.58%• Axis Bank Ltd. CRISIL AA 6.58%• Reliance Utilities & Power Private Ltd. CRISIL AAA 3.71%• Tata Steel Ltd. BWR AA 2.75%• Mahanagar Telephone Nigam Ltd. CRISIL AAA 2.74% Food Corporation Of India CRISIL AAA 0.22% Indian Railway Finance Corporation Ltd. CRISIL AAA 0.16% IDBI Bank Ltd. ICRA AA- 0.04% IDBI Bank Ltd. ICRA A+ 0.04% CBLO & Net Current Assets 3.06% Total Net Assets 100.00%
Company/Issuer % to NAVRating
Notes:1. Different plans shall have different expense structure. The performance details provided herein are of ICICI Prudential Income Plan.2. The scheme is currently managed Manish Banthia. Mr. Manish Banthia has been managing this fund since . Total Schemes managed by the Fund Sep 2013Manager . Refer annexure from page no. 91 for performance of other schemes currently managed by Manish Banthia. is 19 (5 are jointly managed) 3. Date of inception: 09-Jul-98.4. Past performance may or may not be sustained in future and the same may not necessarily provide the basis for comparison with other investment.5. Load is not considered for computation of returns.6. In case, the start/end date of the concerned period is a nonbusiness date (NBD), the NAV of the previous date is considered for computation of returns. The NAV per unit shown in the table is as on the start date of the said period7. As the scheme was launched before the launch of the benchmark index, benchmark index figures since inception or the required period are not available.
Scheme
10 Year G Sec (Additional Benchmark)
NAV (Rs.) Per Unit (as on April 28,2017 : 52.1979)
CAGR (%)
10.0000
Crisil Composite Bond Fund Index (Benchmark)
Since inception
CurrentValue of
Investment of Rs. 10000
CAGR (%) Current Value of
Investment of Rs. 10000
1 Year 3 Year 5 Year
CAGR (%) Current Value of
Investment of Rs. 10000
CAGR (%) Current Value of
Investment of Rs. 10000
46.9807 37.7231 33.6605
Particulars
11.14 11110.50 11.44 13837.12 9.18 15507.17 9.18 52197.90
10.07 11004.47 10.93 13646.82 9.28 15582.87 NA NA
9.64 10961.31 10.76 13584.03 8.51 15038.07 NA NA
18.41%
9.37%
0.04%
69.13%
3.05%
0% 10% 20% 30% 40% 50% 60% 70% 80%
AAA and Equivalent
AA and Equivalent
A and Equivalent
Sovereign Securities
CBLO & Current Assets

Rating Profile
Quantitative Indicators
Fund Details
Portfolio as on April 30, 2017
Style Box
Company/Issuer Rating % to NAV
Fund Managers :
Manish Banthia (Managing this fund since Sep, 2012 & Overall 13 years of experience)Anuj Tagra(Managing this fund since Jan, 2015 & Overall 9 years of experience)
Indicative Investment Horizon:3 years & aboveInception/Allotment date : 28-Mar-02
Monthly AAUM as on 30-Apr-17 : Rs. 2135.24 crores
Closing AUM as on 30-Apr-17 : Rs. 2126.15 crores
NAV (As on 28-Apr-17):IPLTP Growth Option : 20.3975IPLTP Direct Plan Growth Option : 20.7746Option/ sub-options : Growth Options and Dividend Option (with Weekly, Quarterly and Annual frequencies)(dividend payout*** and re-investment facility available)
Application Amount for freshSubscription :Rs.5,000 (plus in multiples of Re.1)
Min.Addl.Investment :Rs.1,000 (plus in multiples of Re.1)
Exit load for Redemption :- Lumpsum &SIP / STP / SWP OptionUpto 1 month from allotment - 0.25% ofapplicable NAV, more than 1 month -Nil
##SIP :Monthly Frequency: Rs. 1,000/- and in multiple of Rs. 1/-Quarterly Frequency: Rs. 5,000/- and in multiple of Rs. 1/-
&&SWP :Rs. 500/- and in multiples of Rs. 1/-
STP/ Flex STP/ Value STP * :Daily Frequency: Rs. 250/- and in multiples of Rs. 50/-Weekly, Monthly and Quarterly Frequency: Rs. 1,000/- and in multiples of Rs. 1/-
Min.Redemption Amt. :500/- or all units where amount is below 500/-
84
For Schemes which have discontinued fresh subscriptions with effect from October 01,2012,the dividend declared will be compulsorily paid out under the “dividend payout “option.@@ Total Expense Ratio is weighted average for the month. Ratio excludes service tax on management fees and includes B-15 clawback reversal, if any.$$ Inception date shown is the date from which units under the plans are available throughout.## Minimum number of installments for monthly frequency will be 6 and for Quarterly frequency will be 4. w.e.f February 01, 2017.* Minimum number of installments for daily, weekly and monthly frequency will be 6 and for Quarterly frequency will be 4. w.e.f February 01, 2017. Refer page No. 137 for definition of Flex STP and Value STP.&& Minimum number of installments for both monthly and quarterly will be 2. w.e.f February 01, 2017.*** In case the unit holder has opted for dividend payout option, the minimum amount for dividend payout shall be 100 (net of dividend distribution tax and other statutory levy, if any), else the dividend would be mandatorily reinvested.
Returns of ICICI Prudential Long Term Plan - Growth Option as on - (IPLTP)April 30, 2017
Average Maturity : 13.07 Years Modified Duration : 7.16 Years Yield To Maturity : 7.76%
• Top Ten Holdings@Short Term < 8 Years, Long Term > 8 Years.
ICICI Prudential Long Term Plan(An Open Ended Income Fund)
Entry load : Nil
RiskometerThis Product is suitable for investors who are seeking*:
• Medium term savings solution
• A Debt Fund that invests in debt and money market instruments with aview to maximise income while maintaining optimum balance of yield, safety and liquidity.
*Investors should consult their financial advisers if in doubt about whether the product is suitable for them.
Government Securities 71.60%@ Short Term 7.24%
08.75% Tamil Nadu SDL 2022 SOV 1.49% 06.35% GOI 2024 SOV 1.09% 08.27% Rajasthan SDL 2022 SOV 0.63% 08.27% Rajasthan SDL 2023 SOV 0.63% 08.29% Rajasthan SDL 2024 SOV 0.63% 08.03% Madhya Pradesh SDL 2025 SOV 0.48% 07.92% Madhya Pradesh SDL 2024 SOV 0.47% 07.68% Madhya Pradesh SDL 2023 SOV 0.47% 08.66% Tamil Nadu SDL 2022 SOV 0.25% 08.57% Haryana SDL 2023 SOV 0.25% 08.05% Telangana SDL 2025 SOV 0.24% 07.94% Telangana SDL 2024 SOV 0.24% 07.70% Telangana SDL 2023 SOV 0.24% 08.02% Tamil Nadu SDL 2025 SOV 0.05% 07.91% Tamil Nadu SDL 2024 SOV 0.05% 07.67% Tamil Nadu SDL 2023 SOV 0.05%
@ Long Term 64.37%• 07.88% GOI 2030 SOV 13.95%• 08.17% GOI 2044 SOV 13.85%• 07.61% GOI 2030 SOV 9.46%• 07.73% GOI 2034 SOV 5.55%• 08.15% GOI 2026 SOV 4.51%• 08.13% GOI 2045 SOV 3.00% 08.21% Maharashtra SDL 2025 SOV 0.97% 06.79% GOI 2029 SOV 0.96% 08.25% Madhya Pradesh SDL 2028 SOV 0.73% 08.06% Madhya Pradesh SDL 2031 SOV 0.72% 08.05% Madhya Pradesh SDL 2029 SOV 0.72% 08.02% Madhya Pradesh SDL 2030 SOV 0.72% 07.93% Madhya Pradesh SDL 2032 SOV 0.72% 06.62% GOI 2051 SOV 0.63% 08.27% Telangana SDL 2028 SOV 0.49% 08.08% Telangana SDL 2031 SOV 0.48% 08.07% Telangana SDL 2029 SOV 0.48% 08.04% Telangana SDL 2030 SOV 0.48% 07.95% Telangana SDL 2032 SOV 0.48% 07.91% Madhya Pradesh SDL 2027 SOV 0.47% 07.71% Tamil Nadu SDL 2029 SOV 0.47% 07.71% Tamil Nadu SDL 2030 SOV 0.47% 07.71% Tamil Nadu SDL 2031 SOV 0.47%
Dividend History : Refer page no. from 122 to 130
SIP Returns : Refer page no. from 118 to 120
Total Expense Ratio @@ :
IPLTP : 1.27% p. a.
IPLTP Direct Plan : 0.61% p. a.
Investment Objective : Refer page no. from 131 to 134
Company/Issuer Rating % to NAV
07.71% Tamil Nadu SDL 2028 SOV 0.47% 07.71% Tamil Nadu SDL 2032 SOV 0.47% 07.69% Madhya Pradesh SDL 2026 SOV 0.47% 08.14% Himachal Pradesh SDL 2028 SOV 0.24% 08.01% Himachal Pradesh SDL 2031 SOV 0.24% 07.94% Himachal Pradesh SDL 2032 SOV 0.24% 07.96% Himachal Pradesh SDL 2029 SOV 0.24% 07.93% Telangana SDL 2027 SOV 0.24% 07.89% Himachal Pradesh SDL 2030 SOV 0.24% 07.71% Telangana SDL 2026 SOV 0.23% 08.28% GOI 2027 SOV 0.16% 08.24% Tamil Nadu SDL 2028 SOV 0.05% 08.05% Tamil Nadu SDL 2031 SOV 0.05% 08.04% Tamil Nadu SDL 2029 SOV 0.05% 08.01% Tamil Nadu SDL 2030 SOV 0.05% 07.92% Tamil Nadu SDL 2032 SOV 0.05% 07.90% Tamil Nadu SDL 2027 SOV 0.05% 07.68% Tamil Nadu SDL 2026 SOV 0.05% Corporate Securities 24.65%• Tata Steel Ltd. BWR AA 9.26%• The Great Eastern Shipping Company Ltd. BWR AAA 6.05%• Reliance Ports & Terminals Ltd. CRISIL AAA 3.28%• Reliance Utilities & Power Private Ltd. CRISIL AAA 3.16% Mahanagar Telephone Nigam Ltd. CRISIL AAA 2.42% Power Grid Corporation Of India Ltd. CRISIL AAA 0.49% CBLO & Net Current Assets 3.75% Total Net Assets 100.00%
Notes:1. Different plans shall have different expense structure. The performance details provided herein are of ICICI Prudential Long Term Plan.2. The scheme is currently managed Manish Banthia and . Mr. Manish Banthia has been managing this fund since 2. Total Schemes managed Anuj Tagra Sep 201by the Fund Manager . Refer annexure from page no. 91 for performance of other schemes currently managed by Manish Banthia. is 19 (5 are jointly managed) Mr. has been managing this fund since 5. Total Schemes managed by the Fund Manager . Refer annexure from page Anuj Tagra Jan 201 is 5 (5 are jointly managed)no. 91 for performance of other schemes currently managed by . Anuj Tagra3. Date of inception $$ : 20-Jan-10 (IPLTP - Growth Option).4. Past performance may or may not be sustained in future and the same may not necessarily provide the basis for comparison with other investment.5. Load is not considered for computation of returns.6. In case, the start/end date of the concerned period is a nonbusiness date (NBD), the NAV of the previous date is considered for computation of returns. The NAV per unit shown in the table is as on the start date of the said period
Scheme
1 Year T Bill (Additional Benchmark)
NAV (Rs.) Per Unit (as on April 28,2017 : 20.3975)
CAGR (%)
10.0000
Crisil Composite Bond Fund Index (Benchmark)
Since inception
CurrentValue of
Investment of Rs. 10000
CAGR (%) Current Value of
Investment of Rs. 10000
1 Year 3 Year 5 Year
CAGR (%) Current Value of
Investment of Rs. 10000
CAGR (%) Current Value of
Investment of Rs. 10000
18.1601 14.3377 11.7398
Particulars
12.36 11232.04 12.48 14226.48 11.69 17374.66 10.30 20397.50
10.07 11004.47 10.93 13646.82 9.28 15582.87 8.37 17949.27
6.63 10661.58 7.75 12509.00 7.41 14292.58 6.71 16040.24
15.40%
9.26%
71.60%
3.74%
0% 10% 20% 30% 40% 50% 60% 70% 80%
AAA and Equivalent
AA and Equivalent
Sovereign Securities
CBLO & Current Assets

Style Box
Fund Details
Portfolio as on April 30, 2017
Company/Issuer % to NAVRating
Quantitative Indicators
For Schemes which have discontinued fresh subscriptions with effect from October 01,2012,the dividend declared will be compulsorily paid out under the “dividend payout “option.@@ Total Expense Ratio is weighted average for the month. Ratio excludes service tax on management fees and includes B-15 clawback reversal, if any.## Minimum number of installments for monthly frequency will be 6 and for Quarterly frequency will be 4. w.e.f February 01, 2017.* Minimum number of installments for daily, weekly and monthly frequency will be 6 and for Quarterly frequency will be 4. w.e.f February 01, 2017. Refer page No. 137 for definition of Flex STP and Value STP.&& Minimum number of installments for both monthly and quarterly will be 2. w.e.f February 01, 2017.*** In case the unit holder has opted for dividend payout option, the minimum amount for dividend payout shall be 100 (net of dividend distribution tax and other statutory levy, if any), else the dividend would be mandatorily reinvested.
Fund Managers :
Rahul Goswami (Managing this fund since Sep, 2012 & Overall 20 years of experience)Anuj Tagra (Managing this fund since Oct,2013 & Overall 9 years of experience)Indicative Investment Horizon:12 months & above
Inception/Allotment date: 11-Feb-04
Monthly AAUM as on 30-Apr-17 : Rs. 51.70 crores
Closing AUM as on 30-Apr-17 : Rs. 26.96 crores
NAV (As on 28-Apr-17):IPGFTP(PF) Growth Option : 24.0836IPGFTP(PF) Direct Plan Growth Option : 24.5545
Option/ sub-options :Growth Options, Growth AEP (withRegular and Appreciation) and Dividend Option (with Quarterly and Half yearly frequencies)(dividend payout*** and re-investment facility available)
Application Amount for freshSubscription :Rs.5,000 (plus in multiples of Re.1)
Min.Addl.Investment :Rs.5,000 & in multiples thereof
Exit load for Redemption / Switch out:- Lumpsum & SIP / SWP OptionNil (w.e.f. 30-Nov-16)
SIP :##
Monthly Frequency: Rs. 1,000/- and in multiple of Rs. 1/-Quarterly Frequency: Rs. 5,000/- and in multiple of Rs. 1/-
&&SWP :Rs. 500/- and in multiples of Rs. 1/-
STP/ Flex STP/ Value STP * :Daily Frequency: Rs. 250/- and in multiples of Rs. 50/-Weekly, Monthly and Quarterly Frequency: Rs. 1,000/- and in multiples of Rs. 1/-
Min.Redemption Amt. :500/- or all units where amount is below 500/-
85
Returns of ICICI Prudential Gilt Fund Treasury Plan PF Option - Growth Option as on April 30, 2017 - (IPGFTP(PF))
Average Maturity : 4.63 Years Modified Duration : 3.70 Years Yield To Maturity : 7.53%
@Short Term < 8 Years, Long Term >8 Years
@Government Securities - Short Term 91.72%
08.21% Haryana SDL 2022 SOV 76.17%
08.63% Tamil Nadu SDL 2023 SOV 15.55%
CBLO & Net Current Assets 8.28%
Total Net Assets 100.00%
HIGH RISK(BROWN)
ICICI Prudential Gilt Fund Treasury Plan PF Option(An Open Ended Gilt Fund)
Rating Profile
Entry load : Nil
RiskometerThis Product is suitable for investors who are seeking*:
• Medium term savings solution
• A Gilt Fund that aims to generate income through investment in Gilts of various maturities.
*Investors should consult their financial advisers if in doubt about whether the product is suitable for them.
Dividend History : Refer page no. from 122 to 130
SIP Returns : Refer page no. from 118 to 120
Total Expense Ratio @@ :
IPGFTP(PF) : 0.66% p. a.
IPGFTP(PF) Direct Plan : 0.27% p. a.
Investment Objective : Refer page no. from 131 to 134
Notes:1. Different plans shall have different expense structure. The performance details provided herein are of ICICI Prudential Gilt Fund Treasury Plan PF Option.2. The scheme is currently managed and . Mr. has been managing this fund since . Total Schemes managed Rahul Goswami Anuj Tagra Rahul Goswami Sep 2012by the Fund Manager . Refer annexure from page no. 91 for performance of other schemes currently managed by .is 11 (9 are jointly managed) Rahul GoswamiMr. Anuj Tagra has been managing this fund since . Total Schemes managed by the Fund Manager . Refer annexure from page Oct 2013 is 5 (5 are jointly managed)no. 91 for performance of other schemes currently managed by Anuj Tagra.3. Date of inception:11-Feb-04.4. Past performance may or may not be sustained in future and the same may not necessarily provide the basis for comparison with other investment.5. Load is not considered for computation of returns.6. In case, the start/end date of the concerned period is a nonbusiness date (NBD), the NAV of the previous date is considered for computation of returns. The NAV per unit shown in the table is as on the start date of the said period
Scheme
10 Year G Sec (Additional Benchmark)
NAV (Rs.) Per Unit (as on April 28,2017 : 24.0836)
CAGR (%)
10.0000
I-SEC Si-BEX (Benchmark)
Since inception
CurrentValue of
Investment of Rs. 10000
CAGR (%) Current Value of
Investment of Rs. 10000
1 Year 3 Year 5 Year
CAGR (%) Current Value of
Investment of Rs. 10000
CAGR (%) Current Value of
Investment of Rs. 10000
21.8418 18.8584 17.1884
Particulars
10.29 11,026.38 8.50 12,770.75 6.98 14,011.54 6.88 24,083.60
7.74 10,771.58 8.83 12,888.05 8.51 15,041.31 7.43 25,803.62
9.64 10,961.31 10.76 13,584.03 8.51 15,038.07 5.70 20,804.71
91.72%
8.28%
0% 20% 40% 60% 80% 100%
Sovereign Securities
CBLO & Current Assets

86
Style Box
Fund Details
Quantitative Indicators
Portfolio as on April 30, 2017
Company/Issuer % to NAVRating
Fund Managers :
Rahul Goswami (Managing this fund since Sep, 2012 & Overall 20 years of experience) Anuj Tagra (Managing this fund since Oct,2013 & Overall 9 years of experience)
Indicative Investment Horizon:12 months & above
Inception/Allotment date: 19-Aug-99
Monthly AAUM as on 30-Apr-17 : Rs. 105.72 crores
Closing AUM as on 30-Apr-17 : Rs. 107.66 crores
NAV (As on 28-Apr-17):IPSTGF Growth Option : 41.7426IPSTGF Direct Plan Growth Option : 42.5662Option/ sub-options :Growth Options, Growth AEP (withRegular and Appreciation) and Dividend Option (with Quarterly and Half yearly frequencies)(dividend payout*** and re-investment facility available)
Application Amount for freshSubscription :Rs.5,000 (plus in multiples of Re.1)
Min.Addl.Investment :Rs.5,000 & in multiples thereof
Exit load for Redemption / Switchout :- Lumpsum & SIP / STP / SWP OptionNil
SIP :##
Monthly Frequency: Rs. 1,000/- and in multiple of Rs. 1/-Quarterly Frequency: Rs. 5,000/- and in multiple of Rs. 1/-
&&SWP :Rs. 500/- and in multiples of Rs. 1/-
STP/ Flex STP/ Value STP * :Daily Frequency: Rs. 250/- and in multiples of Rs. 50/-Weekly, Monthly and Quarterly Frequency: Rs. 1,000/- and in multiples of Rs. 1/-
Min.Redemption Amt. :500/- or all units where amount is below 500/-
For Schemes which have discontinued fresh subscriptions with effect from October 01,2012,the dividend declared will be compulsorily paid out under the “dividend payout “option.
@@ Total Expense Ratio is weighted average for the month. Ratio excludes service tax on management fees and includes B-15 clawback reversal, if any.## Minimum number of installments for monthly frequency will be 6 and for Quarterly frequency will be 4. w.e.f February 01, 2017.
* Minimum number of installments for daily, weekly and monthly frequency will be 6 and for Quarterly frequency will be 4. w.e.f February 01, 2017. Refer page No. 137 for definition of Flex STP and Value STP.&& Minimum number of installments for both monthly and quarterly will be 2. w.e.f February 01, 2017.*** In case the unit holder has opted for dividend payout option, the minimum amount for dividend payout shall be 100 (net of dividend distribution tax and other statutory levy, if any), else the dividend would be mandatorily reinvested.
Government Securities 94.34%@Short Term 81.74%
08.53% Punjab SDL 2022 SOV 33.78%
06.93% Punjab SDL 2020 SOV 18.45%
08.53% Jharkhand SDL 2022 SOV 9.65%
06.99% Andhra Pradesh SDL 2020 SOV 9.24%
08.20% GOI 2022 SOV 4.87%
08.39% Rajasthan SDL 2023 SOV 4.80%
07.35% GOI 2024 SOV 0.94%@Long Term 12.60%
08.49% Tamil Nadu SDL 2026 SOV 8.78%
07.61% GOI 2030 SOV 3.82%
CBLO & Net Current Assets 5.66%
Total Net Assets 100.00%
Rating Profile
Returns of ICICI Prudential Short Term Gilt Fund - Growth Option as on April 30, 2017 - (IPSTGF)
Average Maturity : 4.99 Years Modified Duration : 3.86 Years Yield To Maturity : 7.45%
@Short Term < 8 Years, Long Term >8 Years
ICICI Prudential Short Term Gilt Fund(An Open Ended Gilt Fund)
Entry load : Nil
RiskometerThis Product is suitable for investors who are seeking*:
• Medium term savings solution
• A Gilt Fund that aims to generate income through investment in Gilts of various maturities.
*Investors should consult their financial advisers if in doubt about whether the product is suitable for them.
Dividend History : Refer page no. from 122 to 130
SIP Returns : Refer page no. from 118 to 120
Total Expense Ratio @@ :
IPSTGF : 0.68% p. a.
IPSTGF Direct Plan : 0.37% p. a.
Investment Objective : Refer page no. from 131 to 134
Notes:1. Different plans shall have different expense structure. The performance details provided herein are of ICICI Prudential Short Term Gilt Fund.2. The scheme is currently managed and . Mr. has been managing this fund since . Total Schemes managed Rahul Goswami Anuj Tagra Rahul Goswami Sep 2012by the Fund Manager . Refer annexure from page no. 91 for performance of other schemes currently managed by .is 11 (9 are jointly managed) Rahul GoswamiMr. Anuj Tagra has been managing this fund since . Total Schemes managed by the Fund Manager . Refer annexure from page Oct 2013 is 5 (5 are jointly managed)no. 91 for performance of other schemes currently managed by Anuj Tagra.3. Date of inception:19-Aug-99.4. Past performance may or may not be sustained in future and the same may not necessarily provide the basis for comparison with other investment.5. Load is not considered for computation of returns.6. In case, the start/end date of the concerned period is a nonbusiness date (NBD), the NAV of the previous date is considered for computation of returns. The NAV per unit shown in the table is as on the start date of the said period7. As the scheme was launched before the launch of the benchmark index, benchmark index figures since inception or the required period are not available.
Scheme
10 Year G Sec (Additional Benchmark)
NAV (Rs.) Per Unit (as on April 28,2017 : 41.7426)
CAGR (%)
10.0000
I-SEC Si-BEX (Benchmark)
Since inception
CurrentValue of
Investment of Rs. 10000
CAGR (%) Current Value of
Investment of Rs. 10000
1 Year 3 Year 5 Year
CAGR (%) Current Value of
Investment of Rs. 10000
CAGR (%) Current Value of
Investment of Rs. 10000
38.2589 31.3413 27.1593
Particulars
9.13 10,910.56 10.03 13,318.72 8.98 15,369.54 8.41 41742.60
7.74 10,771.58 8.83 12,888.05 8.51 15,041.31 NA NA
9.64 10,961.31 10.76 13,584.03 8.51 15,038.07 NA NA
94.34%
5.66%
0% 20% 40% 60% 80% 100%
Sovereign Securities
CBLO & Current Assets

Style Box
Fund Managers :
Rahul Goswami(Managing this fund since Sep, 2014 &Overall 20 Years of experience)
Indicative Investment Horizon: 24 months & above
Inception/Allotment date: 12-Sep-14
&&SWP :Rs. 500/- and in multiples of Rs. 1/-
SIP :##
Monthly Frequency: Rs. 1,000/- and in multiple of Rs. 1/-Quarterly Frequency: Rs. 5,000/- and in multiple of Rs. 1/-
NAV (As on 28-Apr-17):IPCMGF Growth Option : 13.2136IPCMGF Direct Plan Growth Option : 13.3143
Option/ sub-options :Growth Option and Dividend (with Monthly, Quarterly, Half Yearly and Annual frequencies)(dividend payout*** and re-investment facility available)
Application Amount for freshSubscription :Rs.5,000 (plus in multiples of Re.1)
Min.Addl.Investment :Rs.1,000 (plus in multiples of Re.1)
Exit load for Redemption / Switch out :- Lumpsum & SIP / SWP OptionUpto 7 Days from allotment - 0.25% ofapplicable NAV, more than 7 Days - Nil
87
Fund Details
Returns of ICICI Prudential Constant Maturity Gilt Fund - Growth Option as on April 30, 2017 - (IPCMGF)
Quantitative Indicators
Average Maturity : 9.73 Years Modified Duration : 6.51 Years Yield To Maturity : 7.46%
Monthly AAUM as on 30-Apr-17 : Rs. 37.74 crores
Closing AUM as on 30-Apr-17 : Rs. 37.57 crores
ICICI Prudential Constant Maturity Gilt FundAn Open Ended Income Fund
Company/Issuer % to NAVRating Rating Profile@Government Securities - Long Term 97.49%
08.15% GOI 2026 SOV 49.79%
08.28% GOI 2027 SOV 47.70%
CBLO & Net Current Assets 2.51%
Total Net Assets 100.00%
@Short Term < 8 Years, Long Term >8 Years
Portfolio as on April 30, 2017
Entry load : Nil
RiskometerThis Product is suitable for investors who are seeking*:
• Long term wealth creation solution
• A Gilt Fund that aims to provide reasonable returns by maintaining an average maturity close to 10 years.
*Investors should consult their financial advisers if in doubt about whether the product is suitable for them.
Min.Redemption Amt. :500/- or all units where amount isbelow 500/-
Dividend History : Refer page no. from 122 to 130
SIP Returns : Refer page no. from 118 to 120
Total Expense Ratio @@ :
IPCMGF : 0.30% p. a.
IPCMGF Direct Plan : 0.22% p. a.
Investment Objective : Refer page no. from 131 to 134
@@ Total Expense Ratio is weighted average for the month. Ratio excludes service tax on management fees and includes B-15 clawback reversal, if any.## Minimum number of installments for monthly frequency will be 6 and for Quarterly frequency will be 4. w.e.f February 01, 2017.* Minimum number of installments for daily, weekly and monthly frequency will be 6 and for Quarterly frequency will be 4. w.e.f February 01, 2017. Refer page No. 137 for definition of Flex STP and Value STP.&& Minimum number of installments for both monthly and quarterly will be 2. w.e.f February 01, 2017.*** In case the unit holder has opted for dividend payout option, the minimum amount for dividend payout shall be 100 (net of dividend distribution tax and other statutory levy, if any), else the dividend would be mandatorily reinvested.
STP/ Flex STP/ Value STP *:Daily Frequency: Rs. 250/- and in multiples of Rs. 50/-Weekly, Monthly and Quarterly Frequency: Rs. 1,000/- and in multiples of Rs. 1/-
Notes:1. Different plans shall have different expense structure. The performance details provided herein are of ICICI Prudential Constant Maturity Gilt Fund.2. The scheme is currently managed and . Mr. has been managing this fund since 4. Total Schemes managed Rahul Goswami Anuj Tagra Rahul Goswami Sep 201by the Fund Manager . Refer annexure from page no. 91 for performance of other schemes currently managed by .is 11 (9 are jointly managed) Rahul Goswami3. Date of inception: 12-Sep-144. As the Scheme has completed more than 1 year but less than 3 years, the performance details of only since inception and 1 year are provided herein.5. Past performance may or may not be sustained in future and the same may not necessarily provide the basis for comparison with other investment.6. Load is not considered for computation of returns.7. In case, the start/end date of the concerned period is a nonbusiness date (NBD), the NAV of the previous date is considered for computation of returns. The NAV per unit shown in the table is as on the start date of the said period
Scheme
NAV (Rs.) Per Unit (as on April 28,2017 : 13.2136)
CAGR (%)
10.0000
10 Year G Sec (Benchmark)
Since inception
CurrentValue of
Investment of Rs. 10000
CAGR (%) Current Value of
Investment of Rs. 10000
1 Year 3 Year 5 Year
CAGR (%) Current Value of
Investment of Rs. 10000
CAGR (%) Current Value of
Investment of Rs. 10000
11.9677 - -
Particulars
10.44 11041.05 - - - - 11.19 13213.60
9.64 10961.31 - - - - 10.74 13072.95
97.49%
2.51%
0% 20% 40% 60% 80% 100% 120%
Sovereign Securities
CBLO & Current Assets

88
Style Box
Portfolio as on April 30, 2017
Quantitative Indicators
For Schemes which have discontinued fresh subscriptions with effect from October 01,2012,the dividend declared will be compulsorily paid out under the “dividend payout “option.@@ Total Expense Ratio is weighted average for the month. Ratio excludes service tax on management fees and includes B-15 clawback reversal, if any.## Minimum number of installments for monthly frequency will be 6 and for Quarterly frequency will be 4. w.e.f February 01, 2017.* Minimum number of installments for daily, weekly and monthly frequency will be 6 and for Quarterly frequency will be 4. w.e.f February 01, 2017. Refer page No. 137 for definition of Flex STP and Value STP.&& Minimum number of installments for both monthly and quarterly will be 2. w.e.f February 01, 2017.*** In case the unit holder has opted for dividend payout option, the minimum amount for dividend payout shall be 100 (net of dividend distribution tax and other statutory levy, if any), else the dividend would be mandatorily reinvested.
Fund Managers :
Fund Details
Manish Banthia(Managing this fund since Jan, 2015 & Overall 13 years of experience)Anuj Tagra(Managing this fund since Oct, 2013 & Overall 9 years of experience)
Indicative Investment Horizon:24 months & above
Inception/Allotment date: 19-Nov-03
Monthly AAUM as on 30-Apr-17 : Rs. 571.08 crores
Closing AUM as on 30-Apr-17 : Rs. 562.62 crores
NAV (As on 28-Apr-17):IPGFIP(PF) Growth Option : 33.1876IPGFIP(PF) Direct Plan Growth Option : 33.6122
Option/ sub-options :Growth Options, Growth AEP (withRegular and Appreciation) and Dividend Option (with Half yearly frequency)(dividend payout*** and re-investment facility available)
Application Amount for freshSubscription :Rs.5,000 (plus in multiples of Re.1)
Min.Addl.Investment :Rs.5,000 & in multiples thereof
Exit load for Redemption / Switch out:- Lumpsum & SIP / SWP OptionNil
SIP :##
Monthly Frequency: Rs. 1,000/- and in multiple of Rs. 1/-Quarterly Frequency: Rs. 5,000/- and in multiple of Rs. 1/-
&&SWP :Rs. 500/- and in multiples of Rs. 1/-
STP/ Flex STP/ Value STP * :Daily Frequency: Rs. 250/- and in multiples of Rs. 50/-Weekly, Monthly and Quarterly Frequency: Rs. 1,000/- and in multiples of Rs. 1/-
Min.Redemption Amt. :500/- or all units where amount is below 500/-
Rating Profile
Returns of ICICI Prudential Gilt Fund Investment Plan PF Option - Growth Option as on April 30, 2017 - (IPGFIP(PF))
Average Maturity : 19.00 Years Modified Duration : 8.94 Years Yield To Maturity : 7.65%
• Top Ten Holdings@Short Term < 8 Years, Long Term >8 Years
ICICI Prudential Gilt Fund Investment Plan PF Option
(An Open Ended Gilt Fund)
Entry load : Nil
RiskometerThis Product is suitable for investors who are seeking*:
• Long term wealth creation solution
• A Gilt Fund that aims to generate income through investment in Gilts of various maturities.
*Investors should consult their financial advisers if in doubt about whether the product is suitable for them.
Government Securities 97.21%@ Short Term 5.62%
• 08.29% Rajasthan SDL 2024 SOV 2.74%
08.03% Madhya Pradesh SDL 2025 SOV 0.90%
07.92% Madhya Pradesh SDL 2024 SOV 0.90%
07.68% Madhya Pradesh SDL 2023 SOV 0.89%
08.63% Tamil Nadu SDL 2023 SOV 0.19%@ Long Term 91.59%
• 08.17% GOI 2044 SOV 38.99%
• 07.61% GOI 2030 SOV 10.15%
• 06.79% GOI 2029 SOV 9.52%
• 07.88% GOI 2030 SOV 8.32%
• 08.13% GOI 2045 SOV 6.61%
• 07.73% GOI 2034 SOV 2.74%
• 08.25% Madhya Pradesh SDL 2028 SOV 0.92%
• 08.14% Himachal Pradesh SDL 2028 SOV 0.91%
• 08.06% Madhya Pradesh SDL 2031 SOV 0.91%
08.05% Madhya Pradesh SDL 2029 SOV 0.91%
08.01% Himachal Pradesh SDL 2031 SOV 0.91%
08.02% Madhya Pradesh SDL 2030 SOV 0.91%
07.94% Himachal Pradesh SDL 2032 SOV 0.90%
07.96% Himachal Pradesh SDL 2029 SOV 0.90%
07.93% Madhya Pradesh SDL 2032 SOV 0.90%
Company/Issuer % to NAVRating Company/Issuer % to NAVRating
Dividend History : Refer page no. from 122 to 130
SIP Returns : Refer page no. from 118 to 120
Total Expense Ratio @@ :
IPGFIP(PF) : 0.72% p. a.
IPGFIP(PF) Direct Plan : 0.57% p. a.
Investment Objective : Refer page no. from 131 to 134
07.89% Himachal Pradesh SDL 2030 SOV 0.90%
07.91% Madhya Pradesh SDL 2027 SOV 0.90%
07.71% Tamil Nadu SDL 2029 SOV 0.89%
07.71% Tamil Nadu SDL 2030 SOV 0.89%
07.71% Tamil Nadu SDL 2031 SOV 0.89%
07.71% Tamil Nadu SDL 2028 SOV 0.89%
07.71% Tamil Nadu SDL 2032 SOV 0.88%
07.69% Madhya Pradesh SDL 2026 SOV 0.88%
CBLO & Net Current Assets 2.79%
Total Net Assets 100.00%
Notes:1. Different plans shall have different expense structure. The performance details provided herein are of ICICI Prudential Gilt Fund Investment Plan PF Option.2. The scheme is currently managed Manish Banthia and . Mr. Manish Banthia has been managing this fund since . Total Schemes managed Anuj Tagra Jan 2015by the Fund Manager . Refer annexure from page no. 91 for performance of other schemes currently managed by Manish Banthia. is 19 (5 are jointly managed) Mr. has been managing this fund since . Total Schemes managed by the Fund Manager . Refer annexure from page Anuj Tagra Oct 2013 is 5 (5 are jointly managed)no. 91 for performance of other schemes currently managed by . Anuj Tagra3. Date of inception:19-Nov-03.4. Past performance may or may not be sustained in future and the same may not necessarily provide the basis for comparison with other investment.5. Load is not considered for computation of returns.6. In case, the start/end date of the concerned period is a nonbusiness date (NBD), the NAV of the previous date is considered for computation of returns. The NAV per unit shown in the table is as on the start date of the said period
Scheme
10 Year G Sec (Additional Benchmark)
NAV (Rs.) Per Unit (as on April 28,2017 : 33.1876)
CAGR (%)
10.0000
I-SEC Li-BEX (Benchmark)
Since inception
CurrentValue of
Investment of Rs. 10000
CAGR (%) Current Value of
Investment of Rs. 10000
1 Year 3 Year 5 Year
CAGR (%) Current Value of
Investment of Rs. 10000
CAGR (%) Current Value of
Investment of Rs. 10000
29.6112 23.1303 20.3524
Particulars
12.11 11,207.79 12.80 14,348.11 10.28 16,306.48 9.33 33,187.60
10.97 11,093.44 12.71 14,313.54 10.68 16,607.84 7.74 27,247.46
9.64 10,961.31 10.76 13,584.03 8.51 15,038.07 5.61 20,843.42
97.21%
2.79%
0% 20% 40% 60% 80% 100% 120%
Sovereign Securities
CBLO & Current Assets

89
Style Box
Fund Details
Rating Profile
Quantitative Indicators
Portfolio as on April 30, 2017
Company/Issuer % to NAVRating
For Schemes which have discontinued fresh subscriptions with effect from October 01,2012,the dividend declared will be compulsorily paid out under the “dividend payout “option.@@ Total Expense Ratio is weighted average for the month. Ratio excludes service tax on management fees and includes B-15 clawback reversal, if any.## Minimum number of installments for monthly frequency will be 6 and for Quarterly frequency will be 4. w.e.f February 01, 2017.* Minimum number of installments for daily, weekly and monthly frequency will be 6 and for Quarterly frequency will be 4. w.e.f February 01, 2017. Refer page No. 137 for definition of Flex STP and Value STP.&& Minimum number of installments for both monthly and quarterly will be 2. w.e.f February 01, 2017.*** In case the unit holder has opted for dividend payout option, the minimum amount for dividend payout shall be 100 (net of dividend distribution tax and other statutory levy, if any), else the dividend would be mandatorily reinvested.
Fund Managers :
Rahul Goswami (Managing this fund since Sep, 2012 & Overall 20 years of experience)Anuj Tagra (Managing this fund since Oct, 2013 & Overall 9 years of experience)
Indicative Investment Horizon:24 months & above
Inception/Allotment date: 19-Aug-99
Monthly AAUM as on 30-Apr-17 : Rs. 1610.89 crores
Closing AUM as on 30-Apr-17 : Rs. 1601.54 crores
NAV (As on 28-Apr-17):IPLTGF Growth Option : 56.3332IPLTGF Direct Plan Growth Option : 58.0557
Option/ sub-options :Growth Options, Growth AEP (withRegular and Appreciation) and Dividend Option(dividend payout*** and re-investment facility available)
Application Amount for freshSubscription :Rs.5,000 (plus in multiples of Re.1)
Min.Addl.Investment :Rs.5,000 & in multiples thereof
Exit load for Redemption / Switchout :- Lumpsum & SIP / STP / SWP OptionNil
SIP :##
Monthly Frequency: Rs. 1,000/- and in multiple of Rs. 1/-Quarterly Frequency: Rs. 5,000/- and in multiple of Rs. 1/-
&&SWP :Rs. 500/- and in multiples of Rs. 1/-
STP/ Flex STP/ Value STP * :Daily Frequency: Rs. 250/- and in multiples of Rs. 50/-Weekly, Monthly and Quarterly Frequency: Rs. 1,000/- and in multiples of Rs. 1/-
Min.Redemption Amt. :500/- or all units where amount is below 500/-
Government Securities 95.67%@ Short Term 2.55%
• 08.92% Tamil Nadu SDL 2022 SOV 0.66%
08.02% Tamil Nadu SDL 2025 SOV 0.63%
07.91% Tamil Nadu SDL 2024 SOV 0.63%
07.67% Tamil Nadu SDL 2023 SOV 0.63%@ Long Term 93.11%
• 06.62% GOI 2051 SOV 28.50%
• 08.13% GOI 2045 SOV 27.85%
• 08.17% GOI 2044 SOV 17.48%
• 06.79% GOI 2029 SOV 7.66%
• 08.15% GOI 2026 SOV 5.22%
• 07.88% GOI 2030 SOV 1.62%
• 08.24% Tamil Nadu SDL 2028 SOV 0.65%
• 08.05% Tamil Nadu SDL 2031 SOV 0.64%
• 08.04% Tamil Nadu SDL 2029 SOV 0.64%
08.01% Tamil Nadu SDL 2030 SOV 0.64%
07.92% Tamil Nadu SDL 2032 SOV 0.63%
07.90% Tamil Nadu SDL 2027 SOV 0.63%
07.68% Tamil Nadu SDL 2026 SOV 0.62%
07.61% GOI 2030 SOV 0.32%
CBLO & Net Current Assets 4.33%
Total Net Assets 100.00%
Returns of ICICI Prudential Long Term Gilt Fund - Growth Option as on April 30, 2017 - (IPLTGF)
Average Maturity : 24.95 Years Modified Duration : 9.96 Years Yield To Maturity : 7.61%
• Top Ten Holdings@Short Term < 8 Years, Long Term >8 Years
ICICI Prudential Long Term Gilt Fund(An Open Ended Gilt Fund)
Entry load : Nil
RiskometerThis Product is suitable for investors who are seeking*:
• Long term wealth creation solution
• A Gilt Fund that aims to generate income through investment in Gilts of various maturities.
*Investors should consult their financial advisers if in doubt about whether the product is suitable for them.
Dividend History : Refer page no. from 122 to 130
SIP Returns : Refer page no. from 118 to 120
Total Expense Ratio @@ :
IPLTGF : 1.12% p. a.
IPLTGF Direct Plan : 0.44% p. a.
Investment Objective : Refer page no. from 131 to 134
Notes:1. Different plans shall have different expense structure. The performance details provided herein are of ICICI Prudential Long Term Gilt Fund.2. The scheme is currently managed and . Mr. has been managing this fund since . Total Schemes managed Rahul Goswami Anuj Tagra Rahul Goswami Sep 2012by the Fund Manager . Refer annexure from page no. 91 for performance of other schemes currently managed by .is 11 (9 are jointly managed) Rahul GoswamiMr. Anuj Tagra has been managing this fund since . Total Schemes managed by the Fund Manager . Refer annexure from page Oct 2013 is 5 (5 are jointly managed)no. 91 for performance of other schemes currently managed by Anuj Tagra.3. Date of inception:19-Aug-99.4. Past performance may or may not be sustained in future and the same may not necessarily provide the basis for comparison with other investment.5. Load is not considered for computation of returns.6. In case, the start/end date of the concerned period is a nonbusiness date (NBD), the NAV of the previous date is considered for computation of returns. The NAV per unit shown in the table is as on the start date of the said period7. As the scheme was launched before the launch of the benchmark index, benchmark index figures since inception or the required period are not available.
Scheme
10 Year G Sec (Additional Benchmark)
NAV (Rs.) Per Unit (as on April 28,2017 : 56.3332)
CAGR (%)
10.0000
I-SEC I-BEX (Benchmark)
Since inception
CurrentValue of
Investment of Rs. 10000
CAGR (%) Current Value of
Investment of Rs. 10000
1 Year 3 Year 5 Year
CAGR (%) Current Value of
Investment of Rs. 10000
CAGR (%) Current Value of
Investment of Rs. 10000
50.8086 40.2224 35.9487
Particulars
10.90 11,087.34 11.89 14,005.43 9.41 15,670.44 10.26 56,333.20
9.82 10,978.86 11.99 14,040.90 10.21 16,252.25 10.09 54,815.87
9.64 10,961.31 10.76 13,584.03 8.51 15,038.07 NA NA
95.67%
4.33%
0% 20% 40% 60% 80% 100% 120%
Sovereign Securities
CBLO & Current Assets

Fund Manager of all Advisor Series: Mrinal Singh (Managing this fund since Feb 2011 & Overall 14 years of experience)
ICICI Prudential Advisor Series - Dynamic Accrual Plan (IPAS-DAP)
Inception/Allotment date: 18-Dec-03
Monthly AAUM as on 30-Apr-17 : Rs. 25.74 crores
Closing AUM as on 30-Apr-17 : Rs. 26.20 crores
NAV (As on 28-Apr-17):
IPAS-DAP Growth Option : 25.7608 IPAS-DAP Direct Plan Growth Option : 26.0385
Portfolio - ICICI Prudential Advisor Series - Dynamic Accrual Plan
Company/Issuer % to NAV
Inception/Allotment date: 18-Dec-03
Monthly AAUM as on 30-Apr-17 : Rs. 5.63 crores
Closing AUM as on 30-Apr-17 : Rs. 5.64 crores
NAV (As on 28-Apr-17):
IPAS-MP Growth Option : 45.8162 IPAS-MP Direct Plan Growth Option : 46.7430
Portfolio - ICICI Prudential Advisor Series - Moderate Plan
Company/Issuer
Entry load : Nil Exit Load : Upto 1 Year 1% of applicable NAV or else Nil.Total Expense Ratio @@ : IPAS-MP : 0.73% p. a. IPAS-MP Direct Plan : 0.27% p. a.
ICICI Prudential Advisor Series - Cautious Plan (IPAS-CP)
Entry load : Nil #Exit Load : (AWP ) 10% of units within 6 Months from allotment - Nil.
More than 10% of units, within 6 Months - 0.50% of applicable NAV More than 6 Months - Nil (w.e.f. 2-May-17) Total Expense Ratio @@ : IPAS-DAP : 1.00% p. a. IPAS-DAP Direct Plan : 0.63% p. a.
ICICI Prudential Advisor Series - Long Term Savings Plan(IPAS-LTSP)
Inception/Allotment date: 18-Dec-03
Monthly AAUM as on 30-Apr-17 : Rs. 89.53 crores
Closing AUM as on 30-Apr-17 : Rs. 89.52 crores
NAV (As on 28-Apr-17):
IPAS-CP Growth Option : 29.9864 IPAS-CP Direct Plan Growth Option : 30.6935
Inception/Allotment date: 18-Dec-03
Monthly AAUM as on 30-Apr-17 : Rs. 6.91 crores
Closing AUM as on 30-Apr-17 : Rs. 7.03 crores
NAV (As on 28-Apr-17):
IPAS-LTSP Growth Option : 56.5103 IPAS-LTSP Direct Plan Growth Option : 57.5961
Portfolio - ICICI Prudential Advisor Series - Cautious Plan
Company/Issuer % to Nav Company/Issuer % to Nav
Entry load : Nil Exit Load : Upto 3 years from allotment date – 1% of applicable NAV, more than 3 years – Nil
Entry load : Nil Exit Load : Upto 1 Month 0.25% of applicable NAV or else Nil. (w.e.f. 2-May-17) Total Expense Ratio @@ : IPAS-DAP : 0.57% p. a. IPAS-DAP Direct Plan : 0.05% p. a.
Portfolio - ICICI Prudential Advisor Series - Long Term Savings Plan
ICICI Prudential Advisor Series(Open ended Fund of Funds)
WHY SHOULD ONE INVEST?Customised investment solutions to match risk return profile.
ICICI Prudential Advisor Series - Moderate Plan (IPAS-MP)
Figures As on April 30, 2017
% to NAVUnits of Mutual Fund 98.20%
Mutual Fund 98.20%
ICICI Prudential Regular Income Fund - Direct Plan - Growth 70.56%
ICICI Prudential Gilt Fund Investment Plan PF Option-Direct Plan-Growth Opt 22.71%
ICICI Prudential Regular Savings Fund - Direct Plan - Growth 2.96%
ICICI Prudential Corporate Bond Fund - Direct Plan - Growth 1.97%
Short Term Debt and net current assets 1.80%
Total Net Assets 100.00%
Units of Mutual Fund 98.58%
Mutual Fund 98.58%
ICICI Prudential Short Term - Direct Plan - Growth Option 24.91%
ICICI Prudential Banking and PSU Debt Fund - Direct Plan - Growth 24.81%
ICICI Prudential Long Term Gilt Fund - Direct Plan - Growth 24.14%
ICICI Prudential Income Opportunities Fund - Direct Plan - Growth 14.80%
ICICI Prudential Ultra Short Term Plan- Direct Plan - Growth 9.92%
Short Term Debt and net current assets 1.42%
Total Net Assets 100.00%
Units of Mutual Fund 99.58%
Mutual Fund 99.58%
ICICI Prudential Long Term Gilt Fund - Direct Plan - Growth 49.57%
ICICI Prudential Nifty Index Plan - Direct Plan - Growth 46.50%
ICICI Prudential Liquid Fund - Direct Plan - Growth 3.52%
Short Term Debt and net current assets 0.42%
Total Net Assets 100.00%
Units of Mutual Fund 98.94%
Mutual Fund 98.94%
ICICI Prudential Nifty Index Plan - Direct Plan - Growth 59.01%
ICICI Prudential Long Term Gilt Fund - Direct Plan - Growth 39.94%
Short Term Debt and net current assets 1.06%
Total Net Assets 100.00%
“Investors may please note that they will be bearing the expenses of the relevantfund of fund scheme in addition to the expenses of the underlying schemes inwhich the fund of fund scheme makes investment.”
90
This Product is suitable for investors who are seeking*:
• Short term savings solution• A Fund of Funds scheme that seeks to provide reasonable
returns, commensurate with low risk while providing a high level of liquidity, through investments made primarily in the schemes of domestic or offshore Mutual Funds having asset allocation to debt and money market securities.
*Investors should consult their financial advisers if in doubt about whether the productis suitable for them.
Riskometer This Product is suitable for investors who are seeking*:
• Long term wealth creation solution• A Fund of Funds scheme that seeks to generate long term
capital appreciation and current income by creating a portfolio that is invested in the schemes of domestic or offshore Mutual Funds mainly having asset allocation to Equity and equity related securities as well as fixed income securities.
*Investors should consult their financial advisers if in doubt about whether the productis suitable for them.
Riskometer
This Product is suitable for investors who are seeking*:
• Medium term savings solution• A Fund of Funds scheme that seeks to generate regular
income primarily through investments in the schemes of domestic or offshore Mutual Funds having asset allocation primarily to fixed income securities and up to 35% in equity and equity related securities.
Riskometer
*Investors should consult their financial advisers if in doubt about whether the productis suitable for them.
This Product is suitable for investors who are seeking*:
• Long term wealth creation solution• A Fund of Funds scheme that seeks to generate long term
capital appreciation from a portfolio that is invested predominantly in the schemes of domestic or offshore Mutual Funds mainly having asset allocation to Equity and equity related securities and a small portion in debt and money market instruments.
Riskometer
*Investors should consult their financial advisers if in doubt about whether the productis suitable for them.
Dividend History : Refer page no. from 122 to 130
Investment Objective : Refer page no. from 131 to 134
Total Expense Ratio @@ : IPAS-DAP : 0.75% p. a. IPAS-DAP Direct Plan : 0.25% p. a.
@@ Total Expense Ratio is weighted average for the month. Ratio excludes service tax on management fees and includes B-15 clawback reversal, if any.
# Automatic Withdrawal Plan (AWP) feature will allow investors to redeem a fixed sum of money periodically at the prevailing Net Asset Value (NAV) depending on the option chosen by the investor. For more details of this feature, Investors are requested to visit the website of the AMC viz., www.icicipruamc.com

ANNEXURE FOR RETURNS OF ALL THE SCHEMESReturns shown for Growth/Dividend Option wherever applicable as on 30 April, 2017
Scheme Name Inception Date^
91
1 Year (CAGR%) 3 Year (CAGR%) 5 Year (CAGR%)
Funds Managed by Manish Banthia & Anuj Tagra
ICICI Prudential Long Term Plan 12.36 12.48 11.69 20-Jan-10
Crisil Composite Bond Fund Index (Benchmark) 10.07 10.93 9.28
1 Year T Bill (Additional Benchmark) 6.63 7.75 7.41
ICICI Prudential Gilt Fund - Investment Plan - PF Option 12.11 12.80 10.28 19-Nov-03
I-SEC Li-BEX (Benchmark) 10.97 12.71 10.68
10 Year G Sec (Additional Benchmark) 9.64 10.76 8.51
Funds Managed by Rahul Goswami & Anuj Tagra
ICICI Prudential Short Term Gilt Fund 9.13 10.03 8.98 19-Aug-99
I-SEC Si-BEX (Benchmark) 7.74 8.83 8.51
10 Year G Sec (Additional Benchmark) 9.64 10.76 8.51
ICICI Prudential Long Term Gilt Fund 10.90 11.89 9.41 19-Aug-99
I-SEC I-BEX (Benchmark) 9.82 11.99 10.20
10 Year G Sec (Additional Benchmark) 9.64 10.76 8.51
ICICI Prudential Gilt Fund - Treasury Plan - PF Option 10.29 8.50 6.98 11-Feb-04
I-SEC Si-BEX (Benchmark) 7.74 8.83 8.51
10 Year G Sec (Additional Benchmark) 9.64 10.76 8.51
Funds Managed by Manish Gunwani & Ashwin Jain
ICICI Prudential Growth Fund - Series 3 24.59 - - 10-Oct-14
Nifty 50 Index (Benchmark) 18.58 - -
ICICI Prudential Exports and Other Services Fund 19.60 22.12 26.52 30-Nov-05
Nifty Services Sector Index (Benchmark) 18.15 13.92 13.87
Nifty 50 Index (Additional Benchmark) 18.58 11.60 12.14
ICICI Prudential Technology Fund -6.21 8.80 16.31 03-Mar-00
S&P BSE Information Technology (Benchmark) -15.14 3.20 11.02
Nifty 50 Index (Additional Benchmark) 18.58 11.60 12.14
Funds Managed by Atul Patel
ICICI Prudential Value Fund - Series 7 40.57 - - 08-Jun-15
S&P BSE 500 Index (Benchmark) 24.80 - -
Nifty 50 Index (Additional Benchmark) 18.58 - -
Funds Managed by George Heber Joseph & Atul Patel
ICICI Prudential Multicap Fund 28.96 22.42 19.81 01-Oct-94
S&P BSE 200 Index (Benchmark) 22.99 14.97 13.83
Nifty 50 Index (Additional Benchmark) 18.58 11.60 12.14
Funds Managed by Sankaran Naren, Atul Patel & Ihab Dalwai
ICICI Prudential Indo Asia Equity Fund 32.61 21.13 19.12 18-Oct-07
65% Nifty 50 + 35% MSCI Asia ex - Japan Index (Benchmark) 17.16 9.39 10.55
Nifty 50 Index (Additional Benchmark) 18.58 11.60 12.14
Funds Managed by Sankaran Naren, Atul Patel & Manish Banthia
ICICI Prudential Balanced Fund 25.78 19.95 18.75 03-Nov-99
CRISIL Balanced Fund – Aggressive Index (Benchmark) 15.73 11.62 11.40
Nifty 50 Index (Additional Benchmark) 18.58 11.60 12.14
1 Year T Bill (Additional Benchmark) 6.63 7.75 7.41
Funds Managed by Manish Gunwani & Atul Patel
ICICI Prudential Growth Fund - Series 7 31.39 - - 22-Jan-15
Nifty 50 Index (Benchmark) 18.58 - -
ICICI Prudential Growth Fund - Series 1 28.00 - - 20-Jun-14
Nifty 50 Index (Benchmark) 18.58 - -
Funds Managed by Mrinal Singh & Atul Patel
ICICI Prudential Value Fund - Series 5 27.59 - - 10-Sep-14
S&P BSE 500 Index (Benchmark) 24.80 - -
Nifty 50 Index (Additional Benchmark) 18.58 - -
Funds Managed by Sankaran Naren & Atul Patel
ICICI Prudential Value Fund - Series 2 30.83 24.27 - 06-Dec-13
S&P BSE 500 Index (Benchmark) 24.80 15.89 -
Nifty 50 Index (Additional Benchmark) 18.58 11.60 -
ICICI Prudential Infrastructure Fund 32.29 18.59 14.60 31-Aug-05
Nifty Infrastructure Index (Benchmark) 23.45 7.65 6.62
Nifty 50 Index (Additional Benchmark) 18.58 11.60 12.14
ICICI Prudential Value Fund - Series 6 24.31 - - 31-Mar-15
S&P BSE 500 Index (Benchmark) 24.80 - -
Nifty 50 Index (Additional Benchmark) 18.58 - -
ICICI Prudential Dynamic Plan 27.26 16.62 17.34 31-Oct-02
Nifty 50 Index (Benchmark) 18.58 11.60 12.14
Funds Managed by Rahul Goswami & Chandni Gupta
ICICI Prudential Banking & PSU Debt Fund 10.01 9.88 9.49 01-Jan-10
CRISIL Short Term Bond Fund Index (Benchmark) 8.70 9.18 9.05
1 Year T Bill (Additional Benchmark) 6.63 7.75 7.41
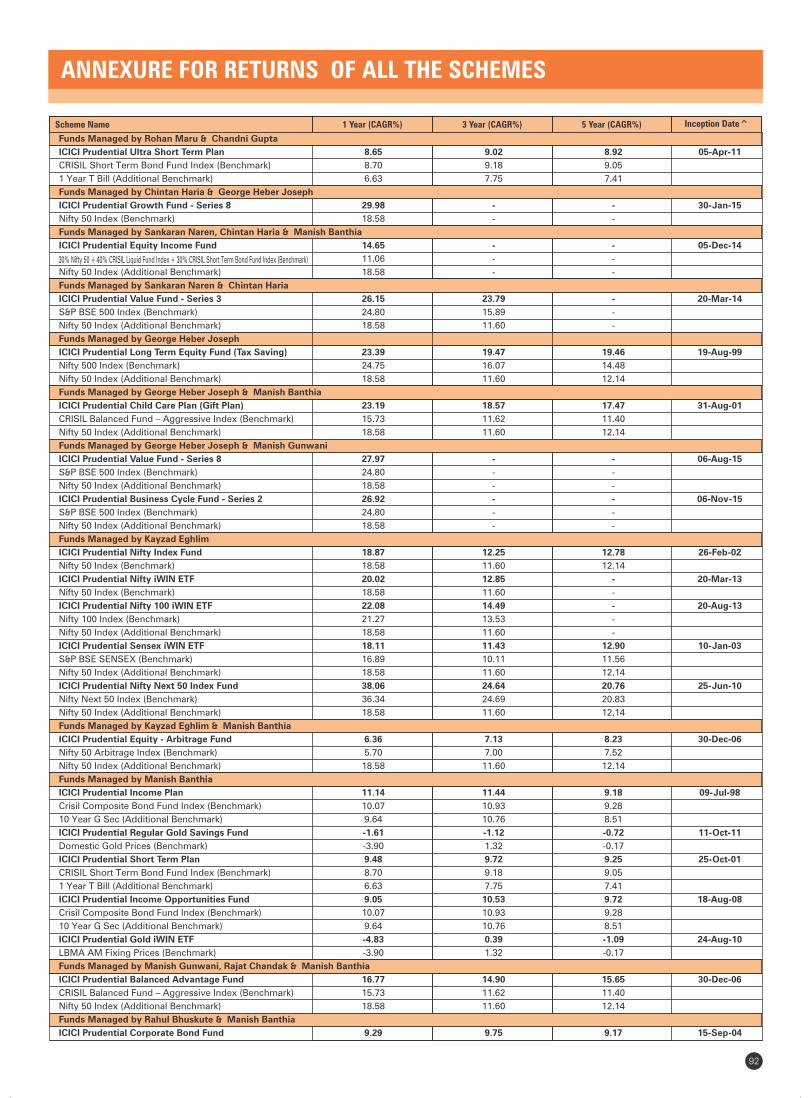
ANNEXURE FOR RETURNS OF ALL THE SCHEMES
Scheme Name Inception Date^
92
1 Year (CAGR%) 3 Year (CAGR%) 5 Year (CAGR%)
30% Nifty 50 + 40% CRISIL Liquid Fund Index + 30% CRISIL Short Term Bond Fund Index (Benchmark)
Funds Managed by Rohan Maru & Chandni Gupta
ICICI Prudential Ultra Short Term Plan 8.65 9.02 8.92 05-Apr-11
CRISIL Short Term Bond Fund Index (Benchmark) 8.70 9.18 9.05
1 Year T Bill (Additional Benchmark) 6.63 7.75 7.41
Funds Managed by Chintan Haria & George Heber Joseph
ICICI Prudential Growth Fund - Series 8 29.98 - - 30-Jan-15
Nifty 50 Index (Benchmark) 18.58 - -
Funds Managed by Sankaran Naren, Chintan Haria & Manish Banthia
ICICI Prudential Equity Income Fund 14.65 - - 05-Dec-14
11.06 - -
Nifty 50 Index (Additional Benchmark) 18.58 - -
Funds Managed by Sankaran Naren & Chintan Haria
ICICI Prudential Value Fund - Series 3 26.15 23.79 - 20-Mar-14
S&P BSE 500 Index (Benchmark) 24.80 15.89 -
Nifty 50 Index (Additional Benchmark) 18.58 11.60 -
Funds Managed by George Heber Joseph
ICICI Prudential Long Term Equity Fund (Tax Saving) 23.39 19.47 19.46 19-Aug-99
Nifty 500 Index (Benchmark) 24.75 16.07 14.48
Nifty 50 Index (Additional Benchmark) 18.58 11.60 12.14
Funds Managed by George Heber Joseph & Manish Banthia
ICICI Prudential Child Care Plan (Gift Plan) 23.19 18.57 17.47 31-Aug-01
CRISIL Balanced Fund – Aggressive Index (Benchmark) 15.73 11.62 11.40
Nifty 50 Index (Additional Benchmark) 18.58 11.60 12.14
Funds Managed by George Heber Joseph & Manish Gunwani
ICICI Prudential Value Fund - Series 8 27.97 - - 06-Aug-15
S&P BSE 500 Index (Benchmark) 24.80 - -
Nifty 50 Index (Additional Benchmark) 18.58 - -
ICICI Prudential Business Cycle Fund - Series 2 26.92 - - 06-Nov-15
S&P BSE 500 Index (Benchmark) 24.80 - -
Nifty 50 Index (Additional Benchmark) 18.58 - -
Funds Managed by Kayzad Eghlim
ICICI Prudential Nifty Index Fund 18.87 12.25 12.78 26-Feb-02
Nifty 50 Index (Benchmark) 18.58 11.60 12.14
ICICI Prudential Nifty iWIN ETF 20.02 12.85 - 20-Mar-13
Nifty 50 Index (Benchmark) 18.58 11.60 -
ICICI Prudential Nifty 100 iWIN ETF 22.08 14.49 - 20-Aug-13
Nifty 100 Index (Benchmark) 21.27 13.53 -
Nifty 50 Index (Additional Benchmark) 18.58 11.60 -
ICICI Prudential Sensex iWIN ETF 18.11 11.43 12.90 10-Jan-03
S&P BSE SENSEX (Benchmark) 16.89 10.11 11.56
Nifty 50 Index (Additional Benchmark) 18.58 11.60 12.14
ICICI Prudential Nifty Next 50 Index Fund 38.06 24.64 20.76 25-Jun-10
Nifty Next 50 Index (Benchmark) 36.34 24.69 20.83
Nifty 50 Index (Additional Benchmark) 18.58 11.60 12.14
Funds Managed by Kayzad Eghlim & Manish Banthia
ICICI Prudential Equity - Arbitrage Fund 6.36 7.13 8.23 30-Dec-06
Nifty 50 Arbitrage Index (Benchmark) 5.70 7.00 7.52
Nifty 50 Index (Additional Benchmark) 18.58 11.60 12.14
Funds Managed by Manish Banthia
ICICI Prudential Income Plan 11.14 11.44 9.18 09-Jul-98
Crisil Composite Bond Fund Index (Benchmark) 10.07 10.93 9.28
10 Year G Sec (Additional Benchmark) 9.64 10.76 8.51
ICICI Prudential Regular Gold Savings Fund -1.61 -1.12 -0.72 11-Oct-11
Domestic Gold Prices (Benchmark) -3.90 1.32 -0.17
ICICI Prudential Short Term Plan 9.48 9.72 9.25 25-Oct-01
CRISIL Short Term Bond Fund Index (Benchmark) 8.70 9.18 9.05
1 Year T Bill (Additional Benchmark) 6.63 7.75 7.41
ICICI Prudential Income Opportunities Fund 9.05 10.53 9.72 18-Aug-08
Crisil Composite Bond Fund Index (Benchmark) 10.07 10.93 9.28
10 Year G Sec (Additional Benchmark) 9.64 10.76 8.51
ICICI Prudential Gold iWIN ETF -4.83 0.39 -1.09 24-Aug-10
LBMA AM Fixing Prices (Benchmark) -3.90 1.32 -0.17
Funds Managed by Manish Gunwani, Rajat Chandak & Manish Banthia
ICICI Prudential Balanced Advantage Fund 16.77 14.90 15.65 30-Dec-06
CRISIL Balanced Fund – Aggressive Index (Benchmark) 15.73 11.62 11.40
Nifty 50 Index (Additional Benchmark) 18.58 11.60 12.14
Funds Managed by Rahul Bhuskute & Manish Banthia
ICICI Prudential Corporate Bond Fund 9.29 9.75 9.17 15-Sep-04

ANNEXURE FOR RETURNS OF ALL THE SCHEMES
Scheme Name Inception Date^
93
1 Year (CAGR%) 3 Year (CAGR%) 5 Year (CAGR%)
CRISIL Short Term Bond Fund Index (Benchmark) 8.70 9.18 9.05
1 Year T Bill (Additional Benchmark) 6.63 7.75 7.41
ICICI Prudential Regular Savings Fund 9.40 9.41 9.12 03-Dec-10
Crisil Composite Bond Fund Index (Benchmark) 10.07 10.93 9.28
1 Year T Bill (Additional Benchmark) 6.63 7.75 7.41
Funds Managed by Rajat Chandak, Rahul Bhuskute & Manish Banthia
ICICI Prudential Regular Income Fund 9.07 10.81 9.02 03-May-11
Crisil MIP Blended Index (Benchmark) 11.42 11.17 9.85
10 Year G Sec (Additional Benchmark) 9.64 10.76 8.51
Funds Managed by Rajat Chandak & Manish Banthia
ICICI Prudential MIP 25 15.72 13.96 12.09 30-Mar-04
Crisil MIP Blended Index (Benchmark) 11.42 11.17 9.85
10 Year G Sec (Additional Benchmark) 9.64 10.76 8.51
ICICI Prudential Child Care Plan (Study Plan) 15.08 16.89 15.42 31-Aug-01
Crisil MIP Blended Index (Benchmark) 11.42 11.17 9.85
10 Year G Sec (Additional Benchmark) 9.64 10.76 8.51
ICICI Prudential Monthly Income Plan 13.01 11.69 10.37 10-Nov-00
Crisil MIP Blended Index (Benchmark) 11.42 11.17 9.85
10 Year G Sec (Additional Benchmark) 9.64 10.76 8.51
Funds Managed by Manish Gunwani
ICICI Prudential Focused Bluechip Equity Fund 23.64 17.44 16.80 23-May-08
Nifty 50 Index (Benchmark) 18.58 11.60 12.14
Funds Managed by Manish Gunwani & Rajat Chandak
ICICI Prudential R.I.G.H.T 28.83 22.15 22.09 26-Sep-09
Nifty 50 Index (Benchmark) 18.58 11.60 12.14
ICICI Prudential India Recovery Fund – Series 4 26.12 - - 25-Feb-16
S&P BSE 500 Index (Benchmark) 24.80 - -
Nifty 50 Index (Additional Benchmark) 18.58 - -
Funds Managed by Mrinal Singh & Mittul Kalawadia
ICICI Prudential India Recovery Fund – Series 3 33.57 - - 28-Aug-15
S&P BSE 500 Index (Benchmark) 24.80 - -
Nifty 50 Index (Additional Benchmark) 18.58 - -
ICICI Prudential India Recovery Fund - Series 1 34.27 - - 27-Mar-15
S&P BSE 500 Index (Benchmark) 24.80 - -
Nifty 50 Index (Additional Benchmark) 18.58 - -
ICICI Prudential India Recovery Fund - Series 2 29.54 - - 08-Apr-15
S&P BSE 500 Index (Benchmark) 24.80 - -
Nifty 50 Index (Additional Benchmark) 18.58 - -
ICICI Prudential Midcap Fund 35.06 28.71 23.58 28-Oct-04
Nifty Free Float Midcap 100 Index (Benchmark) 37.19 27.25 19.35
Nifty 50 Index (Additional Benchmark) 18.58 11.60 12.14
ICICI Prudential Business Cycle Fund - Series 1 26.06 - - 07-Oct-15
S&P BSE 500 Index (Benchmark) 24.80 - -
Nifty 50 Index (Additional Benchmark) 18.58 - -
Funds Managed by Sankaran Naren & Mittul Kalawadia
ICICI Prudential Value Fund - Series 1 28.83 22.31 - 07-Nov-13
S&P BSE 500 Index (Benchmark) 24.80 15.89 -
Nifty 50 Index (Additional Benchmark) 18.58 11.60 -
ICICI Prudential Business Cycle Fund - Series 3 37.96 - - 28-Jan-16
S&P BSE 500 Index (Benchmark) 24.80 - -
Nifty 50 Index (Additional Benchmark) 18.58 - -
ICICI Prudential Top 100 Fund 29.51 17.34 16.97 09-Jul-98
Nifty 50 Index (Benchmark) 18.58 11.60 12.14
Funds Managed by Mrinal Singh
ICICI Prudential Value Discovery Fund 19.66 23.64 22.14 16-Aug-04
S&P BSE 500 Index (Benchmark) 24.80 15.89 14.15
Nifty 50 Index (Additional Benchmark) 18.58 11.60 12.14
Funds Managed by Mrinal Singh & Rajat Chandak
ICICI Prudential Value Fund - Series 4 21.73 - - 08-May-14
S&P BSE 500 Index (Benchmark) 24.80 - -
Nifty 50 Index (Additional Benchmark) 18.58 - -
Funds Managed by Vinay Sharma & Mrinal Singh
ICICI Prudential Growth Fund - Series 2 30.91 - - 01-Aug-14
Nifty 50 Index (Benchmark) 18.58 - -
ICICI Prudential Select Large Cap Fund 21.67 14.76 14.60 28-May-09
S&P BSE 100 Index (Benchmark) 21.33 12.94 12.92
Nifty 50 Index (Additional Benchmark) 18.58 11.60 12.14
ICICI Prudential Growth Fund - Series 4 28.76 - - 01-Nov-14
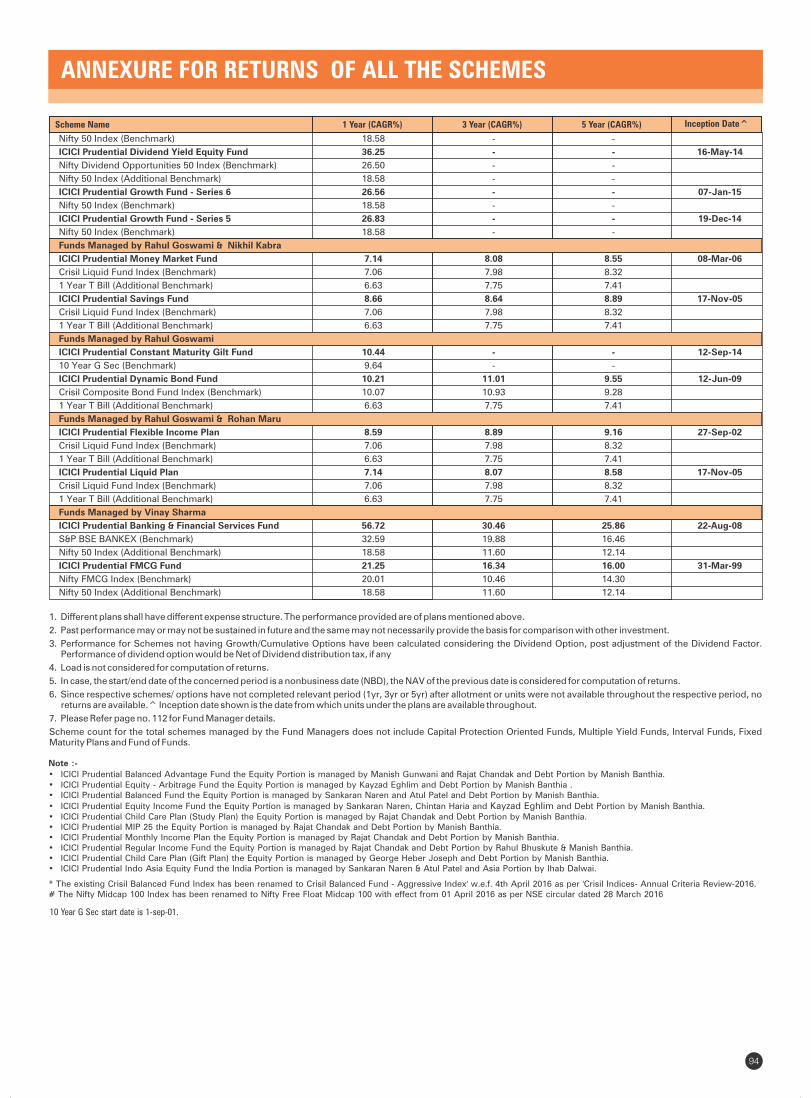
ANNEXURE FOR RETURNS OF ALL THE SCHEMES
Scheme Name 1 Year (CAGR%) 3 Year (CAGR%) 5 Year (CAGR%) Inception Date^
1. Different plans shall have different expense structure. The performance provided are of plans mentioned above.
2. Past performance may or may not be sustained in future and the same may not necessarily provide the basis for comparison with other investment.
3. Performance for Schemes not having Growth/Cumulative Options have been calculated considering the Dividend Option, post adjustment of the Dividend Factor. Performance of dividend option would be Net of Dividend distribution tax, if any
4. Load is not considered for computation of returns.
5. In case, the start/end date of the concerned period is a nonbusiness date (NBD), the NAV of the previous date is considered for computation of returns.
6. Since respective schemes/ options have not completed relevant period (1yr, 3yr or 5yr) after allotment or units were not available throughout the respective period, no returns are available.^ Inception date shown is the date from which units under the plans are available throughout.
7. Please Refer page no. 112 for Fund Manager details.
Scheme count for the total schemes managed by the Fund Managers does not include Capital Protection Oriented Funds, Multiple Yield Funds, Interval Funds, Fixed Maturity Plans and Fund of Funds.
94
Nifty 50 Index (Benchmark) 18.58 - -
ICICI Prudential Dividend Yield Equity Fund 36.25 - - 16-May-14
Nifty Dividend Opportunities 50 Index (Benchmark) 26.50 - -
Nifty 50 Index (Additional Benchmark) 18.58 - -
ICICI Prudential Growth Fund - Series 6 26.56 - - 07-Jan-15
Nifty 50 Index (Benchmark) 18.58 - -
ICICI Prudential Growth Fund - Series 5 26.83 - - 19-Dec-14
Nifty 50 Index (Benchmark) 18.58 - -
Funds Managed by Rahul Goswami & Nikhil Kabra
ICICI Prudential Money Market Fund 7.14 8.08 8.55 08-Mar-06
Crisil Liquid Fund Index (Benchmark) 7.06 7.98 8.32
1 Year T Bill (Additional Benchmark) 6.63 7.75 7.41
ICICI Prudential Savings Fund 8.66 8.64 8.89 17-Nov-05
Crisil Liquid Fund Index (Benchmark) 7.06 7.98 8.32
1 Year T Bill (Additional Benchmark) 6.63 7.75 7.41
Funds Managed by Rahul Goswami
ICICI Prudential Constant Maturity Gilt Fund 10.44 - - 12-Sep-14
10 Year G Sec (Benchmark) 9.64 - -
ICICI Prudential Dynamic Bond Fund 10.21 11.01 9.55 12-Jun-09
Crisil Composite Bond Fund Index (Benchmark) 10.07 10.93 9.28
1 Year T Bill (Additional Benchmark) 6.63 7.75 7.41
Funds Managed by Rahul Goswami & Rohan Maru
ICICI Prudential Flexible Income Plan 8.59 8.89 9.16 27-Sep-02
Crisil Liquid Fund Index (Benchmark) 7.06 7.98 8.32
1 Year T Bill (Additional Benchmark) 6.63 7.75 7.41
ICICI Prudential Liquid Plan 7.14 8.07 8.58 17-Nov-05
Crisil Liquid Fund Index (Benchmark) 7.06 7.98 8.32
1 Year T Bill (Additional Benchmark) 6.63 7.75 7.41
Funds Managed by Vinay Sharma
ICICI Prudential Banking & Financial Services Fund 56.72 30.46 25.86 22-Aug-08
S&P BSE BANKEX (Benchmark) 32.59 19.88 16.46
Nifty 50 Index (Additional Benchmark) 18.58 11.60 12.14
ICICI Prudential FMCG Fund 21.25 16.34 16.00 31-Mar-99
Nifty FMCG Index (Benchmark) 20.01 10.46 14.30
Nifty 50 Index (Additional Benchmark) 18.58 11.60 12.14
Note :-
• ICICI Prudential Balanced Advantage Fund the Equity Portion is managed by Manish Gunwani and Rajat Chandak and Debt Portion by Manish Banthia.• ICICI Prudential Equity - Arbitrage Fund the Equity Portion is managed by Kayzad Eghlim and Debt Portion by Manish Banthia .• ICICI Prudential Balanced Fund the Equity Portion is managed by Sankaran Naren and Atul Patel and Debt Portion by Manish Banthia.
• ICICI Prudential Equity Income Fund the Equity Portion is managed by Sankaran Naren, Chintan Haria and and Debt Portion by Manish Banthia.Kayzad Eghlim• ICICI Prudential Child Care Plan (Study Plan) the Equity Portion is managed by Rajat Chandak and Debt Portion by Manish Banthia.• ICICI Prudential MIP 25 the Equity Portion is managed by Rajat Chandak and Debt Portion by Manish Banthia.• ICICI Prudential Monthly Income Plan the Equity Portion is managed by Rajat Chandak and Debt Portion by Manish Banthia.• ICICI Prudential Regular Income Fund the Equity Portion is managed by Rajat Chandak and Debt Portion by Rahul Bhuskute & Manish Banthia.• ICICI Prudential Child Care Plan (Gift Plan) the Equity Portion is managed by George Heber Joseph and Debt Portion by Manish Banthia.• ICICI Prudential Indo Asia Equity Fund the India Portion is managed by Sankaran Naren & Atul Patel and Asia Portion by Ihab Dalwai.
10 Year G Sec start date is 1-sep-01.
* The existing Crisil Balanced Fund Index has been renamed to Crisil Balanced Fund - Aggressive Index' w.e.f. 4th April 2016 as per 'Crisil Indices- Annual Criteria Review-2016.# The Nifty Midcap 100 Index has been renamed to Nifty Free Float Midcap 100 with effect from 01 April 2016 as per NSE circular dated 28 March 2016

1 Year
CAGR (%)
Current Value of
Investment of Rs. 10000
Scheme Name 3 Year
CAGR (%)
Current Value of
Investment of Rs. 10000
5 Year
CAGR (%)
Current Value of
Investment of Rs. 10000
Since inception
CAGR (%)
Current Value of
Investment of Rs. 10000
Inception date
95
ICICI Prudential Fixed Maturity Plans
Returns shown for Cumulative Option as on 30 April, 2017
(A Close Ended Debt Fund)
ANNEXURE FOR RETURNS OF ALL THE SCHEMES
ICICI Prudential Fixed Maturity Plan - Series 67 - 740 Days Plan H 7.77 10775.14 8.30 12700.30 - - 8.29 13825.80 05-Apr-13
CRISIL Short Term Bond Fund Index (Benchmark) 8.70 10867.02 9.18 13010.59 - - 9.05 14220.00
1 Year T Bill (Additional Benchmark) 6.63 10661.58 7.75 12509.00 - - 7.23 13282.46
NAV (Rs.) Per Unit (as on April 28,2017 : 13.8258) 12.8312 10.8862 - 10.00
ICICI Prudential Fixed Maturity Plan - Series 68 - 745 Days Plan H 8.15 10812.69 8.34 12713.27 - - 8.58 13637.40 22-Jul-13
CRISIL Short Term Bond Fund Index (Benchmark) 8.70 10867.02 9.18 13010.59 - - 9.30 13982.71
1 Year T Bill (Additional Benchmark) 6.63 10661.58 7.75 12509.00 - - 7.51 13140.48
NAV (Rs.) Per Unit (as on April 28,2017 : 13.6374) 12.6124 10.7269 - 10.00
ICICI Prudential Fixed Maturity Plan - Series 68 - 745 Days Plan J 8.12 10809.44 8.30 12698.16 - - 8.75 13705.50 26-Jul-13
CRISIL Short Term Bond Fund Index (Benchmark) 8.70 10867.02 9.18 13010.59 - - 9.48 14053.83
1 Year T Bill (Additional Benchmark) 6.63 10661.58 7.75 12509.00 - - 7.87 13292.43
NAV (Rs.) Per Unit (as on April 28,2017 : 13.7055) 12.6792 10.7933 - 10.00
ICICI Prudential Fixed Maturity Plan-Series 68 - 369 Days Plan K 7.44 10741.83 8.60 12804.56 - - 8.91 13764.90 01-Aug-13
CRISIL Short Term Bond Fund Index (Benchmark) 8.70 10867.02 9.18 13010.59 - - 9.47 14029.07
1 Year T Bill (Additional Benchmark) 6.63 10661.58 7.75 12509.00 - - 7.83 13259.69
NAV (Rs.) Per Unit (as on April 28,2017 : 13.7649) 12.8143 10.7500 - 10.00
ICICI Prudential Fixed Maturity Plan-Series 69 - 366 Days Plan A 7.39 10736.85 8.50 12769.08 - - 8.88 13732.00 07-Aug-13
CRISIL Short Term Bond Fund Index (Benchmark) 8.70 10867.02 9.18 13010.59 - - 9.46 14003.58
1 Year T Bill (Additional Benchmark) 6.63 10661.58 7.75 12509.00 - - 7.84 13246.27
NAV (Rs.) Per Unit (as on April 28,2017 : 13.7320) 12.7896 10.7541 - 10.00
ICICI Prudential Fixed Maturity Plan - Series 69 - 698 Days Plan B 7.44 10742.03 7.98 12587.96 - - 8.45 13526.90 08-Aug-13
CRISIL Short Term Bond Fund Index (Benchmark) 8.70 10867.02 9.18 13010.59 - - 9.44 13993.47
1 Year T Bill (Additional Benchmark) 6.63 10661.58 7.75 12509.00 - - 7.84 13243.08
NAV (Rs.) Per Unit (as on April 28,2017 : 13.5269) 12.5925 10.7459 - 10.00
ICICI Prudential Fixed Maturity Plan - Series 69 - 369 Days Plan J 7.68 10765.42 8.55 12788.36 - - 9.05 13737.00 30-Aug-13
CRISIL Short Term Bond Fund Index (Benchmark) 8.70 10867.02 9.18 13010.59 - - 9.66 14020.63
1 Year T Bill (Additional Benchmark) 6.63 10661.58 7.75 12509.00 - - 7.84 13182.56
NAV (Rs.) Per Unit (as on April 28,2017 : 13.7370) 12.7603 10.7418 - 10.00
ICICI Prudential Fixed Maturity Plan - Series 69 - 1821 Days Plan H 8.03 10800.79 9.36 13077.02 - - 9.88 14106.70 03-Sep-13
Crisil Composite Bond Fund Index (Benchmark) 10.07 11004.47 10.93 13646.82 - - 10.85 14565.30
1 Year T Bill (Additional Benchmark) 6.63 10661.58 7.75 12509.00 - - 7.87 13186.16
NAV (Rs.) Per Unit (as on April 28,2017 : 14.1067) 13.0608 10.7874 - 10.00
ICICI Prudential Fixed Maturity Plan - Series 69 - 1821 Days Plan I 7.76 10773.86 9.06 12969.81 - - 9.24 13803.90 05-Sep-13
Crisil Composite Bond Fund Index (Benchmark) 10.07 11004.47 10.93 13646.82 - - 10.57 14427.37
1 Year T Bill (Additional Benchmark) 6.63 10661.58 7.75 12509.00 - - 7.84 13166.22
NAV (Rs.) Per Unit (as on April 28,2017 : 13.8039) 12.8124 10.6431 - 10.00
ICICI Prudential Fixed Maturity Plan - Series 70 - 367 Days Plan C 7.65 10762.37 8.59 12801.24 - - 8.95 13631.40 17-Sep-13
CRISIL Short Term Bond Fund Index (Benchmark) 8.70 10867.02 9.18 13010.59 - - 9.45 13858.20
1 Year T Bill (Additional Benchmark) 6.63 10661.58 7.75 12509.00 - - 7.82 13129.04
NAV (Rs.) Per Unit (as on April 28,2017 : 13.6314) 12.6658 10.6485 - 10.00
ICICI Prudential Fixed Maturity Plan - Series 70 - 367 Days Plan N 6.67 10665.06 8.27 12688.41 - - 8.35 13300.50 08-Oct-13
CRISIL Short Term Bond Fund Index (Benchmark) 8.70 10867.02 9.18 13010.59 - - 9.18 13666.96
1 Year T Bill (Additional Benchmark) 6.63 10661.58 7.75 12509.00 - - 7.68 13011.03
NAV (Rs.) Per Unit (as on April 28,2017 : 13.3005) 12.4711 10.4824 - 10.00
ICICI Prudential Fixed Maturity Plan - Series 70 - 540 Days Plan S 7.56 10753.91 8.48 12761.25 - - 8.57 13348.40 24-Oct-13
CRISIL Short Term Bond Fund Index (Benchmark) 8.70 10867.02 9.18 13010.59 - - 9.23 13633.95
1 Year T Bill (Additional Benchmark) 6.63 10661.58 7.75 12509.00 - - 7.71 12982.61
NAV (Rs.) Per Unit (as on April 28,2017 : 13.3484) 12.4126 10.4601 - 10.00
ICICI Prudential Fixed Maturity Plan - Series 70 - 1285 Days Plan T 6.65 10663.27 8.56 12792.35 - - 8.84 13419.30 08-Nov-13
Crisil Composite Bond Fund Index (Benchmark) 10.07 11004.47 10.93 13646.82 - - 10.91 14324.17
1 Year T Bill (Additional Benchmark) 6.63 10661.58 7.75 12509.00 - - 7.74 12953.55
NAV (Rs.) Per Unit (as on April 28,2017 : 13.4193) 12.5846 10.4901 - 10.00
ICICI Prudential Fixed Maturity Plan - Series 71 - 547 Days Plan B 8.14 10811.46 8.52 12775.33 - - 8.74 13360.70 13-Nov-13
CRISIL Short Term Bond Fund Index (Benchmark) 8.70 10867.02 9.18 13010.59 - - 9.31 13605.39
1 Year T Bill (Additional Benchmark) 6.63 10661.58 7.75 12509.00 - - 7.79 12962.33
NAV (Rs.) Per Unit (as on April 28,2017 : 13.3607) 12.3579 10.4582 - 10.00
ICICI Prudential Fixed Maturity Plan - Series 71 - 525 Days Plan D 8.02 10799.46 8.59 12802.04 - - 8.71 13305.80 27-Nov-13
CRISIL Short Term Bond Fund Index (Benchmark) 8.70 10867.02 9.18 13010.59 - - 9.28 13543.67
1 Year T Bill (Additional Benchmark) 6.63 10661.58 7.75 12509.00 - - 7.77 12916.06
NAV (Rs.) Per Unit (as on April 28,2017 : 13.3058) 12.3208 10.3935 - 10.00
ICICI Prudential Fixed Maturity Plan - Series 71 - 505 Days Plan H 8.05 10802.45 8.52 12778.74 - - 8.62 13218.20 13-Dec-13
CRISIL Short Term Bond Fund Index (Benchmark) 8.70 10867.02 9.18 13010.59 - - 9.29 13497.87
1 Year T Bill (Additional Benchmark) 6.63 10661.58 7.75 12509.00 - - 7.79 12880.25
NAV (Rs.) Per Unit (as on April 28,2017 : 13.2182) 12.2363 10.3439 - 10.00
ICICI Prudential Fixed Maturity Plan - Series 71 - 480 Days Plan L 7.70 10768.25 8.35 12716.24 - - 8.49 13116.80 30-Dec-13
CRISIL Short Term Bond Fund Index (Benchmark) 8.70 10867.02 9.18 13010.59 - - 9.28 13436.00
1 Year T Bill (Additional Benchmark) 6.63 10661.58 7.75 12509.00 - - 7.79 12836.28
NAV (Rs.) Per Unit (as on April 28,2017 : 13.1168) 12.1810 10.3150 - 10.00
ICICI Prudential Fixed Maturity Plan - Series 72 - 368 Days Plan A 7.40 10738.01 8.35 12716.15 - - 8.37 13057.20 03-Jan-14
CRISIL Short Term Bond Fund Index (Benchmark) 8.70 10867.02 9.18 13010.59 - - 9.26 13416.98

1 Year
CAGR (%)
Current Value of
Investment of Rs. 10000
Scheme Name 3 Year
CAGR (%)
Current Value of
Investment of Rs. 10000
5 Year
CAGR (%)
Current Value of
Investment of Rs. 10000
Since inception
CAGR (%)
Current Value of
Investment of Rs. 10000
Inception date
96
ICICI Prudential Fixed Maturity Plans(A Close Ended Debt Fund)
Returns shown for Cumulative Option as on 30 April, 2017
ANNEXURE FOR RETURNS OF ALL THE SCHEMES
1 Year T Bill (Additional Benchmark) 6.63 10661.58 7.75 12509.00 - - 7.75 12810.51
NAV (Rs.) Per Unit (as on April 28,2017 : 13.0572) 12.1598 10.2682 - 10.00
ICICI Prudential Fixed Maturity Plan - Series 72 - 525 Days Plan B 6.91 10688.71 7.68 12482.21 - - 7.84 12825.60 10-Jan-14
CRISIL Short Term Bond Fund Index (Benchmark) 8.70 10867.02 9.18 13010.59 - - 9.26 13393.35
1 Year T Bill (Additional Benchmark) 6.63 10661.58 7.75 12509.00 - - 7.73 12783.20
NAV (Rs.) Per Unit (as on April 28,2017 : 12.8256) 11.9992 10.2751 - 10.00
ICICI Prudential Fixed Maturity Plan - Series 72 - 366 Days Plan C 7.16 10713.93 8.21 12668.53 - - 8.28 12985.50 15-Jan-14
CRISIL Short Term Bond Fund Index (Benchmark) 8.70 10867.02 9.18 13010.59 - - 9.24 13369.74
1 Year T Bill (Additional Benchmark) 6.63 10661.58 7.75 12509.00 - - 7.70 12757.75
NAV (Rs.) Per Unit (as on April 28,2017 : 12.9855) 12.1202 10.2502 - 10.00
ICICI Prudential Fixed Maturity Plan - Series 72 - 368 Days Plan D 7.18 10715.95 8.16 12651.33 - - 8.29 12985.70 17-Jan-14
CRISIL Short Term Bond Fund Index (Benchmark) 8.70 10867.02 9.18 13010.59 - - 9.24 13360.96
1 Year T Bill (Additional Benchmark) 6.63 10661.58 7.75 12509.00 - - 7.73 12766.54
NAV (Rs.) Per Unit (as on April 28,2017 : 12.9857) 12.1181 10.2643 - 10.00
ICICI Prudential Fixed Maturity Plan - Series 72 - 500 Days Plan E 8.11 10808.49 8.42 12740.44 - - 8.53 13066.60 21-Jan-14
CRISIL Short Term Bond Fund Index (Benchmark) 8.70 10867.02 9.18 13010.59 - - 9.22 13340.98
1 Year T Bill (Additional Benchmark) 6.63 10661.58 7.75 12509.00 - - 7.66 12726.46
NAV (Rs.) Per Unit (as on April 28,2017 : 13.0666) 12.0892 10.2560 - 10.00
ICICI Prudential Fixed Maturity Plan - Series 72 - 370 Days Plan G 7.35 10733.39 8.20 12664.30 - - 8.35 12991.80 23-Jan-14
CRISIL Short Term Bond Fund Index (Benchmark) 8.70 10867.02 9.18 13010.59 - - 9.23 13340.18
1 Year T Bill (Additional Benchmark) 6.63 10661.58 7.75 12509.00 - - 7.72 12745.98
NAV (Rs.) Per Unit (as on April 28,2017 : 12.9918) 12.1041 10.2586 - 10.00
ICICI Prudential Fixed Maturity Plan - Series 72 - 823 Days Plan H 8.34 10831.46 9.25 13034.88 - - 9.49 13438.70 24-Jan-14
CRISIL Short Term Bond Fund Index (Benchmark) 8.70 10867.02 9.18 13010.59 - - 9.25 13342.40
1 Year T Bill (Additional Benchmark) 6.63 10661.58 7.75 12509.00 - - 7.74 12750.19
NAV (Rs.) Per Unit (as on April 28,2017 : 13.4387) 12.4071 10.3098 - 10.00
ICICI Prudential Fixed Maturity Plan - Series 72 - 1092 Days Plan F 7.23 10721.20 8.72 12846.80 - - 8.92 13197.90 29-Jan-14
CRISIL Short Term Bond Fund Index (Benchmark) 8.70 10867.02 9.18 13010.59 - - 9.28 13340.37
1 Year T Bill (Additional Benchmark) 6.63 10661.58 7.75 12509.00 - - 7.79 12756.93
NAV (Rs.) Per Unit (as on April 28,2017 : 13.1979) 12.3101 10.2733 - 10.00
ICICI Prudential Fixed Maturity Plan - Series 72 - 483 Days Plan J 7.91 10788.74 8.38 12729.01 - - 8.54 13043.80 31-Jan-14
CRISIL Short Term Bond Fund Index (Benchmark) 8.70 10867.02 9.18 13010.59 - - 9.30 13340.43
1 Year T Bill (Additional Benchmark) 6.63 10661.58 7.75 12509.00 - - 7.79 12754.07
NAV (Rs.) Per Unit (as on April 28,2017 : 13.0438) 12.0902 10.2473 - 10.00
ICICI Prudential Fixed Maturity Plan - Series 72 - 366 Days Plan K 7.29 10726.77 8.40 12734.97 - - 8.53 13022.40 05-Feb-14
CRISIL Short Term Bond Fund Index (Benchmark) 8.70 10867.02 9.18 13010.59 - - 9.29 13319.58
1 Year T Bill (Additional Benchmark) 6.63 10661.58 7.75 12509.00 - - 7.81 12748.26
NAV (Rs.) Per Unit (as on April 28,2017 : 13.0224) 12.1401 10.2257 - 10.00
ICICI Prudential Fixed Maturity Plan - Series 72 - 440 Days Plan L 7.63 10760.85 8.33 12709.11 - - 8.49 13001.80 07-Feb-14
CRISIL Short Term Bond Fund Index (Benchmark) 8.70 10867.02 9.18 13010.59 - - 9.28 13311.61
1 Year T Bill (Additional Benchmark) 6.63 10661.58 7.75 12509.00 - - 7.81 12739.83
NAV (Rs.) Per Unit (as on April 28,2017 : 13.0018) 12.0825 10.2303 - 10.00
ICICI Prudential Fixed Maturity Plan - Series 72 - 785 Days Plan O 7.15 10713.47 8.27 12687.72 - - 8.49 12987.40 12-Feb-14
CRISIL Short Term Bond Fund Index (Benchmark) 8.70 10867.02 9.18 13010.59 - - 9.30 13303.03
1 Year T Bill (Additional Benchmark) 6.63 10661.58 7.75 12509.00 - - 7.82 12733.55
NAV (Rs.) Per Unit (as on April 28,2017 : 12.9874) 12.1225 10.2362 - 10.00
ICICI Prudential Fixed Maturity Plan - Series 72 - 366 Days Plan M 7.23 10720.82 8.28 12693.56 - - 8.47 12979.80 12-Feb-14
CRISIL Short Term Bond Fund Index (Benchmark) 8.70 10867.02 9.18 13010.59 - - 9.30 13303.03
1 Year T Bill (Additional Benchmark) 6.63 10661.58 7.75 12509.00 - - 7.82 12733.55
NAV (Rs.) Per Unit (as on April 28,2017 : 12.9798) 12.1071 10.2255 - 10.00
ICICI Prudential Fixed Maturity Plan - Series 72 - 425 Days Plan N 7.64 10762.27 8.36 12720.25 - - 8.55 13004.80 14-Feb-14
CRISIL Short Term Bond Fund Index (Benchmark) 8.70 10867.02 9.18 13010.59 - - 9.32 13302.42
1 Year T Bill (Additional Benchmark) 6.63 10661.58 7.75 12509.00 - - 7.82 12726.67
NAV (Rs.) Per Unit (as on April 28,2017 : 13.0048) 12.0837 10.2237 - 10.00
ICICI Prudential Fixed Maturity Plan - Series 72 - 367 Days Plan R 7.30 10727.85 8.30 12699.57 - - 8.50 12974.90 18-Feb-14
CRISIL Short Term Bond Fund Index (Benchmark) 8.70 10867.02 9.18 13010.59 - - 9.31 13287.25
1 Year T Bill (Additional Benchmark) 6.63 10661.58 7.75 12509.00 - - 7.82 12715.70
NAV (Rs.) Per Unit (as on April 28,2017 : 12.9749) 12.0946 10.2168 - 10.00
ICICI Prudential Fixed Maturity Plan - Series 72 - 1075 Days Plan Q 7.32 10730.14 8.88 12906.29 - - 9.12 13194.10 24-Feb-14
CRISIL Short Term Bond Fund Index (Benchmark) 8.70 10867.02 9.18 13010.59 - - 9.32 13272.18
1 Year T Bill (Additional Benchmark) 6.63 10661.58 7.75 12509.00 - - 7.79 12689.87
NAV (Rs.) Per Unit (as on April 28,2017 : 13.1941) 12.2963 10.2230 - 10.00
ICICI Prudential Fixed Maturity Plan - Series 72 - 409 Days Plan S 8.72 10869.09 8.63 12815.22 - - 8.83 13077.80 25-Feb-14
CRISIL Short Term Bond Fund Index (Benchmark) 8.70 10867.02 9.18 13010.59 - - 9.33 13269.13
1 Year T Bill (Additional Benchmark) 6.63 10661.58 7.75 12509.00 - - 7.79 12688.76
NAV (Rs.) Per Unit (as on April 28,2017 : 13.0778) 12.0321 10.2049 - 10.00
ICICI Prudential Fixed Maturity Plan - Series 73 - 407 Days Plan C 7.50 10748.15 8.32 12707.84 - - 8.49 12924.00 06-Mar-14
CRISIL Short Term Bond Fund Index (Benchmark) 8.70 10867.02 9.18 13010.59 - - 9.31 13234.37
1 Year T Bill (Additional Benchmark) 6.63 10661.58 7.75 12509.00 - - 7.81 12669.18
NAV (Rs.) Per Unit (as on April 28,2017 : 12.9240) 12.0244 10.1701 - 10.00
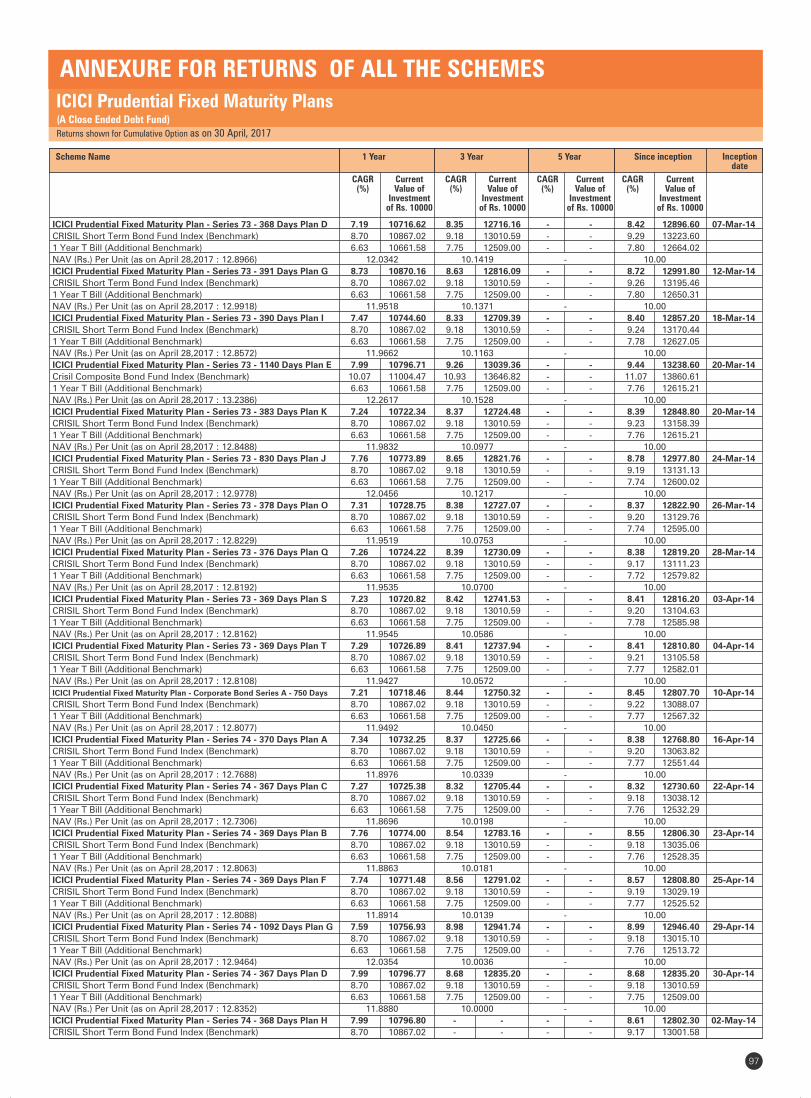
1 Year
CAGR (%)
Current Value of
Investment of Rs. 10000
Scheme Name 3 Year
CAGR (%)
Current Value of
Investment of Rs. 10000
5 Year
CAGR (%)
Current Value of
Investment of Rs. 10000
Since inception
CAGR (%)
Current Value of
Investment of Rs. 10000
Inception date
97
ICICI Prudential Fixed Maturity Plans(A Close Ended Debt Fund)
Returns shown for Cumulative Option as on 30 April, 2017
ANNEXURE FOR RETURNS OF ALL THE SCHEMES
ICICI Prudential Fixed Maturity Plan - Series 73 - 368 Days Plan D 7.19 10716.62 8.35 12716.16 - - 8.42 12896.60 07-Mar-14
CRISIL Short Term Bond Fund Index (Benchmark) 8.70 10867.02 9.18 13010.59 - - 9.29 13223.60
1 Year T Bill (Additional Benchmark) 6.63 10661.58 7.75 12509.00 - - 7.80 12664.02
NAV (Rs.) Per Unit (as on April 28,2017 : 12.8966) 12.0342 10.1419 - 10.00
ICICI Prudential Fixed Maturity Plan - Series 73 - 391 Days Plan G 8.73 10870.16 8.63 12816.09 - - 8.72 12991.80 12-Mar-14
CRISIL Short Term Bond Fund Index (Benchmark) 8.70 10867.02 9.18 13010.59 - - 9.26 13195.46
1 Year T Bill (Additional Benchmark) 6.63 10661.58 7.75 12509.00 - - 7.80 12650.31
NAV (Rs.) Per Unit (as on April 28,2017 : 12.9918) 11.9518 10.1371 - 10.00
ICICI Prudential Fixed Maturity Plan - Series 73 - 390 Days Plan I 7.47 10744.60 8.33 12709.39 - - 8.40 12857.20 18-Mar-14
CRISIL Short Term Bond Fund Index (Benchmark) 8.70 10867.02 9.18 13010.59 - - 9.24 13170.44
1 Year T Bill (Additional Benchmark) 6.63 10661.58 7.75 12509.00 - - 7.78 12627.05
NAV (Rs.) Per Unit (as on April 28,2017 : 12.8572) 11.9662 10.1163 - 10.00
ICICI Prudential Fixed Maturity Plan - Series 73 - 1140 Days Plan E 7.99 10796.71 9.26 13039.36 - - 9.44 13238.60 20-Mar-14
Crisil Composite Bond Fund Index (Benchmark) 10.07 11004.47 10.93 13646.82 - - 11.07 13860.61
1 Year T Bill (Additional Benchmark) 6.63 10661.58 7.75 12509.00 - - 7.76 12615.21
NAV (Rs.) Per Unit (as on April 28,2017 : 13.2386) 12.2617 10.1528 - 10.00
ICICI Prudential Fixed Maturity Plan - Series 73 - 383 Days Plan K 7.24 10722.34 8.37 12724.48 - - 8.39 12848.80 20-Mar-14
CRISIL Short Term Bond Fund Index (Benchmark) 8.70 10867.02 9.18 13010.59 - - 9.23 13158.39
1 Year T Bill (Additional Benchmark) 6.63 10661.58 7.75 12509.00 - - 7.76 12615.21
NAV (Rs.) Per Unit (as on April 28,2017 : 12.8488) 11.9832 10.0977 - 10.00
ICICI Prudential Fixed Maturity Plan - Series 73 - 830 Days Plan J 7.76 10773.89 8.65 12821.76 - - 8.78 12977.80 24-Mar-14
CRISIL Short Term Bond Fund Index (Benchmark) 8.70 10867.02 9.18 13010.59 - - 9.19 13131.13
1 Year T Bill (Additional Benchmark) 6.63 10661.58 7.75 12509.00 - - 7.74 12600.02
NAV (Rs.) Per Unit (as on April 28,2017 : 12.9778) 12.0456 10.1217 - 10.00
ICICI Prudential Fixed Maturity Plan - Series 73 - 378 Days Plan O 7.31 10728.75 8.38 12727.07 - - 8.37 12822.90 26-Mar-14
CRISIL Short Term Bond Fund Index (Benchmark) 8.70 10867.02 9.18 13010.59 - - 9.20 13129.76
1 Year T Bill (Additional Benchmark) 6.63 10661.58 7.75 12509.00 - - 7.74 12595.00
NAV (Rs.) Per Unit (as on April 28,2017 : 12.8229) 11.9519 10.0753 - 10.00
ICICI Prudential Fixed Maturity Plan - Series 73 - 376 Days Plan Q 7.26 10724.22 8.39 12730.09 - - 8.38 12819.20 28-Mar-14
CRISIL Short Term Bond Fund Index (Benchmark) 8.70 10867.02 9.18 13010.59 - - 9.17 13111.23
1 Year T Bill (Additional Benchmark) 6.63 10661.58 7.75 12509.00 - - 7.72 12579.82
NAV (Rs.) Per Unit (as on April 28,2017 : 12.8192) 11.9535 10.0700 - 10.00
ICICI Prudential Fixed Maturity Plan - Series 73 - 369 Days Plan S 7.23 10720.82 8.42 12741.53 - - 8.41 12816.20 03-Apr-14
CRISIL Short Term Bond Fund Index (Benchmark) 8.70 10867.02 9.18 13010.59 - - 9.20 13104.63
1 Year T Bill (Additional Benchmark) 6.63 10661.58 7.75 12509.00 - - 7.78 12585.98
NAV (Rs.) Per Unit (as on April 28,2017 : 12.8162) 11.9545 10.0586 - 10.00
ICICI Prudential Fixed Maturity Plan - Series 73 - 369 Days Plan T 7.29 10726.89 8.41 12737.94 - - 8.41 12810.80 04-Apr-14
CRISIL Short Term Bond Fund Index (Benchmark) 8.70 10867.02 9.18 13010.59 - - 9.21 13105.58
1 Year T Bill (Additional Benchmark) 6.63 10661.58 7.75 12509.00 - - 7.77 12582.01
NAV (Rs.) Per Unit (as on April 28,2017 : 12.8108) 11.9427 10.0572 - 10.00
ICICI Prudential Fixed Maturity Plan - Corporate Bond Series A - 750 Days 7.21 10718.46 8.44 12750.32 - - 8.45 12807.70 10-Apr-14
CRISIL Short Term Bond Fund Index (Benchmark) 8.70 10867.02 9.18 13010.59 - - 9.22 13088.07
1 Year T Bill (Additional Benchmark) 6.63 10661.58 7.75 12509.00 - - 7.77 12567.32
NAV (Rs.) Per Unit (as on April 28,2017 : 12.8077) 11.9492 10.0450 - 10.00
ICICI Prudential Fixed Maturity Plan - Series 74 - 370 Days Plan A 7.34 10732.25 8.37 12725.66 - - 8.38 12768.80 16-Apr-14
CRISIL Short Term Bond Fund Index (Benchmark) 8.70 10867.02 9.18 13010.59 - - 9.20 13063.82
1 Year T Bill (Additional Benchmark) 6.63 10661.58 7.75 12509.00 - - 7.77 12551.44
NAV (Rs.) Per Unit (as on April 28,2017 : 12.7688) 11.8976 10.0339 - 10.00
ICICI Prudential Fixed Maturity Plan - Series 74 - 367 Days Plan C 7.27 10725.38 8.32 12705.44 - - 8.32 12730.60 22-Apr-14
CRISIL Short Term Bond Fund Index (Benchmark) 8.70 10867.02 9.18 13010.59 - - 9.18 13038.12
1 Year T Bill (Additional Benchmark) 6.63 10661.58 7.75 12509.00 - - 7.76 12532.29
NAV (Rs.) Per Unit (as on April 28,2017 : 12.7306) 11.8696 10.0198 - 10.00
ICICI Prudential Fixed Maturity Plan - Series 74 - 369 Days Plan B 7.76 10774.00 8.54 12783.16 - - 8.55 12806.30 23-Apr-14
CRISIL Short Term Bond Fund Index (Benchmark) 8.70 10867.02 9.18 13010.59 - - 9.18 13035.06
1 Year T Bill (Additional Benchmark) 6.63 10661.58 7.75 12509.00 - - 7.76 12528.35
NAV (Rs.) Per Unit (as on April 28,2017 : 12.8063) 11.8863 10.0181 - 10.00
ICICI Prudential Fixed Maturity Plan - Series 74 - 369 Days Plan F 7.74 10771.48 8.56 12791.02 - - 8.57 12808.80 25-Apr-14
CRISIL Short Term Bond Fund Index (Benchmark) 8.70 10867.02 9.18 13010.59 - - 9.19 13029.19
1 Year T Bill (Additional Benchmark) 6.63 10661.58 7.75 12509.00 - - 7.77 12525.52
NAV (Rs.) Per Unit (as on April 28,2017 : 12.8088) 11.8914 10.0139 - 10.00
ICICI Prudential Fixed Maturity Plan - Series 74 - 1092 Days Plan G 7.59 10756.93 8.98 12941.74 - - 8.99 12946.40 29-Apr-14
CRISIL Short Term Bond Fund Index (Benchmark) 8.70 10867.02 9.18 13010.59 - - 9.18 13015.10
1 Year T Bill (Additional Benchmark) 6.63 10661.58 7.75 12509.00 - - 7.76 12513.72
NAV (Rs.) Per Unit (as on April 28,2017 : 12.9464) 12.0354 10.0036 - 10.00
ICICI Prudential Fixed Maturity Plan - Series 74 - 367 Days Plan D 7.99 10796.77 8.68 12835.20 - - 8.68 12835.20 30-Apr-14
CRISIL Short Term Bond Fund Index (Benchmark) 8.70 10867.02 9.18 13010.59 - - 9.18 13010.59
1 Year T Bill (Additional Benchmark) 6.63 10661.58 7.75 12509.00 - - 7.75 12509.00
NAV (Rs.) Per Unit (as on April 28,2017 : 12.8352) 11.8880 10.0000 - 10.00
ICICI Prudential Fixed Maturity Plan - Series 74 - 368 Days Plan H 7.99 10796.80 - - - - 8.61 12802.30 02-May-14
CRISIL Short Term Bond Fund Index (Benchmark) 8.70 10867.02 - - - - 9.17 13001.58

1 Year
CAGR (%)
Current Value of
Investment of Rs. 10000
Scheme Name 3 Year
CAGR (%)
Current Value of
Investment of Rs. 10000
5 Year
CAGR (%)
Current Value of
Investment of Rs. 10000
Since inception
CAGR (%)
Current Value of
Investment of Rs. 10000
Inception date
ICICI Prudential Fixed Maturity Plans(A Close Ended Debt Fund)
Returns shown for Cumulative Option as on 30 April, 2017
ANNEXURE FOR RETURNS OF ALL THE SCHEMES
98
1 Year T Bill (Additional Benchmark) 6.63 10661.58 - - - - 7.75 12503.37
NAV (Rs.) Per Unit (as on April 28,2017 : 12.8023) 11.8575 - - 10.00
ICICI Prudential Fixed Maturity Plan - Series 74 - 780 Days Plan E 7.77 10774.82 - - - - 8.72 12822.90 08-May-14
CRISIL Short Term Bond Fund Index (Benchmark) 8.70 10867.02 - - - - 9.15 12974.20
1 Year T Bill (Additional Benchmark) 6.63 10661.58 - - - - 7.72 12475.86
NAV (Rs.) Per Unit (as on April 28,2017 : 12.8229) 11.9008 - - 10.00
ICICI Prudential Fixed Maturity Plan - Series 74 - 369 Days Plan I 8.21 10818.62 - - - - 8.75 12831.10 09-May-14
CRISIL Short Term Bond Fund Index (Benchmark) 8.70 10867.02 - - - - 9.14 12968.44
1 Year T Bill (Additional Benchmark) 6.63 10661.58 - - - - 7.72 12472.54
NAV (Rs.) Per Unit (as on April 28,2017 : 12.8311) 11.8602 - - 10.00
ICICI Prudential Fixed Maturity Plan - Series 74 - 368 Days Plan J 8.19 10816.33 - - - - 8.67 12782.20 16-May-14
CRISIL Short Term Bond Fund Index (Benchmark) 8.70 10867.02 - - - - 9.11 12935.99
1 Year T Bill (Additional Benchmark) 6.63 10661.58 - - - - 7.72 12456.68
NAV (Rs.) Per Unit (as on April 28,2017 : 12.7822) 11.8175 - - 10.00
ICICI Prudential Fixed Maturity Plan - Series 74 - 369 Days Plan K 8.03 10800.87 - - - - 8.54 12719.10 23-May-14
CRISIL Short Term Bond Fund Index (Benchmark) 8.70 10867.02 - - - - 9.07 12901.80
1 Year T Bill (Additional Benchmark) 6.63 10661.58 - - - - 7.68 12423.98
NAV (Rs.) Per Unit (as on April 28,2017 : 12.7191) 11.7760 - - 10.00
ICICI Prudential Fixed Maturity Plan - Series 74 - 367 Days Plan N 7.92 10789.43 - - - - 8.49 12688.80 27-May-14
CRISIL Short Term Bond Fund Index (Benchmark) 8.70 10867.02 - - - - 9.07 12889.89
1 Year T Bill (Additional Benchmark) 6.63 10661.58 - - - - 7.67 12413.07
NAV (Rs.) Per Unit (as on April 28,2017 : 12.6888) 11.7604 - - 10.00
ICICI Prudential Fixed Maturity Plan - Series 74 - 1092 Days Plan P 7.85 10782.75 - - - - 8.87 12814.00 29-May-14
CRISIL Short Term Bond Fund Index (Benchmark) 8.70 10867.02 - - - - 9.06 12881.10
1 Year T Bill (Additional Benchmark) 6.63 10661.58 - - - - 7.67 12406.53
NAV (Rs.) Per Unit (as on April 28,2017 : 12.8140) 11.8838 - - 10.00
ICICI Prudential Fixed Maturity Plan - Series 74 - 369 Days Plan L 7.96 10794.00 - - - - 8.47 12676.80 29-May-14
CRISIL Short Term Bond Fund Index (Benchmark) 8.70 10867.02 - - - - 9.06 12881.10
1 Year T Bill (Additional Benchmark) 6.63 10661.58 - - - - 7.67 12406.53
NAV (Rs.) Per Unit (as on April 28,2017 : 12.6768) 11.7443 - - 10.00
ICICI Prudential Fixed Maturity Plan - Series 74 - 370 Days Plan Q 8.22 10819.35 - - - - 8.58 12697.70 04-Jun-14
CRISIL Short Term Bond Fund Index (Benchmark) 8.70 10867.02 - - - - 9.03 12850.46
1 Year T Bill (Additional Benchmark) 6.63 10661.58 - - - - 7.64 12380.79
NAV (Rs.) Per Unit (as on April 28,2017 : 12.6977) 11.7361 - - 10.00
ICICI Prudential Fixed Maturity Plan - Series 74 - 368 Days Plan R 8.23 10820.20 - - - - 8.60 12698.70 06-Jun-14
CRISIL Short Term Bond Fund Index (Benchmark) 8.70 10867.02 - - - - 8.99 12832.32
1 Year T Bill (Additional Benchmark) 6.63 10661.58 - - - - 7.62 12370.98
NAV (Rs.) Per Unit (as on April 28,2017 : 12.6987) 11.7361 - - 10.00
ICICI Prudential Fixed Maturity Plan - Series 74 - 369 Days Plan T 8.23 10821.10 - - - - 8.61 12683.20 12-Jun-14
CRISIL Short Term Bond Fund Index (Benchmark) 8.70 10867.02 - - - - 9.01 12820.19
1 Year T Bill (Additional Benchmark) 6.63 10661.58 - - - - 7.63 12358.83
NAV (Rs.) Per Unit (as on April 28,2017 : 12.6832) 11.7208 - - 10.00
ICICI Prudential Fixed Maturity Plan - Series 74 - 370 Days Plan S 7.82 10779.71 - - - - 8.35 12579.60 18-Jun-14
CRISIL Short Term Bond Fund Index (Benchmark) 8.70 10867.02 - - - - 9.04 12813.09
1 Year T Bill (Additional Benchmark) 6.63 10661.58 - - - - 7.65 12351.16
NAV (Rs.) Per Unit (as on April 28,2017 : 12.5796) 11.6697 - - 10.00
ICICI Prudential Fixed Maturity Plan - Series 74 - 370 Days Plan V 8.03 10800.97 - - - - 8.54 12624.60 25-Jun-14
CRISIL Short Term Bond Fund Index (Benchmark) 8.70 10867.02 - - - - 9.07 12800.71
1 Year T Bill (Additional Benchmark) 6.63 10661.58 - - - - 7.66 12336.15
NAV (Rs.) Per Unit (as on April 28,2017 : 12.6246) 11.6884 - - 10.00
ICICI Prudential Fixed Maturity Plan - Series 74 - 9 Years Plan U 9.34 10930.83 - - - - 8.14 12488.80 26-Jun-14
Crisil Composite Bond Fund Index (Benchmark) 10.07 11004.47 - - - - 10.53 13290.20
1 Year T Bill (Additional Benchmark) 6.63 10661.58 - - - - 7.66 12333.47
NAV (Rs.) Per Unit (as on April 28,2017 : 12.4888) 11.4253 - - 10.00
ICICI Prudential Fixed Maturity Plan - Series 74 - 370 Days Plan X 8.11 10808.77 - - - - 8.54 12604.00 02-Jul-14
CRISIL Short Term Bond Fund Index (Benchmark) 8.70 10867.02 - - - - 9.04 12770.79
1 Year T Bill (Additional Benchmark) 6.63 10661.58 - - - - 7.64 12311.49
NAV (Rs.) Per Unit (as on April 28,2017 : 12.6040) 11.6609 - - 10.00
ICICI Prudential Fixed Maturity Plan - Series 74 - 368 Days Plan Y 7.91 10788.40 - - - - 8.43 12564.60 04-Jul-14
CRISIL Short Term Bond Fund Index (Benchmark) 8.70 10867.02 - - - - 9.04 12763.85
1 Year T Bill (Additional Benchmark) 6.63 10661.58 - - - - 7.64 12306.13
NAV (Rs.) Per Unit (as on April 28,2017 : 12.5646) 11.6464 - - 10.00
ICICI Prudential Fixed Maturity Plan - Series 74 - 367 Days Plan Z 7.86 10783.38 - - - - 8.37 12531.80 08-Jul-14
CRISIL Short Term Bond Fund Index (Benchmark) 8.70 10867.02 - - - - 9.05 12755.97
1 Year T Bill (Additional Benchmark) 6.63 10661.58 - - - - 7.65 12298.69
NAV (Rs.) Per Unit (as on April 28,2017 : 12.5318) 11.6214 - - 10.00
ICICI Prudential Fixed Maturity Plan - Series 75 - 1352 Days Plan E 8.22 10819.30 - - - - 9.49 12790.90 11-Aug-14
Crisil Composite Bond Fund Index (Benchmark) 10.07 11004.47 - - - - 10.79 13207.09
1 Year T Bill (Additional Benchmark) 6.63 10661.58 - - - - 7.66 12218.74
NAV (Rs.) Per Unit (as on April 28,2017 : 12.7909) 11.8223 - - 10.00

1 Year
CAGR (%)
Current Value of
Investment of Rs. 10000
Scheme Name 3 Year
CAGR (%)
Current Value of
Investment of Rs. 10000
5 Year
CAGR (%)
Current Value of
Investment of Rs. 10000
Since inception
CAGR (%)
Current Value of
Investment of Rs. 10000
Inception date
ICICI Prudential Fixed Maturity Plans(A Close Ended Debt Fund)
Returns shown for Cumulative Option as on 30 April, 2017
ANNEXURE FOR RETURNS OF ALL THE SCHEMES
99
ICICI Prudential Fixed Maturity Plan - Corporate Bond Series B - 1100 Days 8.77 10874.79 - - - - 10.11 12983.20 13-Aug-14
CRISIL Short Term Bond Fund Index (Benchmark) 8.70 10867.02 - - - - 9.11 12665.90
1 Year T Bill (Additional Benchmark) 6.63 10661.58 - - - - 7.67 12215.58
NAV (Rs.) Per Unit (as on April 28,2017 : 12.9832) 11.9388 - - 10.00
ICICI Prudential Fixed Maturity Plan - Series 75 - 1100 Days Plan F 7.81 10779.07 - - - - 8.89 12554.60 27-Aug-14
CRISIL Short Term Bond Fund Index (Benchmark) 8.70 10867.02 - - - - 9.09 12616.25
1 Year T Bill (Additional Benchmark) 6.63 10661.58 - - - - 7.64 12173.83
NAV (Rs.) Per Unit (as on April 28,2017 : 12.5546) 11.6472 - - 10.00
ICICI Prudential Fixed Maturity Plan - Series 75 - 1100 Days Plan H 7.79 10777.08 - - - - 8.85 12502.60 10-Sep-14
CRISIL Short Term Bond Fund Index (Benchmark) 8.70 10867.02 - - - - 9.08 12572.45
1 Year T Bill (Additional Benchmark) 6.63 10661.58 - - - - 7.64 12138.37
NAV (Rs.) Per Unit (as on April 28,2017 : 12.5026) 11.6011 - - 10.00
ICICI Prudential Fixed Maturity Plan - Series 75 - 1100 Days Plan G 8.99 10896.09 - - - - 10.34 12956.10 10-Sep-14
CRISIL Short Term Bond Fund Index (Benchmark) 8.70 10867.02 - - - - 9.08 12572.45
1 Year T Bill (Additional Benchmark) 6.63 10661.58 - - - - 7.64 12138.37
NAV (Rs.) Per Unit (as on April 28,2017 : 12.9561) 11.8906 - - 10.00
ICICI Prudential Fixed Maturity Plan - Series 75 - 1100 Days Plan I 8.94 10891.11 - - - - 10.32 12905.20 23-Sep-14
CRISIL Short Term Bond Fund Index (Benchmark) 8.70 10867.02 - - - - 9.05 12524.62
1 Year T Bill (Additional Benchmark) 6.63 10661.58 - - - - 7.63 12105.10
NAV (Rs.) Per Unit (as on April 28,2017 : 12.9052) 11.8493 - - 10.00
ICICI Prudential Fixed Maturity Plan - Series 75 - 1100 Days Plan J 7.84 10781.29 - - - - 8.78 12438.80 25-Sep-14
CRISIL Short Term Bond Fund Index (Benchmark) 8.70 10867.02 - - - - 9.05 12518.38
1 Year T Bill (Additional Benchmark) 6.63 10661.58 - - - - 7.63 12099.83
NAV (Rs.) Per Unit (as on April 28,2017 : 12.4388) 11.5374 - - 10.00
ICICI Prudential Fixed Maturity Plan - Series 75 - 1103 Days Plan L 8.78 10875.64 - - - - 10.04 12741.90 17-Oct-14
Crisil Composite Bond Fund Index (Benchmark) 10.07 11004.47 - - - - 10.40 12845.20
1 Year T Bill (Additional Benchmark) 6.63 10661.58 - - - - 7.61 12039.82
NAV (Rs.) Per Unit (as on April 28,2017 : 12.7419) 11.7160 - - 10.00
ICICI Prudential Fixed Maturity Plan - Series 75 - 1100 Days Plan O 8.38 10835.45 - - - - 9.05 12436.60 22-Oct-14
CRISIL Short Term Bond Fund Index (Benchmark) 8.70 10867.02 - - - - 8.95 12409.74
1 Year T Bill (Additional Benchmark) 6.63 10661.58 - - - - 7.56 12015.49
NAV (Rs.) Per Unit (as on April 28,2017 : 12.4366) 11.4777 - - 10.00
ICICI Prudential Fixed Maturity Plan - Series 75 - 1100 Days Plan N 9.02 10899.37 - - - - 9.15 12443.70 30-Oct-14
CRISIL Short Term Bond Fund Index (Benchmark) 8.70 10867.02 - - - - 8.91 12372.97
1 Year T Bill (Additional Benchmark) 6.63 10661.58 - - - - 7.56 11995.04
NAV (Rs.) Per Unit (as on April 28,2017 : 12.4437) 11.4169 - - 10.00
ICICI Prudential Fixed Maturity Plan - Series 75 - 1103 Days Plan P 8.23 10821.12 - - - - 8.64 12262.60 12-Nov-14
Crisil Composite Bond Fund Index (Benchmark) 10.07 11004.47 - - - - 9.87 12607.25
1 Year T Bill (Additional Benchmark) 6.63 10661.58 - - - - 7.53 11955.59
NAV (Rs.) Per Unit (as on April 28,2017 : 12.2626) 11.3321 - - 10.00
ICICI Prudential Fixed Maturity Plan - Series 75 - 1100 Days Plan Q 8.97 10894.24 - - - - 9.93 12620.10 13-Nov-14
CRISIL Short Term Bond Fund Index (Benchmark) 8.70 10867.02 - - - - 8.85 12317.66
1 Year T Bill (Additional Benchmark) 6.63 10661.58 - - - - 7.53 11953.07
NAV (Rs.) Per Unit (as on April 28,2017 : 12.6201) 11.5842 - - 10.00
ICICI Prudential Fixed Maturity Plan - Series 75 - 1100 Days Plan R 8.52 10849.87 - - - - 8.93 12338.80 13-Nov-14
CRISIL Short Term Bond Fund Index (Benchmark) 8.70 10867.02 - - - - 8.85 12317.66
1 Year T Bill (Additional Benchmark) 6.63 10661.58 - - - - 7.53 11953.07
NAV (Rs.) Per Unit (as on April 28,2017 : 12.3388) 11.3723 - - 10.00
ICICI Prudential Fixed Maturity Plan - Series 75 - 1100 Days Plan T 8.47 10844.38 - - - - 8.85 12297.20 20-Nov-14
CRISIL Short Term Bond Fund Index (Benchmark) 8.70 10867.02 - - - - 8.82 12289.84
1 Year T Bill (Additional Benchmark) 6.63 10661.58 - - - - 7.51 11932.22
NAV (Rs.) Per Unit (as on April 28,2017 : 12.2972) 11.3397 - - 10.00
ICICI Prudential Fixed Maturity Plan - Series 75 - 1246 Days Plan U 9.99 10996.03 - - - - 10.26 12662.70 28-Nov-14
Crisil Composite Bond Fund Index (Benchmark) 10.07 11004.47 - - - - 9.74 12516.92
1 Year T Bill (Additional Benchmark) 6.63 10661.58 - - - - 7.49 11906.50
NAV (Rs.) Per Unit (as on April 28,2017 : 12.6627) 11.5157 - - 10.00
ICICI Prudential Fixed Maturity Plan - Series 76 - 1100 Days Plan D 8.13 10810.54 - - - - 8.57 12129.10 23-Dec-14
CRISIL Short Term Bond Fund Index (Benchmark) 8.70 10867.02 - - - - 8.78 12185.32
1 Year T Bill (Additional Benchmark) 6.63 10661.58 - - - - 7.49 11848.92
NAV (Rs.) Per Unit (as on April 28,2017 : 12.1291) 11.2197 - - 10.00
ICICI Prudential Fixed Maturity Plan - Series 76 - 1103 Days Plan F 8.29 10826.91 - - - - 8.35 11996.00 21-Jan-15
Crisil Composite Bond Fund Index (Benchmark) 10.07 11004.47 - - - - 9.12 12189.03
1 Year T Bill (Additional Benchmark) 6.63 10661.58 - - - - 7.35 11746.59
NAV (Rs.) Per Unit (as on April 28,2017 : 11.9960) 11.0798 - - 10.00
ICICI Prudential Fixed Maturity Plan - Series 76 - 1100 Days Plan G 8.26 10824.08 - - - - 8.38 11984.10 28-Jan-15
CRISIL Short Term Bond Fund Index (Benchmark) 8.70 10867.02 - - - - 8.64 12049.12
1 Year T Bill (Additional Benchmark) 6.63 10661.58 - - - - 7.35 11729.06
NAV (Rs.) Per Unit (as on April 28,2017 : 11.9841) 11.0717 - - 10.00
ICICI Prudential Fixed Maturity Plan - Series 76 - 1185 Days Plan H 10.52 11048.61 - - - - 10.63 12533.10 02-Feb-15
Crisil Composite Bond Fund Index (Benchmark) 10.07 11004.47 - - - - 9.05 12137.33

1 Year
CAGR (%)
Current Value of
Investment of Rs. 10000
Scheme Name 3 Year
CAGR (%)
Current Value of
Investment of Rs. 10000
5 Year
CAGR (%)
Current Value of
Investment of Rs. 10000
Since inception
CAGR (%)
Current Value of
Investment of Rs. 10000
Inception date
ICICI Prudential Fixed Maturity Plans(A Close Ended Debt Fund)
Returns shown for Cumulative Option as on 30 April, 2017
ANNEXURE FOR RETURNS OF ALL THE SCHEMES
100
1 Year T Bill (Additional Benchmark) 6.63 10661.58 - - - - 7.35 11718.39
NAV (Rs.) Per Unit (as on April 28,2017 : 12.5331) 11.3436 - - 10.00
ICICI Prudential Fixed Maturity Plan - Series 76 - 1155 Days Plan K 8.29 10826.34 - - - - 8.61 11998.40 13-Feb-15
Crisil Composite Bond Fund Index (Benchmark) 10.07 11004.47 - - - - 9.23 12150.35
1 Year T Bill (Additional Benchmark) 6.63 10661.58 - - - - 7.41 11706.94
NAV (Rs.) Per Unit (as on April 28,2017 : 11.9984) 11.0826 - - 10.00
ICICI Prudential Fixed Maturity Plan - Series 76 - 1142 Days Plan M 8.05 10802.86 - - - - 8.40 11912.10 26-Feb-15
Crisil Composite Bond Fund Index (Benchmark) 10.07 11004.47 - - - - 9.26 12119.29
1 Year T Bill (Additional Benchmark) 6.63 10661.58 - - - - 7.40 11674.32
NAV (Rs.) Per Unit (as on April 28,2017 : 11.9121) 11.0268 - - 10.00
ICICI Prudential Fixed Maturity Plan - Series 76 - 1132 Days Plan P 8.30 10827.30 - - - - 8.54 11909.60 12-Mar-15
Crisil Composite Bond Fund Index (Benchmark) 10.07 11004.47 - - - - 9.30 12086.28
1 Year T Bill (Additional Benchmark) 6.63 10661.58 - - - - 7.38 11639.97
NAV (Rs.) Per Unit (as on April 28,2017 : 11.9096) 10.9996 - - 10.00
ICICI Prudential Fixed Maturity Plan - Series 76 - 1100 Days Plan T 8.38 10835.47 - - - - 8.57 11882.50 24-Mar-15
CRISIL Short Term Bond Fund Index (Benchmark) 8.70 10867.02 - - - - 8.71 11914.80
1 Year T Bill (Additional Benchmark) 6.63 10661.58 - - - - 7.32 11598.68
NAV (Rs.) Per Unit (as on April 28,2017 : 11.8825) 10.9663 - - 10.00
ICICI Prudential Fixed Maturity Plan - Series 76 - 1120 Days Plan U 8.33 10830.17 - - - - 8.42 11844.20 26-Mar-15
Crisil Composite Bond Fund Index (Benchmark) 10.07 11004.47 - - - - 9.45 12081.36
1 Year T Bill (Additional Benchmark) 6.63 10661.58 - - - - 7.33 11595.58
NAV (Rs.) Per Unit (as on April 28,2017 : 11.8442) 10.9363 - - 10.00
ICICI Prudential Fixed Maturity Plan - Series 76 - 1108 Days Plan V 8.40 10837.25 - - - - 8.41 11830.70 30-Mar-15
Crisil Composite Bond Fund Index (Benchmark) 10.07 11004.47 - - - - 9.38 12053.08
1 Year T Bill (Additional Benchmark) 6.63 10661.58 - - - - 7.32 11583.64
NAV (Rs.) Per Unit (as on April 28,2017 : 11.8307) 10.9167 - - 10.00
ICICI Prudential Fixed Maturity Plan - Series 76 - 1127 Days Plan W 8.35 10832.76 - - - - 8.71 11876.60 07-Apr-15
Crisil Composite Bond Fund Index (Benchmark) 10.07 11004.47 - - - - 9.38 12029.80
1 Year T Bill (Additional Benchmark) 6.63 10661.58 - - - - 7.28 11557.92
NAV (Rs.) Per Unit (as on April 28,2017 : 11.8766) 10.9636 - - 10.00
ICICI Prudential Fixed Maturity Plan - Series 76 - 1134 Days Plan Y 8.63 10860.96 - - - - 8.60 11825.20 17-Apr-15
Crisil Composite Bond Fund Index (Benchmark) 10.07 11004.47 - - - - 9.42 12007.43
1 Year T Bill (Additional Benchmark) 6.63 10661.58 - - - - 7.28 11536.41
NAV (Rs.) Per Unit (as on April 28,2017 : 11.8252) 10.8878 - - 10.00
ICICI Prudential Fixed Maturity Plan - Series 76 - 1135 Days Plan Z 8.54 10851.56 - - - - 8.54 11800.10 22-Apr-15
Crisil Composite Bond Fund Index (Benchmark) 10.07 11004.47 - - - - 9.36 11980.00
1 Year T Bill (Additional Benchmark) 6.63 10661.58 - - - - 7.32 11532.24
NAV (Rs.) Per Unit (as on April 28,2017 : 11.8001) 10.8741 - - 10.00
ICICI Prudential Fixed Maturity Plan - Series 77 - 1132 Days Plan A 8.70 10867.90 - - - - 8.84 11825.90 06-May-15
Crisil Composite Bond Fund Index (Benchmark) 10.07 11004.47 - - - - 9.70 12011.78
1 Year T Bill (Additional Benchmark) 6.63 10661.58 - - - - 7.31 11500.88
NAV (Rs.) Per Unit (as on April 28,2017 : 11.8259) 10.8815 - - 10.00
ICICI Prudential Fixed Maturity Plan - Series 77 - 1473 Days Plan C 9.03 10899.94 - - - - 9.18 11874.40 15-May-15
Crisil Composite Bond Fund Index (Benchmark) 10.07 11004.47 - - - - 9.89 12025.96
1 Year T Bill (Additional Benchmark) 6.63 10661.58 - - - - 7.30 11477.96
NAV (Rs.) Per Unit (as on April 28,2017 : 11.8744) 10.8940 - - 10.00
ICICI Prudential Fixed Maturity Plan - Series 77 - 1130 Days Plan D 8.75 10872.04 - - - - 8.82 11786.60 19-May-15
Crisil Composite Bond Fund Index (Benchmark) 10.07 11004.47 - - - - 9.74 11982.29
1 Year T Bill (Additional Benchmark) 6.63 10661.58 - - - - 7.29 11466.70
NAV (Rs.) Per Unit (as on April 28,2017 : 11.7866) 10.8412 - - 10.00
ICICI Prudential Fixed Maturity Plan - Series 77 - 1134 Days Plan H 7.86 10784.24 - - - - 8.12 11588.20 09-Jun-15
Crisil Composite Bond Fund Index (Benchmark) 10.07 11004.47 - - - - 10.03 11977.05
1 Year T Bill (Additional Benchmark) 6.63 10661.58 - - - - 7.19 11400.32
NAV (Rs.) Per Unit (as on April 28,2017 : 11.5882) 10.7455 - - 10.00
ICICI Prudential Fixed Maturity Plan - Series 77 - 1100 Days Plan L 7.76 10774.10 - - - - 7.89 11457.50 14-Jul-15
CRISIL Short Term Bond Fund Index (Benchmark) 8.70 10867.02 - - - - 8.75 11621.48
1 Year T Bill (Additional Benchmark) 6.63 10661.58 - - - - 7.11 11310.21
NAV (Rs.) Per Unit (as on April 28,2017 : 11.4575) 10.6343 - - 10.00
ICICI Prudential Fixed Maturity Plan - Series 77 - 1105 Days Plan N 7.98 10796.11 - - - - 8.07 11484.90 17-Jul-15
Crisil Composite Bond Fund Index (Benchmark) 10.07 11004.47 - - - - 10.13 11877.38
1 Year T Bill (Additional Benchmark) 6.63 10661.58 - - - - 7.11 11303.15
NAV (Rs.) Per Unit (as on April 28,2017 : 11.4849) 10.6380 - - 10.00
ICICI Prudential Fixed Maturity Plan - Series 77 - 1100 Days Plan M 9.73 10970.01 - - - - 9.82 11805.60 21-Jul-15
CRISIL Short Term Bond Fund Index (Benchmark) 8.70 10867.02 - - - - 8.76 11605.85
1 Year T Bill (Additional Benchmark) 6.63 10661.58 - - - - 7.10 11293.40
NAV (Rs.) Per Unit (as on April 28,2017 : 11.8056) 10.7617 - - 10.00
ICICI Prudential Fixed Maturity Plan - Series 77 - 1151 Days Plan S 7.93 10790.92 - - - - 8.00 11360.90 01-Sep-15
Crisil Composite Bond Fund Index (Benchmark) 10.07 11004.47 - - - - 9.90 11694.11
1 Year T Bill (Additional Benchmark) 6.63 10661.58 - - - - 7.07 11198.86
NAV (Rs.) Per Unit (as on April 28,2017 : 11.3609) 10.5282 - - 10.00

1 Year
CAGR (%)
Current Value of
Investment of Rs. 10000
Scheme Name 3 Year
CAGR (%)
Current Value of
Investment of Rs. 10000
5 Year
CAGR (%)
Current Value of
Investment of Rs. 10000
Since inception
CAGR (%)
Current Value of
Investment of Rs. 10000
Inception date
59
ICICI Prudential Fixed Maturity Plans(A Close Ended Debt Fund)
Returns shown for Cumulative Option as on 30 April, 2017
ANNEXURE FOR RETURNS OF ALL THE SCHEMES
101
ICICI Prudential Fixed Maturity Plan - Series 77 - 1144 Days Plan T 7.91 10788.31 - - - - 8.09 11358.90 08-Sep-15
Crisil Composite Bond Fund Index (Benchmark) 10.07 11004.47 - - - - 10.03 11694.89
1 Year T Bill (Additional Benchmark) 6.63 10661.58 - - - - 7.02 11175.03
NAV (Rs.) Per Unit (as on April 28,2017 : 11.3589) 10.5289 - - 10.00
ICICI Prudential Fixed Maturity Plan - Series 77 - 1129 Days Plan W 7.78 10776.26 - - - - 7.92 11291.80 24-Sep-15
Crisil Composite Bond Fund Index (Benchmark) 10.07 11004.47 - - - - 9.99 11638.83
1 Year T Bill (Additional Benchmark) 6.63 10661.58 - - - - 7.02 11143.17
NAV (Rs.) Per Unit (as on April 28,2017 : 11.2918) 10.4784 - - 10.00
ICICI Prudential Fixed Maturity Plan - Series 78 - 1212 Days Plan A 8.36 10833.14 - - - - 8.33 11173.30 09-Dec-15
Crisil Composite Bond Fund Index (Benchmark) 10.07 11004.47 - - - - 10.10 11426.31
1 Year T Bill (Additional Benchmark) 6.63 10661.58 - - - - 6.85 10962.00
NAV (Rs.) Per Unit (as on April 28,2017 : 11.1733) 10.3140 - - 10.00
ICICI Prudential Fixed Maturity Plan - Series 78 - 1190 Days Plan C 8.32 10829.17 - - - - 8.38 11128.70 30-Dec-15
Crisil Composite Bond Fund Index (Benchmark) 10.07 11004.47 - - - - 10.28 11388.22
1 Year T Bill (Additional Benchmark) 6.63 10661.58 - - - - 6.83 10917.50
NAV (Rs.) Per Unit (as on April 28,2017 : 11.1287) 10.2766 - - 10.00
ICICI Prudential Fixed Maturity Plan - Series 78 - 1190 Days Plan E 8.75 10872.27 - - - - 8.99 11156.80 20-Jan-16
Crisil Composite Bond Fund Index (Benchmark) 10.07 11004.47 - - - - 10.46 11348.41
1 Year T Bill (Additional Benchmark) 6.63 10661.58 - - - - 6.86 10880.00
NAV (Rs.) Per Unit (as on April 28,2017 : 11.1568) 10.2617 - - 10.00
ICICI Prudential Fixed Maturity Plan - Series 78 - 1185 Days Plan F 8.73 10870.59 - - - - 8.95 11145.40 22-Jan-16
Crisil Composite Bond Fund Index (Benchmark) 10.07 11004.47 - - - - 10.44 11339.57
1 Year T Bill (Additional Benchmark) 6.63 10661.58 - - - - 6.85 10875.03
NAV (Rs.) Per Unit (as on April 28,2017 : 11.1454) 10.2528 - - 10.00
ICICI Prudential Fixed Maturity Plan - Series 78 - 1170 Days Plan I 8.86 10883.70 - - - - 9.97 11179.30 25-Feb-16
Crisil Composite Bond Fund Index (Benchmark) 10.07 11004.47 - - - - 12.00 11420.71
1 Year T Bill (Additional Benchmark) 6.63 10661.58 - - - - 6.91 10815.13
NAV (Rs.) Per Unit (as on April 28,2017 : 11.1793) 10.2716 - - 10.00
ICICI Prudential Fixed Maturity Plan - Series 78 - 1168 Days Plan J 8.89 10886.72 - - - - 9.66 11139.40 26-Feb-16
Crisil Composite Bond Fund Index (Benchmark) 10.07 11004.47 - - - - 11.85 11399.53
1 Year T Bill (Additional Benchmark) 6.63 10661.58 - - - - 6.89 10811.15
NAV (Rs.) Per Unit (as on April 28,2017 : 11.1394) 10.2321 - - 10.00
ICICI Prudential Fixed Maturity Plan - Series 78 - 1150 Days Plan N 8.82 10879.13 - - - - 9.51 11107.70 02-Mar-16
Crisil Composite Bond Fund Index (Benchmark) 10.07 11004.47 - - - - 11.14 11298.43
1 Year T Bill (Additional Benchmark) 6.63 10661.58 - - - - 6.82 10792.40
NAV (Rs.) Per Unit (as on April 28,2017 : 11.1077) 10.2101 - - 10.00
ICICI Prudential Fixed Maturity Plan - Series 78 - 1127 Days Plan R 9.92 10988.75 - - - - 10.08 11130.50 17-Mar-16
Crisil Composite Bond Fund Index (Benchmark) 10.07 11004.47 - - - - 10.65 11194.08
1 Year T Bill (Additional Benchmark) 6.63 10661.58 - - - - 6.82 10763.28
NAV (Rs.) Per Unit (as on April 28,2017 : 11.1305) 10.1290 - - 10.00
ICICI Prudential Fixed Maturity Plan - Series 78 - 1135 Days Plan W 8.14 10811.86 - - - - 8.57 10960.20 17-Mar-16
Crisil Composite Bond Fund Index (Benchmark) 10.07 11004.47 - - - - 10.65 11194.08
1 Year T Bill (Additional Benchmark) 6.63 10661.58 - - - - 6.82 10763.28
NAV (Rs.) Per Unit (as on April 28,2017 : 10.9602) 10.1372 - - 10.00
ICICI Prudential Fixed Maturity Plan - Series 78 - 1130 Days Plan T 8.85 10882.67 - - - - 9.00 10995.20 22-Mar-16
Crisil Composite Bond Fund Index (Benchmark) 10.07 11004.47 - - - - 10.44 11156.19
1 Year T Bill (Additional Benchmark) 6.63 10661.58 - - - - 6.82 10753.47
NAV (Rs.) Per Unit (as on April 28,2017 : 10.9952) 10.1034 - - 10.00
ICICI Prudential Fixed Maturity Plan - Series 78 - 1115 Days Plan X 8.87 10884.36 - - - - 9.14 10993.20 29-Mar-16
Crisil Composite Bond Fund Index (Benchmark) 10.07 11004.47 - - - - 10.54 11145.83
1 Year T Bill (Additional Benchmark) 6.63 10661.58 - - - - 6.83 10740.72
NAV (Rs.) Per Unit (as on April 28,2017 : 10.9932) 10.1000 - - 10.00
ICICI Prudential Fixed Maturity Plan - Series 78 - 1156 Days Plan U 8.18 10815.18 - - - - 8.30 10899.00 30-Mar-16
Crisil Composite Bond Fund Index (Benchmark) 10.07 11004.47 - - - - 10.48 11135.76
1 Year T Bill (Additional Benchmark) 6.63 10661.58 - - - - 6.81 10736.71
NAV (Rs.) Per Unit (as on April 28,2017 : 10.8990) 10.0775 - - 10.00
ICICI Prudential Fixed Maturity Plan - Series 78 - 1281 Days Plan V 10.07 11003.84 - - - - 10.32 11118.50 30-Mar-16
Crisil Composite Bond Fund Index (Benchmark) 10.07 11004.47 - - - - 10.48 11135.76
1 Year T Bill (Additional Benchmark) 6.63 10661.58 - - - - 6.81 10736.71
NAV (Rs.) Per Unit (as on April 28,2017 : 11.1185) 10.1042 - - 10.00
ICICI Prudential Fixed Maturity Plan - Series 78 - 1102 Days Plan Z 7.98 10795.82 - - - - 7.99 10801.00 27-Apr-16
Crisil Composite Bond Fund Index (Benchmark) 10.07 11004.47 - - - - 10.12 11014.78
1 Year T Bill (Additional Benchmark) 6.63 10661.58 - - - - 6.63 10664.84
NAV (Rs.) Per Unit (as on April 28,2017 : 10.8010) 10.0048 - - 10.00
1. Different plans shall have different expense structure. The performance provided are of plans mentioned above.
2. Past performance may or may not be sustained in future and the same may not necessarily provide the basis for comparison with other investment.
3. Performance for Schemes not having Growth/Cumulative Options have been calculated considering the Dividend Option, post adjustment of the Dividend Factor. Performance of dividend option would be Net of Dividend distribution tax, if any

59
ICICI Prudential Fixed Maturity Plans(A Close Ended Debt Fund)
Returns shown for Cumulative Option
ANNEXURE FOR RETURNS OF ALL THE SCHEMES
102
Returns shown for Cumulative Option as on 30 April, 2017
4. Load is not considered for computation of returns.
5. In case, the start/end date of the concerned period is a nonbusiness date (NBD), the NAV of the previous date is considered for computation of returns. The NAV per unit shown in the table is as on the start date of the said period.
6. Since respective schemes/ options have not completed relevant period (1yr, 3yr or 5yr) after allotment or units were not available throughout the respective period, no returns are available.^ Inception date shown is the date from which units under the plans are available throughout.
7. Please Refer page no. 112 for Fund Manager details.

103
ICICI Prudential Interval Funds(A Debt Oriented Interval Fund)
Returns shown for Cumulative Option as on 30 April, 2017
ANNEXURE FOR RETURNS OF ALL THE SCHEMES
1 Year
CAGR (%)
Current Value of
Investment of Rs. 10000
Scheme Name 3 Year
CAGR (%)
Current Value of
Investment of Rs. 10000
5 Year
CAGR (%)
Current Value of
Investment of Rs. 10000
Since inception
CAGR (%)
Current Value of
Investment of Rs. 10000
Inception date
ICICI Prudential Interval Fund - Annual Interval Plan II 11.27 11123.91 9.53 13137.96 9.27 15572.59 8.91 22623.70 05-Oct-07
Crisil Composite Bond Fund Index (Benchmark) 10.07 11004.47 10.93 13646.82 9.28 15582.87 7.95 20798.52
1 Year T Bill (Additional Benchmark) 6.63 10661.58 7.75 12509.00 7.41 14292.58 6.45 18185.08
NAV (Rs.) Per Unit (as on April 28,2017 : 22.6237) 20.3379 17.2201 14.5279 10.00
ICICI Prudential Interval Fund - Quarterly Interval Plan II 7.07 10705.37 7.68 12482.63 8.35 14930.02 8.03 19456.80 15-Sep-08
Crisil Liquid Fund Index (Benchmark) 7.06 10704.48 7.98 12589.19 8.32 14906.55 7.62 18841.94
1 Year T Bill (Additional Benchmark) 6.63 10661.58 7.75 12509.00 7.41 14292.58 6.64 17406.59
NAV (Rs.) Per Unit (as on April 28,2017 : 19.4568) 18.1748 15.5871 13.0320 10.00
ICICI Prudential Interval Fund - Annual Interval Plan IV 6.15 10613.10 7.89 12554.47 8.58 15088.48 8.32 19730.60 27-Oct-08
Crisil Composite Bond Fund Index (Benchmark) 10.07 11004.47 10.93 13646.82 9.28 15582.87 8.49 20006.74
1 Year T Bill (Additional Benchmark) 6.63 10661.58 7.75 12509.00 7.41 14292.58 6.45 17024.30
NAV (Rs.) Per Unit (as on April 28,2017 : 19.7306) 18.5908 15.7160 13.0766 10.00
ICICI Prudential Interval Fund IV - Quarterly Interval Plan B 7.16 10714.31 7.67 12479.49 8.18 14816.15 8.32 17641.00 25-Mar-10
Crisil Liquid Fund Index (Benchmark) 7.06 10704.48 7.98 12589.19 8.32 14906.55 8.04 17311.76
1 Year T Bill (Additional Benchmark) 6.63 10661.58 7.75 12509.00 7.41 14292.58 6.82 15973.83
NAV (Rs.) Per Unit (as on April 28,2017 : 17.6410) 16.4649 14.1360 11.9066 10.00
ICICI Prudential Interval Fund II - Quarterly Interval Plan F 6.46 10644.22 7.47 12408.60 7.99 14684.90 8.12 17395.00 29-Mar-10
Crisil Liquid Fund Index (Benchmark) 7.06 10704.48 7.98 12589.19 8.32 14906.55 8.04 17303.99
1 Year T Bill (Additional Benchmark) 6.63 10661.58 7.75 12509.00 7.41 14292.58 6.83 15969.24
NAV (Rs.) Per Unit (as on April 28,2017 : 17.3950) 16.3422 14.0185 11.8455 10.00
ICICI Prudential Interval Fund - Quarterly Interval Plan III 6.09 10607.61 7.51 12424.38 8.19 14818.42 8.29 17178.70 15-Jul-10
Crisil Liquid Fund Index (Benchmark) 7.06 10704.48 7.98 12589.19 8.32 14906.55 8.21 17091.62
1 Year T Bill (Additional Benchmark) 6.63 10661.58 7.75 12509.00 7.41 14292.58 7.01 15848.03
NAV (Rs.) Per Unit (as on April 28,2017 : 17.1787) 16.1947 13.8266 11.5928 10.00
ICICI Prudential Interval Fund - Quarterly Interval Plan I 6.24 10622.38 7.32 12357.10 8.22 14840.51 8.42 17195.40 16-Aug-10
Crisil Liquid Fund Index (Benchmark) 7.06 10704.48 7.98 12589.19 8.32 14906.55 8.25 17011.68
1 Year T Bill (Additional Benchmark) 6.63 10661.58 7.75 12509.00 7.41 14292.58 7.13 15865.08
NAV (Rs.) Per Unit (as on April 28,2017 : 17.1954) 16.1879 13.9154 11.5868 10.00
ICICI Prudential Interval Fund - Annual Interval Plan I 7.38 10735.54 8.28 12693.14 8.88 15300.02 8.74 17527.70 17-Aug-10
Crisil Composite Bond Fund Index (Benchmark) 10.07 11004.47 10.93 13646.82 9.28 15582.87 8.67 17459.69
1 Year T Bill (Additional Benchmark) 6.63 10661.58 7.75 12509.00 7.41 14292.58 7.13 15864.29
NAV (Rs.) Per Unit (as on April 28,2017 : 17.5277) 16.3268 13.8088 11.4560 10.00
ICICI Prudential Interval Fund - Annual Interval Plan III 6.58 10656.60 8.26 12684.25 8.57 15083.15 8.59 17142.00 15-Oct-10
Crisil Composite Bond Fund Index (Benchmark) 10.07 11004.47 10.93 13646.82 9.28 15582.87 8.77 17330.68
1 Year T Bill (Additional Benchmark) 6.63 10661.58 7.75 12509.00 7.41 14292.58 7.20 15760.97
NAV (Rs.) Per Unit (as on April 28,2017 : 17.1420) 16.0858 13.5144 11.3650 10.00
ICICI Prudential Interval Fund II - Quarterly Interval Plan - B 6.91 10689.45 7.52 12427.51 - - 8.22 13925.90 18-Feb-13
Crisil Liquid Fund Index (Benchmark) 7.06 10704.48 7.98 12589.19 - - 8.36 14003.41
1 Year T Bill (Additional Benchmark) 6.63 10661.58 7.75 12509.00 - - 7.28 13423.88
NAV (Rs.) Per Unit (as on April 28,2017 : 13.9259) 13.0277 11.2057 - 10.00
ICICI Prudential Interval Fund - Series VI - Annual Interval Plan - C 7.00 10697.59 8.20 12663.38 - - 8.53 14034.70 08-Mar-13
CRISIL Short Term Bond Fund Index (Benchmark) 8.70 10867.02 9.18 13010.59 - - 9.09 14341.30
1 Year T Bill (Additional Benchmark) 6.63 10661.58 7.75 12509.00 - - 7.29 13384.97
NAV (Rs.) Per Unit (as on April 28,2017 : 14.0347) 13.1195 11.0829 - 10.00
ICICI Prudential Interval Fund - Series VI - Annual Interval Plan - D 7.46 10743.44 8.25 12681.38 - - 8.45 13971.20 15-Mar-13
CRISIL Short Term Bond Fund Index (Benchmark) 8.70 10867.02 9.18 13010.59 - - 9.07 14304.67
1 Year T Bill (Additional Benchmark) 6.63 10661.58 7.75 12509.00 - - 7.26 13350.46
NAV (Rs.) Per Unit (as on April 28,2017 : 13.9712) 13.0044 11.0171 - 10.00
ICICI Prudential Interval Fund II - Quarterly Interval Plan - A 6.71 10668.90 7.61 12458.75 - - 8.10 13366.00 07-Aug-13
Crisil Liquid Fund Index (Benchmark) 7.06 10704.48 7.98 12589.19 - - 8.44 13526.59
1 Year T Bill (Additional Benchmark) 6.63 10661.58 7.75 12509.00 - - 7.84 13246.27
NAV (Rs.) Per Unit (as on April 28,2017 : 13.3660) 12.5280 10.7282 - 10.00
ICICI Prudential Interval Fund - Monthly Interval Plan I 6.35 10633.32 7.38 12379.12 - - 7.83 13200.10 22-Aug-13
Crisil Liquid Fund Index (Benchmark) 7.06 10704.48 7.98 12589.19 - - 8.45 13484.42
1 Year T Bill (Additional Benchmark) 6.63 10661.58 7.75 12509.00 - - 7.87 13220.26
NAV (Rs.) Per Unit (as on April 28,2017 : 13.2001) 12.4139 10.6632 - 10.00
ICICI Prudential Interval Fund V - Monthly Interval Plan A 7.12 10710.30 8.64 12819.43 - - 8.78 13634.10 22-Aug-13
Crisil Liquid Fund Index (Benchmark) 7.06 10704.48 7.98 12589.19 - - 8.45 13484.42
1 Year T Bill (Additional Benchmark) 6.63 10661.58 7.75 12509.00 - - 7.87 13220.26
NAV (Rs.) Per Unit (as on April 28,2017 : 13.6341) 12.7299 10.6355 - 10.00
ICICI Prudential Interval Fund II - Quarterly Interval Plan - C 9.02 10899.02 8.91 12915.97 - - 9.10 13740.40 04-Sep-13
Crisil Liquid Fund Index (Benchmark) 7.06 10704.48 7.98 12589.19 - - 8.39 13419.05
1 Year T Bill (Additional Benchmark) 6.63 10661.58 7.75 12509.00 - - 7.84 13169.34
NAV (Rs.) Per Unit (as on April 28,2017 : 13.7404) 12.6070 10.6383 - 10.00
ICICI Prudential Interval Fund II - Quarterly Interval Plan - D 6.17 10614.99 7.29 12348.32 - - 7.80 13119.60 16-Sep-13
Crisil Liquid Fund Index (Benchmark) 7.06 10704.48 7.98 12589.19 - - 8.34 13359.54
1 Year T Bill (Additional Benchmark) 6.63 10661.58 7.75 12509.00 - - 7.83 13132.14
NAV (Rs.) Per Unit (as on April 28,2017 : 13.1196) 12.3595 10.6246 - 10.00
ICICI Prudential Interval Fund - Series VII - Annual Interval Plan - C 7.35 10733.14 8.48 12761.33 - - 8.65 13022.30 21-Feb-14
CRISIL Short Term Bond Fund Index (Benchmark) 8.70 10867.02 9.18 13010.59 - - 9.32 13279.44

ICICI Prudential Interval Funds(A Debt Oriented Interval Fund)
Returns shown for Cumulative Option as on 30 April, 2017
ANNEXURE FOR RETURNS OF ALL THE SCHEMES
104
1 Year
CAGR (%)
Current Value of
Investment of Rs. 10000
Scheme Name 3 Year
CAGR (%)
Current Value of
Investment of Rs. 10000
5 Year
CAGR (%)
Current Value of
Investment of Rs. 10000
Since inception
CAGR (%)
Current Value of
Investment of Rs. 10000
Inception date
1 Year T Bill (Additional Benchmark) 6.63 10661.58 7.75 12509.00 - - 7.78 12694.96
NAV (Rs.) Per Unit (as on April 28,2017 : 13.0223) 12.1328 10.2045 - 10.00
1. Different plans shall have different expense structure. The performance provided are of plans mentioned above.
2. Past performance may or may not be sustained in future and the same may not necessarily provide the basis for comparison with other investment.
3. Performance for Schemes not having Growth/Cumulative Options have been calculated considering the Dividend Option, post adjustment of the Dividend Factor. Performance of dividend option would be Net of Dividend distribution tax, if any
4. Load is not considered for computation of returns.
5. In case, the start/end date of the concerned period is a nonbusiness date (NBD), the NAV of the previous date is considered for computation of returns. The NAV per unit shown in the table is as on the start date of the said period.
6. Since respective schemes/ options have not completed relevant period (1yr, 3yr or 5yr) after allotment or units were not available throughout the respective period, no returns are available.^ Inception date shown is the date from which units under the plans are available throughout.
7. Please Refer page no. 112 for Fund Manager details.
ICICI Prudential Interval Fund VI - Annual Interval Plan A has been wound-up with effect from March 16, 2017 on account of not meeting the requirement of minimum number of investors.

105
ICICI Prudential Multiple Yield Funds(A Close ended Income Fund)
Returns shown for Cumulative Option as on 30 April, 2017
ANNEXURE FOR RETURNS OF ALL THE SCHEMES
1 Year
CAGR (%)
Current Value of
Investment of Rs. 10000
Scheme Name 3 Year
CAGR (%)
Current Value of
Investment of Rs. 10000
5 Year
CAGR (%)
Current Value of
Investment of Rs. 10000
Since inception
CAGR (%)
Current Value of
Investment of Rs. 10000
Inception date
ICICI Prudential Multiple Yield Fund - Series 3 - Plan C 10.29 11026.21 9.80 13235.15 - - 9.81 14459.00 21-May-13
Crisil MIP Blended Index (Benchmark) 11.42 11138.53 11.17 13736.77 - - 8.92 13999.85
1 Year T Bill (Additional Benchmark) 6.63 10661.58 7.75 12509.00 - - 7.12 13114.09
NAV (Rs.) Per Unit (as on April 28,2017 : 14.4590) 13.1133 10.9247 - 10.00
ICICI Prudential Multiple Yield Fund - Series 3 - Plan D 10.89 11085.43 10.25 13399.14 - - 9.72 14388.00 27-May-13
Crisil MIP Blended Index (Benchmark) 11.42 11138.53 11.17 13736.77 - - 8.94 13990.59
1 Year T Bill (Additional Benchmark) 6.63 10661.58 7.75 12509.00 - - 7.12 13099.61
NAV (Rs.) Per Unit (as on April 28,2017 : 14.3880) 12.9792 10.7380 - 10.00
ICICI Prudential Multiple Yield Fund - Series 4 - 1825 Days Plan A 11.35 11131.58 11.57 13882.61 - - 11.66 15373.60 05-Jun-13
Crisil MIP Blended Index (Benchmark) 11.42 11138.53 11.17 13736.77 - - 9.14 14063.89
1 Year T Bill (Additional Benchmark) 6.63 10661.58 7.75 12509.00 - - 7.15 13088.06
NAV (Rs.) Per Unit (as on April 28,2017 : 15.3736) 13.8108 11.0740 - 10.00
ICICI Prudential Multiple Yield Fund - Series 4 - 1825 Days Plan B 11.40 11136.85 11.65 13914.81 - - 12.01 15426.10 03-Jul-13
Crisil MIP Blended Index (Benchmark) 11.42 11138.53 11.17 13736.77 - - 9.86 14323.19
1 Year T Bill (Additional Benchmark) 6.63 10661.58 7.75 12509.00 - - 7.20 13044.66
NAV (Rs.) Per Unit (as on April 28,2017 : 15.4261) 13.8514 11.0861 - 10.00
ICICI Prudential Multiple Yield Fund - Series 4 - 1825 Days Plan D 11.43 11139.72 11.40 13821.54 - - 11.98 15403.00 05-Jul-13
Crisil MIP Blended Index (Benchmark) 11.42 11138.53 11.17 13736.77 - - 9.75 14260.27
1 Year T Bill (Additional Benchmark) 6.63 10661.58 7.75 12509.00 - - 7.20 13036.72
NAV (Rs.) Per Unit (as on April 28,2017 : 15.4030) 13.8271 11.1442 - 10.00
ICICI Prudential Multiple Yield Fund - Series 5 - 1825 Days - Plan C 11.04 11101.22 11.06 13693.70 - - 11.80 14460.00 07-Jan-14
Crisil MIP Blended Index (Benchmark) 11.42 11138.53 11.17 13736.77 - - 11.41 14295.40
1 Year T Bill (Additional Benchmark) 6.63 10661.58 7.75 12509.00 - - 7.74 12797.00
NAV (Rs.) Per Unit (as on April 28,2017 : 14.4600) 13.0256 10.5596 - 10.00
ICICI Prudential Multiple Yield Fund - Series 6 - 1825 Days - Plan C 10.63 11060.34 11.12 13718.26 - - 11.20 13839.80 07-Apr-14
Crisil MIP Blended Index (Benchmark) 11.42 11138.53 11.17 13736.77 - - 11.48 13944.68
1 Year T Bill (Additional Benchmark) 6.63 10661.58 7.75 12509.00 - - 7.76 12569.00
NAV (Rs.) Per Unit (as on April 28,2017 : 13.8398) 12.5130 10.0886 - 10.00
ICICI Prudential Multiple Yield Fund - Series 6 - 1100 Days - Plan E 6.86 10684.10 9.05 12964.02 - - 9.06 12970.50 29-Apr-14
Crisil MIP Blended Index (Benchmark) 11.42 11138.53 11.17 13736.77 - - 11.17 13738.39
1 Year T Bill (Additional Benchmark) 6.63 10661.58 7.75 12509.00 - - 7.76 12513.72
NAV (Rs.) Per Unit (as on April 28,2017 : 12.9705) 12.1400 10.0050 - 10.00
ICICI Prudential Multiple Yield Fund - Series 6 - 1825 Days - Plan D 9.83 10979.73 - - - - 10.08 13305.90 08-May-14
Crisil MIP Blended Index (Benchmark) 11.42 11138.53 - - - - 11.14 13691.21
1 Year T Bill (Additional Benchmark) 6.63 10661.58 - - - - 7.72 12475.86
NAV (Rs.) Per Unit (as on April 28,2017 : 13.3059) 12.1186 - - 10.00
ICICI Prudential Multiple Yield Fund - Series 6 - 1100 Days - Plan F 8.58 10855.92 - - - - 8.79 12787.30 29-May-14
Crisil MIP Blended Index (Benchmark) 11.42 11138.53 - - - - 10.48 13375.78
1 Year T Bill (Additional Benchmark) 6.63 10661.58 - - - - 7.67 12406.53
NAV (Rs.) Per Unit (as on April 28,2017 : 12.7873) 11.7791 - - 10.00
ICICI Prudential Multiple Yield Fund - Series 7 - 1100 Days - Plan A 7.02 10700.20 - - - - 7.65 12332.20 25-Jun-14
Crisil MIP Blended Index (Benchmark) 11.42 11138.53 - - - - 10.21 13186.11
1 Year T Bill (Additional Benchmark) 6.63 10661.58 - - - - 7.66 12336.15
NAV (Rs.) Per Unit (as on April 28,2017 : 12.3322) 11.5252 - - 10.00
ICICI Prudential Multiple Yield Fund - Series 7 - 1825 Days - Plan B 8.49 10846.44 - - - - 8.81 12629.70 24-Jul-14
Crisil MIP Blended Index (Benchmark) 11.42 11138.53 - - - - 10.02 13020.99
1 Year T Bill (Additional Benchmark) 6.63 10661.58 - - - - 7.66 12262.56
NAV (Rs.) Per Unit (as on April 28,2017 : 12.6297) 11.6441 - - 10.00
ICICI Prudential Multiple Yield Fund - Series 7 - 1825 Days - Plan C 7.98 10795.74 - - - - 7.85 12213.00 05-Sep-14
Crisil MIP Blended Index (Benchmark) 11.42 11138.53 - - - - 10.04 12882.19
1 Year T Bill (Additional Benchmark) 6.63 10661.58 - - - - 7.63 12148.30
NAV (Rs.) Per Unit (as on April 28,2017 : 12.2130) 11.3128 - - 10.00
ICICI Prudential Multiple Yield Fund - Series 7 - 1338 Days - Plan D 6.98 10695.92 - - - - 7.23 11972.80 30-Sep-14
Crisil MIP Blended Index (Benchmark) 11.42 11138.53 - - - - 10.11 12817.75
1 Year T Bill (Additional Benchmark) 6.63 10661.58 - - - - 7.62 12085.03
NAV (Rs.) Per Unit (as on April 28,2017 : 11.9728) 11.1938 - - 10.00
ICICI Prudential Multiple Yield Fund - Series 7 - 1100 Days - Plan F 7.33 10731.02 - - - - 7.26 11960.90 09-Oct-14
Crisil MIP Blended Index (Benchmark) 11.42 11138.53 - - - - 10.06 12773.97
1 Year T Bill (Additional Benchmark) 6.63 10661.58 - - - - 7.62 12061.12
NAV (Rs.) Per Unit (as on April 28,2017 : 11.9609) 11.1461 - - 10.00
ICICI Prudential Multiple Yield Fund - Series 7 - 1825 Days - Plan E 8.35 10832.42 - - - - 8.42 12292.30 09-Oct-14
Crisil MIP Blended Index (Benchmark) 11.42 11138.53 - - - - 10.06 12773.97
1 Year T Bill (Additional Benchmark) 6.63 10661.58 - - - - 7.62 12061.12
NAV (Rs.) Per Unit (as on April 28,2017 : 12.2923) 11.3477 - - 10.00
ICICI Prudential Multiple Yield Fund - Series 8 - 1824 Days - Plan A 7.09 10706.49 - - - - 6.72 11740.10 10-Nov-14
Crisil MIP Blended Index (Benchmark) 11.42 11138.53 - - - - 9.22 12429.17
1 Year T Bill (Additional Benchmark) 6.63 10661.58 - - - - 7.52 11958.52
NAV (Rs.) Per Unit (as on April 28,2017 : 11.7401) 10.9654 - - 10.00
ICICI Prudential Multiple Yield Fund - Series 8 - 1103 Days - Plan C 6.09 10607.28 - - - - 5.99 11508.90 28-Nov-14
Crisil MIP Blended Index (Benchmark) 11.42 11138.53 - - - - 8.90 12289.01

106
ICICI Prudential Multiple Yield Funds(A Close ended Income Fund)
Returns shown for Cumulative Option as on 30 April, 2017
ANNEXURE FOR RETURNS OF ALL THE SCHEMES
1 Year
CAGR (%)
Current Value of
Investment of Rs. 10000
Scheme Name 3 Year
CAGR (%)
Current Value of
Investment of Rs. 10000
5 Year
CAGR (%)
Current Value of
Investment of Rs. 10000
Since inception
CAGR (%)
Current Value of
Investment of Rs. 10000
Inception date
1 Year T Bill (Additional Benchmark) 6.63 10661.58 - - - - 7.49 11906.50
NAV (Rs.) Per Unit (as on April 28,2017 : 11.5089) 10.8500 - - 10.00
ICICI Prudential Multiple Yield Fund - Series 8 - 1822 Days - Plan D 8.36 10833.78 - - - - 7.83 11951.50 17-Dec-14
Crisil MIP Blended Index (Benchmark) 11.42 11138.53 - - - - 9.36 12355.96
1 Year T Bill (Additional Benchmark) 6.63 10661.58 - - - - 7.49 11861.62
NAV (Rs.) Per Unit (as on April 28,2017 : 11.9515) 11.0317 - - 10.00
ICICI Prudential Multiple Yield Fund - Series 8 - 1101 Days - Plan E 7.80 10777.44 - - - - 7.05 11736.20 22-Dec-14
Crisil MIP Blended Index (Benchmark) 11.42 11138.53 - - - - 9.11 12273.47
1 Year T Bill (Additional Benchmark) 6.63 10661.58 - - - - 7.49 11850.33
NAV (Rs.) Per Unit (as on April 28,2017 : 11.7362) 10.8896 - - 10.00
ICICI Prudential Multiple Yield Fund - Series 8 - 1103 Days - Plan F 6.58 10656.11 - - - - 5.59 11274.70 13-Feb-15
Crisil MIP Blended Index (Benchmark) 11.42 11138.53 - - - - 8.35 11934.12
1 Year T Bill (Additional Benchmark) 6.63 10661.58 - - - - 7.41 11706.94
NAV (Rs.) Per Unit (as on April 28,2017 : 11.2747) 10.5805 - - 10.00
ICICI Prudential Multiple Yield Fund - Series 9 - 1140 Days - Plan A 6.53 10650.69 - - - - 1.48 10305.50 09-Apr-15
Crisil MIP Blended Index (Benchmark) 11.42 11138.53 - - - - 8.53 11831.27
1 Year T Bill (Additional Benchmark) 6.63 10661.58 - - - - 7.28 11553.31
NAV (Rs.) Per Unit (as on April 28,2017 : 10.3055) 9.6759 - - 10.00
ICICI Prudential Multiple Yield Fund - Series 10 - 1775 Days - Plan A 10.17 11013.99 - - - - 8.99 11270.40 08-Dec-15
CRISIL Composite Bond Fund Index (80%) + Nifty 50 Index (20%) (Benchmark) 11.86 11182.71 - - - - 11.15 11581.39
1 Year T Bill (Additional Benchmark) 6.63 10661.58 - - - - 6.83 10961.09
NAV (Rs.) Per Unit (as on April 28,2017 : 11.2704) 10.2328 - - 10.00
ICICI Prudential Multiple Yield Fund - Series 10 - 1825 Days - Plan B 10.11 11007.99 - - - - 7.82 11020.10 13-Jan-16
CRISIL Composite Bond Fund Index (80%) + Nifty 50 Index (20%) (Benchmark) 11.86 11182.71 - - - - 11.89 11560.59
1 Year T Bill (Additional Benchmark) 6.63 10661.58 - - - - 6.88 10896.55
NAV (Rs.) Per Unit (as on April 28,2017 : 11.0201) 10.0110 - - 10.00
1. Different plans shall have different expense structure. The performance provided are of plans mentioned above.
2. Past performance may or may not be sustained in future and the same may not necessarily provide the basis for comparison with other investment.
3. Performance for Schemes not having Growth/Cumulative Options have been calculated considering the Dividend Option, post adjustment of the Dividend Factor. Performance of dividend option would be Net of Dividend distribution tax, if any
4. Load is not considered for computation of returns.
5. In case, the start/end date of the concerned period is a nonbusiness date (NBD), the NAV of the previous date is considered for computation of returns. The NAV per unit shown in the table is as on the start date of the said period.
6. Since respective schemes/ options have not completed relevant period (1yr, 3yr or 5yr) after allotment or units were not available throughout the respective period, no returns are available.^ Inception date shown is the date from which units under the plans are available throughout.
7. Please Refer page no. 112 for Fund Manager details.

107
ICICI Prudential Capital Protection Oriented Funds(A Close ended Capital Protection Oriented Fund)
Returns shown for Cumulative Option as on 30 April, 2017
ANNEXURE FOR RETURNS OF ALL THE SCHEMES
1 Year
CAGR (%)
Current Value of
Investment of Rs. 10000
Scheme Name 3 Year
CAGR (%)
Current Value of
Investment of Rs. 10000
5 Year
CAGR (%)
Current Value of
Investment of Rs. 10000
Since inception
CAGR (%)
Current Value of
Investment of Rs. 10000
Inception date
ICICI Prudential Capital Protection Oriented Fund III -
Plan B - 60 Months 11.39 11135.65 11.29 13778.26 - - 10.98 15801.60 07-Dec-12
Crisil MIP Blended Index (Benchmark) 11.42 11138.53 11.17 13736.77 - - 9.68 15005.56
1 Year T Bill (Additional Benchmark) 6.63 10661.58 7.75 12509.00 - - 7.34 13648.78
NAV (Rs.) Per Unit (as on April 28,2017 : 15.8016) 14.1901 11.4685 - 10.00
ICICI Prudential Capital Protection Oriented Fund III -
Plan E - 60 Months 10.28 11024.87 10.95 13653.74 - - 11.07 15585.20 05-Feb-13
Crisil MIP Blended Index (Benchmark) 11.42 11138.53 11.17 13736.77 - - 9.67 14773.45
1 Year T Bill (Additional Benchmark) 6.63 10661.58 7.75 12509.00 - - 7.27 13453.39
NAV (Rs.) Per Unit (as on April 28,2017 : 15.5852) 14.1364 11.4146 - 10.00
ICICI Prudential Capital Protection Oriented Fund III -
Plan G - 60 Months 11.07 11104.19 11.06 13695.85 - - 11.11 15474.80 07-Mar-13
Crisil MIP Blended Index (Benchmark) 11.42 11138.53 11.17 13736.77 - - 9.79 14729.16
1 Year T Bill (Additional Benchmark) 6.63 10661.58 7.75 12509.00 - - 7.28 13383.96
NAV (Rs.) Per Unit (as on April 28,2017 : 15.4748) 13.9360 11.2989 - 10.00
ICICI Prudential Capital Protection Oriented Fund III -
Plan H - 60 Months 10.00 10996.73 10.96 13657.52 - - 11.17 15364.30 09-Apr-13
Crisil MIP Blended Index (Benchmark) 11.42 11138.53 11.17 13736.77 - - 10.08 14759.90
1 Year T Bill (Additional Benchmark) 6.63 10661.58 7.75 12509.00 - - 7.23 13272.10
NAV (Rs.) Per Unit (as on April 28,2017 : 15.3643) 13.9717 11.2497 - 10.00
ICICI Prudential Capital Protection Oriented Fund IV -
Plan A - 60 Months 10.25 11022.19 11.67 13919.40 - - 12.82 15678.40 06-Aug-13
Crisil MIP Blended Index (Benchmark) 11.42 11138.53 11.17 13736.77 - - 11.21 14862.98
1 Year T Bill (Additional Benchmark) 6.63 10661.58 7.75 12509.00 - - 7.84 13249.51
NAV (Rs.) Per Unit (as on April 28,2017 : 15.6784) 14.2244 11.2637 - 10.00
ICICI Prudential Capital Protection Oriented Fund IV -
Plan C - 60 Months 10.09 11006.43 11.11 13713.40 - - 12.45 15334.60 06-Sep-13
Crisil MIP Blended Index (Benchmark) 11.42 11138.53 11.17 13736.77 - - 11.42 14828.90
1 Year T Bill (Additional Benchmark) 6.63 10661.58 7.75 12509.00 - - 7.85 13171.01
NAV (Rs.) Per Unit (as on April 28,2017 : 15.3346) 13.9324 11.1822 - 10.00
ICICI Prudential Capital Protection Oriented Fund IV - Plan
D - 60 Months 10.36 11033.03 10.79 13596.57 - - 11.75 14849.90 07-Oct-13
Crisil MIP Blended Index (Benchmark) 11.42 11138.53 11.17 13736.77 - - 11.28 14627.19
1 Year T Bill (Additional Benchmark) 6.63 10661.58 7.75 12509.00 - - 7.77 13051.60
NAV (Rs.) Per Unit (as on April 28,2017 : 14.8499) 13.4595 10.9218 - 10.00
ICICI Prudential Capital Protection Oriented Fund IV -
Plan F - 60 Months 10.82 11078.64 11.65 13915.31 - - 12.31 14879.50 26-Nov-13
Crisil MIP Blended Index (Benchmark) 11.42 11138.53 11.17 13736.77 - - 11.40 14467.06
1 Year T Bill (Additional Benchmark) 6.63 10661.58 7.75 12509.00 - - 7.78 12923.50
NAV (Rs.) Per Unit (as on April 28,2017 : 14.8795) 13.4308 10.6929 - 10.00
ICICI Prudential Capital Protection Oriented Fund IV -
Plan G - 60 Months 11.04 11100.38 11.81 13973.60 - - 12.15 14693.80 20-Dec-13
Crisil MIP Blended Index (Benchmark) 11.42 11138.53 11.17 13736.77 - - 11.31 14327.24
1 Year T Bill (Additional Benchmark) 6.63 10661.58 7.75 12509.00 - - 7.75 12848.74
NAV (Rs.) Per Unit (as on April 28,2017 : 14.6938) 13.2372 10.5154 - 10.00
ICICI Prudential Capital Protection Oriented Fund V -
Plan A - 5 Years 10.66 11062.86 11.12 13715.10 - - 11.60 14313.90 21-Jan-14
Crisil MIP Blended Index (Benchmark) 11.42 11138.53 11.17 13736.77 - - 11.06 14088.17
1 Year T Bill (Additional Benchmark) 6.63 10661.58 7.75 12509.00 - - 7.66 12726.46
NAV (Rs.) Per Unit (as on April 28,2017 : 14.3139) 12.9387 10.4366 - 10.00
ICICI Prudential Capital Protection Oriented Fund V -
Plan C - 1825 Days 10.34 11030.55 11.09 13704.93 - - 12.01 14349.20 21-Feb-14
Crisil MIP Blended Index (Benchmark) 11.42 11138.53 11.17 13736.77 - - 11.68 14215.00
1 Year T Bill (Additional Benchmark) 6.63 10661.58 7.75 12509.00 - - 7.78 12694.96
NAV (Rs.) Per Unit (as on April 28,2017 : 14.3492) 13.0086 10.4701 - 10.00
ICICI Prudential Capital Protection Oriented Fund V -
Plan E - 1100 Days 7.75 10772.84 - - - - 9.56 13132.20 05-May-14
Crisil MIP Blended Index (Benchmark) 11.42 11138.53 - - - - 11.08 13682.58
1 Year T Bill (Additional Benchmark) 6.63 10661.58 - - - - 7.74 12492.69
NAV (Rs.) Per Unit (as on April 28,2017 : 13.1322) 12.1901 - - 10.00
ICICI Prudential Capital Protection Oriented Fund V -
Plan F - 1100 Days 7.37 10734.98 - - - - 8.34 12615.00 04-Jun-14
Crisil MIP Blended Index (Benchmark) 11.42 11138.53 - - - - 10.20 13256.48
1 Year T Bill (Additional Benchmark) 6.63 10661.58 - - - - 7.64 12380.79
NAV (Rs.) Per Unit (as on April 28,2017 : 12.6150) 11.7513 - - 10.00
ICICI Prudential Capital Protection Oriented Fund VI -
Plan A - 1825 Days 9.80 10977.35 - - - - 9.92 13151.30 06-Jun-14
Crisil MIP Blended Index (Benchmark) 11.42 11138.53 - - - - 9.95 13159.78
1 Year T Bill (Additional Benchmark) 6.63 10661.58 - - - - 7.62 12370.98
NAV (Rs.) Per Unit (as on April 28,2017 : 13.1513) 11.9804 - - 10.00

108
ICICI Prudential Capital Protection Oriented Funds (A Close ended Capital Protection Oriented Fund)
Returns shown for Cumulative Option as on 30 April, 2017
ANNEXURE FOR RETURNS OF ALL THE SCHEMES
1 Year
CAGR (%)
Current Value of
Investment of Rs. 10000
Scheme Name 3 Year
CAGR (%)
Current Value of
Investment of Rs. 10000
5 Year
CAGR (%)
Current Value of
Investment of Rs. 10000
Since inception
CAGR (%)
Current Value of
Investment of Rs. 10000
Inception date
ICICI Prudential Capital Protection Oriented Fund VI -
Plan B - 1100 Days 7.22 10719.75 - - - - 7.76 12349.80 02-Jul-14
Crisil MIP Blended Index (Benchmark) 11.42 11138.53 - - - - 10.06 13108.07
1 Year T Bill (Additional Benchmark) 6.63 10661.58 - - - - 7.64 12311.49
NAV (Rs.) Per Unit (as on April 28,2017 : 12.3498) 11.5206 - - 10.00
ICICI Prudential Capital Protection Oriented Fund VI -
Plan C - 1825 Days 8.76 10873.54 - - - - 9.03 12760.10 04-Jul-14
Crisil MIP Blended Index (Benchmark) 11.42 11138.53 - - - - 10.02 13090.04
1 Year T Bill (Additional Benchmark) 6.63 10661.58 - - - - 7.64 12306.13
NAV (Rs.) Per Unit (as on April 28,2017 : 12.7601) 11.7350 - - 10.00
ICICI Prudential Capital Protection Oriented Fund VI -
Plan D - 1100 Days 7.06 10703.58 - - - - 7.73 12307.40 15-Jul-14
Crisil MIP Blended Index (Benchmark) 11.42 11138.53 - - - - 10.40 13176.31
1 Year T Bill (Additional Benchmark) 6.63 10661.58 - - - - 7.66 12285.10
NAV (Rs.) Per Unit (as on April 28,2017 : 12.3074) 11.4984 - - 10.00
ICICI Prudential Capital Protection Oriented Fund VI -
Plan E - 1100 Days 6.88 10685.69 - - - - 7.61 12220.90 04-Aug-14
Crisil MIP Blended Index (Benchmark) 11.42 11138.53 - - - - 10.25 13058.13
1 Year T Bill (Additional Benchmark) 6.63 10661.58 - - - - 7.65 12232.06
NAV (Rs.) Per Unit (as on April 28,2017 : 12.2209) 11.4367 - - 10.00
ICICI Prudential Capital Protection Oriented Fund VI -
Plan F - 1100 Days 7.20 10718.14 - - - - 7.52 12142.90 25-Aug-14
Crisil MIP Blended Index (Benchmark) 11.42 11138.53 - - - - 10.20 12969.11
1 Year T Bill (Additional Benchmark) 6.63 10661.58 - - - - 7.64 12177.52
NAV (Rs.) Per Unit (as on April 28,2017 : 12.1429) 11.3293 - - 10.00
ICICI Prudential Capital Protection Oriented Fund VI -
Plan G - 1100 Days 7.16 10714.18 - - - - 7.21 12033.10 01-Sep-14
Crisil MIP Blended Index (Benchmark) 11.42 11138.53 - - - - 10.11 12916.40
1 Year T Bill (Additional Benchmark) 6.63 10661.58 - - - - 7.64 12160.54
NAV (Rs.) Per Unit (as on April 28,2017 : 12.0331) 11.2310 - - 10.00
ICICI Prudential Capital Protection Oriented Fund VI -
Plan H - 1100 Days 7.55 10753.06 - - - - 7.54 12090.10 18-Sep-14
Crisil MIP Blended Index (Benchmark) 11.42 11138.53 - - - - 9.96 12813.57
1 Year T Bill (Additional Benchmark) 6.63 10661.58 - - - - 7.63 12117.17
NAV (Rs.) Per Unit (as on April 28,2017 : 12.0901) 11.2434 - - 10.00
ICICI Prudential Capital Protection Oriented Fund VII -
Plan A - 1285 Days 8.54 10851.90 - - - - 8.11 12155.00 27-Oct-14
Crisil MIP Blended Index (Benchmark) 11.42 11138.53 - - - - 9.80 12637.03
1 Year T Bill (Additional Benchmark) 6.63 10661.58 - - - - 7.55 11999.50
NAV (Rs.) Per Unit (as on April 28,2017 : 12.1550) 11.2008 - - 10.00
ICICI Prudential Capital Protection Oriented Fund VII -
Plan B - 1285 Days 8.21 10819.05 - - - - 7.29 11863.20 24-Nov-14
Crisil MIP Blended Index (Benchmark) 11.42 11138.53 - - - - 9.07 12344.65
1 Year T Bill (Additional Benchmark) 6.63 10661.58 - - - - 7.52 11923.23
NAV (Rs.) Per Unit (as on April 28,2017 : 11.8632) 10.9651 - - 10.00
ICICI Prudential Capital Protection Oriented Fund VII -
Plan C - 1284 Days 7.96 10794.16 - - - - 7.02 11712.10 30-Dec-14
Crisil MIP Blended Index (Benchmark) 11.42 11138.53 - - - - 9.10 12248.76
1 Year T Bill (Additional Benchmark) 6.63 10661.58 - - - - 7.46 11825.29
NAV (Rs.) Per Unit (as on April 28,2017 : 11.7121) 10.8504 - - 10.00
ICICI Prudential Capital Protection Oriented Fund VII -
Plan D - 1822 Days 9.18 10914.89 - - - - 7.29 11762.00 07-Jan-15
Crisil MIP Blended Index (Benchmark) 11.42 11138.53 - - - - 9.26 12267.65
1 Year T Bill (Additional Benchmark) 6.63 10661.58 - - - - 7.45 11803.56
NAV (Rs.) Per Unit (as on April 28,2017 : 11.7620) 10.7761 - - 10.00
ICICI Prudential Capital Protection Oriented Fund VII -
Plan E - 1284 Days 7.46 10744.37 - - - - 5.79 11364.10 20-Jan-15
Crisil MIP Blended Index (Benchmark) 11.42 11138.53 - - - - 8.36 12001.33
1 Year T Bill (Additional Benchmark) 6.63 10661.58 - - - - 7.37 11753.69
NAV (Rs.) Per Unit (as on April 28,2017 : 11.3641) 10.5768 - - 10.00
ICICI Prudential Capital Protection Oriented Fund VII -
Plan F - 1288 Days 7.04 10701.99 - - - - 5.80 11353.10 28-Jan-15
Crisil MIP Blended Index (Benchmark) 11.42 11138.53 - - - - 8.14 11924.62
1 Year T Bill (Additional Benchmark) 6.63 10661.58 - - - - 7.35 11729.06
NAV (Rs.) Per Unit (as on April 28,2017 : 11.3531) 10.6084 - - 10.00
ICICI Prudential Capital Protection Oriented Fund VII -
Plan G - 1285 Days 8.05 10802.46 - - - - 6.41 11449.20 23-Feb-15
Crisil MIP Blended Index (Benchmark) 11.42 11138.53 - - - - 8.43 11927.92
1 Year T Bill (Additional Benchmark) 6.63 10661.58 - - - - 7.39 11680.93
NAV (Rs.) Per Unit (as on April 28,2017 : 11.4492) 10.5987 - - 10.00

ICICI Prudential Capital Protection Oriented Funds (A Close ended Capital Protection Oriented Fund)
Returns shown for Cumulative Option as on 30 April, 2017
ANNEXURE FOR RETURNS OF ALL THE SCHEMES
109
1 Year
CAGR (%)
Current Value of
Investment of Rs. 10000
Scheme Name 3 Year
CAGR (%)
Current Value of
Investment of Rs. 10000
5 Year
CAGR (%)
Current Value of
Investment of Rs. 10000
Since inception
CAGR (%)
Current Value of
Investment of Rs. 10000
Inception date
ICICI Prudential Capital Protection Oriented Fund VII -
Plan H - 1284 Days 8.82 10879.29 - - - - 6.71 11488.10 10-Mar-15
Crisil MIP Blended Index (Benchmark) 11.42 11138.53 - - - - 8.50 11905.60
1 Year T Bill (Additional Benchmark) 6.63 10661.58 - - - - 7.34 11634.13
NAV (Rs.) Per Unit (as on April 28,2017 : 11.4881) 10.5596 - - 10.00
ICICI Prudential Capital Protection Oriented Fund VIII -
Plan A - 1300 Days 8.78 10875.70 - - - - 6.73 11459.40 27-Mar-15
Crisil MIP Blended Index (Benchmark) 11.42 11138.53 - - - - 8.95 11962.81
1 Year T Bill (Additional Benchmark) 6.63 10661.58 - - - - 7.34 11595.86
NAV (Rs.) Per Unit (as on April 28,2017 : 11.4594) 10.5367 - - 10.00
ICICI Prudential Capital Protection Oriented Fund VIII -
Plan B - 1103 Days 7.77 10775.22 - - - - 6.80 11418.50 23-Apr-15
Crisil MIP Blended Index (Benchmark) 11.42 11138.53 - - - - 8.89 11872.74
1 Year T Bill (Additional Benchmark) 6.63 10661.58 - - - - 7.31 11528.87
NAV (Rs.) Per Unit (as on April 28,2017 : 11.4185) 10.5970 - - 10.00
ICICI Prudential Capital Protection Oriented Fund VIII -
Plan C - 1103 Days 6.09 10607.28 - - - - 5.79 11164.90 14-May-15
Crisil MIP Blended Index (Benchmark) 11.42 11138.53 - - - - 9.52 11950.08
1 Year T Bill (Additional Benchmark) 6.63 10661.58 - - - - 7.31 11482.32
NAV (Rs.) Per Unit (as on April 28,2017 : 11.1649) 10.5257 - - 10.00
ICICI Prudential Capital Protection Oriented Fund VIII -
Plan D - 1101 Days 8.65 10862.83 - - - - 6.84 11310.60 19-Jun-15
Crisil MIP Blended Index (Benchmark) 11.42 11138.53 - - - - 9.55 11849.70
1 Year T Bill (Additional Benchmark) 6.63 10661.58 - - - - 7.20 11380.50
NAV (Rs.) Per Unit (as on April 28,2017 : 11.3106) 10.4122 - - 10.00
ICICI Prudential Capital Protection Oriented Fund VIII -
Plan E - 1107 Days 8.42 10839.73 - - - - 6.88 11274.40 10-Jul-15
Crisil MIP Blended Index (Benchmark) 11.42 11138.53 - - - - 9.60 11796.23
1 Year T Bill (Additional Benchmark) 6.63 10661.58 - - - - 7.11 11318.95
NAV (Rs.) Per Unit (as on April 28,2017 : 11.2744) 10.4010 - - 10.00
ICICI Prudential Capital Protection Oriented Fund VIII -
Plan F - 1115 Days 8.45 10842.52 - - - - 6.90 11241.20 28-Jul-15
Crisil MIP Blended Index (Benchmark) 11.42 11138.53 - - - - 9.64 11751.89
1 Year T Bill (Additional Benchmark) 6.63 10661.58 - - - - 7.12 11281.17
NAV (Rs.) Per Unit (as on April 28,2017 : 11.2412) 10.3677 - - 10.00
ICICI Prudential Capital Protection Oriented Fund VIII -
Plan G - 1101 Days 7.62 10760.32 - - - - 6.54 11146.40 12-Aug-15
Crisil MIP Blended Index (Benchmark) 11.42 11138.53 - - - - 9.60 11699.70
1 Year T Bill (Additional Benchmark) 6.63 10661.58 - - - - 7.10 11246.45
NAV (Rs.) Per Unit (as on April 28,2017 : 11.1464) 10.3588 - - 10.00
ICICI Prudential Capital Protection Oriented Fund VIII -
Plan H - 1105 Days 8.54 10851.19 - - - - 7.30 11263.10 21-Aug-15
Crisil MIP Blended Index (Benchmark) 11.42 11138.53 - - - - 9.61 11675.37
1 Year T Bill (Additional Benchmark) 6.63 10661.58 - - - - 7.08 11223.50
NAV (Rs.) Per Unit (as on April 28,2017 : 11.2631) 10.3796 - - 10.00
ICICI Prudential Capital Protection Oriented Fund VIII -
Plan I - 1290 Days 8.85 10882.71 - - - - 7.58 11300.50 26-Aug-15
Crisil MIP Blended Index (Benchmark) 11.42 11138.53 - - - - 10.29 11780.99
1 Year T Bill (Additional Benchmark) 6.63 10661.58 - - - - 7.09 11214.81
NAV (Rs.) Per Unit (as on April 28,2017 : 11.3005) 10.3839 - - 10.00
ICICI Prudential Capital Protection Oriented Fund VIII -
Plan J - 1284 Days 8.62 10860.04 - - - - 8.12 11381.10 01-Sep-15
Crisil MIP Blended Index (Benchmark) 11.42 11138.53 - - - - 10.25 11755.85
1 Year T Bill (Additional Benchmark) 6.63 10661.58 - - - - 7.07 11198.86
NAV (Rs.) Per Unit (as on April 28,2017 : 11.3811) 10.4798 - - 10.00
ICICI Prudential Capital Protection Oriented Fund IX -
Plan A - 1101 Days 8.78 10875.39 - - - - 7.34 11121.50 28-Oct-15
CRISIL Composite Bond Fund Index (85%) + Nifty 50 Index (15%) (Benchmark) 11.42 11138.52 - - - - 9.51 11461.19
1 Year T Bill (Additional Benchmark) 6.63 10661.58 - - - - 6.84 11044.02
NAV (Rs.) Per Unit (as on April 28,2017 : 11.1215) 10.2263 - - 10.00
ICICI Prudential Capital Protection Oriented Fund IX -
Plan B - 1103 Days 8.12 10809.20 - - - - 6.62 10994.90 05-Nov-15
CRISIL Composite Bond Fund Index (85%) + Nifty 50 Index (15%) (Benchmark) 11.42 11138.52 - - - - 10.02 11517.57
1 Year T Bill (Additional Benchmark) 6.63 10661.58 - - - - 6.83 11027.35
NAV (Rs.) Per Unit (as on April 28,2017 : 10.9949) 10.1718 - - 10.00
ICICI Prudential Capital Protection Oriented Fund IX -
Plan C - 1195 Days 9.11 10908.12 - - - - 8.23 11110.90 29-Dec-15
CRISIL Composite Bond Fund Index (85%) + Nifty 50 Index (15%) (Benchmark) 11.42 11138.52 - - - - 10.80 11463.68
1 Year T Bill (Additional Benchmark) 6.63 10661.58 - - - - 6.84 10920.52
NAV (Rs.) Per Unit (as on April 28,2017 : 11.1109) 10.1859 - - 10.00

ICICI Prudential Capital Protection Oriented Funds (A Close ended Capital Protection Oriented Fund)
Returns shown for Cumulative Option
ANNEXURE FOR RETURNS OF ALL THE SCHEMES
110
Returns shown for Cumulative Option as on 30 April, 2017
1 Year
CAGR (%)
Current Value of
Investment of Rs. 10000
Scheme Name 3 Year
CAGR (%)
Current Value of
Investment of Rs. 10000
5 Year
CAGR (%)
Current Value of
Investment of Rs. 10000
Since inception
CAGR (%)
Current Value of
Investment of Rs. 10000
Inception date
ICICI Prudential Capital Protection Oriented Fund IX -
Plan D - 1378 Days 9.27 10924.76 - - - - 9.94 11277.30 21-Jan-16
CRISIL Composite Bond Fund Index (85%) + Nifty 50 Index (15%) (Benchmark) 11.42 11138.52 - - - - 12.12 11561.20
1 Year T Bill (Additional Benchmark) 6.63 10661.58 - - - - 6.86 10878.02
NAV (Rs.) Per Unit (as on April 28,2017 : 11.2773) 10.3227 - - 10.00
ICICI Prudential Capital Protection Oriented Fund IX -
Plan E - 1325 Days 9.63 10960.37 - - - - 10.36 11168.40 15-Mar-16
CRISIL Composite Bond Fund Index (85%) + Nifty 50 Index (15%) (Benchmark) 11.42 11138.52 - - - - 12.63 11425.16
1 Year T Bill (Additional Benchmark) 6.63 10661.58 - - - - 6.81 10766.26
NAV (Rs.) Per Unit (as on April 28,2017 : 11.1684) 10.1898 - - 10.00
ICICI Prudential Capital Protection Oriented Fund IX -
Plan F - 1120 Days 8.80 10877.63 - - - - 8.98 10970.20 31-Mar-16
CRISIL Composite Bond Fund Index (85%) + Nifty 50 Index (15%) (Benchmark) 11.42 11138.52 - - - - 11.63 11257.13
1 Year T Bill (Additional Benchmark) 6.63 10661.58 - - - - 6.81 10734.78
NAV (Rs.) Per Unit (as on April 28,2017 : 10.9702) 10.0851 - - 10.00
1. Different plans shall have different expense structure. The performance provided are of plans mentioned above.
2. Past performance may or may not be sustained in future and the same may not necessarily provide the basis for comparison with other investment.
3. Performance for Schemes not having Growth/Cumulative Options have been calculated considering the Dividend Option, post adjustment of the Dividend Factor. Performance of dividend option would be Net of Dividend distribution tax, if any
4. Load is not considered for computation of returns.
5. In case, the start/end date of the concerned period is a nonbusiness date (NBD), the NAV of the previous date is considered for computation of returns. The NAV per unit shown in the table is as on the start date of the said period.
6. Since respective schemes/ options have not completed relevant period (1yr, 3yr or 5yr) after allotment or units were not available throughout the respective period, no returns are available.^ Inception date shown is the date from which units under the plans are available throughout.
7. Please Refer page no. 112 for Fund Manager details.
“The Scheme offered is “oriented towards protection of capital” and “not with guaranteed returns”.The orientation towards protection of the capital originates from the portfolio structure of the Scheme and not from any bank guarantee, insurance cover etc. The ability of the portfolio to meet capital protection on maturity to the investors can be impacted in certain circumstances including changes in government policies, interest rate movements in the market, credit defaults by bonds, expenses, reinvestment risk and risk associated with trading volumes, liquidity and settlement systems in equity and debt markets. Accordingly, investors may lose part or all of their investment (including original amount invested) in the Scheme. No guarantee or assurance, express or implied, is given that investors will receive the capital protected value at maturity or any other returns. Investors in the Scheme are not being offered any guaranteed / assured returns.”

Returns shown for Growth Option as on 30 April, 2017
ICICI Prudential Advisor Series(Open ended Fund of Funds)
WHY SHOULD ONE INVEST?Customised investment solutions to match risk return profile.
ANNEXURE FOR RETURNS OF ALL THE SCHEMES
111
1 Year
CAGR (%)
Current Value of
Investment of Rs. 10000
Scheme Name 3 Year
CAGR (%)
Current Value of
Investment of Rs. 10000
5 Year
CAGR (%)
Current Value of
Investment of Rs. 10000
Since inception
CAGR (%)
Current Value of
Investment of Rs. 10000
Inception date
ICICI Prudential Advisor Series - Dynamic Accrual Plan 9.50 10947.00 11.03 13684.65 9.51 15742.65 7.33 25760.80 18-Dec-03
Crisil Liquid Fund Index (30%) + Crisil Composite Bond Fund Index
(70%) (Benchmark) 9.17 10914.81 10.05 13322.89 9.00 15385.74 6.77 24002.55
NAV (Rs.) Per Unit (as on April 28,2017 : 25.7608) 23.5323 18.8246 16.3637 10.00
ICICI Prudential Advisor Series - Cautious Plan 8.08 10805.48 9.91 13272.14 8.58 15087.42 8.56 29986.40 18-Dec-03
Nifty 50 (20%) + Crisil Composite Bond Index (60%) +
Crisil Liquid Fund Index (10%) + Gold (10%) (Benchmark) 10.13 11010.09 10.03 13318.62 9.07 15433.03 7.97 27870.60
NAV (Rs.) Per Unit (as on April 28,2017 : 29.9864) 27.7511 22.5935 19.8751 10.00
ICICI Prudential Advisor Series - Long Term Savings Plan 19.63 11957.25 13.87 14759.04 11.91 17549.46 13.83 56510.30 18-Dec-03
Nifty 50 (50%) + Crisil Composite Bond Fund Index (30%) +
Crisil Liquid Fund Index (5%) + Gold (15%) (Benchmark) 12.13 11209.02 10.03 13319.12 9.64 15838.41 12.05 45764.47
NAV (Rs.) Per Unit (as on April 28,2017 : 56.5103) 47.2603 38.2886 32.2006 10.00
ICICI Prudential Advisor Series - Moderate Plan 18.05 11799.57 13.46 14602.17 11.77 17438.25 12.06 45816.20 18-Dec-03
Nifty 50 (40%) + Crisil Composite Bond Fund Index (40%) +
Crisil Liquid Fund Index (10%) + Gold (10%) (Benchmark) 11.85 11181.63 10.26 13401.96 9.73 15907.37 10.06 36013.43
NAV (Rs.) Per Unit (as on April 28,2017 : 45.8162) 38.8287 31.3763 26.2734 10.00
ICICI Prudential Advisor Series - Very Aggressive Plan 21.34 12127.79 14.78 15116.76 12.86 18304.37 14.98 64619.90 18-Dec-03
Nifty 50 (75%) + Crisil Composite Bond Fund Index (5%) +
Crisil Liquid Fund Index (5%) + Gold (15%) (Benchmark) 14.18 11413.94 10.14 13359.16 10.29 16312.54 13.12 51953.54
NAV (Rs.) Per Unit (as on April 28,2017 : 64.6199) 53.2825 42.7472 35.3030 10.00
1. Different plans shall have different expense structure. The performance provided are of plans mentioned above.
2. Past performance may or may not be sustained in future and the same may not necessarily provide the basis for comparison with other investment.
3. Performance for Schemes not having Growth/Cumulative Options have been calculated considering the Dividend Option, post adjustment of the Dividend Factor. Performance of dividend option would be Net of Dividend distribution tax, if any
4. Load is not considered for computation of returns.
5. In case, the start/end date of the concerned period is a nonbusiness date (NBD), the NAV of the previous date is considered for computation of returns. The NAV per unit shown in the table is as on the start date of the said period.
6. Since respective schemes/ options have not completed relevant period (1yr, 3yr or 5yr) after allotment or units were not available throughout the respective period, no returns are available.^ Inception date shown is the date from which units under the plans are available throughout.
7. Please Refer page no. 112 for Fund Manager details.
Benchmark indices allocation from inception to November 23, 2010
Investors may please note that they will be bearing the expenses of this Scheme in addition to the expenses of the underlying Schemes in which this Scheme makes investment.
Dynamic Accrual :- Crisil Liquid fund Index - 70%, Crisil Composite Bond Fund Index -30%
Cautious:- Nifty 50 Index-15%, Crisil Composite Bond Fund Index - 70%, Crisil Liquid Fund Index-15%
Moderate:- Nifty 50 Index-40%, Crisil Composite Bond Fund Index - 40%, Crisil Liquid Fund Index-20%
Long Term Savings:- Nifty 50 Index-70%, Crisil Composite Bond Fund Index - 25%, Crisil Liquid Fund Index-5%
New Benchmark indices allocation w.e.f. November 24, 2010
Dynamic Accrual:- Crisil Composite Bond Fund Index - 70%, Crisil Liquid fund Index - 30%
Cautious:- Nifty 50 Index - 20%, Crisil Composite Bond Fund Index - 60%, Crisil Liquid Fund Index - 10%, Gold# - 10%
Moderate:- Nifty 50 Index - 40%, Crisil Composite Bond Fund Index - 40%, Crisil Liquid Fund Index - 10%, Gold# - 10%
Long Term Savings:- Nifty 50 Index - 50%, Crisil Composite Bond Fund Index - 30%, Crisil Liquid Fund Index - 5%, Gold# - 15%
# Benchmark against the domestic price of gold as derived from the LBMA AM fixing prices.

Fund Manager Details
112
ICICI Prudential Equity - Arbitrage Fund Kayzad Eghlim Feb-11 Manish Banthia Nov-09
ICICI Prudential Capital Protection Oriented Fund – Series X –
1235 Days Plan A Rahul Goswami Jun-16 Chandni Gupta Jun-16 Vinay Sharma Jun-16
ICICI Prudential Capital Protection Oriented Fund – Series X –
1375 Days Plan B Rahul Goswami Jul-16 Chandni Gupta Jul-16 Vinay Sharma Jul-16
ICICI Prudential Capital Protection Oriented Fund - Series XI -
Plan A 2056 Days Rahul Goswami Dec-16 Chandni Gupta Dec-16 Vinay Sharma Dec-16
ICICI Prudential Capital Protection Oriented Fund – Series XI -
Plan B 1222 Days Rahul Goswami Dec-16 Chandni Gupta Dec-16 Vinay Sharma Dec-16
ICICI Prudential Capital Protection Oriented Fund - Series XI -
Plan C 1255 Days Rahul Goswami Mar-17 Chandni Gupta Mar-17 Vinay Sharma Mar-17
ICICI Prudential Capital Protection Oriented Fund - Series XI -
Plan D 1247 Days Rahul Goswami Mar-17 Chandni Gupta Mar-17 Vinay Sharma Mar-17
ICICI Prudential Capital Protection Oriented Fund - Series XI -
Plan E 1222 Days Rahul Goswami Mar-17 Chandni Gupta Mar-17 Vinay Sharma Mar-17
ICICI Prudential Capital Protection Oriented Fund III - Plan B -
60 Months Rahul Goswami Nov-13 Chandni Gupta Aug-16 Rajat Chandak Nov-13
ICICI Prudential Capital Protection Oriented Fund III - Plan E -
60 Months Rahul Goswami Nov-13 Chandni Gupta Aug-16 Rajat Chandak Nov-13
ICICI Prudential Capital Protection Oriented Fund III - Plan G -
60 Months Rahul Goswami Nov-13 Chandni Gupta Aug-16 Rajat Chandak Nov-13
ICICI Prudential Capital Protection Oriented Fund III - Plan H - 60
Months Rahul Goswami Nov-13 Chandni Gupta Aug-16 Rajat Chandak Nov-13
ICICI Prudential Capital Protection Oriented Fund IV -
Plan A - 60 Months Rahul Goswami Nov-13 Chandni Gupta Aug-16 Rajat Chandak Nov-13
ICICI Prudential Capital Protection Oriented Fund IV - Plan C -
60 Months Rahul Goswami Nov-13 Chandni Gupta Aug-16 Rajat Chandak Nov-13
ICICI Prudential Capital Protection Oriented Fund IV - Plan D -
60 Months Rahul Goswami Nov-13 Chandni Gupta Aug-16 Rajat Chandak Nov-13
ICICI Prudential Capital Protection Oriented Fund IV - Plan F -
60 Months Rahul Goswami Nov-13 Chandni Gupta Aug-16 Rajat Chandak Nov-13
ICICI Prudential Capital Protection Oriented Fund IV - Plan G -
60 Months Rahul Goswami Dec-13 Chandni Gupta Aug-16 Rajat Chandak Dec-13
ICICI Prudential Capital Protection Oriented Fund IX - Plan A -
1101 Days Rahul Goswami Oct-15 Chandni Gupta Oct-15 Vinay Sharma Oct-15
ICICI Prudential Capital Protection Oriented Fund IX -
Plan B - 1103 Days Rahul Goswami Nov-15 Chandni Gupta Nov-15 Vinay Sharma Nov-15
ICICI Prudential Capital Protection Oriented Fund IX - Plan
C - 1195 Days Rahul Goswami Dec-15 Chandni Gupta Dec-15 Vinay Sharma Dec-15
ICICI Prudential Capital Protection Oriented Fund IX - Plan
D - 1378 Days Rahul Goswami Jan-16 Chandni Gupta Jan-16 Vinay Sharma Jan-16
ICICI Prudential Capital Protection Oriented Fund IX - Plan
E - 1325 Days Rahul Goswami Mar-16 Chandni Gupta Mar-16 Vinay Sharma Mar-16
ICICI Prudential Capital Protection Oriented Fund IX - Plan
F - 1120 Days Rahul Goswami Mar-16 Chandni Gupta Mar-16 Vinay Sharma Mar-16
ICICI Prudential Capital Protection Oriented Fund V - Plan
A - 5 Years Rahul Goswami Jan-14 Chandni Gupta Aug-16 Rajat Chandak Jan-14
ICICI Prudential Capital Protection Oriented Fund V - Plan
C - 1825 Days Rahul Goswami Feb-14 Chandni Gupta Aug-16 Rajat Chandak Feb-14
ICICI Prudential Capital Protection Oriented Fund V - Plan
D - 1100 Days Rahul Goswami Mar-14 Chandni Gupta Aug-16 Rajat Chandak Mar-14
ICICI Prudential Capital Protection Oriented Fund V - Plan
E - 1100 Days Rahul Goswami May-14 Chandni Gupta Aug-16 Rajat Chandak May-14
ICICI Prudential Capital Protection Oriented Fund V - Plan
F - 1100 Days Rahul Goswami Jun-14 Chandni Gupta Aug-16 Rajat Chandak Jun-14
ICICI Prudential Capital Protection Oriented Fund VI - Plan
A - 1825 Days Rahul Goswami Jun-14 Chandni Gupta Aug-16 Vinay Sharma Jun-14
ICICI Prudential Capital Protection Oriented Fund VI - Plan
B - 1100 Days Rahul Goswami Jul-14 Chandni Gupta Aug-16 Vinay Sharma Jul-14
ICICI Prudential Capital Protection Oriented Fund VI - Plan
C - 1825 Days Rahul Goswami Jul-14 Chandni Gupta Aug-16 Vinay Sharma Jul-14
ICICI Prudential Capital Protection Oriented Fund VI - Plan
D - 1100 Days Rahul Goswami Jul-14 Chandni Gupta Aug-16 Vinay Sharma Jul-14
ICICI Prudential Capital Protection Oriented Fund VI - Plan
E - 1100 Days Rahul Goswami Aug-14 Chandni Gupta Aug-16 Vinay Sharma Aug-14
ICICI Prudential Capital Protection Oriented Fund VI - Plan
F - 1100 Days Rahul Goswami Aug-14 Chandni Gupta Aug-16 Vinay Sharma Aug-14
Scheme NameFund
Manager 1Managing
SinceFund
Manager 2Managing
Since
Fund Manager 3
Managing Since
Fund Manager 4
Managing Since
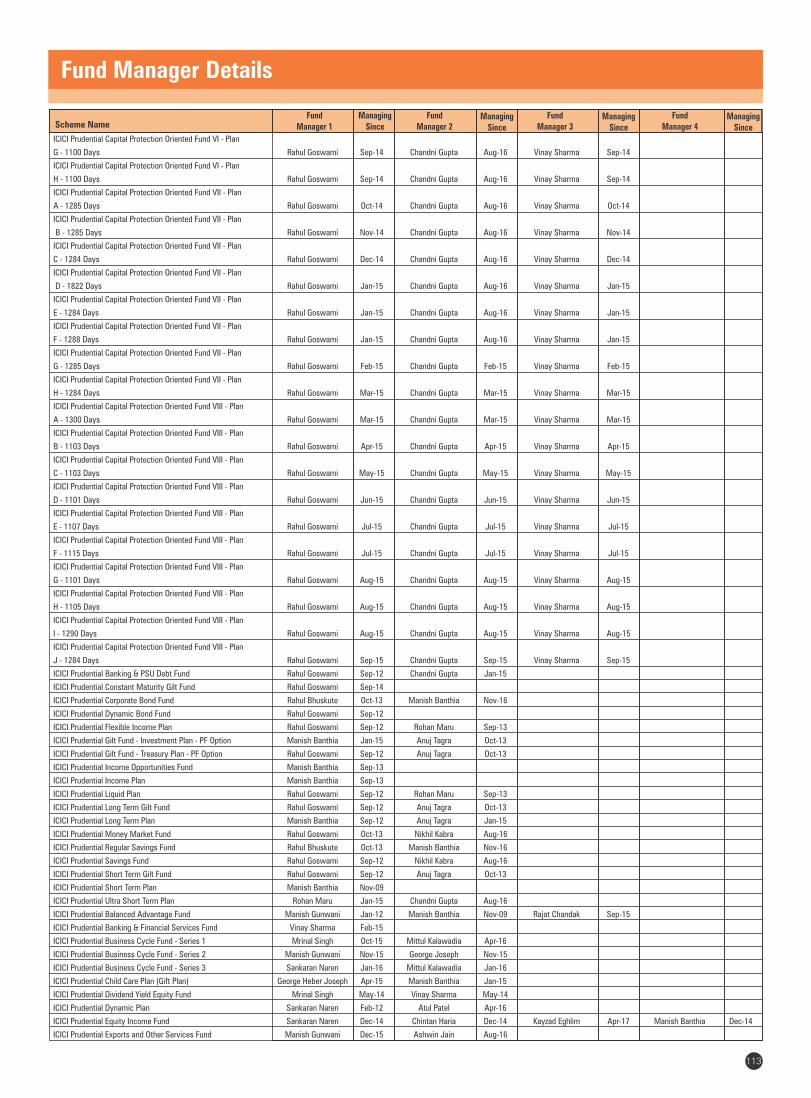
Scheme NameFund
Manager 1Managing
SinceFund
Manager 2Managing
Since
Fund Manager 3
Managing Since
Fund Manager 4
Managing Since
ICICI Prudential Capital Protection Oriented Fund VI - Plan
G - 1100 Days Rahul Goswami Sep-14 Chandni Gupta Aug-16 Vinay Sharma Sep-14
ICICI Prudential Capital Protection Oriented Fund VI - Plan
H - 1100 Days Rahul Goswami Sep-14 Chandni Gupta Aug-16 Vinay Sharma Sep-14
ICICI Prudential Capital Protection Oriented Fund VII - Plan
A - 1285 Days Rahul Goswami Oct-14 Chandni Gupta Aug-16 Vinay Sharma Oct-14
ICICI Prudential Capital Protection Oriented Fund VII - Plan
B - 1285 Days Rahul Goswami Nov-14 Chandni Gupta Aug-16 Vinay Sharma Nov-14
ICICI Prudential Capital Protection Oriented Fund VII - Plan
C - 1284 Days Rahul Goswami Dec-14 Chandni Gupta Aug-16 Vinay Sharma Dec-14
ICICI Prudential Capital Protection Oriented Fund VII - Plan
D - 1822 Days Rahul Goswami Jan-15 Chandni Gupta Aug-16 Vinay Sharma Jan-15
ICICI Prudential Capital Protection Oriented Fund VII - Plan
E - 1284 Days Rahul Goswami Jan-15 Chandni Gupta Aug-16 Vinay Sharma Jan-15
ICICI Prudential Capital Protection Oriented Fund VII - Plan
F - 1288 Days Rahul Goswami Jan-15 Chandni Gupta Aug-16 Vinay Sharma Jan-15
ICICI Prudential Capital Protection Oriented Fund VII - Plan
G - 1285 Days Rahul Goswami Feb-15 Chandni Gupta Feb-15 Vinay Sharma Feb-15
ICICI Prudential Capital Protection Oriented Fund VII - Plan
H - 1284 Days Rahul Goswami Mar-15 Chandni Gupta Mar-15 Vinay Sharma Mar-15
ICICI Prudential Capital Protection Oriented Fund VIII - Plan
A - 1300 Days Rahul Goswami Mar-15 Chandni Gupta Mar-15 Vinay Sharma Mar-15
ICICI Prudential Capital Protection Oriented Fund VIII - Plan
B - 1103 Days Rahul Goswami Apr-15 Chandni Gupta Apr-15 Vinay Sharma Apr-15
ICICI Prudential Capital Protection Oriented Fund VIII - Plan
C - 1103 Days Rahul Goswami May-15 Chandni Gupta May-15 Vinay Sharma May-15
ICICI Prudential Capital Protection Oriented Fund VIII - Plan
D - 1101 Days Rahul Goswami Jun-15 Chandni Gupta Jun-15 Vinay Sharma Jun-15
ICICI Prudential Capital Protection Oriented Fund VIII - Plan
E - 1107 Days Rahul Goswami Jul-15 Chandni Gupta Jul-15 Vinay Sharma Jul-15
ICICI Prudential Capital Protection Oriented Fund VIII - Plan
F - 1115 Days Rahul Goswami Jul-15 Chandni Gupta Jul-15 Vinay Sharma Jul-15
ICICI Prudential Capital Protection Oriented Fund VIII - Plan
G - 1101 Days Rahul Goswami Aug-15 Chandni Gupta Aug-15 Vinay Sharma Aug-15
ICICI Prudential Capital Protection Oriented Fund VIII - Plan
H - 1105 Days Rahul Goswami Aug-15 Chandni Gupta Aug-15 Vinay Sharma Aug-15
ICICI Prudential Capital Protection Oriented Fund VIII - Plan
I - 1290 Days Rahul Goswami Aug-15 Chandni Gupta Aug-15 Vinay Sharma Aug-15
ICICI Prudential Capital Protection Oriented Fund VIII - Plan
J - 1284 Days Rahul Goswami Sep-15 Chandni Gupta Sep-15 Vinay Sharma Sep-15
ICICI Prudential Banking & PSU Debt Fund Rahul Goswami Sep-12 Chandni Gupta Jan-15
ICICI Prudential Constant Maturity Gilt Fund Rahul Goswami Sep-14
ICICI Prudential Corporate Bond Fund Rahul Bhuskute Oct-13 Manish Banthia Nov-16
ICICI Prudential Dynamic Bond Fund Rahul Goswami Sep-12
ICICI Prudential Flexible Income Plan Rahul Goswami Sep-12 Rohan Maru Sep-13
ICICI Prudential Gilt Fund - Investment Plan - PF Option Manish Banthia Jan-15 Anuj Tagra Oct-13
ICICI Prudential Gilt Fund - Treasury Plan - PF Option Rahul Goswami Sep-12 Anuj Tagra Oct-13
ICICI Prudential Income Opportunities Fund Manish Banthia Sep-13
ICICI Prudential Income Plan Manish Banthia Sep-13
ICICI Prudential Liquid Plan Rahul Goswami Sep-12 Rohan Maru Sep-13
ICICI Prudential Long Term Gilt Fund Rahul Goswami Sep-12 Anuj Tagra Oct-13
ICICI Prudential Long Term Plan Manish Banthia Sep-12 Anuj Tagra Jan-15
ICICI Prudential Money Market Fund Rahul Goswami Oct-13 Nikhil Kabra Aug-16
ICICI Prudential Regular Savings Fund Rahul Bhuskute Oct-13 Manish Banthia Nov-16
ICICI Prudential Savings Fund Rahul Goswami Sep-12 Nikhil Kabra Aug-16
ICICI Prudential Short Term Gilt Fund Rahul Goswami Sep-12 Anuj Tagra Oct-13
ICICI Prudential Short Term Plan Manish Banthia Nov-09
ICICI Prudential Ultra Short Term Plan Rohan Maru Jan-15 Chandni Gupta Aug-16
ICICI Prudential Balanced Advantage Fund Manish Gunwani Jan-12 Manish Banthia Nov-09 Rajat Chandak Sep-15
ICICI Prudential Banking & Financial Services Fund Vinay Sharma Feb-15
ICICI Prudential Business Cycle Fund - Series 1 Mrinal Singh Oct-15 Mittul Kalawadia Apr-16
ICICI Prudential Business Cycle Fund - Series 2 Manish Gunwani Nov-15 George Joseph Nov-15
ICICI Prudential Business Cycle Fund - Series 3 Sankaran Naren Jan-16 Mittul Kalawadia Jan-16
ICICI Prudential Child Care Plan (Gift Plan) George Heber Joseph Apr-15 Manish Banthia Jan-15
ICICI Prudential Dividend Yield Equity Fund Mrinal Singh May-14 Vinay Sharma May-14
ICICI Prudential Dynamic Plan Sankaran Naren Feb-12 Atul Patel Apr-16
ICICI Prudential Equity Income Fund Sankaran Naren Dec-14 Chintan Haria Dec-14 Kayzad Eghlim Apr-17 Manish Banthia Dec-14
ICICI Prudential Exports and Other Services Fund Manish Gunwani Dec-15 Ashwin Jain Aug-16
Fund Manager Details
113

ICICI Prudential FMCG Fund Vinay Sharma Apr-14
ICICI Prudential Focused Bluechip Equity Fund Manish Gunwani Jan-12
ICICI Prudential Growth Fund - Series 1 Manish Gunwani Jun-14 Atul Patel Feb-15
ICICI Prudential Growth Fund - Series 2 Vinay Sharma Aug-14 Mrinal Singh Aug-16
ICICI Prudential Growth Fund - Series 3 Manish Gunwani Oct-14 Ashwin Jain Oct-14
ICICI Prudential Growth Fund - Series 4 Vinay Sharma Nov-14 Mrinal Singh Aug-16
ICICI Prudential Growth Fund - Series 5 Vinay Sharma Dec-14 Mrinal Singh Aug-16
ICICI Prudential Growth Fund - Series 6 Vinay Sharma Jan-15 Mrinal Singh Aug-16
ICICI Prudential Growth Fund - Series 7 Manish Gunwani Jan-15 Atul Patel Feb-15
ICICI Prudential Growth Fund - Series 8 George Joseph Apr-15 Chintan Haria Jan-15
ICICI Prudential India Recovery Fund - Series 1 Mrinal Singh Mar-15 Mittul Kalawadia Apr-16
ICICI Prudential India Recovery Fund - Series 2 Mrinal Singh Apr-15 Mittul Kalawadia Apr-16
ICICI Prudential India Recovery Fund – Series 3 Mrinal Singh Aug-15 Mittul Kalawadia Apr-16
ICICI Prudential India Recovery Fund – Series 4 Manish Gunwani Feb-16 Rajat Chandak Feb-16
ICICI Prudential India Recovery Fund – Series 5 George Joseph May-16 Atul Patel May-16
ICICI Prudential India Recovery Fund – Series 7 Sankaran Naren Mar-15 Atul Patel Mar-15
ICICI Prudential Indo Asia Equity Fund Sankaran Naren Feb-15 Atul Patel Feb-15 Ihab Dalwai Oct-16
ICICI Prudential Infrastructure Fund Sankaran Naren Dec-15 Atul Patel Aug-16
ICICI Prudential Long Term Equity Fund (Tax Saving) George Heber Joseph Apr-15
ICICI Prudential Midcap Fund Mrinal Singh May-11 Mittul Kalawadia Apr-16
ICICI Prudential Midcap Select iWIN ETF Kayzad Eghlim Jul-16
ICICI Prudential Multicap Fund George Heber Joseph Dec-15 Atul Patel Aug-16
ICICI Prudential Nifty 100 iWIN ETF Kayzad Eghlim Aug-13
ICICI Prudential Nifty Index Fund Kayzad Eghlim Aug-09
ICICI Prudential Nifty iWIN ETF Kayzad Eghlim Mar-13
ICICI Prudential Nifty Next 50 Index Fund Kayzad Eghlim Jun-10
ICICI Prudential NV20 iWIN ETF Kayzad Eghlim Jun-16
ICICI Prudential R.I.G.H.T (Rewards of investing & generation
of IPRIGHT Closed Ended ELSS 56 healthy tax savings) Fund Manish Gunwani Jan-12 Rajat Chandak Apr-14
ICICI Prudential Select Large Cap Fund Mrinal Singh Dec-15 Vinay Sharma Apr-14
ICICI Prudential Sensex iWIN ETF Kayzad Eghlim Aug-09
ICICI Prudential Technology Fund Manish Gunwani Oct-16 Ashwin Jain Oct-16
ICICI Prudential Top 100 Fund Sankaran Naren Feb-12 Mittul Kalawadia Feb-12
ICICI Prudential US Bluechip Equity Fund Ihab Dalwai Oct-16 Rohan Maru Sep-13
ICICI Prudential Value Discovery Fund Mrinal Singh Feb-11
ICICI Prudential Value Fund - Series 1 Sankaran Naren Nov-13 Mittul Kalawadia Nov-13
ICICI Prudential Value Fund - Series 10 Mrinal Singh Jan-17 Vinay Sharma Jan-17
ICICI Prudential Value Fund - Series 11 Manish Gunwani Jan-17 Rajat Chandak Jan-17
ICICI Prudential Value Fund - Series 2 Sankaran Naren Dec-13 Atul Patel Dec-13
ICICI Prudential Value Fund - Series 3 Sankaran Naren Mar-14 Chintan Haria Mar-14
ICICI Prudential Value Fund - Series 4 Mrinal Singh May-14 Rajat Chandak May-14
ICICI Prudential Value Fund - Series 5 Mrinal Singh Sep-14 Atul Patel Sep-14
ICICI Prudential Value Fund - Series 6 Sankaran Naren Mar-15 Atul Patel Mar-15
ICICI Prudential Value Fund - Series 7 Atul Patel Jun-15 Jan-00
ICICI Prudential Value Fund - Series 8 Manish Gunwani Aug-15 George Joseph Aug-15
ICICI Prudential Value Fund - Series 9 Sankaran Naren Nov-16 Atul Patel Nov-16
ICICI Prudential Fixed Maturity Plan - Corporate Bond Series A -
750 Days Rahul Goswami Apr-14 Rohan Maru Jun-16
ICICI Prudential Fixed Maturity Plan - Corporate Bond Series B -
1100 Days Rahul Bhuskute Aug-14
ICICI Prudential Fixed Maturity Plan - Series 67 - 740 Days Plan H Rahul Goswami Nov-13 Rohan Maru Nov-13
ICICI Prudential Fixed Maturity Plan - Series 68 - 745 Days Plan H Rahul Goswami Nov-13 Rohan Maru Nov-13
ICICI Prudential Fixed Maturity Plan - Series 68 - 745 Days Plan J Rahul Goswami Nov-13 Rohan Maru Nov-13
ICICI Prudential Fixed Maturity Plan - Series 69 - 1821 Days Plan H Rahul Goswami Nov-13 Rohan Maru Nov-13
ICICI Prudential Fixed Maturity Plan - Series 69 - 1821 Days Plan I Rahul Goswami Nov-13 Rohan Maru Nov-13
ICICI Prudential Fixed Maturity Plan - Series 69 - 369 Days Plan J Rahul Goswami Nov-13 Rohan Maru Nov-13
ICICI Prudential Fixed Maturity Plan - Series 69 - 698 Days Plan B Rahul Goswami Nov-13 Rohan Maru Nov-13
ICICI Prudential Fixed Maturity Plan - Series 70 - 1285 Days Plan T Rahul Goswami Nov-13 Rohan Maru Nov-13
ICICI Prudential Fixed Maturity Plan - Series 70 - 367 Days Plan C Rahul Goswami Nov-13 Rohan Maru Nov-13
ICICI Prudential Fixed Maturity Plan - Series 70 - 367 Days Plan N Rahul Goswami Nov-13 Rohan Maru Nov-13
ICICI Prudential Fixed Maturity Plan - Series 70 - 540 Days Plan S Rahul Goswami Nov-13 Rohan Maru Nov-13
ICICI Prudential Fixed Maturity Plan - Series 71 - 1095 Days Plan O Rahul Goswami Dec-13 Rohan Maru Dec-13
ICICI Prudential Fixed Maturity Plan - Series 71 - 480 Days Plan L Rahul Goswami Dec-13 Rohan Maru Dec-13
ICICI Prudential Fixed Maturity Plan - Series 71 - 505 Days Plan H Rahul Goswami Dec-13 Rohan Maru Dec-13
ICICI Prudential Fixed Maturity Plan - Series 71 - 525 Days Plan D Rahul Goswami Nov-13 Rohan Maru Nov-13
ICICI Prudential Fixed Maturity Plan - Series 71 - 547 Days Plan B Rahul Goswami Nov-13 Rohan Maru Nov-13
ICICI Prudential Fixed Maturity Plan - Series 72 - 1075 Days Plan Q Rahul Goswami Feb-14 Rohan Maru Feb-14
ICICI Prudential Fixed Maturity Plan - Series 72 - 1092 Days Plan F Rahul Goswami Jan-14 Rohan Maru Jan-14
Scheme NameFund
Manager 1Managing
SinceFund
Manager 2Managing
Since
Fund Manager 3
Managing Since
Fund Manager 4
Managing Since
Fund Manager Details
114

Scheme NameFund
Manager 1Managing
SinceFund
Manager 2Managing
Since
Fund Manager 3
Managing Since
Fund Manager 4
Managing Since
ICICI Prudential Fixed Maturity Plan - Series 72 - 366 Days Plan C Rahul Goswami Jan-14 Rohan Maru Jan-14
ICICI Prudential Fixed Maturity Plan - Series 72 - 366 Days Plan K Rahul Goswami Feb-14 Rohan Maru Feb-14
ICICI Prudential Fixed Maturity Plan - Series 72 - 366 Days Plan M Rahul Goswami Feb-14 Rohan Maru Feb-14
ICICI Prudential Fixed Maturity Plan - Series 72 - 367 Days Plan R Rahul Goswami Feb-14 Rohan Maru Feb-14
ICICI Prudential Fixed Maturity Plan - Series 72 - 368 Days Plan A Rahul Goswami Jan-14 Rohan Maru Jan-14
ICICI Prudential Fixed Maturity Plan - Series 72 - 368 Days Plan D Rahul Goswami Jan-14 Rohan Maru Jan-14
ICICI Prudential Fixed Maturity Plan - Series 72 - 370 Days Plan G Rahul Goswami Jan-14 Rohan Maru Jan-14
ICICI Prudential Fixed Maturity Plan - Series 72 - 409 Days Plan S Rahul Goswami Feb-14 Rohan Maru Feb-14
ICICI Prudential Fixed Maturity Plan - Series 72 - 425 Days Plan N Rahul Goswami Feb-14 Rohan Maru Feb-14
ICICI Prudential Fixed Maturity Plan - Series 72 - 440 Days Plan L Rahul Goswami Feb-14 Rohan Maru Feb-14
ICICI Prudential Fixed Maturity Plan - Series 72 - 483 Days Plan J Rahul Goswami Jan-14 Rohan Maru Jan-14
ICICI Prudential Fixed Maturity Plan - Series 72 - 500 Days Plan E Rahul Goswami Jan-14 Rohan Maru Jan-14
ICICI Prudential Fixed Maturity Plan - Series 72 - 525 Days Plan B Rahul Goswami Jan-14 Rohan Maru Jan-14
ICICI Prudential Fixed Maturity Plan - Series 72 - 785 Days Plan O Rahul Goswami Feb-14 Rohan Maru Feb-14
ICICI Prudential Fixed Maturity Plan - Series 72 - 823 Days Plan H Rahul Bhuskute Mar-14
ICICI Prudential Fixed Maturity Plan - Series 73 - 1120 Days Plan L Rahul Goswami Mar-14 Rohan Maru Mar-14
ICICI Prudential Fixed Maturity Plan - Series 73 - 1140 Days Plan E Rahul Goswami Mar-14 Rohan Maru Mar-14
ICICI Prudential Fixed Maturity Plan - Series 73 - 366 Days Plan A Rahul Goswami Mar-14 Rohan Maru Mar-14
ICICI Prudential Fixed Maturity Plan - Series 73 - 366 Days Plan B Rahul Goswami Mar-14 Rohan Maru Mar-14
ICICI Prudential Fixed Maturity Plan - Series 73 - 368 Days Plan D Rahul Goswami Mar-14 Rohan Maru Mar-14
ICICI Prudential Fixed Maturity Plan - Series 73 - 368 Days Plan M Rahul Goswami Mar-14 Rohan Maru Mar-14
ICICI Prudential Fixed Maturity Plan - Series 73 - 368 Days Plan R Rahul Goswami Mar-14 Rohan Maru Mar-14
ICICI Prudential Fixed Maturity Plan - Series 73 - 369 Days Plan H Rahul Goswami Mar-14 Rohan Maru Mar-14
ICICI Prudential Fixed Maturity Plan - Series 73 - 369 Days Plan P Rahul Goswami Mar-14 Rohan Maru Mar-14
ICICI Prudential Fixed Maturity Plan - Series 73 - 369 Days Plan S Rahul Goswami Apr-14 Rohan Maru Apr-14
ICICI Prudential Fixed Maturity Plan - Series 73 - 369 Days Plan T Rahul Goswami Apr-14 Rohan Maru Apr-14
ICICI Prudential Fixed Maturity Plan - Series 73 - 376 Days Plan Q Rahul Goswami Mar-14 Rohan Maru Mar-14
ICICI Prudential Fixed Maturity Plan - Series 73 - 378 Days Plan N Rahul Goswami Mar-14 Rohan Maru Mar-14
ICICI Prudential Fixed Maturity Plan - Series 73 - 378 Days Plan O Rahul Goswami Mar-14 Rohan Maru Mar-14
ICICI Prudential Fixed Maturity Plan - Series 73 - 383 Days Plan K Rahul Goswami Mar-14 Rohan Maru Mar-14
ICICI Prudential Fixed Maturity Plan - Series 73 - 390 Days Plan I Rahul Goswami Mar-14 Rohan Maru Mar-14
ICICI Prudential Fixed Maturity Plan - Series 73 - 391 Days Plan G Rahul Goswami Mar-14 Rohan Maru Mar-14
ICICI Prudential Fixed Maturity Plan - Series 73 - 392 Days Plan F Rahul Goswami Mar-14 Rohan Maru Mar-14
ICICI Prudential Fixed Maturity Plan - Series 73 - 407 Days Plan C Rahul Goswami Mar-14 Rohan Maru Mar-14
ICICI Prudential Fixed Maturity Plan - Series 73 - 830 Days Plan J Rahul Goswami Mar-14 Rohan Maru Mar-14
ICICI Prudential Fixed Maturity Plan - Series 74 - 1092 Days Plan G Rahul Goswami Apr-14 Rohan Maru Apr-14
ICICI Prudential Fixed Maturity Plan - Series 74 - 1092 Days Plan P Rahul Goswami May-14 Rohan Maru May-14
ICICI Prudential Fixed Maturity Plan - Series 74 - 367 Days Plan C Rahul Goswami Apr-14 Rohan Maru Apr-14
ICICI Prudential Fixed Maturity Plan - Series 74 - 367 Days Plan D Rahul Goswami Apr-14 Rohan Maru Apr-14
ICICI Prudential Fixed Maturity Plan - Series 74 - 367 Days Plan N Rahul Goswami May-14 Rohan Maru May-14
ICICI Prudential Fixed Maturity Plan - Series 74 - 367 Days Plan Z Rahul Goswami Jul-14 Rohan Maru Jul-14
ICICI Prudential Fixed Maturity Plan - Series 74 - 368 Days Plan H Rahul Goswami May-14 Rohan Maru May-14
ICICI Prudential Fixed Maturity Plan - Series 74 - 368 Days Plan J Rahul Goswami May-14 Rohan Maru May-14
ICICI Prudential Fixed Maturity Plan - Series 74 - 368 Days Plan R Rahul Goswami Jun-14 Rohan Maru Jun-14
ICICI Prudential Fixed Maturity Plan - Series 74 - 368 Days Plan Y Rahul Goswami Jul-14 Rohan Maru Jul-14
ICICI Prudential Fixed Maturity Plan - Series 74 - 369 Days Plan B Rahul Goswami Apr-14 Rohan Maru Apr-14
ICICI Prudential Fixed Maturity Plan - Series 74 - 369 Days Plan F Rahul Goswami Apr-14 Rohan Maru Apr-14
ICICI Prudential Fixed Maturity Plan - Series 74 - 369 Days Plan I Rahul Goswami May-14 Rohan Maru May-14
ICICI Prudential Fixed Maturity Plan - Series 74 - 369 Days Plan K Rahul Goswami May-14 Rohan Maru May-14
ICICI Prudential Fixed Maturity Plan - Series 74 - 369 Days Plan L Rahul Goswami May-14 Rohan Maru May-14
ICICI Prudential Fixed Maturity Plan - Series 74 - 369 Days Plan T Rahul Goswami Jun-14 Rohan Maru Jun-14
ICICI Prudential Fixed Maturity Plan - Series 74 - 370 Days Plan A Rahul Goswami Apr-14 Rohan Maru Apr-14
ICICI Prudential Fixed Maturity Plan - Series 74 - 370 Days Plan Q Rahul Goswami Jun-14 Rohan Maru Jun-14
ICICI Prudential Fixed Maturity Plan - Series 74 - 370 Days Plan S Rahul Goswami Jun-14 Rohan Maru Jun-14
ICICI Prudential Fixed Maturity Plan - Series 74 - 370 Days Plan V Rahul Goswami Jun-14 Rohan Maru Jun-14
ICICI Prudential Fixed Maturity Plan - Series 74 - 370 Days Plan X Rahul Goswami Jul-14 Rohan Maru Jul-14
ICICI Prudential Fixed Maturity Plan - Series 74 - 780 Days Plan E Rahul Goswami May-14 Rohan Maru May-14
ICICI Prudential Fixed Maturity Plan - Series 74 - 9 Years Plan U Rahul Goswami Jun-14 Rohan Maru Jun-14
ICICI Prudential Fixed Maturity Plan - Series 75 - 1100 Days Plan F Rahul Goswami Sep-14 Rohan Maru Sep-14
ICICI Prudential Fixed Maturity Plan - Series 75 - 1100 Days Plan G Rahul Bhuskute Sep-14 Rohan Maru Sep-14
ICICI Prudential Fixed Maturity Plan - Series 75 - 1100 Days Plan H Rahul Goswami Sep-14 Rohan Maru Sep-14
ICICI Prudential Fixed Maturity Plan - Series 75 - 1100 Days Plan I Rahul Bhuskute Sep-14
ICICI Prudential Fixed Maturity Plan - Series 75 - 1100 Days Plan J Rahul Goswami Sep-14 Rohan Maru Sep-14
ICICI Prudential Fixed Maturity Plan - Series 75 - 1100 Days Plan N Rahul Goswami Oct-14 Rohan Maru Oct-14
ICICI Prudential Fixed Maturity Plan - Series 75 - 1100 Days Plan O Rahul Goswami Oct-14 Rohan Maru Oct-14
ICICI Prudential Fixed Maturity Plan - Series 75 - 1100 Days Plan Q Rahul Bhuskute Nov-14
ICICI Prudential Fixed Maturity Plan - Series 75 - 1100 Days Plan R Rahul Goswami Nov-14 Rohan Maru Nov-14
ICICI Prudential Fixed Maturity Plan - Series 75 - 1100 Days Plan T Rahul Goswami Nov-14 Rohan Maru Nov-14
Fund Manager Details
115

Scheme NameFund
Manager 1Managing
SinceFund
Manager 2Managing
Since
Fund Manager 3
Managing Since
Fund Manager 4
Managing Since
ICICI Prudential Fixed Maturity Plan - Series 75 - 1103 Days Plan L Rahul Bhuskute Oct-14
ICICI Prudential Fixed Maturity Plan - Series 75 - 1103 Days Plan P Rahul Goswami Nov-14 Rohan Maru Nov-14
ICICI Prudential Fixed Maturity Plan - Series 75 - 1246 Days Plan U Rahul Bhuskute Nov-14
ICICI Prudential Fixed Maturity Plan - Series 75 - 1352 Days Plan E Rahul Goswami Aug-14 Rohan Maru Aug-14
ICICI Prudential Fixed Maturity Plan - Series 76 - 1100 Days Plan D Rahul Goswami Dec-14 Rohan Maru Dec-14
ICICI Prudential Fixed Maturity Plan - Series 76 - 1100 Days Plan G Rahul Goswami Jan-15 Rohan Maru Jan-15
ICICI Prudential Fixed Maturity Plan - Series 76 - 1100 Days Plan T Rahul Goswami Mar-15 Rohan Maru Mar-15
ICICI Prudential Fixed Maturity Plan - Series 76 - 1103 Days Plan F Rahul Goswami Jan-15 Rohan Maru Jan-15
ICICI Prudential Fixed Maturity Plan - Series 76 - 1108 Days Plan V Rahul Goswami Mar-15 Rohan Maru Mar-15
ICICI Prudential Fixed Maturity Plan - Series 76 - 1120 Days Plan U Rahul Goswami Mar-15 Rohan Maru Mar-15
ICICI Prudential Fixed Maturity Plan - Series 76 - 1127 Days Plan W Rahul Goswami Apr-15 Rohan Maru Apr-15
ICICI Prudential Fixed Maturity Plan - Series 76 - 1132 Days Plan P Rahul Goswami Mar-15 Rohan Maru Mar-15
ICICI Prudential Fixed Maturity Plan - Series 76 - 1134 Days Plan Y Rahul Goswami Apr-15 Rohan Maru Apr-15
ICICI Prudential Fixed Maturity Plan - Series 76 - 1135 Days Plan Z Rahul Goswami Apr-15 Rohan Maru Apr-15
ICICI Prudential Fixed Maturity Plan - Series 76 - 1142 Days Plan M Rahul Goswami Feb-15 Rohan Maru Feb-15
ICICI Prudential Fixed Maturity Plan - Series 76 - 1155 Days Plan K Rahul Goswami Feb-15 Rohan Maru Feb-15
ICICI Prudential Fixed Maturity Plan - Series 76 - 1185 Days Plan H Rahul Bhuskute Jan-15
ICICI Prudential Fixed Maturity Plan - Series 77 - 1100 Days Plan L Rahul Goswami Jul-15 Rohan Maru Jul-15
ICICI Prudential Fixed Maturity Plan - Series 77 - 1100 Days Plan M Rahul Goswami Jul-15 Rohan Maru Jul-15
ICICI Prudential Fixed Maturity Plan - Series 77 - 1105 Days Plan N Rahul Goswami Jul-15 Rohan Maru Jul-15
ICICI Prudential Fixed Maturity Plan - Series 77 - 1129 Days Plan W Rahul Goswami Sep-15 Rohan Maru Sep-15
ICICI Prudential Fixed Maturity Plan - Series 77 - 1130 Days Plan D Rahul Goswami May-15 Rohan Maru May-15
ICICI Prudential Fixed Maturity Plan - Series 77 - 1132 Days Plan A Rahul Goswami May-15 Rohan Maru May-15
ICICI Prudential Fixed Maturity Plan - Series 77 - 1134 Days Plan H Rahul Goswami Jun-15 Rohan Maru Jun-15
ICICI Prudential Fixed Maturity Plan - Series 77 - 1144 Days Plan T Rahul Goswami Sep-15 Rohan Maru Sep-15
ICICI Prudential Fixed Maturity Plan - Series 77 - 1151 Days Plan S Rahul Goswami Sep-15 Rohan Maru Sep-15
ICICI Prudential Fixed Maturity Plan - Series 77 - 1473 Days Plan C Rahul Goswami May-15 Rohan Maru May-15
ICICI Prudential Fixed Maturity Plan - Series 78 - 1102 Days Plan Z Rahul Goswami Apr-16 Rohan Maru Apr-16
ICICI Prudential Fixed Maturity Plan - Series 78 - 1115 Days Plan X Rahul Goswami Mar-16 Rohan Maru Mar-16
ICICI Prudential Fixed Maturity Plan - Series 78 - 1127 Days Plan R Rahul Goswami Mar-16 Rohan Maru Mar-16
ICICI Prudential Fixed Maturity Plan - Series 78 - 1130 Days Plan T Rahul Goswami Mar-16 Rohan Maru Mar-16
ICICI Prudential Fixed Maturity Plan - Series 78 - 1135 Days Plan W Rahul Goswami Mar-16 Rohan Maru Mar-16
ICICI Prudential Fixed Maturity Plan - Series 78 - 1150 Days Plan N Rahul Goswami Mar-16 Rohan Maru Mar-16
ICICI Prudential Fixed Maturity Plan - Series 78 - 1156 Days Plan U Rahul Goswami Mar-16 Rohan Maru Mar-16
ICICI Prudential Fixed Maturity Plan - Series 78 - 1168 Days Plan J Rahul Goswami Feb-16 Rohan Maru Feb-16
ICICI Prudential Fixed Maturity Plan - Series 78 - 1170 Days Plan I Rahul Goswami Feb-16 Rohan Maru Feb-16
ICICI Prudential Fixed Maturity Plan - Series 78 - 1185 Days Plan F Rahul Goswami Jan-16 Rohan Maru Jan-16
ICICI Prudential Fixed Maturity Plan - Series 78 - 1190 Days Plan C Rahul Goswami Dec-15 Rohan Maru Dec-15
ICICI Prudential Fixed Maturity Plan - Series 78 - 1190 Days Plan E Rahul Goswami Jan-16 Rohan Maru Jan-16
ICICI Prudential Fixed Maturity Plan - Series 78 - 1212 Days Plan A Rahul Goswami Dec-15 Rohan Maru Dec-15
ICICI Prudential Fixed Maturity Plan - Series 78 - 1281 Days Plan V Rahul Goswami Mar-16 Rohan Maru Mar-16
ICICI Prudential Fixed Maturity Plan - Series 79 - 1104 Days Plan O Rahul Goswami Sep-16 Rohan Maru Sep-16
ICICI Prudential Fixed Maturity Plan - Series 79 - 1104 Days Plan P Rahul Goswami Sep-16 Rohan Maru Sep-16
ICICI Prudential Fixed Maturity Plan - Series 79 - 1105 Days Plan B Rahul Goswami May-16 Rohan Maru May-16
ICICI Prudential Fixed Maturity Plan - Series 79 - 1106 Days Plan M Rahul Goswami Aug-16 Rohan Maru Aug-16
ICICI Prudential Fixed Maturity Plan - Series 79 - 1118 Days Plan K Rahul Goswami Aug-16 Rohan Maru Aug-16
ICICI Prudential Fixed Maturity Plan - Series 79 - 1120 Days Plan J Rahul Goswami Aug-16 Rohan Maru Aug-16
ICICI Prudential Fixed Maturity Plan - Series 79 - 1130 Days Plan E Rahul Goswami Jun-16 Rohan Maru Jun-16
ICICI Prudential Fixed Maturity Plan - Series 79 - 1140 Days Plan D Rahul Goswami Jun-16 Rohan Maru Jun-16
ICICI Prudential Fixed Maturity Plan - Series 79 - 1218 Days Plan A Rahul Goswami May-16 Rohan Maru May-16
ICICI Prudential Fixed Maturity Plan - Series 79 - 1404 Days Plan T Rahul Goswami Sep-16 Rohan Maru Sep-16
ICICI Prudential Fixed Maturity Plan - Series 80 - 1100 Days Plan A Rahul Goswami Oct-16 Rohan Maru Oct-16
ICICI Prudential Fixed Maturity Plan - Series 80 - 1125 Days Plan S Rahul Goswami Mar-17 Rohan Maru Mar-17
ICICI Prudential Fixed Maturity Plan - Series 80 - 1138 Days Plan R Rahul Goswami Mar-17 Rohan Maru Mar-17
ICICI Prudential Fixed Maturity Plan - Series 80 - 1150 Days Plan N Rahul Goswami Mar-17 Rohan Maru Mar-17
ICICI Prudential Fixed Maturity Plan - Series 80 - 1170 Days Plan I Rahul Goswami Feb-17 Rohan Maru Feb-17
ICICI Prudential Fixed Maturity Plan - Series 80 - 1187 Days Plan G Rahul Goswami Feb-17 Rohan Maru Feb-17
ICICI Prudential Fixed Maturity Plan - Series 80 - 1194 Days Plan F Rahul Goswami Jan-17 Rohan Maru Jan-17
ICICI Prudential Fixed Maturity Plan - Series 80 - 1216 Days Plan U Rahul Goswami Mar-17 Rohan Maru Mar-17
ICICI Prudential Fixed Maturity Plan - Series 80 - 1225 Days Plan T Rahul Goswami Mar-17 Rohan Maru Mar-17
ICICI Prudential Fixed Maturity Plan - Series 80 - 1227 Days Plan Q Rahul Goswami Mar-17 Rohan Maru Mar-17
ICICI Prudential Fixed Maturity Plan - Series 80 - 1231 Days Plan P Rahul Goswami Mar-17 Rohan Maru Mar-17
ICICI Prudential Fixed Maturity Plan - Series 80 - 1233 Days Plan O Rahul Goswami Mar-17 Rohan Maru Mar-17
ICICI Prudential Fixed Maturity Plan - Series 80 - 1245 Days Plan L Rahul Goswami Mar-17 Rohan Maru Mar-17
ICICI Prudential Fixed Maturity Plan - Series 80 - 1248 Days Plan D Rahul Goswami Nov-16 Rohan Maru Nov-16
ICICI Prudential Fixed Maturity Plan - Series 80 - 1253 Days Plan J Rahul Goswami Feb-17 Rohan Maru Feb-17
ICICI Prudential Fixed Maturity Plan-Series 68 - 369 Days Plan K Rahul Goswami Nov-13 Rohan Maru Nov-13
ICICI Prudential Fixed Maturity Plan-Series 69 - 366 Days Plan A Rahul Goswami Nov-13 Rohan Maru Nov-13
Fund Manager Details
116

Scheme NameFund
Manager 1Managing
SinceFund
Manager 2Managing
Since
Fund Manager 3
Managing Since
Fund Manager 4
Managing Since
ICICI Prudential Advisor Series - Cautious Plan Mrinal Singh Feb-11
ICICI Prudential Advisor Series - Dynamic Accrual Plan Mrinal Singh Feb-11
ICICI Prudential Advisor Series - Long Term Savings Plan Mrinal Singh Feb-11
ICICI Prudential Advisor Series - Moderate Plan Mrinal Singh Feb-11
ICICI Prudential Advisor Series - Very Aggressive Plan Mrinal Singh Feb-11
ICICI Prudential Global Stable Equity Fund Ihab Dalwai Oct-16 Rohan Maru Sep-13
ICICI Prudential Gold iWIN ETF Manish Banthia Sep-12
ICICI Prudential Regular Gold Savings Fund Manish Banthia Sep-12
ICICI Prudential Balanced Fund Sankaran Naren Dec-15 Atul Patel Aug-16 Manish Banthia Sep-13
ICICI Prudential Child Care Plan (Study Plan) Rajat Chandak Feb-12 Manish Banthia Sep-13
ICICI Prudential MIP 25 (An open ended Income fund. Monthly income is
not assured and is subject to the availability of distributable surplus.) Rajat Chandak Feb-15 Manish Banthia Sep-13
ICICI Prudential Monthly Income Plan (An open ended income fund.
Monthly income is not assured and is subject to the availability of
distributable surplus.) Rajat Chandak Sep-12 Manish Banthia Sep-13
ICICI Prudential Regular Income Fund (An open ended income fund.
Income is not assured and is subject to the availability of distributable surplus.) Rajat Chandak Sep-12 Rahul Bhuskute Oct-14 Manish Banthia Nov-16
ICICI Prudential Interval Fund - Annual Interval Plan I Rohan Maru Aug-16 Nikhil Kabra Aug-16
ICICI Prudential Interval Fund - Annual Interval Plan II Rohan Maru Aug-16 Nikhil Kabra Aug-16
ICICI Prudential Interval Fund - Annual Interval Plan III Rohan Maru Aug-16 Nikhil Kabra Aug-16
ICICI Prudential Interval Fund - Annual Interval Plan IV Rohan Maru Aug-16 Nikhil Kabra Aug-16
ICICI Prudential Interval Fund - Monthly Interval Plan I Rohan Maru Aug-16 Nikhil Kabra Aug-16
ICICI Prudential Interval Fund - Quarterly Interval Plan I Rohan Maru Aug-16 Nikhil Kabra Aug-16
ICICI Prudential Interval Fund - Quarterly Interval Plan II Rohan Maru Aug-16 Nikhil Kabra Aug-16
ICICI Prudential Interval Fund - Quarterly Interval Plan III Rohan Maru Aug-16 Nikhil Kabra Aug-16
ICICI Prudential Interval Fund - Series VI - Annual Interval Plan - C Rohan Maru Aug-16 Nikhil Kabra Aug-16
ICICI Prudential Interval Fund - Series VI - Annual Interval Plan - D Rohan Maru Aug-16 Nikhil Kabra Aug-16
ICICI Prudential Interval Fund - Series VII - Annual Interval Plan - C Rohan Maru Aug-16 Nikhil Kabra Aug-16
ICICI Prudential Interval Fund II - Quarterly Interval Plan - A Rohan Maru Aug-16 Nikhil Kabra Aug-16
ICICI Prudential Interval Fund II - Quarterly Interval Plan - B Rohan Maru Aug-16 Nikhil Kabra Aug-16
ICICI Prudential Interval Fund II - Quarterly Interval Plan - C Rohan Maru Aug-16 Nikhil Kabra Aug-16
ICICI Prudential Interval Fund II - Quarterly Interval Plan - D Rohan Maru Aug-16 Nikhil Kabra Aug-16
ICICI Prudential Interval Fund II - Quarterly Interval Plan F Rohan Maru Aug-16 Nikhil Kabra Aug-16
ICICI Prudential Interval Fund IV - Quarterly Interval Plan B Rohan Maru Aug-16 Nikhil Kabra Aug-16
ICICI Prudential Interval Fund V - Monthly Interval Plan A Rohan Maru Aug-16 Nikhil Kabra Aug-16
ICICI Prudential Multiple Yield Fund - Series 10 - 1775 Days - Plan A Rahul Goswami Dec-15 Chandni Gupta Dec-15 Vinay Sharma Dec-15
ICICI Prudential Multiple Yield Fund - Series 10 - 1825 Days - Plan B Rahul Goswami Jan-16 Chandni Gupta Jan-16 Vinay Sharma Jan-16
ICICI Prudential Multiple Yield Fund - Series 11 - Plan A 1427 Days Rahul Goswami Aug-16 Chandni Gupta Aug-16 Vinay Sharma Aug-16
ICICI Prudential Multiple Yield Fund - Series 11 - Plan B 1394 Days Rahul Goswami Sep-16 Chandni Gupta Sep-16 Vinay Sharma Sep-16
ICICI Prudential Multiple Yield Fund - Series 11 - Plan C - 1387 days Rahul Goswami Oct-16 Chandni Gupta Oct-16 Vinay Sharma Oct-16
ICICI Prudential Multiple Yield Fund - Series 11 - Plan D 1361 Days Vinay Sharma Nov-16 Rahul Goswami Nov-16 Chandni Gupta Nov-16
ICICI Prudential Multiple Yield Fund - Series 3 - Plan C Rahul Goswami Nov-13 Chandni Gupta Aug-16 Rajat Chandak Nov-13
ICICI Prudential Multiple Yield Fund - Series 3 - Plan D Rahul Goswami Nov-13 Chandni Gupta Aug-16 Rajat Chandak Nov-13
ICICI Prudential Multiple Yield Fund - Series 4 - 1825 Days Plan A Rahul Goswami Nov-13 Chandni Gupta Aug-16 Rajat Chandak Nov-13
ICICI Prudential Multiple Yield Fund - Series 4 - 1825 Days Plan B Rahul Goswami Nov-13 Chandni Gupta Aug-16 Rajat Chandak Nov-13
ICICI Prudential Multiple Yield Fund - Series 4 - 1825 Days Plan D Rahul Goswami Nov-13 Chandni Gupta Aug-16 Rajat Chandak Nov-13
ICICI Prudential Multiple Yield Fund - Series 5 - 1825 Days - Plan C Rahul Goswami Jan-14 Chandni Gupta Aug-16 Rajat Chandak Jan-14
ICICI Prudential Multiple Yield Fund - Series 6 - 1100 Days - Plan E Rahul Goswami Apr-14 Chandni Gupta Aug-16 Rajat Chandak Apr-14
ICICI Prudential Multiple Yield Fund - Series 6 - 1100 Days - Plan F Rahul Goswami May-14 Chandni Gupta Aug-16 Rajat Chandak May-14
ICICI Prudential Multiple Yield Fund - Series 6 - 1125 Days - Plan B Rahul Goswami Mar-14 Chandni Gupta Aug-16 Rajat Chandak Mar-14
ICICI Prudential Multiple Yield Fund - Series 6 - 1825 Days - Plan C Rahul Goswami Apr-14 Chandni Gupta Aug-16 Rajat Chandak Apr-14
ICICI Prudential Multiple Yield Fund - Series 6 - 1825 Days - Plan D Rahul Goswami May-14 Chandni Gupta Aug-16 Rajat Chandak May-14
ICICI Prudential Multiple Yield Fund - Series 7 - 1100 Days - Plan A Rahul Goswami Jun-14 Chandni Gupta Aug-16 Vinay Sharma Jun-14
ICICI Prudential Multiple Yield Fund - Series 7 - 1100 Days - Plan F Rahul Goswami Oct-14 Chandni Gupta Aug-16 Vinay Sharma Oct-14
ICICI Prudential Multiple Yield Fund - Series 7 - 1338 Days - Plan D Rahul Goswami Sep-14 Chandni Gupta Aug-16 Vinay Sharma Sep-14
ICICI Prudential Multiple Yield Fund - Series 7 - 1825 Days - Plan B Rahul Goswami Jul-14 Chandni Gupta Aug-16 Vinay Sharma Jul-14
ICICI Prudential Multiple Yield Fund - Series 7 - 1825 Days - Plan C Rahul Goswami Sep-14 Chandni Gupta Aug-16 Vinay Sharma Sep-14
ICICI Prudential Multiple Yield Fund - Series 7 - 1825 Days - Plan E Rahul Goswami Oct-14 Chandni Gupta Aug-16 Vinay Sharma Oct-14
ICICI Prudential Multiple Yield Fund - Series 8 - 1101 Days - Plan E Rahul Goswami Dec-14 Chandni Gupta Aug-16 Vinay Sharma Dec-14
ICICI Prudential Multiple Yield Fund - Series 8 - 1103 Days - Plan C Rahul Goswami Nov-14 Chandni Gupta Aug-16 Vinay Sharma Nov-14
ICICI Prudential Multiple Yield Fund - Series 8 - 1103 Days - Plan F Rahul Goswami Feb-15 Chandni Gupta Feb-15 Vinay Sharma Feb-15
ICICI Prudential Multiple Yield Fund - Series 8 - 1822 Days - Plan D Rahul Goswami Dec-14 Chandni Gupta Aug-16 Vinay Sharma Dec-14
ICICI Prudential Multiple Yield Fund - Series 8 - 1824 Days - Plan A Rahul Goswami Nov-14 Chandni Gupta Aug-16 Vinay Sharma Nov-14
ICICI Prudential Multiple Yield Fund - Series 9 - 1140 Days - Plan A Rahul Goswami Apr-15 Chandni Gupta Apr-15 Vinay Sharma Apr-15
Fund Manager Details
117

ICICI Prudential Multicap Fund
Past performance may or may not be sustained in future*Inception date is 01 Oct 1994. **Scheme benchmark is S&P BSE - 200 Index.
10 year SIP
5 year SIP
3 year SIP
1 year SIP
Since Inception
SIP*
SIP Investments15 year
SIP7 Year
SIP
Total Amount Invested (Rs. '000) 2,710 1,800 1,200 840 600 360 120
Market Value as on Month End (Rs. '000) 33,429.92 8,698.89 2,723.51 1,570.46 997.40 463.72 136.34
Scheme Return (% CAGR) 18.76 18.94 15.67 17.60 20.51 17.25 26.69
Scheme** Benchmark Return (% CAGR) 13.47 14.21 11.15 12.05 13.99 11.76 22.64
Nifty 50 Index (% CAGR) 12.22 13.18 9.86 10.28 11.37 8.75 18.01
118
Benefits of Systematic Investment Plan (SIP) - SIP Performance of Select Schemes
Past performance may or may not be sustained in future*Inception date is 18 Oct 2007. **Scheme benchmark is 65 Nifty 50 + 35 MSCI Asia ex - JapanIndex .
ICICI Prudential Indo Asia Equity Fund
7 year SIP
SIP Investments5 year
SIP3 year
SIP1 year
SIP
Total Amount Invested (Rs. '000) 1,150 840 600 360 120
Market Value as on Month End (Rs. '000) 2,601.46 1,572.98 981.15 463.52 141.48
Scheme Return (% CAGR) 16.34 17.64 19.83 17.22 35.50
Scheme** Benchmark Return (% CAGR) 9.54 9.32 9.61 7.85 16.57
Nifty 50 Index (% CAGR) 10.05 10.29 11.38 8.82 18.26
Since Inception
SIP*
Past performance may or may not be sustained in future*Inception date is 30 Nov 2005. **Scheme benchmark is Nifty Services Sector Index.
ICICI Prudential Exports and Other Services Fund
10 year SIP
5 year SIP
3 year SIP
1 year SIP
SIP Investments Since Inception
SIP*
7 yearSIP
Total Amount Invested (Rs. '000) 1,380 1,200 840 600 360 120
Market Value as on Month End (Rs. '000) 3,996.58 3,202.70 1,818.39 1,065.80 440.59 133.29
Scheme Return (% CAGR) 17.36 18.68 21.72 23.26 13.64 21.57
Scheme** Benchmark Return (% CAGR) 10.80 10.94 11.63 12.96 9.71 19.79
Nifty 50 Index (% CAGR) 9.90 9.86 10.28 11.37 8.75 18.01
The Fund offers flexible and convenient Systematic Investment Plan (SIP) facility. To illustrate the advantages of SIP investments, this is how your investments wouldhave grown if you had invested say Rs. 10,000 systematically on the first Business Day of every month over a period of time in the Growth Option of Respective Scheme.
The returns are calculated by XIRR approach assuming investment of Rs 10000/- on the 1st working day of every month. XIRR helps in calculating return on investmentsgiven an initial and final value and a series of cash inflows and outflows with the correct allowance for the time impact of the transactions.Data as on April 30, 2016.
ICICI Prudential Focused Bluechip Equity Fund
Past performance may or may not be sustained in future*Inception date is 23 May 2008.
SIP Investments Since Inception
SIP*
5 year SIP
3 year SIP
1 year SIP
7 year SIP
Total Amount Invested (Rs. '000) 1,080 840 600 360 120
Market Value as on Month End (Rs. '000) 2,299.96 1,434.26 903.38 437.79 133.60
Scheme Return (% CAGR) 16.21 15.05 16.43 13.20 22.08
Nifty 50 Index (% CAGR) 10.68 10.28 11.37 8.75 18.01
ICICI Prudential Value Discovery Fund
Past performance may or may not be sustained in future*Inception date is 16 Aug 2004. **Scheme benchmark is S&P BSE 500 Index.
10 year SIP
5 year SIP
3 year SIP
1 year SIP
SIP Investments Since Inception
SIP*
7 yearSIP
Total Amount Invested (Rs. '000) 1,530 1,200 840 600 360 120
Market Value as on Month End (Rs. '000) 6,120.79 3,564.09 1,720.28 1,032.19 439.12 131.42
Scheme Return (% CAGR) 20.03 20.66 20.16 21.93 13.41 18.45
Scheme** Benchmark Return (% CAGR) 11.94 11.41 12.51 14.77 12.78 25.04
Nifty 50 Index (% CAGR) 10.95 9.86 10.28 11.37 8.75 18.01
ICICI Prudential Top 100 Fund
Past performance may or may not be sustained in future*Inception date is 09 Jul 1998.
10 year SIP
5 year SIP
3 year SIP
1 year SIP
Since Inception
SIP*
SIP Investments15 year
SIP7 year
SIP
Total Amount Invested (Rs. '000) 2,260 1,800 1,200 840 600 360 120
Market Value as on Month End (Rs. '000) 15,954.22 7,749.75 2,557.89 1,469.16 924.66 450.37 136.37
Scheme Return (% CAGR) 18.11 17.63 14.50 15.72 17.39 15.18 26.74
Nifty 50 Index (% CAGR) 13.15 13.18 9.86 10.28 11.37 8.75 18.01
Past performance may or may not be sustained in future*Inception date is 31 Oct 2002.
ICICI Prudential Dynamic Plan
10 year SIP
5 year SIP
3 year SIP
1 year SIP
SIP Investments Since Inception
SIP*
7 yearSIP
Total Amount Invested (Rs. '000) 1,750 1,200 840 600 360 120
Market Value as on Month End (Rs. '000) 8,481.57 2,666.24 1,468.25 928.35 447.54 135.69
Scheme Return (% CAGR) 19.57 15.27 15.70 17.55 14.74 25.60
Nifty 50 Index (% CAGR) 12.84 9.86 10.28 11.37 8.75 18.01
Past performance may or may not be sustained in future*Inception date is 28 Oct 2004. **Scheme benchmark is Nifty Free Float Midcap 100 Index.
ICICI Prudential Midcap Fund
10 year SIP
5 year SIP
3 year SIP
1 year SIP
SIP Investments Since Inception
SIP*
7 yearSIP
Total Amount Invested (Rs. '000) 1,510 1,200 840 600 360 120
Market Value as on Month End (Rs. '000) 4,831.05 3,198.09 1,852.43 1,163.02 480.03 142.45
Scheme Return (% CAGR) 17.17 18.66 22.25 26.91 19.72 37.15
Scheme** Benchmark Return (% CAGR) 15.62 16.23 18.53 23.47 22.58 40.84
Nifty 50 Index (% CAGR) 10.76 9.86 10.28 11.37 8.75 18.01
Past performance may or may not be sustained in future*Inception date is 31 Aug 2005. **Scheme benchmark is Nifty Infrastructure Index.
ICICI Prudential Infrastructure Fund
10 year SIP
5 year SIP
3 year SIP
1 year SIP
SIP Investments Since Inception
SIP*
7 yearSIP
Total Amount Invested (Rs. '000) 1,410 1,200 840 600 360 120
Market Value as on Month End (Rs. '000) 2,827.40 2,077.89 1,329.98 910.88 442.20 140.83
Scheme Return (% CAGR) 11.27 10.60 12.93 16.77 13.90 34.35
Scheme** Benchmark Return (% CAGR) 2.37 2.04 4.71 7.77 6.62 26.76
Nifty 50 Index (% CAGR) 10.06 9.86 10.28 11.37 8.75 18.01
ICICI Prudential Long Term Equity Fund (Tax Saving)
Past performance may or may not be sustained in future*Inception date is 19 Aug 1999. **Scheme benchmark is Nifty 500 Index.
10 year SIP
5 year SIP
3 year SIP
1 year SIP
Since Inception
SIP*
SIP Investments15 year
SIP7 Year
SIP
Total Amount Invested (Rs. '000) 2,130 1,800 1,200 840 600 360 120
Market Value as on Month End (Rs. '000) 18,796.95 10,148.41 2,882.95 1,532.40 957.06 438.59 132.79
Scheme Return (% CAGR) 21.37 20.69 16.73 16.91 18.80 13.33 20.74
Scheme** Benchmark Return (% CAGR) 14.48 14.38 11.56 12.79 15.01 12.87 25.09
Nifty 50 Index (% CAGR) 13.10 13.18 9.86 10.28 11.37 8.75 18.01
Returns shown for Growth Option as on 30 April, 2017

119
Benefits of Systematic Investment Plan (SIP) - SIP Performance of Select Schemes
ICICI Prudential Nifty Next 50 Index Fund
Past performance may or may not be sustained in future*Inception date is 25 Jun 2010. **Scheme benchmark is Nifty Next 50 Index.
SIP Investments Since Incep-tion SIP*
5 yearSIP
3 yearSIP
1 yearSIP
Total Amount Invested (Rs. '000) 830 600 360 120
Market Value as on Month End (Rs. '000) 1,598.91 1,043.97 489.97 142.76
Scheme Return (% CAGR) 18.68 22.40 21.20 37.68
Scheme** Benchmark Return (% CAGR) 18.63 22.20 20.49 35.20
Nifty 50 Index (% CAGR) 10.31 11.37 8.75 18.01
ICICI Prudential US Bluechip Equity Fund
Past performance may or may not be sustained in future*Inception date is 06 Jul 2012. **Scheme benchmark is S&P 500 Index.
SIP Investments Since Incep-tion SIP*
3 yearSIP
1 yearSIP
Total Amount Invested (Rs. '000) 580 360 120
Market Value as on Month End (Rs. '000) 772.06 409.29 125.68
Scheme Return (% CAGR) 11.84 8.56 9.07
Scheme** Benchmark Return (% CAGR) 12.46 9.18 7.96
Nifty 50 Index (% CAGR) 11.25 8.76 17.99
ICICI Prudential Banking & Financial Services Fund
Past performance may or may not be sustained in future*Inception date is 22 Aug 2008. **Scheme benchmark is S&P BSE BANKEX.
7 year SIP
SIP Investments5 year
SIP3 year
SIP1 year
SIP
Since Inception
SIP*
Total Amount Invested (Rs. '000) 1,050 840 600 360 120
Market Value as on Month End (Rs. '000) 3,065.41 1,951.96 1,190.27 535.64 150.26
Scheme Return (% CAGR) 23.56 23.73 27.89 27.74 50.86
Scheme** Benchmark Return (% CAGR) 16.59 15.36 17.95 16.08 33.85
Nifty 50 Index (% CAGR) 10.83 10.28 11.37 8.75 18.01
ICICI Prudential Technology Fund
Past performance may or may not be sustained in future*Inception date is 03 Mar 2000. **Scheme benchmark is S&P BSE Information Technology Index
10 year SIP
5 year SIP
3 year SIP
1 year SIP
Since Inception
SIP*
SIP Investments15 year
SIP7 Year
SIP
Total Amount Invested (Rs. '000) 2,060 1,800 1,200 840 600 360 120
Market Value as on Month End (Rs. '000) 9,733.65 7,124.09 2,627.98 1,331.57 785.25 358.88 118.01
Scheme Return (% CAGR) 16.16 16.67 15.00 12.96 10.74 -0.20 -3.12
Scheme** Benchmark Return (% CAGR) 11.36 11.95 9.89 6.80 4.51 -5.98 -14.65
Nifty 50 Index (% CAGR) 13.30 13.18 9.86 10.28 11.37 8.75 18.01
ICICI Prudential FMCG Fund
Past performance may or may not be sustained in future*Inception date is 31 Mar 1999. **Scheme benchmark is Nifty FMCG Index.
10 year SIP
5 year SIP
3 year SIP
1 year SIP
Since Inception
SIP*
SIP Investments15 year
SIP7 year
SIP
Total Amount Invested (Rs. '000) 2,180 1,800 1,200 840 600 360 120
Market Value as on Month End (Rs. '000) 18,829.31 11,388.28 3,193.07 1,544.93 873.03 442.63 132.68
Scheme Return (% CAGR) 20.64 21.99 18.63 17.13 15.04 13.97 20.55
Scheme** Benchmark Return (% CAGR) 15.79 17.69 16.71 14.27 11.05 10.44 17.96
Nifty 50 Index (% CAGR) 13.08 13.18 9.86 10.28 11.37 8.75 18.01
ICICI Prudential Dividend Yield Equity Fund
Past performance may or may not be sustained in future*Inception date is 16 May 2014. **Scheme benchmark is Nifty Dividend Opportunities 50 Index.
SIP Investments Since Inception SIP*
Past performance may or may not be sustained in future*Inception date is 26 Feb 2002.
ICICI Prudential Nifty Index Fund
Past performance may or may not be sustained in future*Inception date is 28 May 2009. **Scheme benchmark is S&P BSE 100 Index.
ICICI Prudential Select Large Cap Fund
7 year SIP
SIP Investments5 year
SIP3 year
SIP1 year
SIP
Since Inception
SIP*
Total Amount Invested (Rs. '000) 960 840 600 360 120
Market Value as on Month End (Rs. '000) 1,618.19 1,335.54 859.81 423.11 130.28
Scheme Return (% CAGR) 12.75 13.04 14.42 10.84 16.57
Scheme** Benchmark Return (% CAGR) 10.62 11.07 12.56 10.22 20.68
Nifty 50 Index (% CAGR) 9.99 10.28 11.37 8.75 18.01
ICICI Prudential Balanced Fund
Past performance may or may not be sustained in future*Inception date is 03 Nov 1999. **Scheme benchmark is Crisil Balanced Fund - Index Aggressivestart date - 30-Mar-02.The existing Crisil Balanced Fund Index has been renamed to Crisil Balanced Fund - Aggressive Index' w.e.f. 4th April 2016 as per 'Crisil Indices- Annual Criteria Review-2016.
10 year SIP
5 year SIP
3 year SIP
1 year SIP
Since Inception
SIP*
SIP Investments15 year
SIP7 year
SIP
Total Amount Invested (Rs. '000) 2,100 1,800 1,200 840 600 360 120
Market Value as on Month End (Rs. '000) 10,745.70 7,130.13 2,770.09 1,567.87 958.55 453.08 133.67
Scheme Return (% CAGR) 16.58 16.68 15.99 17.55 18.87 15.61 22.21
Scheme** Benchmark Return (% CAGR) NA 11.38 9.79 10.19 11.01 9.30 14.24
Nifty 50 Index (% CAGR) 13.18 13.18 9.86 10.28 11.37 8.75 18.01
1 Year T Bill (% CAGR) 71.67 6.36 6.85 7.33 7.38 7.23 6.11
ICICI Prudential Balanced Advantage Fund
Past performance may or may not be sustained in future*Inception date is 30 Dec 2006. **Scheme benchmark is Crisil Balanced Fund - Aggressive Index.The existing Crisil Balanced Fund Index has been renamed to Crisil Balanced Fund - Aggressive Index' w.e.f. 4th April 2016 as per 'Crisil Indices- Annual Criteria Review-2016.
10 year SIP
5 year SIP
3 year SIP
1 year SIP
SIP Investments Since Inception
SIP*
7 yearSIP
Total Amount Invested (Rs. '000) 1,250 1,200 840 600 360 120
Market Value as on Month End (Rs. '000) 2,600.66 2,448.85 1,399.38 863.25 427.96 128.99
Scheme Return (% CAGR) 13.45 13.68 14.36 14.58 11.62 14.45
Scheme** Benchmark Return (% CAGR) 9.73 9.79 10.19 11.01 9.30 14.24
Nifty 50 Index (% CAGR) 9.76 9.86 10.28 11.37 8.75 18.01
ICICI Prudential Child Care Plan (Gift Plan)
Past performance may or may not be sustained in future*Inception date is 31 Aug 2001. **Scheme benchmark is Crisil Balanced Fund - Index Aggressivestart date - 30-Mar-02.The existing Crisil Balanced Fund Index has been renamed to Crisil Balanced Fund - Aggressive Index' w.e.f. 4th April 2016 as per 'Crisil Indices- Annual Criteria Review-2016.
10 year SIP
5 year SIP
3 year SIP
1 year SIP
Since Inception
SIP*
SIP Investments15 year
SIP7 Year
SIP
Total Amount Invested (Rs. '000) 1,890 1,800 1,200 840 600 360 120
Market Value as on Month End (Rs. '000) 7,654.90 6,560.91 2,599.54 1,475.21 936.09 437.79 131.68
Scheme Return (% CAGR) 16.07 15.73 14.80 15.84 17.89 13.20 18.89
Scheme** Benchmark Return (% CAGR) NA 11.38 9.79 10.19 11.01 9.30 14.24
Nifty 50 Index (% CAGR) 13.53 13.18 9.86 10.28 11.37 8.75 18.01
10 year SIP
5 year SIP
3 year SIP
1 year SIP
Since Inception
SIP*
SIP Investments15 year
SIP7 Year
SIP
Total Amount Invested (Rs. '000) 1,830 1,800 1,200 840 600 360 120
Market Value as on Month End (Rs. '000) 5,983.82 5,711.49 2,061.47 1,233.79 808.60 412.46 131.10
Scheme Return (% CAGR) 14.22 14.13 10.45 10.82 11.92 9.09 17.93
Nifty 50 Index (% CAGR) 13.27 13.18 9.86 10.28 11.37 8.75 18.01
3 year SIP
1 year SIP
Total Amount Invested (Rs. '000) 360 360 120
Market Value as on Month End (Rs. '000) 466.11 466.11 141.86
Scheme Return (% CAGR) 17.63 17.63 36.13
Scheme** Benchmark Return (% CAGR) 9.85 9.85 22.59
Nifty 50 Index (% CAGR) 8.60 8.60 18.01
Returns shown for Growth Option as on 30 April, 2017

120
Benefits of Systematic Investment Plan (SIP) - SIP Performance of Select Schemes
ICICI Prudential Child Care Plan (Study Plan)
Past performance may or may not be sustained in future*Inception date is 31 Aug 2001. **Scheme benchmark is Crisil MIP Blended Index start date -30-Mar-02 and start date of 10 year GSEC Benchmark is 01st Sept 2001.
Disclaimer of IISL: The “ICICI Prudential Nifty Index Fund/ICICI Prudential Nifty iWIN ETF/ICICI Prudential NV20 iWIN ETF/ICICI Prudential Nifty Next 50 Index Fund/ICICI Prudential Midcap Fund/ICICI Prudential Nifty 100 iWIN ETF” offered by “ICICI Prudential Mutual Fund/ICICI Prudential Asset Management Company Limited” or its affiliates is not sponsored, endorsed, sold or promoted by India Index Services & Products Limited (IISL) and its affiliates. IISL and its affiliates do not make any representation or warranty, express or implied (including warranties of merchantability or fitness for particular purpose or use) to the owners of “ICICI Prudential Nifty Index Fund/ICICI Prudential Nifty iWIN ETF/ICICI Prudential NV20 iWIN ETF/ICICI Prudential Nifty Next 50 Index Fund/ICICI Prudential Midcap Fund/ICICI Prudential Nifty 100 iWIN ETF” or any member of the public regarding the advisability of investing in securities generally or in the ”ICICI Prudential Nifty Index Fund/ICICI Prudential Nifty iWIN ETF/ICICI Prudential NV20 iWIN ETF/ICICI Prudential Nifty Next 50 Index Fund/ICICI Prudential Midcap Fund/ICICI Prudential Nifty 100 iWIN ETF” linked to Nifty 50 Index/ /Nifty Next 50 Index/Nifty Free Float Midcap 100 Index/Nifty 100 Index or particularly in the ability of the Nifty 50 Index/Nifty50 Value 20 Index Nifty50 Value 20 Index/Nifty Next 50 Index/Nifty Free Float Midcap 100 Index/ Nifty 100 Index to track general stock market performance in India. Please read the full Disclaimers in relation to the Nifty 50 Index/ /Nifty Next 50 Index/Nifty Free Float Midcap 100 Index/Nifty 100 Index in the respective Scheme Information Nifty50 Value 20 IndexDocument.
Disclaimer by the National Stock Exchange of India Limited : It is to be distinctly understood that the permission given by National Stock Exchange of India Limited (NSE) should not in any way be deemed or construed that the Scheme Information Document has been cleared or approved by NSE nor does it certify the correctness or completeness of any of the contents of the Scheme Information Document. The investors are advised to refer to the Scheme Information Document for the full text of the ‘Disclaimer Clause of NSE’.
Disclaimer by the BSE Limited: It is to be distinctly understood that the permission given by BSE Limited should not in any way be deemed or construed that the SID has been cleared or approved by BSE Limited nor does it certify the correctness or completeness of any of the contents of the SID. The investors are advised to refer to the SID for the full text of the Disclaimer Clause of the BSE Limited.
Disclaimer by AIPL for ICICI Prudential Sensex iWIN ETF and ICICI Prudential Midcap Select iWIN ETF: “The "S&P BSE Sensex and S&P BSE Midcap Select Index" is a product of AIPL, a joint venture among affiliates of S&P Dow Jones Indices LLC (“SPDJI”) and BSE Limited (“BSE”), and has been licensed for use by ICICI Prudential Asset Management Company Limited. Standard & Poor’s® and S&P® are registered trademarks of Standard & Poor’s Financial Services LLC (“S&P”); BSE® and SENSEX® are registered trademarks of BSE Limited; Dow Jones® is a registered trademark of Dow Jones Trademark Holdings LLC (“Dow Jones”); and these trademarks have been licensed for use by AIPL and sublicensed for certain purposes by ICICI Prudential Asset Management Company Limited. ICICI Prudential Sensex iWIN ETF and ICICI Prudential Midcap Select iWIN ETF is not sponsored, endorsed, sold or promoted by SPDJI, BSE, Dow Jones, S&P or their respective affiliates and none of such parties make any representation regarding the advisability of investing in such product(s) nor do they have any liability for any errors, omissions, or interruptions of the SENSEX.”
“The "S&P BSE Sensex and S&P BSE Midcap Select Index" (the “Index”) is published by Asia Index Private Limited (“AIPL”), which is a joint venture among affiliates of S&P Dow Jones Indices LLC (“SPDJI”) and BSE Limited (“BSE”), and has been licensed for use by ICICI Prudential Asset Management Company Limited (“Licensee”). Standard & Poor’s® and S&P® are registered trademarks of Standard & Poor’s Financial Services LLC (“S&P”) and Dow Jones® is a registered trademark of Dow Jones Trademark Holdings LLC (“Dow Jones”). BSE® and SENSEX® are registered trademarks of BSE. The trademarks have been licensed to AIPL and have been sublicensed for use for certain purposes by Licensee. Licensee’s ICICI Prudential Sensex iWIN ETF and ICICI Prudential Midcap Select iWIN ETF” (the “Product”) is/are not sponsored, endorsed, sold or promoted by AIPL, SPDJI, Dow Jones, S&P, any of their respective affiliates (collectively, “S&P Dow Jones Indices”) or BSE. None of AIPL, S&P Dow Jones Indices or BSE makes any representation or warranty, express or implied, to the owners of the Product or any member of the public regarding the advisability of investing in securities generally or in the Product particularly or the ability of the Index to track general market performance. AIPL’s, S&P Dow Jones Indices’ and BSE’s only relationship to Licensee with respect to the Index is the licensing of the Index and certain trademarks, service marks and/or trade names of AIPL, S&P Dow Jones Indices, BSE and/or their licensors. The "S&P BSE Sensex and S&P BSE Midcap Select Index" is determined, composed and calculated by AIPL or its agent without regard to Licensee or the Product. None of AIPL, S&P Dow Jones Indices or BSE are responsible for and have not participated in the determination of the prices, and amount of the Product or the timing of the issuance or sale of the Product or in the determination or calculation of the equation by which the Product is to be converted into cash, surrendered or redeemed, as the case may be. AIPL, S&P Dow Jones Indices and BSE have no obligation or liability in connection with the administration, marketing or trading of the Product. There is no assurance that investment products based on the Index will accurately track index performance or provide positive investment returns. AIPL and S&P Dow Jones Indices LLC are not investment advisors. Inclusion of a security within an index is not a recommendation by AIPL, S&P Dow Jones Indices or BSE to buy, sell, or hold such security, nor is it considered to be investment advice. AIPL, S&P DOW JONES INDICES, BSE AND THEIR THIRD PARTY LICENSORS DO NOT GUARANTEE THE ADEQUACY, ACCURACY, TIMELINESS AND/OR THE COMPLETENESS OF THE INDEX OR ANY DATA RELATED THERETO. AIPL, S&P DOW JONES INDICES, BSE AND THEIR THIRD PARTY LICENSORS SHALL NOT BE SUBJECT TO ANY DAMAGES OR LIABILITY FOR ANY ERRORS, OMISSIONS, OR DELAYS THEREIN. AIPL, S&P DOW JONES INDICES, BSE AND THEIR THIRD PARTY LICENSORS MAKE NO EXPRESS OR IMPLIED WARRANTIES, AND EXPRESSLY DISCLAIM ALL WARRANTIES, OF MERCHANTABILITY OR FITNESS FOR A PARTICULAR PURPOSE OR USE OR AS TO RESULTS TO BE OBTAINED BY LICENSEE, OWNERS OF THE PRODUCT, OR ANY OTHER PERSON OR ENTITY FROM THE USE OF THE INDEX OR WITH RESPECT TO ANY DATA RELATED THERETO. WITHOUT LIMITING ANY OF THE FOREGOING, IN NO EVENT WHATSOEVER SHALL AIPL, S&P DOW JONES INDICES, BSE OR THEIR THIRD PARTY LICENSORS BE LIABLE FOR ANY INDIRECT, SPECIAL, INCIDENTAL, PUNITIVE, OR CONSEQUENTIAL DAMAGES INCLUDING BUT NOT LIMITED TO, LOSS OF PROFITS, TRADING LOSSES, LOST TIME OR GOODWILL, EVEN IF THEY HAVE BEEN ADVISED OF THE POSSIBLITY OF SUCH DAMAGES, WHETHER IN CONTRACT, TORT, STRICT LIABILITY, OR OTHERWISE. THERE ARE NO THIRD PARTY BENEFICIARIES OF ANY AGREEMENTS OR ARRANGEMENTS BETWEEN AIPL AND LICENSEE, OTHER THAN THE LICENSORS OF AIPL (INCLUDING S&P DOW JONES INDICES AND/OR BSE).”
Single plan structure for the schemes of the Fund:W.e.f. October 1, 2012 fresh subscriptions/switch-ins are accepted only under a single plan for all the schemes. Fresh subscriptions / switch-ins in other plans of the schemes shall not be accepted w.e.f. October 1, 2012. However, such plans will continue till the existing investors remain invested in the plan.
Note Pertaining to Direct Plan ,which was introduced w.e.f. 1st Jan 2013 :Direct Plan is only for investors who purchase /subscribe Units in a Scheme directly with the Fund. Direct Plan shall be the default Plan. Thus, if the Purchase/ Switch application does not specifically state the details of the plan then the same shall be processed under the Direct Plan if no distributor code is mentioned in the application. Otherwise it shall be processed under the Other than Direct plan.
10 year SIP
5 year SIP
3 year SIP
1 year SIP
Since Inception
SIP*
SIP Investments15 year
SIP7 year
SIP
Total Amount Invested (Rs. '000) 1,890 1,800 1,200 840 600 360 120
Market Value as on Month End (Rs. '000) 5,791.75 5,219.37 2,474.70 1,418.48 882.71 434.86 127.84
Scheme Return (% CAGR) 13.03 13.08 13.88 14.74 15.49 12.74 12.56
Scheme** Benchmark Return (% CAGR) NA 8.65 9.00 9.60 10.09 9.73 8.77
10 Year G Sec (% CAGR) NA 6.79 7.44 8.21 8.81 9.49 5.62
10 year SIP
5 year SIP
3 year SIP
1 year SIP
SIP Investments Since Inception
SIP*
7 yearSIP
Total Amount Invested (Rs. '000) 1,580 1,200 840 600 360 120
Market Value as on Month End (Rs. '000) 3,321.06 2,122.21 1,276.09 820.30 428.92 128.37
Scheme Return (% CAGR) 10.65 11.00 11.77 12.51 11.78 13.44
Scheme** Benchmark Return (% CAGR) 8.70 9.00 9.60 10.09 9.73 8.77
10 Year G Sec (% CAGR) 7.04 7.44 8.21 8.81 9.49 5.62
Past performance may or may not be sustained in future*Inception date is 30 Mar 2004. **Scheme benchmark is Crisil MIP Blended Index.
ICICI Prudential MIP 25(An open ended Income fund. Monthly income is not assured and is subject to the availability of distributable surplus.) ICICI Prudential Monthly Income Plan
(An open ended income fund. Monthly income is not assured and is subject to the availability of distributable surplus.)
Past performance may or may not be sustained in future*Inception date is 10 Nov 2000. **Scheme benchmark is Crisil MIP Blended Index start date -30-Mar-02 and start date of 10 year GSEC Benchmark is 01st Sept 2001
10 year SIP
5 year SIP
3 year SIP
1 year SIP
Since Inception
SIP*
SIP Investments15 year
SIP7 year
SIP
Total Amount Invested (Rs. '000) 1,980 1,800 1,200 840 600 360 120
Market Value as on Month End (Rs. '000) 4,539.97 3,793.13 1,972.04 1,202.82 780.74 415.82 126.48
Scheme Return (% CAGR) 9.35 9.33 9.61 10.11 10.51 9.65 10.36
Scheme** Benchmark Return (% CAGR) NA 8.65 9.00 9.60 10.09 9.73 8.77
10 Year G Sec (% CAGR) NA 6.79 7.44 8.21 8.81 9.49 5.62
ICICI Prudential Regular Income Fund(An open ended income fund. Income is not assured and is subject to the availability of distributable surplus.)
Past performance may or may not be sustained in future*Inception date is 03 May 2011. **Scheme benchmark is Crisil MIP Blended Index.
SIP Investments Since Incep-tion SIP*
5 yearSIP
3 yearSIP
1 yearSIP
Total Amount Invested (Rs. '000) 720 600 360 120
Market Value as on Month End (Rs. '000) 953.85 761.91 414.88 125.27
Scheme Return (% CAGR) 9.29 9.53 9.49 8.39
Scheme** Benchmark Return (% CAGR) 9.94 10.09 9.73 8.77
10 Year G Sec (% CAGR) 8.58 8.81 9.49 5.62
Returns shown for Growth Option as on 30 April, 2017

6979121
ANNEXURE -I
% of exposure to Total Debt HoldingsIssuer Name
Details of exposure across all Debt Funds of ICICI Prudential Mutual Fund as on 30-April-2017 i.e as a % of total debt holdings
Monte Carlo Fashions Ltd. 0.02%Motilal Oswal Financial Services Ltd. 0.06%Motilal Oswal Securities Ltd. 0.08%Murugappa Holdings Ltd. 0.04%Muthoot Finance Ltd. 0.08%NABHA Power Ltd. 0.13%NABARD 4.09%National Highways Authority of India 0.08%National Housing Bank 0.06%Navneet Education Ltd. 0.09%NHPC Ltd. 0.18%Nirchem Cement Ltd. 0.30%Nirma Ltd. 0.16%Nomura Capital (India) Pvt. Ltd. 0.09%NRB Bearings Ltd. 0.04%NTPC Ltd. 0.15%Nuclear Power Corporation of India Ltd. 0.22%ONGC Mangalore Petro Chemicals Ltd. 0.44%Oriental Bank Of Commerce 0.80%Parry Sugars Refinery India Private Ltd. (Subsidiary of E.I.D - Parry (India) Limited) 0.17%Patel KNR Heavy Infrastructures Ltd. (National Highways Authority of India Project) 0.04%Piramal Enterprises Ltd. 0.42%Piramal Finance Ltd. 1.12%Power Finance Corporation Ltd. 4.47%Power Grid Corporation Of India Ltd. 0.52%Prestige Estates Projects Ltd. 0.19%Prime Publishing Pvt. Ltd. 0.06%Prism Cement Ltd. 0.20%Promont Hillside Private Ltd. (Subsidiary of Tata Housing Development Co. Ltd) 0.14%Pune Solapur Expressway Pvt. Ltd. 0.12%PVR Ltd. 0.15%Quess Corp Ltd. 0.05%The Ramco Cements Ltd. 0.18%RBL Bank Ltd. 0.13%Redington (India) Ltd. 0.06%Reliance Capital Ltd. 0.40%Reliance Gas Transportation Ltd. 0.30%Reliance Home Finance Ltd. 0.12%Reliance Industries Ltd. 0.62%Reliance Jio Infocomm Ltd. 0.44%Reliance Ports & Terminals Ltd. 0.11%Reliance Utilities & Power Private Ltd. 0.49%RSPL Ltd. 0.06%Rural Electrification Corporation Ltd. 1.49%Sadbhav Infrastucture Project Ltd. 0.10%Samvardhana Motherson International Ltd. (Secured by pledge of equity shares 0.24%of Motherson Sumi Systems Ltd)Sansar Trust September 2016 V 0.15%Seagull Trust I 0.11%Shriram Industrial Holdings Ltd. 0.20%Shriram Transport Finance Company Ltd. 0.23%Silica Ceramica Pvt. Ltd. 0.05%Small Industries Development Bank Of India 0.97%Sneha Gardens Private Ltd. (Secured by pledge of equity shares of Emami Ltd) 0.01%Sneha Niketan Private Ltd. (Secured by pledge of equity shares of Emami Ltd) 0.01%Somany Ceramics Ltd. 0.02%SP Jammu Udhampur Highway Ltd. 0.09%SRF Ltd. 0.03%Standard Chartered Investment & Loan (India) Ltd. 0.28%State Bank Of India 0.55%State Development Loan 7.51%Steel Authority Of India Ltd. 0.09%Sun Pharma Laboratories Ltd. 0.26%Sundaram BNP Paribas Home Finance Ltd. 0.08%Sundaram Finance Ltd. 0.04%Suntrack Commerce Private Ltd. (Secured by pledge of equity shares of Emami Ltd) 0.09%Suraj Viniyog Pvt. Ltd. 0.01%Suraksha Realty Ltd. 0.04%Talwandi Sabo Power Ltd. 0.31%TATA Advanced Materials Ltd. 0.05%Tata Capital Financial Services Ltd. 0.96%Tata Capital Housing Finance Ltd. 0.23%Tata Capital Ltd. 0.06%Tata Housing Development Company Ltd. 0.19%Tata Industries Ltd. 0.08%Tata Motors Finance Ltd. 0.59%Tata Motors Finance Solutions Pvt. Ltd. 0.23%Tata Motors Ltd. 0.22%Tata Power Company Ltd. 0.22%Tata Power Renewable Energy Ltd. 0.18%Tata Power Solar Systems Ltd. 0.03%Tata Realty & Infrastructure Ltd. 0.15%Tata Sons Ltd. 0.91%Tata Steel Ltd. 1.16%Tata Value Homes Ltd. 0.12%Techno Electric & Engineering Company Ltd. 0.02%TGS Investment & Trade Pvt. Ltd. 0.16%The Great Eastern Shipping Company Ltd. 0.49%The Indian Hotels Company Ltd. 0.13%The South Indian Bank Ltd. 0.59%Thomas Cook (India) Ltd. 0.08%Toyota Financial Services India 0.03%Transport Corporation Of India Ltd. 0.01%Trapti Trading & Investments Pvt. Ltd. 0.11%Trent Ltd. 0.07%Tube Investments of India Ltd. (A Murugappa Group company) 0.09%Turquoise Investments & Finance Private Ltd. 0.05%TVS Credit Services Ltd. 0.09%Ujjivan Financial Services Ltd. 0.12%Ultratech Cement Ltd. 0.04%United Spirits Ltd. 0.38%Vardhman Textiles Ltd. 0.37%Vedanta Ltd. 2.69%Viacom18 Media Pvt. Ltd. 0.06%Vodafone India Ltd. 0.43%Vodafone Mobile Services Ltd. 2.18%Volkswagen Finance Pvt. Ltd. 0.34%Welspun Renewables Energy Pvt Ltd. 0.37%
INDUSTRY/SECTOR % of exposure to Total Debt AUM
Banks 17.69%Cash (CBLO & Reverse Repo) 1.82%Corporates 24.61%Financial Services 16.50%GOI & Tbills 19.37%NBFC 18.61%Real Estate 1.40%
Adani Ports and Special Economic Zone Ltd. 0.32%Aditya Birla Fashion and Retail Limited 0.33%Aditya Birla Finance Ltd. 0.90%Aditya Birla Financial Services Ltd. 0.18%Afcons Infrastructure Ltd. (A Shapoorji Pallonji Group company) 0.13%Airports Authority Of India 0.05%Ambadi Investments Private Ltd. 0.01%Amri Hospitals Ltd (Secured by pledge of equity shares of Emami Ltd) 0.08%Andhra Bank 0.01%AP Expressway Ltd. 0.02%Anjani Portland Cement Ltd. (A Chettinad Cement Corporation Ltd Group company) 0.04%Arvind Lifestyle Brands Ltd. 0.02%Arvind Ltd. 0.12%Ashok Leyland Ltd. 0.03%Ashoka Buildcon Ltd. 0.03%Asian Satellite Broadcast Pvt. Ltd. (Promoter company of Essel Group) 0.05%Aspire Home Finance Corporation Ltd. (Subsidiary of Motilal Oswal Group) 0.19%Au Small Finance Bank Ltd. 0.28%Avenue Supermarts Ltd. (D-Mart) 0.24%Axis Bank Ltd. 1.73%Axis Finance Ltd. 0.17%Bahadur Chand Investments Private Ltd. (A Hero Group company) 0.71%Bajaj Finance Ltd. 1.26%Barclays Investments & Loans (India) Ltd. 0.12%BASF India Ltd. 0.23%Bharat Aluminium Co. Ltd. 0.10%Bharat Financial Inclusion Ltd. 0.19%Bharti Airtel Ltd. 0.62%Birla TMT Holdings Pvt. Ltd. 0.05%Blue Dart Express Ltd. 0.12%BMW India Financial Services Ltd. 0.19%Bombay Burmah Trading Corporation Ltd. 0.06%Can Fin Homes Ltd. 0.05%Cargill India Pvt. Ltd. 0.05%CCIL 1.82%Century Textiles & Industries Ltd. 0.19%Cholamandalam Investment And Finance Company Ltd. 0.43%Citicorp Finance (India) Ltd. 0.00%Clp Wind Farms (India) Pvt. Ltd. 0.29%Coffee Day Enterprises Pvt. Ltd. (Secured by pledge of equity shares of Mindtree Ltd.) 0.21%Credit Suisse AG-Mumbai Branch 0.49%Crompton Greaves Consumer Electricals Ltd. 0.15%Daimler Financial Services India Pvt. Ltd. 0.46%Deutsche Bank 0.22%Deutsche Investments India Pvt. Ltd. 0.18%Dewan Housing Finance Corporation Ltd. 0.47%ECL Finance Ltd. 0.43%Edelweiss Asset Reconstruction Company Ltd. 0.02%Edelweiss Commodities Services Ltd. 0.31%Emami Infrastructure Ltd. (secured by pledge of equity shares of Emami Ltd.) 0.08%Emami Ltd. 0.03%Equitas Finance Ltd. 0.12%Equitas Small Finance Bank Ltd. 0.06%Essel Mining & Industries Ltd. (A Birla Group company) 0.32%Essel Propack Ltd. 0.03%Export-Import Bank Of India 1.32%Food Corporation Of India 0.00%Ford Credit India Pvt. Ltd. 0.03%Fullerton India Credit Co. Ltd. 0.13%Geetanjali Trading & Investments Pvt. Ltd. (Promoter company of Asian Paints) 0.08%Gmmco Ltd. 0.05%Godrej & Boyce Mfg. Co. Ltd. 0.29%Godrej Properties Ltd. 0.10%Government Securities 11.85%Gruh Finance Ltd. 0.15%Gujarat Narmada Valley Fertilizers and Chemicals Ltd. 0.06%HDB Financial Services Ltd. 0.32%HDFC Bank Ltd. 4.05%Hindalco Industries Ltd. 0.13%Hinduja Leyland Finance Ltd. 0.19%Hindustan Zinc Ltd. 0.93%HDFC Ltd. 6.10%HPCL - Mittal Pipelines Ltd. 0.07%ICICI Bank Ltd. 0.53%ICICI Home Finance Company Ltd. 0.22%IDBI Bank Ltd. 0.05%IDFC Bank Ltd. 1.92%IIFL Wealth Finance Ltd. 0.19%IL&FS Financial Services Ltd. 0.02%Incline Realty Pvt. Ltd. (A Oberoi Group company) 0.47%India Infoline Finance Ltd. 0.61%India Infoline Housing Finance Ltd. 0.31%Indiabulls Housing Finance Ltd. 1.15%Indian Hospital Corporation Ltd. (Secured by pledge of equity shares of Apollo Hospitals) 0.22%Indian Railway Finance Corporation Ltd. 0.08%Indostar Capital Finance Ltd. 0.02%Indus Towers Limited 0.09%IndusInd Bank Ltd. 0.71%Infina Finance Pvt. Ltd. 0.02%Inox Air Products Ltd. 0.22%Jagran Prakashan Ltd. 0.04%Janalakshmi Financial Services Ltd. 0.07%Jhajjar Power Ltd. (A CLP Group company) 0.13%JPL 0.06%Jindal Steel & Power Ltd. 0.10%JK Tyre & Industries Ltd. 0.09%J M Financial Products Pvt. Ltd. 0.36%JM Financial Services Ltd. 0.05%JSW Steel Ltd. 0.92%Julius Baer Capital (India) Pvt. Ltd. 0.14%Kalpataru Power Transmission Ltd. 0.06%Khyati Realtors Private Ltd. 0.31%Kirloskar Ferrous Industries Ltd. 0.03%Kotak Commodity Services Pvt. Ltd. 0.02%Kotak Mahindra Bank Ltd. 0.44%Kotak Mahindra Investments Ltd. 0.37%Kotak Mahindra Prime Ltd. 0.33%Kotak Securities Ltd. 0.06%KRIBHCO Shyam Fertilizers Ltd. 0.06%Krishak Bharati Co-operative Ltd. 0.06%L&T Finance Ltd. 0.12%LIC Housing Finance Ltd. 2.00%Ma Multi-Trade Private Ltd. (Secured by pledge of equity shares of Bajaj Corp Ltd) 0.17%MFL Securitisation Trust XLII 0.06%Mahanagar Telephone Nigam Ltd. 0.28%Mahindra & Mahindra Financial Services Ltd. 0.45%Mahindra Integrated Township Ltd. 0.05%Mahindra Vehicle Manufacturers Ltd. 0.15%Mahindra World City (Jaipur) Ltd. 0.12%Manappuram Finance Ltd. 0.13%MFL Securitisation Trust XLIX 0.10%
Issuer Name% of Total Debt
Holdings

122
Dividend History
ICICI Prudential Technology Fund - Dividend
Record Date Face Value (Rs) NAV (Rs) Dividend (Rs.)/Unit
27-Feb-15 10.00 36.66 3.0019-Feb-16 10.00 30.69 1.5023-Feb-17 10.00 29.78 2.70
ICICI Prudential Indo Asia Equity Fund - Dividend
Record Date Face Value (Rs) NAV (Rs) Dividend (Rs.)/Unit
31-Oct-14 10.00 17.18 1.5030-Oct-15 10.00 17.02 1.4021-Oct-16 10.00 17.82 1.60
ICICI Prudential Dividend Yield Equity Fund - Dividend Option
Record Date Face Value (Rs) NAV (Rs) Dividend (Rs.)/Unit
22-May-15 10.00 12.02 0.4017-Jun-16 10.00 11.92 0.50
ICICI Prudential Dividend Yield Equity Fund - Direct Plan - Dividend Option
Record Date Face Value (Rs) NAV (Rs) Dividend (Rs.)/Unit
22-May-15 10.00 12.12 0.4017-Jun-16 10.00 12.10 0.50
ICICI Prudential Exports and Other Services Fund - Dividend Option
Record Date Face Value (Rs) NAV (Rs) Dividend (Rs.)/Unit
23-May-14 10.00 19.34 1.2522-May-15 10.00 28.32 2.2530-May-16 10.00 25.76 2.05
ICICI Prudential Exports and Other Services Fund - Direct Plan - Dividend
Record Date Face Value (Rs) NAV (Rs) Dividend (Rs.)/Unit
30-May-16 10.00 34.09 1.50
ICICI Prudential Infrastructure Fund - Dividend Option
Record Date Face Value (Rs) NAV (Rs) Dividend (Rs.)/Unit
14-Aug-14 10.00 15.00 1.0031-Aug-15 10.00 15.11 1.6005-Aug-16 10.00 13.90 1.13
ICICI Prudential Infrastructure Fund - Direct Plan - Dividend Option
Record Date Face Value (Rs) NAV (Rs) Dividend (Rs.)/Unit
14-Aug-14 10.00 15.16 0.4031-Aug-15 10.00 16.04 1.70
ICICI Prudential Dynamic Plan - Dividend Option
Record Date Face Value (Rs) NAV (Rs) Dividend (Rs.)/Unit
30-Oct-15 10.0000 22.3659 1.850021-Oct-16 10.0000 23.6394 2.250021-Apr-17 10.0000 23.2391 0.5500
ICICI Prudential Long Term Equity Fund (Tax Saving) - Dividend
Record Date Face Value (Rs) NAV (Rs) Dividend (Rs.)/Unit
06-Feb-15 10.00 25.84 2.0019-Feb-16 10.00 21.16 1.5003-Mar-17 10.00 25.23 2.55
Record Date Face Value (Rs) NAV (Rs) Dividend (Rs.)/Unit
ICICI Prudential Long Term Equity Fund (Tax Saving) - Direct Plan - Dividend
06-Feb-15 10.00 30.70 2.0019-Feb-16 10.00 25.73 1.5003-Mar-17 10.00 31.52 2.55
ICICI Prudential Dynamic - Direct Plan - Dividend
Record Date Face Value (Rs) NAV (Rs) Dividend (Rs.)/Unit
30-Oct-15 10.0000 22.8717 0.900021-Oct-16 10.0000 25.5173 1.250021-Apr-17 10.0000 26.4663 0.5500
ICICI Prudential Value Discovery Fund - Dividend Option
Record Date Face Value (Rs) NAV (Rs) Dividend (Rs.)/Unit20-Mar-15 10.00 35.99 3.3023-Mar-16 10.00 30.70 2.5024-Mar-17 10.00 34.03 3.10
ICICI Prudential Value Discovery Fund - Direct Plan - Dividend
Record Date Face Value (Rs) NAV (Rs) Dividend (Rs.)/Unit
20-Mar-15 10.00 44.74 1.0023-Mar-16 10.00 41.56 1.00
Record Date Face Value (Rs) NAV (Rs) Dividend (Rs.)/Unit
ICICI Prudential Multicap Fund - Dividend Option
31-Oct-14 10.00 23.65 2.0027-Nov-15 10.00 23.56 1.8529-Nov-16 10.00 23.68 2.10
ICICI Prudential Multicap Fund -Direct Plan - Dividend Option
Record Date Face Value (Rs) NAV (Rs) Dividend (Rs.)/Unit
31-Oct-14 10.00 25.43 1.0029-Nov-16 10.00 29.52 2.10
ICICI Prudential Top 100 Fund - Dividend Option
Record Date Face Value (Rs) NAV (Rs) Dividend (Rs.)/Unit
24-Apr-15 10.00 19.06 1.8129-Apr-16 10.00 16.73 1.3521-Apr-17 10.00 19.56 1.80
ICICI Prudential Top 100 Fund - Direct Plan - Dividend
Record Date Face Value (Rs) NAV (Rs) Dividend (Rs.)/Unit
24-Apr-15 10.00 22.52 1.8129-Apr-16 10.00 20.25 1.0021-Apr-17 10.00 24.77 1.80
ICICI Prudential Select Large Cap Fund - Retail Dividend
Record Date Face Value (Rs) NAV (Rs) Dividend (Rs.)/Unit
23-May-14 10.00 17.62 1.3026-Jun-15 10.00 19.13 1.5017-Jun-16 10.00 17.76 1.35
ICICI Prudential Select Large Cap Fund - Direct Plan - Dividend
Record Date Face Value (Rs) NAV (Rs) Dividend (Rs.)/Unit
17-Jun-16 10.00 23.77 0.75
ICICI Prudential Focused Bluechip Equity Fund - Direct Plan - Dividend
Record Date Face Value (Rs) NAV (Rs) Dividend (Rs.)/Unit
16-Jan-15 10.00 28.39 2.2520-Jan-17 10.00 28.75 1.20
ICICI Prudential Focused Bluechip Equity Fund - Dividend
Record Date Face Value (Rs) NAV (Rs) Dividend (Rs.)/Unit
16-Jan-15 10.00 24.28 2.2515-Jan-16 10.00 20.15 1.6020-Jan-17 10.00 21.87 2.00
ICICI Prudential Midcap Fund - Direct Plan - Dividend
Record Date Face Value (Rs) NAV (Rs) Dividend (Rs.)/Unit
21-Jan-14 10.00 16.11 1.3115-Jan-16 10.00 26.71 2.2506-Jan-17 10.00 28.91 1.95
ICICI Prudential Midcap Fund - Dividend Option
Record Date Face Value (Rs) NAV (Rs) Dividend (Rs.)/Unit
23-Jan-15 10.00 28.66 3.2515-Jan-16 10.00 23.11 2.0006-Jan-17 10.00 24.74 1.95
Record Date Face Value (Rs) NAV (Rs) Dividend (Rs.)/Unit
ICICI Prudential Monthly Income Plan (An open ended fund. Monthly income is not assured and is subject to the availability of distributable surplus.) - Monthly Dividend Option
28-Feb-17 10.0000 12.4963 0.055131-Mar-17 10.0000 12.6081 0.105728-Apr-17 10.0000 12.5994 0.0767
ANNEXURE -IIPass Through Certificates (PTC) Details
Pool PTC Details
Originator
Magma Fincorp Ltd.
Trust Details
MFL Securitisation Trust XLII
Existing MF Rating
ICRA AAA(SO)
Type of Pool
Car, CV & CE
Shriram Transport Finance Company Limited CRISIL AAA(SO)Sansar Trust September 2016 V Car, CV & CE
L&T Finance Ltd. FITCH AA+(SO)Seagull Trust I Car, CV & CE
Magma Fincorp Ltd. MFL Securitisation Trust XLIX CRISIL AAA(SO) Car, CV & CE

Dividend History
ICICI Prudential Banking and Financial Services Fund - Dividend
Record Date Face Value (Rs) NAV (Rs) Dividend (Rs.)/Unit
27-Feb-15 10.00 31.88 3.0019-Feb-16 10.00 22.95 1.0023-Feb-17 10.00 35.98 3.20
ICICI Prudential Banking and Financial Services Fund - Direct Plan - Dividend
Record Date Face Value (Rs) NAV (Rs) Dividend (Rs.)/Unit27-Feb-15 10.00 37.89 1.0023-Feb-17 10.00 49.10 3.20
ICICI Prudential FMCG Fund - Dividend
Record Date Face Value (Rs) NAV (Rs) Dividend (Rs.)/Unit
26-Dec-14 10.00 70.23 6.0004-Jan-16 10.00 68.13 5.4030-Dec-16 10.00 63.69 5.00
ICICI Prudential Growth Fund- Series 1 - Dividend
Record Date Face Value (Rs) NAV (Rs) Dividend (Rs.)/Unit
29-Apr-16 10.00 11.02 0.7529-Jul-16 10.00 11.77 0.7528-Apr-17 10.00 12.30 0.75
ICICI Prudential Growth Fund- Series 1 - Direct Dividend
Record Date Face Value (Rs) NAV (Rs) Dividend (Rs.)/Unit29-Apr-16 10.00 11.33 0.7529-Jul-16 10.00 12.17 0.7528-Apr-17 10.00 12.85 0.75
ICICI Prudential Growth Fund- Series 2 - Dividend
Record Date Face Value (Rs) NAV (Rs) Dividend (Rs.)/Unit
29-Apr-16 10.00 11.38 0.5005-Aug-16 10.00 12.38 0.7528-Apr-17 10.00 13.37 0.75
ICICI Prudential R.I.G.H.T. (Rewards of investing & generation of healthy tax savings) Fund - Dividend
Record Date Face Value (Rs) NAV (Rs) Dividend (Rs.)/Unit
25-Jul-14 10.00 21.56 1.6031-Jul-15 10.00 26.37 2.1529-Jul-16 10.00 24.34 2.00
ICICI Prudential Sensex iWIN ETF
Record Date Face Value (Rs) NAV (Rs) Dividend (Rs.)/Unit
25-Jul-14 10.0000 289.0755 27.0000
ICICI Prudential Nifty iWIN ETF
Record Date Face Value (Rs) NAV (Rs) Dividend (Rs.)/Unit
29-Apr-16 10.0000 81.1747 2.2000
ICICI Prudential Growth Fund- Series 2 - Direct Dividend
Record Date Face Value (Rs) NAV (Rs) Dividend (Rs.)/Unit
29-Apr-16 10.00 11.69 0.5005-Aug-16 10.00 12.77 0.7528-Apr-17 10.00 13.94 0.75
ICICI Prudential Growth Fund- Series 3 - Dividend
Record Date Face Value (Rs) NAV (Rs) Dividend (Rs.)/Unit17-Apr-15 10.00 11.48 0.5028-Apr-17 10.00 12.75 0.75
ICICI Prudential Growth Fund- Series 3 - Direct Dividend
Record Date Face Value (Rs) NAV (Rs) Dividend (Rs.)/Unit17-Apr-15 10.00 11.58 0.5028-Apr-17 10.00 13.24 0.75
ICICI Prudential Growth Fund - Series 4 - Dividend
Record Date Face Value (Rs) NAV (Rs) Dividend (Rs.)/Unit
29-Apr-16 10.00 11.35 0.5005-Aug-16 10.00 12.46 0.7528-Apr-17 10.00 13.12 0.75
ICICI Prudential Growth Fund - Series 4 Direct Dividend
Record Date Face Value (Rs) NAV (Rs) Dividend (Rs.)/Unit
29-Apr-16 10.00 11.62 0.5005-Aug-16 10.00 12.83 0.7528-Apr-17 10.00 13.66 0.75
ICICI Prudential FMCG Fund - Direct Plan - Dividend
Record Date Face Value (Rs) NAV (Rs) Dividend (Rs.)/Unit30-Dec-16 10.00 83.43 4.43
ICICI Prudential Balanced Advantage Fund - Dividend Option
Record Date Face Value (Rs) NAV (Rs) Dividend (Rs.)/Unit19-Sep-14 10.00 16.93 1.5030-Sep-15 10.00 16.85 1.5523-Sep-16 10.00 17.22 1.70
ICICI Prudential Balanced Advantage Fund - Direct Plan - Dividend
Record Date Face Value (Rs) NAV (Rs) Dividend (Rs.)/Unit
19-Sep-14 10.00 18.97 1.5030-Sep-15 10.00 19.30 1.7523-Sep-16 10.00 20.04 1.70
ICICI Prudential Balanced Advantage Fund - Quarterly Dividend
Record Date Face Value (Rs) NAV (Rs) Dividend (Rs.)/Unit
08-Jul-16 10.00 11.28 0.1523-Dec-16 10.00 11.17 0.2024-Mar-17 10.00 11.90 0.20
ICICI Prudential Balanced Advantage Fund - Direct Plan - Quarterly Dividend
Record Date Face Value (Rs) NAV (Rs) Dividend (Rs.)/Unit
08-Jul-16 10.00 11.61 0.1523-Dec-16 10.00 11.56 0.2024-Mar-17 10.00 12.37 0.20
ICICI Prudential Equity Income Fund - Quarterly Dividend
Record Date Face Value (Rs) NAV (Rs) Dividend (Rs.)/Unit
23-Sep-16 10.00 11.33 0.1221-Dec-16 10.00 11.15 0.1224-Mar-17 10.00 11.49 0.12
ICICI Prudential Equity Income Fund - Direct Plan - Monthly Dividend
Record Date Face Value (Rs) NAV (Rs) Dividend (Rs.)/Unit20-May-16 10.00 10.38 0.0417-Jun-16 10.00 10.55 0.0415-Jul-16 10.00 10.82 0.04
ICICI Prudential Equity Income Fund - Direct Plan - Half Yearly Dividend
Record Date Face Value (Rs) NAV (Rs) Dividend (Rs.)/Unit
30-Jul-15 10.00 10.29 0.2420-Jun-16 10.00 10.73 0.24
ICICI Prudential Equity Income Fund - Direct Plan - Quarterly Dividend
Record Date Face Value (Rs) NAV (Rs) Dividend (Rs.)/Unit
23-Sep-16 10.00 11.43 0.1221-Dec-16 10.00 11.26 0.1224-Mar-17 10.00 11.64 0.12
ICICI Prudential Equity Income Fund - Half Yearly Dividend
Record Date Face Value (Rs) NAV (Rs) Dividend (Rs.)/Unit
30-Jul-15 10.00 10.23 0.2120-Jun-16 10.00 10.61 0.24
ICICI Prudential Balanced Advantage Fund - Direct Plan - Monthly Dividend
Record Date Face Value (Rs) NAV (Rs) Dividend (Rs.)/Unit
27-Feb-17 10.00 14.78 0.0527-Mar-17 10.00 14.92 0.0528-Apr-17 10.00 15.19 0.05
ICICI Prudential Balanced Advantage Fund - Monthly Dividend
Record Date Face Value (Rs) NAV (Rs) Dividend (Rs.)/Unit
16-Feb-17 10.00 13.96 0.0516-Mar-17 10.00 14.19 0.0524-Apr-17 10.00 14.32 0.05
ICICI Prudential Equity Income Fund - Monthly Dividend
Record Date Face Value (Rs) NAV (Rs) Dividend (Rs.)/Unit03-Feb-17 10.00 11.17 0.0403-Mar-17 10.00 11.13 0.0407-Apr-17 10.00 11.20 0.04
ICICI Prudential Growth Fund - Series 5 Dividend
Record Date Face Value (Rs) NAV (Rs) Dividend (Rs.)/Unit
21-Apr-17 10.00 12.36 0.75
123
ICICI Prudential Growth Fund - Series 5 Direct Dividend
Record Date Face Value (Rs) NAV (Rs) Dividend (Rs.)/Unit
21-Apr-17 10.00 12.80 0.75
ICICI Prudential Growth Fund - Series 6 Dividend
Record Date Face Value (Rs) NAV (Rs) Dividend (Rs.)/Unit
21-Apr-17 10.00 12.05 0.75
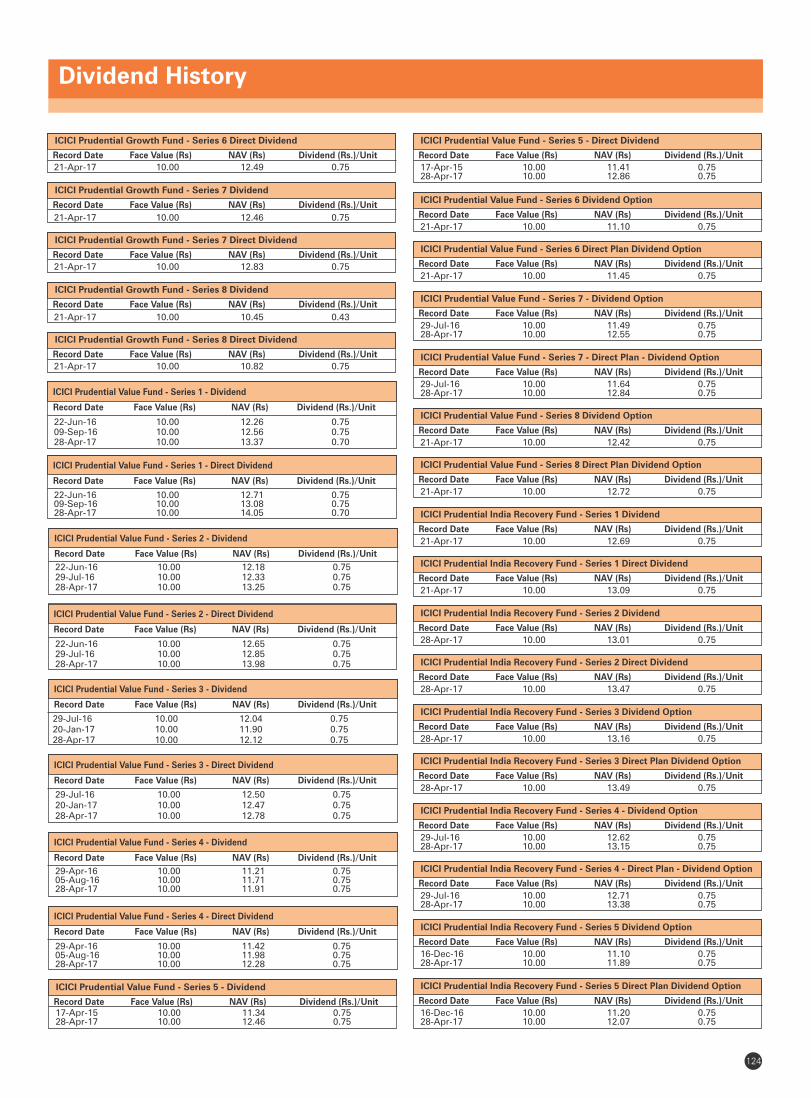
ICICI Prudential Value Fund - Series 1 - Direct Dividend
Record Date Face Value (Rs) NAV (Rs) Dividend (Rs.)/Unit
22-Jun-16 10.00 12.71 0.7509-Sep-16 10.00 13.08 0.7528-Apr-17 10.00 14.05 0.70
ICICI Prudential Value Fund - Series 1 - Dividend
Record Date Face Value (Rs) NAV (Rs) Dividend (Rs.)/Unit
22-Jun-16 10.00 12.26 0.7509-Sep-16 10.00 12.56 0.7528-Apr-17 10.00 13.37 0.70
ICICI Prudential Growth Fund - Series 6 Direct Dividend
Record Date Face Value (Rs) NAV (Rs) Dividend (Rs.)/Unit
21-Apr-17 10.00 12.49 0.75
ICICI Prudential Growth Fund - Series 7 Dividend
Record Date Face Value (Rs) NAV (Rs) Dividend (Rs.)/Unit
21-Apr-17 10.00 12.46 0.75
ICICI Prudential Growth Fund - Series 7 Direct Dividend
Record Date Face Value (Rs) NAV (Rs) Dividend (Rs.)/Unit
21-Apr-17 10.00 12.83 0.75
ICICI Prudential Growth Fund - Series 8 Dividend
Record Date Face Value (Rs) NAV (Rs) Dividend (Rs.)/Unit
21-Apr-17 10.00 10.45 0.43
ICICI Prudential Growth Fund - Series 8 Direct Dividend
Record Date Face Value (Rs) NAV (Rs) Dividend (Rs.)/Unit
21-Apr-17 10.00 10.82 0.75
ICICI Prudential Value Fund - Series 2 - Dividend
Record Date Face Value (Rs) NAV (Rs) Dividend (Rs.)/Unit
22-Jun-16 10.00 12.18 0.7529-Jul-16 10.00 12.33 0.7528-Apr-17 10.00 13.25 0.75
ICICI Prudential Value Fund - Series 2 - Direct Dividend
Record Date Face Value (Rs) NAV (Rs) Dividend (Rs.)/Unit
22-Jun-16 10.00 12.65 0.7529-Jul-16 10.00 12.85 0.7528-Apr-17 10.00 13.98 0.75
ICICI Prudential Value Fund - Series 3 - Dividend
Record Date Face Value (Rs) NAV (Rs) Dividend (Rs.)/Unit
29-Jul-16 10.00 12.04 0.7520-Jan-17 10.00 11.90 0.7528-Apr-17 10.00 12.12 0.75
ICICI Prudential Value Fund - Series 3 - Direct Dividend
Record Date Face Value (Rs) NAV (Rs) Dividend (Rs.)/Unit
29-Jul-16 10.00 12.50 0.7520-Jan-17 10.00 12.47 0.7528-Apr-17 10.00 12.78 0.75
ICICI Prudential Value Fund - Series 4 - Dividend
Record Date Face Value (Rs) NAV (Rs) Dividend (Rs.)/Unit
29-Apr-16 10.00 11.21 0.7505-Aug-16 10.00 11.71 0.7528-Apr-17 10.00 11.91 0.75
ICICI Prudential Value Fund - Series 4 - Direct Dividend
Record Date Face Value (Rs) NAV (Rs) Dividend (Rs.)/Unit
29-Apr-16 10.00 11.42 0.7505-Aug-16 10.00 11.98 0.7528-Apr-17 10.00 12.28 0.75
ICICI Prudential Value Fund - Series 5 - Dividend
Record Date Face Value (Rs) NAV (Rs) Dividend (Rs.)/Unit17-Apr-15 10.00 11.34 0.7528-Apr-17 10.00 12.46 0.75
ICICI Prudential Value Fund - Series 5 - Direct Dividend
Record Date Face Value (Rs) NAV (Rs) Dividend (Rs.)/Unit
17-Apr-15 10.00 11.41 0.7528-Apr-17 10.00 12.86 0.75
ICICI Prudential Value Fund - Series 6 Direct Plan Dividend Option
Record Date Face Value (Rs) NAV (Rs) Dividend (Rs.)/Unit
21-Apr-17 10.00 11.45 0.75
ICICI Prudential Value Fund - Series 6 Dividend Option
Record Date Face Value (Rs) NAV (Rs) Dividend (Rs.)/Unit
21-Apr-17 10.00 11.10 0.75
ICICI Prudential Value Fund - Series 7 - Dividend Option
Record Date Face Value (Rs) NAV (Rs) Dividend (Rs.)/Unit
29-Jul-16 10.00 11.49 0.7528-Apr-17 10.00 12.55 0.75
ICICI Prudential Value Fund - Series 7 - Direct Plan - Dividend Option
Record Date Face Value (Rs) NAV (Rs) Dividend (Rs.)/Unit
29-Jul-16 10.00 11.64 0.7528-Apr-17 10.00 12.84 0.75
ICICI Prudential India Recovery Fund - Series 1 Dividend
Record Date Face Value (Rs) NAV (Rs) Dividend (Rs.)/Unit
21-Apr-17 10.00 12.69 0.75
ICICI Prudential Value Fund - Series 8 Direct Plan Dividend Option
Record Date Face Value (Rs) NAV (Rs) Dividend (Rs.)/Unit
21-Apr-17 10.00 12.72 0.75
ICICI Prudential Value Fund - Series 8 Dividend Option
Record Date Face Value (Rs) NAV (Rs) Dividend (Rs.)/Unit
21-Apr-17 10.00 12.42 0.75
ICICI Prudential India Recovery Fund - Series 1 Direct Dividend
Record Date Face Value (Rs) NAV (Rs) Dividend (Rs.)/Unit
21-Apr-17 10.00 13.09 0.75
ICICI Prudential India Recovery Fund - Series 2 Dividend
Record Date Face Value (Rs) NAV (Rs) Dividend (Rs.)/Unit
28-Apr-17 10.00 13.01 0.75
ICICI Prudential India Recovery Fund - Series 4 - Dividend Option
Record Date Face Value (Rs) NAV (Rs) Dividend (Rs.)/Unit
29-Jul-16 10.00 12.62 0.7528-Apr-17 10.00 13.15 0.75
ICICI Prudential India Recovery Fund - Series 2 Direct Dividend
Record Date Face Value (Rs) NAV (Rs) Dividend (Rs.)/Unit
28-Apr-17 10.00 13.47 0.75
ICICI Prudential India Recovery Fund - Series 3 Direct Plan Dividend Option
Record Date Face Value (Rs) NAV (Rs) Dividend (Rs.)/Unit
28-Apr-17 10.00 13.49 0.75
ICICI Prudential India Recovery Fund - Series 3 Dividend Option
Record Date Face Value (Rs) NAV (Rs) Dividend (Rs.)/Unit
28-Apr-17 10.00 13.16 0.75
ICICI Prudential India Recovery Fund - Series 4 - Direct Plan - Dividend Option
Record Date Face Value (Rs) NAV (Rs) Dividend (Rs.)/Unit
29-Jul-16 10.00 12.71 0.7528-Apr-17 10.00 13.38 0.75
ICICI Prudential India Recovery Fund - Series 5 Direct Plan Dividend Option
Record Date Face Value (Rs) NAV (Rs) Dividend (Rs.)/Unit
16-Dec-16 10.00 11.20 0.7528-Apr-17 10.00 12.07 0.75
ICICI Prudential India Recovery Fund - Series 5 Dividend Option
Record Date Face Value (Rs) NAV (Rs) Dividend (Rs.)/Unit
16-Dec-16 10.00 11.10 0.7528-Apr-17 10.00 11.89 0.75
Dividend History
124

Dividend History
6979125
ICICI Prudential Balanced Fund - Direct Plan - Half Yearly Dividend
Record Date Face Value (Rs) NAV (Rs) Dividend (Rs.)/Unit
23-Dec-16 10.00 12.56 0.55
ICICI Prudential Balanced Fund - Half Yearly Dividend
Record Date Face Value (Rs) NAV (Rs) Dividend (Rs.)/Unit
23-Dec-16 10.00 12.35 0.55
ICICI Prudential Equity Arbitrage Fund - Direct Plan - Dividend
Record Date Face Value (Rs) NAV (Rs) Dividend (Rs.)/Unit
06-Jan-17 10.0000 14.5048 0.068503-Feb-17 10.0000 14.5015 0.065224-Apr-17 10.0000 14.6227 0.0683
ICICI Prudential Balanced Fund - Direct Plan -Annual Dividend
Record Date Face Value (Rs) NAV (Rs) Dividend (Rs.)/Unit
23-Dec-16 10.00 12.12 0.25
ICICI Prudential Balanced Fund -Annual Dividend
Record Date Face Value (Rs) NAV (Rs) Dividend (Rs.)/Unit
23-Dec-16 10.00 11.96 0.25
ICICI Prudential Balanced Fund - Direct Plan - Monthly Dividend Option
Record Date Face Value (Rs) NAV (Rs) Dividend (Rs.)/Unit
03-Feb-17 10.00 29.03 0.1503-Mar-17 10.00 29.22 0.1507-Apr-17 10.00 29.62 0.15
ICICI Prudential Balanced Fund - Monthly Dividend Option
Record Date Face Value (Rs) NAV (Rs) Dividend (Rs.)/Unit
03-Feb-17 10.00 24.47 0.2403-Mar-17 10.00 24.48 0.2407-Apr-17 10.00 24.67 0.24
ICICI Prudential MIP - 25 (An open ended Income fund. Monthly income is not assured and is subject to the availability of distributable surplus.) - Half Yearly Dividend
Record Date Face Value (Rs) NAV (Rs) Dividend (Rs.)/Unit
28-Mar-16 10.0000 12.2051 0.157028-Sep-16 10.0000 13.4822 1.328129-Mar-17 10.0000 12.6249 0.3724
ICICI Prudential MIP - 25 (An open ended Income fund. Monthly income is not assured and is subject to the availability of distributable surplus.) Direct Plan - Half Yearly Dividend
Record Date Face Value (Rs) NAV (Rs) Dividend (Rs.)/Unit
28-Mar-16 10.0000 14.3468 0.314028-Sep-16 10.0000 15.7495 0.853029-Mar-17 10.0000 15.5515 0.5319
ICICI Prudential MIP - 25 (An open ended Income fund. Monthly income is not assured and is subject to the availability of distributable surplus.) Direct Plan - Monthly Dividend
Record Date Face Value (Rs) NAV (Rs) Dividend (Rs.)/Unit
28-Feb-17 10.0000 14.8488 0.065031-Mar-17 10.0000 15.0976 0.125628-Apr-17 10.0000 15.1690 0.1149
ICICI Prudential MIP 25 (An open ended Income fund. Monthly income is not assured and issubject to the availability of distributable surplus.) - Monthly Dividend
Record Date Face Value (Rs) NAV (Rs) Dividend (Rs.)/Unit
28-Feb-17 10.0000 13.7556 0.060331-Mar-17 10.0000 13.9788 0.116328-Apr-17 10.0000 14.0381 0.1063
ICICI Prudential MIP - 25 (An open ended Income fund. Monthly income is not assured and is subject to the availability of distributable surplus.) - Quarterly Dividend
Record Date Face Value (Rs) NAV (Rs) Dividend (Rs.)/Unit
09-May-16 10.0000 11.7045 0.204229-Sep-16 10.0000 12.4582 1.018031-Mar-17 10.0000 12.0381 0.4837
ICICI Prudential MIP - 25 (An open ended Income fund. Monthly income is not assured and is subject to the availability of distributable surplus.) Direct Plan - Quarterly Dividend
Record Date Face Value (Rs) NAV (Rs) Dividend (Rs.)/Unit
09-May-16 10.0000 13.0293 0.491429-Sep-16 10.0000 13.6137 0.443831-Mar-17 10.0000 13.9199 0.6160
ICICI Prudential Equity Arbitrage Fund - Dividend
Record Date Face Value (Rs) NAV (Rs) Dividend (Rs.)/Unit
03-Mar-17 10.0000 13.7966 0.054731-Mar-17 10.0000 13.8161 0.074224-Apr-17 10.0000 13.7689 0.0270
ICICI Prudential Business Cycle Fund - Series 2 Direct Plan Dividend Option
Record Date Face Value (Rs) NAV (Rs) Dividend (Rs.)/Unit
05-Aug-16 10.00 11.86 0.7528-Apr-17 10.00 12.19 0.75
ICICI Prudential Business Cycle Fund - Series 2 Dividend Option
Record Date Face Value (Rs) NAV (Rs) Dividend (Rs.)/Unit
05-Aug-16 10.00 11.72 0.7528-Apr-17 10.00 11.94 0.75
ICICI Prudential Business Cycle Fund - Series 3 Direct Plan Dividend option
Record Date Face Value (Rs) NAV (Rs) Dividend (Rs.)/Unit
05-Aug-16 10.00 12.57 0.7528-Apr-17 10.00 14.55 0.75
ICICI Prudential Business Cycle Fund - Series 3 Dividend option
Record Date Face Value (Rs) NAV (Rs) Dividend (Rs.)/Unit
05-Aug-16 10.00 12.46 0.7528-Apr-17 10.00 14.27 0.75
ICICI Prudential Business Cycle Fund - Series 1 Direct Plan Dividend Option
Record Date Face Value (Rs) NAV (Rs) Dividend (Rs.)/Unit
28-Apr-17 10.00 12.53 0.75
ICICI Prudential Business Cycle Fund - Series 1 Dividend Option
Record Date Face Value (Rs) NAV (Rs) Dividend (Rs.)/Unit
28-Apr-17 10.00 12.27 0.75
ICICI Prudential India Recovery Fund - Series 7 Direct Plan Dividend Option
Record Date Face Value (Rs) NAV (Rs) Dividend (Rs.)/Unit
21-Apr-17 10.00 12.08 0.75
ICICI Prudential India Recovery Fund - Series 7 Dividend Option
Record Date Face Value (Rs) NAV (Rs) Dividend (Rs.)/Unit
21-Apr-17 10.00 11.92 0.75
Record Date Face Value (Rs) NAV (Rs) Dividend (Rs.)/Unit
ICICI Prudential Monthly Income Plan (An open ended Income fund. Monthly income is not assured and is subject to the availability of distributable surplus.) Direct Plan - Half Yearly Dividend
26-Aug-15 10.0000 13.4644 0.181826-Aug-16 10.0000 14.6439 1.356527-Feb-17 10.0000 13.8483 0.5853
ICICI Prudential Monthly Income Plan (An open ended Income fund. Monthly income is not assured and is subject to the availability of distributable surplus.) - Quarterly Dividend Option
Record Date Face Value (Rs) NAV (Rs) Dividend (Rs.)/Unit
29-Aug-16 10.0000 14.0404 0.664829-Nov-16 10.0000 13.8696 0.439328-Feb-17 10.0000 13.4718 0.0584
ICICI Prudential Monthly Income Plan (An open ended Income fund. Monthly income is not assured and is subject to the availability of distributable surplus.) Direct Plan - Quarterly Dividend
Record Date Face Value (Rs) NAV (Rs) Dividend (Rs.)/Unit
29-Aug-16 10.0000 14.3911 0.697029-Nov-16 10.0000 14.2205 0.468628-Feb-17 10.0000 13.8023 0.0663
ICICI Prudential Monthly Income Plan (An open ended Income fund. Monthly income is not assured and is subject to the availability of distributable surplus.) - Half Yearly Dividend Option
Record Date Face Value (Rs) NAV (Rs) Dividend (Rs.)/Unit
26-Aug-15 10.0000 12.8977 0.376426-Aug-16 10.0000 13.7190 1.194727-Feb-17 10.0000 13.0263 0.5261
Record Date Face Value (Rs) NAV (Rs) Dividend (Rs.)/Unit
ICICI Prudential Monthly Income Plan (An open ended Income fund. Monthly income is not assured and is subject to the availability of distributable surplus.) Direct Plan - Monthly Dividend
28-Feb-17 10.0000 12.8426 0.056731-Mar-17 10.0000 12.9612 0.108628-Apr-17 10.0000 12.9570 0.0789
ICICI Prudential Regular Income Fund (An open ended income fund. Income is not assured and is subject to the availability of distributable surplus.) - Monthly Dividend Option
Record Date Face Value (Rs) NAV (Rs) Dividend (Rs.)/Unit
28-Feb-17 10.0000 10.6633 0.052429-Mar-17 10.0000 10.6623 0.051428-Apr-17 10.0000 10.6754 0.0645
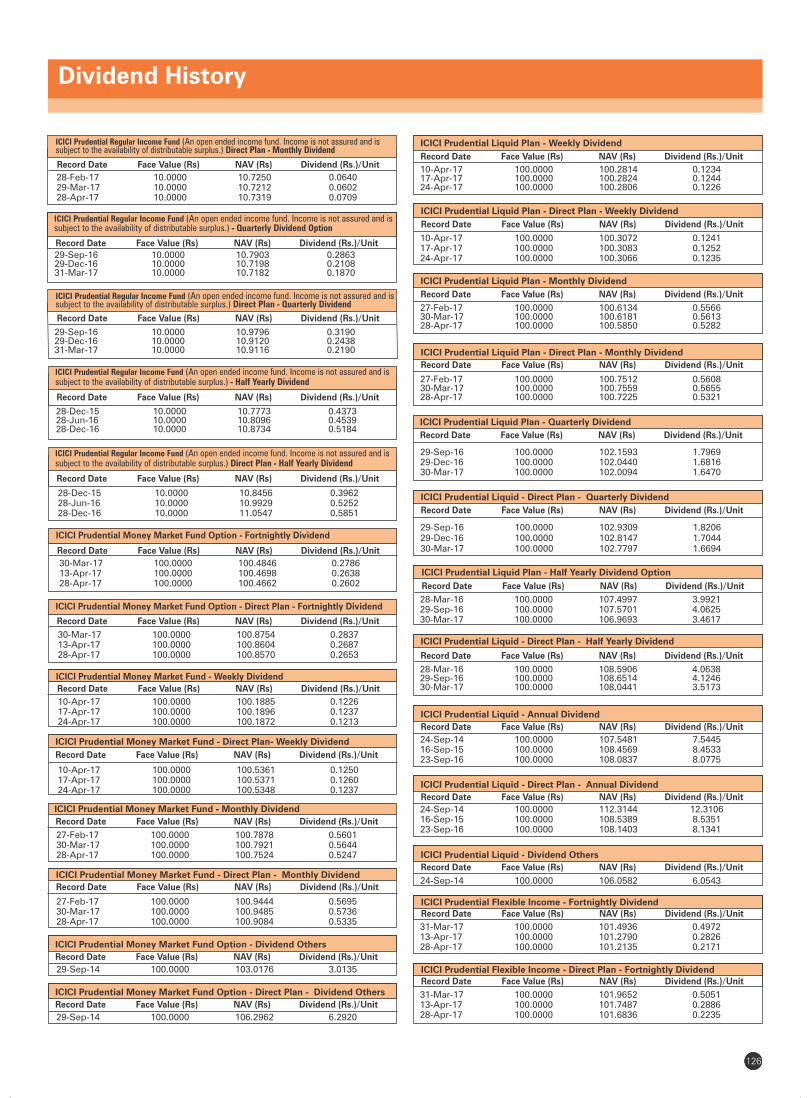
Dividend History
6979126
ICICI Prudential Money Market Fund Option - Direct Plan - Dividend Others
Record Date Face Value (Rs) NAV (Rs) Dividend (Rs.)/Unit
29-Sep-14 100.0000 106.2962 6.2920
ICICI Prudential Money Market Fund Option - Dividend Others
Record Date Face Value (Rs) NAV (Rs) Dividend (Rs.)/Unit
29-Sep-14 100.0000 103.0176 3.0135
ICICI Prudential Money Market Fund - Direct Plan - Monthly Dividend
Record Date Face Value (Rs) NAV (Rs) Dividend (Rs.)/Unit
27-Feb-17 100.0000 100.9444 0.569530-Mar-17 100.0000 100.9485 0.573628-Apr-17 100.0000 100.9084 0.5335
Record Date Face Value (Rs) NAV (Rs) Dividend (Rs.)/Unit
ICICI Prudential Money Market Fund Option - Direct Plan - Fortnightly Dividend
30-Mar-17 100.0000 100.8754 0.283713-Apr-17 100.0000 100.8604 0.268728-Apr-17 100.0000 100.8570 0.2653
ICICI Prudential Money Market Fund - Direct Plan- Weekly Dividend
Record Date Face Value (Rs) NAV (Rs) Dividend (Rs.)/Unit
10-Apr-17 100.0000 100.5361 0.125017-Apr-17 100.0000 100.5371 0.126024-Apr-17 100.0000 100.5348 0.1237
ICICI Prudential Money Market Fund - Monthly Dividend -
Record Date Face Value (Rs) NAV (Rs) Dividend (Rs.)/Unit
27-Feb-17 100.0000 100.7878 0.560130-Mar-17 100.0000 100.7921 0.564428-Apr-17 100.0000 100.7524 0.5247
Record Date Face Value (Rs) NAV (Rs) Dividend (Rs.)/Unit
ICICI Prudential Money Market Fund - Weekly Dividend
10-Apr-17 100.0000 100.1885 0.122617-Apr-17 100.0000 100.1896 0.123724-Apr-17 100.0000 100.1872 0.1213
Record Date Face Value (Rs) NAV (Rs) Dividend (Rs.)/Unit
ICICI Prudential Regular Income Fund (An open ended income fund. Income is not assured and is subject to the availability of distributable surplus.) Direct Plan - Half Yearly Dividend
28-Dec-15 10.0000 10.8456 0.396228-Jun-16 10.0000 10.9929 0.525228-Dec-16 10.0000 11.0547 0.5851
Record Date Face Value (Rs) NAV (Rs) Dividend (Rs.)/Unit
ICICI Prudential Money Market Fund Option - Fortnightly Dividend
30-Mar-17 100.0000 100.4846 0.278613-Apr-17 100.0000 100.4698 0.263828-Apr-17 100.0000 100.4662 0.2602
ICICI Prudential Regular Income Fund (An open ended income fund. Income is not assured and is subject to the availability of distributable surplus.) - Quarterly Dividend Option
Record Date Face Value (Rs) NAV (Rs) Dividend (Rs.)/Unit
29-Sep-16 10.0000 10.7903 0.286329-Dec-16 10.0000 10.7198 0.210831-Mar-17 10.0000 10.7182 0.1870
ICICI Prudential Regular Income Fund (An open ended income fund. Income is not assured and is subject to the availability of distributable surplus.) Direct Plan - Quarterly Dividend
Record Date Face Value (Rs) NAV (Rs) Dividend (Rs.)/Unit
29-Sep-16 10.0000 10.9796 0.319029-Dec-16 10.0000 10.9120 0.243831-Mar-17 10.0000 10.9116 0.2190
Record Date Face Value (Rs) NAV (Rs) Dividend (Rs.)/Unit
ICICI Prudential Regular Income Fund (An open ended income fund. Income is not assured and is subject to the availability of distributable surplus.) - Half Yearly Dividend
28-Dec-15 10.0000 10.7773 0.437328-Jun-16 10.0000 10.8096 0.453928-Dec-16 10.0000 10.8734 0.5184
ICICI Prudential Regular Income Fund (An open ended income fund. Income is not assured and is subject to the availability of distributable surplus.) Direct Plan - Monthly Dividend
Record Date Face Value (Rs) NAV (Rs) Dividend (Rs.)/Unit
28-Feb-17 10.0000 10.7250 0.064029-Mar-17 10.0000 10.7212 0.060228-Apr-17 10.0000 10.7319 0.0709
ICICI Prudential Liquid Plan - Weekly Dividend
Record Date Face Value (Rs) NAV (Rs) Dividend (Rs.)/Unit
10-Apr-17 100.0000 100.2814 0.123417-Apr-17 100.0000 100.2824 0.124424-Apr-17 100.0000 100.2806 0.1226
ICICI Prudential Liquid Plan - Direct Plan - Weekly Dividend
Record Date Face Value (Rs) NAV (Rs) Dividend (Rs.)/Unit
10-Apr-17 100.0000 100.3072 0.124117-Apr-17 100.0000 100.3083 0.125224-Apr-17 100.0000 100.3066 0.1235
ICICI Prudential Liquid Plan - Monthly Dividend
Record Date Face Value (Rs) NAV (Rs) Dividend (Rs.)/Unit
27-Feb-17 100.0000 100.6134 0.556630-Mar-17 100.0000 100.6181 0.561328-Apr-17 100.0000 100.5850 0.5282
ICICI Prudential Liquid Plan - Direct Plan - Monthly Dividend
Record Date Face Value (Rs) NAV (Rs) Dividend (Rs.)/Unit
27-Feb-17 100.0000 100.7512 0.560830-Mar-17 100.0000 100.7559 0.565528-Apr-17 100.0000 100.7225 0.5321
ICICI Prudential Liquid Plan - Quarterly Dividend
Record Date Face Value (Rs) NAV (Rs) Dividend (Rs.)/Unit
29-Sep-16 100.0000 102.1593 1.796929-Dec-16 100.0000 102.0440 1.681630-Mar-17 100.0000 102.0094 1.6470
ICICI Prudential Liquid - Direct Plan - Quarterly Dividend
Record Date Face Value (Rs) NAV (Rs) Dividend (Rs.)/Unit
29-Sep-16 100.0000 102.9309 1.820629-Dec-16 100.0000 102.8147 1.704430-Mar-17 100.0000 102.7797 1.6694
ICICI Prudential Liquid Plan - Half Yearly Dividend Option
Record Date Face Value (Rs) NAV (Rs) Dividend (Rs.)/Unit
28-Mar-16 100.0000 107.4997 3.992129-Sep-16 100.0000 107.5701 4.062530-Mar-17 100.0000 106.9693 3.4617
ICICI Prudential Liquid - Dividend Others
Record Date Face Value (Rs) NAV (Rs) Dividend (Rs.)/Unit
24-Sep-14 100.0000 106.0582 6.0543
ICICI Prudential Flexible Income - Fortnightly DividendRecord Date Face Value (Rs) NAV (Rs) Dividend (Rs.)/Unit
31-Mar-17 100.0000 101.4936 0.497213-Apr-17 100.0000 101.2790 0.282628-Apr-17 100.0000 101.2135 0.2171
ICICI Prudential Flexible Income - Direct Plan - Fortnightly DividendRecord Date Face Value (Rs) NAV (Rs) Dividend (Rs.)/Unit
31-Mar-17 100.0000 101.9652 0.505113-Apr-17 100.0000 101.7487 0.288628-Apr-17 100.0000 101.6836 0.2235
ICICI Prudential Liquid - Direct Plan - Half Yearly Dividend
Record Date Face Value (Rs) NAV (Rs) Dividend (Rs.)/Unit
28-Mar-16 100.0000 108.5906 4.063829-Sep-16 100.0000 108.6514 4.124630-Mar-17 100.0000 108.0441 3.5173
ICICI Prudential Liquid - Annual Dividend
Record Date Face Value (Rs) NAV (Rs) Dividend (Rs.)/Unit
24-Sep-14 100.0000 107.5481 7.544516-Sep-15 100.0000 108.4569 8.453323-Sep-16 100.0000 108.0837 8.0775
ICICI Prudential Liquid - Direct Plan - Annual Dividend
Record Date Face Value (Rs) NAV (Rs) Dividend (Rs.)/Unit
24-Sep-14 100.0000 112.3144 12.310616-Sep-15 100.0000 108.5389 8.535123-Sep-16 100.0000 108.1403 8.1341
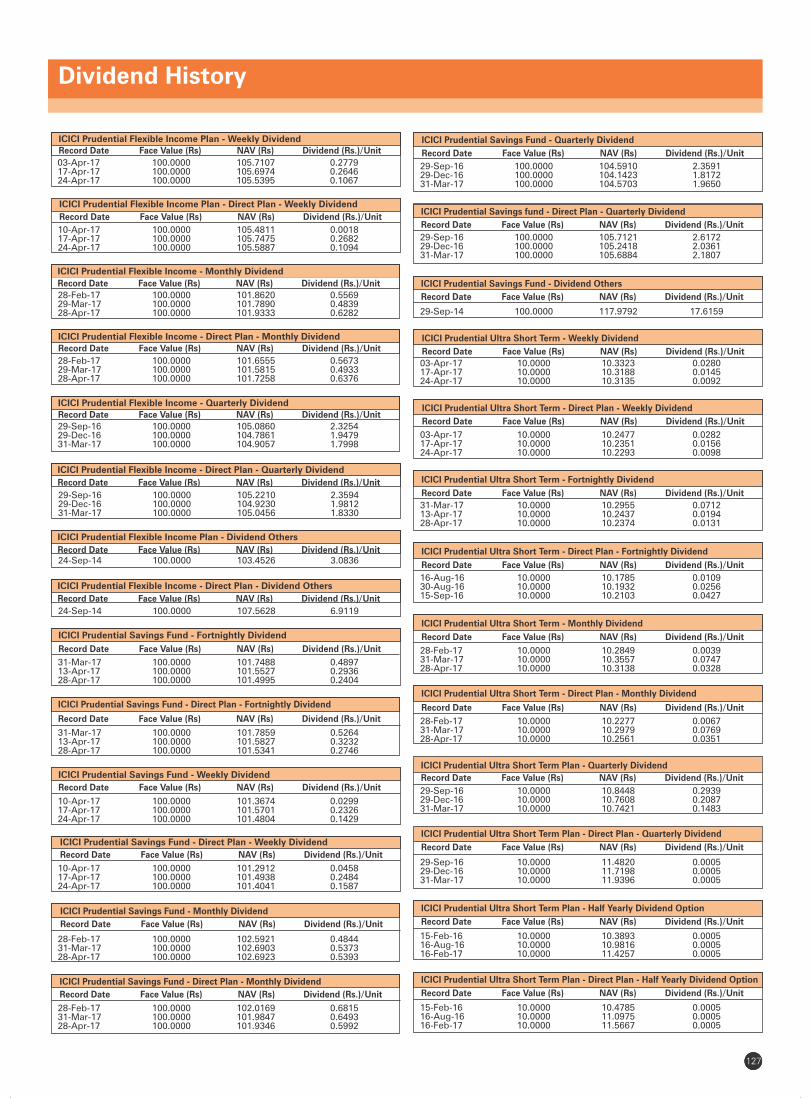
Dividend History
6979127
ICICI Prudential Savings Fund - Direct Plan - Fortnightly Dividend
Record Date Face Value (Rs) NAV (Rs) Dividend (Rs.)/Unit
31-Mar-17 100.0000 101.7859 0.526413-Apr-17 100.0000 101.5827 0.323228-Apr-17 100.0000 101.5341 0.2746
ICICI Prudential Savings Fund - Direct Plan - Monthly Dividend
Record Date Face Value (Rs) NAV (Rs) Dividend (Rs.)/Unit
28-Feb-17 100.0000 102.0169 0.681531-Mar-17 100.0000 101.9847 0.649328-Apr-17 100.0000 101.9346 0.5992
ICICI Prudential Savings Fund - Direct Plan - Weekly Dividend
Record Date Face Value (Rs) NAV (Rs) Dividend (Rs.)/Unit
10-Apr-17 100.0000 101.2912 0.045817-Apr-17 100.0000 101.4938 0.248424-Apr-17 100.0000 101.4041 0.1587
ICICI Prudential Savings Fund - Monthly Dividend
Record Date Face Value (Rs) NAV (Rs) Dividend (Rs.)/Unit
28-Feb-17 100.0000 102.5921 0.484431-Mar-17 100.0000 102.6903 0.537328-Apr-17 100.0000 102.6923 0.5393
ICICI Prudential Savings Fund - Weekly Dividend
Record Date Face Value (Rs) NAV (Rs) Dividend (Rs.)/Unit
10-Apr-17 100.0000 101.3674 0.029917-Apr-17 100.0000 101.5701 0.232624-Apr-17 100.0000 101.4804 0.1429
ICICI Prudential Savings Fund - Quarterly Dividend
Record Date Face Value (Rs) NAV (Rs) Dividend (Rs.)/Unit
29-Sep-16 100.0000 104.5910 2.359129-Dec-16 100.0000 104.1423 1.817231-Mar-17 100.0000 104.5703 1.9650
ICICI Prudential Savings fund - Direct Plan - Quarterly Dividend
Record Date Face Value (Rs) NAV (Rs) Dividend (Rs.)/Unit
29-Sep-16 100.0000 105.7121 2.617229-Dec-16 100.0000 105.2418 2.036131-Mar-17 100.0000 105.6884 2.1807
ICICI Prudential Savings Fund - Dividend Others
Record Date Face Value (Rs) NAV (Rs) Dividend (Rs.)/Unit
29-Sep-14 100.0000 117.9792 17.6159
ICICI Prudential Ultra Short Term - Direct Plan - Weekly Dividend
Record Date Face Value (Rs) NAV (Rs) Dividend (Rs.)/Unit
03-Apr-17 10.0000 10.2477 0.028217-Apr-17 10.0000 10.2351 0.015624-Apr-17 10.0000 10.2293 0.0098
ICICI Prudential Ultra Short Term - Fortnightly Dividend
Record Date Face Value (Rs) NAV (Rs) Dividend (Rs.)/Unit
31-Mar-17 10.0000 10.2955 0.071213-Apr-17 10.0000 10.2437 0.019428-Apr-17 10.0000 10.2374 0.0131
ICICI Prudential Ultra Short Term - Weekly Dividend
Record Date Face Value (Rs) NAV (Rs) Dividend (Rs.)/Unit
03-Apr-17 10.0000 10.3323 0.028017-Apr-17 10.0000 10.3188 0.014524-Apr-17 10.0000 10.3135 0.0092
ICICI Prudential Ultra Short Term - Direct Plan - Fortnightly Dividend
Record Date Face Value (Rs) NAV (Rs) Dividend (Rs.)/Unit
16-Aug-16 10.0000 10.1785 0.010930-Aug-16 10.0000 10.1932 0.025615-Sep-16 10.0000 10.2103 0.0427
ICICI Prudential Ultra Short Term - Monthly Dividend
Record Date Face Value (Rs) NAV (Rs) Dividend (Rs.)/Unit
28-Feb-17 10.0000 10.2849 0.003931-Mar-17 10.0000 10.3557 0.074728-Apr-17 10.0000 10.3138 0.0328
ICICI Prudential Flexible Income Plan - Dividend Others
Record Date Face Value (Rs) NAV (Rs) Dividend (Rs.)/Unit24-Sep-14 100.0000 103.4526 3.0836
ICICI Prudential Flexible Income - Direct Plan - Dividend Others
Record Date Face Value (Rs) NAV (Rs) Dividend (Rs.)/Unit
24-Sep-14 100.0000 107.5628 6.9119
ICICI Prudential Flexible Income Plan - Direct Plan - Weekly Dividend
Record Date Face Value (Rs) NAV (Rs) Dividend (Rs.)/Unit
10-Apr-17 100.0000 105.4811 0.001817-Apr-17 100.0000 105.7475 0.268224-Apr-17 100.0000 105.5887 0.1094
ICICI Prudential Flexible Income - Monthly Dividend
Record Date Face Value (Rs) NAV (Rs) Dividend (Rs.)/Unit
28-Feb-17 100.0000 101.8620 0.556929-Mar-17 100.0000 101.7890 0.483928-Apr-17 100.0000 101.9333 0.6282
ICICI Prudential Flexible Income - Direct Plan - Monthly Dividend
Record Date Face Value (Rs) NAV (Rs) Dividend (Rs.)/Unit
28-Feb-17 100.0000 101.6555 0.567329-Mar-17 100.0000 101.5815 0.493328-Apr-17 100.0000 101.7258 0.6376
ICICI Prudential Flexible Income - Quarterly Dividend
Record Date Face Value (Rs) NAV (Rs) Dividend (Rs.)/Unit
29-Sep-16 100.0000 105.0860 2.325429-Dec-16 100.0000 104.7861 1.947931-Mar-17 100.0000 104.9057 1.7998
ICICI Prudential Flexible Income - Direct Plan - Quarterly Dividend
Record Date Face Value (Rs) NAV (Rs) Dividend (Rs.)/Unit
29-Sep-16 100.0000 105.2210 2.359429-Dec-16 100.0000 104.9230 1.981231-Mar-17 100.0000 105.0456 1.8330
ICICI Prudential Savings Fund - Fortnightly Dividend
Record Date Face Value (Rs) NAV (Rs) Dividend (Rs.)/Unit
31-Mar-17 100.0000 101.7488 0.489713-Apr-17 100.0000 101.5527 0.293628-Apr-17 100.0000 101.4995 0.2404
ICICI Prudential Flexible Income Plan - Weekly DividendRecord Date Face Value (Rs) NAV (Rs) Dividend (Rs.)/Unit
03-Apr-17 100.0000 105.7107 0.277917-Apr-17 100.0000 105.6974 0.264624-Apr-17 100.0000 105.5395 0.1067
ICICI Prudential Ultra Short Term Plan - Direct Plan - Quarterly Dividend
Record Date Face Value (Rs) NAV (Rs) Dividend (Rs.)/Unit
29-Sep-16 10.0000 11.4820 0.000529-Dec-16 10.0000 11.7198 0.000531-Mar-17 10.0000 11.9396 0.0005
ICICI Prudential Ultra Short Term Plan - Half Yearly Dividend Option
Record Date Face Value (Rs) NAV (Rs) Dividend (Rs.)/Unit
15-Feb-16 10.0000 10.3893 0.000516-Aug-16 10.0000 10.9816 0.000516-Feb-17 10.0000 11.4257 0.0005
ICICI Prudential Ultra Short Term Plan - Direct Plan - Half Yearly Dividend Option
Record Date Face Value (Rs) NAV (Rs) Dividend (Rs.)/Unit
15-Feb-16 10.0000 10.4785 0.000516-Aug-16 10.0000 11.0975 0.000516-Feb-17 10.0000 11.5667 0.0005
ICICI Prudential Ultra Short Term Plan - Quarterly Dividend
Record Date Face Value (Rs) NAV (Rs) Dividend (Rs.)/Unit
29-Sep-16 10.0000 10.8448 0.293929-Dec-16 10.0000 10.7608 0.208731-Mar-17 10.0000 10.7421 0.1483
ICICI Prudential Ultra Short Term - Direct Plan - Monthly Dividend
Record Date Face Value (Rs) NAV (Rs) Dividend (Rs.)/Unit
28-Feb-17 10.0000 10.2277 0.006731-Mar-17 10.0000 10.2979 0.076928-Apr-17 10.0000 10.2561 0.0351
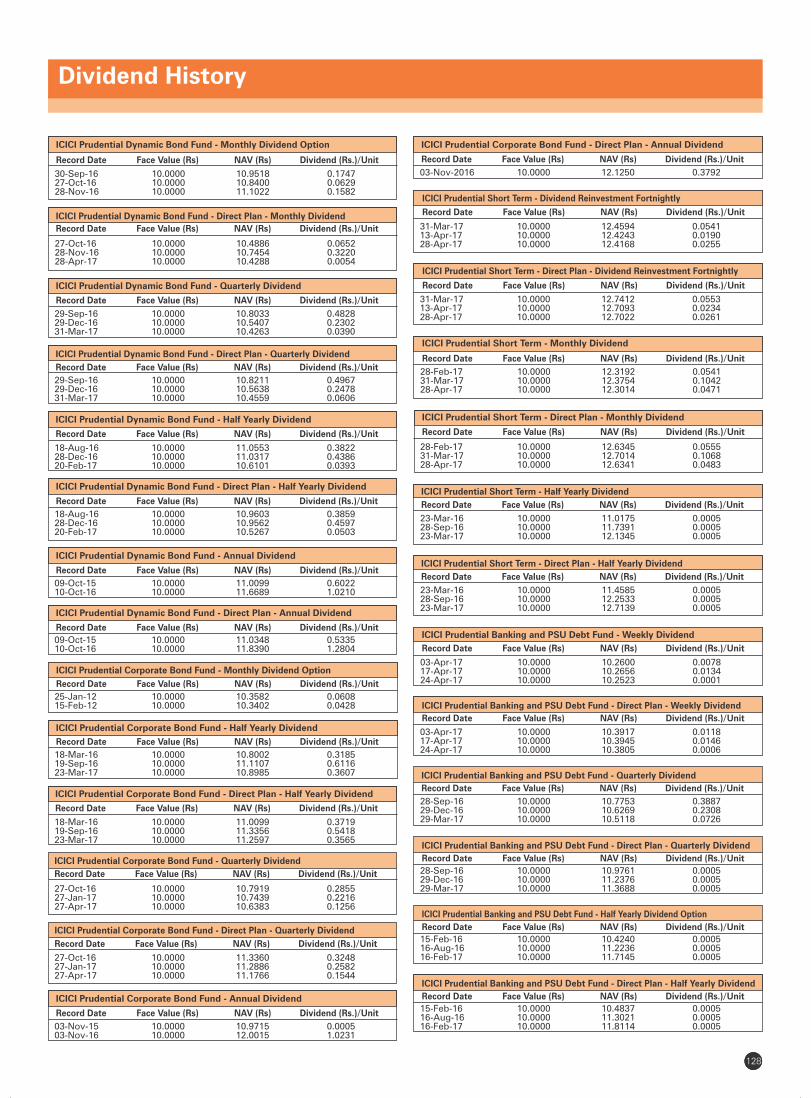
Dividend History
6979128
ICICI Prudential Corporate Bond Fund - Monthly Dividend Option
Record Date Face Value (Rs) NAV (Rs) Dividend (Rs.)/Unit
25-Jan-12 10.0000 10.3582 0.060815-Feb-12 10.0000 10.3402 0.0428
ICICI Prudential Corporate Bond Fund - Half Yearly Dividend
Record Date Face Value (Rs) NAV (Rs) Dividend (Rs.)/Unit
18-Mar-16 10.0000 10.8002 0.318519-Sep-16 10.0000 11.1107 0.611623-Mar-17 10.0000 10.8985 0.3607
ICICI Prudential Corporate Bond Fund - Annual Dividend
Record Date Face Value (Rs) NAV (Rs) Dividend (Rs.)/Unit
03-Nov-15 10.0000 10.9715 0.000503-Nov-16 10.0000 12.0015 1.0231
ICICI Prudential Corporate Bond Fund - Direct Plan - Half Yearly Dividend
Record Date Face Value (Rs) NAV (Rs) Dividend (Rs.)/Unit
18-Mar-16 10.0000 11.0099 0.371919-Sep-16 10.0000 11.3356 0.541823-Mar-17 10.0000 11.2597 0.3565
ICICI Prudential Corporate Bond Fund - Direct Plan - Quarterly Dividend
Record Date Face Value (Rs) NAV (Rs) Dividend (Rs.)/Unit
27-Oct-16 10.0000 11.3360 0.324827-Jan-17 10.0000 11.2886 0.258227-Apr-17 10.0000 11.1766 0.1544
ICICI Prudential Corporate Bond Fund - Quarterly Dividend
Record Date Face Value (Rs) NAV (Rs) Dividend (Rs.)/Unit
27-Oct-16 10.0000 10.7919 0.285527-Jan-17 10.0000 10.7439 0.221627-Apr-17 10.0000 10.6383 0.1256
ICICI Prudential Short Term - Half Yearly Dividend
Record Date Face Value (Rs) NAV (Rs) Dividend (Rs.)/Unit
23-Mar-16 10.0000 11.0175 0.000528-Sep-16 10.0000 11.7391 0.000523-Mar-17 10.0000 12.1345 0.0005
ICICI Prudential Corporate Bond Fund - Direct Plan - Annual Dividend
Record Date Face Value (Rs) NAV (Rs) Dividend (Rs.)/Unit
03-Nov-2016 10.0000 12.1250 0.3792
ICICI Prudential Short Term - Direct Plan - Dividend Reinvestment Fortnightly
Record Date Face Value (Rs) NAV (Rs) Dividend (Rs.)/Unit
31-Mar-17 10.0000 12.7412 0.055313-Apr-17 10.0000 12.7093 0.023428-Apr-17 10.0000 12.7022 0.0261
ICICI Prudential Short Term - Direct Plan - Monthly Dividend
Record Date Face Value (Rs) NAV (Rs) Dividend (Rs.)/Unit
28-Feb-17 10.0000 12.6345 0.055531-Mar-17 10.0000 12.7014 0.106828-Apr-17 10.0000 12.6341 0.0483
ICICI Prudential Short Term - Monthly Dividend
Record Date Face Value (Rs) NAV (Rs) Dividend (Rs.)/Unit
28-Feb-17 10.0000 12.3192 0.054131-Mar-17 10.0000 12.3754 0.104228-Apr-17 10.0000 12.3014 0.0471
ICICI Prudential Short Term - Dividend Reinvestment Fortnightly
Record Date Face Value (Rs) NAV (Rs) Dividend (Rs.)/Unit
31-Mar-17 10.0000 12.4594 0.054113-Apr-17 10.0000 12.4243 0.019028-Apr-17 10.0000 12.4168 0.0255
ICICI Prudential Short Term - Direct Plan - Half Yearly Dividend
Record Date Face Value (Rs) NAV (Rs) Dividend (Rs.)/Unit
23-Mar-16 10.0000 11.4585 0.000528-Sep-16 10.0000 12.2533 0.000523-Mar-17 10.0000 12.7139 0.0005
ICICI Prudential Dynamic Bond Fund - Direct Plan - Annual Dividend
Record Date Face Value (Rs) NAV (Rs) Dividend (Rs.)/Unit
09-Oct-15 10.0000 11.0348 0.533510-Oct-16 10.0000 11.8390 1.2804
ICICI Prudential Dynamic Bond Fund - Annual Dividend
Record Date Face Value (Rs) NAV (Rs) Dividend (Rs.)/Unit
09-Oct-15 10.0000 11.0099 0.602210-Oct-16 10.0000 11.6689 1.0210
ICICI Prudential Dynamic Bond Fund - Quarterly Dividend
Record Date Face Value (Rs) NAV (Rs) Dividend (Rs.)/Unit
29-Sep-16 10.0000 10.8033 0.482829-Dec-16 10.0000 10.5407 0.230231-Mar-17 10.0000 10.4263 0.0390
ICICI Prudential Dynamic Bond Fund - Direct Plan - Quarterly Dividend
Record Date Face Value (Rs) NAV (Rs) Dividend (Rs.)/Unit
29-Sep-16 10.0000 10.8211 0.496729-Dec-16 10.0000 10.5638 0.247831-Mar-17 10.0000 10.4559 0.0606
ICICI Prudential Dynamic Bond Fund - Half Yearly Dividend
Record Date Face Value (Rs) NAV (Rs) Dividend (Rs.)/Unit
18-Aug-16 10.0000 11.0553 0.382228-Dec-16 10.0000 11.0317 0.438620-Feb-17 10.0000 10.6101 0.0393
ICICI Prudential Dynamic Bond Fund - Direct Plan - Half Yearly Dividend
Record Date Face Value (Rs) NAV (Rs) Dividend (Rs.)/Unit
18-Aug-16 10.0000 10.9603 0.385928-Dec-16 10.0000 10.9562 0.459720-Feb-17 10.0000 10.5267 0.0503
ICICI Prudential Dynamic Bond Fund - Direct Plan - Monthly Dividend
Record Date Face Value (Rs) NAV (Rs) Dividend (Rs.)/Unit
27-Oct-16 10.0000 10.4886 0.065228-Nov-16 10.0000 10.7454 0.322028-Apr-17 10.0000 10.4288 0.0054
ICICI Prudential Dynamic Bond Fund - Monthly Dividend Option
Record Date Face Value (Rs) NAV (Rs) Dividend (Rs.)/Unit
30-Sep-16 10.0000 10.9518 0.174727-Oct-16 10.0000 10.8400 0.062928-Nov-16 10.0000 11.1022 0.1582
ICICI Prudential Banking and PSU Debt Fund - Direct Plan - Half Yearly Dividend
Record Date Face Value (Rs) NAV (Rs) Dividend (Rs.)/Unit
15-Feb-16 10.0000 10.4837 0.000516-Aug-16 10.0000 11.3021 0.000516-Feb-17 10.0000 11.8114 0.0005
ICICI Prudential Banking and PSU Debt Fund - Direct Plan - Quarterly Dividend
Record Date Face Value (Rs) NAV (Rs) Dividend (Rs.)/Unit
28-Sep-16 10.0000 10.9761 0.000529-Dec-16 10.0000 11.2376 0.000529-Mar-17 10.0000 11.3688 0.0005
ICICI Prudential Banking and PSU Debt Fund - Half Yearly Dividend Option
Record Date Face Value (Rs) NAV (Rs) Dividend (Rs.)/Unit
15-Feb-16 10.0000 10.4240 0.000516-Aug-16 10.0000 11.2236 0.000516-Feb-17 10.0000 11.7145 0.0005
ICICI Prudential Banking and PSU Debt Fund - Weekly Dividend
Record Date Face Value (Rs) NAV (Rs) Dividend (Rs.)/Unit
03-Apr-17 10.0000 10.2600 0.007817-Apr-17 10.0000 10.2656 0.013424-Apr-17 10.0000 10.2523 0.0001
ICICI Prudential Banking and PSU Debt Fund - Direct Plan - Weekly Dividend
Record Date Face Value (Rs) NAV (Rs) Dividend (Rs.)/Unit
03-Apr-17 10.0000 10.3917 0.011817-Apr-17 10.0000 10.3945 0.014624-Apr-17 10.0000 10.3805 0.0006
ICICI Prudential Banking and PSU Debt Fund - Quarterly Dividend
Record Date Face Value (Rs) NAV (Rs) Dividend (Rs.)/Unit
28-Sep-16 10.0000 10.7753 0.388729-Dec-16 10.0000 10.6269 0.230829-Mar-17 10.0000 10.5118 0.0726

Dividend History
129
ICICI Prudential Long Term - Direct Plan - Dividend
Record Date Face Value (Rs) NAV (Rs) Dividend (Rs.)/Unit
26-Sep-14 10.0000 12.1670 1.4968
Record Date Face Value (Rs) NAV (Rs) Dividend (Rs.)/Unit
ICICI Prudential Regular Savings Fund - Half Yearly Dividend
30-Mar-16 10.0000 10.5753 0.319430-Sep-16 10.0000 10.8763 0.592731-Mar-17 10.0000 10.6845 0.3702
Record Date Face Value (Rs) NAV (Rs) Dividend (Rs.)/Unit
ICICI Prudential Regular Savings Fund - Direct Plan - Half Yearly Dividend
30-Mar-16 10.0000 10.9630 0.386730-Sep-16 10.0000 11.2586 0.651631-Mar-17 10.0000 11.0779 0.4369
ICICI Prudential Income Opportunities Fund - Direct Plan - Monthly Dividend
Record Date Face Value (Rs) NAV (Rs) Dividend (Rs.)/Unit
28-Nov-16 10.0000 11.7729 0.267627-Jan-17 10.0000 11.5099 0.004628-Apr-17 10.0000 11.5392 0.0339
Record Date Face Value (Rs) NAV (Rs) Dividend (Rs.)/Unit
ICICI Prudential Income Opportunities Fund - Quarterly Dividend
20-May-16 10.0000 11.1700 0.412522-Aug-16 10.0000 11.1852 0.459622-Nov-16 10.0000 11.2066 0.3514
Record Date Face Value (Rs) NAV (Rs) Dividend (Rs.)/Unit
ICICI Prudential Income Opportunities Fund - Direct Plan - Quarterly Dividend
20-May-16 10.0000 11.5047 0.434422-Aug-16 10.0000 11.5222 0.483522-Nov-16 10.0000 11.5468 0.3734
ICICI Prudential Income Opportunities Fund - Half Yearly Dividend
Record Date Face Value (Rs) NAV (Rs) Dividend (Rs.)/Unit
23-Mar-16 10.0000 10.6827 0.198728-Sep-16 10.0000 11.2553 0.439623-Mar-17 10.0000 11.0535 0.1903
Record Date Face Value (Rs) NAV (Rs) Dividend (Rs.)/Unit
ICICI Prudential Income Opportunities Fund - Monthly Dividend
28-Nov-16 10.0000 11.6717 0.259631-Mar-17 10.0000 11.4194 0.007328-Apr-17 10.0000 11.4155 0.0034
ICICI Prudential Income Opportunities Fund - Direct Plan - Half Yearly Dividend
Record Date Face Value (Rs) NAV (Rs) Dividend (Rs.)/Unit
23-Mar-16 10.0000 10.6706 0.339828-Sep-16 10.0000 11.1138 0.642423-Mar-17 10.0000 10.7295 0.2108
ICICI Prudential Regular Savings Fund - Direct Plan - Annual Dividend
Record Date Face Value (Rs) NAV (Rs) Dividend (Rs.)/Unit
18-Mar-16 10.0000 10.8292 0.558723-Mar-17 10.0000 11.4312 1.1306
ICICI Prudential Regular Savings Fund - Annual Dividend
Record Date Face Value (Rs) NAV (Rs) Dividend (Rs.)/Unit
18-Mar-16 10.0000 10.7508 0.695023-Mar-17 10.0000 11.0912 1.0081
Record Date Face Value (Rs) NAV (Rs) Dividend (Rs.)/Unit
ICICI Prudential Regular Savings Fund - Quarterly Dividend
30-Sep-16 10.0000 10.7037 0.336029-Dec-16 10.0000 10.5680 0.199831-Mar-17 10.0000 10.5684 0.1698
Record Date Face Value (Rs) NAV (Rs) Dividend (Rs.)/Unit
ICICI Prudential Regular Savings Fund - Direct Plan - Quarterly Dividend
30-Sep-16 10.0000 11.2981 0.373929-Dec-16 10.0000 11.1622 0.235331-Mar-17 10.0000 11.1689 0.2077
ICICI Prudential Long Term - Annual Dividend
Record Date Face Value (Rs) NAV (Rs) Dividend (Rs.)/Unit
26-Sep-14 10.0000 12.8616 2.100328-Sep-15 10.0000 12.1172 1.364928-Sep-16 10.0000 12.2689 1.3508
ICICI Prudential Long Term Plan - Direct Plan - Weekly Dividend
Record Date Face Value (Rs) NAV (Rs) Dividend (Rs.)/Unit
22-Nov-16 10.0000 10.7563 0.198429-Nov-16 10.0000 10.6013 0.043406-Dec-16 10.0000 10.6129 0.0550
ICICI Prudential Long Term - Direct Plan - Annual Dividend
Record Date Face Value (Rs) NAV (Rs) Dividend (Rs.)/Unit
26-Sep-14 10.0000 12.8692 2.200828-Sep-15 10.0000 12.0946 1.434128-Sep-16 10.0000 12.2564 1.3835
ICICI Prudential Long Term - Dividend
Record Date Face Value (Rs) NAV (Rs) Dividend (Rs.)/Unit
26-Sep-14 10.0000 12.1619 1.8708
ICICI Prudential Long Term - Direct Plan - Quarterly Dividend
Record Date Face Value (Rs) NAV (Rs) Dividend (Rs.)/Unit
27-Oct-16 10.0000 11.6106 0.419227-Jan-17 10.0000 11.6277 0.409127-Apr-17 10.0000 11.2085 0.0072
ICICI Prudential Long Term Plan - Quarterly Dividend
Record Date Face Value (Rs) NAV (Rs) Dividend (Rs.)/Unit
29-Jul-16 10.0000 11.3892 0.422727-Oct-16 10.0000 11.3477 0.388227-Jan-17 10.0000 11.3724 0.3876
ICICI Prudential Long Term Plan - Weekly DividendRecord Date Face Value (Rs) NAV (Rs) Dividend (Rs.)/Unit
15-Nov-16 10.0000 10.6986 0.160122-Nov-16 10.0000 10.7355 0.197006-Dec-16 10.0000 10.6347 0.0163
ICICI Prudential Income Plan - Direct Plan - Half Yearly Dividend
Record Date Face Value (Rs) NAV (Rs) Dividend (Rs.)/Unit
30-Mar-16 10.0000 11.8858 0.448530-Sep-16 10.0000 12.5703 1.063231-Mar-17 10.0000 11.9333 0.3111
ICICI Prudential Income Plan - Annual Dividend
Record Date Face Value (Rs) NAV (Rs) Dividend (Rs.)/Unit
09-Oct-15 10.0000 10.4033 0.033410-Oct-16 10.0000 11.6463 1.1567
ICICI Prudential Income Plan - Direct Plan - Annual Dividend Record Date Face Value (Rs) NAV (Rs) Dividend (Rs.)/Unit
09-Oct-15 10.0000 11.4301 0.000510-Oct-16 10.0000 12.9589 1.4683
ICICI Prudential Income Plan - Quarterly Dividend Option
Record Date Face Value (Rs) NAV (Rs) Dividend (Rs.)/Unit
30-Jun-16 10.0000 12.0639 0.281830-Sep-16 10.0000 12.4857 0.636629-Dec-16 10.0000 12.1292 0.3161
ICICI Prudential Income Plan - Direct Plan - Quarterly Dividend
Record Date Face Value (Rs) NAV (Rs) Dividend (Rs.)/Unit
30-Sep-16 10.0000 12.7078 0.671829-Dec-16 10.0000 12.3480 0.346531-Mar-17 10.0000 12.1325 0.0140
ICICI Prudential Income Plan - Half Yearly Dividend
Record Date Face Value (Rs) NAV (Rs) Dividend (Rs.)/Unit
30-Mar-16 10.0000 11.1641 0.364130-Sep-16 10.0000 11.8199 0.956531-Mar-17 10.0000 11.2123 0.2432

Dividend History
6979130
ICICI Prudential Constant Maturity Gilt Fund - Direct Plan - Annual Dividend
Record Date Face Value (Rs) NAV (Rs) Dividend (Rs.)/Unit
14-Sep-15 10.0000 11.2758 1.057012-Sep-16 10.0000 11.6382 0.8910
ICICI Prudential Constant Maturity Gilt Fund - Annual Dividend
Record Date Face Value (Rs) NAV (Rs) Dividend (Rs.)/Unit
14-Sep-15 10.0000 11.2415 1.071712-Sep-16 10.0000 11.5387 0.9773
ICICI Prudential Constant Maturity Gilt Fund - Monthly Dividend
Record Date Face Value (Rs) NAV (Rs) Dividend (Rs.)/Unit
15-Nov-16 10.0000 11.3620 0.100813-Dec-16 10.0000 11.3446 0.083412-Jan-17 10.0000 11.3182 0.0570
ICICI Prudential Constant Maturity Gilt Fund - Direct Plan - Monthly Dividend
Record Date Face Value (Rs) NAV (Rs) Dividend (Rs.)/Unit
15-Nov-16 10.0000 11.5507 0.102413-Dec-16 10.0000 11.5337 0.085412-Jan-17 10.0000 11.5070 0.0587
ICICI Prudential Constant Maturity Gilt Fund - Quarterly Dividend
Record Date Face Value (Rs) NAV (Rs) Dividend (Rs.)/Unit
13-Jun-16 10.0000 10.9156 0.367512-Sep-16 10.0000 11.1759 0.556213-Dec-16 10.0000 11.1166 0.4037
ICICI Prudential Constant Maturity Gilt Fund - Direct Plan - Half Yearly Dividend
Record Date Face Value (Rs) NAV (Rs) Dividend (Rs.)/Unit
14-Mar-16 10.0000 10.8612 0.327012-Sep-16 10.0000 11.5744 0.770414-Mar-17 10.0000 10.9911 0.2141
ICICI Prudential Constant Maturity Gilt Fund - Half Yearly Dividend
Record Date Face Value (Rs) NAV (Rs) Dividend (Rs.)/Unit
14-Mar-16 10.0000 10.5883 0.300612-Sep-16 10.0000 11.2822 0.747314-Mar-17 10.0000 10.7103 0.2019
ICICI Prudential Constant Maturity Gilt Fund - Direct Plan - Quarterly Dividend
Record Date Face Value (Rs) NAV (Rs) Dividend (Rs.)/Unit
13-Jun-16 10.0000 10.9033 0.376212-Sep-16 10.0000 11.1643 0.312013-Dec-16 10.0000 11.3652 0.4229
ICICI Prudential Long Term Gilt Fund - Direct Plan - Dividend
Record Date Face Value (Rs) NAV (Rs) Dividend (Rs.)/Unit
23-Nov-15 10.0000 12.9775 0.562730-May-16 10.0000 13.0538 0.613828-Nov-16 10.0000 14.3442 1.7754
ICICI Prudential Short Term Gilt Fund - Dividend
Record Date Face Value (Rs) NAV (Rs) Dividend (Rs.)/Unit
30-May-16 10.0000 12.5901 0.515829-Aug-16 10.0000 12.5215 0.427329-Nov-16 10.0000 12.6125 0.4925
23-Mar-16 10.0000 10.9944 0.251723-Sep-16 10.0000 11.8727 1.033023-Mar-17 10.0000 11.1029 0.1704
ICICI Gilt Fund - Invest Plan - PF Option-Direct Plan - Half Yearly Dividend
Record Date Face Value (Rs) NAV (Rs) Dividend (Rs.)/Unit
Dividend is gross dividend. To arrive at the net dividend payable for corporate and non-corporate investors applicable dividend distribution tax, if any, needs to be adjusted respectively. Past performance may or may not be sustained in future. After payment of dividend the NAV has fallen to the extent of payout and distribution taxes if applicable. For complete dividend history details please refer to our website www.icicipruamc.com, Download section-NAV and Dividend history section.
ICICI Prudential Short Term Gilt Fund - Direct Plan - Dividend
Record Date Face Value (Rs) NAV (Rs) Dividend (Rs.)/Unit
30-May-16 10.0000 12.7652 0.537029-Aug-16 10.0000 12.6965 0.447029-Nov-16 10.0000 12.7878 0.5113
ICICI Prudential Short Term Gilt Fund - Half Yearly Dividend
Record Date Face Value (Rs) NAV (Rs) Dividend (Rs.)/Unit
30-Nov-15 10.0000 11.6586 0.469527-May-16 10.0000 11.8041 0.588828-Nov-16 10.0000 12.1300 0.8803
ICICI Prudential Short Term Gilt Fund - Direct Plan - Half Yearly Dividend
Record Date Face Value (Rs) NAV (Rs) Dividend (Rs.)/Unit
28-Nov-16 10.0000 12.1500 1.7837
ICICI Gilt Fund Treasury Plan PF Option - Quarterly Dividend
Record Date Face Value (Rs) NAV (Rs) Dividend (Rs.)/Unit
24-May-13 10.0000 10.7224 0.354424-Sep-14 10.0000 10.1671 0.0282
ICICI Gilt Fund Treasury Plan PF Option - Direct Plan - Quarterly Dividend
Record Date Face Value (Rs) NAV (Rs) Dividend (Rs.)/Unit
24-Sep-14 10.0000 10.4852 0.258016-Sep-15 10.0000 10.3868 0.155623-Mar-16 10.0000 11.2640 0.2407
ICICI Prudential Long Term Gilt Fund - Dividend
Record Date Face Value (Rs) NAV (Rs) Dividend (Rs.)/Unit
23-Nov-15 10.0000 12.7125 0.505730-May-16 10.0000 12.7920 0.562128-Nov-16 10.0000 14.0596 1.7048
ICICI Gilt Fund - Invest Plan - PF Option - Half Yearly Dividend
Record Date Face Value (Rs) NAV (Rs) Dividend (Rs.)/Unit
23-Mar-16 10.0000 11.3385 0.240723-Sep-16 10.0000 12.2435 1.046623-Mar-17 10.0000 11.4624 0.1701

Investment Objective of all the schemes
ICICI Prudential Focused Bluechip Equity Fund
To generate long-term capital appreciation and income distribution to unit holders from a portfolio that is invested in equity and equity related securities of about 20 companies belonging to the large cap domain and the balance in debt securities and money market instruments. The Fund Manager will always select stocks for investment from among Top 200 stocks in terms of market capitalization on the National Stock Exchange of India Ltd. If the total assets under management under this scheme goes above Rs. 1,000 crores the Fund Manager reserves the right to increase the number of companies to more than 20.
ICICI Prudential Select Large Cap Fund
To generate capital appreciation by investing in equity or equity related securities of large market capitalization companies constituting the S&P BSE 100 index and providing investors with options to withdraw their investment automatically based on triggers for pre-set levels of return as and when they are achieved.
ICICI Prudential Top 100 Fund
To generate long-term capital appreciation from a portfolio that is invested predominantly in equity and equity related securities
ICICI Prudential Dynamic Plan
To generate capital appreciation by actively investing in equity and equity related securities. For defensive considerations, the Scheme may invest in debt, money market instruments and derivatives. The investment manager will have the discretion to take aggressive asset calls i.e. by staying 100% invested in equity market/equity related instruments at a given point of time and 0% at another, in which case, the fund may be invested in debt related instruments at its discretion. The AMC may choose to churn the portfolio of the Scheme in order to achieve the investment objective. The Scheme is suitable for investors seeking high returns and for those who are willing to take commensurate risks.
ICICI Prudential Multicap Fund (Erstwhile ICICI Prudential Top 200 Fund)
To generate capital appreciation through investments in equity and equity related securities in core sectors and associated feeder industries.
ICICI Prudential Dividend Yield Equity Fund
The investment objective of ICICI Prudential Dividend Yield Equity Fund is to provide medium to long term capital gains and/or dividend distribution by investing in a well diversified portfolio of predominantly equity and equity related instruments, which offer attractive dividend yield. However, there can be no assurance that the investment objective of the Scheme will be realized.
ICICI Prudential Value Discovery Fund
To generate returns through a combination of dividend income and capital appreciation by investing primarily in a well-diversified portfolio of value stocks. Value stocks are those, which have attractive valuations in relation to earnings or book value or current and/or future dividends.
ICICI Prudential Midcap Fund
The primary objective of the Scheme is to seek to generate capital appreciation by actively investing in diversified mid cap stocks.
ICICI Prudential Infrastructure Fund
To generate capital appreciation and income distribution to unit holders by investing predominantly in equity/equity related securities of the companies belonging to the infrastructure development and balance in debt securities and money market instruments.
ICICI Prudential Technology Fund
To generate long-term capital appreciation by creating a portfolio that is invested in equity and equity related securities of technology and technology dependent companies.
ICICI Prudential FMCG Fund
To generate long term capital appreciation through investments made primarily in equities of select group of companies in the FMCG Sector. The AMC will be broadly guided, while investing the corpus of the Scheme, among other criteria, by the market capitalization of the companies.
ICICI Prudential Banking & Financial Services Fund
To generate long-term capital appreciation to unit holders from a portfolio that is invested predominantly in equity and equity related securities of companies engaged in banking and financial services.
ICICI Prudential Long Term Equity Fund (Tax Saving) (Erstwhile ICICI Prudential Tax Plan)
To generate long-term capital appreciation through investments made primarily in equity and equity related securities of companies.
ICICI Prudential US Bluechip Equity Fund
The investment objective of ICICI Prudential US Bluechip Equity Fund is to provide long term capital appreciation to investors by primarily investing in equity and equity related securities (including ADRs/GDRs issued by Indian and foreign companies) of companies listed on New York Stock Exchange and/or NASDAQ. However, there can be no assurance that the investment objective of theScheme will be realized.
ICICI Prudential Equity - Arbitrage Fund
To generate low volatility returns by using arbitrage and other derivative strategies in equity markets and investments in short-term debt portfolio.
ICICI Prudential Exports and Other Services Fund
To generate capital appreciation and income distribution to unit holders by investing predominantly in equity/equity related securities of the companies belonging to the service industry and balance in debt securities and money market instruments.
Equity Funds
ICICI Prudential Global Stable Equity Fund
ICICI Prudential Global Stable Equity Fund (the Scheme) is an open-ended fund of funds scheme that seeks to provide adequate returns by investing in the units of one or more overseas mutual fund schemes, which have the mandate to invest globally. Currently the Scheme intends to invest in the units/shares of Nordea 1 – Global Stable Equity Fund – Unhedged (N1 – GSEF - U). The fund manager may also invest in one or more other overseas mutual fund schemes, with similar investment policy/fundamental attributes and risk profile and is in accordance with the investment strategy of the Scheme. The Scheme may also invest a certain portion of its corpus in domestic money market securities and/or money market/liquid schemes of domestic mutual funds including that of ICICI Prudential Mutual Fund, in order to meet liquidity requirements from time to time. However, there can be no assurance that the investment objective of the Scheme will be realized.
ICICI Prudential Indo Asia Equity Fund
To generate long term capital appreciation by investing in equity, equity related securities and or share classes/units of equity funds of companies, which are incorporated or have their area of primary activity, in the Asia Pacific region. Initially the Scheme will be investing in share classes of International Opportunities Fund (I.O.F) Asian Equity Fund and thereafter the Fund Manager of ICICI Prudential Indo Asia Equity Fund may choose to make investment in listed equity shares, securities in the Asia Pacific Region.
ICICI Prudential Growth Fund - Series 1
The investment objective of the Scheme is to provide capital appreciation by investing in a well diversified portfolio of equity and equity related securities.However, there can be no assurance that the investment objective of the Scheme will be realized.
ICICI Prudential Growth Fund - Series 2
The investment objective of the Scheme is to provide capital appreciation by investing in a well diversified portfolio of equity and equity related securities.However, there can be no assurance that the investment objective of the Scheme will be realized.
ICICI Prudential Growth Fund - Series 3
The investment objective of the Scheme is to provide capital appreciation by investing in a well diversified portfolio of equity and equity related securities.However, there can be no assurance that the investment objective of the Scheme will be realized.
131
ICICI Prudential Growth Fund - Series 4
The investment objective of the Scheme is to provide capital appreciation by investing in a well-diversified portfolio of equity and equity related securities. However, there can be no assurance that the investment objective of the Scheme will be realized.
Investment Objective of all the schemes
ICICI Prudential Value Fund - Series 1
The investment objective of the Scheme is to provide capital appreciation by investing in a well diversified portfolio of stocks through fundamental analysis.However, there can be no assurance that the investment objectives of the scheme will be realized.
ICICI Prudential Value Fund - Series 2
The investment objective of the Scheme is to provide capital appreciation by investing in a well diversified portfolio of stocks through fundamental analysis.However, there can be no assurance that the investment objectives of the scheme will be realized.
ICICI Prudential Value Fund - Series 3
The investment objective of the Scheme is to provide capital appreciation by investing in a well diversified portfolio of stocks through fundamental analysis.However, there can be no assurance that the investment objectives of the Scheme will be realized.
ICICI Prudential Growth Fund - Series 8
The investment objective of the Scheme is to provide capital appreciation by investing in a well-diversified portfolio of equity and equity related securities. However, there can be no assurance that the investment objective of the Scheme will be realized.
ICICI Prudential Value Fund - Series 5
The investment objective of the Scheme is to provide capital appreciation by investing in a well diversified portfolio of stocks through fundamental analysis.However, there can be no assurance that the investment objectives of the Scheme will be realized.
ICICI Prudential Value Fund - Series 6
The investment objective of the Scheme is to provide capital appreciation by investing in a well diversified portfolio of stocks through fundamental analysis. However, there can be no assurance that the investment objectives of the Scheme will be realized.
ICICI Prudential Value Fund - Series 7
The investment objective of the Scheme is to provide capital appreciation by investing in a well diversified portfolio of stocks through fundamental analysis. However, there can be no assurance that the investment objectives of the Scheme will be realized.
ICICI Prudential Value Fund - Series 8
The investment objective of the Scheme is to provide capital appreciation by investing in a well diversified portfolio of stocks through fundamental analysis.However, there can be no assurance that the investment objectives of the Scheme will be realized.
ICICI Prudential Value Fund - Series 4
The investment objective of the Scheme is to provide capital appreciation by investing in a well diversified portfolio of stocks through fundamental analysis.However, there can be no assurance that the investment objective of the Scheme will be realized.
ICICI Prudential Growth Fund - Series 6
The investment objective of the Scheme is to provide capital appreciation by investing in a well-diversified portfolio of equity and equity related securities. However, there can be no assurance that the investment objective of the Scheme will be realized.
ICICI Prudential Growth Fund - Series 7
The investment objective of the Scheme is to provide capital appreciation by investing in a well-diversified portfolio of equity and equity related securities. However, there can be no assurance that the investment objective of the Scheme will be realized.
ICICI Prudential Growth Fund - Series 5
The investment objective of the Scheme is to provide capital appreciation by investing in a well-diversified portfolio of equity and equity related securities. However, there can be no assurance that the investment objective of the Scheme will be realized.
ICICI Prudential India Recovery Fund – Series 3
The investment objective of the Scheme is to provide capital appreciation by investing in equity and equity related securities that are likely to benefit from recovery in the Indian economy.However, there can be no assurance that the investment objectives of the Scheme will be realized.
ICICI Prudential India Recovery Fund – Series 2
The investment objective of the Scheme is to provide capital appreciation by investing in equity and equity related securities that are likely to benefit from recovery in the Indian economy. However, there can be no assurance that the investment objectives of the Scheme will be realized.
ICICI Prudential India Recovery Fund – Series 1
The investment objective of the Scheme is to provide capital appreciation by investing in equity and equity related securities that are likely to benefit from recovery in the Indian economy. However, there can be no assurance that the investment objectives of the Scheme will be realized.
ICICI Prudential Business Cycle Fund - Series 1
The investment objective of the Scheme is to provide capital appreciation by predominantly investing in equity and equity related securities with focus on riding business cycles through dynamic allocation between various sectors and stocks.However, there can be no assurance that the investment objective of the Scheme will be realized.
ICICI Prudential Business Cycle Fund - Series 2
The investment objective of the Scheme is to provide capital appreciation by predominantly investing in equity and equity related securities with focus on riding business cycles through dynamic allocation between various sectors and stocks.However, there can be no assurance that the investment objective of the Scheme will be realized.
ICICI Prudential Business Cycle Fund - Series 3
The investment objective of the Scheme is to provide capital appreciation by predominantly investing in equity and equity related securities with focus on riding business cycles through dynamic allocation between various sectors and stocks.However, there can be no assurance that the investment objective of the Scheme will be realized.
ICICI Prudential India Recovery Fund - Series 4
The investment objective of the Scheme is to provide capital appreciation by investing in equity and equity related securities that are likely to benefit from recovery in the Indian economy.However, there can be no assurance that the investment objectives of the Scheme will be realized.
ICICI Prudential India Recovery Fund - Series 5
The investment objective of the Scheme is to provide capital appreciation by investing in equity and equity related securities that are likely to benefit from recovery in the Indian economy.However, there can be no assurance that the investment objectives of the Scheme will be realized.
132
ICICI Prudential Value Fund - Series 9
The investment objective of the Scheme is to provide capital appreciation by investing in a well diversified portfolio of stocks through fundamental analysis.However, there can be no assurance that the investment objective of the Scheme will be realized.
ICICI Prudential Value Fund - Series 10
The investment objective of the Scheme is to provide capital appreciation by investing in a well diversified portfolio of stocks through fundamental analysis.However, there can be no assurance that the investment objectives of the Scheme will be realized.
ICICI Prudential Value Fund - Series 11
The investment objective of the Scheme is to provide capital appreciation by investing in a well diversified portfolio of stocks through fundamental analysis.However, there can be no assurance that the investment objectives of the Scheme will be realized.
ICICI Prudential Value Fund - Series 12
The investment objective of the Scheme is to provide capital appreciation by investing in a well-diversified portfolio of stocks through fundamental analysis.However, there can be no assurance that the investment objective of the Scheme will be realized.

133
Investment Objective of all the schemes
ICICI Prudential Liquid Plan
To provide reasonable returns, commensurate with low risk while providing a high level of liquidity, through investments made primarily in money market and debt securities.
ICICI Prudential Money Market Fund
The Scheme seeks to provide reasonable returns, commensurate with low risk while providing a high level of liquidity, through investments made in money market securities.
Debt Funds
ICICI Prudential Savings Fund
To generate income through investments in a range of debt and money market instruments of various maturities with a view to maximising income while maintaining the optimum balance of yield, safety and liquidity.
ICICI Prudential Ultra Short Term Plan
To generate regular income through investments in a basket of debt and money market instruments of very short maturities with a view to providing reasonable returns, while maintaining an optimum balance of safety, liquidity and yield.
ICICI Prudential Flexible Income Plan
To generate income through investments in a range of debt and money marketinstruments of various maturities with a view to maximising income whilemaintaining the optimum balance of yield, safety and liquidity.
ICICI Prudential Regular Gold Savings Fund
ICICI Prudential Regular Gold Savings Fund (the Scheme) is a fund of funds scheme with the primary objective to generate returns by investing in units of ICICI Prudential Gold iWIN ETF (IPru Gold ETF). However, there can be no assurance that the investment objective of the Scheme will be realized.
ICICI Prudential Monthly Income Plan (An open ended income fund. Monthly income is not assured and is subject to the availability of distributable surplus.)
To generate regular income through investments primarily in debt and money market instruments. As a secondary objective, the Scheme also seeks to generate long term capital appreciation from the portion of equity investments under the Scheme.
ICICI Prudential MIP 25 (An open ended Income fund. Monthly income isnot assured and is subject to the availability of distributable surplus.)
To generate regular income through investments primarily in debt and money market instruments. As a secondary objective, the Scheme also seeks to generate long term capital appreciation from the portion of equity investments under the Scheme.
Hybrid Funds
ICICI Prudential Child Care Plan (Study Plan)
The primary investment objective of the Study Plan is to seek generation of current income by creating a portfolio that is invested in debt, money market instruments and equity and equity related securities.
ICICI Prudential Regular Income Fund (An open ended income fund. Incomeis not assured and is subject to the availability of distributable surplus.)
The Scheme seeks to generate regular income through investments in fixed income securities so as to make regular dividend distribution to unitholders seeking the Dividend Option. The secondary objective of the Scheme is to generate long-term capital appreciation by investing a portion of the Scheme's assets in equity and equity related instruments.
ICICI Prudential Gold iWIN ETF
ICICI Prudential Gold iWIN ETF seeks to provide investment returns that, before expenses, closely track the performance of domestic prices of Gold derived from the LBMA AM fixing prices. However, the performance of the Scheme may differ from that of the underlying gold due to tracking error. There can be no assurance or guarantee that the investment objective of the Scheme will be achieved. The fund is not actively managed. It does not engage in any activities designed to obtain a profit from, or to ameliorate losses caused by, changes in the price of gold.
ICICI Prudential Midcap Select iWIN ETF
The investment objective of the scheme is to provide returns before expenses that closely correspond to the total return of the underlying index subject to tracking errors.However, there can be no assurance or guarantee that the investment objective of the Scheme would be achieved.
ICICI Prudential Sensex iWIN ETF (Erstwhile SENSEX Prudential ICICI Exchange Traded Fund)
The investment objective of the “SPIcE” is to provide investment returns that, before expenses, closely correspond to the total returns of the securities as represented by the S&P BSE SENSEX. However, the performance of Scheme may differ from that of the underlying index due to tracking error. There can be no assurance or guarantee that the investment objective of the Scheme will be achieved.
ICICI Prudential Nifty iWIN ETF
The investment objective of the Schemes is to provide returns before expenses that closely correspond to the total return of the Underlying Index, subject to tracking errors. However, there can be no assurance or guarantee that the investment objective of the Scheme would be achieved.
ICICI Prudential Nifty Index Fund (Erstwhile ICICI Prudential Index Fund)
An open-ended index linked growth scheme seeking to track the returns of the Nifty 50 through investments in a basket of stocks drawn from the constituents of the above index. The objective of the Scheme is to invest in companies whose securities are included in Nifty and subject to tracking errors, to endeavor to achieve the returns of the above index as closely as possible. This would be done by investing in almost all the stocks comprising the Nifty 50 in approximately the same weightage that they represent in Nifty 50 . The Plan will not seek to outperform the Nifty 50 or to under perform it. The objective is that the performance of the NAV of the Plan should closely track the performance of the Nifty 50 over the same period.
ICICI Prudential Nifty Next 50 Index Fund (Erstwhile ICICI Prudential Nifty Junior Index Fund)
The investment objective of the Scheme is to invest in companies whose securities are included in Nifty Next 50 Index (the Index) and to endeavor to achieve the returns of the above index as closely as possible, though subject to tracking error. The Scheme will not seek to outperform the Nifty Next 50. The objective is that the performance of the NAV of the Scheme should closely track the performance of the Nifty Next 50 over the same period subject to tracking error. However, there is no assurance that the investment objective of the Scheme will be realized.
ICICI Prudential Nifty 100 iWIN ETF (Erstwhile ICICI Prudential CNX 100 ETF)
The investment objective of the Schemes is to provide returns before expenses that closely correspond to the total return of the Underlying Index, subject to tracking errors. However, there can be no assurance or guarantee that the investment objective of the Scheme would be achieved.
ICICI Prudential Equity Income Fund
The Scheme seeks to generate regular income through investments in fixed income securities and using arbitrage and other derivative strategies. The Scheme also intends to generate long-term capital appreciation by investing a portion of the Scheme’s assets in equity and equity related instruments. However there can be no assurance that the investment objectives of the scheme will be realized.
ICICI Prudential Balanced Advantage Fund
To provide capital appreciation and income distribution to the investors by using equity derivatives strategies, arbitrage opportunities and pure equity investments.
ICICI Prudential NV20 iWIN ETF
The investment objective of the scheme is to provide returns before expenses that closely correspond to the total return of the underlying index subject to tracking errors. However, there can be no assurance or guarantee that the investment objective of the Scheme would be achieved.
ICICI Prudential Balanced Fund
To generate long term capital appreciation and current income from a portfolio that is invested in equity and equity related securities as well as in fixed income securities.
ICICI Prudential Child Care Plan (Gift Plan)
The primary investment objective of the Gift Plan is to seek generation of capital appreciation by creating a portfolio that is invested in equity and equity related securities and debt and money market instruments.
ICICI Prudential R.I.G.H.T (Rewards of investing & generation of healthy tax savings) Fund
ICICI Prudential R.I.G.H.T. Fund (Rewards of Investing and Generation of Healthy Tax Savings) is a ten year close-ended equity linked savings scheme that seeks to generate long-term capital appreciation to unit-holders from a portfolio that is invested predominantly in equity and equity related securities of large capitalization companies and emerging mid cap companies along with income tax benefit. The investment policies shall be framed in accordance with SEBI (Mutual Funds) Regulations, 1996 and rules and guidelines for Equity Linked savings Scheme (ELSS), 2005 (and modifications to them).However, there can be no assurance that the investment objective of the Scheme will be realized.

Investment Objective of all the schemes
134
ICICI Prudential Short Term Plan
To generate income through investments in a range of debt and money market instruments of various maturities with a view to maximising income while maintaining the optimum balance of yield, safety and liquidity.
ICICI Prudential Banking & PSU Debt Fund
To generate regular income through investments in a basket of debt and money market instruments consisting predominantly of securities issued by entities such as Banks and Public Sector Undertakings (PSU) with a view to providing reasonable returns, while maintaining an optimum balance of safety, liquidity and yield.
ICICI Prudential Long Term Gilt Fund
To generate income through investment in Gilts of various maturities.
ICICI Prudential Gilt Fund Treasury Plan PF Option
To generate income through investment in Gilts of various maturities.
ICICI Prudential Advisor Series - Long Term Savings Plan
The primary investment objective of this Plan is to seek to generate long term capital appreciation from a portfolio that is invested predominantly in the schemes of domestic or offshore Mutual Fund(s) mainly having asset allocation to: • Equity and equity related securities and • A small portion in debt and money market instruments. However, there can be no assurance that the investment objective of the Scheme will be realized.
ICICI Prudential Advisor Series - Cautious Plan
The primary investment objective of this Plan is to seek to generate regular income primarily through investments in the schemes of domestic or offshore Mutual Fund(s) having asset allocation: • Primarily to fixed income securities • To a lesser extent (maximum 35%) in equity and equity related securities so
as to generate long-term capital appreciation. However, there can be no assurance that the investment objectives of the Plan/s will be realized.
ICICI Prudential Advisor Series - Moderate Plan
The primary investment objective of this Plan is to seek to generate long term capital appreciation and current income by creating a portfolio that is invested in the schemes of domestic or offshore Mutual Fund(s) mainly having asset allocation to: • Equity and equity related securities as well as • fixed income securities However, there can be no assurance that the investment objectives of the Plan/s will be realized.
Fund of Funds
ICICI Prudential Advisor Series - Dynamic Accrual Plan
The primary investment objective of this Plan is to seek to provide reasonable returns, commensurate with low risk while providing a high level of liquidity, through investments made primarily in the schemes of domestic or offshore Mutual Fund(s) having asset allocation to: • Money market and debt securities.This Plan may be considered to be ideal for investor’s having a low risk appetite and a shorter duration of investment. However, there can be no assurance that the investment objectives of the Plan/s will be realized.
ICICI Prudential Constant Maturity Gilt Fund
The Scheme aims to provide reasonable returns by investing in portfolio of Government Securities with average maturity of around 10 years. However, there can be no assurance that the investment objective of the Scheme will be realized.
ICICI Prudential Gilt Fund Investment Plan PF Option
To generate income through investment in Gilts of various maturities.
ICICI Prudential Income Plan
To generate income through investments in a range of debt and money market instruments of various maturities with a view to maximising income while maintaining the optimum balance of yield, safety and liquidity.
ICICI Prudential Long Term Plan
To generate income through investments in a range of debt and money market instruments of various maturities with a view to maximising income while maintaining the optimum balance of yield, safety and liquidity.
ICICI Prudential Short Term Gilt Fund
To generate income through investment in Gilts of various maturities.
ICICI Prudential Corporate Bond Fund
To generate income through investments in a range of debt and money market instruments of various maturities with a view to maximising income while maintaining the optimum balance of yield, safety and liquidity.
ICICI Prudential Income Opportunities Fund
To generate income through investments in a range of debt and money market instruments of various credit ratings and maturities with a view to maximizing income while maintaining an optimum balance of yield, safety and liquidity.
ICICI Prudential Regular Savings Fund
It intends to provide reasonable returns, by maintaining an optimum balance of safety, liquidity and yield, through investments in a basket of debt and money market instruments with a view to delivering consistent performance.
ICICI Prudential Dynamic Bond Fund
To generate regular income through investments in debt and money market instruments with a view to provide regular dividend payments and a secondary objective of growth of capital.

Schedule 1: One Liner Definitions
Sharpe Ratio :The Sharpe Ratio is a measure for calculating risk-adjusted return, Itis the average return earned in excess of the risk-free rate per unit of volatility or total risk.
Beta Ratio (Portfolio Beta) :Beta is a measure of the volatility, or systematic risk, of a security or a portfolio in comparison to the market as a whole.
Modified Duration :Modified duration follows the concept that interest rates and bond prices move in opposite directions. This ratio is used to determine the effect that a 100-basis-point (1%) change in interest rates will have on the price of a bond.
Standard Deviation :Standard deviation is a measure of the dispersion of a set of data from its mean. The more spread apart the data, the higher the deviation. It is applied to the annual rate of return of an investment to measure the investment's volatility.
Risk Free Return:The rate of return attributed to an investment with zero risk. The risk-free rate represents the interest on an investor's money that would expect from an absolutely risk-free investment over a specified period of time.
Tracking Error:A divergence between the price behavior of a position or a portfolio and the price behavior of a benchmark.
Total Expense Ratio : Total expense ratio is the percentage of net expenses that are charged by the fund. The net asset value of the fund is calculated after deducting total expense ratio.
Average Maturity : Weighted Average Maturity of the assets.
Portfolio Yield (Yield To Maturity) : Weighted Average valuation yield of the assets.
Average portfolio PE (Average P/E) :It is price to earnings ratio of the stocks calculated for the entire portfolio on a weighted average basis.
Average portfolio price to book ratio (Average P/BV) : It is price to book value of the stocks calculated for the entire portfolio on a weighted average basis.
Average portfolio dividend yield (Average Dividend Yield) :It is dividend yield of the stocks calculated for the entire portfolio on a weighted average basis.
R Squared : It is a statistical measure of how closely the portfolio returns are correlated with its benchmark.
Growth and Cumulative option :Growth and Cumulative words are used alternatively.
135

Schedule 2: How To Read Factsheet
Fund Manager :An employee of the asset management company such as a mutual fund or life insurer, who manages investments of the scheme. He is usually part of a larger team of fund managers and research analysts.
Application Amount for Fresh Subscription :This is the minimum investment amount for a new investor in a mutual fund scheme.
Minimum Additional Amount :This is the minimum investment amount for an existing investor in a mutual fund scheme.
Yield to Maturity :The Yield to Maturity or the YTM is the rate of return anticipated on a bond if held until maturity. YTM is expressed as an annual rate. The YTM factors in the bond's current market price, par value, coupon interest rate and time to maturity.
SIP :SIP or systematic investment plan works on the principle of making periodic investments of a fixed sum. It works similar to a recurring bank deposit. For instance, an investor may opt for an SIP that invests Rs 500 every 15th of the month in an equity fund for a period of three years.
NAV :The NAV or the net asset value is the total asset value per unit of the mutual fund after deducting all related and permissible expenses. The NAV is calculated at the end of every business day. It is the value at which the investor enters or exits the mutual fund.
Benchmark :A group of securities, usually a market index, whose performance is used as a standard or benchmark to measure investment performance of mutual funds, among other investments. Some typical benchmarks include the Nifty, Sensex, BSE200, BSE500, 10-Year Gsec.
Entry Load :A mutual fund may have a sales charge or load at the time of entry and/or exit to compensate the distributor/agent. Entry load is charged at the time an investor purchases the units of a mutual fund. The entry load is added to the prevailing NAV at the time of investment. For instance, if the NAV is Rs. 100 and the entry load is 1 %, the investor will enter the fund at Rs. 101. Note: SEBI, vide circular dated June 30, 2009 has abolished entry load and mandated that the upfront commission to distributors will be paid by the investor directly to the distributor, based on his assessment of various factors including the service rendered by the distributor.
Exit Load :Exit load is charged at the time an investor redeems the units of a mutual fund. The exit loadis reduced from the prevailing NAV at the time of redemption. The investor will receiveredemption proceed at net value of NAV less Exit Load. For instance if the NAV is Rs.100and the exit load is 1%, the investor will receive Rs.99
Modified Duration :Modified duration is the price sensitivity and the percentage change in price for a unit change in yield.
Standard Deviation :Standard deviation is a statistical measure of the range of an investment's performance. When a mutual fund has a high standard deviation, its means its range of performance is wide, implying greater volatility.
Sharpe Ratio :The Sharpe Ratio, named after its founder, the Nobel Laureate William Sharpe, is a measure of risk-adjusted returns. It is calculated using standard deviation and excess return to determine reward per unit of risk.
136

Beta Ratio (Portfolio Beta) :Beta is a measure of an investment's volatility vis-a-vis the market. Beta of less than 1 means that the security will be less volatile than the market. A beta of greater than 1 implies that the security's price will be more volatile than the market.
Average portfolio PE (Average P/E) :It is price to earnings ratio of the stocks calculated for the entire portfolio on a weighted average basis.
Average portfolio price to book ratio (Average P/BV) : It is price to book value of the stocks calculated for the entire portfolio on a weighted average basis.
Average portfolio dividend yield (Average Dividend Yield) :It is dividend yield of the stocks calculated for the entire portfolio on a weighted average basis.
Net Equity : Net equity level is the net equity exposure percentage adjusted for any derivative positions in stocks or index for hedging or rebalancing purpose.
R Squared : It is a statistical measure of how closely the portfolio returns are correlated with its benchmark.
AUM :AUM or assets under management refers to the recent / updated cumulative market value of investments managed by a mutual fund or any investment firm.
Holdings :The holdings or the portfolio is a mutual fund's latest or updated reported statement of investments/securities. These are usually displayed in terms of percentage to net assets or the rupee value or both. The objective is to give investors an idea of where their money is being invested by the fund manager.
Nature of Scheme :The investment objective and underlying investments determine the nature of the mutual fund scheme. For instance, a mutual fund that aims at generating capital appreciation by investing in stock markets is an equity fund or growth fund. Likewise, a mutual fund that aims at capital preservation by investing in debt markets is a debt fund or income fund. Each of these categories may have sub-categories.
Rating Profile :Mutual funds invest in securities after evaluating their creditworthiness as disclosed by the ratings. A depiction of the mutual fund in various investments based on their ratings becomes the rating profile of the fund. Typically, this is a feature of debt funds.
Value STP : The ICICI Prudential Value STP is an innovation over the regular STP that enables you to take advantage of market fluctuations; you buy more units when the Net Asset Value (NAV) of your selected scheme falls and lesser units when the NAV rises. The Value STP helps you reach your targeted value for every transfer date, by adding or removing funds from your selected scheme.
Flex STP :ICICI Prudential Transfer Plan (“Flex STP”) is a facility wherein unit holder(s) of designated open-ended Scheme(s) of ICICI Prudential Mutual Fund can opt to transfer variable amount(s) linked to value of investments under Flex STP on the date of transfer at pre-determined intervals from designated open ended Scheme(s) of ICICI Prudential Mutual Fund [hereinafter referred to as “Transferor Scheme”] to the growth option of designated open-ended Scheme(s) of ICICI Prudential Mutual Fund [hereinafter referred to as “Transferee Scheme”].
137

ICICI Prudential Mutual Fund Corporate Office
ONE BKC, A - Wing, 13th Floor, Bandra-Kurla Complex, Mumbai 400 051, India.
Tel: 022 - 26525000 Fax: 022 - 26528100, website: www.icicipruamc.com, email id: [email protected]
Statutory Details & Risk Factors
Mutual Fund investments are subject to market risks, read all scheme related documents carefully.
Disclaimer: In the preparation of the material contained in this document, the Asset Management Company (AMC) has used information that is publicly available, including information developed in-house. Some of the material used in the document may have been obtained from members/persons other than the AMC and/or its affiliates and which may have been made available to the AMC and/or to its affiliates. Information gathered and material used in this document is believed to be from reliable sources. The AMC however does not warrant the accuracy, reasonableness and / or completeness of any information. We have included statements / opinions / recommendations in this document, which contain words, or phrases such as “will”, “expect”, “should”, “believe” and similar expressions or variations of such expressions that are “forward looking statements”. Actual results may differ materially from those suggested by the forward looking statements due to risk or uncertainties associated with our expectations with respect to, but not limited to, exposure to market risks, general economic and political conditions in India and other countries globally, which have an impact on our services and / or investments, the monetary and interest policies of India, inflation, deflation, unanticipated turbulence in interest rates, foreign exchange rates, equity prices or other rates or prices etc.
The AMC (including its affiliates), the Mutual Fund, the trust and any of its officers, directors, personnel and employees, shall not be liable for any loss, damage of any nature, including but not limited to direct, indirect, punitive, special, exemplary, consequential, as also any loss of profit in any way arising from the use of this material in any manner. The recipient alone shall be fully responsible/are liable for any decision taken on this material.
138

Transact on the go, anytime, anywhere
Benefit from expert advice with the touch to call feature
Stay updated with the latest news
Plan for your goals with a range of calculators
Track your investments with ease