may 10 2018 - lucaradiamond.com 10, 2018 · 5. safety, health, environment and community relations....
TRANSCRIPT
Annual General Meeting May 10 2018
Cautionary StatementForward‐looking information
This investor presentation contains forward‐looking statements and information as defined in applicable securities laws including: the estimates ofthe Company’s mineral reserve and resources; estimates of the Company’s production volumes; forecasted sales volumes and pricing; projectedrevenues of the Company; exploration and development plans and objectives including an anticipated resource upgrade; estimated productioncosts, exploration and development expenditures; estimates of ore to be mined by the Company and corresponding operating and sustaining costs;and the cost, timing and results of the commercialization of Clara. Generally, these forward‐looking statements can be identified by the use offorward‐looking terminology such as “expects”, “anticipates”, “believes”, “intends”, “estimates", "potential”, “possible” and similar expressions, orstatements that events, conditions or results “will”, “may”, “could” or “should” occur or achieved. Forward‐looking statements are based on theassumptions, opinions and estimates of management as of the date such statements are made, and they are subject to a number of known andunknown risks and uncertainties which may cause the actual results, performance or achievements of the Company to be materially different fromany future results, performance or achievement expressed or implied by such forward‐looking statements. In particular, such risks include generalbusiness and economic conditions, changes in interest and foreign currency rates, the supply and demand for, deliveries of and the level andvolatility of prices of rough diamonds, costs of power and diesel, acts of foreign governments and the outcome of legal proceedings, inaccurategeological and recoverability assumptions (including with respect to the size, grade and recoverability of mineral reserves and resources),unanticipated operational difficulties (including failure of plant, equipment or processes to operate in accordance with specifications or expectations),cost escalations, unavailability of materials and equipment, government action or delays in the receipt of government approvals, industrialdisturbances or other job actions, adverse weather conditions, unanticipated events relating to health safety and environmental matters, delays orfailure to successfully commercialize Clara’s platform, acceptance of Clara’s platform by the diamond industry, risks relating to the technologyunderlying Clara’s platform and other risks inherent in the implementation of new technologies, and other risks and uncertainties describe underRisks and Uncertainties disclosed under the heading “Risk Factors’ in the Company’s most recent Annual Information Form available athttp://www.sedar.com.
Forward‐looking statements and information speak only as of the date the statements were made, and the Company does not assume anyobligations to update or revise them to reflect new events or circumstances, except as required by law. Readers are cautioned not to place unduereliance on forward‐looking statements and information. This presentation does not constitute an offer or invitation to purchase or subscribe for anysecurities and no part of it shall form the basis of or be relied upon in connection with any investment decision in relation thereto.
Technical information
The technical information in this document for the AK6 diamond project (Karowe Mine) in Botswana is based on the following technical reports,respectively: NI 43‐101 Technical Report on the Feasibility Study for the AK6 Kimberlite Project, Botswana Prepared by MSA Geoservices (Pty) Ltd onbehalf of Lucara Diamond Corp., dated December 31, 2010 [NTD: should this refer to the amended report filed in Feb. 2011?]; the NI 43‐101Independent Technical Report dated February 4, 2014, based on update Mineral Resource Estimate released by Lucara Diamond Corp., datedDecember 19, 2013; NI 43‐101Technical Report on the Preliminary Economic Assessment of the Karowe Diamond Mine Underground Project,Botswana Prepared by Royal Haskoning DHV, dated effective October 31, 2017.
The authors of these technical reports are independent of the Company and are qualified persons for the purposes of National Instrument 43‐101 –Standards of Disclosure for Mineral Projects (“NI 43‐101”). The technical reports are available for review on SEDAR at www.sedar.com.
All currencies mentioned in this presentation are in United States Dollars (“US$”) unless otherwise mentioned.
2

The Investment Case
100% owned Karowe Mine in Botswana
• High margin diamond producer, in production since 2012
• One of the worlds’ foremost producers of large Type IIagem quality diamonds
• 158 diamonds have sold for > US$1 million each (total value in excess of US$600 M)
• $43 million in cash on hand, no debt
• PFS underway on Karowe underground with potential to extend mine-life to 2036
100% owned Clara Diamond Solutions
• A secure, digital sales platform that uses proprietary analytics together with cloud and blockchain technologies to modernize the existing diamond supply chain, driving efficiencies, unlocking value and ensuring diamond provenance from mine to finger
Progressive Annual Dividend
• CDN$0.10 for 2018. US$257 million paid since implementation of dividend policy in 2014
3

Q1 2018 Highlights
100% owned Karowe Mine in Botswana
• No lost time injuries in Q1 (2.9 million man hours since last LTI); Lost Time Injury Frequency Rate of 0.06
• Overall performance with respect to ore mined, processed and carats recovered was within forecast for Q1 2018
• 218 specials (single diamonds larger than 10.8 carats) were recovered, representing 6.8% of the total recovered carats by weight
• In April 2018, a 327 carat top white gem and a 472 carat top light brown were recovered from South lobe ore
100% owned Clara Diamond Solutions
• Completed the acquisition of Clara - a secure, digital sales platform that uses proprietary analytics together with cloud and blockchain technologies to modernize the existing diamond supply chain, driving efficiencies, unlocking value and ensuring diamond provenance from mine to finger
Progressive Annual Dividend
• Quarterly dividend of C$0.025 per share paid April 12, 2018 to shareholders of record on March 23, 2018. CDN$0.10 for 2018.
4
5
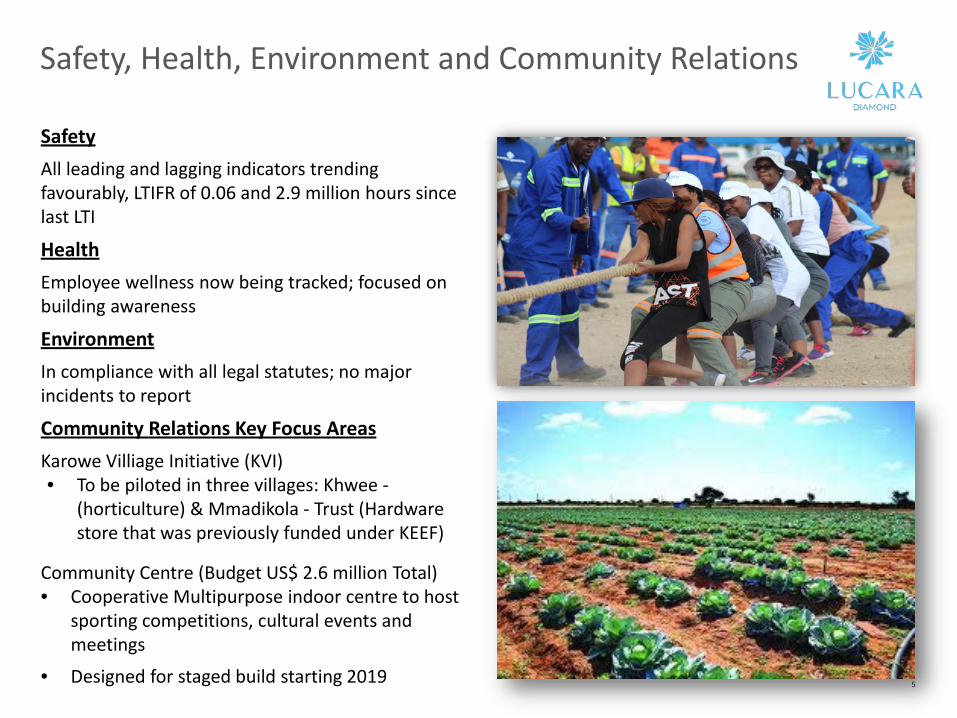
Safety, Health, Environment and Community Relations
SafetyAll leading and lagging indicators trending favourably, LTIFR of 0.06 and 2.9 million hours since last LTI
HealthEmployee wellness now being tracked; focused on building awareness
EnvironmentIn compliance with all legal statutes; no major incidents to report
Community Relations Key Focus AreasKarowe Villiage Initiative (KVI)• To be piloted in three villages: Khwee -
(horticulture) & Mmadikola - Trust (Hardware store that was previously funded under KEEF)
Community Centre (Budget US$ 2.6 million Total)• Cooperative Multipurpose indoor centre to host
sporting competitions, cultural events and meetings
• Designed for staged build starting 2019
6
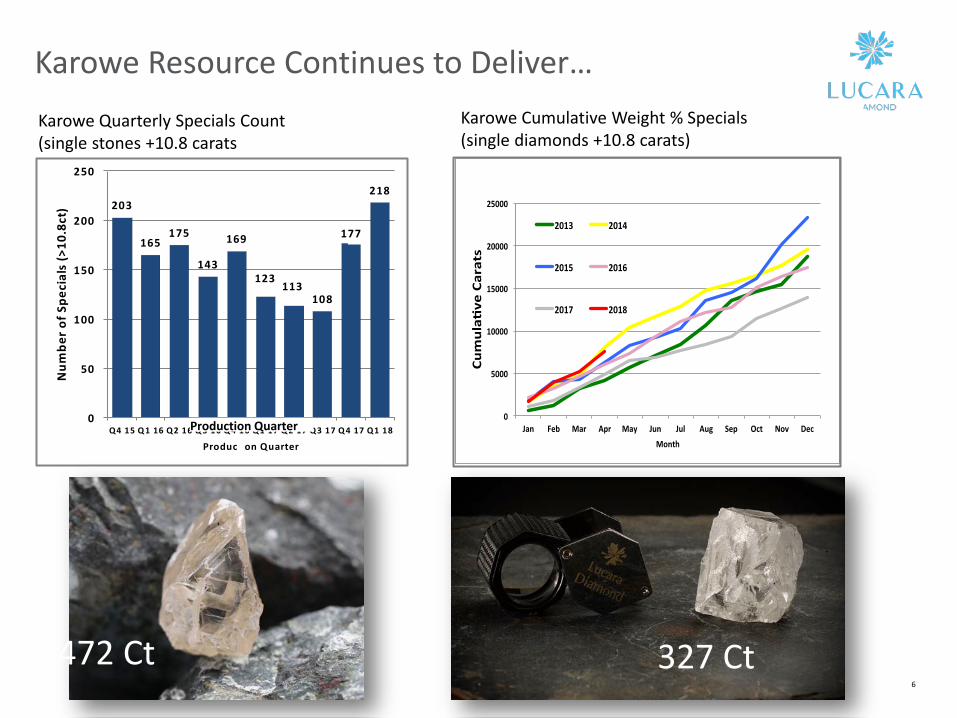
Karowe Quarterly Specials Count(single stones +10.8 carats
203
165175
143
169
123113
108
177
218
0
50
100
150
200
250
Q4 15 Q 1 16 Q2 16 Q 3 16 Q 4 16 Q1 17 Q 2 17 Q3 17 Q 4 17 Q1 18
Num
bero
f Spe
cial
s(>
10.8
ct)
Produc on Quarter
Karowe Resource Continues to Deliver… Karowe Cumulative Weight % Specials(single diamonds +10.8 carats)
Production Quarter
327 Ct472 Ct

Diamond Market
• 2018 began with a sense of cautious optimism, bolstered by a reasonably strong US holiday season and healthy demand from China
• Positive outcome at the Hong Kong diamond and jewelry show in February 2018• Markets appear stable, manufacturers achieving better margins• Diamond producers association (DPA) announced increase to marketing budget • The major banking fraud in India continues to cause uncertainty; Indian state banks will be under
greater scrutiny when lending to the diamond industry• De Beers held two sights in Q1 achieving US $1,235,000 compared to Q1 2017 of US $1,282,000. 2018
YTD US $1,755,000
7
2018 Lucara Diamond Sales
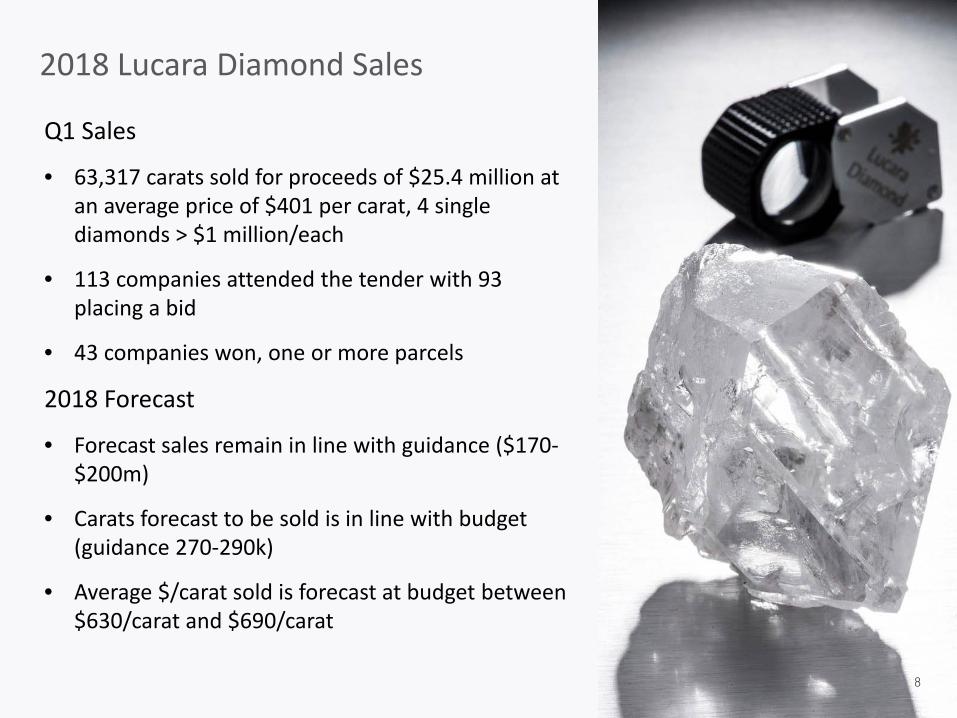
Q1 Sales
• 63,317 carats sold for proceeds of $25.4 million at an average price of $401 per carat, 4 single diamonds > $1 million/each
• 113 companies attended the tender with 93 placing a bid
• 43 companies won, one or more parcels
2018 Forecast
• Forecast sales remain in line with guidance ($170-$200m)
• Carats forecast to be sold is in line with budget (guidance 270-290k)
• Average $/carat sold is forecast at budget between $630/carat and $690/carat
8
Sales Strategy 2018
Exceptional Stone Tenders (“EST’s”)
vs.
Regular Stone Tenders (“RST’s”)
9
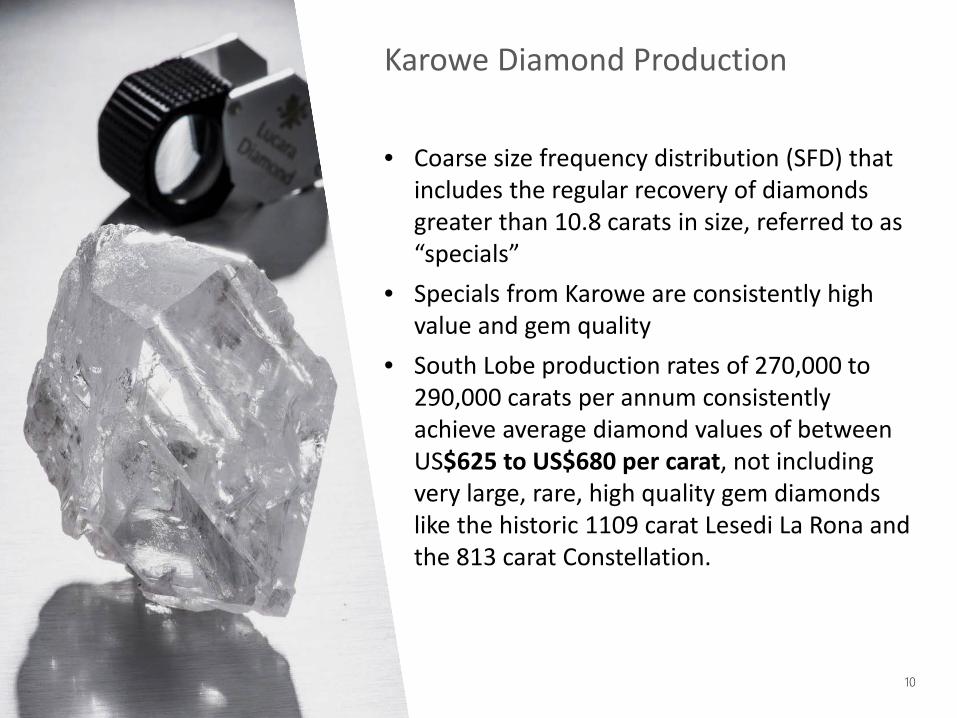
Karowe Diamond Production
• Coarse size frequency distribution (SFD) that includes the regular recovery of diamonds greater than 10.8 carats in size, referred to as “specials”
• Specials from Karowe are consistently high value and gem quality
• South Lobe production rates of 270,000 to 290,000 carats per annum consistently achieve average diamond values of between US$625 to US$680 per carat, not including very large, rare, high quality gem diamonds like the historic 1109 carat Lesedi La Rona and the 813 carat Constellation.
10

Diamond Sales Tenders
• Historically, Lucara has held both Regular Stone Tenders (RST’s) and Exceptional Stone Tenders (EST’s) with:− RST’s representing most of Lucara’s
run of mine production, held around 4 times per annum
− EST’s for rare diamonds, selected on a range of criteria including weight, quality, color, and, often achieving sales prices in excess of USD$ 1 million per diamond and held 1-2 times per annum
• Lucara’s next diamond sale will include both an RST and an EST scheduled for June 2018
11
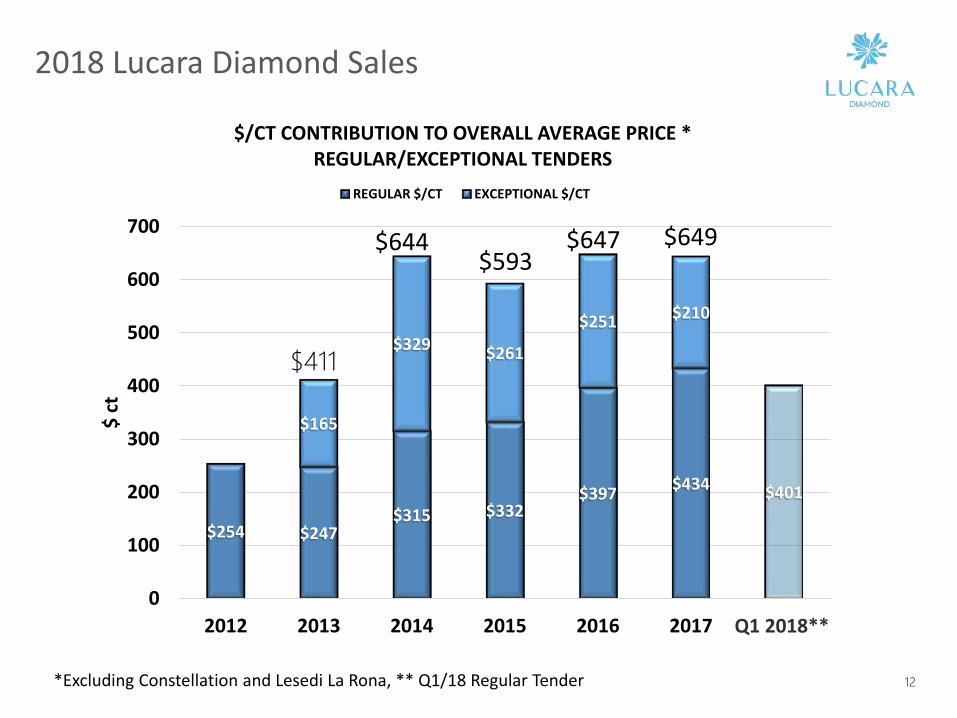
*Excluding Constellation and Lesedi La Rona, ** Q1/18 Regular Tender
2018 Lucara Diamond Sales
$254 $247$315 $332
$397 $434 $401
$165
$329 $261
$251 $210
0
100
200
300
400
500
600
700
2012 2013 2014 2015 2016 2017 2018**
$ ct
$/CT CONTRIBUTION TO OVERALL AVERAGE PRICE *REGULAR/EXCEPTIONAL TENDERS
REGULAR $/CT EXCEPTIONAL $/CT
$644$593
$649$647
$411
Q1 2018**
12
Future Diamond Sales Strategy
• Lucara intends to move towards a blended tender process, whereby a greater number of exceptional stones will be sold as part of RST’s
• A blended tender process decreases the inventory time for large, high value diamonds and will generate a smoother, more predictable revenue profile, that better supports price guidance on a per sale basis
• Lucara will also be selling part of its future diamond production through Clara, its proprietary digital sales platform, following commercialization later in 2018
13

Q1 2018 Karowe Operations
Production Q1 2017 Q1 2018Ore processed (tonnes) 598,934 599,407Ore mined (tonnes) 131,380 630,242Carats recovered (carats) 65,241 75,698Plant feed grade (cpht) 10.9 12.6Waste mined (tonnes) 587,177 3,991,648
Revenues & Operating Margins Q1 2017 Q1 2018Revenue ($ millions) 26.1 25.4Carats sold 64,444 63,317Revenue ($ per carat) 405 401Operating margin ($ per carat) 188 170
14

Q1 2018 Financial Highlights
$26.1 $25.4
Q1 2017 Q1 2018
Revenue(millions)
$4.9
$1.4
Q1 2017 Q1 2018
EBITDA(millions)
$(1.5)
$(7.0)
Q1 2017 Q1 2018
Net Loss(millions)
$405 $401
Q1 2017 Q1 2018
Total Sales(average dollar per carat)
$19.86
$43.04
Q1 2017 Q1 2018
US$ per tonne processed
$(0.00)
$(0.02)
Q1 2017 Q1 2018
Earnings (loss) per share
15
Achievements 2017
Capital Projects for Enhanced Diamond Recoveries
• Completed on time and budget, commissioned in Q3 2017• MDR allows for the early recovery of diamonds (+50mm –
120mm) • Sub-Middles XRT (+4mm – 8mm) removes yield constraints for
cost effective processing of South Lobe ore
Healthy, Safety and Sustainability• Continued strong focus on safety with LTIFR for last 12 months
trending favourably at 0.64• Engagement with Letlhakane District Council to advance multi-
year community initiatives through Lundin Foundation
Completion of positive PEA for Karowe Underground• Standalone NPV5 (USD) of $451 and an IRR of 39%
16
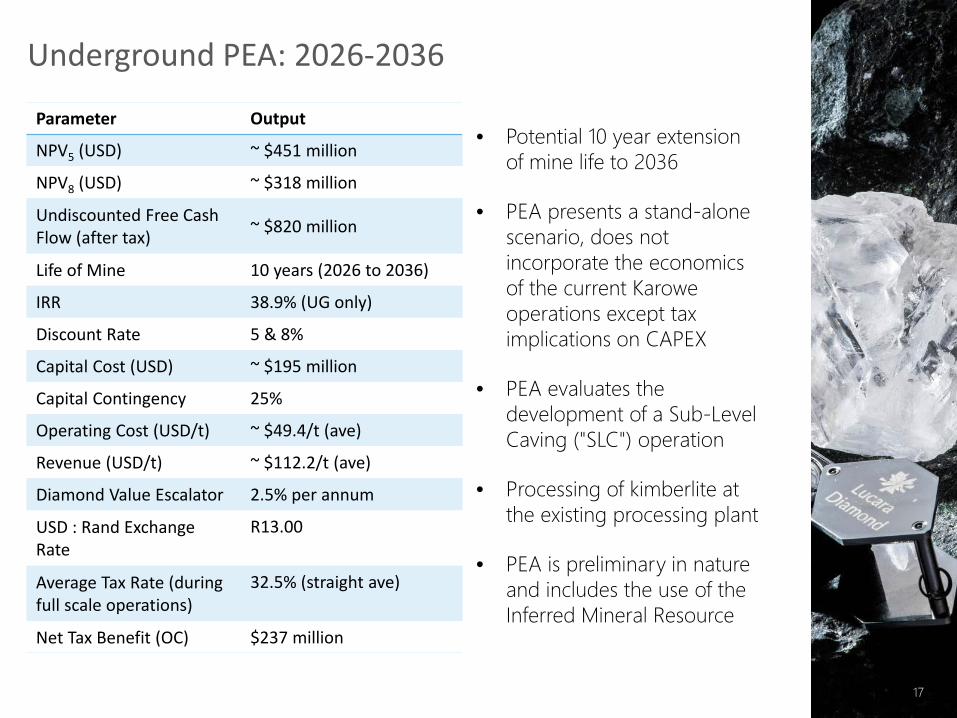
Underground PEA: 2026-2036
• Potential 10 year extension of mine life to 2036
• PEA presents a stand‐alone scenario, does not incorporate the economics of the current Karowe operations except tax implications on CAPEX
• PEA evaluates the development of a Sub‐Level Caving ("SLC") operation
• Processing of kimberlite at the existing processing plant
• PEA is preliminary in nature and includes the use of the Inferred Mineral Resource
Parameter Output
NPV5 (USD) ~ $451 million
NPV8 (USD) ~ $318 million
Undiscounted Free Cash Flow (after tax) ~ $820 million
Life of Mine 10 years (2026 to 2036)
IRR 38.9% (UG only)
Discount Rate 5 & 8%
Capital Cost (USD) ~ $195 million
Capital Contingency 25%
Operating Cost (USD/t) ~ $49.4/t (ave)
Revenue (USD/t) ~ $112.2/t (ave)
Diamond Value Escalator 2.5% per annum
USD : Rand Exchange Rate
R13.00
Average Tax Rate (during full scale operations)
32.5% (straight ave)
Net Tax Benefit (OC) $237 million
17
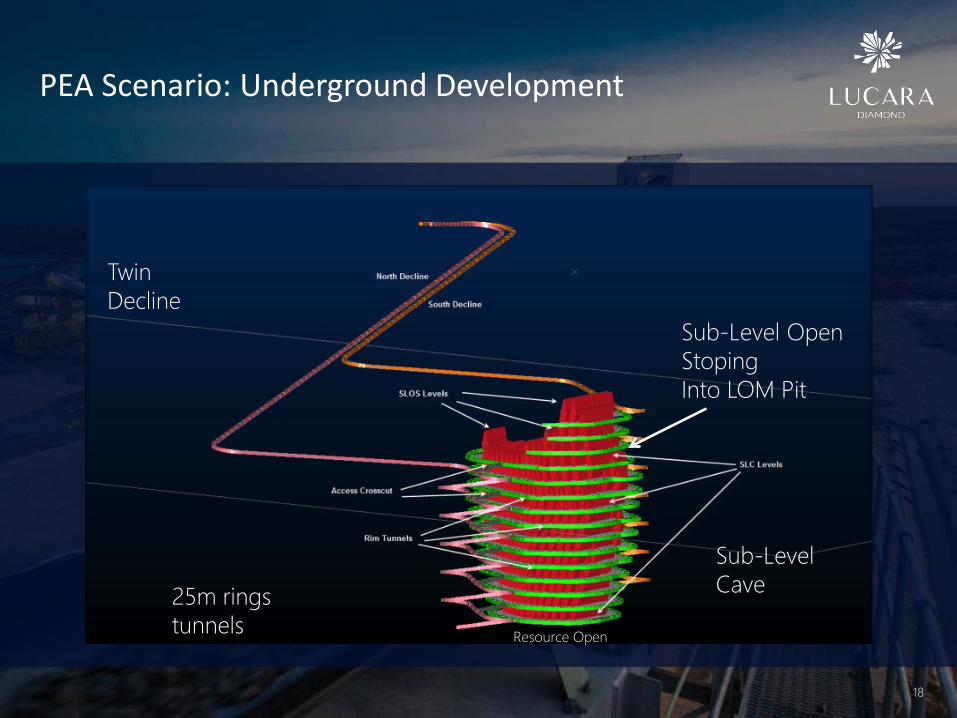
PEA Scenario: Underground Development
Production of 2.5 Mtpa with upside
Twin Decline
Sub‐Level Open StopingInto LOM Pit
25m rings tunnels
Sub‐Level Cave
Resource Open
18

Understanding Risk• Completion of mineral resource update – Q2 2018• Initiation of feasibility level geotechnical and hydrogeological studies
with accompanying drill programs – Drilling underway• Mine design, mining options, trade off studies – In Progress
Opportunities• Financial apsects are known: revenues, diamond characteristics, size
distribution, strong client base and brand recognition• Process plant in place, modern, state of the art• Exisiting operational site • Review PEA mine design • Efficiency improvements may increase potential operational
throughputs
Building on Positive PEA Next Steps toward PFS and FS
19
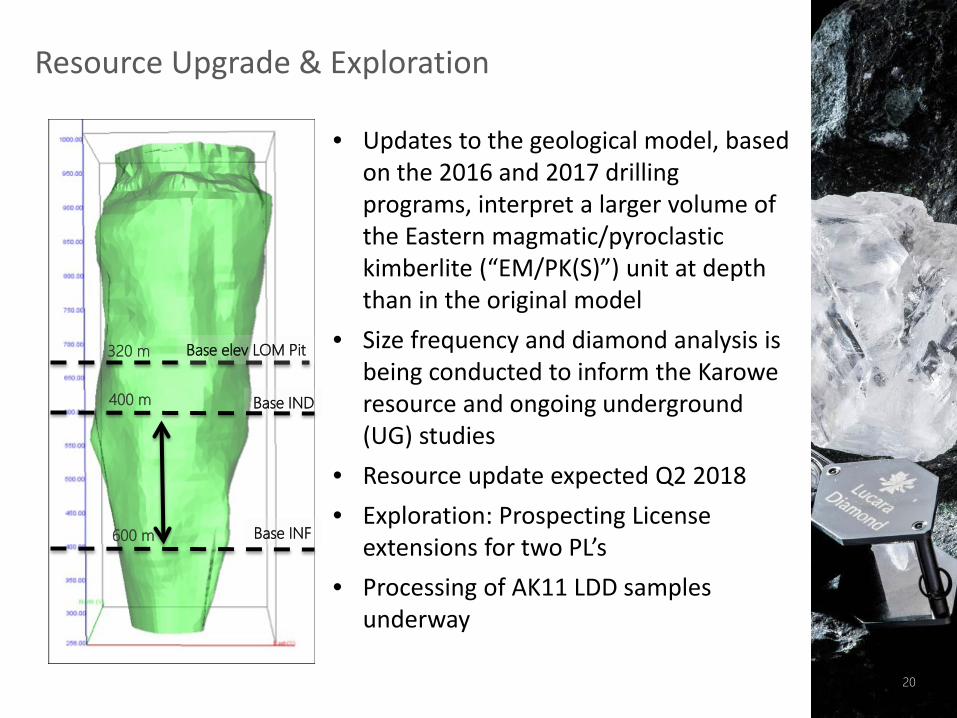
• Updates to the geological model, based on the 2016 and 2017 drilling programs, interpret a larger volume of the Eastern magmatic/pyroclastic kimberlite (“EM/PK(S)”) unit at depth than in the original model
• Size frequency and diamond analysis is being conducted to inform the Karowe resource and ongoing underground (UG) studies
• Resource update expected Q2 2018• Exploration: Prospecting License
extensions for two PL’s• Processing of AK11 LDD samples
underway
Base elev LOM Pit
Base IND
Base INF
320 m
600 m
400 m
Resource Upgrade & Exploration
20

Lucara’s next generation growth project
21
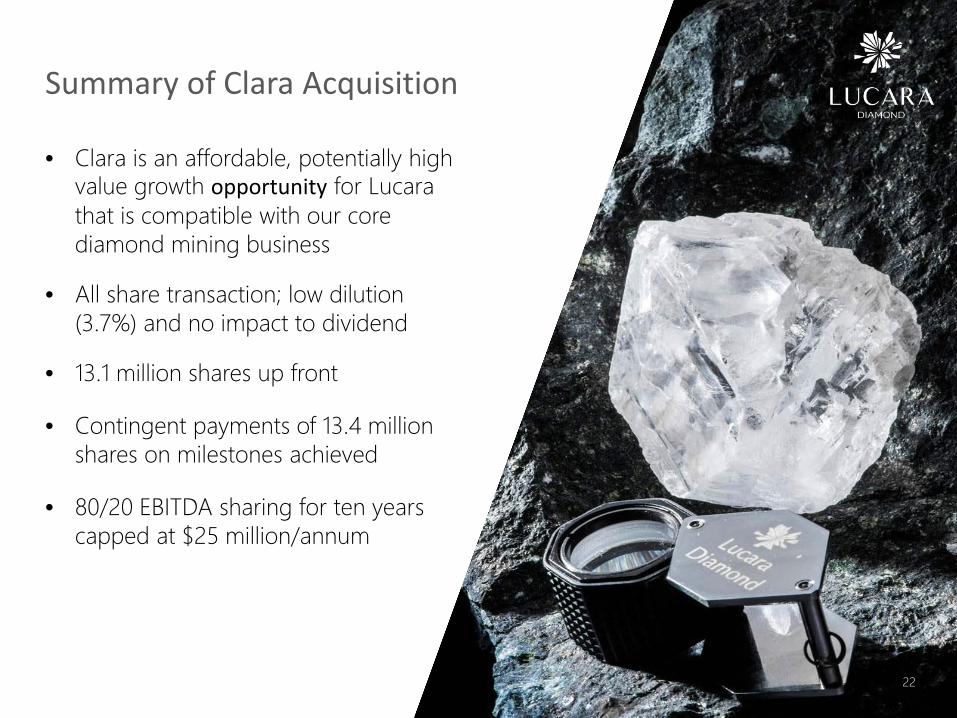
Summary of Clara Acquisition
• Clara is an affordable, potentially high value growth opportunity for Lucarathat is compatible with our core diamond mining business
• All share transaction; low dilution (3.7%) and no impact to dividend
• 13.1 million shares up front
• Contingent payments of 13.4 million shares on milestones achieved
• 80/20 EBITDA sharing for ten years capped at $25 million/annum
22

• Current supply chain is static, inefficient, and inflexible; uses an entrenched system that hasn’t changed in over 100 years, and is ripe for disruption
• Recent technological advances make disruption possible and inevitable
• Value is being lost across the entire diamond pipeline; producers and manufacturers alike stand to benefit from a new and improved system
Why?
23
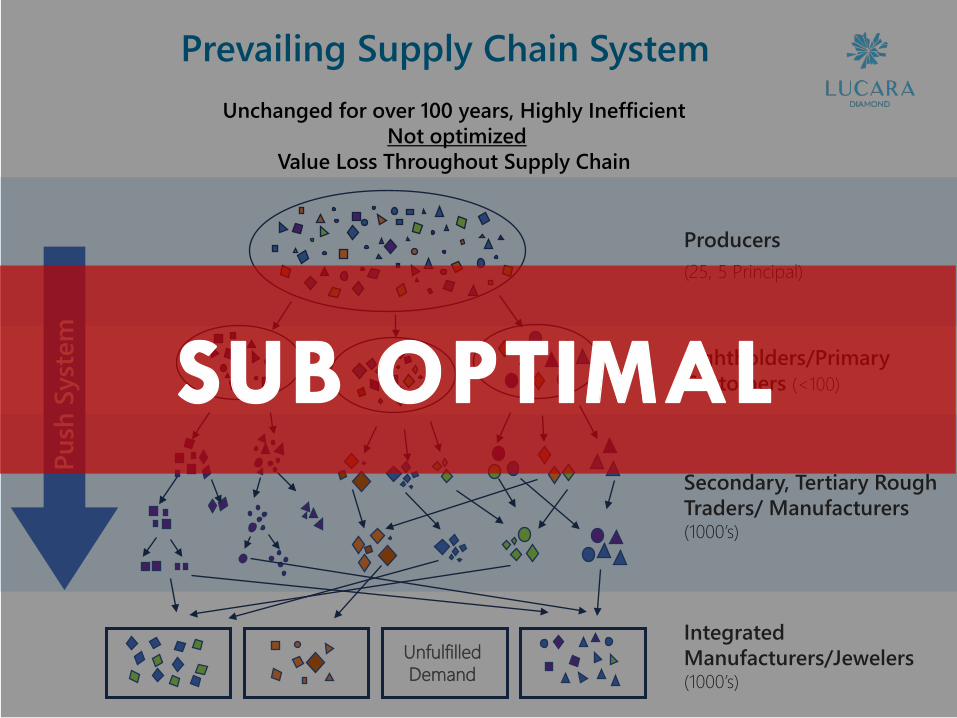
Prevailing Supply Chain System
Producers(25, 5 Principal)
Sightholders/Primary Customers (<100)
Secondary, Tertiary Rough Traders/ Manufacturers(1000’s)
Integrated Manufacturers/Jewelers(1000’s)
Push
Sys
tem
Unfulfilled Demand
Unchanged for over 100 years, Highly InefficientNot optimized
Value Loss Throughout Supply Chain
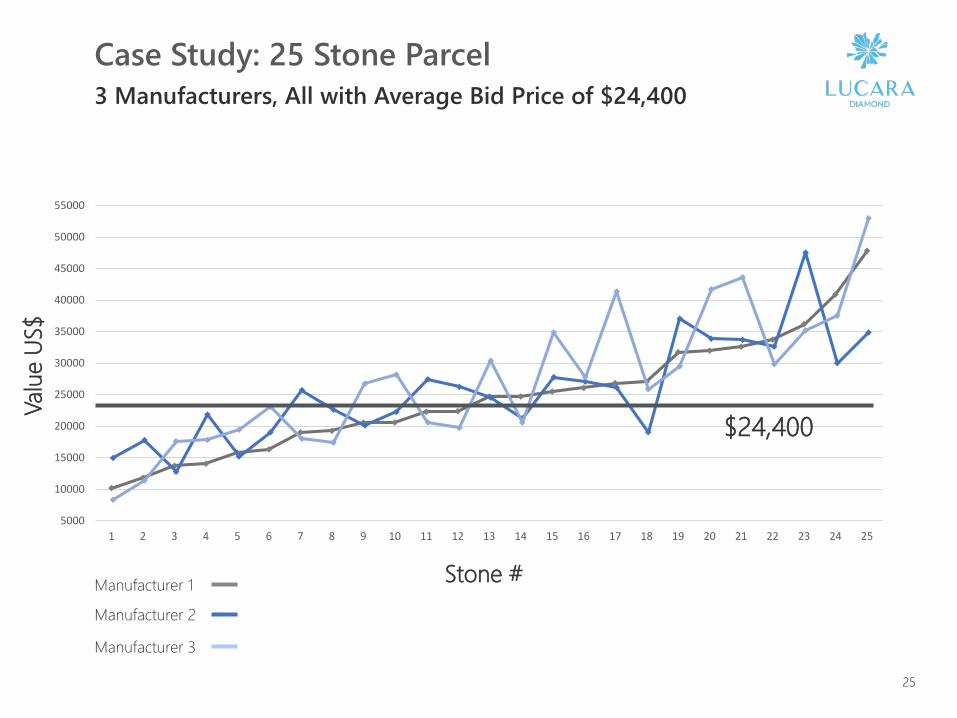
Case Study: 25 Stone Parcel3 Manufacturers, All with Average Bid Price of $24,400
5000
10000
15000
20000
25000
30000
35000
40000
45000
50000
55000
1 2 3 4 5 6 7 8 9 10 11 12 13 14 15 16 17 18 19 20 21 22 23 24 25
Valu
e US
$
Stone #Manufacturer 1
Manufacturer 2
Manufacturer 3
$24,400
25

By disrupting the existing diamond valuechain, using proprietary analytics togetherwith cloud and blockchain technologies tomatch diamond demand to supply,ensuring diamond provenance from mineto finger, driving efficiencies and unlockingvalue for all stakeholders.
How can this be improved?
26

Clara Cloud Platform
Clara Platform Matches Rough Output to Polished DemandStreamlining the Supply Chain and Creating Value Throughout the Pipeline
Producers(25, 5 Principal)
POTENTIAL CUSTOMERS27
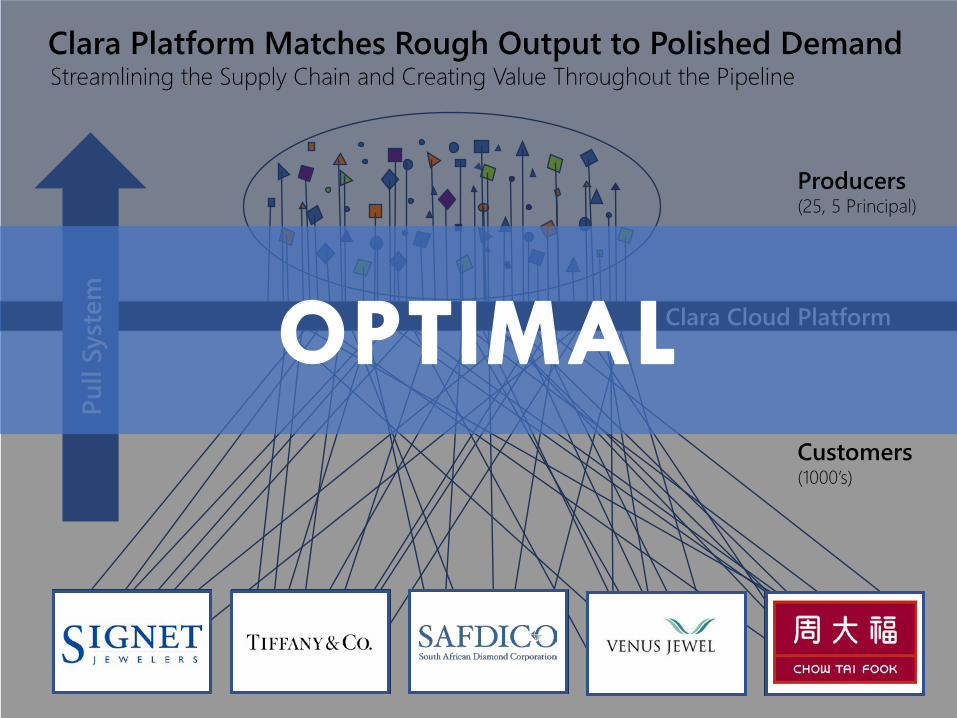
Clara Platform Matches Rough Output to Polished DemandStreamlining the Supply Chain and Creating Value Throughout the Pipeline
Producers(25, 5 Principal)
Clara Cloud Platform
Customers(1000’s)
Pull
Syst
em
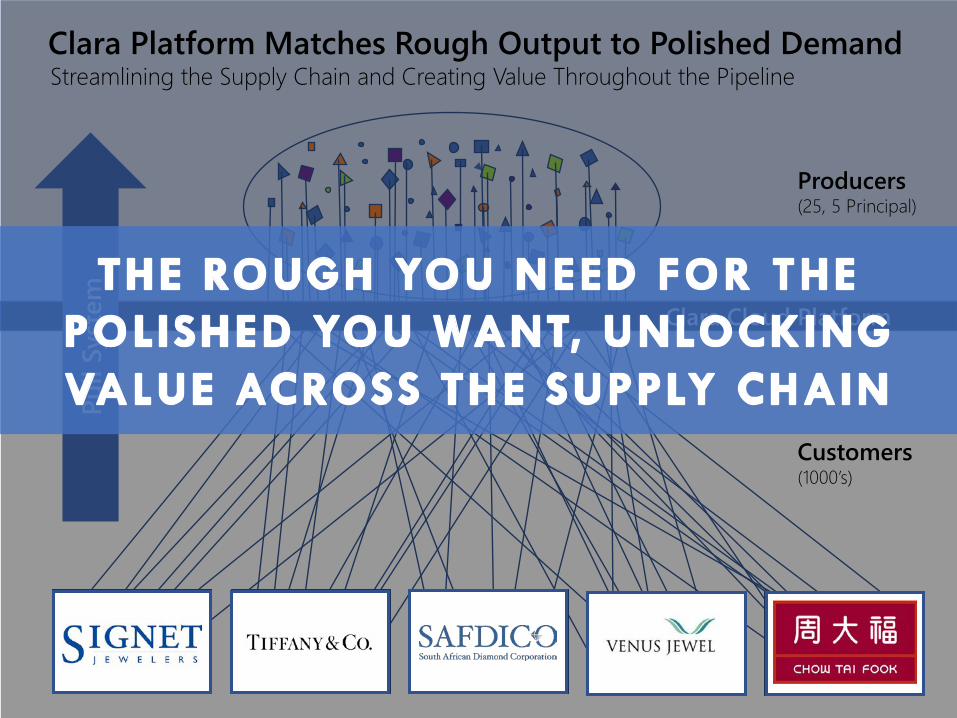
Clara Platform Matches Rough Output to Polished DemandStreamlining the Supply Chain and Creating Value Throughout the Pipeline
Producers(25, 5 Principal)
Clara Cloud Platform
Customers(1000’s)
Pull
Syst
em

Case Study: 25 Stone Parcel3 Manufacturers, All with Average Bid Price of $24,400
5000
10000
15000
20000
25000
30000
35000
40000
45000
50000
55000
1 2 3 4 5 6 7 8 9 10 11 12 13 14 15 16 17 18 19 20 21 22 23 24 25
Valu
e US
$
Stone #Manufacturer 1
Manufacturer 2
Manufacturer 3
$24,400
Best Value + 15%
$28,600
30

Benefits
Producers
• Maximum selling price achieved for every stone
• Not reliant on tender sale cycles
• Reduces sorting inefficiencies, removes human factor
• Inventory greatly reduced, potentially eliminated
• Opportunity to establish a true “block chain” system to provide chain of custody and assurance on diamond provenance
Manufacturers/Retailers
• Purchase of rough based on polished orders
• Eliminates financial carrying costs of unwanted inventory
• Eliminates manufacturing losses taken on unwanted inventory
• Eliminates secondary market trading losses
• Opportunity to establish a true “block chain” system to provide chain of custody and assurance on diamond provenance
Benefits
31
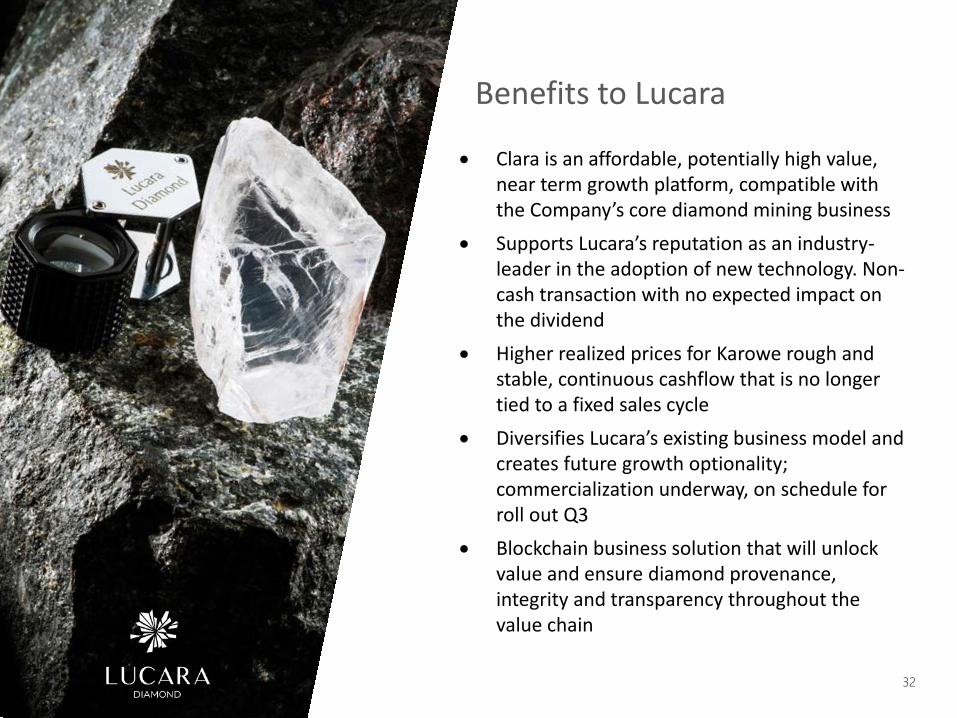
Benefits to Lucara
• Clara is an affordable, potentially high value, near term growth platform, compatible with the Company’s core diamond mining business
• Supports Lucara’s reputation as an industry-leader in the adoption of new technology. Non-cash transaction with no expected impact on the dividend
• Higher realized prices for Karowe rough and stable, continuous cashflow that is no longer tied to a fixed sales cycle
• Diversifies Lucara’s existing business model and creates future growth optionality; commercialization underway, on schedule for roll out Q3
• Blockchain business solution that will unlock value and ensure diamond provenance, integrity and transparency throughout the value chain
32
2018 Guidance33 33
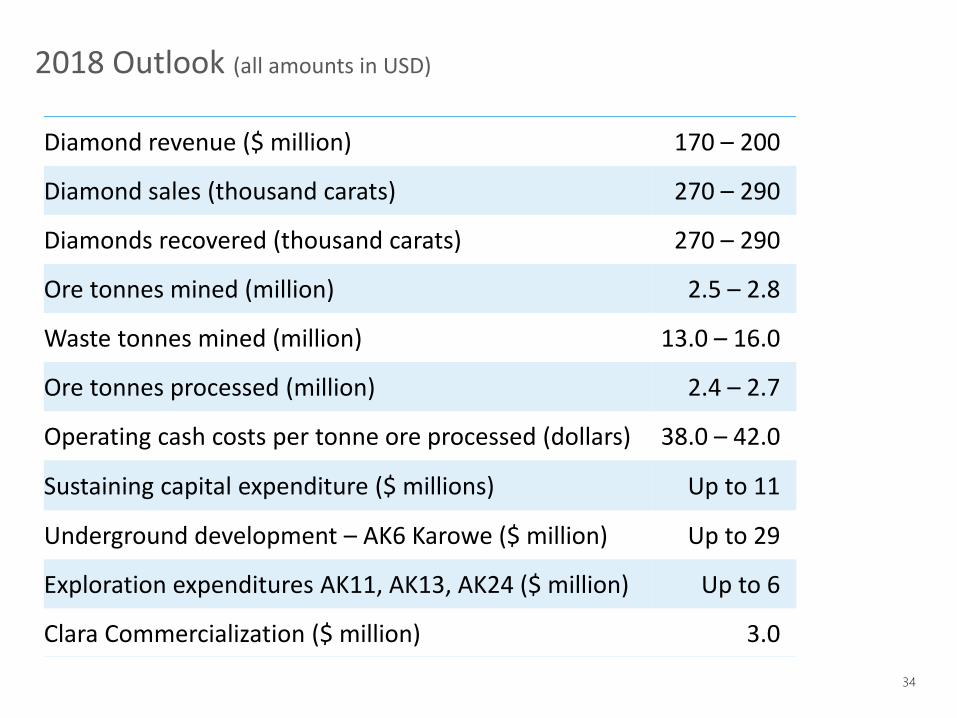
Diamond revenue ($ million) 170 – 200
Diamond sales (thousand carats) 270 – 290
Diamonds recovered (thousand carats) 270 – 290
Ore tonnes mined (million) 2.5 – 2.8
Waste tonnes mined (million) 13.0 – 16.0
Ore tonnes processed (million) 2.4 – 2.7
Operating cash costs per tonne ore processed (dollars) 38.0 – 42.0
Sustaining capital expenditure ($ millions) Up to 11
Underground development – AK6 Karowe ($ million) Up to 29
Exploration expenditures AK11, AK13, AK24 ($ million) Up to 6
Clara Commercialization ($ million) 3.0
2018 Outlook (all amounts in USD)
34
34
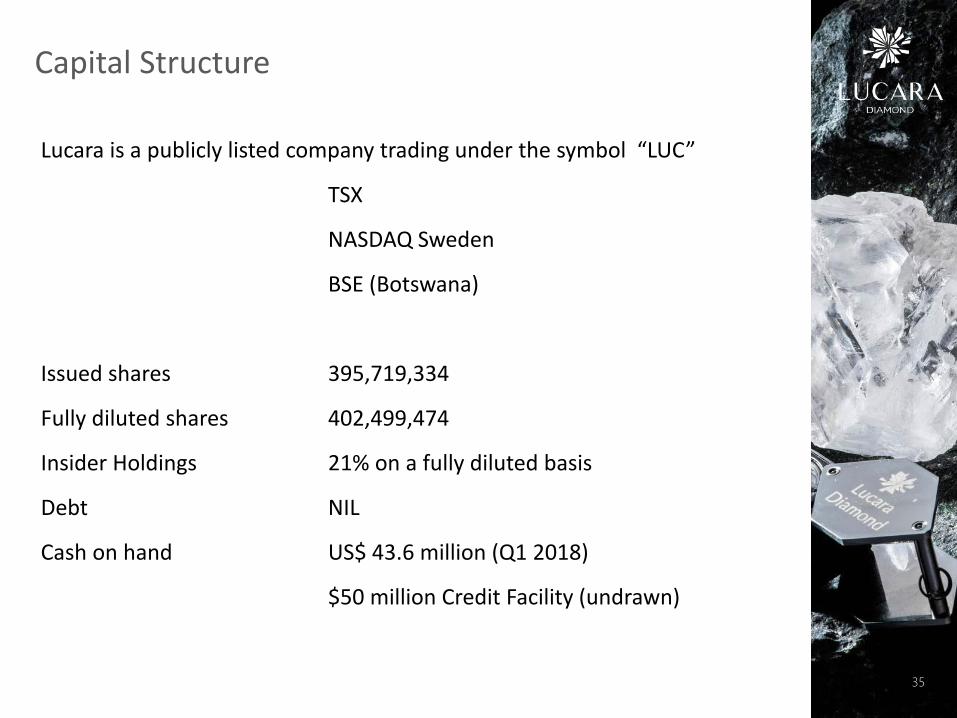
Lucara is a publicly listed company trading under the symbol “LUC”
TSX
NASDAQ Sweden
BSE (Botswana)
Issued shares 395,719,334
Fully diluted shares 402,499,474
Insider Holdings 21% on a fully diluted basis
Debt NIL
Cash on hand US$ 43.6 million (Q1 2018)
$50 million Credit Facility (undrawn)
Capital Structure
35
Suite 2000
885 West Georgia St.
Vancouver, BC
V6C 3E8
Tel: 604 689 7872
Fax: 604 689 4250
lucaradiamond.com
Contact Information36
36
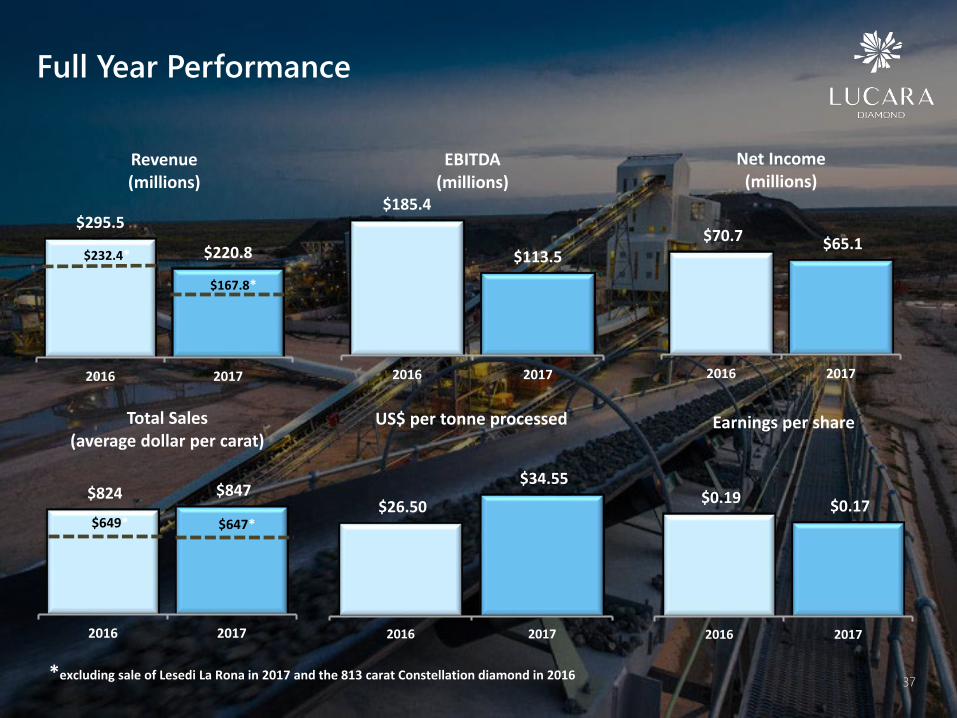
*excluding sale of Lesedi La Rona in 2017 and the 813 carat Constellation diamond in 2016
$70.7 $65.1
2016 2017
Net Income(millions)
$295.5
$220.8
2016 2017
Revenue(millions)
$167.8*
$232.4*
$185.4
$113.5
2016 2017
EBITDA(millions)
$824 $847
2016 2017
Total Sales(average dollar per carat)
$649* $647*$26.50
$34.55
2016 2017
US$ per tonne processed
$0.19 $0.17
2016 2017
Earnings per share
Full Year Performance
37