may 10, 2016 report to the water commission
TRANSCRIPT
I
Annual Report May 10, 2016
REPORT TO THE WATER
COMMISSION
YEAR 2016
WATER, WASTEWATER, REUSE AND
STORMWATER
Annual Report
CITY OF FLAGSTAFF
UTILITIES DIVISION

II
Annual Report May 10, 2016

III
Annual Report May 10, 2016
REPORT TO THE WATER
COMMISSION
YEAR 2016
WATER, WASTEWATER, REUSE
and STORMWATER
Annual Report
Including Historical Data &
Graphical Trends
May 10, 2016
CITY OF FLAGSTAFF
UTILITIES DIVISION

IV
Annual Report May 10, 2016
Cover Photo of Kinlani Storage Tank by Lee Williams
This report is printed on recycled paper
i
Annual Report May 10, 2016
ACKNOWLEDGEMENTS .................................................................................................................. III
1 OPERATIONAL OVERVIEW .......................................................................................................... 1
2 PRODUCTION & TREATMENT SUMMARY ................................................................................... 2
2-1 POPULATION ......................................................................................................................... 2
2-2 POTABLE WATER USES & PRODUCTION ............................................................................ 2
2-3 WASTEWATER TREATMENT ................................................................................................. 3
2-4 RECLAIMED WATER DELIVERIES ......................................................................................... 4
3 WATER PRODUCTION PLAN ........................................................................................................ 5
4 2015 SUMMARY ............................................................................................................................. 6
4-1 2015 NOTABLE EVENTS & IMPROVEMENTS ....................................................................... 6
4-2 2015 WATER MANAGEMENT SUMMARY .............................................................................. 9
5 WATER CONSUMPTION & PROJECTED NEEDS ...................................................................... 11
5-1 PROJECTED WATER DELIVERIES FROM 2015-2070 ......................................................... 11
5-2 2015 POTABLE WATER USE BY CUSTOMER CLASS ........................................................ 11
5-3 WATER METERS .................................................................................................................. 12
5-4 DESIGNATION OF ADEQUATE WATER SUPPLY ................................................................ 13
6 WATER PRODUCTION ............................................................................................................... 17
6-1 WATER WELLS PEAK CAPACITY ........................................................................................ 17
6-2 HISTORICAL PRODUCTION BY SOURCE DATA ................................................................. 18
6-3 2015 WEEKLY PRODUCTION BY SOURCE ........................................................................ 20
6-4 MOST RECENT DISTRIBUTION SYSTEM WATER QUALITY AT EACH EPDS ................. 22
6-5 CITY SUPPLY WELLS & REGISTRATION INFORMATION ................................................... 23
6-6 POWER COST - CY 2015 ...................................................................................................... 24
7 WELL FIELDS .............................................................................................................................. 25
7-1 WELL FIELDS & INFRASTRUCTURE ................................................................................... 25
7-2 CITY OF FLAGSTAFF WELL PRODUCTION HISTORY 1996- PRESENT ............................ 26
7-3 WATER SUPPLY SOURCES ................................................................................................. 28
7-4 WATER LEVEL HYDROGRAPHS .......................................................................................... 29
8 UPPER LAKE MARY .................................................................................................................... 35
8-1 UPPER LAKE MARY MONITORING - NEWMAN CANYON .................................................... 35
8-2 UPPER & LOWERE LAKE MARY WATERSHEDS..................................................................37
8-3 UPPER LAKE MARY MONITORING - FLOWTOGRAPHY......................................................38
8-4 CLIMATE MONITORING.......................................................................................................... 41
8-5 UPPER LAKE MARY AVERAGE- MONTHLY COMPARISON (1960-2015) .............................. 42
8-6 UPPER LAKE MARY INFLOW REPORT & PREDICTED WATER BUDGET ......................... 43
TABLE OF CONTENTS

ii
Annual Report May 10, 2016
9 WATER CONSERVATION .......................................................................................................... 44
9-1 PROGRAM OVERVIEW……………………………………………………………………………. 44
9-2 FINANCIAL REBATES SUMMARY ...................................................................................... 45
9-3 WATER FESTIVAL SUMMARY ............................................................................................ 46
9-4 WATER CONSERVATION TRENDS .................................................................................... 48
9-5 DROUGHT PREPAREDNESS.............................................................................................. 51
10 WATER STORAGE & DISTRIBUTION ....................................................................................... 52
10-1 WATER STORAGE RESERVOIRS ..................................................................................... 52
10-2 FLAGSTAFF WATER PRESSURE ZONES ......................................................................... 53
11 RECLAIMED WATER ................................................................................................................. 54
11-1 2015 RECLAIMED WATER USED BY CUSTOMER CLASS ............................................... 54
11-2 RECLAIMED WATER DISTRIBUTION SYSTEM ................................................................. 55
11-3 WASTEWATER TREATMENT FLOW REPORT .................................................................. 56
12 STORMWATER MANAGEMENT ................................................................................................ 57
12-1 KEY PROGRAM SUMMARY .............................................................................................. 57
12-2 FLOODPLAIN MAPS ........................................................................................................... 70
13 REGULATORY COMPLIANCE ................................................................................................... 72
13-1 INDUSTRIAL WASTE SIGNIFICANT INDUSTRIAL USERS .............................................. 74
14 RED GAP RANCH ....................................................................................................................... 75
14-1 RED GAP RANCH WELL DATA .......................................................................................... 80
14-2 RED GAP RANCH WELL LOCATIONS ............................................................................... 81
14-3 RED GAP RANCH HYDROGRAPHS .................................................................................. 82
14-4 RED GAP RANCH WATER QUALITY ................................................................................ 84
15 MISCELLANEOUS INFORMATION ........................................................................................... 85
15-1 STATISTICS ........................................................................................................................ 85
15-2 UTILITIES DIVISION ORGANIZATIONAL CHART .............................................................. 86
15-3 CITY OF FLAGSTAFF WATER RATES AND FEES ............................................................ 87
15-4 RADIO BASE STATIONS AND UTILITIES PERSONNEL CONTACT INFORMATION ........ 90

iii
Annual Report May 10, 2016
Water Commission
Staff Contributions
Kira Russo
Hanna Cortner
John Malin Chair
Charles Odegaard Vice Chair
Karin Wadsack
Paul Turner
John Nowakowski
Ward Davis
Lisa Adams
Plant Specialist
Thomas Bolyen
Water Production Manager
Steve Flood
Utilities Supervisor
Robin Harrington
Utilities Program Manager
Tim Harrington
Utilities GIS Administrator
Jim Huchel
Wastewater Manager
Chris Kirkendall
Stormwater Manager
Mark Richardson
Operations Manager
Debby Valencia
Administrative Specialist
Erin Young
Water Resources Manager
To acknowledge those who were responsible for the data and assembling this year’s
Annual Report to the Water Commission
Bradley M. Hill, R.G.
Utilities Director
ACKNOWLEDGEMENTS
iv
Annual Report May 10, 2016
Photo by Lee Williams, Lake Mary Water Treatment Plant

1
Annual Report May 10, 2016
OPERATIONAL OVERVIEW
The Utilities Division is responsible for water
production and distribution, wastewater
collection and treatment, reclaimed water
distribution and stormwater management.
Additionally, the Division is responsible for
water resource management, water
conservation, engineering, and regulatory
compliance programs. Included in this report
are data and updates regarding reclaimed
water, wastewater treatment, water resource
management, regulatory compliance of the
water and wastewater systems, stormwater
functions, and water conservation program.
This report is distributed throughout the year
in response to various requests for
information on the Utilities Division’s
programs.
The greatest impact on how the City
operates its water supply system is
determined by the winter weather season
which typically ends in March or April.
There is a substantial difference on how
the Utilities Division provides water
depending upon whether it is a “wet” or
“dry” year. A “wet year” is classified as a
year when Upper Lake Mary reaches 65%
or more of capacity. Above the 65% level,
Utilities can utilize this resource to its
maximum. During the winter of 2015-16,
the Lake was at a low of 41% in October
2015 and by February 19, 2016, Upper
Lake Mary rose to 56% capacity for
spring. This puts the City into a dry-year
operations plan. Upper Lake Mary will be
utilized such to balance maximum
production with volume for next summer.
Utilities oversee master planning efforts that
include water resources, infrastructure,
SCADA, and new in 2016, solids handling.
Water Infrastructure, Wastewater
Infrastructure, Reclaimed Water
Infrastructure, and Water Resources master
plan information can be found at the Utilities
website at www.flagstaff.az.gov/Utilities
Lastly, Utilities operates by the Water
Policies adopted by City Council in July,
2014. This document is also available at
www.flagstaff.az.gov/Utilities
“Professionally and cost effectively providing water, wastewater and stormwater
services that meet the present and future environmental, health, and safety needs of
the community and our co-workers. Committed to a goal of 100% customer
satisfaction achieved by a dedication to exceed customer expectations by
continuously improving our operations.”
MISSION STATEMENT OF THE UTILITIES DIVISION:
1
2
Annual Report May 10, 2016
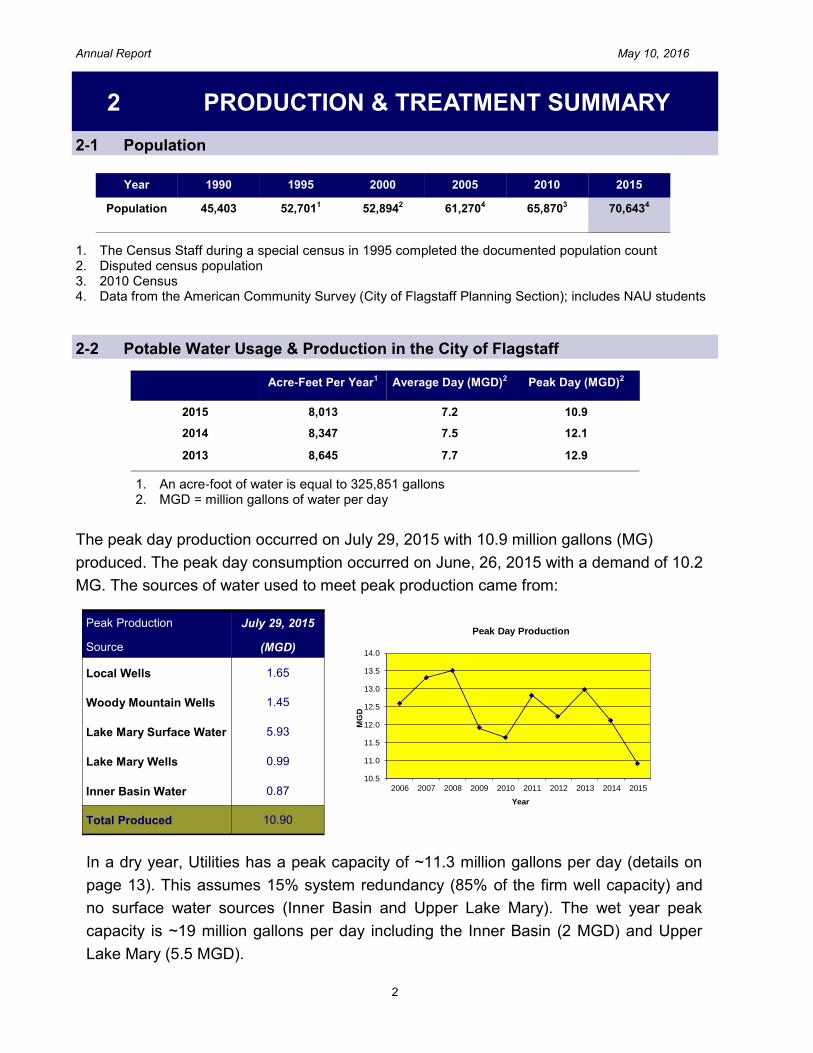
The peak day production occurred on July 29, 2015 with 10.9 million gallons (MG)
produced. The peak day consumption occurred on June, 26, 2015 with a demand of 10.2
MG. The sources of water used to meet peak production came from:
In a dry year, Utilities has a peak capacity of ~11.3 million gallons per day (details on
page 13). This assumes 15% system redundancy (85% of the firm well capacity) and
no surface water sources (Inner Basin and Upper Lake Mary). The wet year peak
capacity is ~19 million gallons per day including the Inner Basin (2 MGD) and Upper
Lake Mary (5.5 MGD).
Year 1990 1995 2000 2005 2010 2015
Population 45,403 52,7011 52,8942 61,2704 65,8703 70,6434
1. The Census Staff during a special census in 1995 completed the documented population count 2. Disputed census population 3. 2010 Census 4. Data from the American Community Survey (City of Flagstaff Planning Section); includes NAU students
Acre-Feet Per Year1 Average Day (MGD)2 Peak Day (MGD)2
2015 8,013 7.2 10.9
2014 8,347 7.5 12.1
2013 8,645 7.7 12.9
1. An acre-foot of water is equal to 325,851 gallons 2. MGD = million gallons of water per day
Peak Production
Source
July 29, 2015
(MGD)
Local Wells 1.65
Woody Mountain Wells 1.45
Lake Mary Surface Water 5.93
Lake Mary Wells 0.99
Inner Basin Water 0.87
Total Produced 10.90
PRODUCTION & TREATMENT SUMMARY
2-2 Potable Water Usage & Production in the City of Flagstaff
2-1 Population
2
10.5
11.0
11.5
12.0
12.5
13.0
13.5
14.0
2006 2007 2008 2009 2010 2011 2012 2013 2014 2015
MG
D
Year
Peak Day Production

3
Annual Report May 10, 2016
The treatment capacity of the Wildcat Hill Wastewater Reclamation Plant is 6.0 MGD and
the Rio De Flag Wastewater Reclamation Plant is 4.0 MGD. The combined treatment ca-
pacity of the two plants is 10 MGD. This capacity is projected to serve the City of Flagstaff
until 2035 or approximately a population of 100,000 (Sewer Master Plan, 2015 Brown &
Caldwell).
2-3 Wastewater Treatment
1. Maximum Day units are in million gallons per day (MGD) and Maximum Month are in million gallons (MG). Flows are based on the influent metering system.
2. Total influent (2,034,104,000 gallons in 2015) divided by population (70,643) divided by 365 days
Maximum Month & Day1
Wastewater Volume Treated
Wastewater Treatment Plants
Peak Month &
Year
Rio de Flag WRP Peak Month &
Year
Wildcat Hill WRP Maximum Treated
(MGD)
June 2015 62.5 MG (2.4 MGD 7/3/15) March 2015 151.5 MG (10.4 MGD 3/2/15) 12.8 MGD
August 2014 66.1 MG (2.3 MGD 8/12/14) October 2014 124.5 MG (5.2 MGD 10/26/14) 7.5 MGD
July 2013 62.2 MG (2.2 MGD 7/2/13) September 2013 137.4 MG (7.9 MGD on 9/9/13) 10.1 MGD
AVERAGE PER CAPITA INFLOW 1990 1052 GPCD
2015 792 GPCD
Outdoor water use in summer months causes the weekly demand to increase from April to
October. Efforts to switch landscaping to low water use will help to postpone the
construction of new water supply facilities and development of new water resources.
Water Production by Week—2015
4
Annual Report May 10, 2016
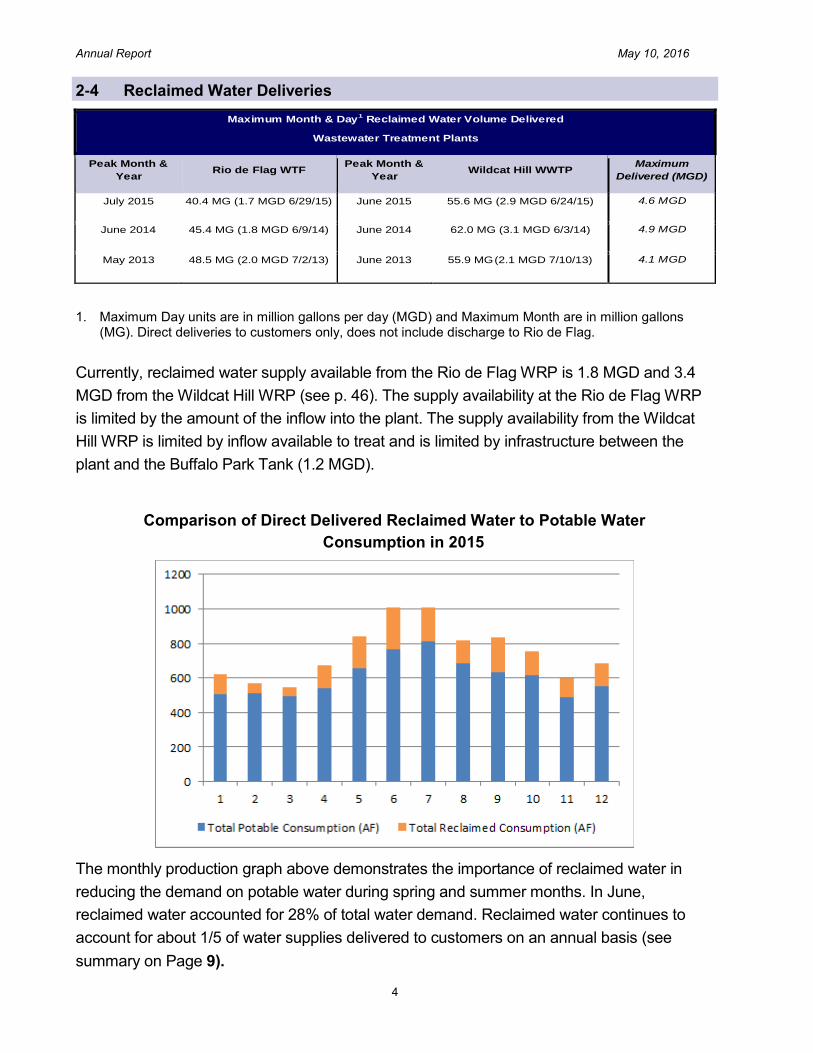
Currently, reclaimed water supply available from the Rio de Flag WRP is 1.8 MGD and 3.4
MGD from the Wildcat Hill WRP (see p. 46). The supply availability at the Rio de Flag WRP
is limited by the amount of the inflow into the plant. The supply availability from the Wildcat
Hill WRP is limited by inflow available to treat and is limited by infrastructure between the
plant and the Buffalo Park Tank (1.2 MGD).
2-4 Reclaimed Water Deliveries
1. Maximum Day units are in million gallons per day (MGD) and Maximum Month are in million gallons (MG). Direct deliveries to customers only, does not include discharge to Rio de Flag.
Comparison of Direct Delivered Reclaimed Water to Potable Water
Consumption in 2015
The monthly production graph above demonstrates the importance of reclaimed water in
reducing the demand on potable water during spring and summer months. In June,
reclaimed water accounted for 28% of total water demand. Reclaimed water continues to
account for about 1/5 of water supplies delivered to customers on an annual basis (see
summary on Page 9).
Maximum Month & Day1 Reclaimed Water Volume Delivered
Wastewater Treatment Plants
Peak Month &
Year Rio de Flag WTF
Peak Month &
Year Wildcat Hill WWTP
Maximum
Delivered (MGD)
July 2015 40.4 MG (1.7 MGD 6/29/15) June 2015 55.6 MG (2.9 MGD 6/24/15) 4.6 MGD
June 2014 45.4 MG (1.8 MGD 6/9/14) June 2014 62.0 MG (3.1 MGD 6/3/14) 4.9 MGD
May 2013 48.5 MG (2.0 MGD 7/2/13) June 2013 55.9 MG (2.1 MGD 7/10/13) 4.1 MGD

5
Annual Report May 10, 2016
2016 WATER PRODUCTION PLAN
This section describes the strategy for
providing the quantity and quality
requirements for the water demand for the
upcoming summer (high demand) season. A
summary of events that occurred in the last
year has an impact on the water production
approach for 2016.
2015/2016 Winter Season: Upper Lake
Mary was at peak capacity of 56% on
February 25, 2016. If the lake follows
previous trends, it will lose approximately
12% to evaporation and seepage. If the city
uses 450 million gallons, or 1,380 AF
(average of about 2 MGD), for the
remainder of 2016, the lake will have a
predicted level of 36% by January 1, 2017.
This will leave a factor of safety for next
summer if the next winter season is dry.
The Inner Basin and Lake Mary surface
water supplies are the City's most
renewable water supplies. The cheapest
water supply to develop is from Upper Lake
Mary (see power costs on page 20). Power
costs should trend lower in 2016 as the city
shifts to more surface water production.
Therefore, assuming that the lake volume at
the end of year will be 36%, average water
production for the upcoming year is
projected to be:
Source Max Available1 (MGD)
Upper Lake Mary 5.50
Local Wells 4.87
Lake Mary Wells 3.42
Woody Mountain Wells 5.23
Inner Basin 2.00
Total Peak Day Available 21.02
Minus 15% Well Redundancy 18.69
Peak Day 2016 Operations Plan
2016 Annual Operations Plan
1. See Peak Available on Page 17—note the volume does not include McAllister Well until it is equipped and connected to the system.
3
1st Quarter (actual) 2nd Quarter (estimated)
Daily Avg
MGD MG Acre-ft
Daily Avg
MGD MG Acre-ft
Surface 0.38 34 105 2.10 191 587
LM Wells 1.34 122 374 1.43 171 526
WM Wells 1.67 152 467 1.68 210 645
Local Wells 2.66 243 745 2.94 199 612
IB 0 0 0 0.27 25 77
Total 6.1 551 1,527 8.4 875 2,447
3rd Quarter (estimated) 4th Quarter (estimated)
Daily Avg
MGD MG Acre-ft
Daily Avg
MGD MG Acre-ft
Surface 2.15 198 608 1.53 139 427
LM Wells 1.55 142 438 1.22 111 341
WM Wells 1.72 158 486 1.40 128 392
Local Wells 2.58 237 729 1.95 178 546
IB 0.60 55 169 0 0 0
Total 8.6 791 2,430 6.1 555 1,706
Based on 2016 projections of available
water supplies to meet anticipated demands,
production staff
expect to supply
the community with
about 20% surface
water and 80%
groundwater in
2016.
2016 Annual Estimate
MG Acre-ft
Surface 450 1,381
LM Wells 613 1,881
WM Wells 783 2,403
Local Wells 705 2,164
IB 60 184
Total 2,611 8,013

6
Annual Report May 10, 2016
2015 SUMMARY 4
4-1 2015 Notable Events & Improvements
Wastewater Operations Wildcat
1. Water Commission approved updating Wildcat’s name from a Wastewater Treatment Plant to Water Reclamation Plant
2. After Wildcat Hill WRP deployed 6 Geotubes ® to manage solids handling in the DLD area in 2014, the 5 month rolling geomean on the aquifer protection permit remained low again in 2015 and never exceeded xx mg/L in 2015.
3. Maintain total nitrogen levels below 8 mg/L 4. Produced Class A+ reclaimed water on a consistent basis 5. Upgrade SCADA System – In progress 6. Continuously improve operations and maintenance 7. Security Upgrades 8. Bi-weekly computerized safety training for staff 9. Vendor equipment training at the facilities
Wastewater Operations Rio
1. Staff switched treatment trains taking 1 off line for maintenance 2. Installation of security system both inside and outside the facility with video
surveillance and installed electronic door locks 3. Begin the process of engineering the upgrade of the U.V. disinfection system 4. Installed new flow meters on the main influent pipe. 5. Begin the process of upgrading the facility controls in accordance with the new SCADA
Master Plan. 6. Started a comprehensive Preventive Maintenance program. 7. Replaced VFD’s on Reclaim Pumps 1 and 2.
Water Production Operations
1. Shut down and cleaned Lake Mary Treatment plant due to HAA5 violation in distribution system attributed to organics from Upper Lake Mary
2. New Aquifer Protection Permit acquired for the Lake Mary sludge recovery lagoons 3. New below ground 8” discharge water line installed for Lake Mary Well #2 4. Electric motor overhauled Lake Mary Well #8 5. New well pump and motor installed Ft. Tuthill Well 6. New booster pumps for Fox Glenn and Ft. Tuthill Pump Stations 7. Cheshire Reservoir brought to current seismic standards and recoated interior and
exterior 8. Engineering design completed for the essential electrical upgrades to Lake Mary Water
Treatment Plant 9. Engineering design completed for the new McAllister Well and Pump Station 10. Engineering design completed for three SCADA Wireless network towers

7
Annual Report May 10, 2016
City of Flagstaff Rain & Stream Gage for the Rio de Flag at Peak
View Street. For Stormwater
Section updates see page 57.
Water Resources
1. Red Gap Ranch grant-funded environmental assessments completed (Page 76) 2. Utilities continued to support ongoing operation and maintenance of the 6
Flowtography watershed runoff monitoring stations within the 4-FRI treatment area of the Upper Lake Mary watershed. The equipment was purchased by the Lake Mary-Walnut Canyon Technical Advisory Committee (Utilities, National Park Service, and Coconino National Forest) in FY15 for $15,000 and Utilities contributed about $45,000 in FY 16 towards the operations and maintenance of the equipment. For more information see (Page 35.)
3. The USGS gauge at Newman Canyon has collected over a year’s worth of data at the site in Newman Canyon (see page 35 for more information.)
4. Completed Phase two of four of a leak detection survey on the water distribution system (206 of about 480 miles completed to date).
Regulatory Compliance
1. Passed the new Industrial Waste Local Limits ordinance in City Code (see page 74 for changes).
2. First complete year of the newly created the Regulatory Compliance Section. All laboratory and Industrial Waste supervisors and staff that oversee compliance within the water, wastewater, backflow and industrial waste regulatory compliance programs were brought into the new section.
3. Successfully updated the AZPDES Permits for the Rio de Flag Water Reclamation Facility (Rio WRF) and Wildcat Hill Wastewater Reclamation Plant (WRP).
4. Standardized ordering and operating the Rio de Flag and Wildcat Hill wastewater labs. 5. Coordinated efforts between the wastewater and industrial waste labs to sample the
effluent from the Rio de Flag and Wildcat Hill treatment plants to save the City money in sampling costs.
6. Submitted an Aquifer Protection Permit (APP) modification for the Wildcat Hill WRP to ADEQ to modify the monitoring schedule for the point of compliance well and change the name to the Wildcat Hill WRP.
7. Obtained the Area-wide AZPDES de minimus Permit from ADEQ. 8. Implemented software to track
and manage compliance data for the drinking water and wastewater labs.
9. Assisted in resolving an HAA5 exceedance at the Lake Mary Water Treatment Plant.
10. Upgraded flow and pH monitoring equipment located at Significant Industrial User outfalls to provide secure real time, web based information.
8
Annual Report May 10, 2016
Engineering
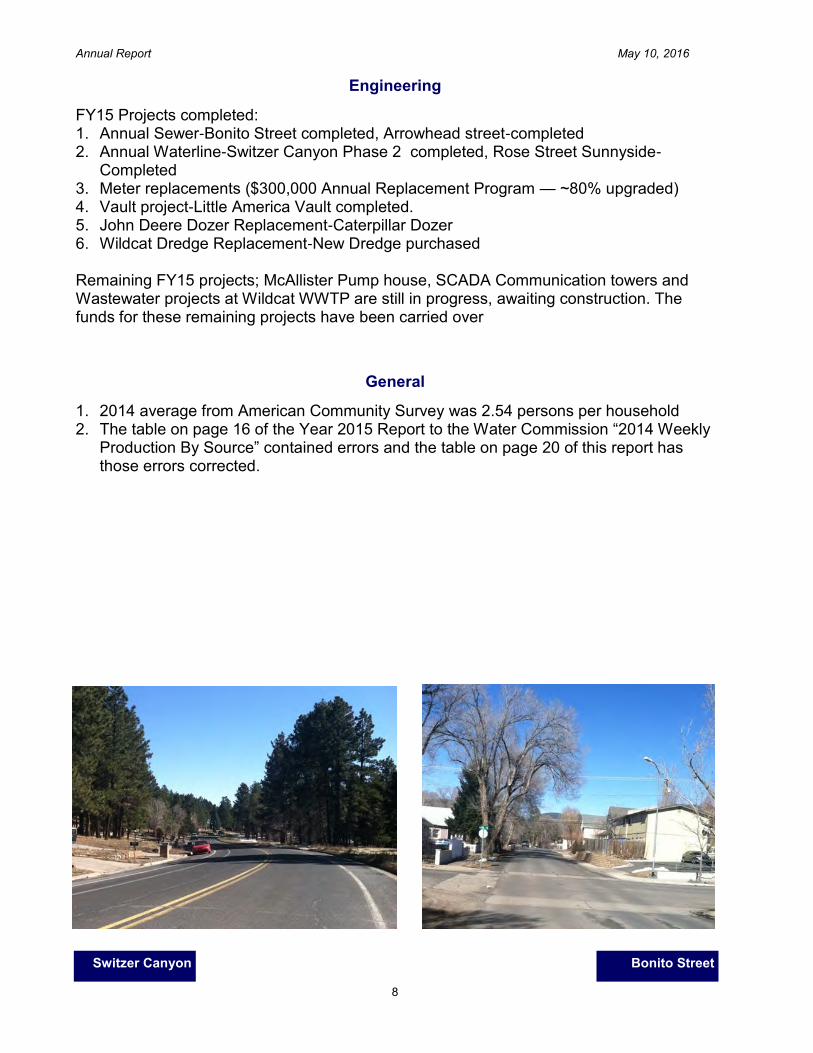
FY15 Projects completed: 1. Annual Sewer-Bonito Street completed, Arrowhead street-completed 2. Annual Waterline-Switzer Canyon Phase 2 completed, Rose Street Sunnyside-
Completed 3. Meter replacements ($300,000 Annual Replacement Program — ~80% upgraded) 4. Vault project-Little America Vault completed. 5. John Deere Dozer Replacement-Caterpillar Dozer 6. Wildcat Dredge Replacement-New Dredge purchased Remaining FY15 projects; McAllister Pump house, SCADA Communication towers and Wastewater projects at Wildcat WWTP are still in progress, awaiting construction. The funds for these remaining projects have been carried over
General
1. 2014 average from American Community Survey was 2.54 persons per household 2. The table on page 16 of the Year 2015 Report to the Water Commission “2014 Weekly
Production By Source” contained errors and the table on page 20 of this report has those errors corrected.
Bonito Street Switzer Canyon
9
Annual Report May 10, 2016
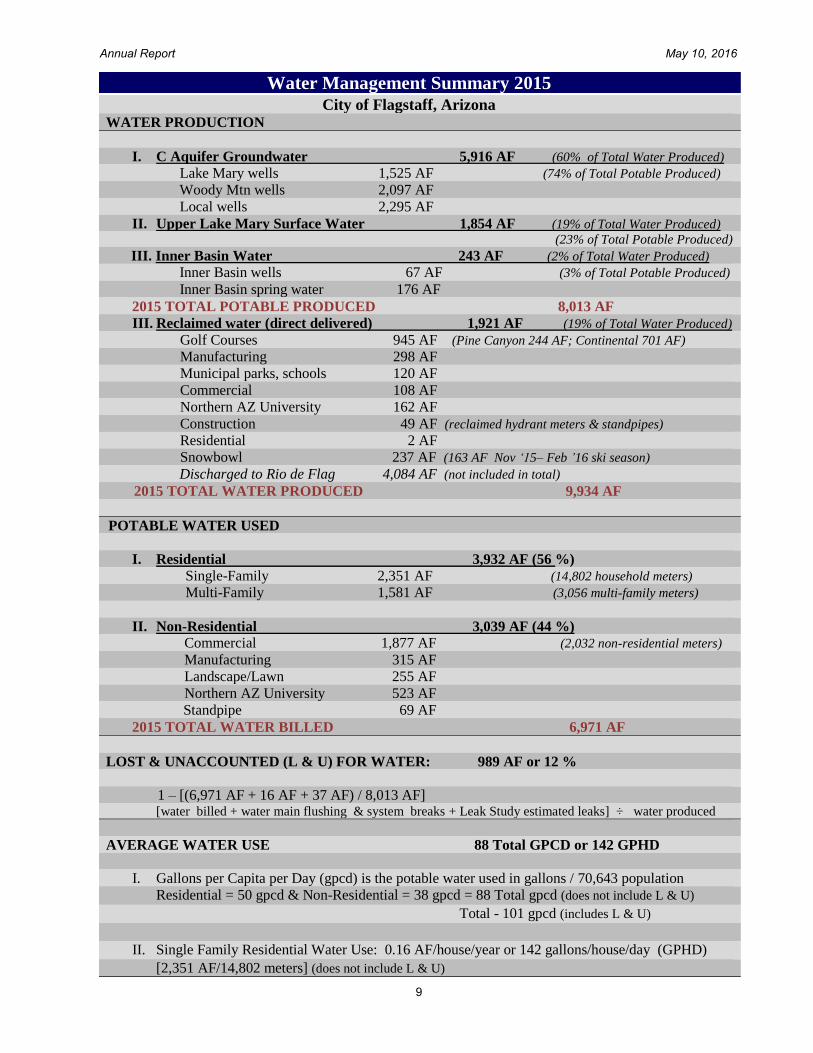
Water Management Summary 2015
City of Flagstaff, Arizona A. WATER PRODUCTION
I. C Aquifer Groundwater 5,916 AF (60% of Total Water Produced)
Lake Mary wells 1,525 AF (74% of Total Potable Produced)
Woody Mtn wells 2,097 AF
Local wells 2,295 AF
II. Upper Lake Mary Surface Water 1,854 AF (19% of Total Water Produced) (23% of Total Potable Produced)
III. Inner Basin Water 243 AF (2% of Total Water Produced)
Inner Basin wells 67 AF (3% of Total Potable Produced)
Inner Basin spring water 176 AF
2015 TOTAL POTABLE PRODUCED 8,013 AF
III. Reclaimed water (direct delivered) 1,921 AF (19% of Total Water Produced)
Golf Courses 945 AF (Pine Canyon 244 AF; Continental 701 AF)
Manufacturing 298 AF
Municipal parks, schools 120 AF
Commercial 108 AF
Northern AZ University 162 AF
Construction 49 AF (reclaimed hydrant meters & standpipes)
Residential 2 AF
Snowbowl 237 AF (163 AF Nov ‘15– Feb ’16 ski season)
Discharged to Rio de Flag 4,084 AF (not included in total)
2015 TOTAL WATER PRODUCED 9,934 AF
B. POTABLE WATER USED
I. Residential 3,932 AF (56 %) Single-Family 2,351 AF (14,802 household meters)
Multi-Family 1,581 AF (3,056 multi-family meters)
II. Non-Residential 3,039 AF (44 %) Commercial 1,877 AF (2,032 non-residential meters)
Manufacturing 315 AF
Landscape/Lawn 255 AF
Northern AZ University 523 AF
Standpipe 69 AF
2015 TOTAL WATER BILLED 6,971 AF
C. LOST & UNACCOUNTED (L & U) FOR WATER: 989 AF or 12 %
1 – [(6,971 AF + 16 AF + 37 AF) / 8,013 AF] [water billed + water main flushing & system breaks + Leak Study estimated leaks] ÷ water produced
D. AVERAGE WATER USE 88 Total GPCD or 142 GPHD
I. Gallons per Capita per Day (gpcd) is the potable water used in gallons / 70,643 population
Residential = 50 gpcd & Non-Residential = 38 gpcd = 88 Total gpcd (does not include L & U)
Total - 101 gpcd (includes L & U)
II. Single Family Residential Water Use: 0.16 AF/house/year or 142 gallons/house/day (GPHD)
[2,351 AF/14,802 meters] (does not include L & U)

10
Annual Report May 10, 2016
11
Annual Report May 10, 2016
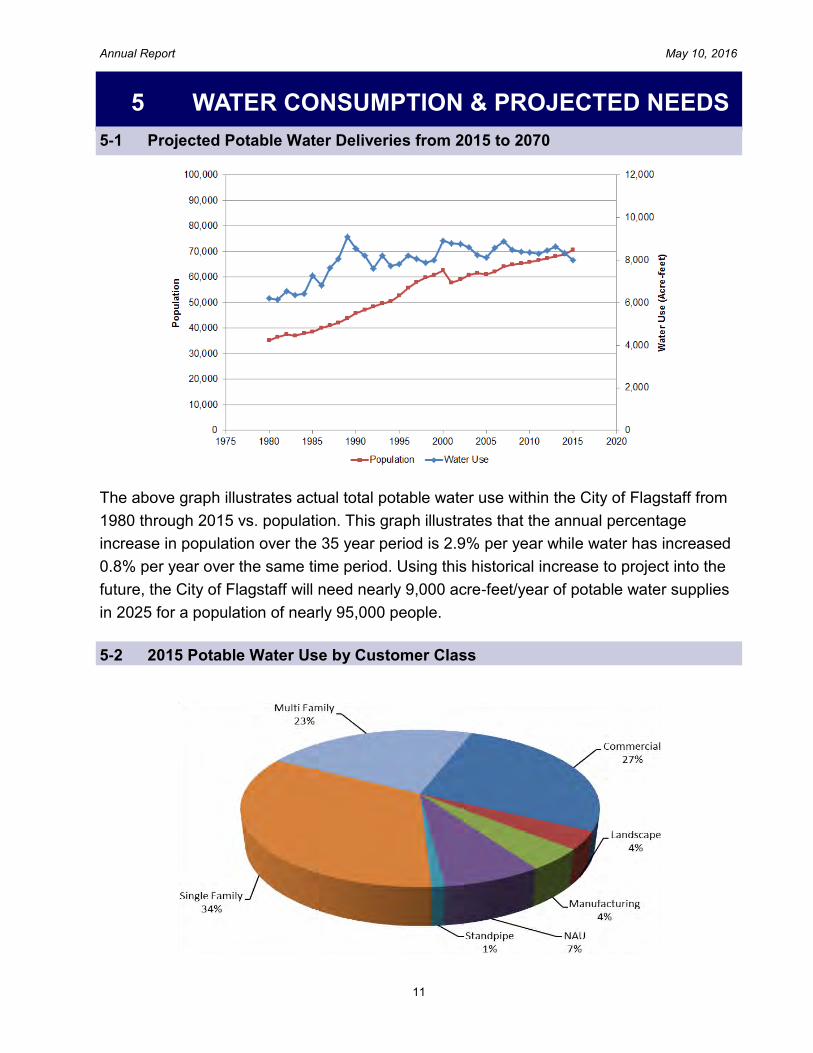
WATER CONSUMPTION & PROJECTED NEEDS 5
The above graph illustrates actual total potable water use within the City of Flagstaff from
1980 through 2015 vs. population. This graph illustrates that the annual percentage
increase in population over the 35 year period is 2.9% per year while water has increased
0.8% per year over the same time period. Using this historical increase to project into the
future, the City of Flagstaff will need nearly 9,000 acre-feet/year of potable water supplies
in 2025 for a population of nearly 95,000 people.
5-1 Projected Potable Water Deliveries from 2015 to 2070
5-2 2015 Potable Water Use by Customer Class

12
Annual Report May 10, 2016
5-3 Water Meters
Meters Read—Highest Month Each Year for Last 10 Years
New Meter Sets in Last 10 Years

13
Annual Report May 10, 2016
The Arizona Department of Water
Resources (ADWR) issued the City a
Designation of Adequate Water Supply in
2013. The Designation identified 9,913 AF/
YR (acre-feet per year) of local groundwater
(Lake Mary, Woody Mountain and Local well
fields), 3,585 AF/YR from Upper Lake Mary,
16,500 AF/YR from Red Gap Ranch, and
2,212 AF/YR of reclaimed water as available
supplies to meet 100 years of demand.
Utilities self-limits the supply from Red Gap
Ranch to 8,000 AF/YR after signing an
agreement with the Navajo Nation in 2011.
The Designation was based upon several
factors: 1) population growth projections
from the voter-approved Regional Land Use
Plan, 2) water supply availability as
demonstrated using a groundwater
computer model developed by the U.S.
Geological Survey, and 3) records of direct
delivered reclaimed water use.
Flagstaff is required to provide to ADWR
annually the current, committed and
projected water demands are for the
community.
Reporting
Year
Current
Demand
Potable
Current
Demand
Reclaimed
Total
Current
Demand1
Committed
Demand2
10-Year Projected
Demand3
Remaining
Designation
Volume4
2015 8,013 1,921 9,934
2014 8,347 1,934 10,281 1,058 11,629 4,371
2013 8,565 2,252 10,816 819 9,881 4,034
2012 8,458 2,050 10,508 707 9,673 4,332
2011 8,249 2,212 10,461 859 9,517 4,390
Annual Reporting to ADWR (in acre-feet/year)
1. Total current demand reported to ADWR is the sum of potable and reclaimed water delivered in that calendar year
2. Committed demand is Council-approved plats, building permits and rezones approved but not served 3. Based on the historic 60-year growth rate of 1.4%; does not include reclaimed water 4. Total Designation Volume - Current Demand + Committed Demand. This figure does not include the
8,000 AF/year available from Red Gap Ranch. Data reported annually to ADWR by June 1; data for 2015 has not been reported.
5-4 Designation of Adequate Water Supply
14
Annual Report May 10, 2016
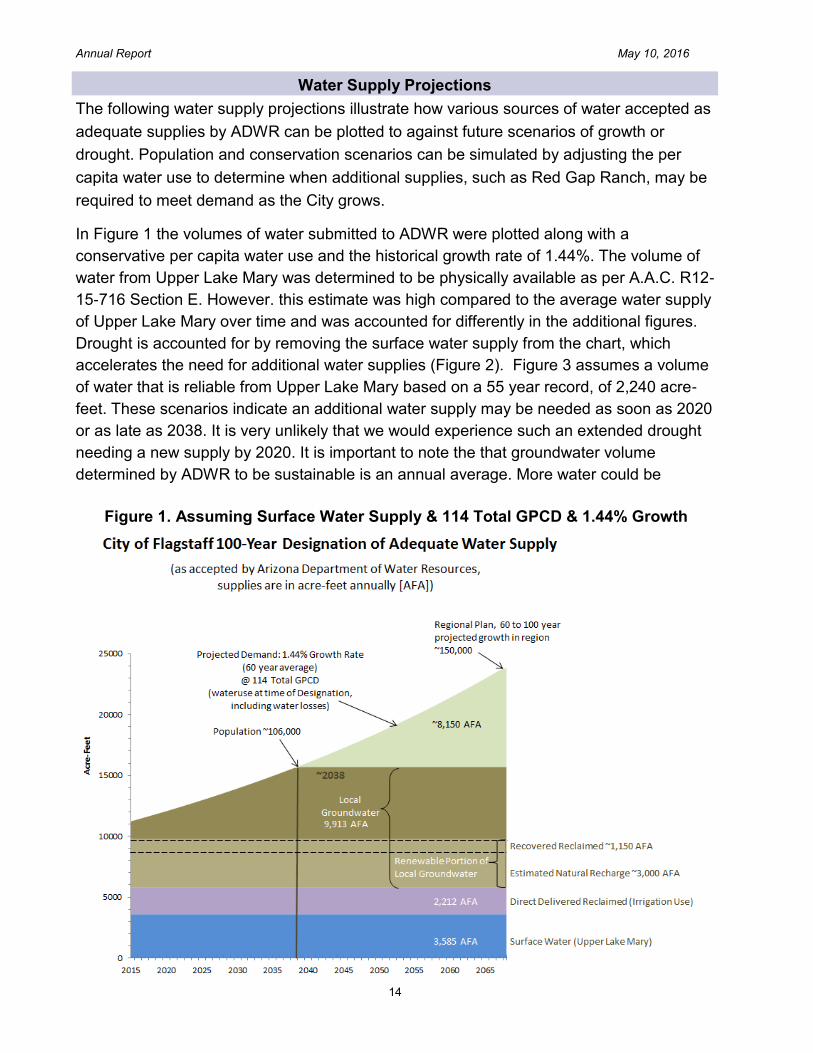
The following water supply projections illustrate how various sources of water accepted as
adequate supplies by ADWR can be plotted to against future scenarios of growth or
drought. Population and conservation scenarios can be simulated by adjusting the per
capita water use to determine when additional supplies, such as Red Gap Ranch, may be
required to meet demand as the City grows.
In Figure 1 the volumes of water submitted to ADWR were plotted along with a
conservative per capita water use and the historical growth rate of 1.44%. The volume of
water from Upper Lake Mary was determined to be physically available as per A.A.C. R12-
15-716 Section E. However. this estimate was high compared to the average water supply
of Upper Lake Mary over time and was accounted for differently in the additional figures.
Drought is accounted for by removing the surface water supply from the chart, which
accelerates the need for additional water supplies (Figure 2). Figure 3 assumes a volume
of water that is reliable from Upper Lake Mary based on a 55 year record, of 2,240 acre-
feet. These scenarios indicate an additional water supply may be needed as soon as 2020
or as late as 2038. It is very unlikely that we would experience such an extended drought
needing a new supply by 2020. It is important to note the that groundwater volume
determined by ADWR to be sustainable is an annual average. More water could be
Water Supply Projections
Figure 1. Assuming Surface Water Supply & 114 Total GPCD & 1.44% Growth

15
Annual Report May 10, 2016
Figure 2. Assuming No Surface Water Supply & Total 114 GPCD & 1.44% Growth
developed from the aquifer as long as the annual average does not exceed 9,913 acre-
feet per year.
Figure 3. Assuming Reliable Surface Water Supply & Total 100 GPCD & 1.44%
Growth

16
Annual Report May 10, 2016
Figure 4. Assuming No Surface Water Supply & Total 100 GPCD & 1.44% Growth

17
Annual Report May 10, 2016
WATER PRODUCTION
2016 Estimated Wells Peak Capacity
Local Wells Maximum Production
(gpm)
Lake Mary Wells Maximum
Production (gpm)
Woody Mountain Wells
Maximum Production (gpm)
Continental-2 310 LM 1 155 WM 1 225
Foxglenn 350* LM 2 390 WM 2 225
Sinagua 300* LM 4 400 WM 3 565
Shop 840 LM 5 290 WM 4 320
Ft. Tuthill 1,250 LM 8 900 WM 5 280
Interchange 185 LM 9 240 WM 6 350
Rio 200 WM 7 550
McAllister Scheduled for 2015 WM 9 460
WM 10 300 *Foxglenn/Sinagua pumphouse limited
to max volume of 600 gpm WM 11 355
Total gpm 3,385GPM 2,375 GPM 3,630 GPM
Total MGD 4.87 MGD 3.42 MGD 5.23 MGD
TOTAL PEAK WELL CAPACITY
WITH ONE HIGH-CAPACITY WELL REDUNDANCY (15%)
13.52 MGD
11.49 MGD
6
6-1 Water Wells Peak Capacity
Photo by Brad Hill
18
Annual Report May 10, 2016
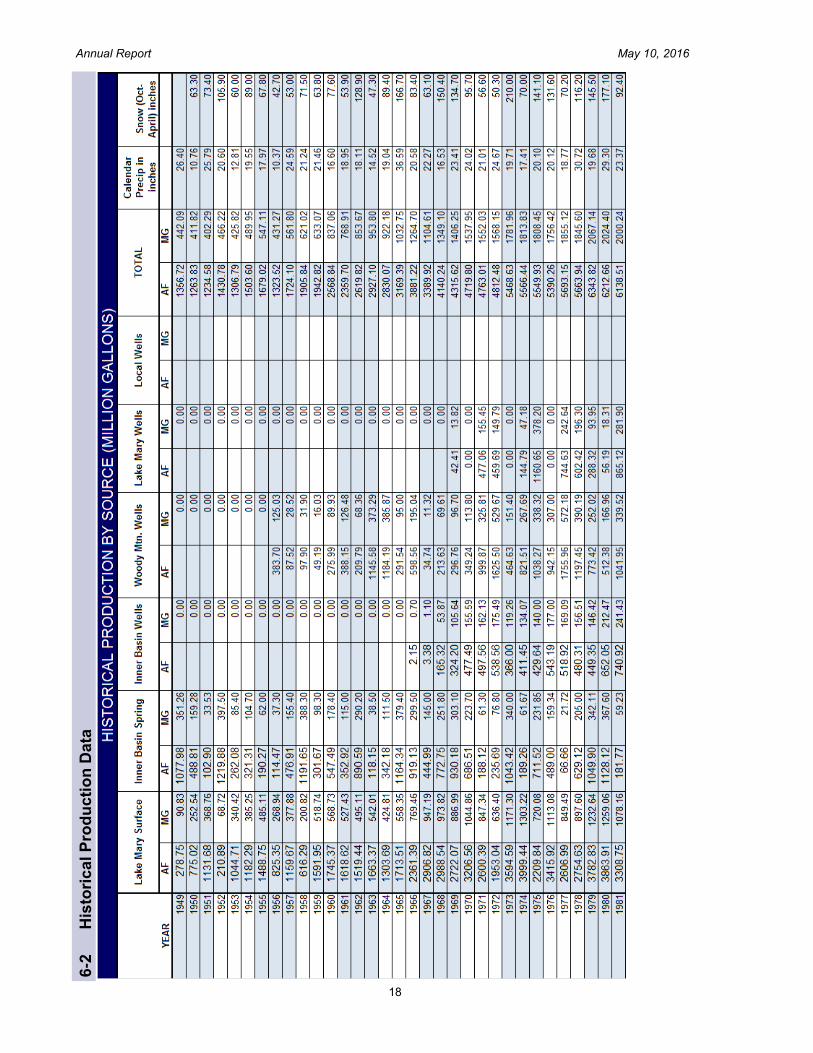
6-2
H
isto
ric
al P
rod
ucti
on
Da
ta

19
Annual Report May 10, 2016

20
Annual Report May 10, 2016
6-3 2015 Weekly Production By Source (Million Gallons)
MONTH WEEK TOTAL LM SURFACE LM WELLS WM WELLS R F P LOC WELLS
January 1 46.59 5.368 11.227 10.439 0 19.554
2 42.56 8.172 10.733 9.082 0 14.574
3 43.44 6.359 10.946 9.207 0 16.923
4 45.03 7.653 11.01 9.347 0 17.019
February 1 42.21 6.592 11.424 9.052 0 15.137
2 41.03 7.549 10.19 9.276 0 14.014
3 45.23 9.723 10.72 9.108 0 15.679
4 42.93 11.081 9.69 9.014 0 13.141
March 1 41.57 8.266 10.069 9.345 0 13.887
2 44.14 10.977 10.059 9.033 0 14.069
3 41.23 10.68 9.419 9.07 0 12.065
4 44.45 14.338 9.398 9.268 0 11.445
April 1 48.59 16.426 9.231 9.339 0 13.595
2 46.35 10.196 9.206 8.975 0 17.969
3 49.83 13.392 9.2 9.101 0.498 17.635
4 54.98 17.951 9.846 12.23 1.018 13.933
5 53.23 18.763 8.798 10.305 0.881 14.487
May 1 54.43 21.201 6.269 10.344 1.137 15.476
2 51.91 17.695 6.564 10.135 1.308 16.206
3 49.36 18.039 6.571 10.222 0.857 13.669
4 51.92 16.577 6.135 15.854 1.317 12.04
June 1 59.92 21.198 6.609 20.726 1.9 9.484
2 54.86 18.63 5.438 13.66 4.083 13.044
3 59.86 18.058 6.539 13.479 8.008 13.771
4 68.42 25.712 9.622 13.732 6.607 12.751
July 1 63.98 23.806 6.474 12.725 8.072 12.901
2 53.91 15.327 6.745 12.686 4.928 14.221
3 60.93 24.594 7.086 10.145 3.911 15.192
4 58.05 23.612 6.517 9.904 3.139 14.875
5 62.10 26.825 6.943 9.758 6.481 12.091
August 1 60.28 23.642 7.065 9.791 5.646 14.135
2 52.06 22.026 6.837 9.674 3.861 9.663
3 58.38 20.973 7.496 10.007 3.756 16.147
4 59.82 21.92 7.52 9.616 3.94 16.819
September 1 58.31 20.052 7.337 15.083 3.745 12.097
2 57.39 15.761 8.129 17.629 2.689 13.178
3 56.36 10.694 13.1 18.757 0.855 12.958
4 59.48 6.657 15.217 25.72 0.535 11.354
5 58.86 6.759 14.107 26.199 0 11.794
October 1 54.79 0.933 15.44 29.437 0 8.982
2 51.22 0 14.542 28.462 0 8.215
3 48.21 0 11.606 23.783 0 12.819
4 42.27 0 10.032 18.096 0 14.144
November 1 42.22 0 11.121 13.745 0 17.358
2 40.77 0 11.673 12.988 0 16.109
3 41.07 0 11.195 12.925 0 16.945
4 37.90 0 10.21 11.05 0 16.641
December 1 44.82 0 12.377 14.648 0 17.793
2 42.39 0 12.192 13.032 0 17.167
3 41.86 0 11.651 12.498 0 17.715
4 39.71 0 10.013 12.763 0 16.938
5 39.90 0 9.212 12.802 0 17.882
Total year, 2015 2611.07 604.18 496.75 683.27 79.17 747.70
Acre-Feet 8013.06 1854.15 1524.47 2096.87 242.97 2294.61
Total year, 2014 2719.71 338.17 562.68 838.87 83.29 896.70
TOTAL LM SURFACE LM WELLS WM WELLS R F P LOC WELLS
2015 % of 2014 96% 179% 88% 81% 132% 83%
2015 % By Source 23% 19% 26% 3% 29%
AVG DAILY 7.15 1.66 1.36 1.87 0.22 2.05
RFP = Reservoir Filtration Plant
Difference between total and sum of individual wells on page 22 & 23 is due to meter inaccuracies

21
Annual Report May 10, 2016
Historic Average (1949-2015) Potable Water Supply 2015
Production by Source (1949-2015)

22
Annual Report May 10, 2016
6-4
M
os
t R
ec
en
t D
istr
ibu
tio
n S
ys
tem
Wa
ter
Qu
ali
ty a
t E
ac
h E
PD
S (
En
try P
oin
t to
th
e D
istr
ibu
tio
n S
ys
tem
)
mg/L
= m
illig
ram
s p
er
liter
MF
L =
mill
ion f
ibre
s p
er
lite
r pC
i/L =
pic
ocuri
es p
er
liter.
Pic
ocuri
es p
er
liter
is a
measure
of
the r
adio
activity in w
ate
r.
µg/L
= m
icro
gra
ms p
er
Liter
D
rinkin
g w
ate
r re
gula
tio
ns o
nly
ca
ll fo
r sam
plin
g e
very
couple
of
ye
ars
de
pen
din
g o
n t
he E
PD
S.

23
Annual Report May 10, 2016
6-5 City Supply Wells & Registration Information
* EPDS – Wells that are tested as an entry point to the distribution system (EPDS). See page 18 for drinking water quality data regulated by the Arizona Department of Environmental Quality. Other EPDS points include the Woody Mountain booster site (EPDS 001), Inner Basin water at the North Reservoir Plant (EPDS 002), and water from Upper Lake Mary (EPDS 003).
CADASTRAL NAME
ADWR REGISTRATION
NUMBER
DATE OF
COMPLETION
A (21-06) 35 cbd Woody Mtn Well #1 55-606201 Dec-54
A (21-06) 35 ccb Woody Mtn Well #2 55-606202 Jul-56
A (21-06) 35 bcc Woody Mtn Well #3 55-606203 Oct-57
A (21-06) 35 ccc Woody Mtn Well #4 55-606204 Nov-57
A (20-06) 02 bbc Woody Mtn Well #5 55-606205 Jun-63
A (20-06) 02 bdb Woody Mtn Well #6 55-606206 Mar-68
A (20-06) 11 bab Woody Mtn Well #7 55-606207 Apr-78
A (20-06) 11 cab Woody Mtn Well #9 55-509026 Nov-85
A (20-06) 02 bcb Woody Mtn Well #10 55-548560 Mar-96
A (20-06) 11 baa Woody Mtn Well #11 55-559574 Jun-98
A (20-08) 18 bbb Lake Mary Well #1 55-606195 Oct-62
A (20-08) 18 ccb Lake Mary Well #2 55-606196 Dec-64
A (20-07) 12 dda Lake Mary Well #3 55-606197 Sep-65
A (20-08) 19 aba Lake Mary Well #4 55-606198 Jan-72
A (20-08) 20 dbc Lake Mary Well #5 55-606199 Dec-75
A (20-08) 27 bdc Lake Mary Well #7 55-606200 Dec-78
A (20-08) 20 cca Lake Mary WTP #8 55-606228 Mar-82
A (20-08) 30 cdb Lake Mary Well #9 55-532282 Sep-91
A (23-07) 33 aab Inner Basin Well #9 55-606209 Aug-68
A (23-07) 27 cca Inner Basin Well #11 55-606210 Aug-71
A (23-07) 28 ddb Inner Basin Well #14 55-606211 Aug-70
A (21-07) 24 aac Foxglenn Well (EPDS 4) 55-559572 Jan-97
A (21-08) 17 bca Continental Well-2 (EPDS 5) 55-560805 Feb-97
A (21-08) 07 dbb Interchange Well (EPDS 6) 55-588998 Nov-02
A (21-08) 05 dca Shop Well (EPDS 7) 55-588257 Dec-02
A (21-07) 23 cbb Rio Well (EPDS 8) 55-599535 Nov-03
A (20-07) 06 adc Ft. Tuthill Well (EPDS 9) 55-907084 Jan-08
A (21-07) 24 acd Sinagua Well (EPDS 4) 55-907085 May-08
A (21-07) 19 bbd McAllister Well 55-908260 Apr-09

24
Annual Report May 10, 2016
6-6 POTABLE & RECLAIMED POWER COST—CY 2015
Electricity
$/Kgal Total Power
Cost
Water
Produced
(MG)
Total
Megawatt
Cost Per
Acre-foot
Water Source Source Raw
Pump Booster
Final
Cost
Lake Mary Wells $0.62 $0.09 $0.71 $377,095 531.12 3,579.80 $231.35
Lake Mary Plant $0.30 $0.09 $0.39 $235,630 604.18 2,335.78 $127.08
Local Wells $0.96 $0.036 $0.96 $486,662 506.94 7,345.97 $312.82
Woody Mountain
Wells $0.79 $0.036 $0.83 $421,083 507.33 5,971.31 $270.46
Inner Basin Wells $0.67 $0.036 $0.71 $81,216 114.39 20.83 $231.35
Totals $1,601,686 2,263.96 19,253.69
Average $0.67 $0.02 $0.72 $234.61
Data from Utilities Division, Production Section, April, 2016
Costs do not include operation and maintenance or chemical treatment costs
Electrical charges to boost the water to homes in Flagstaff was distributed across WM, IB, and Local Wells only
IB includes Fuel and Labor costs
Electricity Used to Treat
Influent to Plants
(kWh)
Electricity
Used to
Deliver
Reclaimed
Water
(kWh)
Total
Reclaimed
Delivered
(gallons) Water Reclamation
Plant APS Solar Co-Gen
Wildcat Hill 2,163,655 1,450,681 305,120 349,728
Rio de Flag 3,256,340 527,065 551,271
Totals 5,419,995 1,977,746 305,120 900,999 625,959,771
Cost to Utility $100,160
Data from Utilities Division, Wastewater Treatment Section, April, 2016
Note the energy cost above for reclaimed water is only that to pump into the reclaimed water system. Staff can not differentiate out the portion of the overall cost to treat wastewater from that to produce reclaimed water

25
Annual Report May 10, 2016
WELL FIELDS 7
7-1 Well Fields & Infrastructure

26
Annual Report May 10, 2016
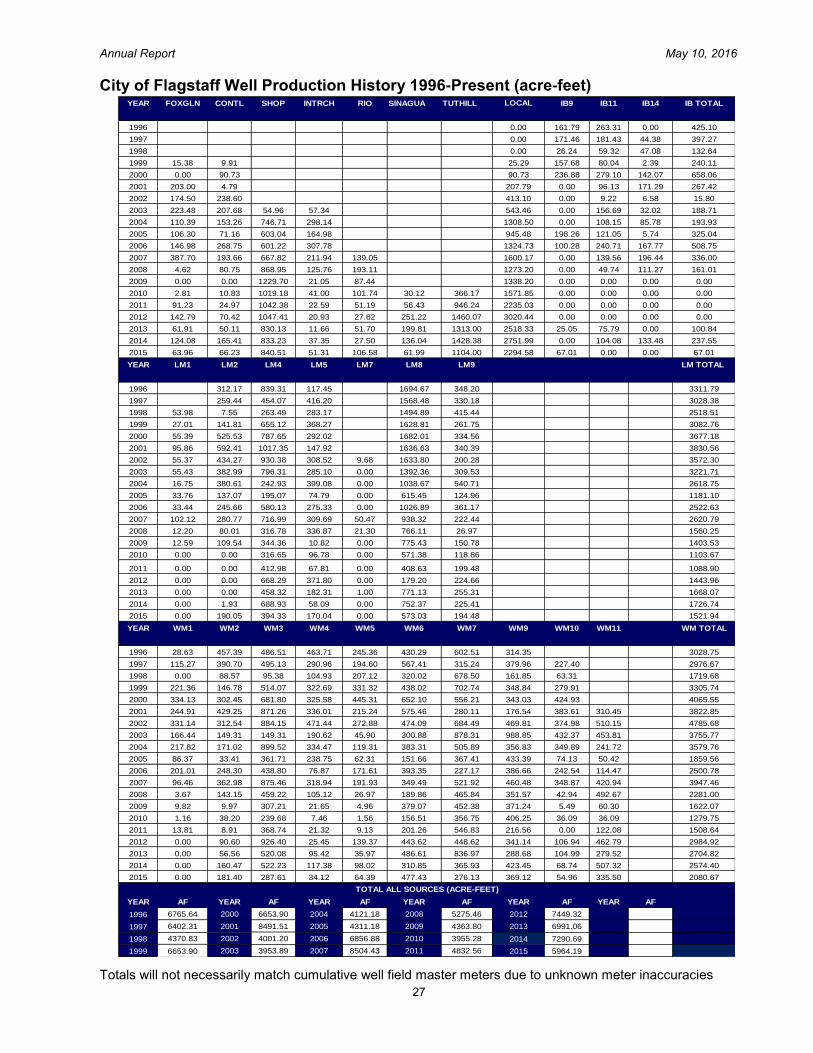
7-2 City of Flagstaff Well Production History 1996-Present (million gallons)
Totals will not necessarily match cumulative well field master meters due to unknown meter inaccuracies
YEAR FOXGLN CONTL SHOP INTRCH RIO SINAGUA TUTHILL LOCAL IB9 IB11 IB14 IB TOTAL
1996 52.720 85.800 0.000 138.520
1997 55.870 59.120 14.460 129.450
1998 8.550 19.330 15.340 43.220
1999 5.010 3.230 8.240 51.380 26.080 0.780 78.240
2000 0 29.565 29.565 77.189 90.945 46.294 214.428
2001 66.149 1.560 67.709 0 31.323 55.815 87.138
2002 56.860 77.748 134.608 0 3.004 2.145 5.149
2003 72.821 67.674 17.909 18.683 177.087 0 51.057 10.435 61.492
2004 35.972 49.939 243.317 97.148 426.376 0 35.240 27.951 63.191
2005 34.637 23.189 196.500 53.758 308.084 64.602 39.444 1.870 105.916
2006 47.892 87.574 195.908 100.290 431.664 32.675 78.434 54.667 165.776
2007 126.331 63.106 217.610 69.060 45.310 521.417 0 45.476 64.011 109.487
2008 1.507 26.311 283.149 40.98 62.926 414.873 0 16.209 36.257 52.466
2009 0 0 400.7 6.86 28.494 436.054 0 0 0 0
2010 0.916 3.53 332.1 13.36 33.151 9.816 119.317 512.190 0 0 0 0
2011 29.726 8.138 339.66 7.36 16.68 18.389 308.334 728.287 0 0 0 0
2012 46.527 22.945 341.3 6.82 8.999 81.859 475.765 984.215 0 0 0 0
2013 20.1719 16.3274 270.5 3.8 16.848 65.1097 427.8429 820.600 8.163 24.695 0 32.858
2014 40.43 53.9 271.51 12.17 8.96 44.33 465.44 896.740 0.000 33.914 43.49 77.407
2015 20.84 21.58 273.88 16.72 34.73 20.20 359.74 747.690 21.835 0.000 0.00 21.835
YEAR LM1 LM2 LM4 LM5 LM7 LM8 LM9 LM TOTAL
1996 101.720 273.490 38.270 552.210 113.460 1079.150
1997 0.000 84.540 147.960 135.620 511.090 107.590 986.800
1998 17.590 2.460 85.860 92.270 487.110 135.370 820.660
1999 8.800 46.210 213.470 120.000 530.750 85.290 1004.520
2000 18.049 171.246 256.658 95.156 548.086 109.017 1198.212
2001 31.236 193.036 331.506 48.201 533.297 110.915 1248.191
2002 18.043 141.507 303.165 100.531 3.155 532.376 65.262 1164.039
2003 18.062 124.797 259.479 92.900 0 453.701 100.860 1049.799
2004 5.457 124.023 79.160 130.041 0 338.451 176.190 853.322
2005 11.002 44.665 63.565 24.370 0 200.544 40.717 384.863
2006 10.895 80.049 189.037 89.718 0 334.613 117.689 822.001
2007 33.275 91.488 233.631 100.913 16.447 305.751 72.482 853.988
2008 3.977 26.072 103.224 109.768 6.941 249.638 8.788 508.408
2009 4.103 35.694 112.21 3.526 0 252.675 49.133 457.341
2010 0 0 103.18 31.535 0 186.186 38.731 359.632
2011 0 0 134.57 22.095 0 133.152 65.001 354.818
2012 0 0 217.764 121.153 0 58.394 73.206 470.517
2013 0 0 149.343 59.407 0 251.275 83.193 543.218
2014 0.000 0.630 224.490 18.930 0.000 245.160 73.450 562.660
2015 0.000 61.929 128.494 55.409 0.000 186.722 63.372 495.926
YEAR WM1 WM2 WM3 WM4 WM5 WM6 WM7 WM9 WM10 WM11 WM TOTAL
1996 9.330 149.040 158.530 151.100 79.950 140.210 196.330 102.430 986.920
1997 37.560 127.310 161.340 94.810 63.410 184.890 102.720 123.810 74.100 969.950
1998 0.000 28.860 31.080 34.190 67.490 104.280 221.090 52.740 20.630 560.360
1999 72.130 47.830 167.510 105.150 107.960 142.730 228.990 113.670 91.210 1077.180
2000 108.875 98.554 222.164 106.091 145.106 212.489 181.241 111.777 138.465 1324.762
2001 79.803 139.872 283.900 109.490 70.137 187.515 91.275 57.525 125.001 101.162 1245.680
2002 107.903 101.841 288.102 153.620 88.919 154.482 223.042 153.087 122.189 166.234 1559.419
2003 54.234 48.651 48.651 62.113 14.955 98.042 286.197 322.218 140.888 147.873 1223.822
2004 70.978 55.726 293.108 108.986 38.876 124.902 164.845 116.272 114.012 78.764 1166.469
2005 28.143 10.887 117.863 77.798 20.303 49.420 119.721 141.219 24.155 16.429 605.938
2006 65.498 80.910 142.982 25.047 55.920 128.174 74.025 125.994 79.033 37.299 814.882
2007 31.433 118.277 285.269 103.927 62.540 113.881 170.067 150.048 113.680 137.164 1286.285
2008 1.197 46.644 149.636 34.252 8.789 61.866 151.793 114.561 13.991 160.537 743.266
2009 3.199 3.249 100.105 7.054 1.615 123.519 147.408 120.969 1.788 19.648 528.554
2010 0.379 12.449 78.100 2.430 0.509 50.999 116.248 132.377 11.759 11.759 417.009
2011 4.499 2.902 120.155 6.948 2.975 65.582 178.185 70.566 0 39.779 491.591
2012 0 29.521 301.868 8.292 45.413 144.554 146.182 111.161 34.845 150.802 972.638
2013 0 18.430 169.470 31.094 11.720 158.563 272.729 94.067 34.211 91.083 881.367
2014 0.000 52.290 170.170 38.250 31.940 101.290 119.240 137.980 22.400 165.310 838.870
2015 0.000 59.110 93.718 11.118 20.983 155.571 89.978 120.278 17.909 109.322 677.987
YEAR MG YEAR MG YEAR MG YEAR MG YEAR MG YEAR MG
1996 2204.590 2000 2766.967 2004 1342.889 2008 1719.013 2012 2427.370
1997 2086.200 2001 2648.718 2005 1404.801 2009 1421.949 2013 2278.043
1998 1424.240 2002 1303.796 2006 2234.322 2010 1288.831 2014 2375.677
1999 2168.180 2003 1288.378 2007 2771.177 2011 1574.696 2015 1943.438
TOTAL ALL SOURCES
27
Annual Report May 10, 2016
City of Flagstaff Well Production History 1996-Present (acre-feet)
Totals will not necessarily match cumulative well field master meters due to unknown meter inaccuracies
YEAR FOXGLN CONTL SHOP INTRCH RIO SINAGUA TUTHILL LOCAL IB9 IB11 IB14 IB TOTAL
1996 0.00 161.79 263.31 0.00 425.10
1997 0.00 171.46 181.43 44.38 397.27
1998 0.00 26.24 59.32 47.08 132.64
1999 15.38 9.91 25.29 157.68 80.04 2.39 240.11
2000 0.00 90.73 90.73 236.88 279.10 142.07 658.06
2001 203.00 4.79 207.79 0.00 96.13 171.29 267.42
2002 174.50 238.60 413.10 0.00 9.22 6.58 15.80
2003 223.48 207.68 54.96 57.34 543.46 0.00 156.69 32.02 188.71
2004 110.39 153.26 746.71 298.14 1308.50 0.00 108.15 85.78 193.93
2005 106.30 71.16 603.04 164.98 945.48 198.26 121.05 5.74 325.04
2006 146.98 268.75 601.22 307.78 1324.73 100.28 240.71 167.77 508.75
2007 387.70 193.66 667.82 211.94 139.05 1600.17 0.00 139.56 196.44 336.00
2008 4.62 80.75 868.95 125.76 193.11 1273.20 0.00 49.74 111.27 161.01
2009 0.00 0.00 1229.70 21.05 87.44 1338.20 0.00 0.00 0.00 0.00
2010 2.81 10.83 1019.18 41.00 101.74 30.12 366.17 1571.85 0.00 0.00 0.00 0.00
2011 91.23 24.97 1042.38 22.59 51.19 56.43 946.24 2235.03 0.00 0.00 0.00 0.00
2012 142.79 70.42 1047.41 20.93 27.62 251.22 1460.07 3020.44 0.00 0.00 0.00 0.00
2013 61.91 50.11 830.13 11.66 51.70 199.81 1313.00 2518.33 25.05 75.79 0.00 100.84
2014 124.08 165.41 833.23 37.35 27.50 136.04 1428.38 2751.99 0.00 104.08 133.48 237.55
2015 63.96 66.23 840.51 51.31 106.58 61.99 1104.00 2294.58 67.01 0.00 0.00 67.01
YEAR LM1 LM2 LM4 LM5 LM7 LM8 LM9 LM TOTAL
1996 312.17 839.31 117.45 1694.67 348.20 3311.79
1997 259.44 454.07 416.20 1568.48 330.18 3028.38
1998 53.98 7.55 263.49 283.17 1494.89 415.44 2518.51
1999 27.01 141.81 655.12 368.27 1628.81 261.75 3082.76
2000 55.39 525.53 787.65 292.02 1682.01 334.56 3677.18
2001 95.86 592.41 1017.35 147.92 1636.63 340.39 3830.56
2002 55.37 434.27 930.38 308.52 9.68 1633.80 200.28 3572.30
2003 55.43 382.99 796.31 285.10 0.00 1392.36 309.53 3221.71
2004 16.75 380.61 242.93 399.08 0.00 1038.67 540.71 2618.75
2005 33.76 137.07 195.07 74.79 0.00 615.45 124.96 1181.10
2006 33.44 245.66 580.13 275.33 0.00 1026.89 361.17 2522.63
2007 102.12 280.77 716.99 309.69 50.47 938.32 222.44 2620.79
2008 12.20 80.01 316.78 336.87 21.30 766.11 26.97 1560.25
2009 12.59 109.54 344.36 10.82 0.00 775.43 150.78 1403.53
2010 0.00 0.00 316.65 96.78 0.00 571.38 118.86 1103.67
2011 0.00 0.00 412.98 67.81 0.00 408.63 199.48 1088.90
2012 0.00 0.00 668.29 371.80 0.00 179.20 224.66 1443.96
2013 0.00 0.00 458.32 182.31 1.00 771.13 255.31 1668.07
2014 0.00 1.93 688.93 58.09 0.00 752.37 225.41 1726.74
2015 0.00 190.05 394.33 170.04 0.00 573.03 194.48 1521.94
YEAR WM1 WM2 WM3 WM4 WM5 WM6 WM7 WM9 WM10 WM11 WM TOTAL
1996 28.63 457.39 486.51 463.71 245.36 430.29 602.51 314.35 3028.75
1997 115.27 390.70 495.13 290.96 194.60 567.41 315.24 379.96 227.40 2976.67
1998 0.00 88.57 95.38 104.93 207.12 320.02 678.50 161.85 63.31 1719.68
1999 221.36 146.78 514.07 322.69 331.32 438.02 702.74 348.84 279.91 3305.74
2000 334.13 302.45 681.80 325.58 445.31 652.10 556.21 343.03 424.93 4065.55
2001 244.91 429.25 871.26 336.01 215.24 575.46 280.11 176.54 383.61 310.45 3822.85
2002 331.14 312.54 884.15 471.44 272.88 474.09 684.49 469.81 374.98 510.15 4785.68
2003 166.44 149.31 149.31 190.62 45.90 300.88 878.31 988.85 432.37 453.81 3755.77
2004 217.82 171.02 899.52 334.47 119.31 383.31 505.89 356.83 349.89 241.72 3579.76
2005 86.37 33.41 361.71 238.75 62.31 151.66 367.41 433.39 74.13 50.42 1859.56
2006 201.01 248.30 438.80 76.87 171.61 393.35 227.17 386.66 242.54 114.47 2500.78
2007 96.46 362.98 875.46 318.94 191.93 349.49 521.92 460.48 348.87 420.94 3947.46
2008 3.67 143.15 459.22 105.12 26.97 189.86 465.84 351.57 42.94 492.67 2281.00
2009 9.82 9.97 307.21 21.65 4.96 379.07 452.38 371.24 5.49 60.30 1622.07
2010 1.16 38.20 239.68 7.46 1.56 156.51 356.75 406.25 36.09 36.09 1279.75
2011 13.81 8.91 368.74 21.32 9.13 201.26 546.83 216.56 0.00 122.08 1508.64
2012 0.00 90.60 926.40 25.45 139.37 443.62 448.62 341.14 106.94 462.79 2984.92
2013 0.00 56.56 520.08 95.42 35.97 486.61 836.97 288.68 104.99 279.52 2704.82
2014 0.00 160.47 522.23 117.38 98.02 310.85 365.93 423.45 68.74 507.32 2574.40
2015 0.00 181.40 287.61 34.12 64.39 477.43 276.13 369.12 54.96 335.50 2080.67
YEAR AF YEAR AF YEAR AF YEAR AF YEAR AF YEAR AF
1996 6765.64 2000 6653.90 2004 4121.18 2008 5275.46 2012 7449.32
1997 6402.31 2001 8491.51 2005 4311.18 2009 4363.80 2013 6991.06
1998 4370.83 2002 4001.20 2006 6856.88 2010 3955.28 2014 7290.69
1999 6653.90 2003 3953.89 2007 8504.43 2011 4832.56 2015 5964.19
TOTAL ALL SOURCES (ACRE-FEET)
28
Annual Report May 10, 2016
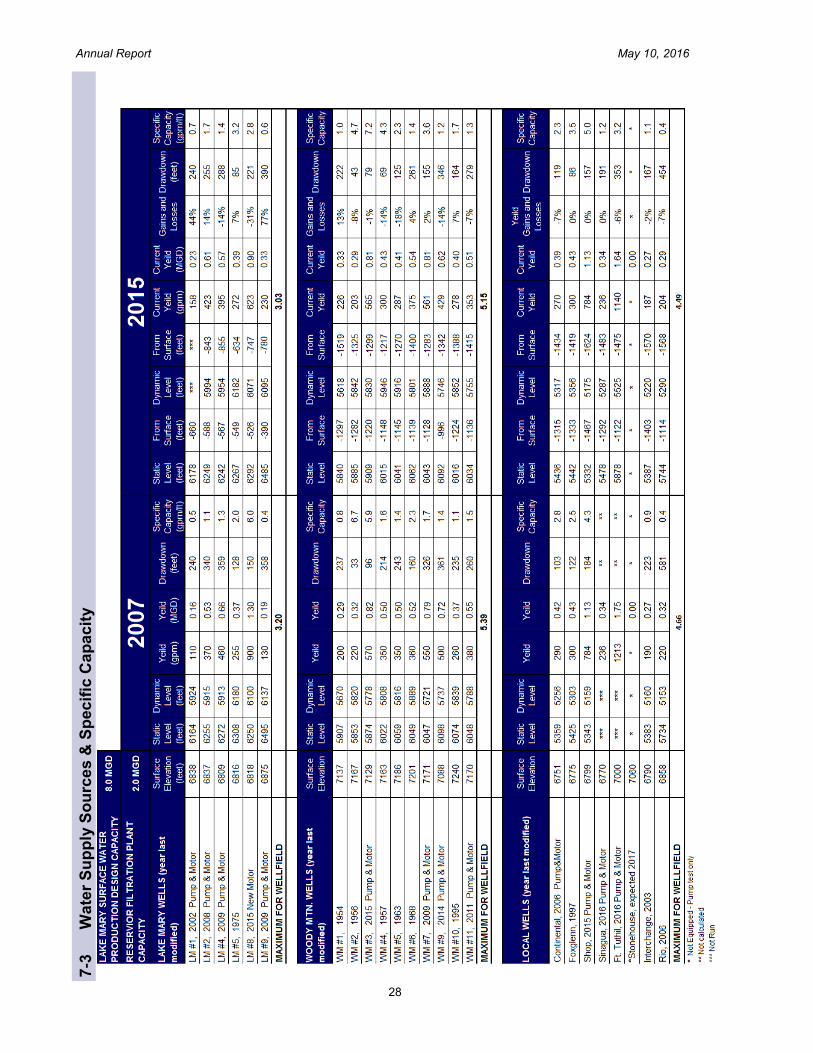
7-3
W
ate
r S
up
ply
So
urc
es
& S
pec
ific
Ca
pa
cit
y

29
Annual Report May 10, 2016
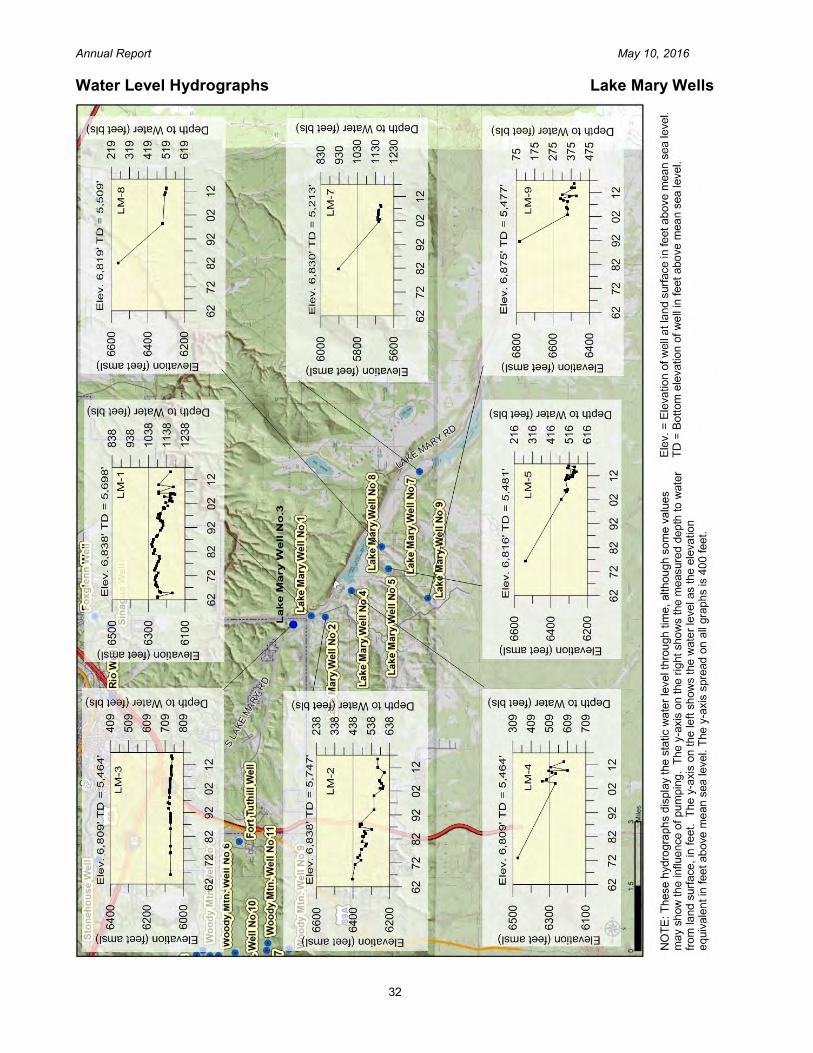
7-4 Water Level Hydrographs Woody Mountain Wells

30
Annual Report May 10, 2016
Water Level Hydrographs Local Wells East

31
Annual Report May 10, 2016
Water Level Hydrographs Local Wells West
32
Annual Report May 10, 2016
Water Level Hydrographs Lake Mary Wells

33
Annual Report May 10, 2016
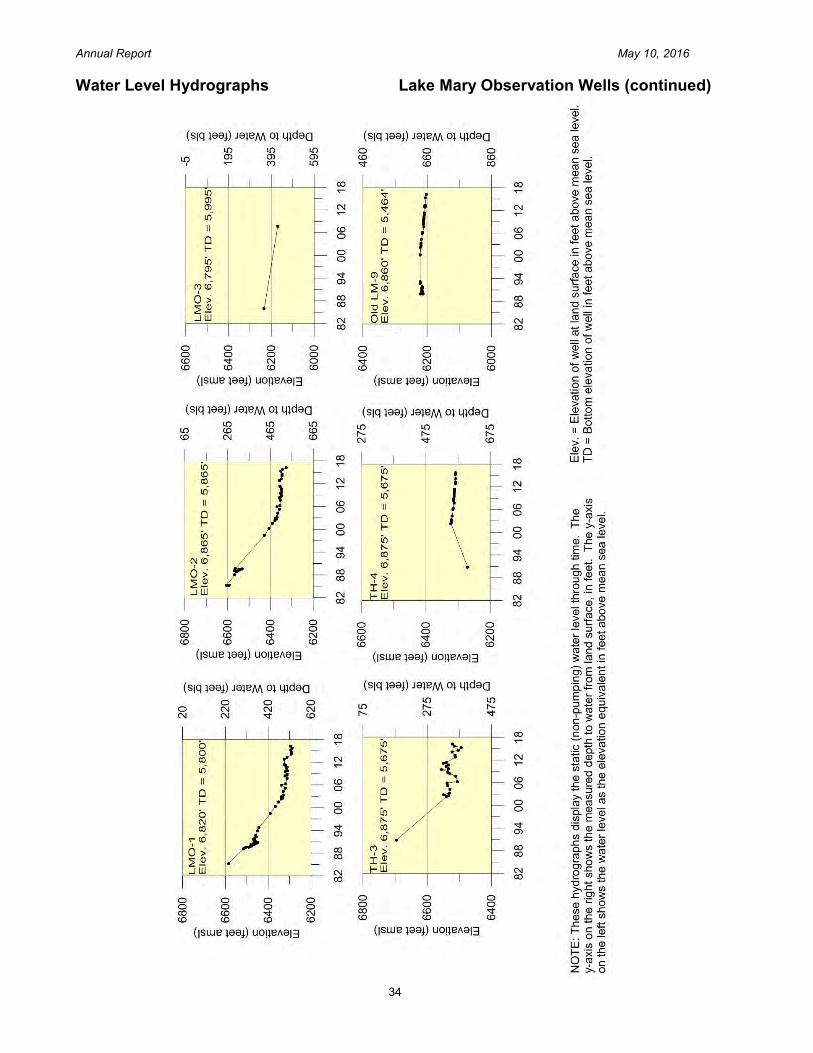
Water Level Hydrographs Lake Mary Observation Wells
34
Annual Report May 10, 2016
Water Level Hydrographs Lake Mary Observation Wells (continued)
35
Annual Report May 10, 2016
UPPER LAKE MARY 8
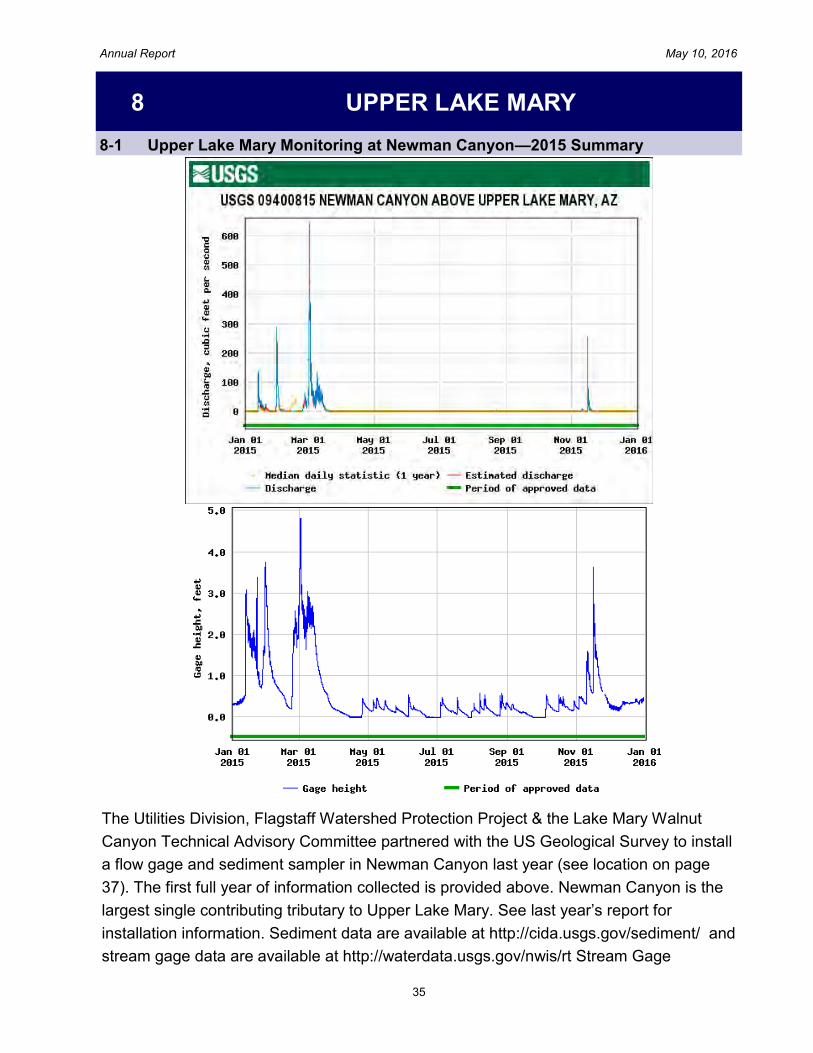
8-1 Upper Lake Mary Monitoring at Newman Canyon—2015 Summary
The Utilities Division, Flagstaff Watershed Protection Project & the Lake Mary Walnut
Canyon Technical Advisory Committee partnered with the US Geological Survey to install
a flow gage and sediment sampler in Newman Canyon last year (see location on page
37). The first full year of information collected is provided above. Newman Canyon is the
largest single contributing tributary to Upper Lake Mary. See last year’s report for
installation information. Sediment data are available at http://cida.usgs.gov/sediment/ and
stream gage data are available at http://waterdata.usgs.gov/nwis/rt Stream Gage
36
Annual Report May 10, 2016
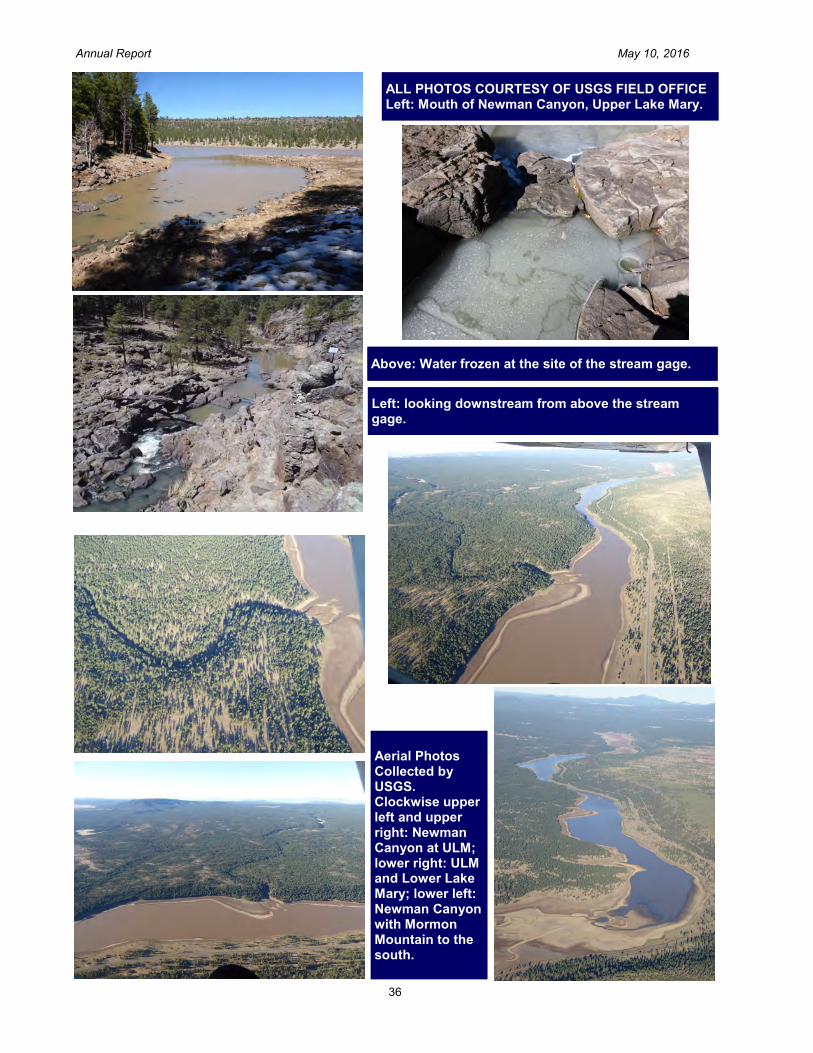
ALL PHOTOS COURTESY OF USGS FIELD OFFICE Left: Mouth of Newman Canyon, Upper Lake Mary.
Above: Water frozen at the site of the stream gage.
Left: looking downstream from above the stream gage.
Aerial Photos Collected by USGS. Clockwise upper left and upper right: Newman Canyon at ULM; lower right: ULM and Lower Lake Mary; lower left: Newman Canyon with Mormon Mountain to the south.
37
Annual Report May 10, 2016
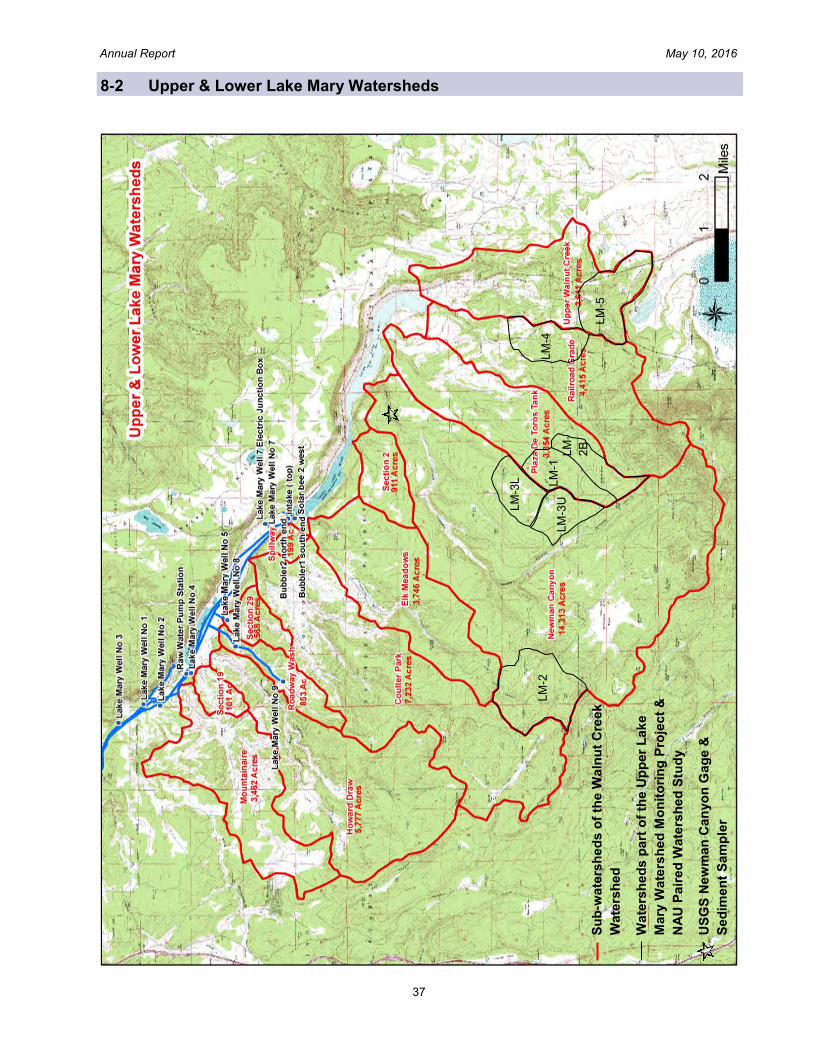
8-2 Upper & Lower Lake Mary Watersheds
LM
-4
LM
-3U
LM
-1 L
M-
2B
LM
-2
LM
-5
LM
-3L
Su
b-w
ate
rsh
ed
s o
f th
e W
aln
ut
Cre
ek
Wate
rsh
ed
Wate
rsh
ed
s p
art
of
the U
pp
er
Lak
e
Mary
Wate
rsh
ed
Mo
nit
ori
ng
Pro
ject
&
NA
U P
air
ed
Wate
rsh
ed
Stu
dy
US
GS
New
man
Can
yo
n G
ag
e &
Sed
imen
t S
am
ple
r

38
Annual Report May 10, 2016
UPPER LAKE MARY 8
In 2015 the Utilities Division partnered with the Salt River Project to provide ongoing
operations and maintenance and data collection for the six (6) FlowtographyTM
sites within
the 4FRI (Four Forests Restoration Initiative) area of the Upper Lake Mary Watershed
(see map on page xx). Flowtography consists of a game camera mounted in a tree that
takes one photo every 15 minutes of a graduated rebar stake in the center of a channel.
The channel has been surveyed for slope, cross-sectional area, and roughness such that
flow can be calculated using Manning’s equation. The height of water on the stream gage
is recorded off of photographs taken during flow events. The flow record will be used as
baseline data to compare with flow data collected after forest treatments. These data will
help to answer the question of how or if forest treatment and maintenance effects surface
water runoff into Upper Lake Mary. The six sites were installed in November 2014. One
additional site is scheduled to be installed at the Newman Canyon USGS gage site and
one at Upper Lake Mary to monitor water levels.
The image below was taken March 2, 2015 at LM-4 (see page xx for location. This date corresponds with the significant flow event recorded at the Newman Canyon Gage., although this site is not within the Newman Canyon drainage.
8-3 Upper Lake Mary Monitoring - Flowtography
Graduated rebar stake
in center of channel.
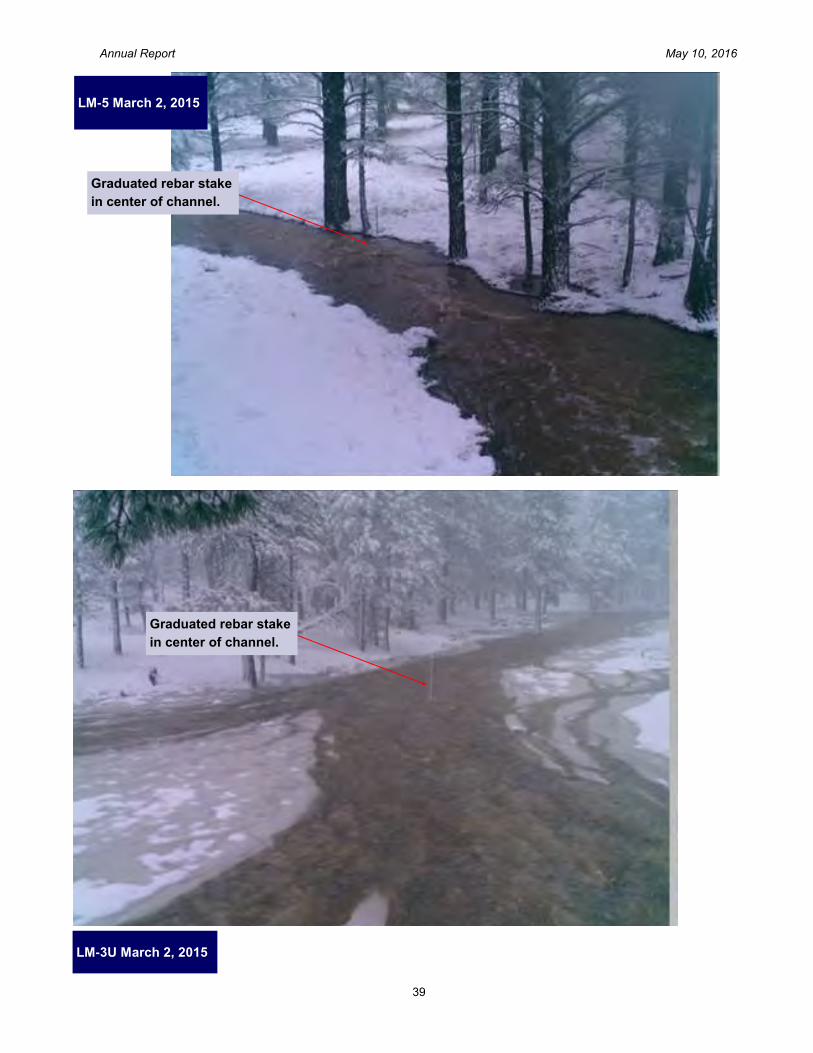
39
Annual Report May 10, 2016
LM-5 March 2, 2015
LM-3U March 2, 2015
Graduated rebar stake
in center of channel.
Graduated rebar stake
in center of channel.
40
Annual Report May 10, 2016
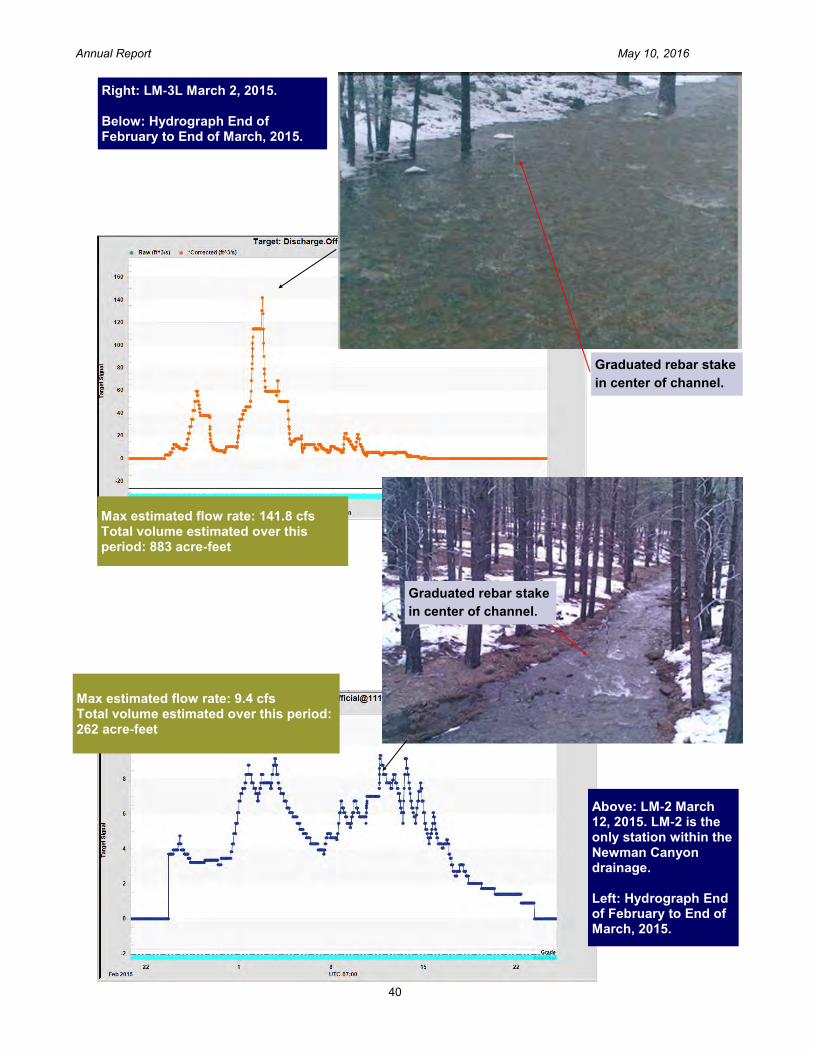
Above: LM-2 March 12, 2015. LM-2 is the only station within the Newman Canyon drainage. Left: Hydrograph End of February to End of March, 2015.
Right: LM-3L March 2, 2015. Below: Hydrograph End of February to End of March, 2015.
Graduated rebar stake
in center of channel.
Graduated rebar stake
in center of channel.
Max estimated flow rate: 141.8 cfs Total volume estimated over this period: 883 acre-feet
Max estimated flow rate: 9.4 cfs Total volume estimated over this period: 262 acre-feet
41
Annual Report May 10, 2016
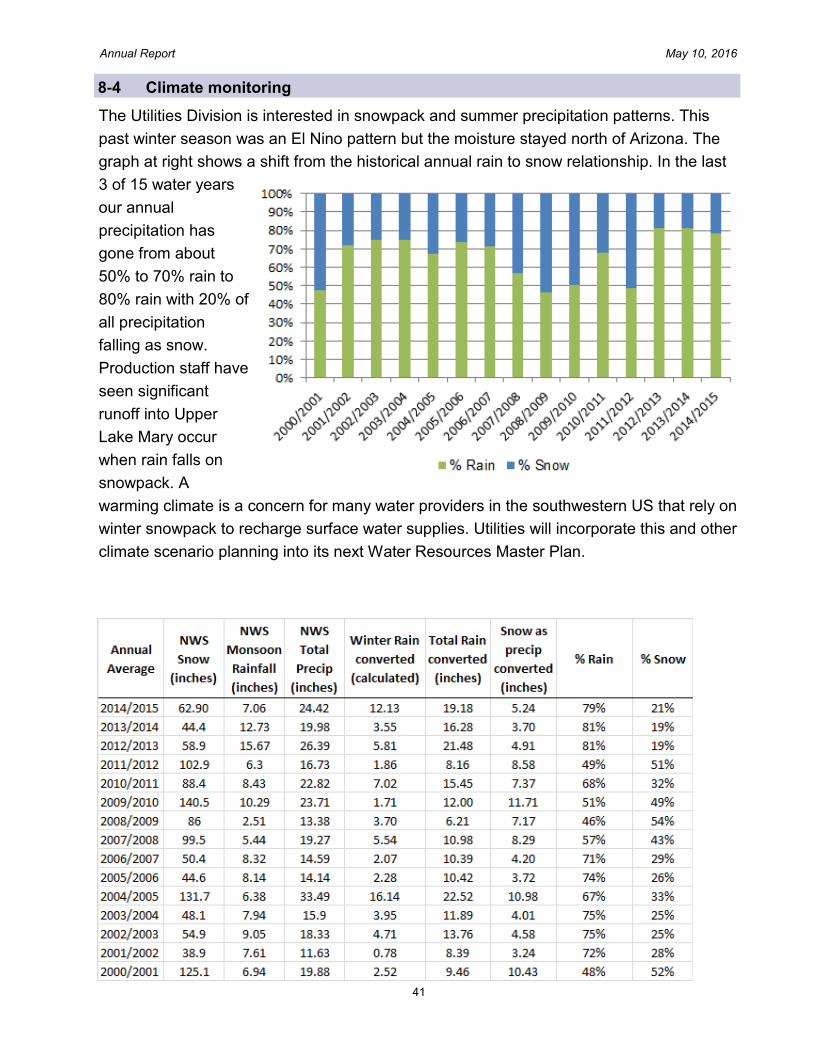
8-4 Climate monitoring
The Utilities Division is interested in snowpack and summer precipitation patterns. This
past winter season was an El Nino pattern but the moisture stayed north of Arizona. The
graph at right shows a shift from the historical annual rain to snow relationship. In the last
3 of 15 water years
our annual
precipitation has
gone from about
50% to 70% rain to
80% rain with 20% of
all precipitation
falling as snow.
Production staff have
seen significant
runoff into Upper
Lake Mary occur
when rain falls on
snowpack. A
warming climate is a concern for many water providers in the southwestern US that rely on
winter snowpack to recharge surface water supplies. Utilities will incorporate this and other
climate scenario planning into its next Water Resources Master Plan.
42
Annual Report May 10, 2016
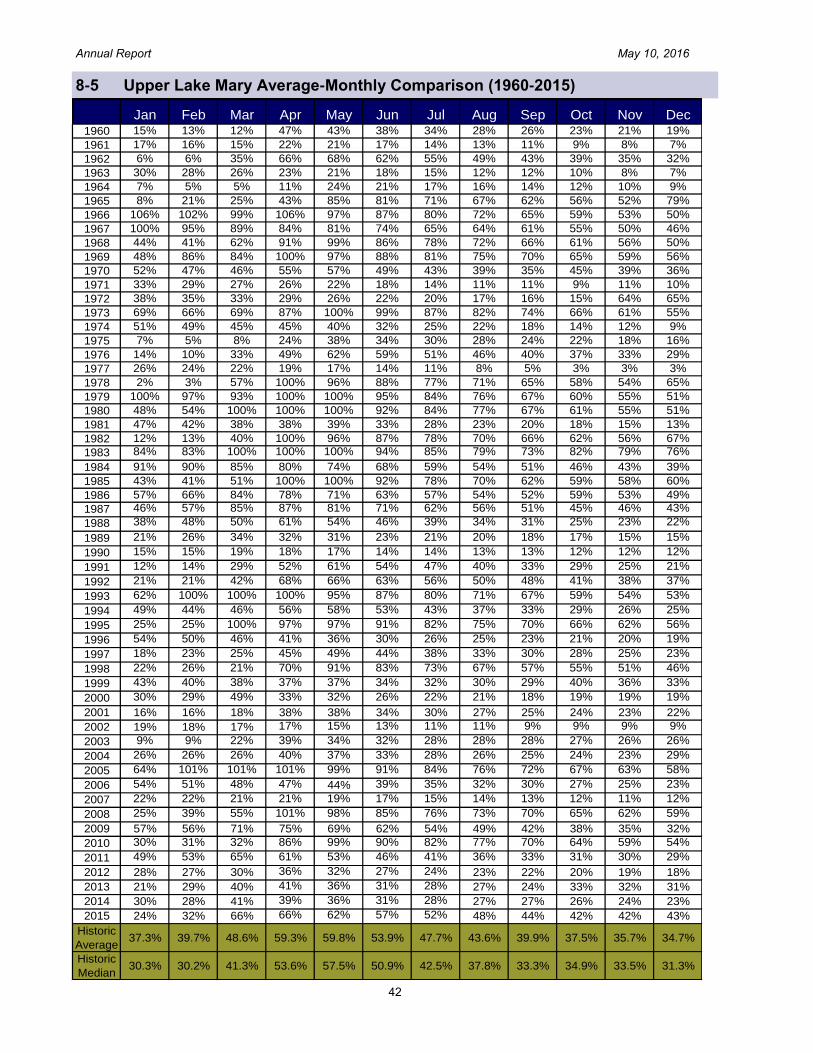
8-5 Upper Lake Mary Average-Monthly Comparison (1960-2015)
Jan Feb Mar Apr May Jun Jul Aug Sep Oct Nov Dec1960 15% 13% 12% 47% 43% 38% 34% 28% 26% 23% 21% 19%
1961 17% 16% 15% 22% 21% 17% 14% 13% 11% 9% 8% 7%
1962 6% 6% 35% 66% 68% 62% 55% 49% 43% 39% 35% 32%
1963 30% 28% 26% 23% 21% 18% 15% 12% 12% 10% 8% 7%
1964 7% 5% 5% 11% 24% 21% 17% 16% 14% 12% 10% 9%
1965 8% 21% 25% 43% 85% 81% 71% 67% 62% 56% 52% 79%
1966 106% 102% 99% 106% 97% 87% 80% 72% 65% 59% 53% 50%
1967 100% 95% 89% 84% 81% 74% 65% 64% 61% 55% 50% 46%
1968 44% 41% 62% 91% 99% 86% 78% 72% 66% 61% 56% 50%
1969 48% 86% 84% 100% 97% 88% 81% 75% 70% 65% 59% 56%
1970 52% 47% 46% 55% 57% 49% 43% 39% 35% 45% 39% 36%
1971 33% 29% 27% 26% 22% 18% 14% 11% 11% 9% 11% 10%
1972 38% 35% 33% 29% 26% 22% 20% 17% 16% 15% 64% 65%
1973 69% 66% 69% 87% 100% 99% 87% 82% 74% 66% 61% 55%
1974 51% 49% 45% 45% 40% 32% 25% 22% 18% 14% 12% 9%
1975 7% 5% 8% 24% 38% 34% 30% 28% 24% 22% 18% 16%
1976 14% 10% 33% 49% 62% 59% 51% 46% 40% 37% 33% 29%
1977 26% 24% 22% 19% 17% 14% 11% 8% 5% 3% 3% 3%
1978 2% 3% 57% 100% 96% 88% 77% 71% 65% 58% 54% 65%
1979 100% 97% 93% 100% 100% 95% 84% 76% 67% 60% 55% 51%
1980 48% 54% 100% 100% 100% 92% 84% 77% 67% 61% 55% 51%
1981 47% 42% 38% 38% 39% 33% 28% 23% 20% 18% 15% 13%
1982 12% 13% 40% 100% 96% 87% 78% 70% 66% 62% 56% 67%
1983 84% 83% 100% 100% 100% 94% 85% 79% 73% 82% 79% 76%
1984 91% 90% 85% 80% 74% 68% 59% 54% 51% 46% 43% 39%
1985 43% 41% 51% 100% 100% 92% 78% 70% 62% 59% 58% 60%
1986 57% 66% 84% 78% 71% 63% 57% 54% 52% 59% 53% 49%
1987 46% 57% 85% 87% 81% 71% 62% 56% 51% 45% 46% 43%
1988 38% 48% 50% 61% 54% 46% 39% 34% 31% 25% 23% 22%
1989 21% 26% 34% 32% 31% 23% 21% 20% 18% 17% 15% 15%
1990 15% 15% 19% 18% 17% 14% 14% 13% 13% 12% 12% 12%
1991 12% 14% 29% 52% 61% 54% 47% 40% 33% 29% 25% 21%
1992 21% 21% 42% 68% 66% 63% 56% 50% 48% 41% 38% 37%
1993 62% 100% 100% 100% 95% 87% 80% 71% 67% 59% 54% 53%
1994 49% 44% 46% 56% 58% 53% 43% 37% 33% 29% 26% 25%
1995 25% 25% 100% 97% 97% 91% 82% 75% 70% 66% 62% 56%
1996 54% 50% 46% 41% 36% 30% 26% 25% 23% 21% 20% 19%
1997 18% 23% 25% 45% 49% 44% 38% 33% 30% 28% 25% 23%
1998 22% 26% 21% 70% 91% 83% 73% 67% 57% 55% 51% 46%
1999 43% 40% 38% 37% 37% 34% 32% 30% 29% 40% 36% 33%
2000 30% 29% 49% 33% 32% 26% 22% 21% 18% 19% 19% 19%
2001 16% 16% 18% 38% 38% 34% 30% 27% 25% 24% 23% 22%
2002 19% 18% 17% 17% 15% 13% 11% 11% 9% 9% 9% 9%
2003 9% 9% 22% 39% 34% 32% 28% 28% 28% 27% 26% 26%
2004 26% 26% 26% 40% 37% 33% 28% 26% 25% 24% 23% 29%
2005 64% 101% 101% 101% 99% 91% 84% 76% 72% 67% 63% 58%
2006 54% 51% 48% 47% 44% 39% 35% 32% 30% 27% 25% 23%
2007 22% 22% 21% 21% 19% 17% 15% 14% 13% 12% 11% 12%
2008 25% 39% 55% 101% 98% 85% 76% 73% 70% 65% 62% 59%
2009 57% 56% 71% 75% 69% 62% 54% 49% 42% 38% 35% 32%
2010 30% 31% 32% 86% 99% 90% 82% 77% 70% 64% 59% 54%
2011 49% 53% 65% 61% 53% 46% 41% 36% 33% 31% 30% 29%
2012 28% 27% 30% 36% 32% 27% 24% 23% 22% 20% 19% 18%
2013 21% 29% 40% 41% 36% 31% 28% 27% 24% 33% 32% 31%
2014 30% 28% 41% 39% 36% 31% 28% 27% 27% 26% 24% 23%
2015 24% 32% 66% 66% 62% 57% 52% 48% 44% 42% 42% 43%
Historic
Average37.3% 39.7% 48.6% 59.3% 59.8% 53.9% 47.7% 43.6% 39.9% 37.5% 35.7% 34.7%
Historic
Median30.3% 30.2% 41.3% 53.6% 57.5% 50.9% 42.5% 37.8% 33.3% 34.9% 33.5% 31.3%

43
Annual Report May 10, 2016
8-5 Upper Lake Mary Inflow Report & Predicted Water Budget (1949-2015)
44
Annual Report May 10, 2016
The City recognizes water conservation as an important component
of the overall Utilities water management program. In April, 2016,
City Council suggested the program should be more robust and
added one tenth of a percent of the increased water rate go to the
water conservation program.
At the same time, staff understands that water conservation has
been an important proactive response to temper peak demand,
infrastructure costs to develop new groundwater wells, surface
water supply variability and climate change. In the last 25 to 30
years Flagstaff has seen an incredible reduction in water use and
production. While this is a similar trend across the southwestern US,
some of the success can be attributed to a national shift in water
awareness starting in about 1990. These shared trends are attributed to reducing indoor
demand through improved technology and plumbing code changes. In Flagstaff, local
impacts of conservation have further reduced water use, which is attributed to
accomplishments through rate structure and rate adjustments, incentives through rebates,
water education, leak reduction and behavior change (all elements of the City’s
conservation program). Staff recognize there is still room for more water savings, which
will further improve system reliability, resilience to surface water supply variability, and
postpone the need to add to our infrastructure system or to develop additional costly water
supplies. Reducing outdoor demand through improved irrigation efficiency and landscape
transformation (key elements of the City’s conservation program) improves reliability
during summer months when demand peaks, providing additional water availability for
storage.
Faced with a drought in 2002, the Utilities created a full-time position, eventually
expanding to 2 full time staff and 2 temporary staff, dedicated to water conservation. The
program was cut during the recession in 2009 and 2010 and has been full time only since
2014. Two water conservation enforcement staff were added as an on-going budget item
for FY14 and the entire budget was built back up to pre-downturn numbers. Plans to
develop a new document for the conservation program began with Council’s adoption of
the 2014 Water Policies. The Water Conservation Plan will provide Flagstaff’s water
conservation program history, local and industry best practices, and recommendations
with cost estimates for program expansion.
We have brought dialogue to the Water Commission on the topic of how low can we go
and I with the objective to set goals that align with Council’s, the policies adopted in the
2014 Water Policies document, and those in the Flagstaff Regional Plan 2030. Staff have
WATER CONSERVATION 9
9-1 Program Overview

45
Annual Report May 10, 2016
For most of the last 22 years (exception is the three years the Water Conservation
Program went unfunded), the City of Flagstaff has offered High Efficiency Toilet (HET)
Rebates. In FY15/16, Utilities issued just under 300 toilet rebates, 7 turf rebates and 4 rain
water harvesting barrels for a total of $22,500. A rebate of $100/HET was given for toilets
using 1.3 gallons per flush or less and a minimum rebate of $500 was given for removing
a minimum of 1500 square feet of turf.
9-2 Financial Rebates Summary
provided a series of presentations to provide historical program information, a discussion
of metrics commonly used in the industry, ideas for a more robust program and what could
be achieved, as well as quality of life and what other cities have accomplished. We will set
goals for the program that we feel are realistic and achievable reductions for all customer
sectors in Flagstaff.
7

46
Annual Report May 10, 2016
The City of Flagstaff Water Conservation
Program once again partnered with Arizona
Project WET (Water Education for
Teachers) on hosting the popular water
festival on September 17, 2015, at
Foxglenn Park. A total of 735 fourth grade
students from several Flagstaff schools
participated in the event. Students used
interactive models to discuss watersheds,
the water cycle, groundwater flow and
water conservation. The event was
sponsored by the City of Flagstaff Water
Conservation Program, SCA and AZ
Project Wet.
This event was made a great success with
volunteers from the City of Flagstaff,
Northern Arizona University, SCA and
Willow Bend Environmental Center. This
event educates children about our most
precious resource. Volunteers and staff
were rewarded with delicious food donated
by Fratelli Pizza.
2005 2006 2007 2008 2012 2013 2014 2015
Schools 17 17 15 17 10 11 ND
4th Grade Classes 37 39 36 38 22 26 ND
4th Grade Students 887 932 862 923 538 667 1,080 735
Teachers 40 40 36 42 47 28 39 28
Teacher Training Hours 80 272 2281 111 1902 7 ND
Parent Volunteers 30 90 35 80 0 65 156 68
Festival Volunteers 148 59 59 68 40 37 60+
9-3 Water Festival Summary
ND = no data
1. Includes a Project WET 6 hour workshop for 17 NAU student teachers-in-training, participating as instructors at the Water Festival
and Project WET 6 hour workshop for 21 FUSD teachers.
2. Includes a Project WET 2 hour workshop for 23 NAU student teachers-in-training,
participating as instructors at the Water Festival and Project WET 6 hour workshop for
24 FUSD teachers.
Photo
credit:
Kim Ott

47
Annual Report May 10, 2016
9-3 System Leak Detection Results Phases I & II (FY14 & FY15)
In 2015, an estimated 2.4% of lost and unaccounted for water was attributed to distribution
system leaks as determined through two phases of a contracted leak detection survey.
Water Distribution crews fixed the majority of leaks identified along the 206 miles of
surveyed pipe, valves, and hydrants. A small volume (<0.1%) of water was documented
by staff as system flushing.
City staff Lee
Williams &
Ryan Kesti
teaching the
groundwater &
Aquifers unit.
Photo credit:
Kim Ott
48
Annual Report May 10, 2016
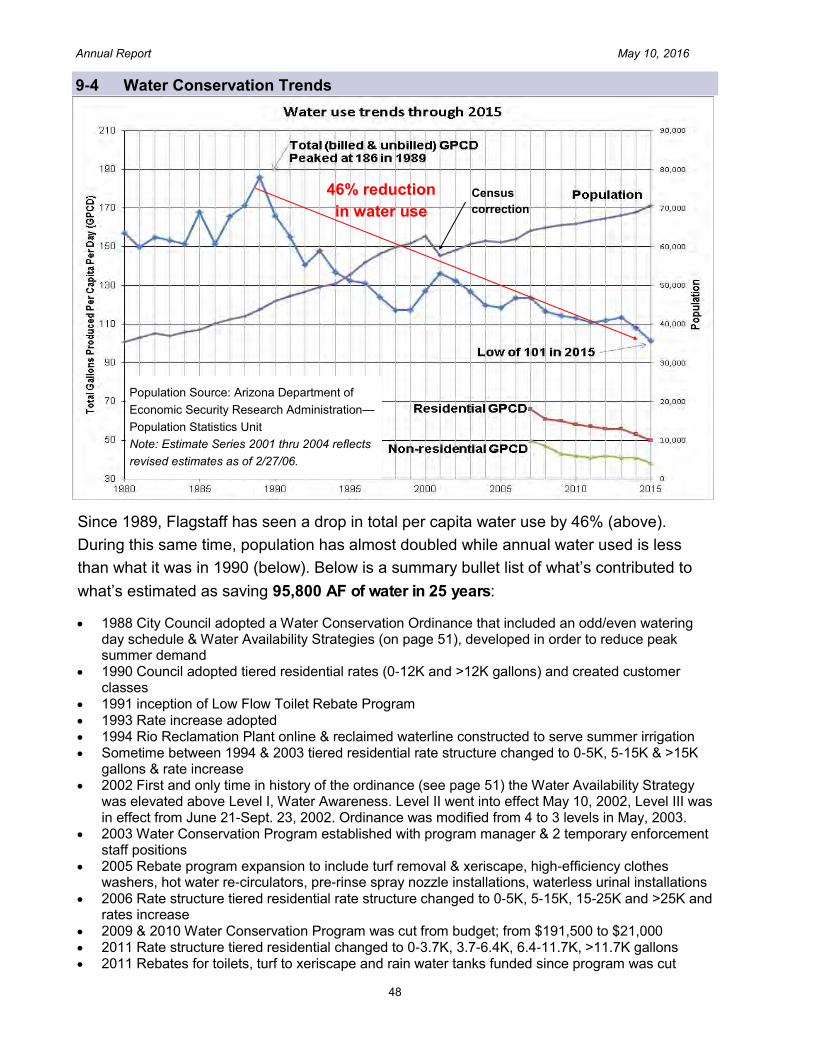
Since 1989, Flagstaff has seen a drop in total per capita water use by 46% (above).
During this same time, population has almost doubled while annual water used is less
than what it was in 1990 (below). Below is a summary bullet list of what’s contributed to
what’s estimated as saving 95,800 AF of water in 25 years:
1988 City Council adopted a Water Conservation Ordinance that included an odd/even watering day schedule & Water Availability Strategies (on page 51), developed in order to reduce peak summer demand
1990 Council adopted tiered residential rates (0-12K and >12K gallons) and created customer classes
1991 inception of Low Flow Toilet Rebate Program 1993 Rate increase adopted 1994 Rio Reclamation Plant online & reclaimed waterline constructed to serve summer irrigation Sometime between 1994 & 2003 tiered residential rate structure changed to 0-5K, 5-15K & >15K
gallons & rate increase 2002 First and only time in history of the ordinance (see page 51) the Water Availability Strategy
was elevated above Level I, Water Awareness. Level II went into effect May 10, 2002, Level III was in effect from June 21-Sept. 23, 2002. Ordinance was modified from 4 to 3 levels in May, 2003.
2003 Water Conservation Program established with program manager & 2 temporary enforcement staff positions
2005 Rebate program expansion to include turf removal & xeriscape, high-efficiency clothes washers, hot water re-circulators, pre-rinse spray nozzle installations, waterless urinal installations
2006 Rate structure tiered residential rate structure changed to 0-5K, 5-15K, 15-25K and >25K and rates increase
2009 & 2010 Water Conservation Program was cut from budget; from $191,500 to $21,000 2011 Rate structure tiered residential changed to 0-3.7K, 3.7-6.4K, 6.4-11.7K, >11.7K gallons 2011 Rebates for toilets, turf to xeriscape and rain water tanks funded since program was cut
Population Source: Arizona Department of
Economic Security Research Administration—
Population Statistics Unit
Note: Estimate Series 2001 thru 2004 reflects
revised estimates as of 2/27/06.
9-4 Water Conservation Trends
46% reduction
in water use
Census
correction
49
Annual Report May 10, 2016
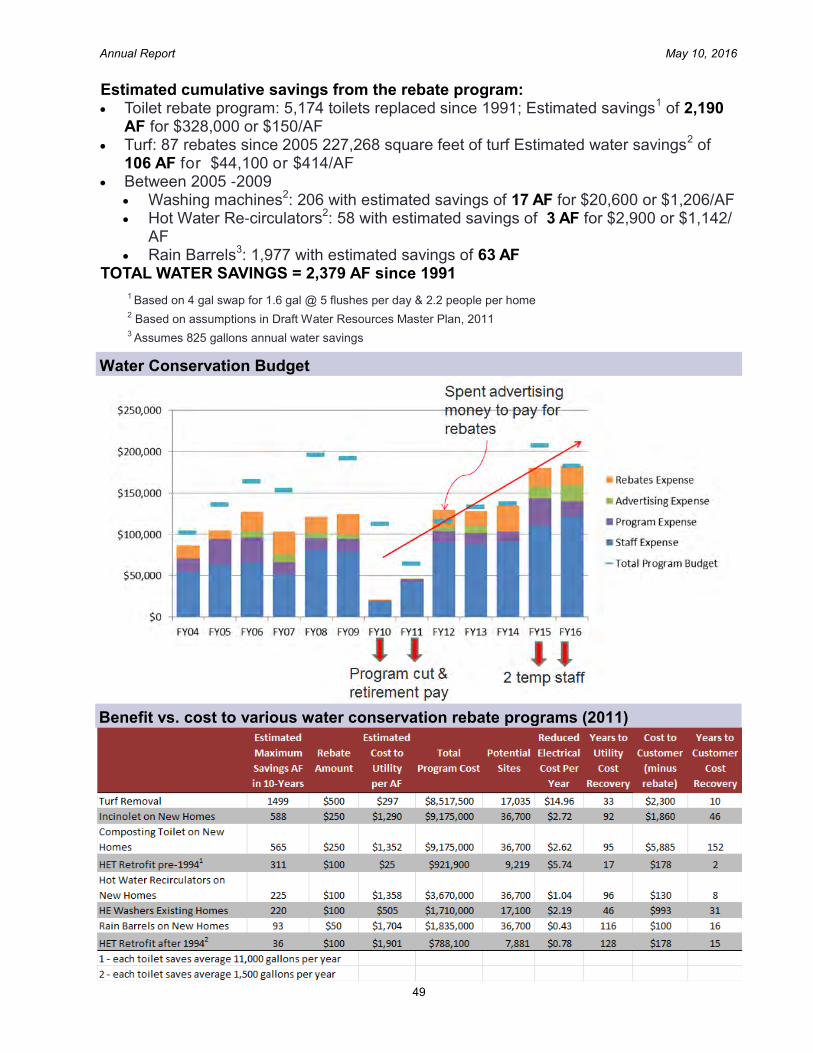
Estimated cumulative savings from the rebate program: Toilet rebate program: 5,174 toilets replaced since 1991; Estimated savings
1 of 2,190
AF for $328,000 or $150/AF Turf: 87 rebates since 2005 227,268 square feet of turf Estimated water savings
2 of
106 AF for $44,100 or $414/AF Between 2005 -2009
Washing machines2: 206 with estimated savings of 17 AF for $20,600 or $1,206/AF
Hot Water Re-circulators2: 58 with estimated savings of 3 AF for $2,900 or $1,142/
AF Rain Barrels
3: 1,977 with estimated savings of 63 AF
TOTAL WATER SAVINGS = 2,379 AF since 1991
1 Based on 4 gal swap for 1.6 gal @ 5 flushes per day & 2.2 people per home 2 Based on assumptions in Draft Water Resources Master Plan, 2011 3 Assumes 825 gallons annual water savings
Water Conservation Budget
Benefit vs. cost to various water conservation rebate programs (2011)

50
Annual Report May 10, 2016
Trends in Water Use: Gallons Per Meter since 2002 with breaks @ rate changes
Rate Structure Changes & Rate Increases
$/1,000 gallons
Prior to
2006 2006 2011
Sin
gle
Fam
ily R
esid
entia
l
0-5K $2.83
5K-15K $3.32
15K+ $4.71
0-5K $3.02
5K-15K $3.54
15K-25K $5.03
>25K $8.77
0-3.7K $3.73
3.7K-6.4K $4.55
6.4K-11.7K
$6.49
11.7K+ $11.06
Mu
lti-fam
ily
Co
mm
erc
ial &
Sch
oo
ls
$2.97 $3.17 Multy Family $4.52
Comm/Schools $4.97

51
Annual Report May 10, 2016
Water Awareness: In effect when water demand is equal to or less than safe production capability.
1. Implements Odd / Even Watering Schedule
2. Prohibits unauthorized use of fire hydrants
3. Prohibits wasting water
4. Prohibits golf courses from irrigating with potable water
5. Provides for New Landscape Permits
Water Emergency: In effect when water demand exceeds safe production capability for five (5) consecutive days.
1. Continue rules established by Strategy I
2. New Landscape Permits not issued
3. Adds vehicle washing to watering schedule (exception for commercial car washes)
4. Prohibits washing buildings and paved areas
5. Prohibits filling fountains, ponds, pools with potable water
6. Prohibits use of potable water for construction activity
7. Implements Drought Rate Structure
Single Family Residential: Water Consumption between 6,401and 11,700
gallons billed at 150% the established rate. Water Consumption in excess of
11,700 gallons billed at 200% the established rate.
Multi-Family, Commercial, Industrial, and Institutional: Billed at 120% the
established rate.
Standpipes: Billed at 130% the established rate. Use limited to 25 mile radius.
Water Crisis: In effect when water demand exceeds total production capability, and the amount of water in storage may impair fire protection for the City.
1. Continue rules established by Strategy I and Strategy II
2. Prohibits all outdoor water use
3. Authorizes additional measure as deemed necessary
9-5 Drought Preparedness—Water Availability Strategies
STRATEGY I
STRATEGY II
STRATEGY III
Safe Production Capability: 90% of total water resources available measured in million gallons per day, based on potable water production and distribution components.
This information falls under City Code 7-03-001-0014 Water Conservation
52
Annual Report May 10, 2016
WATER STORAGE & DISTRIBUTION 10
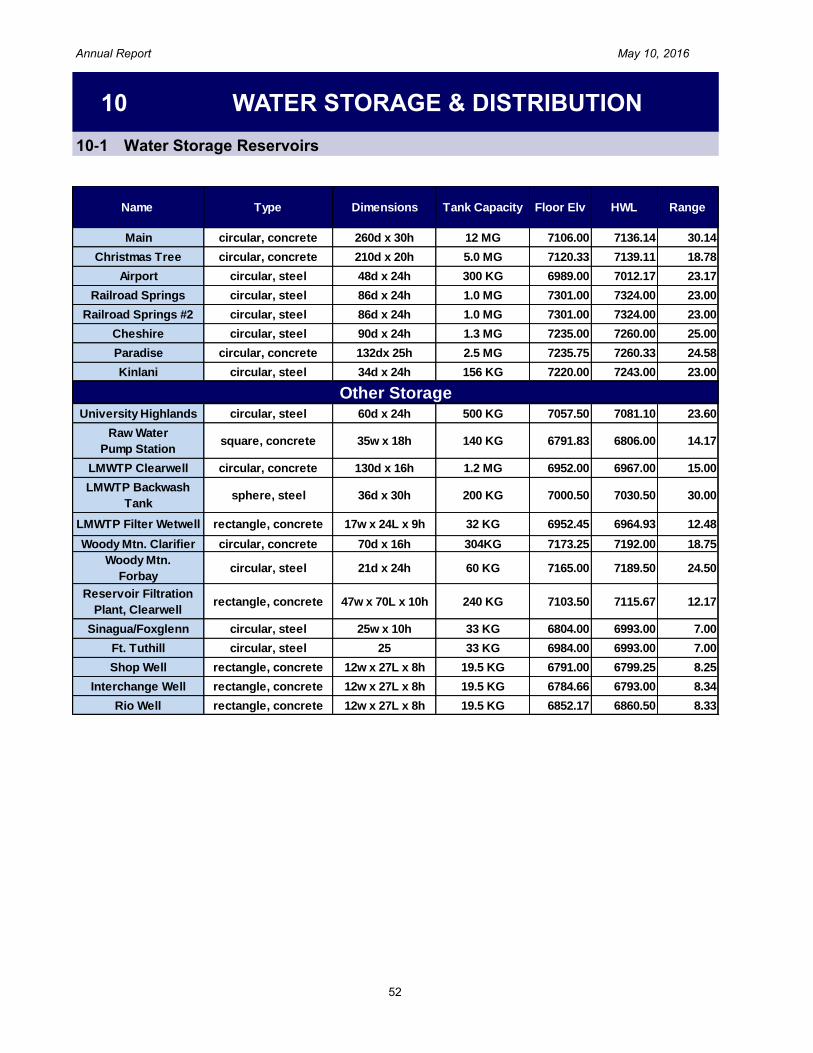
10-1 Water Storage Reservoirs
Name Type Dimensions Tank Capacity Floor Elv HWL Range
Main circular, concrete 260d x 30h 12 MG 7106.00 7136.14 30.14
Christmas Tree circular, concrete 210d x 20h 5.0 MG 7120.33 7139.11 18.78
Airport circular, steel 48d x 24h 300 KG 6989.00 7012.17 23.17
Railroad Springs circular, steel 86d x 24h 1.0 MG 7301.00 7324.00 23.00
Railroad Springs #2 circular, steel 86d x 24h 1.0 MG 7301.00 7324.00 23.00
Cheshire circular, steel 90d x 24h 1.3 MG 7235.00 7260.00 25.00
Paradise circular, concrete 132dx 25h 2.5 MG 7235.75 7260.33 24.58
Kinlani circular, steel 34d x 24h 156 KG 7220.00 7243.00 23.00
University Highlands circular, steel 60d x 24h 500 KG 7057.50 7081.10 23.60
Raw Water
Pump Stationsquare, concrete 35w x 18h 140 KG 6791.83 6806.00 14.17
LMWTP Clearwell circular, concrete 130d x 16h 1.2 MG 6952.00 6967.00 15.00
LMWTP Backwash
Tanksphere, steel 36d x 30h 200 KG 7000.50 7030.50 30.00
LMWTP Filter Wetwell rectangle, concrete 17w x 24L x 9h 32 KG 6952.45 6964.93 12.48
Woody Mtn. Clarifier circular, concrete 70d x 16h 304KG 7173.25 7192.00 18.75
Woody Mtn.
Forbaycircular, steel 21d x 24h 60 KG 7165.00 7189.50 24.50
Reservoir Filtration
Plant, Clearwellrectangle, concrete 47w x 70L x 10h 240 KG 7103.50 7115.67 12.17
Sinagua/Foxglenn circular, steel 25w x 10h 33 KG 6804.00 6993.00 7.00
Ft. Tuthill circular, steel 25 33 KG 6984.00 6993.00 7.00
Shop Well rectangle, concrete 12w x 27L x 8h 19.5 KG 6791.00 6799.25 8.25
Interchange Well rectangle, concrete 12w x 27L x 8h 19.5 KG 6784.66 6793.00 8.34
Rio Well rectangle, concrete 12w x 27L x 8h 19.5 KG 6852.17 6860.50 8.33
Other Storage

53
Annual Report May 10, 2016
10-2 Flagstaff Water Pressure Zones
54
Annual Report May 10, 2016
RECLAIMED WATER 11
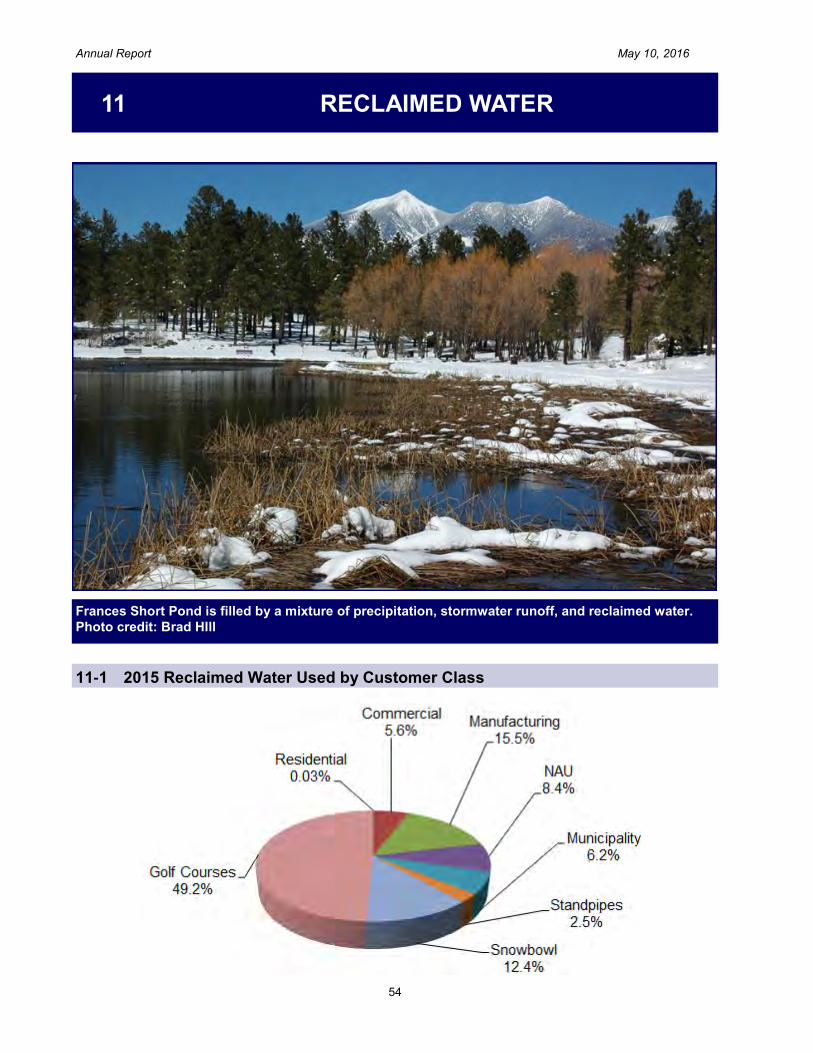
11-1 2015 Reclaimed Water Used by Customer Class
Frances Short Pond is filled by a mixture of precipitation, stormwater runoff, and reclaimed water.
Photo credit: Brad HIll

55
Annual Report May 10, 2016
No
te:
Th
e
se
gm
en
t fr
om
the
pla
nt
to
wh
ere
th
e s
pli
t
oc
cu
rs is
ac
tua
lly t
wo
se
pa
rate
lin
es
,
wh
ich
is
no
t
rep
res
en
ted
at
this
sca
le.
11-2 Reclaimed Water Distribution System
56
Annual Report May 10, 2016
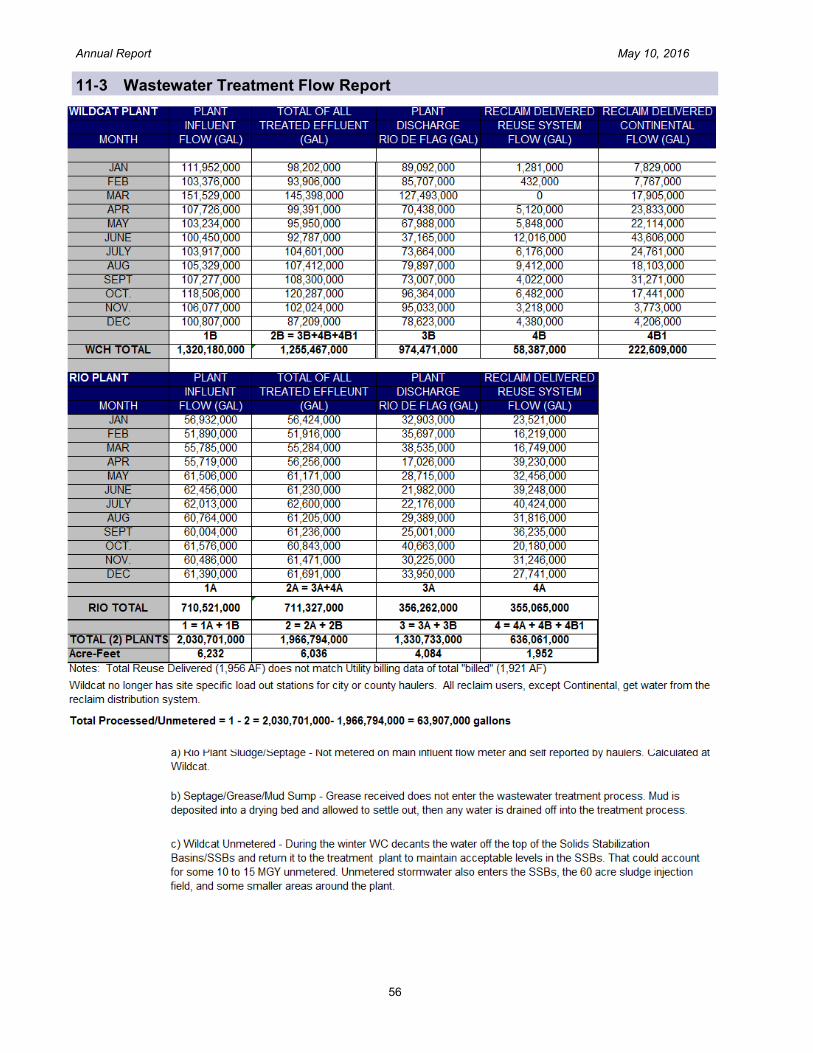
11-3 Wastewater Treatment Flow Report

57
Annual Report May 10, 2016
STORMWATER MANAGEMENT 12
The City’s Stormwater Management
Program includes projects and programs
that address stormwater quantity (flood
control), stormwater quality (AZPDES
Municipal Permit), and watershed
management and restoration.
The Stormwater Section is funded by the
stormwater utility that was established in
2003. Maintenance activities include
updating the database for impervious
surface, creating new accounts and
resolving billing issues.
Stormwater staff have completed a
Geographic Information Systems (GIS)
based inventory of all the surface and
subsurface drainage facilities within the
City, both public and private. A summary of
these facilities is shown below. The City
maintains the majority of the storm drains,
culverts, catch basins and drainage
easements, while most detention basins are
privately owned. Stormwater funds are used
to maintain and improve this system. Funds
are also used for channel maintenance of
the FEMA-mapped floodplains.
Storm Drains 91.3 Miles
Catch Basins 3,912
Manholes (storm drain) 1,100
Detention Basins 556 (142 acres)
Culverts 1,474 (17.7 miles)
Drainage Easements 669 (608 acres)
NPDES Outfalls 287 (requires annual inspection and monitoring)
FEMA-mapped floodplains ~40 miles
Jurisdictional Dams 1 (Clay Avenue Detention Basin)
Stormwater Facilities Within the City of Flagstaff - 2015
12-1 Key Program Summary (descriptions are provided on subsequent pages)
1. GIS maintenance 2. Rain gage and stream gage
network 3. FEMA National Flood Insurance
Program (NFIP) Participation/compliance
4. NPDES (AZPDES) Permit Compliance
5. Stormwater Utility Maintenance 6. Development Review 7. Drainage Master Plan and
Improvement Program 8. Drainage Investigations 9. Low Impact Development and
Rainwater Harvesting Program 10. Capital Improvements 11. Restoration Projects 12. Stormwater Infrastructure
Maintenance Program 13. Public Education 14. 2015 Monsoon Summary 15. Make a Difference Day 2015
58
Annual Report May 10, 2016
City Stormwater staff are responsible for maintaining Stormwater’s Geographic Information Systems (GIS). Stormwater has one full-time intern dedicated to this effort.
Activities during 2015 included: Continued to update GIS with stormwater infrastructure records, additions to
infrastructure from new development, and all surface and subsurface drainage facilities within the City, both public and private.
Staff initiated a GIS-based records management system for selected stormwater infrastructure and drainage investigations, including Low Impact Development facilities, detention basins, and drainage investigations.
1 GIS Maintenance
2 Rain Gauge and Stream Gauge Network
The City participates in the National Flood Insurance Program (NFIP) and manages floodplain development through Floodplain Regulations adopted by the City Council. These regulations reduce flood losses within the city and allow city residents to purchase Flood Insurance and to receive certain types of Federal disaster assistance following a flood. The City also participates in the Community Rating System Program, which recognizes that the City does more to avoid flood losses than just the minimum required to participate in the NFIP and rewards these efforts by providing city residents with a
3 FEMA NFIP Compliance
The Stormwater Section is responsible for maintaining the City of Flagstaff network of precipitation and stream gages. Detailed event records and reports can be generated internally through our Datawise software and web-based monitoring site. Stormwater Section staff is notified when heavy flood producing rains occur through the radio controlled ALERT system. The City is seeking to expand its network over time until adequate coverage is achieved for sufficient flood ALERT notifications. This information is needed for proper stormwater hydrologic and hydraulic modeling calibration efforts to better define floodplains and stormwater infrastructure capacity. Additionally the gage system at Frances Short Pond detects pond level and sends an automated message to responsible staff that maintains specified water elevation.
Activities during 2015 included: Continued maintenance of City rain gauges, stream gages and data management
system Preparation of monthly gage data reports can be provided upon request for City
staff and public requests for information.
Planning and coordination for 6 additional rain/stream gages in the Dry Lake Hills and Observatory Mesa treatment areas included as part of the Flagstaff Watershed Protection Project (FWPP).
Planning and coordination for the relocation of the Newman Canyon gage to Fanning Drive Wash and Linda Vista Drive intersection.
Planning and coordination of a new rain/stream gage at the Clay Avenue Wash Detention Basin Dam.
Planning and coordination of 3 new crest stage gages to be located strategically within the Rio de Flag.
59
Annual Report May 10, 2016
4 NPDES Permit Compliance
discount on flood insurance policies. In late 2013 the City was upgraded to a Class 5 which increased flood insurance premium discounts from 15% to 25%. The City must keep detailed records and prepare an annual report to account for dozens of City and Stormwater Section activities that are required to be monitored and updated each year. These activities must pass in-depth ADWR audits every 5 years, and in-depth FEMA audits every 3 years. Activities during 2015 included:
The City of Flagstaff Stormwater Section maintains a Community Rating System (CRS) Classification improvement of Class 5 following this achievement in 2013. This was an improvement of two rating classification levels.
Flood Zone Determinations Issued: 24 These may include some general floodplain development guidance, base flood elevations, flood maps and property-specific development restrictions
Requests for Information: 30 These may include flood hazard determinations, letters in support of Preferred Risk and Grandfathered Flood Insurance Policies, technical information for surveyors, appraisers, engineers, developers, and realtors. These may involve searching through old reports, construction documents and correspondence. These requests are for information above and beyond Flood Zone Determinations.
New Elevation Certificates: 7 New Floodproofing Certificates: 0 New No-Rise Certifications: 1 Floodplain Use Permits Issued: 20 New Variances Issued: 1. Variances to the Floodplain Regulations are allowed
under some conditions. The City Council is designated as the “Floodplain Board” and makes all final variance decisions. However the Water Commission is asked to provide a preliminary review and subsequent recommendation to council regarding variance requests.
New Letters of Map Amendments (LOMA): 3 (12 buildings removed from floodplain) New Letters of Map Revision (LOMR): 0 Conditional Letters of Map Revision (CLOMR) packages reviewed: 2 Floodplain Violations Investigated: 4. Floodplain violation investigations are
performed by the Stormwater Section and seek to resolve floodplain violations and involve much correspondence with the violators and other stakeholders, agencies and/or City of Flagstaff divisions.
The provisions of the Federal Clean Water Act require the City to comply with the National Pollutant Discharge Elimination System (NPDES) and the non-point source stormwater pollution provisions of the Act. The City received written notification from the Arizona Department of Environmental Quality (ADEQ) that we are in full compliance with our first 5-year permit conditions and is awaiting issuance of a second permit. Permit provisions include six Minimum Control Measures (MCM’s): Public Education & Outreach, Public Participation & Involvement, Illicit Discharge Detection & Elimination, Construction Site Run-off, Post Construction Run-off, and Pollution Prevention & Good Housekeeping

60
Annual Report May 10, 2016
The Stormwater Section is responsible for compliance related to the “Stormwater Management Design Manual” that sets forth design criteria for all development. The Manual contains provisions for hydrology, hydraulics, design criteria, detention and flood mitigation, Low Impact Development and rainwater harvesting requirements. A review of development proposals is also conducted with respect to the Floodplain Regulations. The Stormwater Section will perform floodplain development consultations during the IDS development review process but will also involve multiple meetings, phone calls, emails and investigations of floodplain interpretations with property owners that have difficult circumstances and are going through the residential building permit review process instead of the IDS development review process. These consultations require more effort than flood zone determinations and requests for information. All temporary use permits are reviewed for floodplain regulation applicability as well as necessary erosion control plans to help reduce stormwater pollution, especially in those areas impacted by construction contractor staging areas. Staff is represented on the City’s Internal Divisional Staff (IDS) team and participates in all civil reviews as well as conducts field inspections and permitting activities. Activities during 2015 included:
Reviewed, approved and permitted development proposals.
This effort involves the review of every building permit issued by the City of Flagstaff for impervious surfaces added and secondary review of floodplain regulations applicability. Activities during 2015 included:
Continued database maintenance and establishment of new accounts. Review of all City of Flagstaff issued building permits for impervious surfaces added
and secondary review of floodplain regulations applicability.
5 Stormwater Utility Maintenance
6 Development Review
Activities during 2015 included:
Completion of Stormwater Management Plan demonstrating full compliance. All temporary use permits are reviewed for floodplain regulation applicability as well
as necessary erosion control plans to help reduce stormwater pollution. Administration, monitoring, plan review, inspection and enforcement related to
Arizona’s General Permit for Stormwater Discharges associated with construction activities (Construction General Permit – 2013 CGP)
This includes all construction sites that will disturb one or more acres of land, or will disturb less than one acre, but are part of a common plan that disturbs one acre or more.
Due to new ADEQ requirements the level of service was increased to include all permits required for single family residential construction projects.
All projects that include earth disturbance activities requiring an Erosion Control Plan (ECP).

61
Annual Report May 10, 2016
Reviewed and approved all building permits. Floodplain development consultations. All temporary use permits are reviewed for floodplain regulation and erosion/
pollution control. Additionally Stormwater reviews ALL building permits and demo permits to ensure
compliance.
The Stormwater Section is currently working on two watershed master plan projects: the Bow and Arrow watershed master plan, and the development of a regional hydrologic and hydraulic watershed model. The Bow and Arrow watershed master plan had evolved from a stormwater drainage infrastructure improvement project to a multi-division improvement project involving stormwater, water and sewer facilities, curb and gutter replacement and pavement resurfacing. This project will be managed by the City of Flagstaff Capital Improvements Program, and both Utilities Engineering and Stormwater Sections have transferred design funds to CIP for 100% completion of plans. The City of Flagstaff as a cooperating technical partner with FEMA, received a $200K grant from FEMA, half of which will be used to prepare an integrated Rio de Flag hydrologic and hydraulic model for the purpose of determining flood impacts due to burned watersheds. The second half of the funding will be used to model specific assessments of infrastructure needs given possible geographic changes due to wildfire or other catastrophe. Understanding these impacts represents one of the City of Flagstaff goals identified in the Coconino County Multi-Hazard Mitigation Plan. This model will be owned by the City of Flagstaff and used in a collaborative effort with other agencies such as Coconino County, USFS, USGS, USACE, NRCS, FEMA, and NAU. The model will be using sophisticated hydrologic modeling where highly heterogeneous burned watershed conditions can be appropriately modeled and where storm events can be modeled in both space and time as they are recorded by the National Weather Service. This modeling effort requires a data quality assurance review and any necessary updates to the City of Flagstaff GIS. Data reviewed and updated include soils, vegetation, canopy cover, impervious surfaces, aerial imagery, and contours for the entire Rio de Flag watershed. This model will be refined and improved on an ongoing basis as additional existing data in the City GIS is reviewed and new data is collected. The model will be continuously calibrated using new measured rain and stream gage data from the City of Flagstaff gage network. The model will be used to assess the performance of 20 key culverts that have not recently been reviewed under other master planning efforts that are primarily located near the City boundary that would experience increased flood flows from burned forest conditions in the Dry Lake Hills region. The model is planned to be used in the future for helping to determine regional impacts from new development projects and changes in land development and stormwater mitigation policies.
7 Drainage Master Plan & Improvement Program

62
Annual Report May 10, 2016
8 Drainage Investigations
Stormwater Section staff investigates and responds to drainage concerns received from the public and other City sections throughout the year. These investigations usually include an onsite field visit and a written response to the concerned citizen or City section. Often these complaints coincide with significant rainfall-runoff events. Staff attempts to resolve all complaints by utilizing available resources. Mainly through routine maintenance or small capital construction projects to correct the identified deficiencies found in the drainage infrastructure.
Activities during 2015 included: Staff responded to approximately 25 drainage investigations during 2015.
Stormwater resolved all 25 drainage concerns. These numbers are significantly down from past years. This can be attributed to the reduced storm activity last year during monsoon season. See 2015 Monsoon Summary below for overview.
Activities during 2015 included:
Completion of the Rio de Flag watershed comprehensive hydrologic and hydraulic computer model.
Continued GIS data review and updates for soils, vegetation, canopy cover, impervious surfaces, aerial imagery and contours.
3D rendering of Rio de Flag watershed computer model
9 Low Impact Development (LID) Program and Rainwater Harvesting
LID is the capture of stormwater for reuse and infiltration. New development standards have been adopted by Ordinance that require LID for many new developments. A comprehensive LID guidance manual has been developed to assist designers.
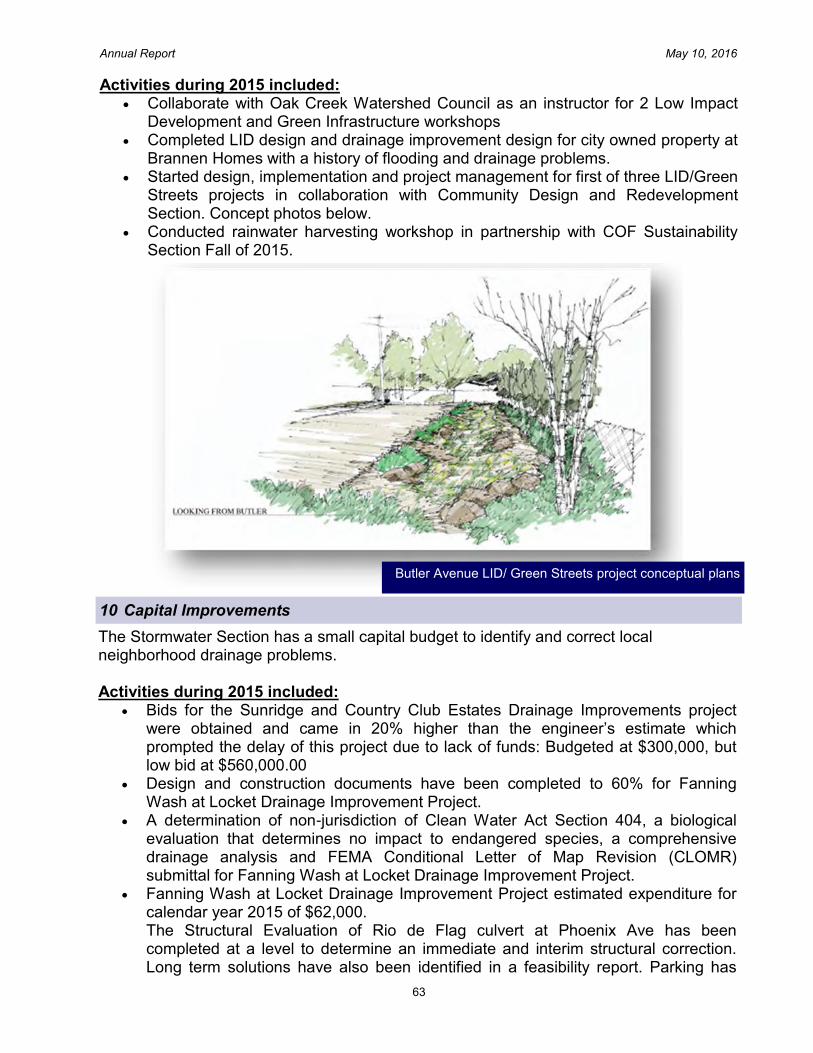
63
Annual Report May 10, 2016
Activities during 2015 included: Collaborate with Oak Creek Watershed Council as an instructor for 2 Low Impact
Development and Green Infrastructure workshops Completed LID design and drainage improvement design for city owned property at
Brannen Homes with a history of flooding and drainage problems. Started design, implementation and project management for first of three LID/Green
Streets projects in collaboration with Community Design and Redevelopment Section. Concept photos below.
Conducted rainwater harvesting workshop in partnership with COF Sustainability Section Fall of 2015.
Butler Avenue LID/ Green Streets project conceptual plans
10 Capital Improvements
The Stormwater Section has a small capital budget to identify and correct local neighborhood drainage problems. Activities during 2015 included:
Bids for the Sunridge and Country Club Estates Drainage Improvements project were obtained and came in 20% higher than the engineer’s estimate which prompted the delay of this project due to lack of funds: Budgeted at $300,000, but low bid at $560,000.00
Design and construction documents have been completed to 60% for Fanning Wash at Locket Drainage Improvement Project.
A determination of non-jurisdiction of Clean Water Act Section 404, a biological evaluation that determines no impact to endangered species, a comprehensive drainage analysis and FEMA Conditional Letter of Map Revision (CLOMR) submittal for Fanning Wash at Locket Drainage Improvement Project.
Fanning Wash at Locket Drainage Improvement Project estimated expenditure for calendar year 2015 of $62,000. The Structural Evaluation of Rio de Flag culvert at Phoenix Ave has been completed at a level to determine an immediate and interim structural correction. Long term solutions have also been identified in a feasibility report. Parking has

64
Annual Report May 10, 2016
been removed on the top of this portion of the structure and monitoring equipment has been installed: $30,000 (estimated expenditure during calendar year 2015)
Completed construction of the Clay Ave / Five Points drainage improvement project. This project included widening and stabilizing the open channel and constructing a connection between Clay Ave. wash and the Rio de Flag on the Southside through an existing concrete culvert under Butler Ave.
Undersized culverts and upstream channel instability in Fanning Wash created flooding at Siler Homes in 2014. Fanning Wash Project will correct this.
Monitoring equipment installed under culvert at Phoenix Ave.
Crews constructing the inlet structure to the con-crete culvert under Butler Ave.
The newly constructed channel sta-bilized with a turf reinforcement mat and native grass seed underneath.

65
Annual Report May 10, 2016
11 Restoration Projects
The Stormwater Section manages the Flagstaff Area Stream Team whose mission is to identify opportunities for restoration maintenance and preservation of streams, wash corridors and open channels within the city limits and take an active role in achieving these goals.
Activities during 2015 included:
Substantial completion of Phase II AZWPF, Arizona Water Protection Fund Grant – Picture Canyon/Rio de Flag restoration reaches 80-100 photo below
Earthwork within the project site and construction of viewshed berm.
Site after monsoon season with revegetation establishing
12 Stormwater Infrastructure Maintenance Program
Stormwater Section manages a stormwater infrastructure maintenance program that includes all public facilities.
Activities during 2015 included:
• Quarterly inspections • Maintenance and Repair • Un-programmed and unbudgeted work also included the following priority

66
Annual Report May 10, 2016
maintenance at Frances Short Pond. • Removal of excess vegetation and sediment • Related trail repair • Dewatering and haul off of removed materials • Project management • Development of Operations and Maintenance
Manual
Frances Short Pond: Areas shown in red labeled A. had surface vegetation removed while maintaining sedges along embank-ment. Areas outlined in blue labeled B. had the subsurface vegetation removed.
Frances Short Pond: Rented excavator with 60 foot reach removing materials
Frances Short Pond: City of Flagstaff Streets Section staff removing and loading vegetation and sediment to dewatering location

67
Annual Report May 10, 2016
Frances Short Pond: Photo of pond three weeks after maintenance project completion. Photo credit Neil Weintraub
13 Public Education
Activities during 2015 included:
Guest Lecturer “Rain Water Harvesting to Master Gardener Class Coconino County Extension
Guest Lecture – Friends of the Rio de Flag Guest Lecturer – NAU Watershed Restoration Class/AregaiTecle Mentor for NAU Engineering Department Capstone Project for Sinclair Wash
Improvement Project National Make a Difference Day 2015 at Frances Short Pond - Flagstaff Area
Stream Team (FAST) Sustainability Section and community stakeholders. Included outreach regarding stormwater quality improvements, rainwater harvesting, and water conservation with native vegetation.
Monsoon Awareness Press Release at the beginning of each monsoon season. Collaborate with Oak Creek Watershed Council as an instructor for 2 Low Impact
Development and Green Infrastructure workshops Completed LID design and drainage improvement design for city owned property at
Brannen Homes with a history of flooding and drainage problems. Provided consultation for internal staff regarding capital improvement projects Started design, implementation and project management for first of three LID/
Green Streets projects in collaboration with Community Design and Redevelopment Section. Concept photos below.
Conducted rainwater harvesting workshop in partnership with COF Sustainability

68
Annual Report May 10, 2016
14 2015 Monsoon Summary
Section Fall of 2015. Stormwater Section Website contains guidance and library of educational
documents to help educate the public for all aspects of its program. The monsoon flooding that occurred in 2015 was less than the flooding in 2014. Monsoon season in 2014 did not result in localized or wide spread flooding throughout the City. The Monsoons that did hit the region for the most part missed the City of Flagstaff and the cells that did impact the local area were not of high enough intensity to result in significant flooding or damage to the existing drainage system.
Average monsoon rainfall = 8.1 inches 2013 total monsoon rainfall = 15.7 inches (tied the Flagstaff record) 2014 total monsoon rainfall = 12.7 inches 2015 total monsoon rainfall = 7.1 inches

69
Annual Report May 10, 2016
15 National Make a Difference Day October 24, 2015

70
Annual Report May 10, 2016
12-2
Flo
od
pla
in M
ap
s
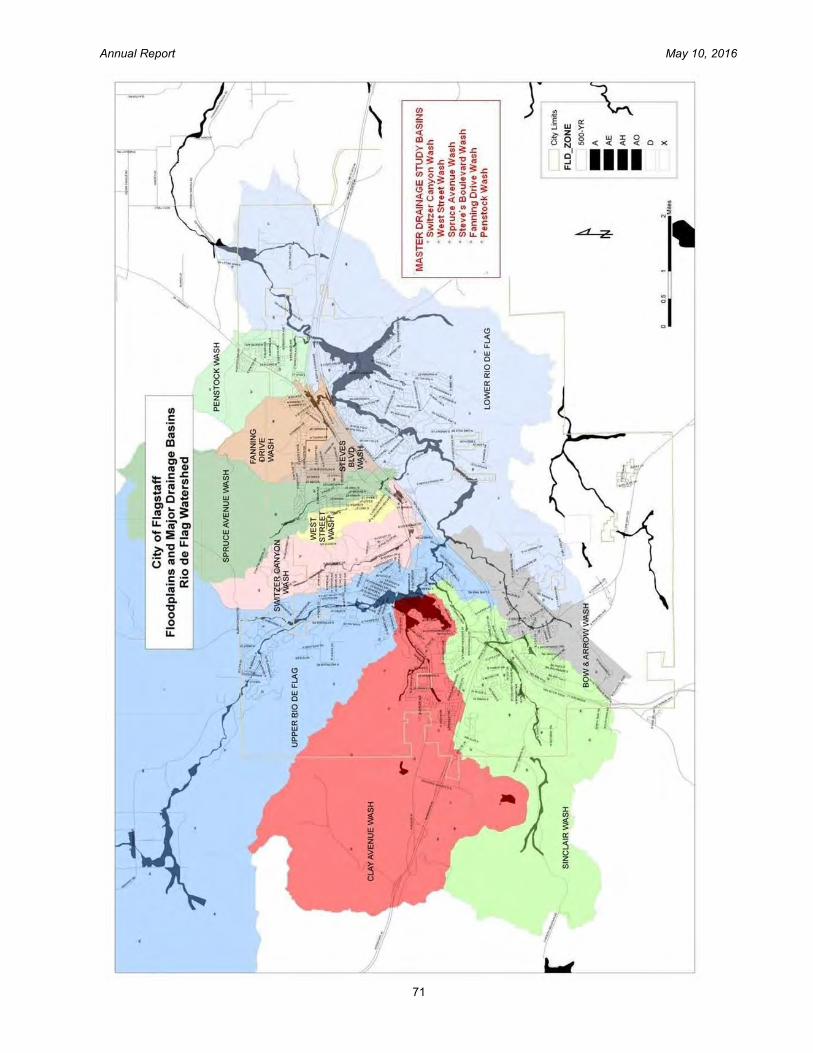
71
Annual Report May 10, 2016

72
Annual Report May 10, 2016
REGULATORY COMPLIANCE
The mission of the Regulatory Compliance
Section of the Utilities Division is to ensure
that the City of Flagstaff is compliant with all
sampling and reporting requirements and
best management practices (BMPs) as
directed under state and federal regulations
and permits for our water, wastewater,
reclaimed water, surface water, stormwater,
industrial pretreatment and backflow
programs. The Regulatory Compliance
Section is also responsible for ensuring
each facility is properly permitted. Staff
philosophy is responsiveness, performing
duties with honesty and integrity, and a
commitment to meeting industry standards
of excellence.
In addition, we are committed to a goal of
100% customer satisfaction. This is
achieved by dedication to exceeding
customer expectations and by continuously
improving our programs. We value co-
worker input and strive to maintain high
motivation by providing an environment that
encourages improvement and teamwork.
Core functions of the Regulatory
Compliance Section include sampling,
testing, documenting and reporting the
quality of the City’s water, wastewater,
reclaimed water, and industrial pretreatment
and backflow systems as directed under
state and federal regulations and permits.
The section also maintains the air quality
permit for the Wildcat Hill Wastewater
Reclamation Plant. The Section manages
two (2) State licensed laboratories,
administers the Multi-Sector General Permit
(MSGP) at the Wildcat Hill and Rio de Flag
Wastewater Reclamation Plants,
administers the Municipal Separate Storm
Sewer System (MS4) permit for the
Stormwater section, and works with
regulatory agencies to update permits. The
section also coordinates the Utilities
Division’s safety programs.
The Regulatory Compliance Section
represents the City by maintaining
relationships with other professionals in the
water and environmental compliance field
and participating in or hosting meetings and
workshops. We are a liaison with numerous
outside agencies and organizations that
include the United States Environmental
Protection Agency (USEPA), Arizona
Department of Environmental Quality
(ADEQ), Arizona Department of Water
Resources (ADWR), Advisory Panel on
Emerging Contaminants, and Environmental
Laboratory Advisory Committee. In addition,
staff review proposed water quality
legislation and provide input to State
Agencies, City Council and Legislators. Staff
also provides water quality regulatory permit
administration for all programs within the
Regulatory Compliance Section for various
Federal (USEPA) and State (ADEQ)
programs including: Safe Drinking Water
Act, Clean Water Act, Clean Air Act,
National Pollutant Discharge Elimination
System (NPDES), Arizona Pollutant
Discharge Elimination System (AZPDES),
13

73
Annual Report May 10, 2016
Arizona Aquifer Protection Permit (APP),
Reclaimed Water Permit, Multi-Sector
General Permit (MSGP), Municipal
Separate Storm Sewer System (MS4), and
Emergency Operations and Safety
Programs as required.
Accomplishments during 2015 included: First complete year of the newly created
the Regulatory Compliance Section. All
laboratory and Industrial Waste
supervisors and staff that oversee
compliance within the water, wastewater,
backflow and industrial waste regulatory
compliance programs were brought into
the new section.
Successfully updated the AZPDES
Permits for the Rio de Flag Water
Reclamation Facility (Rio WRF) and
Wildcat Hill Wastewater Reclamation
Plant (Wildcat WRP).
Participated and provided valuable input
in beta testing ADEQ’s new program for
online submittals of discharge monitoring
reports (DMR) and self-monitoring
reporting forms (SMRF).
Standardized ordering and operating the
Rio de Flag and Wildcat Hill wastewater
labs.
Passed the new Industrial Waste Local
Limits ordinance in City Code.
Coordinated efforts between the
wastewater lab and industrial waste to
sample the effluent from the Rio de Flag
and Wildcat Hill wastewater reclamation
plants to save the City money in
sampling costs.
Submitted an aquifer protection permit
(APP) modification for the Wildcat Hill
Wastewater Reclamation Plant to ADEQ
to modify the monitoring schedule for the
point of compliance well and change the
name to the Wildcat Hill Wastewater
Reclamation Plant.
Industrial Waste program staff resolved
TTHM issues at the Wildcat WRP and
identified a source of ammonia affecting
the Rio WRP through extensive testing
of the water quality in the sewer system.
Purchased ammonia monitors to better
assist Wastewater Collections to better
track ammonia in the collection system.
Tracked down the source and was able
to stop contamination in the collection
system from a fluorescent dye that was
causing issues at the Wildcat Hill plant.
Submitted a renewal for the Air Quality
permit for the Wildcat Hill WRP.
Obtained the Area-wide AZPDES de
minimus Permit from ADEQ.
Obtained a Type 3.02 general permit to
allow the use of sludge drying ponds at
the Lake Mary treatment plant.
Implemented software to track and
manage compliance data for the drinking
water and water labs.
Assisted in resolving an HAA5
exceedance at the Lake Mary surface
water plant.
Upgraded flow and pH monitoring
equipment located at SIU outfalls to
provide secure real time, web based
information.
Closed Consent Order for the Wildcat
Hill WRP

74
Annual Report May 10, 2016
13-1 Industrial Waste Significant Industrial Users

75
Annual Report May 10, 2016
RED GAP RANCH 14
Two notable events occurred in 2015, which are discussed in more detail below: (1) City
Council entering into an agreement with Arizona Department of Transportation (ADOT) to
establish a process and the requirements necessary to obtain an Encroachment Permit to
place a waterline within the Interstate 40 right-of-way, and (2) the City fulfilled a $300,000
grant from the U.S. Bureau of Reclamation Rural Water Supply Program to conduct three
environmental assessments related to the Red Gap Ranch project.
Agreement with Arizona Department of Transportation (ADOT)
The purpose of the Intergovernmental Agreement (IGA) is to establish the process and
requirements necessary to obtain permits from Arizona Department of Transportation that
would allow the City to place a waterline in the right-of-way of Interstate 40. The IGA is the
culmination of six years of negotiations between the City and ADOT. The IGA has been
reviewed and signed by the State Engineer’s Office and Office of the Attorney General
and was approved by City Council at their January 19, 2016 council meeting.
After JACOBS Engineering evaluated multiple alternative alignments, the frontage along
Interstate 40 was selected as the preferred alignment. City staff subsequently started
discussions with ADOT and Federal Highway Administration in early 2010 about the use
of the right-of-way along Interstate 40 as a proposed location for a pipeline. The IGA
establishes a process of how the City can obtain a series of permits necessary for the
installation, construction, operation and maintenance of a 30-inch waterline along and
within the existing ADOT controlled access right-of-way of Interstate 40.
Connection to Council Goal and/or Regional Plan-Council Goals
2) Ensure Flagstaff has a long-term water supply for current and future needs.
3) Provide sustainable and equitable public facilities, services, and infrastructure systems
in an efficient and effective manner to serve all population areas and demographics.
7) Address key issues and processes related to the implementation of the Regional Plan.
11) Ensure that we are as prepared as possible for extreme weather events.
Connection to Council Goal and/or Regional Plan-Regional Plan
WR.3 Satisfy current and future human water demands and the needs of the natural
environment through sustainable and renewable water resources and strategic
conservation measures.
WR.4 Logically enhance and extend the City's public water, wastewater and reclaimed
water services including their treatment, distribution and collection systems in both
urbanized and newly developed areas of the City to provide an efficient delivery of
services.
76
Annual Report May 10, 2016
In September, 2012, the City accepted a $300,000 grant from the U.S. Department of the
Interior, Bureau of Reclamation (USBR) for cultural, biological and groundwater resource
assessments at Red Gap Ranch. In order to receive this grant the City had to meet the
minimum required contribution of 59% cost-share. At that time the City pledged
$1,662,451 (which equaled 85%) for work already completed at Red Gap Ranch.
In 2013 the City went through the procurement process to select a consulting firm to
conduct the three studies scoped under the grant. Southwest Ground-water Consultants,
Phoenix, Arizona, was the selected consultant from that process and the City entered into
contract with the firm in June, 2013. Southwest Ground-water Consultants teamed with
WestLand Resources, Flagstaff, Arizona, to conduct the cultural and biological studies.
The overall study addressed the impact that pumping groundwater from beneath Red Gap
Ranch could have to baseflow that feeds the Little Colorado River, East Clear Creek and
Chevelon Creek, and the impact the conveyance of groundwater (i.e. pipelines, roads,
treatment facility) could have on biological and cultural resources on the Red Gap Ranch
property, as required by the NEPA process.
In February, 2014, WestLand Resources, Inc. (WestLand) completed a Biological
Resources Evaluation and Cultural Resources Assessment at the City’s 7,500 acres of
property at Red Gap Ranch (Project Area). Both the Biological Resources Evaluation and
the Cultural Assessment studies were designed to support the preparation of an
Environmental Impact Statement (EIS) for the proposed development of the water supply
for use by the City. Presently, it is anticipated that the development of the project
infrastructure will involve some federal permitting and oversight. The National
Environmental Policy Act (NEPA) requires review and public disclosure of the potential
effects of major federal actions prior to the issuance of permits or the provision of funding
for construction activities.
Cultural Resource Evaluation
For the Cultural Assessment, a pedestrian survey examined nearly 570 acres of the City’s
Red Gap Ranch property in order to document the existing cultural resources and identify
potential effects to these resources as a result of the construction of the project. The
cultural study focused on those areas of proposed ground-disturbing impacts for the
development of the project, including the existing wells and unpaved roads. WestLand
found 38 sites and 161 isolated occurrences representing human use and occupation of
the landscape from circa 9000 B.C. to the historical present (A.D. 1963). These include
Route 66, the Red Gap Ranch complex, artifact scatters, trash dumps, and temporary
habitations. One site, Route 66, is listed on the National Register of Historic Places
(NRHP), and WestLand recommended that an additional 22 sites are potentially eligible
U.S. Bureau of Reclamation Rural Water Supply Program Grant Final Product
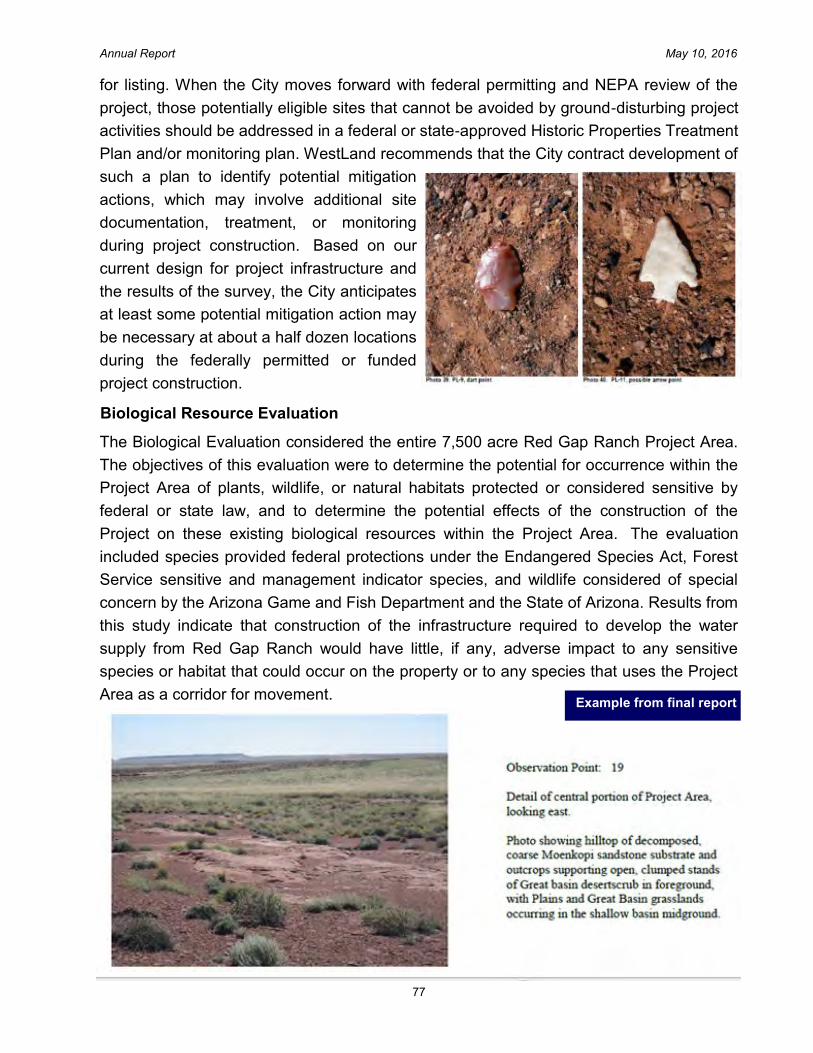
77
Annual Report May 10, 2016
The Biological Evaluation considered the entire 7,500 acre Red Gap Ranch Project Area.
The objectives of this evaluation were to determine the potential for occurrence within the
Project Area of plants, wildlife, or natural habitats protected or considered sensitive by
federal or state law, and to determine the potential effects of the construction of the
Project on these existing biological resources within the Project Area. The evaluation
included species provided federal protections under the Endangered Species Act, Forest
Service sensitive and management indicator species, and wildlife considered of special
concern by the Arizona Game and Fish Department and the State of Arizona. Results from
this study indicate that construction of the infrastructure required to develop the water
supply from Red Gap Ranch would have little, if any, adverse impact to any sensitive
species or habitat that could occur on the property or to any species that uses the Project
Area as a corridor for movement.
for listing. When the City moves forward with federal permitting and NEPA review of the
project, those potentially eligible sites that cannot be avoided by ground-disturbing project
activities should be addressed in a federal or state-approved Historic Properties Treatment
Plan and/or monitoring plan. WestLand recommends that the City contract development of
such a plan to identify potential mitigation
actions, which may involve additional site
documentation, treatment, or monitoring
during project construction. Based on our
current design for project infrastructure and
the results of the survey, the City anticipates
at least some potential mitigation action may
be necessary at about a half dozen locations
during the federally permitted or funded
project construction.
Biological Resource Evaluation
Example from final report

78
Annual Report May 10, 2016
Southwest Ground-water Consultants, Inc., was hired by the City in 2013 to conduct the
groundwater impact assessment. The groundwater model utilized as a starting point for
the project was the U.S. Geological Survey’s Northern Arizona Regional Groundwater
Flow Model. Southwest Ground-water Consultants updated and modified the model to
better predict groundwater level changes and surface water interaction in and around Red
Gap Ranch.
The City and its consultant worked collaboratively with the Coconino Plateau Water
Advisory Council’s Technical Advisory Committee (TAC). The TAC consists of
representatives from the U.S. Fish & Wildlife, U.S. Geological Survey, U.S. Bureau of
Reclamation, Navajo Nation, Hopi Tribe, Northern Arizona University, Coconino County,
National Park Service, Coconino National Resource Conservation District, City of
Flagstaff, among others.
One of the primary objectives of the groundwater modeling effort was to simulate historical
and current groundwater and surface water conditions in the vicinity of Red Gap Ranch,
East Clear Creek, Chevelon Creek, Little Colorado River, and eastward to Holbrook. The
model was used to predict hydrologic conditions in the region over the next 100-years due
to proposed pumping by the City, Navajo Nation, Winslow and Arizona Public Service,
among others. The focus of this effort was on what impacts could occur to the water
flowing within the Little Colorado River, East Clear Creek and Chevelon Creek. This
analysis will likely be required as part of an overall Environmental Impact Statement.
Groundwater Resource Evaluation
Photo of bobcat at Red Gap Ranch.
Photo credit: Steve Flood

79
Annual Report May 10, 2016
Results from the modeling effort indicate that 100 years of pumping groundwater at Red
Gap Ranch (ramping up to 10,800 AF/YR from 2038 to 2082 and constant to 2115), and
by the Navajo Nation at the proposed Leupp wellfield (ramping up to 17,728 AF/YR from
2115), could have less than 0.1 cfs change in baseflow in Clear Creek at a point one mile
up from its confluence with the LCR, up to 2.0 cfs change in baseflow in the Little Colorado
River (see table below). The model shows no change in Chevelon baseflow after 100
years of pumping due to pumping at Red Gap or Leupp wellfields.
WestLand Resources, 2014. Red Gap Ranch Biological Resources Evaluation. Consultant’s Report to City
of Flagstaff Utilities Division, WestLand Resources, Inc. Engineering and Environmental Consultants,
Flagstaff, Arizona, 61 pages plus figures, tables, & appendices.
Purcell, David E., 2014. A cultural Resources Inventory of 567.89 Acres for Water Infrastructure
Development at Red Gap Ranch in Coconino County, Arizona. Consultant’s Report to City of Flagstaff,
Utilities Division, WestLand Resources, Inc. Engineering and Environmental Consultants, Flagstaff, Arizona,
207 pages plus figures.
SGC, Inc., 2015. Red Gap Ranch-Leupp Water Resources Environmental Assessment Groundwater Flow
Model. Consultant’s Report to City
of Flagstaff, Utilities Division,
Southwest Ground-water
Consultants, Inc., Phoenix, Arizona.
At Clear Creek Dam, 2014. Left to
Right: Jon Mason, USGS, Nathan
Miller, SGC, Jamie Macy, USGS,
Brad Hill, COF, Chris Catalano &
Bill Greenslade, SGC, Tom
Klimas, Westland Resources,
Mike Foley, NN. Photo credit
Brad Hill

80
Annual Report May 10, 2016
14-1
R
ed
Ga
p R
an
ch
Well
Data
AD
WR
Gro
un
dw
ate
r S
ite
Inv
en
tory
(G
WS
I)
Tele
metr
y M
on
ito
rin
g
Well a
t R
GR
Well
-7

81
Annual Report May 10, 2016
14-2
R
ed
Ga
p R
an
ch
Well
Lo
ca
tio
ns

82
Annual Report May 10, 2016
14-3
R
ed
Ga
p R
an
ch
Hyd
rog
rap
hs

83
Annual Report May 10, 2016

84
Annual Report May 10, 2016
Analy
te
unit
Year
Shallo
w
Well
#1
Shallo
w
Well
#2
Shallo
w
Well
#3
Shallo
w
Well
#4
Shallo
w
Well
#5
Shallo
w
Well
#6
Year
Red S
ands
Well
Headquart
ers
Well
Sunshin
e
Well
Agre
ssiv
eness In
dex
na
2012
12
12
13
11
12
11
2009
13
13
13
Alk
ilinity
in C
aC
O3
mg/L
2012
56
73
170
34
110
37
2009
200
170
170
Bic
arb
Alk
alin
ity in
HC
O3
calc
ula
tion
mg/L
2012
68
89
210
41
130
45
2009
250
200
210
Calc
ium
Tota
l m
g/L
2012
21
18
91
28
67
41
2009
74
84
94
Langelie
r In
dex
na
2012
-0.3
7-0
.044
0.6
6-1
0.0
66
-0.0
46
2009
0.8
70.8
40.9
6
pH
pH
2012
7.9
8.2
7.8
7.4
7.6
7.7
2009
8.1
7.2
8.1
Iron
mg/L
2009
0.1
114
0.0
43
Magnesiu
mm
g/L
2009
40
39
44
Sulfa
tem
g/L
2009
130
180
250
TD
Sm
g/L
2009
780
370
630
Tota
l Hard
ness (
CaC
O3)
mg/L
2009
350
370
420
Shallo
w W
ell
#6
Fie
ld P
ara
mete
rs2/2
7/2
013
11/6
/2012
2/2
7/2
013
11/6
/2012
2/2
7/2
013
11/6
/2012
2/2
7/2
013
11/6
/2012
2/2
7/2
013
11/6
/2012
2/2
7/2
013
Conductiv
ity (
uS
/cm
)594
601
576
585
1100
1053
634
646
708
749
920
Tem
pera
ture
(degre
es C
)15.6
17.0
15.5
18.5
12.8
20.0
12.0
20.2
11.7
19.4
13.2
pH
8.3
08.0
78.5
28.4
17.1
77.7
98.9
29.1
58.1
88.6
07.6
1
Shallo
w W
ell
#1
Shallo
w W
ell
#2
Shallo
w W
ell
#3
Shallo
w W
ell
#4
Shallo
w W
ell
#5
14-4
M
os
t R
ec
en
t R
ed
Gap
Ran
ch
Wa
ter
Qu
ali
ty D
ata
Tafo
ni, t
he g
eo
log
ic t
erm
fo
r th
e
ho
neyco
mb
weath
eri
ng
patt
ern
sh
ow
n in
th
is p
ho
to, in
Mo
en
ko
pi
san
dsto
ne a
t R
ed
Gap
Ra
nch
. P
ho
to
Cre
dit
: R
ob
in H
arr
ing
ton

85
Annual Report May 10, 2016
MISCELLANEOUS INFORMATION 15
REVENUES (FY= July thru June) FY 2015 WATER $ 14,043,178 FY 2014 $ 14,365,349 FY 2015 SEWER $ 8,907,760 FY 2014 $ 9,500,350 FY 2015 SEWER W/O RECLAIM $ 8,093,592 FY 2014 $ 8,546,638 FY 2015 RECLAIM $ 814,167 FY 2014 $ 953,712 SYSTEM INFORMATION (2015) Number of fire hydrants – 3,255 Number of reclaim hydrants - 14 Number of manholes – 7,494 Number of wells – 26 active in 2015 Miles of sanitary sewer – 276 Miles of water main – 435.02 Miles of reclaim pipeline – 25.8 active Miles of storm drain – 93.09 Average annual gallons per household in 2015 – 142 gallons per house per day Average total annual gallons per capita per day in 2015 – 88 gallons per person per day (without Lost & Unaccounted for Water) Upper Lake Mary capacity – 16,300 acre feet (USGS OFR 2008-1098) Year 2015, number of housing units – 17,858 (14,802 Single Family/3,056 Multi-Family) Average carbon intensity of a gallon of Flagstaff water 3.7 g CO2 equivalent / gallon of water (from Jennifer Wade, PhD, NAU (928) 523-1528 [email protected]) KEY ELEVATIONS (Feet) Pressure Zone A – 7,260 Presssure Zone B – 7,137 Pressure Zone A+ (RR Springs) – 7,320 Upper Lake Mary Spillway – 6,835.5 (USGS OFR 2008-1098) Inner Basin cabin – 9,415 Lake Mary WTP – 6,960 Wildcat WRP – 6,760 Rio de Flag WRP – 6,860
psi Pounds per square inch 2.304 feet of water head
Acre-foot Gallons in 1 acre, 1 foot deep 325,851 gallons
Cubic foot Gallons in 1 cubic foot 7.48 gallons
Cubic foot per second (cfs) 450 gallons per minute
Million gallons per day 694 gallons per minute
Break horse power (total lift x gpm)/3960
0.67 kwh (kilowatt hours)
GPCD Gallons per capita per day
mg/L milligram per liter or part per million
TTHM Total Trihalomethanes
15-1 Statistics

86
Annual Report May 10, 2016
15-2 Utilities Division Organizational Chart
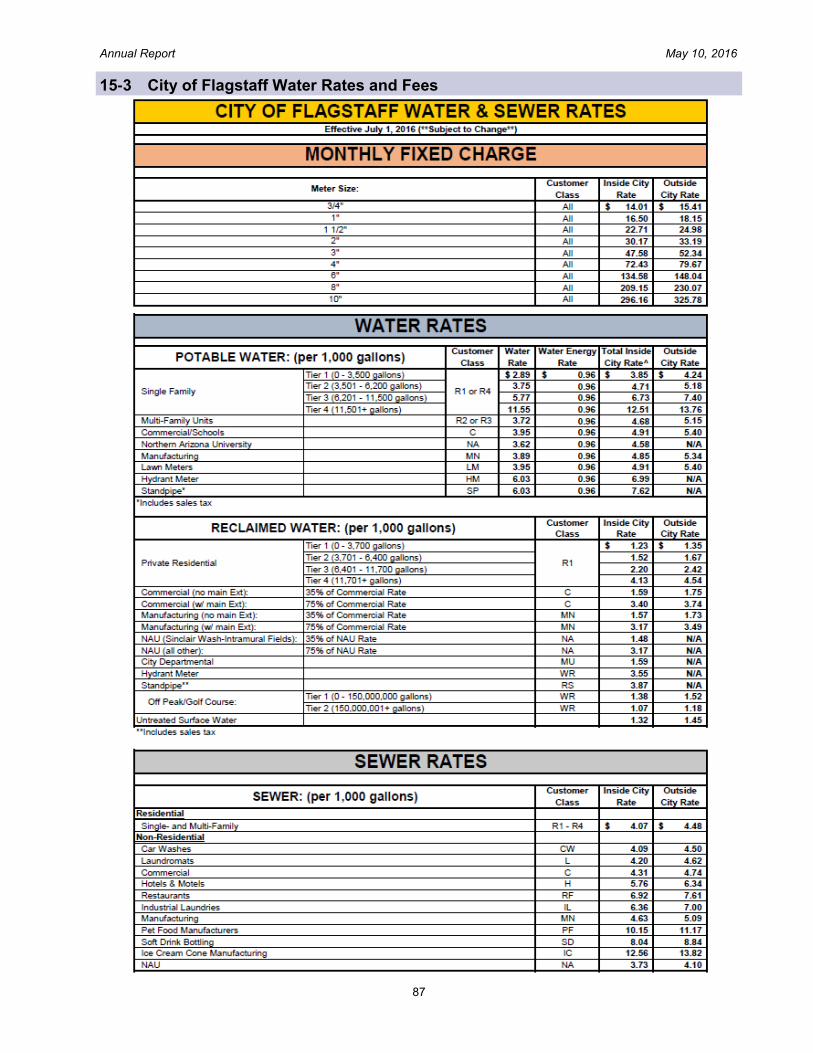
87
Annual Report May 10, 2016
15-3 City of Flagstaff Water Rates and Fees

88
Annual Report May 10, 2016
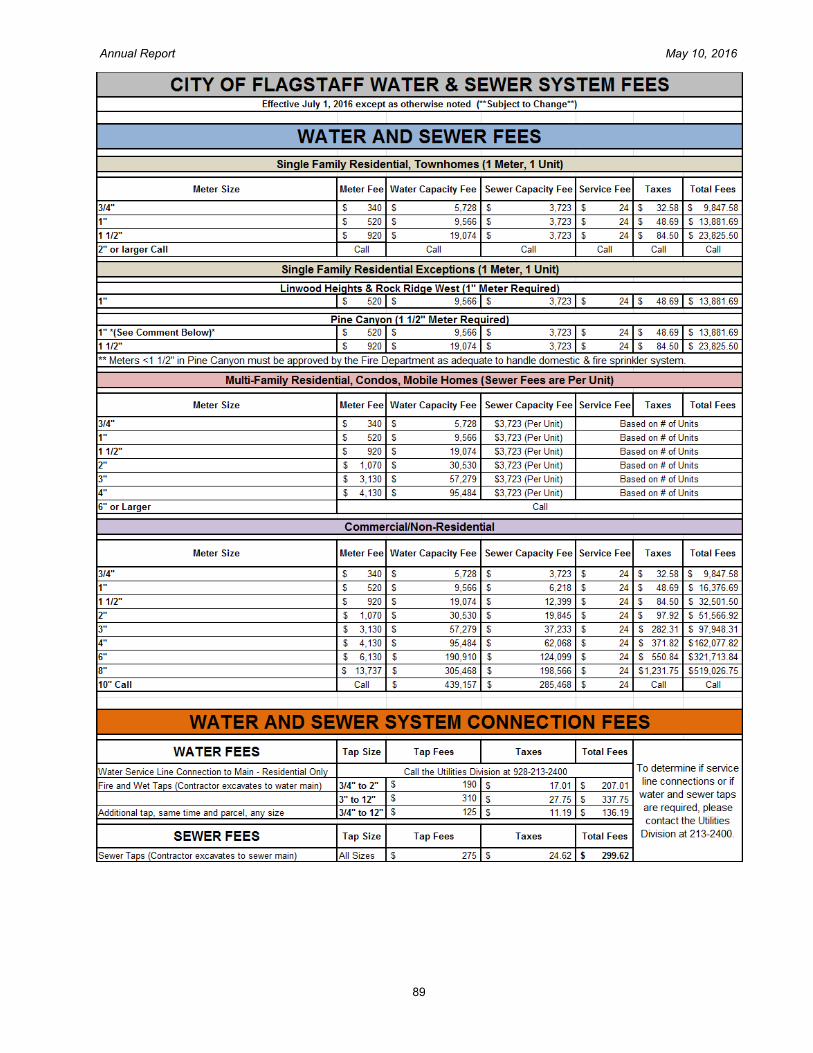
89
Annual Report May 10, 2016

90
Annual Report May 10, 2016
15-4 Radio Base Stations and Utilities Personnel Contact Information
WATER
Lake Mary WTP WT 002478 Type R Level IV Water Treatment Water System No. 403008 Water Distribution AZ 0403008 AWWA Membership No. 00033465 ADWR Designation No. 41-900002.0002 ADWR Community Water System ID: 91-000086.0000
WASTEWATER
Wastewater System No. 330002 Wildcat Hill WWTP AZPDES 0020427 APP 100760 WCH Air Quality Permit 59727, Place ID 1092
Rio De Flag WRF AZPDES 0023639 APP 102421 ADEQ Type 3 Reuse Permit No. R511384, LTF58397
CITY PERMIT NUMBERS