maxqda getting started guide - english
TRANSCRIPT
Support, Distribution:
VERBI Software. Consult. Sozialforschung. GmbH Berlin, Germany
www.maxqda.com
Apart from fair dealing for the purposes of private study, research, criticism or review, as permit-
ted under the Copyright Act, no part may be reproduced by any means without written permis-
sion from the publisher.
MAXQDA is a registered trademark of VERBI Software. Consult. Sozialforschung. GmbH, Ber-
lin/Germany; Mac is a registered trademark of Apple Computer, Inc. in the United States and/or
other countries; Microsoft Windows, Word, Excel, and PowerPoint are registered trademarks of
Microsoft Corporation in the United States and/or other countries; SPSS is a registered trade-
mark of IBM Corporation in the United States and/or other countries; Stata is a registered trademark of Stata Corp LLC. in the United States and/or other countries.
All other trademarks or registered trademarks are the property of their respective owners, and
may be registered in the United States and/or other jurisdictions.
We thank ResearchTalk for providing example data used in this Getting Started Guide.
ã VERBI Software. Consult. Sozialforschung. GmbH, Berlin 2017
Content 5
Introduction ................................................................................................................ 6The MAXQDA interface ............................................................................................. 7Starting MAXQDA ..................................................................................................................... 7The user interface ...................................................................................................................... 9A few notes on data storage and saving .................................................................................. 11Important keywords ................................................................................................................. 12Import and explore your data ................................................................................. 13Importing data ......................................................................................................................... 13Exploring data .......................................................................................................................... 14Search your data ...................................................................................................................... 17Color-coding and memos ......................................................................................................... 18Code your data ......................................................................................................... 20Coding data segments ............................................................................................................. 20Analyze your data .................................................................................................... 23Activating documents .............................................................................................................. 23Retrieving all segments coded with one code ........................................................................... 24Using visualizations .................................................................................................................. 25Conduct Mixed Methods analyses .......................................................................... 27Defining document variables .................................................................................................... 27Entering variable values ............................................................................................................ 28Transforming code frequencies into variables ........................................................................... 29Using document variables in your analysis ................................................................................ 30Further literature ..................................................................................................... 31Goodbye ................................................................................................................... 32Notes ......................................................................................................................... 33
6 Introduction
Introduction
Welcome to the MAXQDA Getting Started Guide! As no one likes to read long introductions and
manuals, we tried to make this one as short as possible to help you get started as quickly as possible.
The guide will enable you to start your analysis and make your own experiences with MAXQDA. We will focus on the actual usage of the program, and not on the presentation of different analysis and
research methods. If you want to find out more about those, we have provided a list of useful pub-
lications in the chapter “Further literature”. As you may know, there is an endless number of differ-
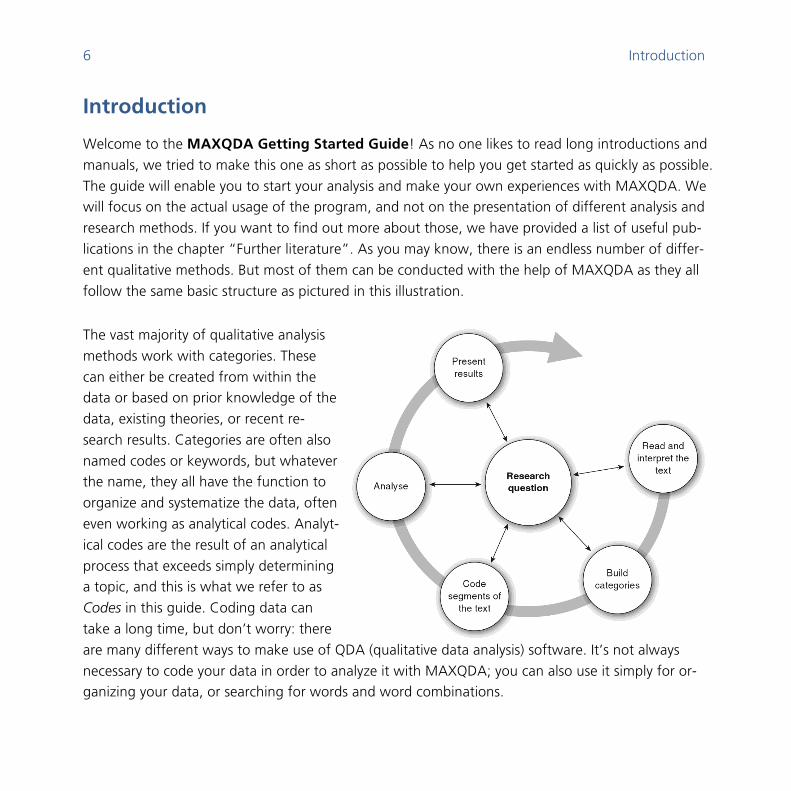
ent qualitative methods. But most of them can be conducted with the help of MAXQDA as they all
follow the same basic structure as pictured in this illustration.
Introduction
The vast majority of qualitative analysis
methods work with categories. These
can either be created from within the data or based on prior knowledge of the
data, existing theories, or recent re-
search results. Categories are often also
named codes or keywords, but whatever the name, they all have the function to
organize and systematize the data, often
even working as analytical codes. Analyt-
ical codes are the result of an analytical
process that exceeds simply determining a topic, and this is what we refer to as
Codes in this guide. Coding data can
take a long time, but don’t worry: there
are many different ways to make use of QDA (qualitative data analysis) software. It’s not always
necessary to code your data in order to analyze it with MAXQDA; you can also use it simply for or-ganizing your data, or searching for words and word combinations.
The MAXQDA interface 7
The MAXQDA interface
Starting MAXQDA
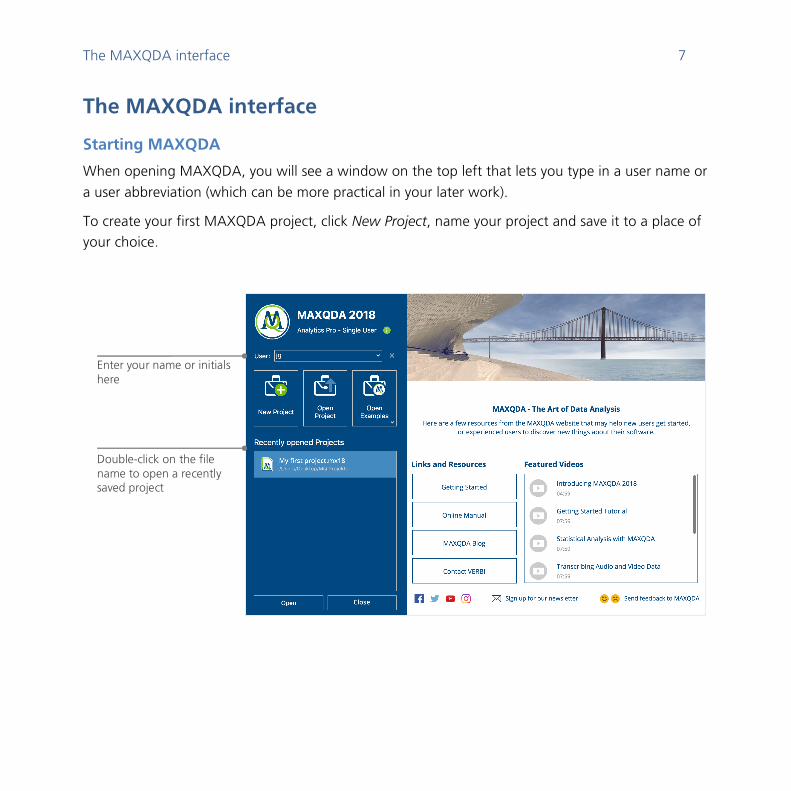
When opening MAXQDA, you will see a window on the top left that lets you type in a user name or
a user abbreviation (which can be more practical in your later work).
To create your first MAXQDA project, click New Project, name your project and save it to a place of your choice.
Enter your name or initials here
Double-click on the file name to open a recently saved project
8 Starting MAXQDA
MAXQDA 2018 project files have the file ending MX18. You can also recognize these files in Win-
dows Explorer or Mac Finder by the description “MAXQDA 2018 Project”.
MAXQDA uses Projects, like Excel uses workbooks (.xlsx), and SPSS uses data files (.sav). Nearly eve-
rything you import to or create with MAXQDA (like your Codes and Memos) will be saved in Pro-
jects.
The right side of the start screen provides you with several links, for example the option to open up
the MAXQDA online manual, watch MAXQDA video tutorials or send feedback to the MAXQDA
team.
The MAXQDA interface 9
The user interface
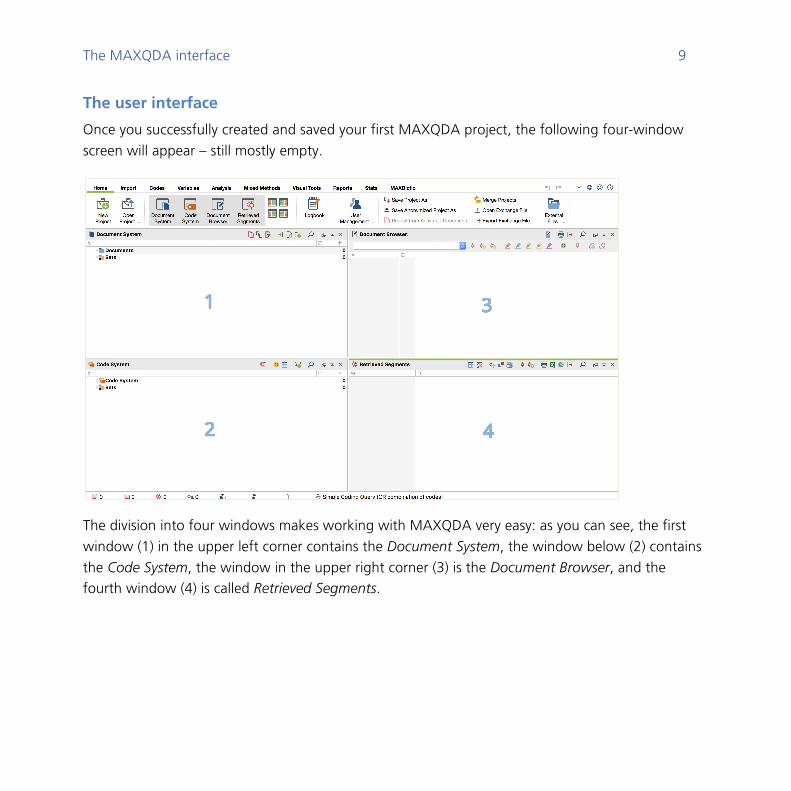
Once you successfully created and saved your first MAXQDA project, the following four-window
screen will appear – still mostly empty.
The division into four windows makes working with MAXQDA very easy: as you can see, the first
window (1) in the upper left corner contains the Document System, the window below (2) contains
the Code System, the window in the upper right corner (3) is the Document Browser, and the fourth window (4) is called Retrieved Segments.
10 The user interface
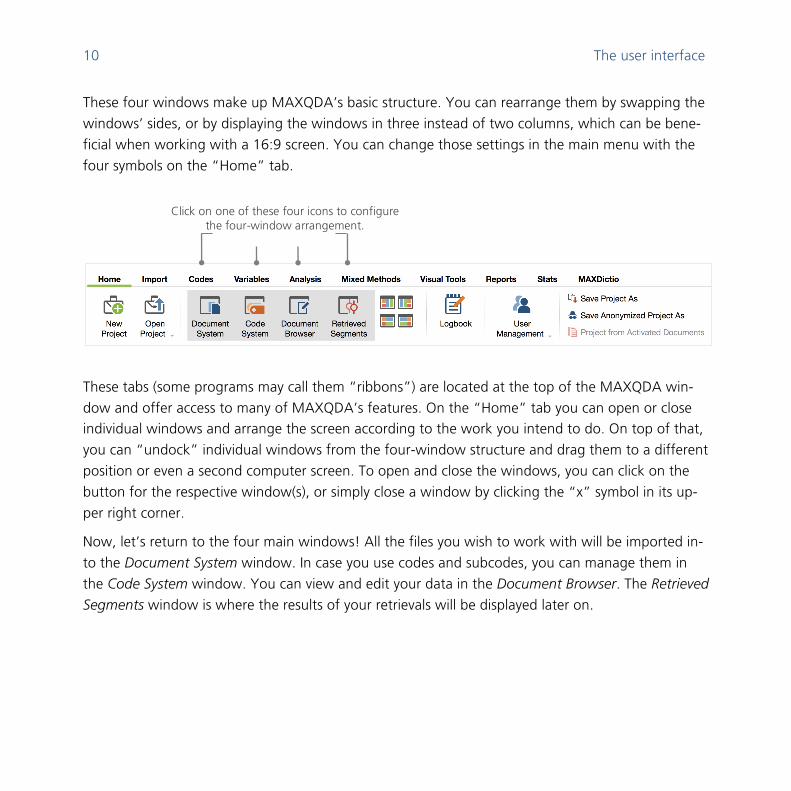
These four windows make up MAXQDA’s basic structure. You can rearrange them by swapping the
windows’ sides, or by displaying the windows in three instead of two columns, which can be bene-
ficial when working with a 16:9 screen. You can change those settings in the main menu with the
four symbols on the “Home” tab.
These tabs (some programs may call them “ribbons”) are located at the top of the MAXQDA win-
dow and offer access to many of MAXQDA’s features. On the “Home” tab you can open or close individual windows and arrange the screen according to the work you intend to do. On top of that,
you can “undock” individual windows from the four-window structure and drag them to a different
position or even a second computer screen. To open and close the windows, you can click on the
button for the respective window(s), or simply close a window by clicking the “x” symbol in its up-
per right corner.
Now, let’s return to the four main windows! All the files you wish to work with will be imported in-
to the Document System window. In case you use codes and subcodes, you can manage them in
the Code System window. You can view and edit your data in the Document Browser. The Retrieved
Segments window is where the results of your retrievals will be displayed later on.
Click on one of these four icons to configure the four-window arrangement.
The MAXQDA interface 11
A few notes on data storage and saving
MAXQDA administers everything you import, comment, or define in one single file, the Project file.
So, once you create it: one project = one file. As we learned earlier, those files end in MX18 (older
versions’ projects end in MX12 or MX11). MAXQDA Exchange files are special types of files used to
make data exchanges between different program versions.
In order to ensure that your project is always safe, please read the following box:
Please note: MAXQDA automatically saves everything that is imported or created by the user(s). However, you should still make sure to regularly create back-ups via the option Save Project as, which you can find in the “Home” tab and save them on a secondary storage device.
To sum up, the Project file contains all the data material you need to work on your research project,
bachelor thesis or master thesis. But there’s an exception to every rule: if you use a lot of audio or
video files, the Project file may become too large, even after importing only a few video files. The standard setting therefore automatically embeds pictures and PDF documents only up to a certain
file size (5 MB), whilst audio and video files are saved separately. Of course you can change these
settings. But when your Project file becomes too large, it may be difficult to exchange it with others.
12 Important keywords
Important keywords
Here are some of the most important keywords you should know for your work with MAXQDA:
Projects are the system files, or “work units” in MAXQDA. They contain all imported data, like texts,
PDFs, pictures, tables as well as the codes, memos, comments you created.
Documents are those units that you want to analyze. They can be interviews, focus group proto-cols, video or audio recordings, articles from scientific journals and many more.
Codes are your most important analysis tool. They can be assigned to anything you consider worth
marking, be it text segments, sections in a photo or parts of a video.
The Code system or Code tree describes the entirety of all codes and subcodes which can be or-dered hierarchically.
Coding is the act of assigning a code to a marked segment of your material.
Coded segments are those material segments that have been assigned a code.
Memos basically serve as your records. You can note your ideas, assumptions, and questions for
your next analysis steps, or formulate first hypotheses regarding possible connections in the data.
Comments are shorter than memos. You can use them to assign comments like “contradictory”, or
“important part!” to coded segments.
Overviews are tabular presentations omnipresent in MAXQDA. There are overviews of coded seg-
ments, memos, variables, links and so on. All MAXQDA overviews follow the same principle and al-low easy access to individual elements so that you don’t lose track of your data.
Import and explore your data 13
Import and explore your data
Importing data
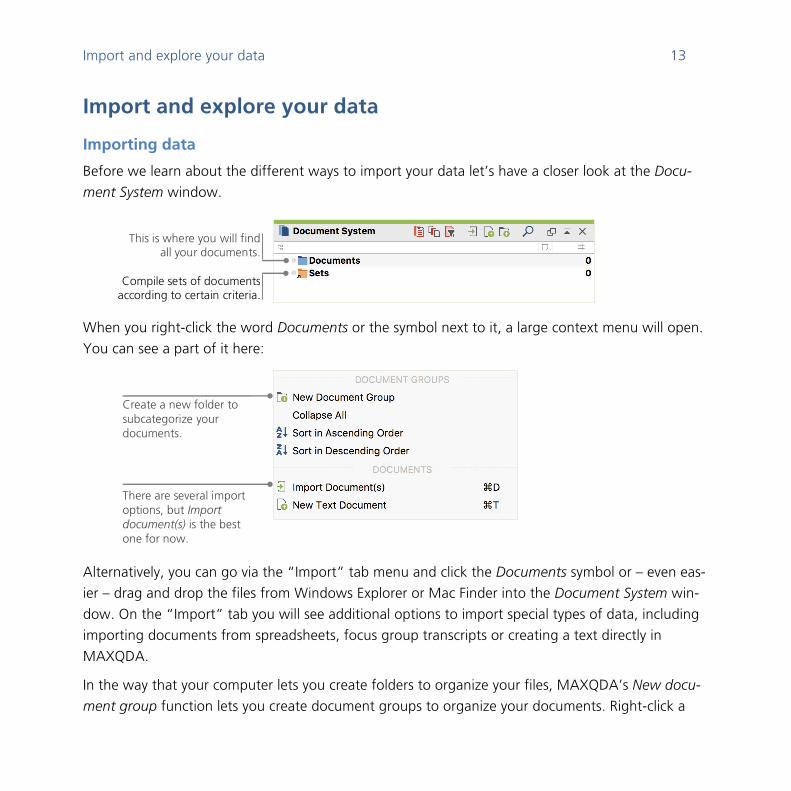
Before we learn about the different ways to import your data let’s have a closer look at the Docu-
ment System window.
When you right-click the word Documents or the symbol next to it, a large context menu will open.
You can see a part of it here:
Alternatively, you can go via the “Import” tab menu and click the Documents symbol or – even eas-
ier – drag and drop the files from Windows Explorer or Mac Finder into the Document System win-
dow. On the “Import” tab you will see additional options to import special types of data, including
importing documents from spreadsheets, focus group transcripts or creating a text directly in
MAXQDA.
In the way that your computer lets you create folders to organize your files, MAXQDA’s New docu-
ment group function lets you create document groups to organize your documents. Right-click a
This is where you will find all your documents.
okumentverwaltung. Compile sets of documents
according to certain criteria.
Create a new folder to subcategorize your documents.
There are several import options, but Import document(s) is the best one for now.
14 Exploring data
document group and choose Import document(s) to import them, or drag and drop your docu-
ments from one group to the other.
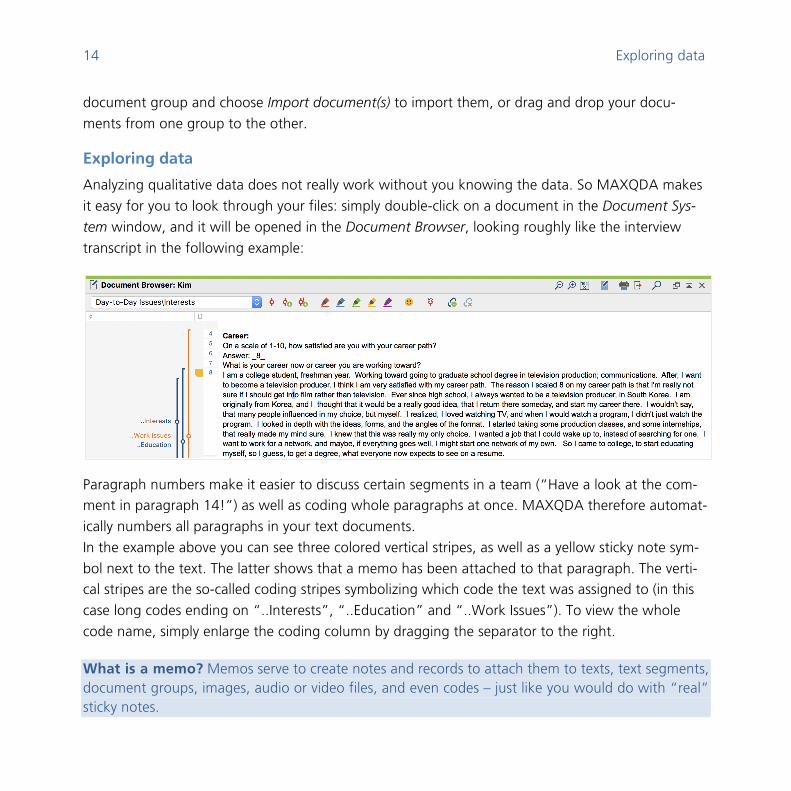
Exploring data
Analyzing qualitative data does not really work without you knowing the data. So MAXQDA makes
it easy for you to look through your files: simply double-click on a document in the Document Sys-
tem window, and it will be opened in the Document Browser, looking roughly like the interview
transcript in the following example:
Paragraph numbers make it easier to discuss certain segments in a team (“Have a look at the com-ment in paragraph 14!”) as well as coding whole paragraphs at once. MAXQDA therefore automat-
ically numbers all paragraphs in your text documents.
In the example above you can see three colored vertical stripes, as well as a yellow sticky note sym-
bol next to the text. The latter shows that a memo has been attached to that paragraph. The verti-cal stripes are the so-called coding stripes symbolizing which code the text was assigned to (in this
case long codes ending on “..Interests”, “..Education” and “..Work Issues”). To view the whole
code name, simply enlarge the coding column by dragging the separator to the right.
What is a memo? Memos serve to create notes and records to attach them to texts, text segments, document groups, images, audio or video files, and even codes – just like you would do with “real” sticky notes.
Import and explore your data 15
When you open a text in the Document Browser for the first time, that sector will still be empty as
you have not coded nor created a memo yet. Just try to create one now: double-click somewhere in
the memo sector and a memo dialog window will automatically open. As we will talk about memos
in more detail later, this is all you need to know for now.
The standard setting for the codes is to be displayed left of the data. If you prefer them on the right, however, you can just place the whole sector there by clicking the sector head and dragging it to
the other side. There is no functional difference.
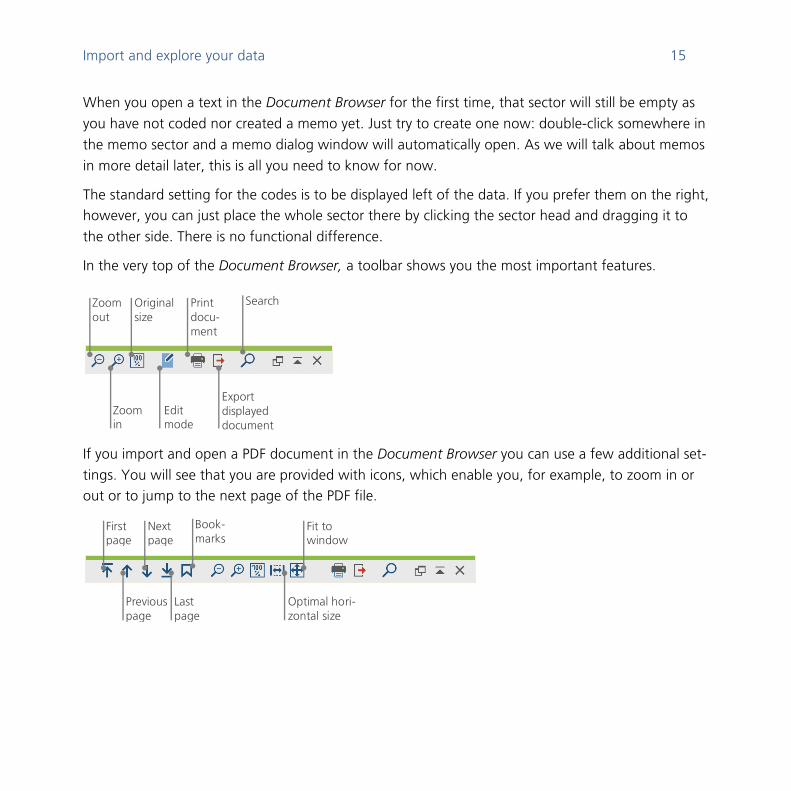
In the very top of the Document Browser, a toolbar shows you the most important features.
If you import and open a PDF document in the Document Browser you can use a few additional set-
tings. You will see that you are provided with icons, which enable you, for example, to zoom in or out or to jump to the next page of the PDF file.
Zoom out
Zoom in
Original size
Edit mode
Print docu-ment
Export displayed document
Search
First page
Previous page
Next page
Last page
Book-marks
Optimal hori-zontal size
Fit to window
16 Exploring data
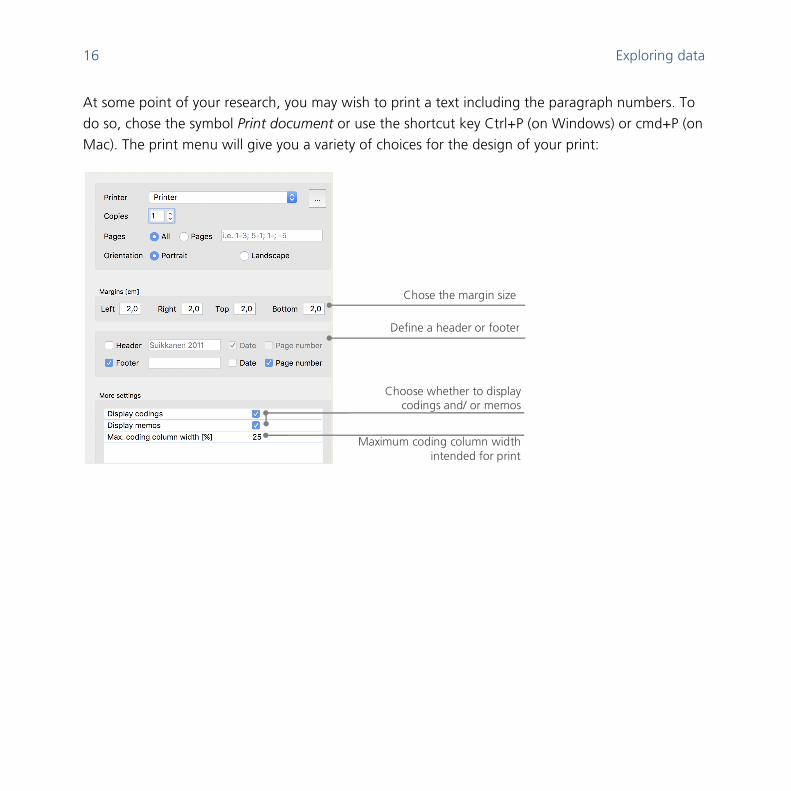
At some point of your research, you may wish to print a text including the paragraph numbers. To
do so, chose the symbol Print document or use the shortcut key Ctrl+P (on Windows) or cmd+P (on
Mac). The print menu will give you a variety of choices for the design of your print:
Choose whether to display codings and/ or memos
Chose the margin size
Define a header or footer
Maximum coding column width intended for print
Import and explore your data 17
Search your data
The exploration phase of your research may call for the necessity to search your documents for cer-
tain words. In MAXQDA, word search can be done locally in each of the four main windows, that
means in one window at a time. You will find a magnifying glass symbol in each window to enter
the search word upon click. MAXQDA will display the term’s frequency, and you will be able to nav-igate from each hit to the next to view its context by using the arrow keys.
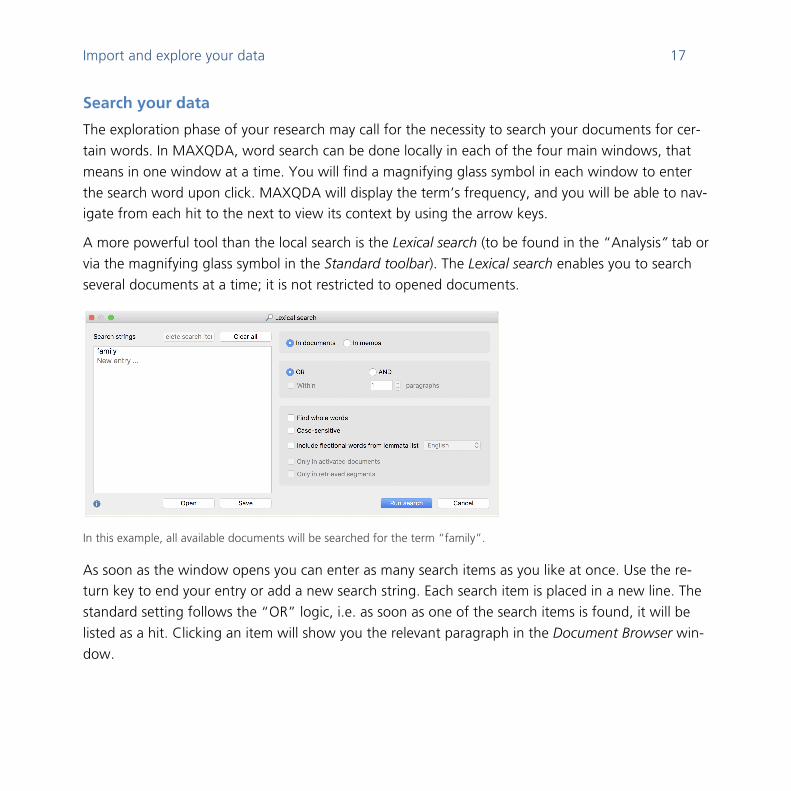
A more powerful tool than the local search is the Lexical search (to be found in the “Analysis” tab or
via the magnifying glass symbol in the Standard toolbar). The Lexical search enables you to search
several documents at a time; it is not restricted to opened documents.
In this example, all available documents will be searched for the term “family”.
As soon as the window opens you can enter as many search items as you like at once. Use the re-turn key to end your entry or add a new search string. Each search item is placed in a new line. The
standard setting follows the “OR” logic, i.e. as soon as one of the search items is found, it will be
listed as a hit. Clicking an item will show you the relevant paragraph in the Document Browser win-
dow.
18 Color-coding and memos
Color-coding and memos
Sometimes you may want to mark something in a text or note comments, hypotheses and further
ideas, before you have even started thinking about categories and the general direction of your
analysis. Just like you may then highlight passages in a book or stick a sticky note to a page, you can
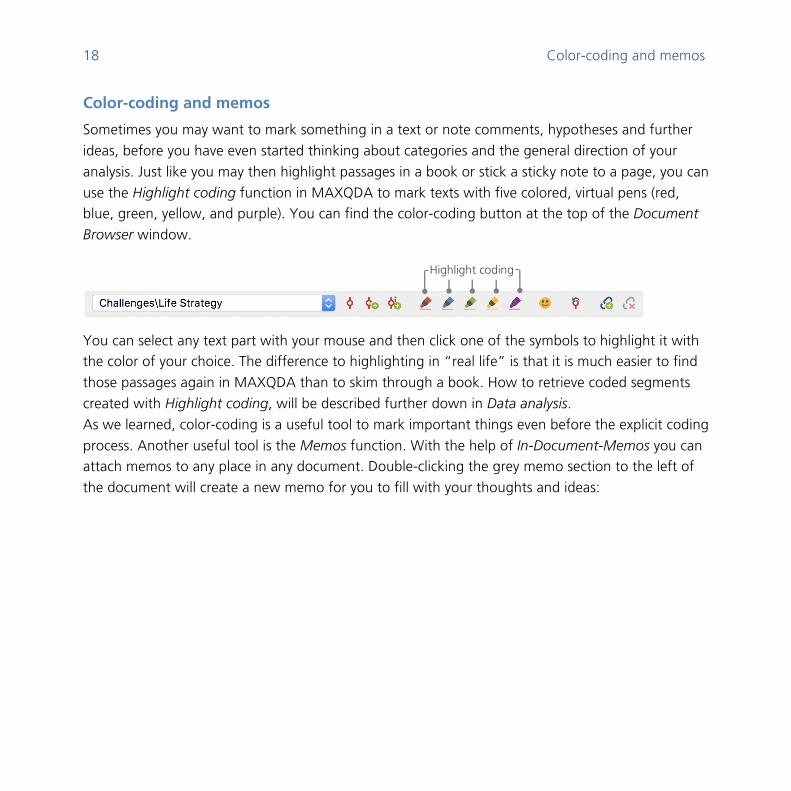
use the Highlight coding function in MAXQDA to mark texts with five colored, virtual pens (red, blue, green, yellow, and purple). You can find the color-coding button at the top of the Document
Browser window.
You can select any text part with your mouse and then click one of the symbols to highlight it with the color of your choice. The difference to highlighting in “real life” is that it is much easier to find
those passages again in MAXQDA than to skim through a book. How to retrieve coded segments
created with Highlight coding, will be described further down in Data analysis.
As we learned, color-coding is a useful tool to mark important things even before the explicit coding
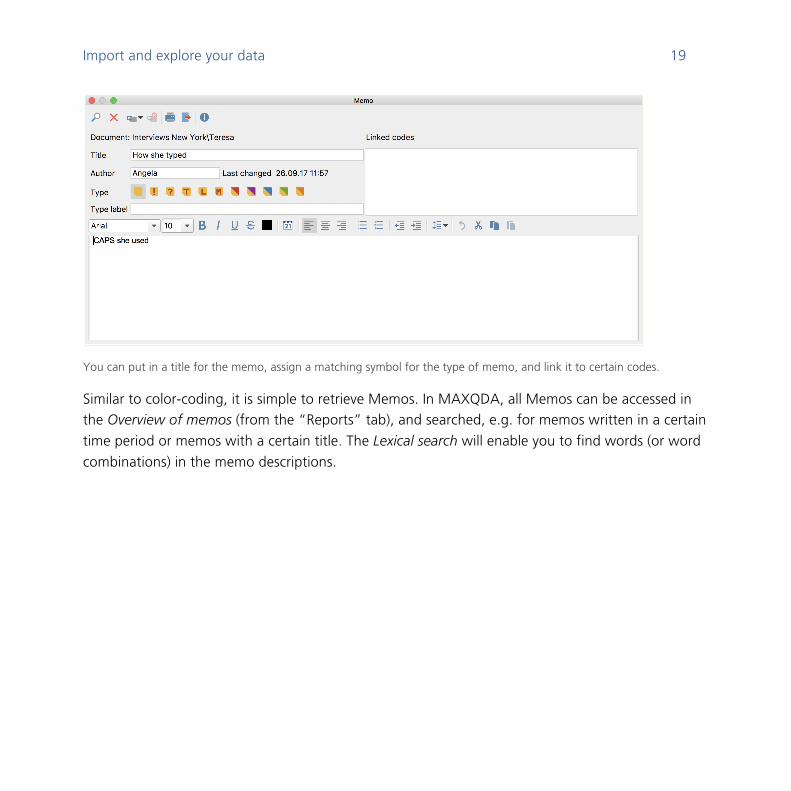
process. Another useful tool is the Memos function. With the help of In-Document-Memos you can attach memos to any place in any document. Double-clicking the grey memo section to the left of
the document will create a new memo for you to fill with your thoughts and ideas:
Highlight coding
Import and explore your data 19
You can put in a title for the memo, assign a matching symbol for the type of memo, and link it to certain codes.
Similar to color-coding, it is simple to retrieve Memos. In MAXQDA, all Memos can be accessed in the Overview of memos (from the “Reports” tab), and searched, e.g. for memos written in a certain
time period or memos with a certain title. The Lexical search will enable you to find words (or word
combinations) in the memo descriptions.
20 Coding data segments
Code your data
Coding data segments
As we learned earlier, the central work technique among most analysis methods is Coding the da-ta. But what does this mean? Coding describes the process of selecting part of the data material,
for example a paragraph or one part of an image, with the mouse (just like in Word or other pro-grams) and assigning a code to it. This is principally the same as tagging contents, but coding in
empirical social research includes much more than that.
So, what is a code then? Your first associations may be of secret services and their coding and de-
coding machines, or of codes as strictly regulated mappings as in Morse codes. Both associations are misleading! In the context of qualitative research a code is more of a label used to name phe-
nomena in a text or an image. In technical terms, a code is a character string that can consist of up
to 63 characters in MAXQDA, be it several words or more cryptical strings like “CR128”. In social
research, codes can possess different meanings and take on different functions in the research pro-
cess: there are factual codes, thematic codes, theoretical codes and many more (see Kuckartz 2016, Richards 2014). From simply looking at the code itself, its role in the research process is not always
clear: it could be of minor importance or play a key role. Only its context or framing will shed light
on that.
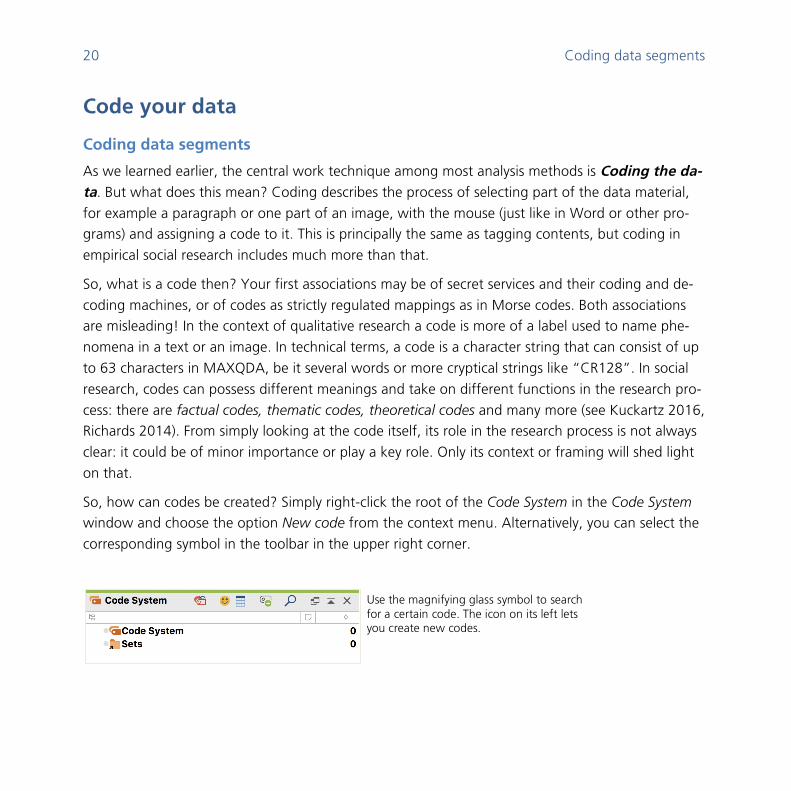
So, how can codes be created? Simply right-click the root of the Code System in the Code System window and choose the option New code from the context menu. Alternatively, you can select the
corresponding symbol in the toolbar in the upper right corner.
Use the magnifying glass symbol to search for a certain code. The icon on its left lets you create new codes.
Code your data 21
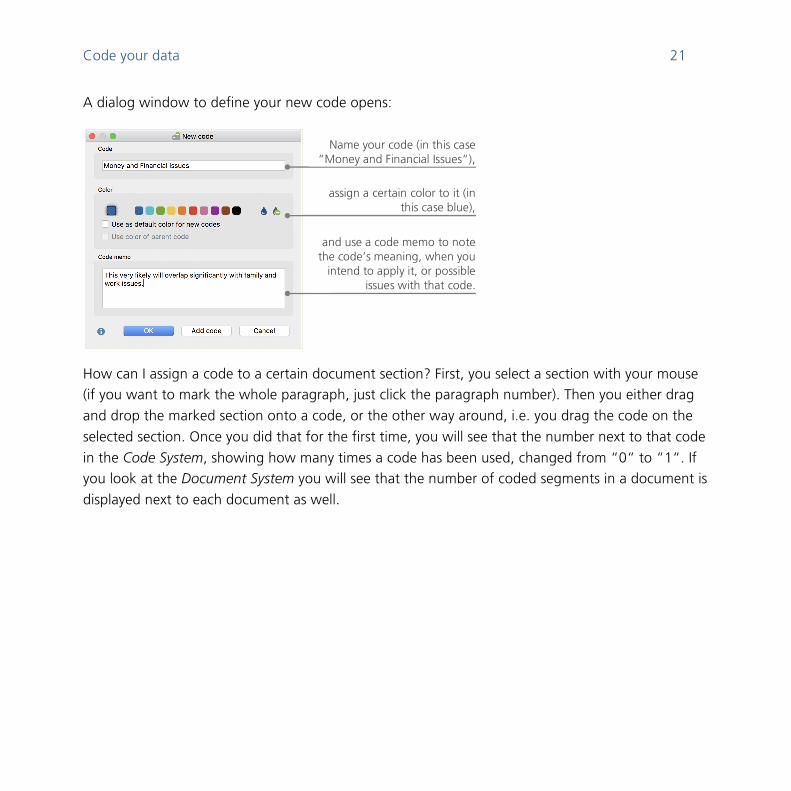
A dialog window to define your new code opens:
How can I assign a code to a certain document section? First, you select a section with your mouse (if you want to mark the whole paragraph, just click the paragraph number). Then you either drag
and drop the marked section onto a code, or the other way around, i.e. you drag the code on the
selected section. Once you did that for the first time, you will see that the number next to that code
in the Code System, showing how many times a code has been used, changed from “0“ to “1“. If you look at the Document System you will see that the number of coded segments in a document is
displayed next to each document as well.
assign a certain color to it (in this case blue),
Name your code (in this case “Money and Financial Issues“),
and use a code memo to note the code’s meaning, when you
intend to apply it, or possible issues with that code.
22 Coding data segments
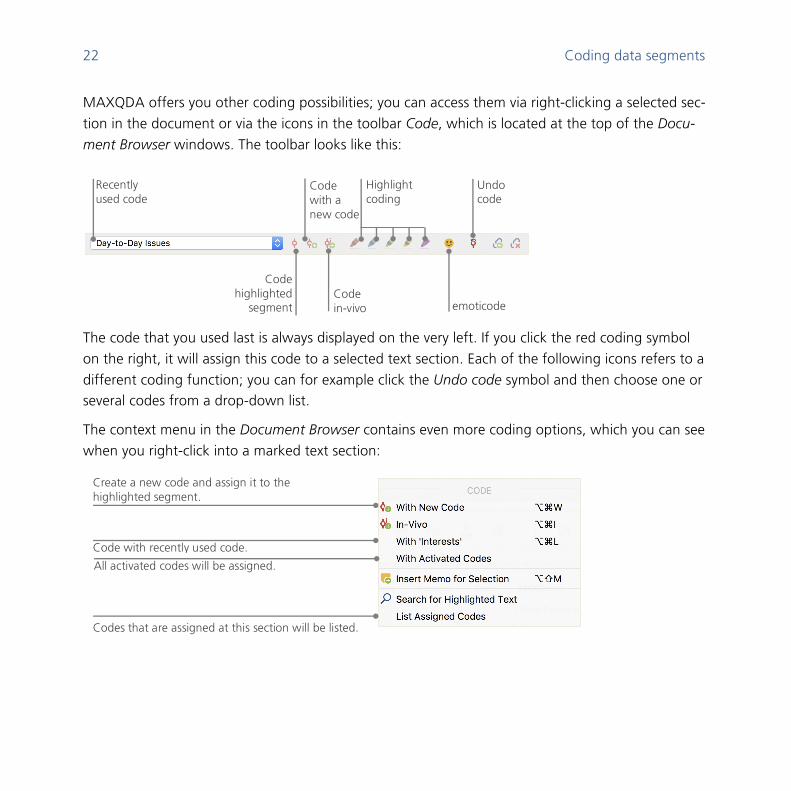
MAXQDA offers you other coding possibilities; you can access them via right-clicking a selected sec-
tion in the document or via the icons in the toolbar Code, which is located at the top of the Docu-
ment Browser windows. The toolbar looks like this:
The code that you used last is always displayed on the very left. If you click the red coding symbol
on the right, it will assign this code to a selected text section. Each of the following icons refers to a
different coding function; you can for example click the Undo code symbol and then choose one or several codes from a drop-down list.
The context menu in the Document Browser contains even more coding options, which you can see
when you right-click into a marked text section:
Highlight coding
Code with a new code
Code highlighted
segment Code in-vivo
Recently used code
emoticode
Undo code
Codes that are assigned at this section will be listed.
All activated codes will be assigned.
Code with recently used code.
Create a new code and assign it to the highlighted segment.
Analyze your data 23
Analyze your data
Activating documents
Maybe you saw the option Only in activated documents earlier in the dialog window for the Lexical
search and asked yourself what that means. Activation is one of MAXQDA’s key concepts: it means
that you can select documents (and/or codes) for your analysis and then work only with the selected items. How does the activation work? This is very simple: in every document’s or document group’s
context menu you will see the option Activate right at the top. More experienced MAXQDA users
will simply click the light grey circle next to the document name or choose a keyboard shortcut to
activate documents: press the Ctrl (Windows) or cmd (Mac) and select the preferred document or document group.
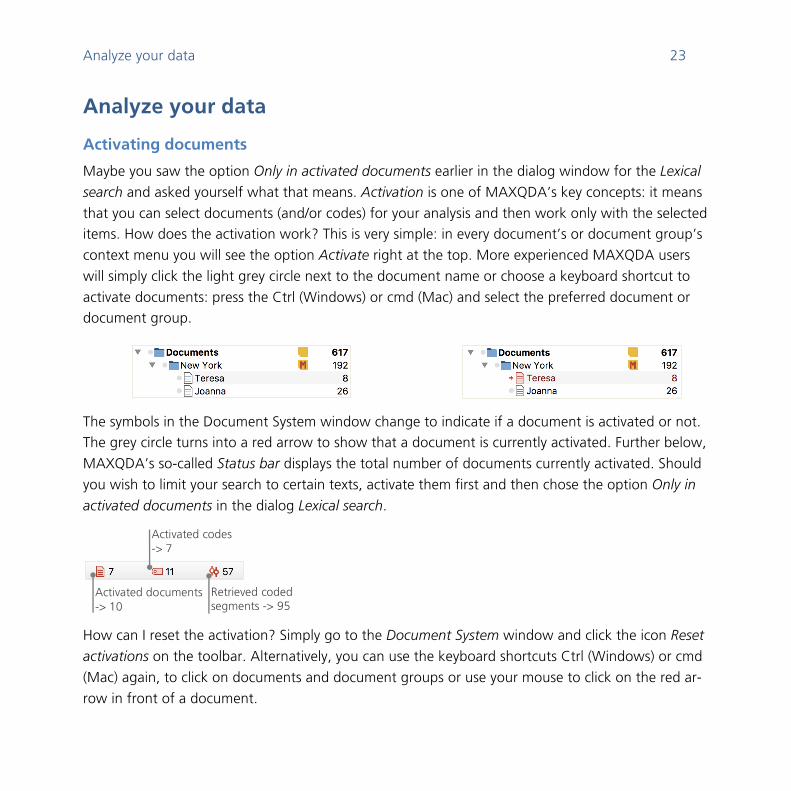
The symbols in the Document System window change to indicate if a document is activated or not. The grey circle turns into a red arrow to show that a document is currently activated. Further below,
MAXQDA’s so-called Status bar displays the total number of documents currently activated. Should
you wish to limit your search to certain texts, activate them first and then chose the option Only in
activated documents in the dialog Lexical search.
How can I reset the activation? Simply go to the Document System window and click the icon Reset
activations on the toolbar. Alternatively, you can use the keyboard shortcuts Ctrl (Windows) or cmd
(Mac) again, to click on documents and document groups or use your mouse to click on the red ar-
row in front of a document.
Activated documents -> 10
Activated codes -> 7
Retrieved coded segments -> 95
24 Retrieving all segments coded with one code
Retrieving all segments coded with one code
Coding isn’t everything and your analysis is certainly more than just coding. At one point you will
want to stop coding and start looking at the results of that process. The easiest way is to retrieve all
segments assigned to one specific code. If you, for example, do a research based on interviews, you
may ask: “What was said about a certain topic and who said what?” The magic word to get exactly those answers is Retrieval. In MAXQDA such a Coding Query works – similar to the Lexical search –
via activations.
Activate all documents that you want to include in the Coding Query, as well as those codes as-
signed to the segments you are interested in. Activation of codes works just like the activation of documents (right-click the code and choose the option Activate or press Ctrl (Windows) or cmd
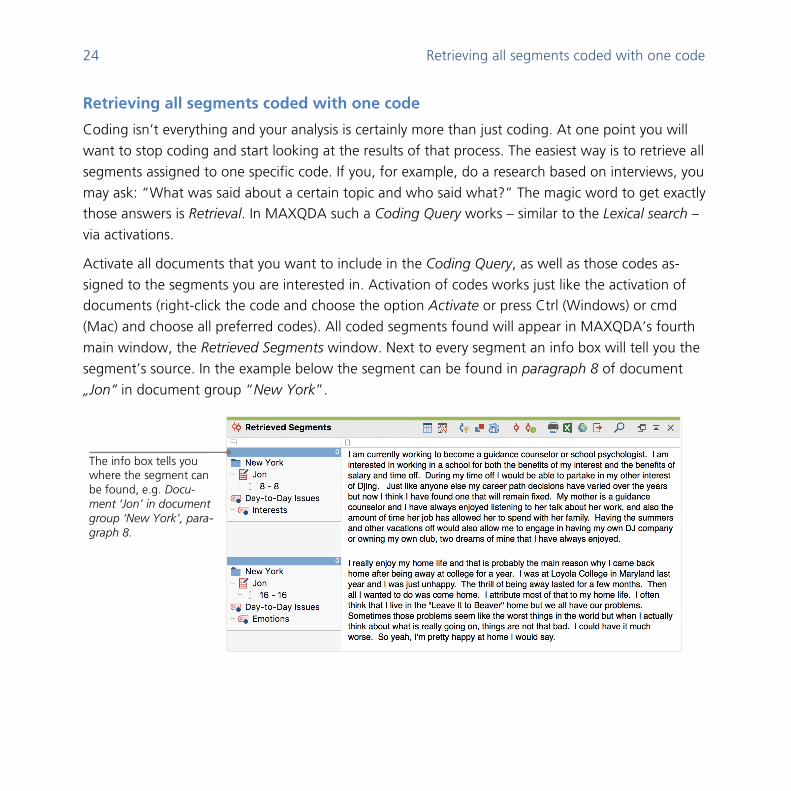
(Mac) and choose all preferred codes). All coded segments found will appear in MAXQDA’s fourth
main window, the Retrieved Segments window. Next to every segment an info box will tell you the
segment’s source. In the example below the segment can be found in paragraph 8 of document
„Jon“ in document group “New York”.
The info box tells you where the segment can be found, e.g. Docu-ment ‘Jon’ in document group ‘New York’, para-graph 8.
Analyze your data 25
The info box does not only tell you which document a certain segment is from, it also lets you go
directly to that document: click the info box, and the document will be loaded to the Document
Browser window with the coded segment right at hand, so that you can easily view it in its context.
Using visualizations
Visualizing results is one of MAXQDA’s strengths which is why we want to include this chapter in a
Getting Started Guide. There are several ways to visualize data in MAXQDA, starting with the possi-
bility to assign individual colors to codes and documents. This does not only help you with the visual
organization of your data, but colors can also be given certain meanings. MAXQDA is the first QDA software to allow the use of emojis as a code symbol. This may be particularly useful to overcome
language barriers, for example when working in international projects.
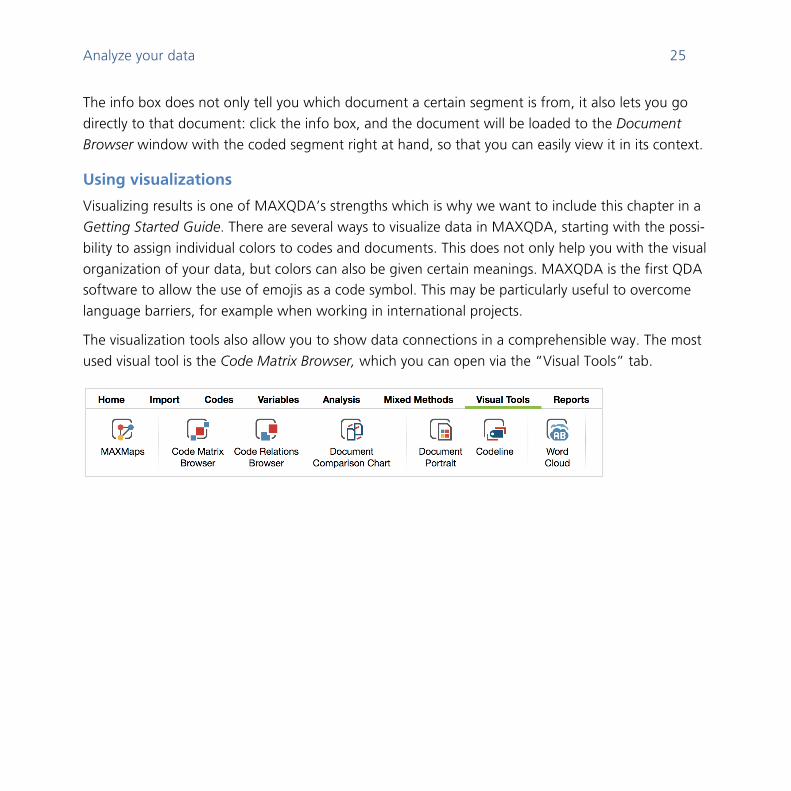
The visualization tools also allow you to show data connections in a comprehensible way. The most
used visual tool is the Code Matrix Browser, which you can open via the “Visual Tools” tab.
26 Using visualizations
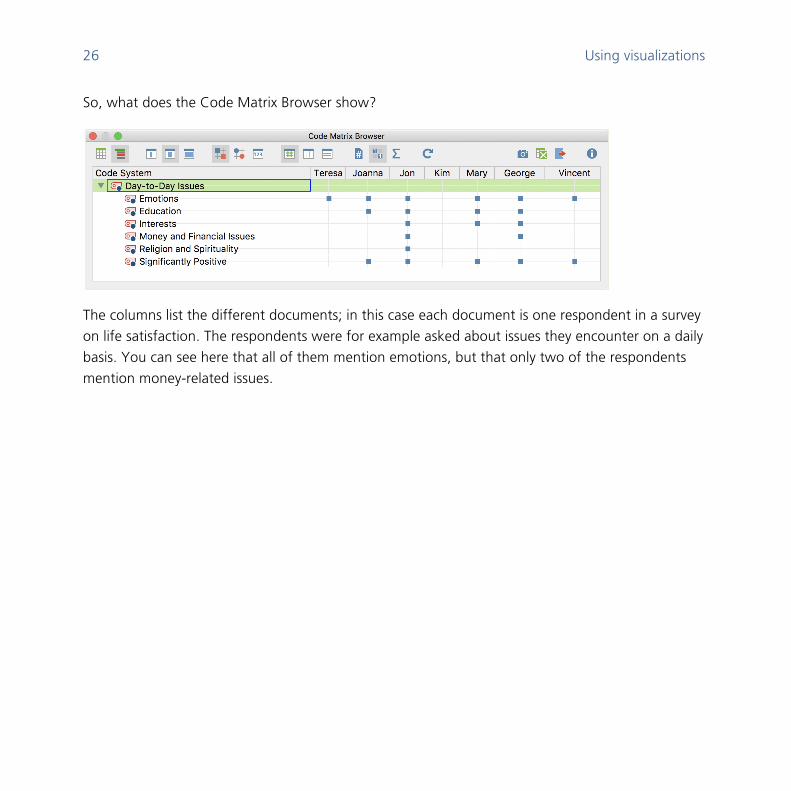
So, what does the Code Matrix Browser show?
The columns list the different documents; in this case each document is one respondent in a survey
on life satisfaction. The respondents were for example asked about issues they encounter on a daily
basis. You can see here that all of them mention emotions, but that only two of the respondents
mention money-related issues.
Conduct Mixed Methods analyses 27
Conduct Mixed Methods analyses
Defining document variables
One of the most important MAXQDA features is its support of Mixed Methods approaches. For eve-
ry document in the Document System a whole set of attributes (that is, variables as used by statistics
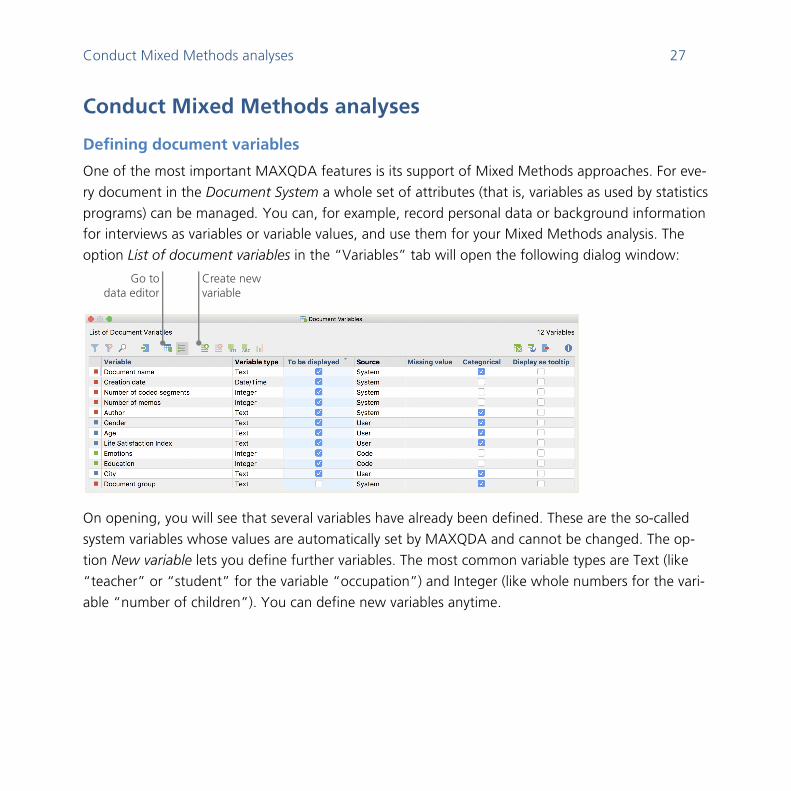
programs) can be managed. You can, for example, record personal data or background information for interviews as variables or variable values, and use them for your Mixed Methods analysis. The
option List of document variables in the “Variables” tab will open the following dialog window:
On opening, you will see that several variables have already been defined. These are the so-called
system variables whose values are automatically set by MAXQDA and cannot be changed. The op-
tion New variable lets you define further variables. The most common variable types are Text (like
“teacher” or “student” for the variable “occupation”) and Integer (like whole numbers for the vari-
able “number of children”). You can define new variables anytime.
Create new variable
Go to data editor
28 Entering variable values
Entering variable values
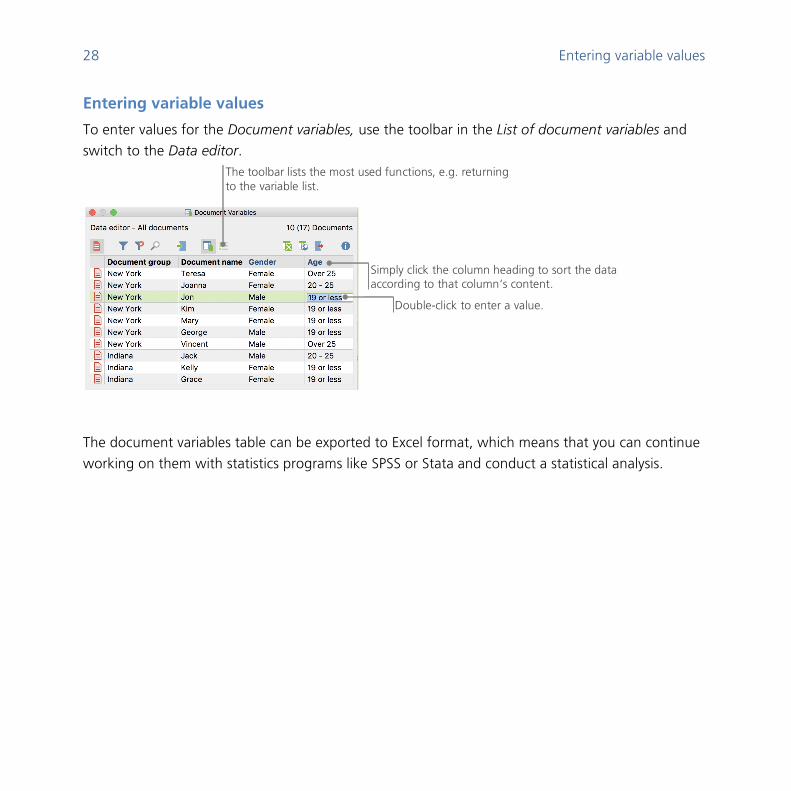
To enter values for the Document variables, use the toolbar in the List of document variables and
switch to the Data editor.
The document variables table can be exported to Excel format, which means that you can continue
working on them with statistics programs like SPSS or Stata and conduct a statistical analysis.
The toolbar lists the most used functions, e.g. returning to the variable list.
Simply click the column heading to sort the data according to that column’s content.
Double-click to enter a value.
Conduct Mixed Methods analyses 29
Transforming code frequencies into variables
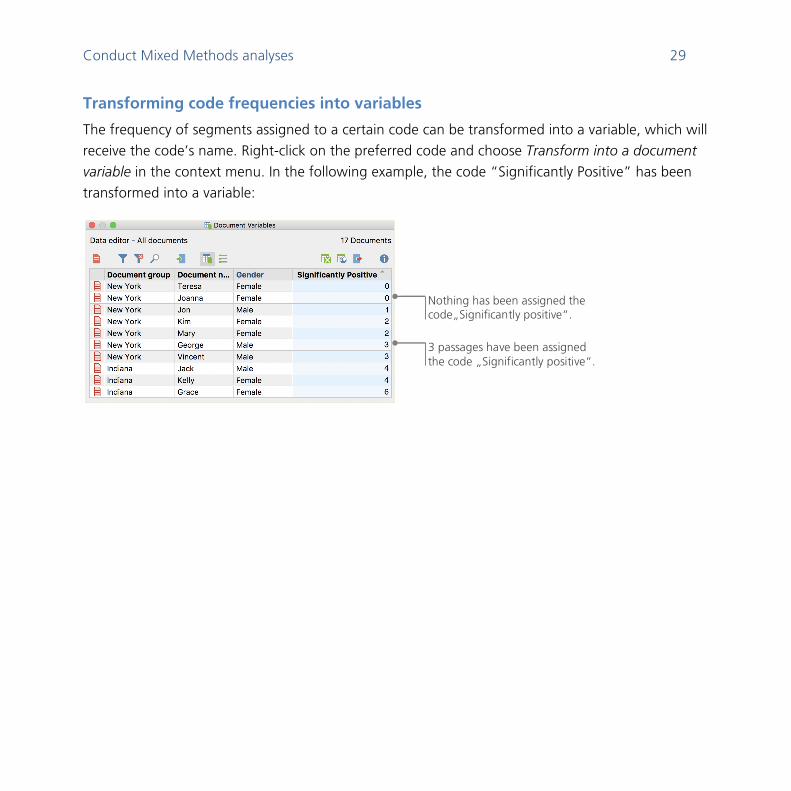
The frequency of segments assigned to a certain code can be transformed into a variable, which will
receive the code’s name. Right-click on the preferred code and choose Transform into a document
variable in the context menu. In the following example, the code “Significantly Positive” has been
transformed into a variable:
3 passages have been assigned the code „Significantly positive“.
Nothing has been assigned the code„Significantly positive“.
30 Using document variables in your analysis
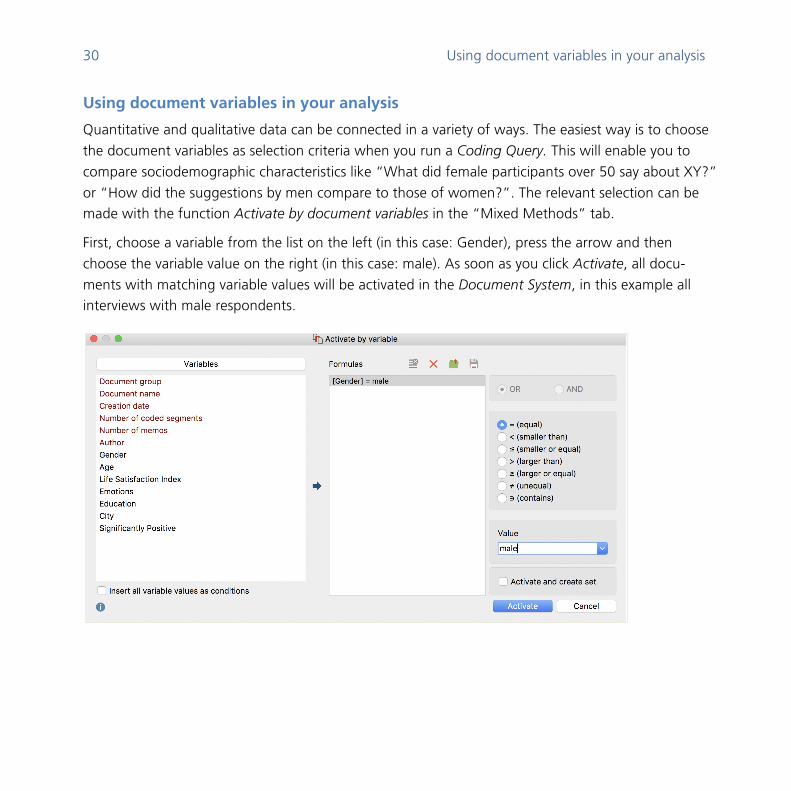
Using document variables in your analysis
Quantitative and qualitative data can be connected in a variety of ways. The easiest way is to choose
the document variables as selection criteria when you run a Coding Query. This will enable you to
compare sociodemographic characteristics like “What did female participants over 50 say about XY?”
or “How did the suggestions by men compare to those of women?”. The relevant selection can be made with the function Activate by document variables in the “Mixed Methods” tab.
First, choose a variable from the list on the left (in this case: Gender), press the arrow and then
choose the variable value on the right (in this case: male). As soon as you click Activate, all docu-
ments with matching variable values will be activated in the Document System, in this example all interviews with male respondents.
Further literature 31
Further literature
Charmaz, Kathy (2014). Constructing Grounded Theory. 2nd ed., San Francisco: SAGE Publications.
Corbin, Juliet; Strauss, Anselm (2015). Basics of Qualitative Research. Techniques and Procedures for Developing Grounded Theory. 4th ed., San Francisco: SAGE Publications.
Kuckartz, Udo (2014). Qualitative Text Analysis. A Guide to Methods, Practice and Using Software. London: SAGE Publications.
Kuckartz, Udo (2014). Mixed Methods. Methodologie, Forschungsdesigns und Analyseverfahren. Wiesbaden: Springer VS.
Kuckartz, Udo; Dresing, Thorsten; Rädiker, Stefan; Stefer, Claus (2008). Qualitative Evaluation. Der Einstieg in die Praxis. 2nd ed., Wiesbaden: VS Verlag für Sozialwissenschaften.
Richards, Lyn (2015). Handling Qualitative Data. A Practical Guide. 3rd ed., London: SAGE Publications.

32
Goodbye
We hope this Guide helped you get started with MAXQDA for literature reviews. Of course,
MAXQDA offers a whole range of further analysis functions and tools. To name a few examples,
you can:
v transcribe audio and video files
v import and analyse Twitter data
v analyse focus groups
v visualize data or results
v conduct a quantitative text analysis with MAXDictio
v generate reports and statistical frequency tables
You can find a wide range of resources on our website www.maxqda.com
v free introductory webinars
v online manual
v video tutorials
v list of upcoming workshops
v professional MAXQDA trainer database
v research blog, user forum, and more...
MQIC – MAXQDA International Conference
The annual MAXQDA International Conference brings together MAXQDA users from all over the
world in Berlin, Germany. The conference offers a rich programme that covers everything on
MAXQDA and Mixed Methods research. It’s a unique possibility for networking with other MAXQDA users or talking to the MAXQDA development team.