maximizing productivity and efficiency in...
TRANSCRIPT

MaximizingProductivity and Efficiency
in Contemporary Agriculturep y g
Paul E. FixenInternational Plant Nutrition Colloquium
Pl t t iti f t i bl d l t d l b l h lthPlant nutrition for sustainable development and global healthAugust 26-30, 2009

Scales within IPNC: nanometers to globalGenetics &
nanotechnology gnanotechnology
Global
Each step in up-scaling is critical to the nutritional, environmental, and economic challenges we face

Underlying factors for the challenges of the coming decadesthe coming decades
A significantA significant
Human i i
A significant A significant component of component of soils soils
& plant nutrition& plant nutrition• Food quantity
• Food quality
• Food cost nutrition
d
• Food cost
LandCarbon
• Land use
• Soil quality
• Water use & quality
• Climate change
• Cheap energy LandCarbon• Waste disposal
• Etc.
• Bioenergy
• Etc.
Soil OMCarbon and land concept by Henry Jansen, 2009

MaximizingMaximizingProductivity and Efficiency
in Contemporary Agriculture( )in Contemporary Agriculture
• Present the pursuit of high productivity and nutrient
Objectives:Objectives:p g p y
use efficiency as a singular goal … a global view
•Offer three concepts intended to facilitate cooperation p pwithin the diverse groups of the Colloquium

Goals or pillars of sustainability
• Food• Fiber
• Air quality• Water quality
• Fuel• Working conditions, etc.
• Biodiversity• Other ecosystem services
• Profitability• Risk• Cash flow• Credit, etc.
Sustainable nutrient management must support Sustainable nutrient management must support cropping systems that contribute to all three pillarscropping systems that contribute to all three pillars

A primary goal for plant nutrition science and practicescience and practice
To contribute all it can to improving:
Globalization has merged these two goals into one
•Global productivity• Resource use efficiency gy
• The strong global character of demand for agricultural products and many of the most critical environmental issues
– Improving efficiency without improving productivity increases pressure to produce more on other lands
d d– Squandering resources to maximize productivity puts more pressure on other lands to reduce environmental impact
Sustainably meeting this goal will require close cooperation across scales … disciplines … sectors … geographies

The need for improving global productivity
•• Millennium Project Millennium Project –– twice as much food in 30 yrs. twice as much food in 30 yrs.
•• World BankWorld Bank 50% more food by 2030; 85% more meat50% more food by 2030; 85% more meat
•• Millennium Project Millennium Project –– twice as much food in 30 yrs. twice as much food in 30 yrs.
•• World BankWorld Bank 50% more food by 2030; 85% more meat50% more food by 2030; 85% more meat•• World Bank World Bank –– 50% more food by 2030; 85% more meat.50% more food by 2030; 85% more meat.
•• Borlaug Borlaug –– a second Green Revolution desperately needed.a second Green Revolution desperately needed.
•• SSSASSSA –– Grand ChallengeGrand Challenge: to develop and extend information and: to develop and extend information and
•• World Bank World Bank –– 50% more food by 2030; 85% more meat.50% more food by 2030; 85% more meat.
•• Borlaug Borlaug –– a second Green Revolution desperately needed.a second Green Revolution desperately needed.
•• SSSASSSA –– Grand ChallengeGrand Challenge: to develop and extend information and: to develop and extend information and•• SSSA SSSA Grand ChallengeGrand Challenge: to develop and extend information and : to develop and extend information and technology needed to improve and maintain the technology needed to improve and maintain the productivity productivity and and sustainabilitysustainability of the global soil resource.of the global soil resource.
•• SSSA SSSA Grand ChallengeGrand Challenge: to develop and extend information and : to develop and extend information and technology needed to improve and maintain the technology needed to improve and maintain the productivity productivity and and sustainabilitysustainability of the global soil resource.of the global soil resource.
•• MonsantoMonsanto –– commitment by 2030 to develop seeds that can commitment by 2030 to develop seeds that can double yields and reduce by 1/3 the amount of key resources double yields and reduce by 1/3 the amount of key resources required;required; Robert Fraley (CTO) Sustainable Solutions for DoublingSustainable Solutions for Doubling
•• MonsantoMonsanto –– commitment by 2030 to develop seeds that can commitment by 2030 to develop seeds that can double yields and reduce by 1/3 the amount of key resources double yields and reduce by 1/3 the amount of key resources required;required; Robert Fraley (CTO) Sustainable Solutions for DoublingSustainable Solutions for Doublingrequired; required; Robert Fraley (CTO) Sustainable Solutions for Doubling Sustainable Solutions for Doubling Crop Productivity by 2030, 2010 AAAS Annual Mtg.Crop Productivity by 2030, 2010 AAAS Annual Mtg.
•• DupontDupont –– Pioneer will increase corn and soybean yields by 40% Pioneer will increase corn and soybean yields by 40%
required; required; Robert Fraley (CTO) Sustainable Solutions for Doubling Sustainable Solutions for Doubling Crop Productivity by 2030, 2010 AAAS Annual Mtg.Crop Productivity by 2030, 2010 AAAS Annual Mtg.
•• DupontDupont –– Pioneer will increase corn and soybean yields by 40% Pioneer will increase corn and soybean yields by 40% by 2018 (more than doubles current rate of gain).by 2018 (more than doubles current rate of gain).by 2018 (more than doubles current rate of gain).by 2018 (more than doubles current rate of gain).

Yield increase arithmetic … annual proportional increasesincreases
Year 2.425% 1.78% 1.3%1 (2007) 100 0 100 0 100 01 (2007) 100.0 100.0 100.02 (2008) 102.4 101.8 101.35 (2011) 110 107 1055 (2011) 110 107 105
10 (2016) 124 117 11220 (2026) 158 140 12820 (2026) 158 140 12824 (2030) 174 150 13530 (2036) 200 167 145( )
Doubled in 30 yrs
World cereal yield proportional
50% by 2030y p p
increase for 2007

Global cereal yield trends, 1961-2007
y = 63.71x ‐ 123011
5500MaizeRice
Maize
Slope as % of 2007 trend yield
1 3%yr² = 0.964500
ha
RiceWheat
1.3%1.2%
y = 52.59x ‐ 101266r² = 0.98
3500
yield, kg/h
Rice
1.3%
y = 40.66x ‐ 78584r² = 0.97
2500
Grain y
Wheat
500
1500
500
1960 1965 1970 1975 1980 1985 1990 1995 2000 2005
Data source: FAO, 2009.

30-year projections of world maize yieldsA l
95002.4%
Doubling in 30 yrs
Annual increase
7500
8500
a 1.3%1.8%
Doubling in 30 yrs
y = 63.71x ‐ 123011²4500
5500
6500
yield, kg/h
Historical
r² = 0.96
2500
3500
4500
Grain y
500
1500
500Bending yield lines upward will require Bending yield lines upward will require multidisciplinary, multimultidisciplinary, multi--sector cooperationsector cooperation
1960 1970 1980 1990 2000 2010 2020 2030 2040

Grain yield per hybrid regressed on year of hybrid release for three plant densities.y p
Hammer et al., 2009.
As in the past future yield increases will not likely be solely due to geneticAs in the past, future yield increases will not likely be solely due to genetic improvement, but due to changes in several interactinginteracting factors, including
nutrient managementnutrient management.

As yields climb …
• More nutrients are contained in removed crop
• Potentially more nutrients necessary to replace those removedy y p– More nutrients at risk of being lost to the environment
• The challenge of increasing productivity and NUE increases– Development and adoption of nutrient BMPs becomes more important
– Adoption of efficiency enhancing technologies plays a larger role

Determining nutrient use efficiency
• Dobermann (2007)
Numerous methods and expressions varying in meaning– Numerous methods and expressions , varying in meaning
– Single year recovery efficiency for N in farmer’s fields often < 40% for major crops of the worldj p
– Best managers at much higher efficiencies
• NUE terms not always easy to interpret
– Especially in high yield systems

N use efficiency in a long-term experiment with irrigated continuous maize managed at recommended and gintensive levels of plant density and fertilization.
2000-2005, Lincoln, Nebraska Recommended Intensive2000 2005, Lincoln, Nebraska Recommended IntensiveAverage maize yield, t/ha/yr 14.0 15.0Fertilizer N input, kg N/ha 1005 1495N removal with grain, kg N/ha 880 970Measured change in total soil N, kg/ha 139 404N unaccounted for kg/ha 14 121N unaccounted for, kg/ha 14 121NUE 1: partial factor prod.,kg grain/kg N applied 70 50NUE 2: kg grain N/kg N applied 0.88 0.65NUE 3: kg grain N+change in soil N/kg N applied
1.01 0.92
System level N
Dobermann, 2007.
yefficiencies were similar

Influence of soil fertility on agronomic efficiency of P fertilizer in wheat experiments in Argentina
d P 28% 128% 1stst yr yr
recoveryrecovery
appl
ied recoveryrecovery
Highest agronomic & recovery* efficiencies by
eat/k
g a Highest agronomic & recovery efficiencies by
difference method are at very low soil fertility levels.
Kg
whe
Near 0% Near 0% recoveryrecoveryK recoveryrecovery*By difference method
Garcia, 2004.

Recovery efficiency by balance method for P or K
• Balance method: nutrient removed by crop/nutrient applied
Same as the removal to use ratio under the condition of soil– Same as the removal to use ratio under the condition of soil fertility maintenance
• Global review by Syers, Johnston and Curtin (2008).y y , ( )
– When soils are maintained near the critical level for crop yield, the efficiency of fertilizer P use frequently exceeds 90%.

Inputs and outputs of N & P by managed pathways.
Nutrient balances by region (kg/ha/yr)
Western Kenya North China Midwest U.S. (low input corn‐based)
(wheat/corndouble crop)
(corn/soy‐bean)
Inputs and outputs N P N P N P
Fertilizer 7 8 588 92 93 14
Biological N fixation 62
Total agronomic inputs 7 8 588 92 155 14g p
Removal in grain and/or beans 23 4 361 39 145 23
Removal in other harvested products 36 3
T t l i t t 59 7 361 39 145 23
Removal to use ratio (partial nutrient 1.640.948.4 0.88 0.61 0.42
Total agronomic outputs 59 7 361 39 145 23
Agronomic inputs minus harvest removals ‐52 +1 +227 +53 +10 ‐9
Vitousek et al. (Science, 2009).
balance or recovery by balance method)

A primary goal of plant nutrition science and practice: To contribute all it can to improvingpractice: To contribute all it can to improving
productivity and resource use efficiency
Sustainably meeting this goal will require close cooperation across scales … disciplines … sectors … geographies
Three concepts for facilitating this interactionThree concepts for facilitating this interaction • The 4R Nutrient Stewardship Framework• Mainstreaming of crop simulation models• Global data networks

4R Nutrient Stewardship
Cropping System
System durability
pp g yObjectives
Healthy environmentdurability environment
ProductivityProfitability
BMPs are the in-fieldBMPs are the in field manifestation of the 4Rs
Right Source Right Source at Right Rate, Right Time, Right PlaceRight Rate, Right Time, Right Place

The basic scientific principles of nutrient management are universalmanagement are universal
1. Supply in plant available forms2. Suit soil properties3. Recognize synergisms among
1. Appropriately assess soil nutrient supply
2 Assess all availableelements4. Blend compatibility
2. Assess all available indigenous nutrient sources
3. Assess plant demand4. Predict fertilizer use efficiency
1. Assess timing of crop uptake2. Assess dynamics of soil nutrient
supply3 Recognize timing of weather
1. Recognize root-soil dynamics2. Manage spatial variability3. Fit needs of tillage system4. Limit potential off-field3. Recognize timing of weather
factors4. Evaluate logistics of operations
4. Limit potential off field transport

Nutrient
Nutrient loss
Biodiversity
Performance indicators
Stakeholder input
Cropping System
Nutrient balance
Yield Soil erosion
Biodiversity
System durability
Healthy environment
pp g yObjectivesResource Energy
use Laboreffic‐ Nutrient
Ecosystem services
durability environmentiencies: Water Water & air quality
Working conditionsQuality
ProductivityProfitability
Net profit Yield
Farm income
Individuals working on the “parts” Individuals working on the “parts” profit
Return on investment
stability
Soil productivity
g pg premain cognizant of the “whole.”remain cognizant of the “whole.”
Adoption
Right Source Right Source at Right Rate, Right Time, Right PlaceRight Rate, Right Time, Right Place

An example
Yield lossLower water use efficiencySoil erosionSoil erosion

The primary goal of plant nutrition science and practice: To contribute all it can to improvingpractice: To contribute all it can to improving
productivity and resource use efficiency
Sustainably meeting this goal will require close cooperation across scales … disciplines … sectors … geographies
Three concepts for facilitating this interactionThree concepts for facilitating this interaction • The 4R Nutrient Stewardship Framework• Mainstreaming of crop simulation models• Global data networks

Potential for yield increase for cornFAO, 2008
State of Food and Agriculture, p 62.

Long-term average corn yields in the Nebraska ecological intensification studyecological intensification study
Cont. corn Corn/soybeanMg/ha
Lancaster County irrigated farmer avg 10.6University recommendation 14 0 14 7
2000-2005.
University recommendation 14.0 14.7Intensive high yield management 15.0 15.6
Experimental data from Dobermann et al., 2007.
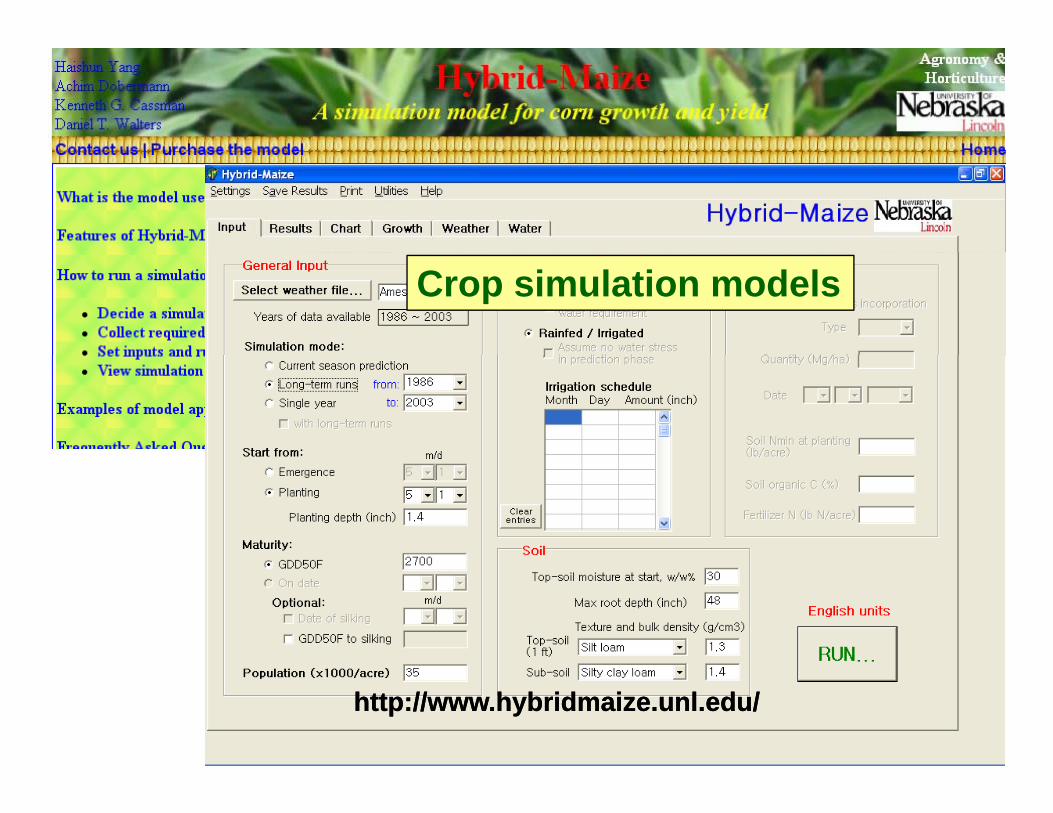
Crop simulation models
http://www.hybridmaize.unl.edu/http://www.hybridmaize.unl.edu/
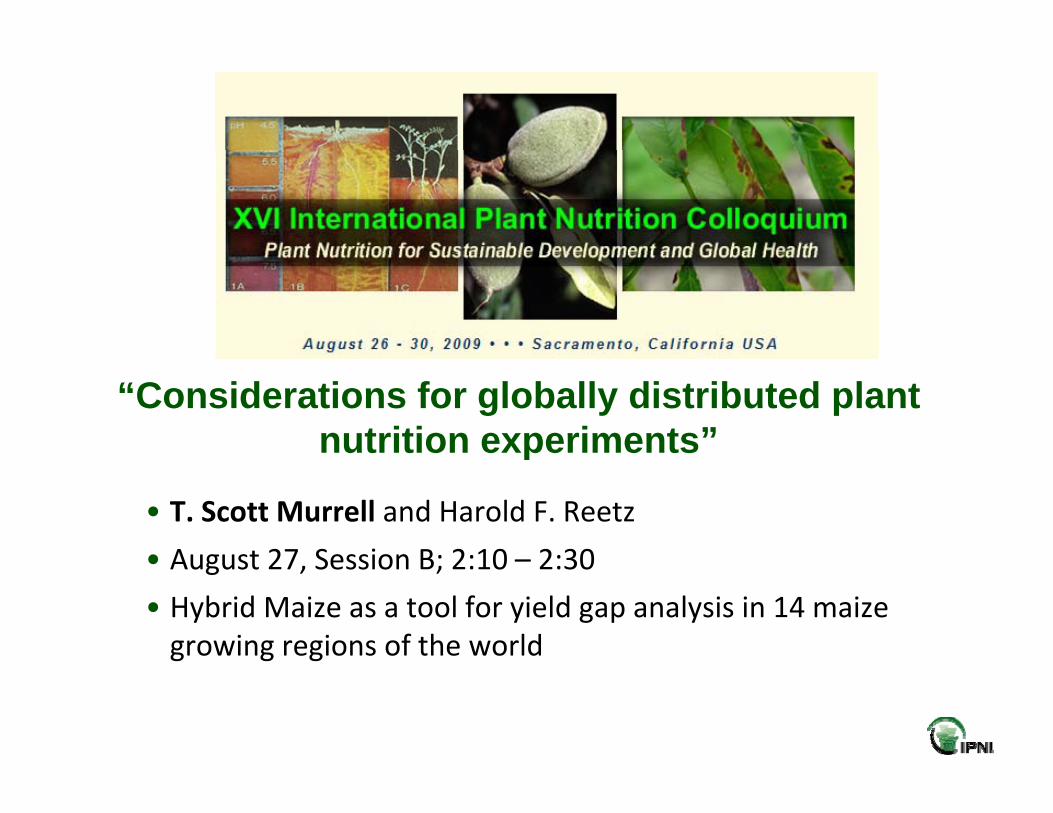
“Considerations for globally distributed plant nutrition experiments”p
• T. Scott Murrell and Harold F. Reetz
• August 27 Session B; 2:10 – 2:30• August 27, Session B; 2:10 – 2:30
• Hybrid Maize as a tool for yield gap analysis in 14 maize growing regions of the world

Climate change
• “The end of climate stationarity requires organized, data‐based decision support for climate‐sensitive decisions.” National Research Council, 2009.
• Numerous implications of climate change• Numerous implications of climate change on plant nutrition – Brouder & Volenic, 2008.

The primary goal of plant nutrition science and practice: To contribute all it can to improvingpractice: To contribute all it can to improving
productivity and resource use efficiency
Sustainably meeting this goal will require close cooperation across scales … disciplines … sectors … geographies
Three concepts for facilitating this interactionThree concepts for facilitating this interaction • The 4R Nutrient Stewardship Framework• Mainstreaming of crop simulation models• Global data networks

International Assessment of Agricultural Knowledge, Science and TechnologyKnowledge, Science and Technology
Development (IAASTD) - Synthesis Report, 2009Co-sponsored by several UN organizations, World Bank, WHO
“The main challenge … is to increase the productivity of agriculture in a sustainable manner.”
Two of six high priority natural resource management options for action:
• Develop networks of knowledge, science and technology practitioners … for the collective good.
• Connect globalization and localization pathways that link• Connect globalization and localization pathways that link locally generated knowledge and innovations to public and private agriculture knowledge, science and technology.

AAAS 2008 Annual Meeting Plenary Lecture by
Dr. Nina Fedoroff (USAID):
With respect to increasing productivity of the land …
“Research universities and institutes, working together with the business sector and using contemporary electronic resources, have a unique opportunity to accelerate the “flattening” of the world.”

Eras of globalization (Friedman)• Globalization 1.0: 1492‐1800
– Change agent: countries and muscleg g
• Globalization 2.0: 1800‐2000
– Change agent: multinational companies
• Globalization 3.0: Current
– Change agent: individuals with power to collaborate & compute globally; enabled by fiber optics & software
– Allows a soil testing lab in the Midwest U.S. to do its data management & programming in Bangaloremanagement & programming in Bangalore
••opportunity to flatten the world of plant nutritionopportunity to flatten the world of plant nutrition••opportunity to flatten the world of plant nutrition opportunity to flatten the world of plant nutrition research research

Concept from Purdue AgronomyConcept from Purdue Agronomy
Provides web access to the tools scientists need to collaborate on modeling, research, and educational efforts.

Could develop data management processes that reach across large geographic scalesreach across large geographic scales
The data set as a legitimate product of discovery … the item “on the library shelf”
HarvestPlusHarvestPlus ZnZn
The National Academy of Sciences: Researchers have a responsibility to devise ways to share their data in the best ways possible - repositories of astronomical images protein sequences archaeological data cell
Murrell, 2008
of astronomical images, protein sequences, archaeological data, cell lines, reagents, transgenic animals, etc.

Int’l ZincAssoc. Belgium
MosaicUSA
K+S KALI Int’l Fertilizer
OMEX Agrifluids
K+S KALIGermany
Int l FertilizerInd. Assoc.France
Int’l Plant NutrC di ti I tit tiOMEX AgrifluidsEngland
Int’l Plant Nutr.Inst. USA
Coordinating Institution
CHINAINDIA THAILANDPAKISTAN
Collaborating Countries/Institutions
CHINACAU: China
Agric. University
INDIAIARI: Indian
Agric. Res. Inst.
THAILANDChiang Mai University
PAKISTANNARC: Nat.
Agric. Res. Cen.
TURKEYMinistry of Agriculture
MOZAMBIQUEIIAM: Inst Inv Agr
Moz
BRAZILAPTA:Agência
Paulista Tec Agr.
ZIMBABWESOFECSA
Zimbabwe Univ.

• National Ecological Observatory Network
• A continental scale research platform
• “Ecologists will use a distributed network of sensors linked by advanced cyber infrastructure to predict responses of theadvanced cyber infrastructure to predict responses of the biosphere to changes in land use, invasive species, and climate over the next 30 to 50 years30 to 50 years.” … the ecologists’ Hubble TelescopeHubble Telescope
• Funded by NSF ($25 million initially); 60 sites across the U.S.
• “…will contribute data sets to encourage “best practices” to solve i t l h ll ”environmental challenges …”
• Planning took a decade; hundreds of ecologists collaborating
Lowman et al. 2009. Science 323:1172-1173.
Is there a NEON, a Hubble Telescope, for plant nutrition? Is there a NEON, a Hubble Telescope, for plant nutrition?

Summary
• Our single most important challenge: to contribute all we can to improving global productivity while increasing resource p g g p y guse efficiency
• Recognize the close cooperation and understanding meeting thi h ll ill d dthis challenge will demand …
– Among scales, disciplines, geographies and sectors
Across a decade rather than a few years– Across a decade rather than a few years
• Consider concepts to facilitate our interaction
– The 4R Nutrient Stewardship FrameworkThe 4R Nutrient Stewardship Framework
– Mainstreaming of simulation models
– Global data networks