maximizing benefits from ftas in asean
TRANSCRIPT

Chapter 11
Maximizing Benefits from FTAs in ASEAN
Daisue Hiratsuka
Institute of Developing Economies, Japan External Trade Organization
Kazunobu Hayakawa
Institute of Developing Economies, Japan External Trade Organization
Kohei Shino
Overseas Research Department, Japan External Trade Organization
Seiya Sukegawa
Overseas Research Department, Japan External Trade Organization
March 2009
This chapter should be cited as
Hiratsuka, D., K. Hayakawa, K. Shino and S. Sukegawa (2009), ‘Maximizing Benefits
from FTAs in ASEAN’, in Corbett, J. and S. Umezaki (eds.), Deepening East Asian
Economic Integration. ERIA Research Project Report 2008-1, pp.407-545. Jakarta:
ERIA.

407
CHAPTER 11
Maximizing Benefits from FTAs in ASEAN
DAISUKE HIRATSUKA
KAZUNOBU HAYAKAWA Institute of Developing Economies, Japan External Trade Organization
KOHEI SHIINO SEIYA SUKEGAWA
Overseas Research Department, Japan External Trade Organization
FTA has proliferated in East Asia. Currently, there are more than thirty RTAs enforced
involving East Asia, of which fourteen are intra-regional RTAs. However, we do not know how
intensively Asian FTAs are actually utilized. The regionalism in the ASEAN+6 region is
consolidating the hub-and-spoke FTA structure with ASEAN as the hub and other East Asian
countries as the spokes. The spaghetti bowl problem may not be serious since the
hub-and-spoke FTA structure can be viewed as a trade agreement matrix. However, the
utilization rates of FTAs may seem rather low in East Asia. The paper investigated the reasons
of it by using the econometric analysis. We obtained the results that FTAs are selectively
utilized: textile and automobile are well utilized while electronics and electrical machinery not.
We find also that the larger the firms’ scale, the more likely they would be to utilize FTA
schemes. Lastly, and equally importantly, firms in the Philippines and Vietnam are less likely
to utilize FTA schemes. Thus, these estimated results might suggest that the operational
procedures to obtain certificates are cumbersome, in particular, in those countries, and that
East Asia has to improve the operational procedures in order to maximize the benefits of FTAs.
408
1. Introduction
FTA has proliferated in East Asia. Currently, in fact, there are more than thirty
RTAs enforced involving East Asia, of which fourteen are intra-regional RTAs, either
bilateral agreements or plurilateral agreements. There are numerous ex ante studies on
the impacts of FTAs which use the computable general equilibrium (CGE) models.
Assuming that any firm can maximize profits and completely utilize FTAs under perfect
information, those studies predict that FTAs substantially increase welfare and income
(Harrigan et al, 2006, and Kawai and Wignaraja, 2007). However, we do not know
how intensively Asian FTAs are actually utilized. Hiratsuka et al. (2008 and 2009)
pointed out that Japanese firms and their affiliates operating in ASEAN are not very
familiar with FTAs, and that the operational procedures to meet the conditions of the
rules of origin (ROOs) are cumbersome, and concluded that high administrative costs to
obtain certificate of origin impedes the utilization of FTAs.
In addition, ROOs, operational procedures to obtain certificate of origin, sensitive
lists that are excluded from tariff elimination schedule, and phase-out tariff elimination
schedules differ by FTA in East Asia. Preferential tariffs, therefore, vary by product
and by FTA. This raises a concern about the overlapping FTA problem or the so-called
spaghetti bowl problem that administrative costs that firms which utilize FTAs would be
high, and as a result, some FTAs are utilized but some are not.
In August 2008, ASEAN revised the ROO system from the 40% value content rule
to the option system of value content rules and change of tariff line. The new system
is expected to increase the utilization of AFTA. The AEC blueprint, which presents the
schedule to realize the ASEAN Economic Community (AEC), ASEAN reviewed all the
409
ROOs implemented by ASEAN member countries, individually and collectively, and
explored possible better mechanisms.
At the onset of the proliferation in East Asia, it is a critical task to evaluate the
existing FTAs, and suggest the best practices of FTAs to maximize benefits to the
region. With the aim of suggesting the best practice of the ASEAN CEPT ROOs and
the other East Asia’ FTA ROOs, this study will identify the revealed and potential
problems of existing bilateral and plurilateral FTAs involving ASEAN and explore best
practices to facilitate trade in the region.
2. Proliferation of FTAs in East Asia
2.1. The ASEAN hub- and others-spoke Structure
ASEAN has led regionalism in East Asia. ASEAN Free Trade Area (AFTA) will
eliminate import duties on all products placed on normal track to be 0% and tariffs on
products placed in sensitive lists to be 0-5% by 2010 for ASEAN-6 (Brunei, Indonesia,
Malaysia, the Philippines, Singapore and Thailand). On the other hand, the new
member countries of Cambodia, Laos, Myanmar and Vietnam will eliminate tariffs on
normal track to be 0% by 2015, and tariffs on products placed in sensitive lists to be
0-5% by 2013 for Vietnam, by 2015 for Laos and Myanmar, and by 2017 for Cambodia.
It should also be noted that the regionalism in the ASEAN+6 region is consolidating
the hub-and-spoke FTA structure with ASEAN as the hub and other East Asian
countries as the spokes. Tariffs between ASEAN-6 and China, and between ASEAN-6
and Korea, will be eliminated to be 0% on products placed on the normal track in the
410
ASEAN-China FTA and ASEAH-Korea FTA respectively. Furthermore, the
ASEAN-Japan FTA has been partially implemented since December 2008, and the
ASEAN-CER (Australia and New Zealand) FTA will be enforced in 2009. The
ASEAN-hub FTA networks are expanding rapidly in East Asia. Currently, in total,
five ASEAN+1 FTAs are enforced or are under negotiation.
In contrast, East Asia’s region-wide FTAs are still at a phase of conceptualization.
In the ASEAN+3 process, the East Asia Study Group (EASG) proposed the East Asian
Free Trade Area (EAFTA) as one of the nine long-term measures proposed at the eighth
ASEAN+3 Summit in November 2004. A feasibility study on the proposed EAFTA
conducted by a Track Two study (an academic expert group study) chaired by a Chinese
national was presented in brief at the 2006 ASEAN+3 Economic Minister Meeting.
The ASEAN ministers, however, insisted on the necessity of expeditiously concluding
ASEAN-plus-one FTAs before concluding an EAFTA. The ASEAN+3 Summit in
January 2007 welcomed South Korea's proposal to conduct a Phase II EAFTA study
focusing on a sector-by-sector analysis, and on the other hand, the summit leaders
decided to examine other possible FTAs, such as the Comprehensive Economic
Partnership in East Asia (CEPEA) to cover the ASEAN+6 countries, proposed by Japan.
The EAS in January 2007 agreed to launch a Track Two study on CEPEA and requested
the ASEAN Secretariat to prepare a time frame for the study. Study group meetings on
CEPEA have already been held several times with Japan as chair, and participants have
been assigned to report on issues related to CEPEA. At the strong request of ASEAN,
the ASEAN-hub and six-countries-spoke FTAs are progressing before the region-wide
FTAs such as EAFTA and CEPEA.

411
2.2. Spaghetti Bowl Phenomenon
The proliferation of FTAs in East Asia might have caused a spaghetti bowl
phenomenon. As of December 2008, AFTA, ASEAN-China FTA, ASEAN-Korea
FTA, and ASEAN-Japan FTA have become effective, and ASEAN-CER (Australia and
New Zealand) will be implemented in 2009. Each FTA sets several tariff levels such
as a 0% tariff, 0%-5% tariff, 50% tariff and so on. Each FTA has a different phase-out
tariff elimination schedule. ROOs vary by products and by FTA. Kawai and
Wignaraja (2007) showed the different ROOs applied on automobile and auto parts.
Consequently, exporters are faced with different tariffs, phase-out schedules and ROOs
on a product depending on the destination.
Baldwin (2008) pointed out that the degree of market access available to an AFTA
exporter of any particular product varies according to the ASEAN destination market
concerned, meaning AFTA is not a single FTA but is composed of 45 (10×9÷2=45)
bilateral FTAs (see Figure 1)1. This means that one ASEAN+1 FTA creates 55
(11×10÷2) bilateral FTAs, since each member can freely offer FTA preferential tariffs
on a product. Three ASEAN+1 FTAs have been forced so far: ASEAN-China,
ASEAN-Korea, and ASEAN-Japan. These three ASEAN+1 FTAs mean 165
(3×11×10÷2) bilateral FTAs. In addition, ASEAN-CER FTA was signed in February
2009, which creates 66 (12×11÷2) bilateral FTAs since it is composed of twelve
countries. If regional-wide FTAs are realized, the number of bilateral FTAs in the
region will increase further. The ASEAN +3 FTA potentially creates 78 different
bilateral FTAs (13×12÷2), and ASEAN+6 produces 120 different bilateral FTAs (16
1 AFTA is composed of ten member countries. Each of the ten members freely places sensitive lists with nine partners. This includes the same match, i.e., Singapore –Thailand and Thailand-Singapore. So, ten member countries can generate forty-five (10×9÷2=45) cases.

412
×15÷2). After all, East Asia potentially creates 474 bilateral FTAs. This complexity
has been created by the system that each country can freely place strategic products on
sensitive lists. So, as long as each country can freely set tariffs on products, the
complex situation caused by the proliferation of FTAs will be serious.
Figure 1. Spaghetti/Noodle Bowl Syndrome
Source: Baldwin (2008).
Will the overlapping FTAs in East Asia really cause complexity for firms? Petri
(2008) doubted such a view raised by Baldwin (2008) and argued that the complexly
intertwined FTAs should be viewed as a trade agreement matrix. In fact, exporters in
ASEAN use AFTA when they export within the region, but do not use other
ASEAN-related plurilateral FTAs such as ASEAN-China FTA and ASEAN-Japan FTA.
KoreaJapan
China
Thailand
Malaysia
Indonesia
Philippines
Noodle bowl syndrome
Myanmar
Vietnam
Cambodia
Laos
Singapore Brunei
HK

413
They use ASEAN-China FTA when exporting to China. However, it is possible that
one FTA may lessen the effects of other FTAs.
2.3. Evaluation of East Asia’s FTA
Kawai and Wignaraja (2007) undertook the CGE analysis by using a variant of the
GTAP model. The model is characterized by an input-output structure that captures
the linkages by modeling firms’ use of factors and intermediate inputs. They estimated
the impacts of the five East Asian FTA scenarios: (1) ASEAN+China FTA; (2)
ASEAN+Korea FTA; (3) ASEAN+Japan FTA; (4) ASEAN+3 (free trade among the 10
ASEAN members, China, Japan and Korea) FTA; and (5) ASEAN+6 FTA scenario (free
trade among the 10 ASEAN members, PRC, Japan, Korea, India, Australia and New
Zealand). The two East Asia-wide FTA scenarios—ASEAN+3 FTA and ASEAN+6
FTA offer larger gains to world income than any of the three ASEAN+1 FTA scenarios.
ASEAN+6 generates larger impacts than ASEAN+3: 0.45% and 0.54% on world
income, and 5.23% and 5.66% on ASEAN income.
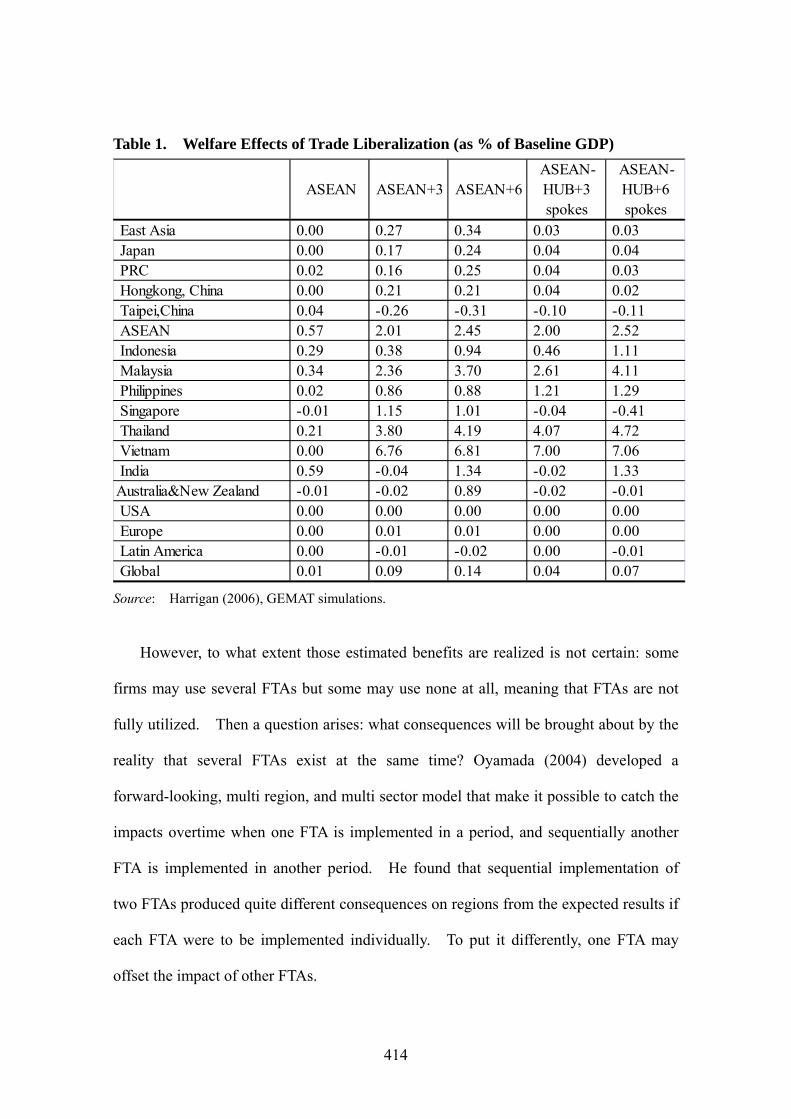
Harrigan et al. (2006) evaluated East Asia’s FTAs such as AFTA, ASEAN+3,
ASEAN+6, the ASEAN-hub+3 spokes (China, Japan and Korea), and the ASEAN-hub+
6 spokes (ASEAN FTA plus PRC, Japan, Korea, India, Australia, and New Zealand).
The results show that region-wide FTAs, such as the ASEAN+3 FTA (liberalization
among +3 countries) or the ASEAN+6 FTA (liberalization among +3 countries), are
likely to generate greater benefits for global economies than other FTAs (Table 1).
Looking at the impact by country, the consequences differ. They predict that ASEAN
can reap a larger benefit from the ASEAN-hub+6 spokes than the ASEAN+6 FTA
although the difference is very small.
414
Table 1. Welfare Effects of Trade Liberalization (as % of Baseline GDP)
ASEAN ASEAN+3 ASEAN+6 ASEAN-HUB+3spokes
ASEAN-HUB+6spokes
East Asia 0.00 0.27 0.34 0.03 0.03 Japan 0.00 0.17 0.24 0.04 0.04 PRC 0.02 0.16 0.25 0.04 0.03 Hongkong, China 0.00 0.21 0.21 0.04 0.02 Taipei,China 0.04 -0.26 -0.31 -0.10 -0.11 ASEAN 0.57 2.01 2.45 2.00 2.52 Indonesia 0.29 0.38 0.94 0.46 1.11 Malaysia 0.34 2.36 3.70 2.61 4.11 Philippines 0.02 0.86 0.88 1.21 1.29 Singapore -0.01 1.15 1.01 -0.04 -0.41 Thailand 0.21 3.80 4.19 4.07 4.72 Vietnam 0.00 6.76 6.81 7.00 7.06 India 0.59 -0.04 1.34 -0.02 1.33Australia&New Zealand -0.01 -0.02 0.89 -0.02 -0.01 USA 0.00 0.00 0.00 0.00 0.00 Europe 0.00 0.01 0.01 0.00 0.00 Latin America 0.00 -0.01 -0.02 0.00 -0.01 Global 0.01 0.09 0.14 0.04 0.07 Source: Harrigan (2006), GEMAT simulations.
However, to what extent those estimated benefits are realized is not certain: some
firms may use several FTAs but some may use none at all, meaning that FTAs are not
fully utilized. Then a question arises: what consequences will be brought about by the
reality that several FTAs exist at the same time? Oyamada (2004) developed a
forward-looking, multi region, and multi sector model that make it possible to catch the
impacts overtime when one FTA is implemented in a period, and sequentially another
FTA is implemented in another period. He found that sequential implementation of
two FTAs produced quite different consequences on regions from the expected results if
each FTA were to be implemented individually. To put it differently, one FTA may
offset the impact of other FTAs.

415
3. The Utilization of FTA by Custom Clearance Base
So, how intensively FTAs involving East Asia is utilized is a great concern not only
to academicians but also to policy makers. How intensively FTAs are utilized can be
measured by the utilization rates of custom recorded FTA utilized export (import) value
to total export (import) value on a product by HS code. These records can be collected
by the custom offices. However, due to the custom trade data collection software
systems in East Asia have not been arranged to collect information on the FTA
preferential trade, except in Malaysia and Thailand. Thailand and Malaysia have
released the values of their trade utilizing FTAs, and these values are basic data for
evaluating the status of FTA utilization in Asia. The total value of Thai exports taking
advantage of AFTA amounted to 30.9% of the total value of exports in 2007, while the
figure for Malaysia was 19.1%; these are the highest figures on record since 1998
(JETRO, 2008a). As for the ASEAN-China FTA, the value of Thai exports to China in
2007 that took advantage of preferential tariffs accounted for only 11.1% of the total.
Kohpaiboon (2008) analyzed administrative records for AFTA implementation of
Thai exporters for the period 2003-06. This allows us to undertake a systematic
analysis of AFTA utilization by Thai exporters. Transactions recorded in the
administrative records of AFTA implementation, which indicate the response of the
private sector to AFTA export creation. The utilization of AFTA (AFTAU) measured
by the ratio of administrative records to total export was low at around 15-20% during
the period 2003-06. The utilization rates on the import side were around 11-16 per
cent, lower than the rates corresponding to the export side. AFTAU observed from
both export and import sides are low by international standards. Kohpaiboon (2008)

416
concluded the AFTA utilization rates were lower than the performances of NAFTA: the
utilization rate of Mexican exports to the United States under NAFTA was at around 60
per cent in 2004-05. The utilization rate of Chilean exports to the United States was
around 55-56 per cent in 2005-06 (James, 2006).
4. JETRO Survey of Japanese-affiliate Firms in Asia
JETRO has carried out a survey of the state of Japanese affiliates operating in Asia
for 22 years since 1987. The study had been targeted on manufacturing companies at
first, but in the wake of the growth of the service sector, it started to include
non-manufacturing companies as well in 2008 (the 21st survey). The 22nd survey
conducted in 2009 was expanded from 7 countries consisting of ASEAN 6 (Indonesia,
Thailand, Malaysia, the Philippines, Singapore and Vietnam) and India to 13 countries
including Myanmar, Pakistan, Sri Lanka, Bangladesh, Australia and New Zealand.
While the WTO multinational negotiations toward trade liberalization are under difficult
conditions these days, Asia-Pacific countries/areas lay more emphasis on FTAs and
EPAs. To study the influence of this trend, the JETRO survey has added a question on
how manufacturing companies take advantages of them in the last 3 surveys. The last
survey results are summarized into “Survey of Japanese-Affiliated Firms in ASEAN,
India, and Oceania.” FY2008 Survey was conducted, from September 25th to October
31st, on 5107 Japanese affiliates operating in ASEAN7 (Indonesia, Malaysia, Myanmar,
the Philippines, Singapore, Thailand, Vietnam), Bangladesh, India, Pakistan, Sri Lanka,
Australia and New Zealand. Of these, 1852 valid responses came from the thirteen

417
countries, for the valid respondent rate, 36.3%. Among the 1852 respondents, 1354 are
in ASEAN 7, 235 are in South-East Asia, and 263 in Oceania (see Table 2).
Table 2. Number of Valid Respondents by JETRO Survey
Mfg. Non-Mfg Mfg. Non-Mfg
Total 830 40.1 1,051 637 414 40.3 1,852 944 908 36.3ASEAN Total 793 39.7 994 601 393 40.3 1,354 786 568 33.7
Indonesia 141 35.8 110 82 28 26.1 166 110 56 22.3Malaysia 134 55.8 247 145 102 45.6 180 108 72 52.0Myanmar - - - - - - 20 6 14 100.0Philippines 162 57.0 188 129 59 57.5 172 115 57 53.3Singapore 86 53.8 135 60 75 40.5 194 48 146 26.1Thailand 202 24.8 261 158 103 35.4 493 317 176 31.4Vietnam 68 67.3 53 27 26 49.1 129 82 47 46.6
SW Asia Total 37 50.0 57 36 21 41.3 235 107 128 50.5Bangladesh - - - - - - 35 18 17 42.7India 37 50.0 57 36 21 41.3 139 61 78 51.9Pakistan - - - - - - 32 13 19 68.1Sri Lanka - - - - - - 29 15 14 42.6
Oceania Total - - - - - - 263 51 212 42.4Australia - - - - - - 201 35 166 38.8New Zealand - - - - - - 62 16 46 60.8
ValidRespons
FY2006(11/27/06 -12/27/06)
FY2007(10/29/07 - 12/3/07)
FY2008(9/25/08 - 10/31/08)
ResponseValid
ResponsResponse
ValidRespons Response
Source: Survey of Japanese-Affiliated Firms in ASEAN, India, and Oceania
4.1. The Utilization Rates of FTA
FTA use by Japanese firms differs, depending on whether they are exporting or
importing. When exporters make use of FTAs, they must secure certificates of origin
(COO) certifying that goods were locally produced, for which they must prepare every
document that the investigating authorities require. The additional cost burden for
certificate issuance, personnel, and procedures is unavoidable, and the exporting
company must complete these procedures before the tariff reductions in question are
applied by the importing countries. In contrast, when importers take advantage of
418
FTA, they need only present the COO they have acquired from the exporter at customs.
Those who benefit from this arrangement are the importers, who formerly had to pay
tariffs. The exporters and those who produce the parts that go into exported goods for
which these procedures are necessary do not benefit directly, despite having to bear the
burden of going through the necessary procedures.
In most cases, Japanese firms doing business in ASEAN have operated on the
assumption of relatively low labor costs and seen ASEAN countries as a base for
finishing and export. Many export-oriented firms have taken advantage of investment
incentives provided by national governments and, thus, do not pay import duties. In
some cases, the investment incentives for parts manufacture and export have eliminated
duties altogether and have also made it unnecessary to secure COO.
In recent years, however, purchasing power has increased in ASEAN countries and
elsewhere in the region, making markets there more attractive. As a result, the
ASEAN operations of Japanese firms now supply local demand as well as producing for
export to a third country. As described above, putting aside special cases like Vietnam,
export-oriented Japanese operations, with exports accounting for 70% or more of sales,
are declining. Among ASEAN nations, the role of the lower tariffs through FTA in
developing markets in Indonesia and Thailand, the largest ASEAN economies, which
have a low percentage of export-oriented Japanese operations, is significant indeed.
For this report, we have surveyed the use of FTA for exports and imports (with 670
exporters and 635 importers responding). When exporters decide whether to use FTA,
important considerations include the following: (1) how much reduction in tariffs will
result from using an FTA? (2) Can tariffs on the item in question be eliminated
altogether by investment incentives provided by the destination country? (3) Are the
419
added paperwork costs in line with export volume? And (4) do the products in question
satisfy local content criteria?
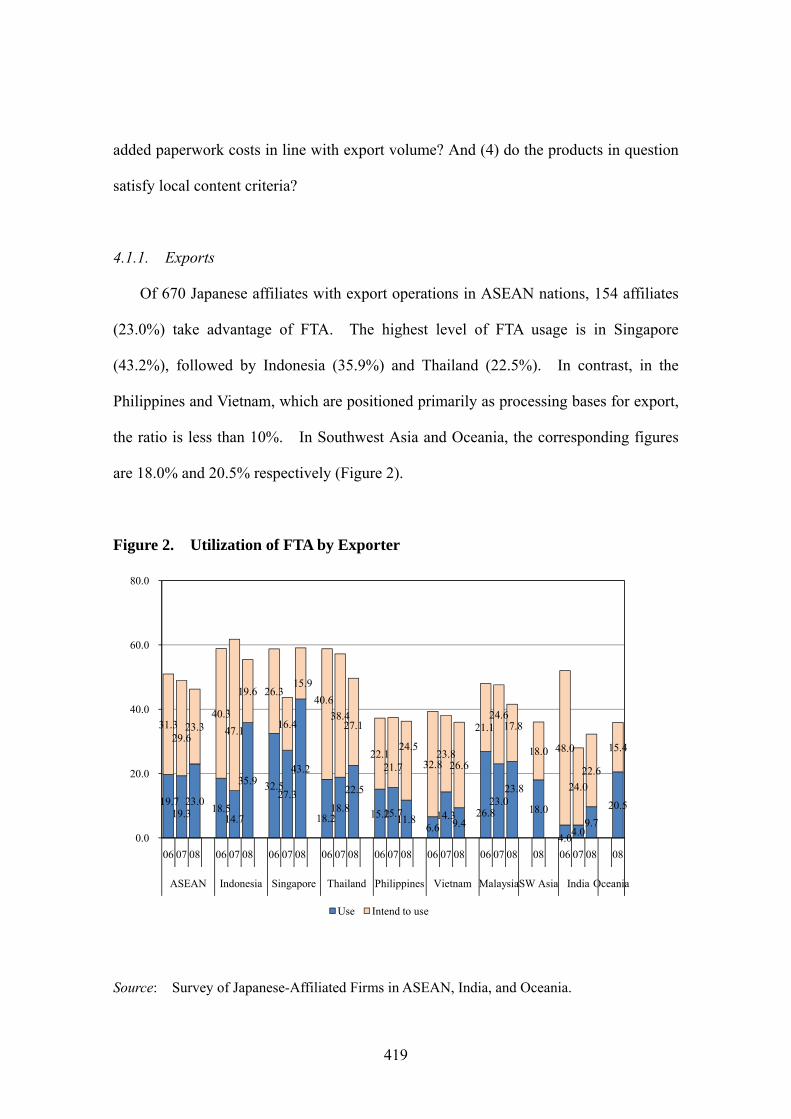
4.1.1. Exports
Of 670 Japanese affiliates with export operations in ASEAN nations, 154 affiliates
(23.0%) take advantage of FTA. The highest level of FTA usage is in Singapore
(43.2%), followed by Indonesia (35.9%) and Thailand (22.5%). In contrast, in the
Philippines and Vietnam, which are positioned primarily as processing bases for export,
the ratio is less than 10%. In Southwest Asia and Oceania, the corresponding figures
are 18.0% and 20.5% respectively (Figure 2).
Figure 2. Utilization of FTA by Exporter
19.7 19.3
23.0 18.5
14.7
35.9 32.5 27.3
43.2
18.2 18.8
22.5
15.2 15.7 11.8
6.6 14.3
9.4 26.8
23.0 23.8
18.0
4.0 4.0
9.7
20.5
31.3 29.6
23.3 40.3
47.1
19.6 26.3
16.4
15.9
40.6
38.4 27.1
22.1 21.7
24.5
32.8 23.8
26.6
21.1 24.6
17.8
18.0 48.0
24.0
22.6
15.4
0.0
20.0
40.0
60.0
80.0
06 07 08 06 07 08 06 07 08 06 07 08 06 07 08 06 07 08 06 07 08 08 06 07 08 08
ASEAN Indonesia Singapore Thailand Philippines Vietnam MalaysiaSW Asia India Oceania
Use Intend to use
Source: Survey of Japanese-Affiliated Firms in ASEAN, India, and Oceania.
420
Among the firms responding to our survey, around one in four (23.3%) are
considering taking advantage of FTA in their ASEAN operations, a proportion almost
identical with those already doing so. When answers are broken down by country, the
highest scores were for Thailand (27.1%), Vietnam (26.6%), and the Philippines
(24.5%), where hopes for benefits from FTA/EPA run high. When we combine
“already using” and “considering use” scores, the resulting shares for “firms interested
in FTA/EPA” include 46.3%, nearly half, for ASEAN as a whole. High scorers include
Singapore (59.1%), Indonesia (55.5%), and Thailand (49.6%).
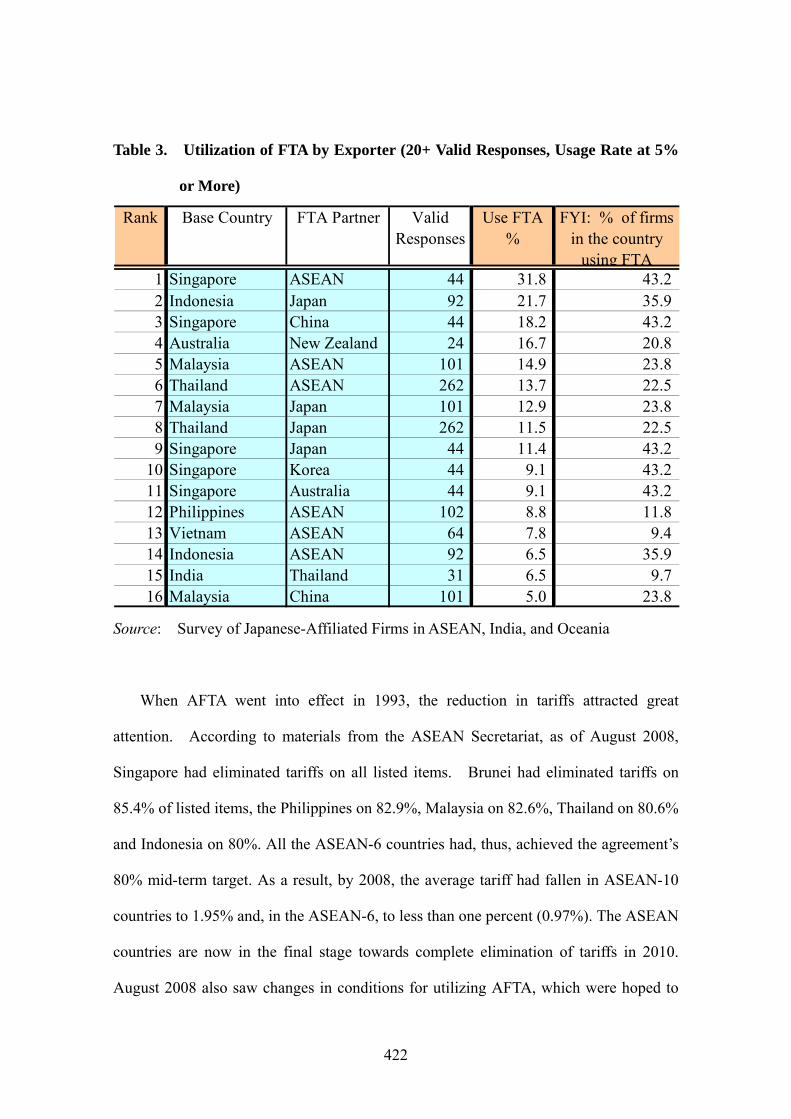
Next, we looked at exporter use of particular FTAs of which ASEAN countries are
signatories. To eliminate high scores due to small numbers of cases in the
denominator, we restricted our analysis to agreements for which (1) we had qualified
responses from 20 or more firms and (2) the proportion of firms taking advantage of the
agreements was 5% or more (Table 3). The most widely used FTA around the Pacific
Rim is Singapore’s AFTA. Of Japanese manufacturing firms in Singapore, 31.8%
make use of this agreement. The next most commonly used agreement is JIEPA, the
EPA concluded between Japan and Indonesia, at 21.7%. JIEPA went into effect in July
2008, and, while this survey was conducted only four months later, one firm in five was
already utilizing it. Of Japanese firms operating in Indonesia, those taking advantage
of JIEPA for exports to Japan come mainly from the textiles, apparel, cloth products,
lumber and wood products, and plastic products industries. The third most commonly
used agreement is ACFTA, the ASEAN-China FTA, which is utilized by 18.2% of
Japanese firms in Singapore. Here the most active users are firms in the food and
agricultural and fisheries products, chemicals, and electrical and electronic components
categories. Japanese firms based in Singapore are more likely to be exporting to China

421
than those based in neighboring countries; China accounts for 11.4% of their exports on
average.
Figure2 show that the use of these agreements has grown in Indonesia, Singapore,
Thailand, and India in these three years. The signing of the JIEPA agreement between
Japan and Indonesia in July 2008 added to this trend. Another important factor was
the agreement with Thailand, which became effective as of November 2007. (The
AJECP agreement with Vietnam was signed on December 1, 2008, after this survey was
conducted, so its effects do not appear in these results, and the usage rate therefore is
not reported to have risen.) If we combine the figures for firms already using or
considering use of FTA in a single “proportion of firms interested in FTA” score, we
find this total score steadily declining over the past three years in the ASEAN countries.
Conversely, the number of firms responding that they have no interest in FTA has
gradually increased. The major reasons for these trends are that tariffs have already
been lowered, and Japan has no FTAs with export destination countries in Europe and
America. (Details will be included in another analysis.)
Turning to use of FTAs by Japanese firms broken down by country or region, we
find that 5 out of 16 cases, nearly a third, involve operations in Singapore. Singapore
has, since the signing of its first bilateral FTA, with New Zealand, in 2001, vigorously
pursued additional agreements with its export partners, concluding further agreements
in the Asia-Pacific region with Japan (2002), Australia (2003), India (2005) and Korea
(2006). As a result, it now possesses Asia’s largest network of FTAs, and Japanese
firms have benefited from these agreements.
The FTA most utilized by Japanese firms with operations in the Pacific Rim is the
ASEAN Free Trade Area (AFTA; six participants) and four countries’ EPA with Japan.
422
Table 3. Utilization of FTA by Exporter (20+ Valid Responses, Usage Rate at 5%
or More)
Rank Base Country FTA Partner ValidResponses
Use FTA%
FYI: % of firmsin the country
using FTA1 Singapore ASEAN 44 31.8 43.22 Indonesia Japan 92 21.7 35.93 Singapore China 44 18.2 43.24 Australia New Zealand 24 16.7 20.85 Malaysia ASEAN 101 14.9 23.86 Thailand ASEAN 262 13.7 22.57 Malaysia Japan 101 12.9 23.88 Thailand Japan 262 11.5 22.59 Singapore Japan 44 11.4 43.2
10 Singapore Korea 44 9.1 43.211 Singapore Australia 44 9.1 43.212 Philippines ASEAN 102 8.8 11.813 Vietnam ASEAN 64 7.8 9.414 Indonesia ASEAN 92 6.5 35.915 India Thailand 31 6.5 9.716 Malaysia China 101 5.0 23.8
Source: Survey of Japanese-Affiliated Firms in ASEAN, India, and Oceania
When AFTA went into effect in 1993, the reduction in tariffs attracted great
attention. According to materials from the ASEAN Secretariat, as of August 2008,
Singapore had eliminated tariffs on all listed items. Brunei had eliminated tariffs on
85.4% of listed items, the Philippines on 82.9%, Malaysia on 82.6%, Thailand on 80.6%
and Indonesia on 80%. All the ASEAN-6 countries had, thus, achieved the agreement’s
80% mid-term target. As a result, by 2008, the average tariff had fallen in ASEAN-10
countries to 1.95% and, in the ASEAN-6, to less than one percent (0.97%). The ASEAN
countries are now in the final stage towards complete elimination of tariffs in 2010.
August 2008 also saw changes in conditions for utilizing AFTA, which were hoped to
423
promote greater use of the agreement. The criterion for taking advantage of AFTA had
been 40% local or regional added value. Alternative criteria now included Product
Specific Rules (PSR, i.e. Change in Chapter (CC) or Change in Tariff Heading (CTH) or
Change in Tariff Sub Heading (CTSH) or Process Rule). As a result, it suddenly
became possible to enjoy AFTA’s preferential tariff rates, the lowest in Asia, for
previously excluded products.
In contrast, for most of Japan’s EPA, apart from that with Singapore, have only
been in effect since 2006, and tariffs have not yet been eliminated. Nonetheless,
Indonesia at 21.7%, followed by Malaysia, Thailand and Singapore, all rank high in the
share of exports covered by FTA. Japan’s own tariffs on manufactured and other
nonagricultural goods are the lowest in the world. According to the WTO’ World
Tariff Profiles 2008, Japan’s tariffs in the nonagricultural sector average 2.6%, lower
than either the USA (3.2%) or the EU (3.8%). Japan retains, however, an average
21.8% tariff on agricultural and processed agricultural products, including 154.7% on
dairy products and 64.3% on grains and grain-based products. As of February 2009,
Japan has given a generalized tariff preference (GSP) status, imposing lower than the
usual tariffs, on 337 agricultural and fisheries products and 5,980 mineral products from
developing nations. Under Japan’s EPA, for GSP items on which the GSP rate is lower
than the EPA preferential rate, the GSP rate can be applied. Since, however, in almost
all cases, the EPA tariff is lower, these items are excluded from GSP coverage. This
explains why we find in this survey that many companies are now taking advantage of
the EPA has switched from the GSP.
For example, Thailand’s FTA with Japan came into effect in November 2007.
Following the FTA’s coming into effect, use of GSP shrank dramatically. According to

424
Thailand’s Department of Commerce, the total value of exports to Japan taking
advantage of GSP between January and November 2008 was US$127.08 million, an
88.8% decline from the US$1.1345 billion reported for the same period in the previous
year. Exporters were switching from use of the GSP to the FTA.
4.1.2. Imports
For ASEAN as a whole, of 635 Japanese affiliates with import operations in the
ASEAN nations, 131 firms (20.6%) utilize FTA for imports, slightly less than the 23%
for exports. Use of FTA for imports is especially prevalent in Oceania (33.3%); 42.1%
of Japanese firms doing business in Australia report taking advantage of these
agreements. Next come firms doing business in Indonesia (28.7%), Thailand (25.3%)
and Malaysia (20.0%). Looking back over our latest three surveys, we find that the
share of importers taking advantage of FTA has increased in Indonesia, Thailand, and
Malaysia. As reported for exports, for imports too, the substantial increase in the
usage rates in Indonesia and Thailand in 2008 demonstrates the impact of the FTA
concluded between Japan and these countries. Of the 27 firms with operations in
Indonesia that take advantage of FTA, the majority are making use of JIEPA, the FTA
between Japan and Indonesia. Of the 27, 23 import goods from Japan, of which 16
(70%) take advantage of JIEPA. Three are firms in the iron and steel and metal
products sector. Two are suppliers of transportation equipment.
The proportion of Japanese firms with operations in ASEAN that report that they
are considering making use of these agreements is 24.4%. If we combine these firms
with those already taking advantage of FTA, we see little change over the last three
years in the interest in them, with the proportion about 45% for ASEAN as a whole.

425
We see similar figures from Oceania and India, included for the first time in the survey
reported here. The degree of interest varies from country to country but is relatively
high in Indonesia (Figure 3).
Figure 3. Utilization of FTA by Importer
16.0 16.7
19.7 20.8 17.7
28.7
17.7 14.9
25.3
10.8 11.4 8.0 9.5
24.0
12.5 15.7 19.3 20.0
12.5
33.3
19.4 16.3
33.3
29.5
23.8
24.4
37.7
41.8
29.8
35.9 35.1
26.9
23.0 14.6
19.3
33.3
20.0 25.0
20.5 14.8
19.0
22.5
40.0
29.0 28.6
11.1
0.0
20.0
40.0
60.0
80.0
06 07 08 06 07 08 06 07 08 06 07 08 06 07 08 06 07 08 08 06 07 08 08
ASEAN Indonesia Thailand Philippines Vietnam Malaysia SW Asia India Oceania
Use Indend to use
Source: Survey of Japanese-Affiliated Firms in ASEAN, India, and Oceania.
Note: Singapore put tax on only 6 alcoholic items including beer. Therefore Singapore is omitted from this figure.
To calculate the proportion of FTA usage by countries in which Japanese firms
operate, we use the same method for imports as for exports, using only agreements for
which we have valid answers from 20 or more firms and usage rates of 5% or more.
The agreement most often made use of is JIEPA, the Japan-Indonesia FTA, at 17%.
Next come Japan’s EPA with Malaysia and Thailand. Thus, the top three are EPAs
426
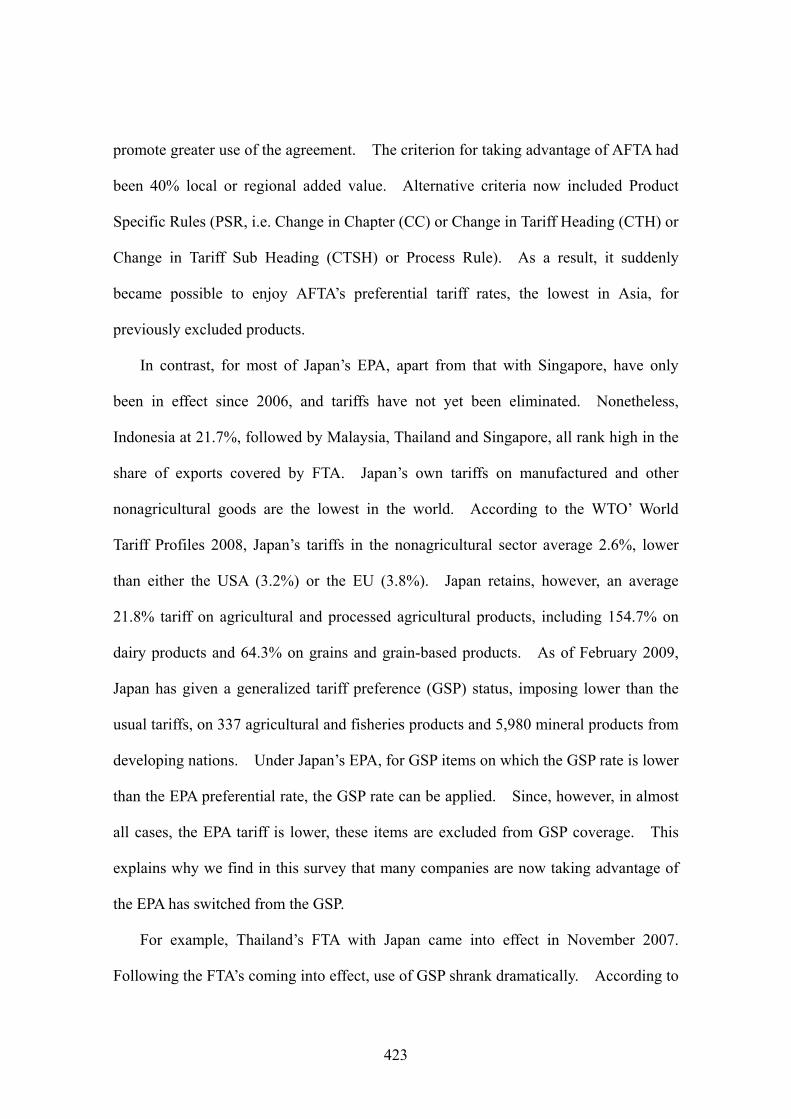
with Japan. Except for TIFTA, Japan’s FTA with India, with its early harvest lowering
of tariffs at No. 5, all of the other agreements are within the ASEAN Free Trade Area
(AFTA) (Table 4).
Table 4. Utilization of FTA Importer (20+ Valid Responses, Usage at 5% or
More)
Rank Base Country FTA Partner Valid Responses Use FTA % FYI: % of firmsin the country
using FTA
1 Indonesia Japan 94 17.0 28.7
2 Malaysia Japan 95 12.6 20.0
3 Thailand Japan 253 12.3 25.3
4 Thailand ASEAN 253 10.3 25.3
5 India Thailand 49 10.2 16.3
6 Malaysia ASEAN 95 9.5 20.0
7 Vietnam ASEAN 64 9.4 12.5
8 Philippines ASEAN 88 8.0 8.0
9 Indonesia ASEAN 94 7.4 28.7
Source: Survey of Japanese-Affiliated Firms in ASEAN, India, and Oceania
In Oceania, the Thailand-Australia FTA (TAFTA) came into effect in January 2005.
Major Japanese corporations took advantage of this FTA to import cars and electrical
products produced in Thailand into Australia. Since only 19 firms provided valid
responses from Australia, these responses are not included in Figure 9. We should
note, however, that 31.6% of Japanese firms active in Australia take advantage of the
TAFTA, which, of the FTA into which Australia has entered, is the most often used.
Among cars imported into Australia, passenger cars produced in Thailand rank No. 3,
after cars from Japan and Germany. In the commercial vehicle segment, it is the
largest source of imported vehicles, topping Japan and the USA.

427
4.2. Reasons for Not Utilizing FTA/EPA
Since the year 2000, awareness of FTA/EPA has increased sharply throughout Asia.
Because, however, there is great variation from country to country, we still find that
more than half of the firms we surveyed neither take advantage of nor consider making
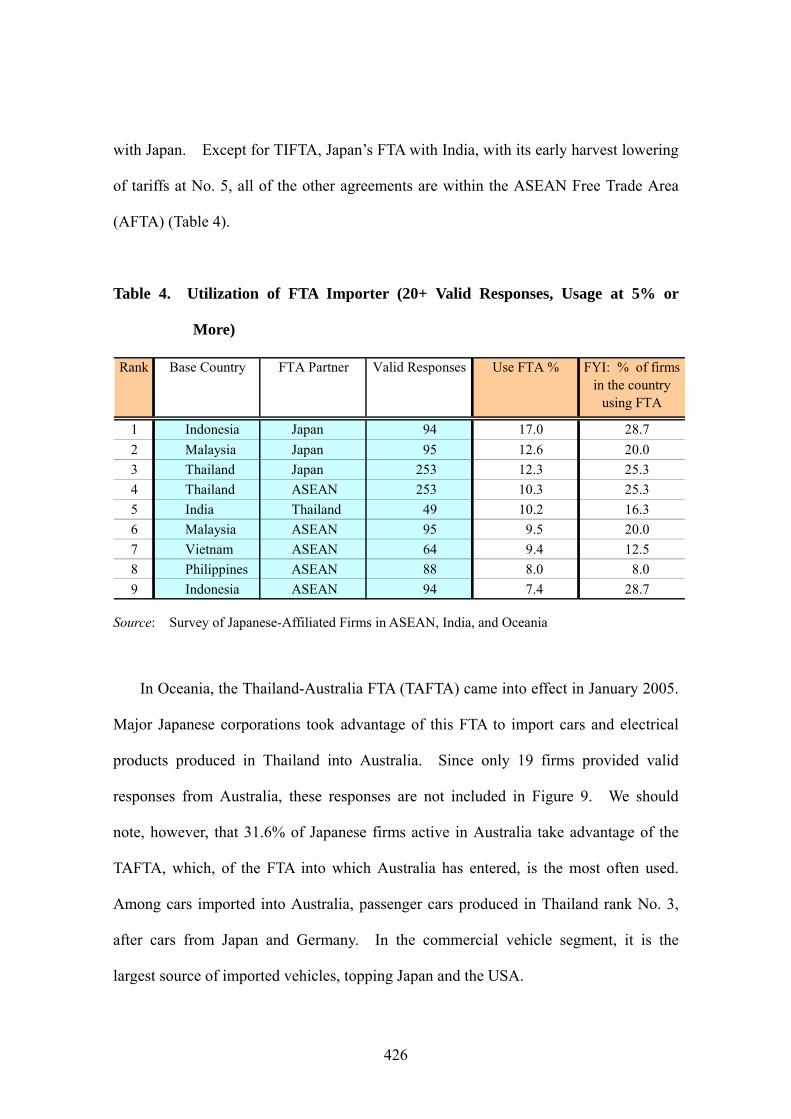
use of these agreements. As far as exports are concerned, the major reasons for not
utilizing FTA/EPA in the ASEAN region are, first, “The countries to which we export
have already reduced tariffs; FTA offers no additional benefit” (123 firms, 37.6%).
Second is, “There are no FTA/EPA with the countries to which we export” (75 firms,
22.9%). Some companies say, “Tariffs are already low in the countries to which we
export; there is no additional benefit to using FTA” (65 firms, 19.9%). When
manufactured goods are sent back to Japan, tariffs are either extremely low or have been
eliminated altogether, making it unnecessary to employ FTA or EPA, a point that
underlies the results reported for ASEAN. In the cases of Southwest Asia and
Oceania, however, nearly 40% of all the responding companies note that there are no
FTA/EPA with the countries to which they export (Table 5).
Turning, then, to imports, we find that the overwhelmingly most important reason
why FTA are neither employed nor considered is that in the ASEAN region, investment
incentive schemes have already eliminated tariffs, a reason cited by 157 (48.9%) of the
351 firms that responded to that question. Other reasons mentioned include “low
levies on products sold domestically” (13.4%) and “no FTA/EPA with the countries
from which we import” (13.1%). In Oceania and Southwest Asia, however, the
absence of FTA/EPA is the reason cited by 50% and 42.6% of responding firms
respectively (Table 6).
428
Table 5. Reasons for not Using FTA (%): Exports
Low tariff,no benefitfrom FTA
Tariffexempt, no
benefitfrom FTA
COOhurdle too
high
High costof COO
COOprocedures
too complex
Unaware ofFTA/EPA or
can't getpaperwork
Many differentCOO ruleswithin the
variousFTA/EPA; too
No FTA/EPAwith
destinationOther
ASEAN (n=327) 19.9 37.6 4.0 2.5 4.6 1.5 4.6 22.9 22.6Indonesia (n=34) 17.7 38.2 2.9 8.8 5.9 2.9 5.9 26.5 35.3Malaysia (n=55) 23.6 52.7 - - 1.8 - 1.8 14.6 14.6Myanmar (n=4) - 75.0 25.0 - - - - 25.0 -Philippines (n=61) 9.8 32.8 4.9 - 3.3 1.6 9.8 21.3 27.9Singapore (n=15) 6.7 40.0 - 13.3 13.3 6.7 6.7 20.0 26.7Thailand (n=122) 26.2 32.8 6.6 2.5 6.6 1.6 4.1 22.1 22.1Vietnam (n=36) 19.4 33.3 - - - - - 38.9 16.7
SW Asia (n=37) 16.2 18.9 - - - 2.7 2.7 37.8 29.7India (n=19) 10.5 5.3 - - - 5.3 - 42.1 42.1
Oceania (n=24) 12.5 29.2 - - - - - 41.7 25.0
Source: Survey of Japanese-Affiliated Firms in ASEAN, India, and Oceania
Table 6. Reasons for not Using FTA (%): Imports
Investmentincentiveschemealready
lowers tariffs
Fewdomesticsales onwhichtariffslevied
Procurement sourcesunaware ofFTA/EPA
FTA notapplicable
tointermediary trades
Ordinarytariffs low,no benefitfrom FTA
No benefitfrom
stepwiseFTA
reduction
No FTA/EPAwith source
Other
ASEAN (n=321) 48.9 13.4 2.2 0.3 12.8 4.1 13.1 15.9Indonesia (n=35) 34.3 14.3 - - 11.4 5.7 17.1 31.4Malaysia (n=55) 45.5 20.0 - 1.8 14.6 3.6 12.7 10.9Myanmar (n=5) 20.0 60.0 20.0 - - - 40.0 -Philippines (n=60) 61.7 8.3 3.3 - 5.0 - 8.3 16.7Singapore (n=18) - 22.2 5.6 - 22.2 - 16.7 38.9Thailand (n=113) 51.3 10.6 2.7 - 15.9 8.0 12.4 14.2Vietnam (n=35) 68.6 8.6 - - 11.4 - 14.3 2.9
SW Asia (n=47) 29.8 4.3 4.3 - 2.1 4.3 42.6 14.9India (n=23) 4.4 - 8.7 - 4.4 8.7 47.8 30.4
Oceania (n=14) - - - - 14.3 7.1 50.0 28.6
Source: Survey of Japanese-Affiliated Firms in ASEAN, India, and Oceania.
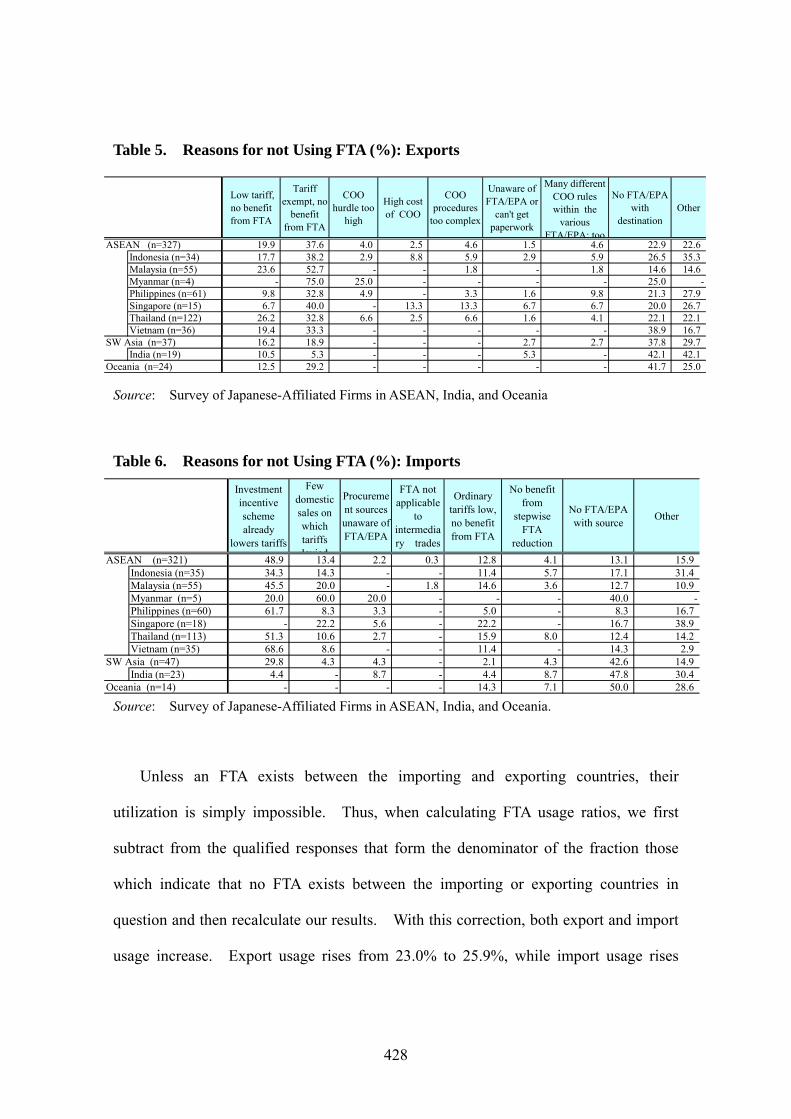
Unless an FTA exists between the importing and exporting countries, their
utilization is simply impossible. Thus, when calculating FTA usage ratios, we first
subtract from the qualified responses that form the denominator of the fraction those
which indicate that no FTA exists between the importing or exporting countries in
question and then recalculate our results. With this correction, both export and import
usage increase. Export usage rises from 23.0% to 25.9%, while import usage rises
429
from 20.6% to 22.1%. In the case of Oceania the increase is dramatic, from 7.1% to
27.6% for exports and from 11.7% to 45.0% for imports (Figure 4).
Figure 4. FTA Usage and Real Usage Rates
19.7
28.7
20.0
8.0
25.3
12.5
12.5
16.3
33.3
21.1
30.7
21.6
8.4
26.8
13.6
16.7
21.1
45.0
0 10 20 30 40 50
ASEAN
Indonesia
Malaysia
Myanmar
Philippines
Singapore
Thailand
Vietnam
SW Asia
India
Oceania
Usage rate
Actual usage rate
23.0
35.9
23.8
20.0
11.8
43.2
22.5
9.4
18.0
9.7
20.5
25.9
39.8
25.8
25.0
13.5
46.3
25.1
12.0
23.4
13.0
27.6
0 10 20 30 40 50
ASEAN
Indonesia
Malaysia
Myanmar
Philippines
Singapore
Thailand
Vietnam
SW Asia
India
Oceania
【Export】 【Import】
Source: Survey of Japanese-Affiliated Firms in ASEAN, India, and Oceania.
Note: Singapore put tax on only six alcoholic items such as stout & porter, samsu, etc. Therefore
Singapore Import is omitted from this figure.
4.3. The Preferential Tariff Margin and Use of FTA/EPA
As noted above, when exporters make use of an FTA/EPA, they incur the added
cost of securing COO. Thus, only when the preferential tariff margin gained by using
FTA/EPA is greater than the additional cost of procedures involved will companies
consider utilizing FTA. All the companies responding to this survey, both those that
make use of FTA and those considering making use of FTA, compare the preferential
tariff margin, the tariff reduction, from utilizing an FTA with that available Most

430
Favored Nation (MFN) status in deciding whether to use FTA. Of the 390
manufacturing firms doing business in Asia and Oceania, the largest proportion (28.2%)
state that they would consider using an FTA with a preferential tariff margin in the
3%-5% range. Another 27.9% said that they would consider it if the margins were
between 5-7%. At the other extreme, 15.6% of those companies reported that they
would not consider making use of FTA unless the tariff margin is at 10% or more.
Most of that group of companies have small volumes of exports and think that it would
take a preferential tariff margin of 10% or more to over the added costs of obtaining
COO.
Using the median in each category, we calculated the average preferential tariff
margin at which Japanese firms will make use of FTA/EPA; the result is a trigger value
of 5.3%. By region, that trigger is at its lowest in ASEAN (5.2%), followed by
Oceania (5.9%) and Southwest Asia (6.2%). In ASEAN, securing COO is already a
relatively widespread practice; since those costs are, thus, often already in the equation,
the preferential tariff margin that will trigger FTA/EPA usage is lower. Indonesia, for
example, is the ASEAN country in which, in terms of required paperwork, is the easiest
to use FTA/ETA. There, the screening for local origin is carried out promptly, as early
as the day of application or no later than three days of application, and the COO is then
issued immediately. JIEPA, Japan’s EPA with Indonesia, only came into effect in July
2008, but Japanese firms report that in most cases they have no trouble obtaining a
COO, usually within one day. Thus, for Indonesia, the preferential tariff margin that
would trigger the use of EPA was only 4.3%, 1% lower than the ASEAN average.
Countries differ in the costs of the paperwork and procedures required to acquire COO;
the more complicated the procedures, the higher the preferential tariff margin needs to
431
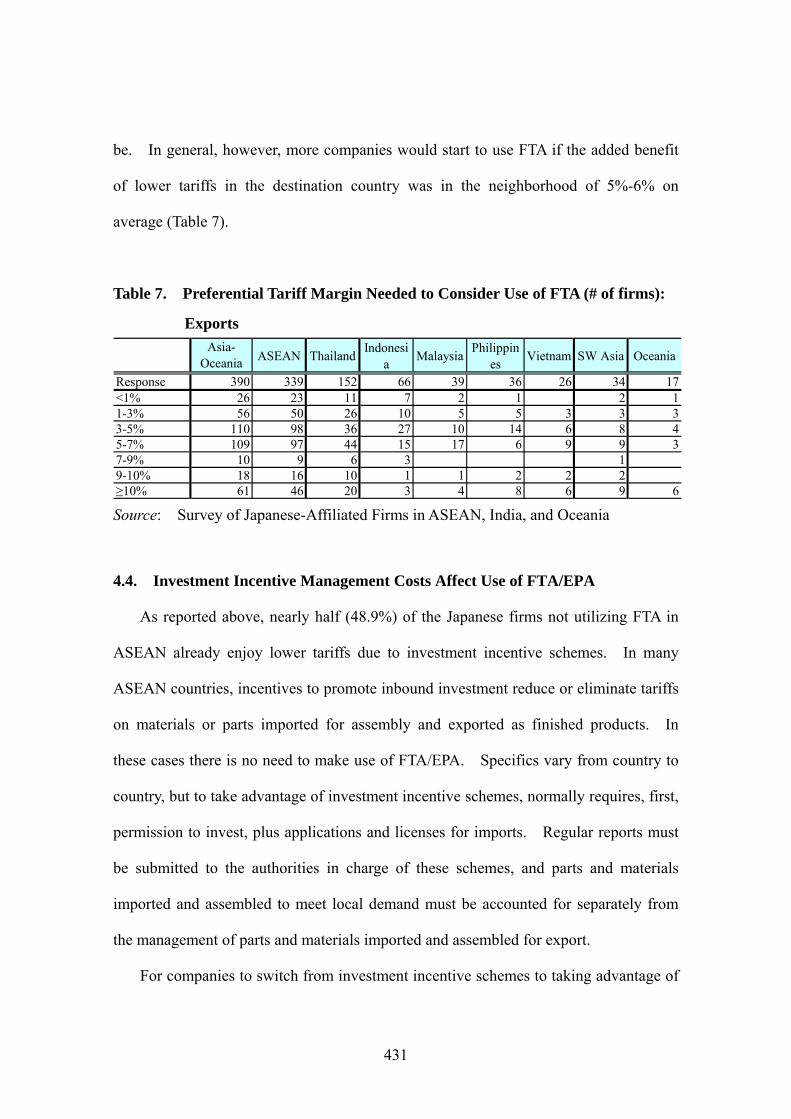
be. In general, however, more companies would start to use FTA if the added benefit
of lower tariffs in the destination country was in the neighborhood of 5%-6% on
average (Table 7).
Table 7. Preferential Tariff Margin Needed to Consider Use of FTA (# of firms):
Exports
Asia-Oceania
ASEAN ThailandIndonesi
aMalaysia
Philippines
Vietnam SW Asia Oceania
Response 390 339 152 66 39 36 26 34 17<1% 26 23 11 7 2 1 2 11-3% 56 50 26 10 5 5 3 3 33-5% 110 98 36 27 10 14 6 8 45-7% 109 97 44 15 17 6 9 9 37-9% 10 9 6 3 19-10% 18 16 10 1 1 2 2 2≥10% 61 46 20 3 4 8 6 9 6
Source: Survey of Japanese-Affiliated Firms in ASEAN, India, and Oceania
4.4. Investment Incentive Management Costs Affect Use of FTA/EPA
As reported above, nearly half (48.9%) of the Japanese firms not utilizing FTA in
ASEAN already enjoy lower tariffs due to investment incentive schemes. In many
ASEAN countries, incentives to promote inbound investment reduce or eliminate tariffs
on materials or parts imported for assembly and exported as finished products. In
these cases there is no need to make use of FTA/EPA. Specifics vary from country to
country, but to take advantage of investment incentive schemes, normally requires, first,
permission to invest, plus applications and licenses for imports. Regular reports must
be submitted to the authorities in charge of these schemes, and parts and materials
imported and assembled to meet local demand must be accounted for separately from
the management of parts and materials imported and assembled for export.
For companies to switch from investment incentive schemes to taking advantage of

432
FTA would require that the costs of switching to FTA be lower than the management
costs incurred by participation in the investment incentive scheme in question. When
we asked firms doing business in Asia about the added management cost of
participating in investment incentive schemes, nearly half answered that they were less
than 1% of the cost of imported materials or parts. The next most common answer
(33.3%) was between one to three percent. Calculations based on the median score in
each category suggest that the cost of participation in investment incentive schemes, is,
on average, 1.9% of the cost of imported materials or parts for all of Asia and for
ASEAN, and 2.3% for Southwest Asia. A breakdown by country shows that the
highest management cost is in Thailand (2.2%), followed by Vietnam (2.2%) and
Malaysia (1.7%). The lowest cost is in Indonesia (1.3%) (Table 8).
Table 8. Ratio of Investment Incentive Scheme Management Costs to Imported
Materials and Parts Costs (%)
Thailand Indonesia Malaysia Philippin Vietnam
Response 390 339 152 66 39 36 26 34 17<1% 6.7 6.8 7.2 10.6 5.1 2.8 0.0 5.9 5.91-3% 14.4 14.7 17.1 15.2 12.8 13.9 11.5 8.8 17.63-5% 28.2 28.9 23.7 40.9 25.6 38.9 23.1 23.5 23.55-7% 27.9 28.6 28.9 22.7 43.6 16.7 34.6 26.5 17.67-9% 2.6 2.7 3.9 4.5 0.0 0.0 0.0 2.9 0.09-10% 4.6 4.7 6.6 1.5 2.6 5.6 7.7 5.9 0.0≥10% 15.6 13.6 13.2 4.5 10.3 22.2 23.1 26.5 35.3
Average 5.3 5.2 5.3 4.3 5.2 5.6 6.3 6.2 5.9
Asia-Oceania
ASEAN SW Asia Oceania
Source: Survey of Japanese-Affiliated Firms in ASEAN, India, and Oceania
At present, the FTA/EPA that has made the greatest progress in reducing tariffs is
AFTA. Because of AFTA, in 2008 the ASEAN-6 reduced tariffs to an average of
0.97%. The cost of tariffs fell below the management cost of participating in
433
investment incentive schemes. However, the ASEAN share of Japanese firms’
procurements is still limited. Our previous survey found that the proportion of
procurements from ASEAN countries to total procurements (including local
procurements) was at most 11.5%, far smaller than that of procurements from Japan
(37.8%) or local procurements (40.0%). Thus, on the import side, most Japanese firms
are still waiting for further tariff reductions before participating in individual EPA
between ASEAN countries and Japan or the ASEAN-Japan Comprehensive Economic
Partnership (AJCEP) agreement. Except for Singapore, EPA between Japan and
ASEAN countries first became effective with Malaysia in July 2006, followed by
Thailand in 2007, and Indonesia in 2008; the EPA to which Japan is a signatory requires
up to 10 years to eliminate tariffs completely. Thus, Japanese firms now mainly
importing materials or parts from Japan under investment incentive schemes are likely
to continue to do so.
5. Econometric Analysis on FTA Utilization
This section is aimed to clarify firm characteristics encouraging or discouraging
firms’ use of FTA scheme by conducting econometric analysis for the firm-level data
introduced in the previous section. Thus our sample is Japanese overseas affiliates in
2006, 2007, and 2008. In order to fix sample countries identical across years, we
restrict to such affiliates in six ASEAN member countries: Thailand, Malaysia,
Singapore, Indonesia, the Philippines, and Vietnam. Therefore, the main FTA scheme

434
in our mind here is CEPT scheme, though there are also other FTA schemes available
for firms in ASEAN countries.
5.1. Empirical Framework
In this paper, we employ the following probit model, given by:
Pr (FTAi=1|Xi) = Φ(Xi’β),
where Xi = (ln Employmenti, Zero tariff sharei, Local input sharei, Local input share^2i).
Φ(·) is the standard cumulative normal probability distribution. FTAi is an indicator
variable taking unity if a firm i uses bilateral or multilateral FTAs and zero otherwise.
We examine three kinds of firm characteristics: Employment, Zero tariff share, and
Local input share. The second one is presumed to be important for the utilization in
importing, and the first and last ones are for that in both importing and exporting.
First, a variable Employment embodies a firms’ scale. In utilizing FTA schemes,
firms generally have to incur some costs to prepare documents, i.e. employing
additional indirect staff to cope with the matters of FTAs, which become a kind of fixed
cost for them. The well-known Melitz model indicates that only firms with higher
productivity can afford to pay expenses for exporting (Melitz, 2003). Applying this
argument to our context, such document costs generate selection effects in firms’ use of
FTA according to firms’ productivity. To examine this claim, we introduce firms’
employment as an independent variable because our dataset does not have convincing
productivity measures, i.e. value-added and so on. Since firms with higher
productivity produce more output and thus employ more employees, the use of the
employment as a proxy for productivity would be plausible to some extent. As a
result, the larger the firms’ scale, the more likely they would be to utilize FTA schemes.
435
Next, in order to examine the influence of alternatives to benefit from zero import
duty schemes on firms’ FTA utilization, we introduce a variable Zero tariff share. This
variable represents a share of imports with zero tariffs through channels other than FTA,
in total imports. There are several channels to import goods through without paying
tariffs. The first is an enjoyable one for all firms. When firms decide not to utilize
FTA, they will pay general tariff rates, usually Most Favored Nations rates (MFN rates).
Thus, as mentioned in section 4.3, if the MFN rates are already zero, they do not have to
pay any import duties. Also, most of the information technology-related products can
be traded without tariffs due to the Information Technology Agreement (ITA). The
second is a channel for foreign-owned firms. They tend to obtain some investment
promotion schemes from host countries’ governments particularly when entering those
countries. An example is tariff exemption on imported inputs for export purposes. If
firms already have these alternatives, they do not need to further utilize FTA schemes,
as mentioned in section 4.4. As a result, firms that already import without tariff
burdens are less likely to utilize FTA in importing.
Last, a share of local inputs in total inputs, Local inputs share, is introduced. In
utilizing an FTA scheme in exporting, exported goods must comply with ROOs. In
CEPT scheme, for example, inputs from ASEAN member countries must account for at
least 40 percent of their gross output value (regional value content rule2). Thus, given
inputs from the other ASEAN countries, affiliates with the larger local inputs share in an
ASEAN member country are more likely to be able to utilize CEPT scheme in exporting
their products to other ASEAN countries. On the side of FTA utilization in importing,
however, their extremely large share might discourage the use of an FTA scheme. This
2 Since 1 August 2008, the CEPT ROOs include “Change in Tariff Headings Rule”. But, since our sample hardly covers such period, we focus on the regional value content rule.

436
is because their larger share implies a smaller share of imports, which is more likely to
fail to cover fixed costs, e.g. documentation costs, for an FTA scheme in importing.
As a result, the share of local inputs is positively and negatively associated with FTA
utilization in exporting and importing, respectively.
Before reporting data issues and estimation results, there are two points to be noted
in our construction of a dependent variable. First, this paper takes as firms utilizing
FTAs, not only firms that currently use any existing bilateral or multilateral FTAs
already in force but also firms that are considering using them. This contributes to
avoiding difficulties in our dataset. Although it is desirable to restrict our sample to
firms exporting to or importing from countries with FTAs with countries in which those
firms locate, our dataset cannot identify trading partner countries in each firm.
However, such a restriction turns out to be not always necessary if we include firms
under consideration. Furthermore, it also might not be necessary that the trading
partner countries have already concluded FTAs. Hereafter, not only firms that
currently use FTAs but also firms that are considering using them are collectively called
“firms using FTAs”.
Second, in this paper, we examine the correlation of the above-proposed firms’
characteristics with FTA schemes in importing and exporting simultaneously, not
separately. That is, our dependent variable takes unity if FTAs are used in either
importing or exporting. There are two reasons for such simultaneous examination.
The first one is based on an empirical fact: The FTA scheme tends to either be utilized
in both importing and exporting or be not utilized at all. Indeed, in Japanese affiliates
in ASEAN countries, the former type of affiliate occupies 37% of all the affiliates, and
437
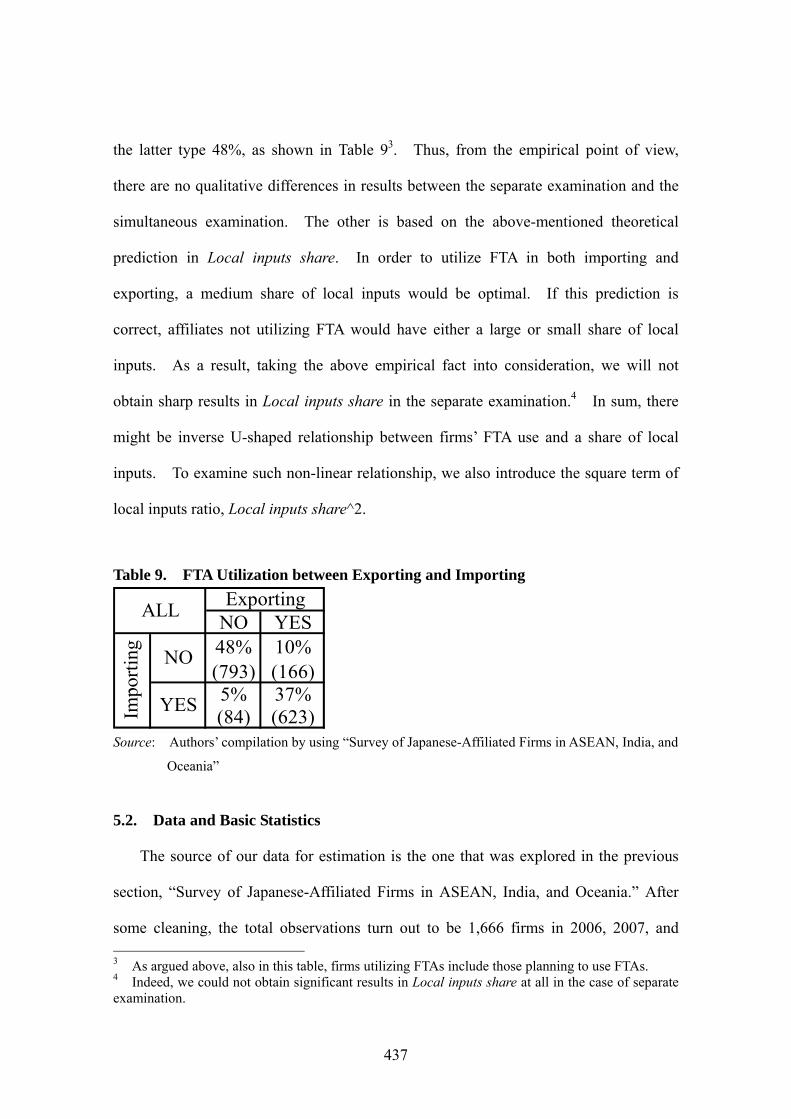
the latter type 48%, as shown in Table 93. Thus, from the empirical point of view,
there are no qualitative differences in results between the separate examination and the
simultaneous examination. The other is based on the above-mentioned theoretical
prediction in Local inputs share. In order to utilize FTA in both importing and
exporting, a medium share of local inputs would be optimal. If this prediction is
correct, affiliates not utilizing FTA would have either a large or small share of local
inputs. As a result, taking the above empirical fact into consideration, we will not
obtain sharp results in Local inputs share in the separate examination.4 In sum, there
might be inverse U-shaped relationship between firms’ FTA use and a share of local
inputs. To examine such non-linear relationship, we also introduce the square term of
local inputs ratio, Local inputs share^2.
Table 9. FTA Utilization between Exporting and Importing
NO YES48% 10%(793) (166)5% 37%(84) (623)
ALLExporting
Impo
rtin
g
NO
YES
Source: Authors’ compilation by using “Survey of Japanese-Affiliated Firms in ASEAN, India, and
Oceania”
5.2. Data and Basic Statistics
The source of our data for estimation is the one that was explored in the previous
section, “Survey of Japanese-Affiliated Firms in ASEAN, India, and Oceania.” After
some cleaning, the total observations turn out to be 1,666 firms in 2006, 2007, and 3 As argued above, also in this table, firms utilizing FTAs include those planning to use FTAs. 4 Indeed, we could not obtain significant results in Local inputs share at all in the case of separate examination.
438
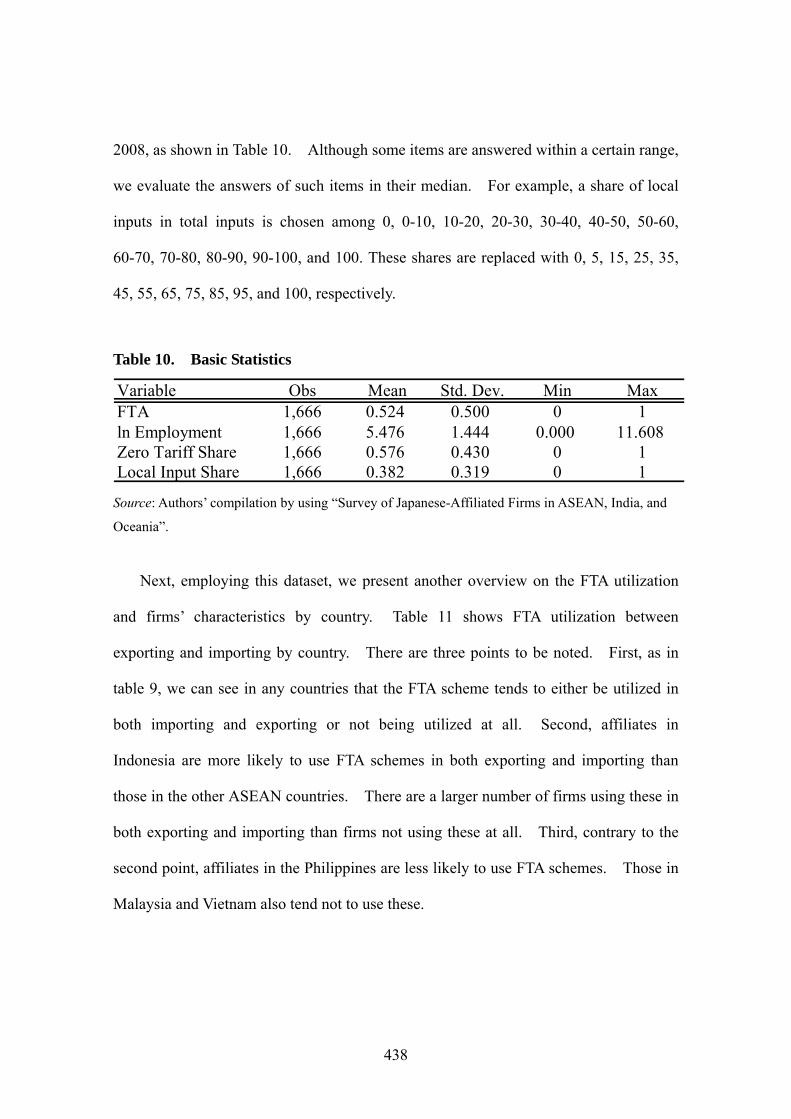
2008, as shown in Table 10. Although some items are answered within a certain range,
we evaluate the answers of such items in their median. For example, a share of local
inputs in total inputs is chosen among 0, 0-10, 10-20, 20-30, 30-40, 40-50, 50-60,
60-70, 70-80, 80-90, 90-100, and 100. These shares are replaced with 0, 5, 15, 25, 35,
45, 55, 65, 75, 85, 95, and 100, respectively.
Table 10. Basic Statistics
Variable Obs Mean Std. Dev. Min MaxFTA 1,666 0.524 0.500 0 1ln Employment 1,666 5.476 1.444 0.000 11.608Zero Tariff Share 1,666 0.576 0.430 0 1Local Input Share 1,666 0.382 0.319 0 1
Source: Authors’ compilation by using “Survey of Japanese-Affiliated Firms in ASEAN, India, and
Oceania”.
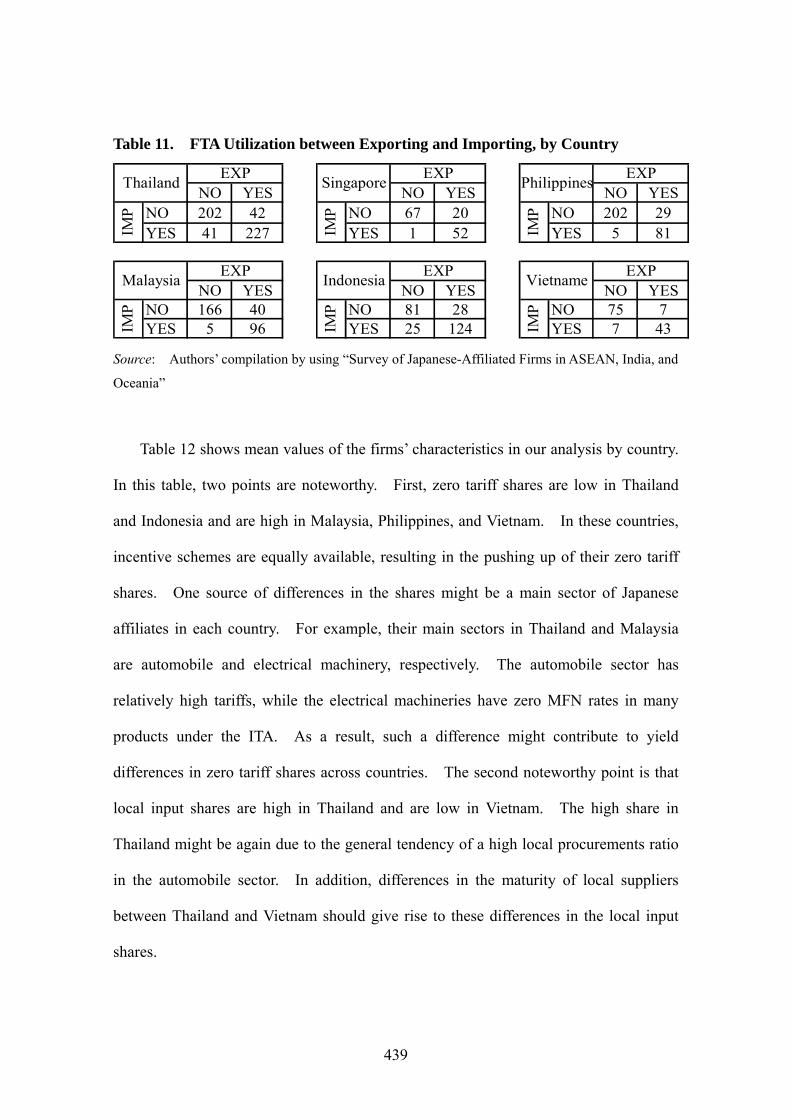
Next, employing this dataset, we present another overview on the FTA utilization
and firms’ characteristics by country. Table 11 shows FTA utilization between
exporting and importing by country. There are three points to be noted. First, as in
table 9, we can see in any countries that the FTA scheme tends to either be utilized in
both importing and exporting or not being utilized at all. Second, affiliates in
Indonesia are more likely to use FTA schemes in both exporting and importing than
those in the other ASEAN countries. There are a larger number of firms using these in
both exporting and importing than firms not using these at all. Third, contrary to the
second point, affiliates in the Philippines are less likely to use FTA schemes. Those in
Malaysia and Vietnam also tend not to use these.
439
Table 11. FTA Utilization between Exporting and Importing, by Country
NO YES NO YES NO YESNO 202 42 NO 67 20 NO 202 29YES 41 227 YES 1 52 YES 5 81
NO YES NO YES NO YESNO 166 40 NO 81 28 NO 75 7YES 5 96 YES 25 124 YES 7 43IM
PIM
P
IMP
VietnameEXP
MalaysiaEXP
IMP
ThailandEXP
IMP
IMP
PhilippinesEXP
SingaporeEXP
IndonesiaEXP
Source: Authors’ compilation by using “Survey of Japanese-Affiliated Firms in ASEAN, India, and
Oceania”
Table 12 shows mean values of the firms’ characteristics in our analysis by country.
In this table, two points are noteworthy. First, zero tariff shares are low in Thailand
and Indonesia and are high in Malaysia, Philippines, and Vietnam. In these countries,
incentive schemes are equally available, resulting in the pushing up of their zero tariff
shares. One source of differences in the shares might be a main sector of Japanese
affiliates in each country. For example, their main sectors in Thailand and Malaysia
are automobile and electrical machinery, respectively. The automobile sector has
relatively high tariffs, while the electrical machineries have zero MFN rates in many
products under the ITA. As a result, such a difference might contribute to yield
differences in zero tariff shares across countries. The second noteworthy point is that
local input shares are high in Thailand and are low in Vietnam. The high share in
Thailand might be again due to the general tendency of a high local procurements ratio
in the automobile sector. In addition, differences in the maturity of local suppliers
between Thailand and Vietnam should give rise to these differences in the local input
shares.

440
Table 12. Mean Values in Variable, by Country
Obs Mean Obs Mean Obs Mean
FTA 512 0.605 307 0.459 140 0.521ln Employment 512 5.619 307 5.267 140 4.185Zero Tariff Share 512 0.368 307 0.734 140 0.678Local Input Share 512 0.513 307 0.400 140 0.293
FTA 258 0.686 317 0.363 132 0.432ln Employment 258 5.766 317 5.720 132 5.625Zero Tariff Share 258 0.419 317 0.783 132 0.718Local Input Share 258 0.401 317 0.261 132 0.184
Thailand Malaysia Singapore
Indonesia Philippines Vietnam
Source: Authors’ compilation by using “Survey of Japanese-Affiliated Firms in ASEAN, India, and
Oceania”
5.3. Empirical Results
Regression results are reported in Tables 13. The column (I) shows our baseline
result, which is completely consistent with our expectation. The coefficient for
Employment is significantly positive, indicating that the larger the affiliate, the more
likely it is to utilize an FTA. Also, affiliates that often import their inputs with zero
tariffs do not need to consider the use of FTAs significantly. This result confirms that
investment promotion incentives and low general tariff rates surely play an alternative
role to FTA utilization. In addition, we can find the significant inverse U-shaped
relationship between FTA use and a share of local inputs. Calculating the maximum
share (= - βLocal inputs share / (2 βLocal inputs share^2)), we can see that affiliates with 42% are
most likely to utilize FTAs. It is interesting that such a maximum share of local inputs
almost completely coincides with the required share of inputs from ASEAN countries in
value content rule, 40%. This result might indicate that Japanese affiliates minimize
costs for FTA utilization in both importing and exporting accurately to some extent,
particularly in the share of local inputs.
441
Table 13. Empirical Results: Probit for FTA Utilization
Sample
Equation (I) (II) (III) (IV) (V) (VI)
ln Employment 0.084*** 0.097*** 0.096*** 0.081*** 0.094*** 0.093***
[0.022] [0.027] [0.027] [0.022] [0.027] [0.027]
Zero Tariff Share -0.627*** -0.339*** -0.346*** -0.634*** -0.348*** -0.354***
[0.076] [0.088] [0.088] [0.076] [0.088] [0.088]
Local Input Share 1.236*** 1.046*** 1.044*** 1.148*** 1.012*** 1.012***
[0.351] [0.383] [0.384] [0.355] [0.387] [0.387]
Local Input Share ^2 -1.480*** -1.502*** -1.501*** -1.350*** -1.452*** -1.452***
[0.373] [0.403] [0.404] [0.380] [0.411] [0.412]
Maximum 42% 35% 35% 43% 35% 35%
Year dummy NO YES NO NO YES NO
Sector dummy NO YES YES NO YES YES
Country dummy NO YES NO NO YES NO
Country-year dummy NO NO YES NO NO YES
Observations 1,666 1,666 1,666 1,652 1,652 1,652
Pseudo R2 0.041 0.111 0.112 0.111 0.110 0.111
ALL Trading Affiliates
Notes: Robust standard errors are in parentheses. ***, **, and * show 1%, 5%, and 10%
significance, respectively.
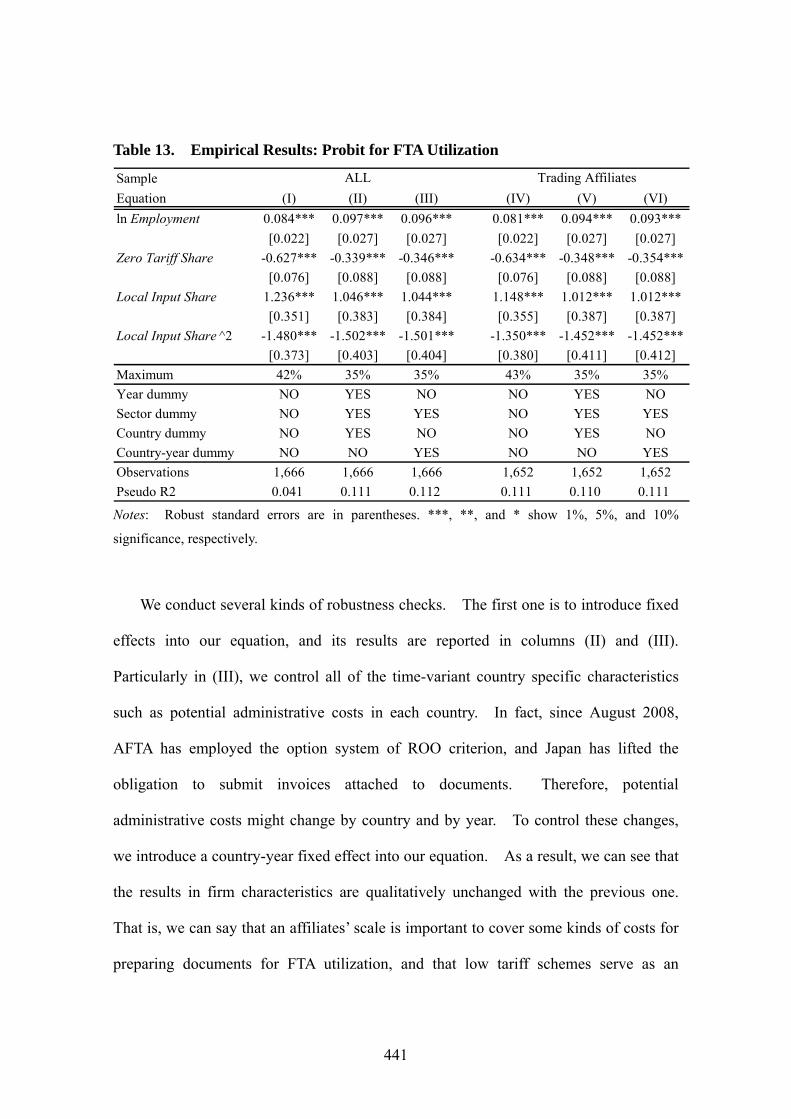
We conduct several kinds of robustness checks. The first one is to introduce fixed
effects into our equation, and its results are reported in columns (II) and (III).
Particularly in (III), we control all of the time-variant country specific characteristics
such as potential administrative costs in each country. In fact, since August 2008,
AFTA has employed the option system of ROO criterion, and Japan has lifted the
obligation to submit invoices attached to documents. Therefore, potential
administrative costs might change by country and by year. To control these changes,
we introduce a country-year fixed effect into our equation. As a result, we can see that
the results in firm characteristics are qualitatively unchanged with the previous one.
That is, we can say that an affiliates’ scale is important to cover some kinds of costs for
preparing documents for FTA utilization, and that low tariff schemes serve as an
442
alternative to FTA schemes. In addition, affiliates with the larger share of local inputs
are likely to comply with ROOs in exporting, but their extremely large share fails to
cover fixed costs for FTA schemes in importing.
The second robustness check is to restrict our sample only to affiliates that are
importing and/or exporting. Although, as argued above, it is not a severe problem
basically to include non-trading firms in our sample because our dependent variable
includes firms that are considering an FTA scheme, such a restriction would yield a
cleaner picture on the choice of FTA utilization. These results in firm characteristics
are reported in columns (IV), (V), and (VI), and are qualitatively unchanged with our
baseline result. That is, an affiliates’ employment is positively related to their FTA
use, while their share of imports with zero tariffs is negatively associated with that.
We can say that the maximum share of local inputs is again around 40%.
In this purer examination, the results of fixed effects are also worth being reported.
They are in Table 14 and have three noteworthy points. First, the likelihood of
affiliates’ FTA utilization falls significantly from 2006 to 2008. Thus, we can say that
the rise of FTA utilization in some countries, which was detected in Section 4, is
induced by changes of firms’ attributes in those countries rather than by the
improvement of FTA scheme. In order to clarify the causes of such negative
significance, the further investigation will be necessary. Second, the FTA is more
likely to be utilized in textile and automobile sectors and is less likely in plastic
products, electrical machinery and electronic equipment, and electric and electronic
parts and components. The contrast between automobile and electrical machineries
would be attributed to the differences in tariff rates. As pointed out above, most of the
IT products can be imported without paying import duties under the ITA, while

443
automobile products including parts and components usually has high import duties.
Interestingly, the estimated result on the textile industry shows positive signs at
significant levels. This reflects that since FTAs by ASEAN mostly reduce tariffs on
textiles to a low level and the units of trade volumes is rather big, the benefits are
expected to be large in this industry. To put it differently, the large reduction of tariffs
might encourage utilizing FTAs. Lastly, and equally important, even after controlling
other factors including those due to the differences in the main sectors, firms in the
Philippines and Vietnam are less likely to utilize FTA schemes. Thus, these estimated
results might suggest that the operational procedures to obtain certificates in those
countries are more cumbersome than other countries.
Table 14. Dummy Coefficients in Equation (IV)
2007 -0.109 Textiles 1.358*** Glass and glass product -0.444 Malaysia -0.121[0.082] [0.460] [0.315] [0.102]
2008 -0.172** Wearing apparel 0.355 Basic iron and steel -0.221 Singapore 0.019[0.079] [0.315] [0.235] [0.140]
Wood products 0.061 Non-ferrous metals -0.22 Indonesia 0.16[0.412] [0.236] [0.105]
Furniture -0.528 Metal products -0.296 Philippine-0.527***[0.400] [0.201] [0.106]
Paper products 0.122 General machinery -0.193 Vietnam -0.315**[0.439] [0.226] [0.137]
Chemicals -0.15 Electric machinery -0.493**[0.207] [0.205]
Petroleum product 0.391 Electric parts -0.764***[0.391] [0.203]
Plastic products -0.598*** Automobile 0.541*[0.219] [0.301]
Medical products 0.152 Automobile parts 0.227[0.517] [0.195]
Rubber products -0.122 Precision machinery -0.342[0.258] [0.343]
Others -0.337*[0.196]
Year Sector CountryBase: 2006 Base: Food Base: Thailand
Notes: Robust standard errors are in parentheses. ***, **, and * show 1%, 5%, and 10%
significance, respectively.

444
Furthermore, we conducted some estimation. The decline of firms using FTA
schemes in either exporting or importing from the sample does not change our results at
all. In addition, we eliminated firms located in Singapore. As argued before, answers
for FTA utilization are doubtful in Singapore. Indeed, also in our sample, 53 firms
answer that they utilize FTA schemes in importing (see Table 11). However, by
dropping the firms in Singapore we obtained the qualitatively unchanged results. As a
result, we conclude that our empirical results are robust.
6. Issues on Current FTAs
Rule of origin is at the center of discussions, when it comes to spaghetti bowl
phenomenon. Currently, 19 FTAs have already come into effect in ASEAN + 6 region
making up ASEAN10, Japan, China, Korea, Australia, New Zealand and India, however
rules of origin adopted within those FTAs differ from each other.
There are three main issues to be discussed in relation to the rules of origin, which
are 1) criterion to determine the origin of goods, 2) procedure to certify the origin of
goods, and 3) intermediary trade. Rules of origin is likely to countervail custom tariff
eliminations under FTAs to some extent through increasing administrative costs and
affecting lead times, even though they are a prerequisite for any FTA except for
complete customs union, in order to avoid circumvented imports from non-statutory
countries. In other words, FTA needs rules of origin, but creates additional costs to
countervail the benefits of an FTA. Therefore it is critical to discuss what a
cost-efficient rule of origin is. A flexible criterion and a procedure to certify origin of
445
goods may be able to reduce them and increase its utilization.
6.1. A Flexible Criterion will Eliminate Administrative Costs
There are four main types of criteria to determine the origin of goods; these are 1) a
value added content criterion, 2) a change in tariff classification criterion, 3) an optional
criterion to allow firms a choice of whether to be of either a value added content
criterion or a change in tariff classification criterion, and 4) a dual criterion to require
firms the use of both of them. It is generally recognized that an optional criterion is
the most flexible and cost efficient criterion because firms are allowed to choose one of
the criterion they will use. As the value added content criterion would be generally
more appropriate for goods using large numbers of components and the change in tariff
classification criterion would be more suited for goods using less numbers of
components, the optional criterion may contribute to help reducing administrative costs
since firms can choose either of the cost efficient criterions.
On the other hand, a dual criterion unquestionably leads firms to cover higher
administrative costs, because meeting both of the criteria simply causes increased costs
in comparison with the optional criterion. Since it is the least cost efficient way to
determine origin of goods, it should be avoided being adopted as the rule of origin in
principle.
The change in tariff classification criterion is also an effective way in the sense of
flexibility and predictability next to the optional criterion in general, because it is not
affected by currency fluctuations or prices of imported components which may cause an
alteration to the origin under a value added content criterion.

446
Table 15. Rules of Origin Adapted in Major FTAs in Asia Pacific Region
FTA Criteria to determine origin Procedures to certify origin
Japan-Malaysia FTA Optional criterion Third party certificate system
ASEAN-Korea Optional criterion Third party certificate system
Japan-Thailand FTA Optional criterion Third party certificate system
AFTAOptional criterion. Shifted from Valueadded content criterion in 2008. Third party certificate system
Japan-Singapore FTA Change in tariff classificationcriterion
Third party certificate system
Thailand-Australia FTA Change in tariff classificationcriterion
Third party certificate system
Thailand-New Zealand FTA Change in tariff classificationcriterion
Self-certificate system
Australia-New Zealand FTAChange in tariff classificationcriterion. Shifted from Value addedcontent criterion in 2007.
Self-certificate system
ASEAN-China FTA Value added content criterion Third party certificate system
Singapore-New Zealand FTA Value added content criterion Self-certificate system
Singapore-Australia FTA Value added content criterion Hybrid system(approved productsystem)
Thailand-India FTA(Early Harvest onDual criterion Third party certificate system
Singapore-India FTA Dual criterion Third party certificate system
Table 15 shows which criterion each FTA in the Asia Pacific region adopts to
determine the origin of goods. Although criteria differ by FTAs, it is a tendency that
the number of FTAs adopting the optional criterion or change in a tariff classification
criterion has incremented in recent years. For instance, AFTA, which adopted a value
added content criterion for a period of time after 1993, when AFTA came into effect,
introduced an optional criterion after August 2008. In addition, the Japan-Malaysia
FTA, Japan-Thailand FTA and ASEAN-Korea FTA, which recently have been in effect,
adopted this flexible rule. The Japan-Singapore FTA, Thailand-Australia FTAs and
Thailand-New Zealand FTA adopt a change in tariff classification criterion.
Furthermore, the Australia-New Zealand FTA has been shifted to its rule of origin to a
447
change in tariff classification criterion from a value added content criterion in 2007.
Meanwhile, India-Thailand FTA and India-Singapore FTA, which India is involved,
require firms to use dual criterion.
6.2. Flexible Procedure to Certify Origin of Goods may Exclude Risks Affecting
Lead Time
The other significant issue in terms of rules of origin is a procedure to certify origin
of goods, because it may affect the lead time of goods from an exporting country to an
importing country. The procedure has not yet been discussed in detail in relation with
FTAs in the Asia Pacific region, even though discussion on criteria to determine the
origin of goods has been made frequently.
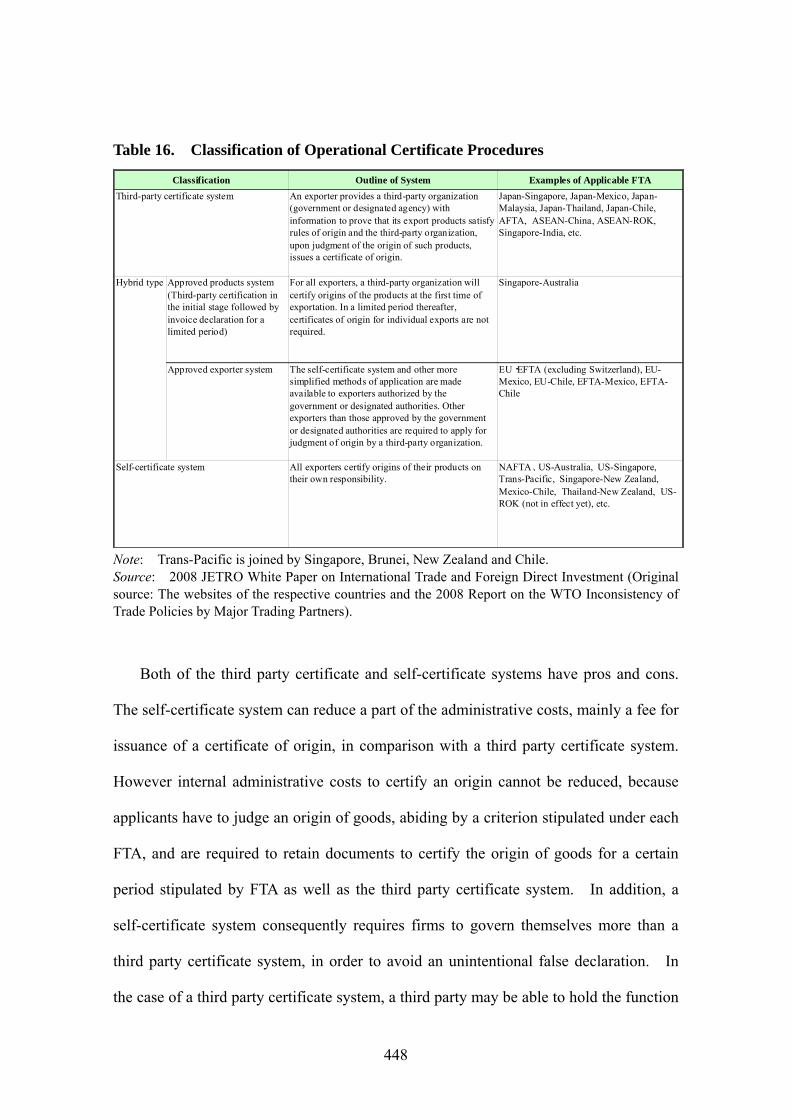
There are mainly three methods of procedure to certify the origin of goods, 1) a
third party certificate system, 2) a self-certificate system, and 3) a hybrid system of third
party certification and self-certification.
A third party certificate system is literally a system that a third party officially
appointed by a statutory government takes a role in issuing a certificate of origin after
judging an application filed by firms utilizing a preferential rate of FTAs. A relevant
ministry or a chamber of commerce is usually appointed as a third party to judge an
application. Most of the FTAs in effect in the Asia Pacific region adopt this system.
In the meantime, under a self-certificate system, all exporters declare an origin of goods
on their own without external assistance or on a designated form, which is broadly
adopted in FTAs involving the U.S. (see Table 16).
448
Table 16. Classification of Operational Certificate Procedures
Outline of System
Third-party certificate system An exporter provides a third-party organization(government or designated agency) withinformation to prove that its export products satisfyrules of origin and the third-party organization,upon judgment of the origin of such products,issues a certificate of origin.
Japan-Singapore, Japan-Mexico, Japan-Malaysia, Japan-Thailand, Japan-Chile,AFTA, ASEAN-China, ASEAN-ROK,Singapore-India, etc.
Approved products system(Third-party certification inthe initial stage followed byinvoice declaration for alimited period)
For all exporters, a third-party organization willcertify origins of the products at the first time ofexportation. In a limited period thereafter,certificates of origin for individual exports are notrequired.
Singapore-Australia
Approved exporter system The self-certificate system and other moresimplified methods of application are madeavailable to exporters authorized by thegovernment or designated authorities. Otherexporters than those approved by the governmentor designated authorities are required to apply forjudgment of origin by a third-party organization.
EU・EFTA (excluding Switzerland), EU-Mexico, EU-Chile, EFTA-Mexico, EFTA-Chile
All exporters certify origins of their products ontheir own responsibility.
NAFTA、US-Australia, US-Singapore,Trans-Pacific, Singapore-New Zealand,Mexico-Chile, Thailand-New Zealand, US-ROK (not in effect yet), etc.
Classification Examples of Applicable FTA
Hybrid type
Self-certificate system
Note: Trans-Pacific is joined by Singapore, Brunei, New Zealand and Chile. Source: 2008 JETRO White Paper on International Trade and Foreign Direct Investment (Original source: The websites of the respective countries and the 2008 Report on the WTO Inconsistency of Trade Policies by Major Trading Partners).
Both of the third party certificate and self-certificate systems have pros and cons.
The self-certificate system can reduce a part of the administrative costs, mainly a fee for
issuance of a certificate of origin, in comparison with a third party certificate system.
However internal administrative costs to certify an origin cannot be reduced, because
applicants have to judge an origin of goods, abiding by a criterion stipulated under each
FTA, and are required to retain documents to certify the origin of goods for a certain
period stipulated by FTA as well as the third party certificate system. In addition, a
self-certificate system consequently requires firms to govern themselves more than a
third party certificate system, in order to avoid an unintentional false declaration. In
the case of a third party certificate system, a third party may be able to hold the function

449
to check an application and provide consultation to firms. In the U.S. which adopts a
self-certificate system, there was a case that a heavy fine was imposed on a firm for a
false declaration.
Furthermore, a self-certificate system may hold a disadvantage increasing the
chances of circumvented imports from non-statutory countries. Allowing firms to
declare an origin of goods on their own, it may be relatively more difficult to detect a
fraudulent declaration than a third party certificate system.
On the other hand, a self-certificate system has an advantage that it can completely
exclude possibility of affecting the lead time of goods in a negative manner. A
certificate of origin under a third party certificate system is usually issued right after
completing the shipping of goods, since a bill of landing is one of documents required
for the issuance of a certificate of origin. Therefore it might be possible to create a
case of delay in reaching a certificate of origin at an importing country. The delay
would add the unnecessary costs of warehouse fees or administrative costs like the tax
refund, in the case imports of goods which are permitted along with a tentative payment
of custom duty. In this regard, the self-certificate system is free to accumulate extra
costs to partially counteract the benefits of FTAs.
Even under the third party certificate system, sometimes it is possible to avoid those
unnecessary costs, if a bill of landing is not required by a third party or a certificate of
origin is issued prior to shipping. In Japan, it is not required by a third party, while it
is generally demanded to be presented to third parties in ASEAN countries.
A hybrid system is a certificate system that allows an approved exporter to use the
self-certificate system, which is broadly adopted by EU in their FTAs. Under the
system, approved exporters are qualified, under a criterion of the number of exports in a

450
year and a degree of governance by an authority, to use a self-certificate system, while
the rest of the exporters utilize a third party certificate system. It is characterized as a
system involving benefits of both systems.
6.3. Allowing an Intermediary Trade will Contribute to an Increase in FTA
Utilization
A final issue, which can avoid countervailing benefits of the elimination of custom
duties, is an intermediary trade, which is defined as re-invoicing and back to back
certificates.
An intermediary trade is defined as a trade going through a third country, and is
widely observed in trades in the Asia Pacific region. Particularly large scale firms
operating in the region generally have regional headquarters in a country of ASEAN
such as in Singapore, which control the entire management of group firms in the region.
Re-invoicing means a way of billing that an invoice is issued not by a firm
manufacturing a product in one country but by a firm in another country where the
regional headquarters are generally located. Taking AFTA for instance, a regional
headquarters in Singapore purchases products manufactured by a group firm in one
country of ASEAN and sells them to the other ASEAN countries, along with this, goods
are directly exported to an importing country. In other words, it means that a
commercial transaction flows indirectly while a distribution of goods passes through
directly.
There is another way of intermediary trade that both a commercial transaction and a
distribution of goods go through indirectly. In this case, in order to take advantage of
an FTA in an importing county, a back to back certificate is required to be presented,
451
which is re-issued by a statutory country based on a certificate of origin issued in
advance by the other statutory country in which a firm actually manufactures a product.
Therefore, a back to back certificate is applicable to an FTA making up of more than
three statutory countries.
The significant advantage of the above mentioned method is that firms are able to
keep inventories of their products at the most convenient place and export part of them
depending on demands separately, if it is allowed under the FTA.
However, whether these ways of trade are allowed also differs by FTAs in effect in
the Asia Pacific region. Some FTAs such as AFTA, Japan-Thailand FTA and
Japan-Malaysia FTA explicitly incorporate a provision permitting use of intermediary
trade in the operational certificate procedure parts of agreements. On the other hand,
some FTAs or some of the statutory countries do not permit using it, because these
agreements do not incorporate the relevant provisions. There are some cases that firms
gave up utilizing FTAs due to an intermediary trade being unavailable in their countries.
A rule of origin is indispensable with FTAs, while it is also true that it incurs
additional costs to countervail the benefits of customs elimination. Therefore it is of
vital importance that a flexible criterion, procedure and rules are effective in addressing
this issue, which will contribute to an increased utilization of FTAs in effect.
7. Conclusions
1. Almost all of the customs offices in East Asia have failed to collect transaction
records on export and import to utilize FTA preferential tariffs. It might be costly

452
to establish a system to collect the transaction records. Instead, a business survey
method may be reasonable and useful to investigate the utilization of FTAs.
JETRO has conducted the business survey which contains several questions
concerning FTAs. The survey, however, covers only Japanese affiliates. ERIA
should conduct a business survey to investigate the operations of indigenous firms
and other foreign affiliates in ASEAN.
2. The utilization rate of FTAs in terms of number of firms is not high in ASEAN. It
is rather low compared to that in NAFTA although the rules of origin criterion are
less restrictive in ASEAN than in NAFTA. This fact suggests that administrative
costs to use FTAs in ASEAN are high due to the demanding operational procedures
and inefficient administrative procedures. Operational procedures to certify the
origin of goods has not yet been discussed in detail in relation with FTAs in the
Asia Pacific region.
3. The investment promotion schemes that exempt tariffs on intermediate goods for
export purpose are widely utilized in ASEAN. Such schemes, however, are
viewed as opposed to the Trade Related Investment Measures (TRIMs). The
administration costs of investment promotion schemes are about 1.9% on average
within ASEAN. If the administrative costs in obtaining the FTA preferential
tariffs are reduced to be lower than this figure, FTAs would be utilized more.
4. Firms in Malaysia, the Philippines, and Vietnam are less likely to utilize FTA
schemes. These estimated results suggest that the operational procedures to obtain
certificates in those countries may be more cumbersome than in other countries.
5. Econometric analysis obtained the results that Firms with a larger size in the
number of employees tend to utilize FTAs more. This suggests that current FTAs
453
don’t benefit all equally. To realize an equitable development for SMEs and small
countries, tariffs reductions at the WTO Doha round should be pursued at the same
time.
6. FTAs in the ASEAN countries seem to be selectively utilized according to each
industry: the textile industry utilizes FTAs well but electrical machinery, electronics
and precision machinery don’t use FTAs. This indicates that the margin between
the MFN tariffs and FTA preferential tariffs provide incentive to utilize FTAs. A
substantial reduction in FTA's preferential tariffs might encourage FTA utilization
within these nonparticipating industries.

454
References
Baldwin, R. (2008). “The East Asian Noodle Bowl Syndrome” in Hiratsuka and Kimura
(eds.), East Asia’s Economic Integration: Progress and Benefit. London:
Palgrave Macmillan.
Chia, S. Y. (2008). “Singapore Case Study on FTA Impact on Business”. Paper
presented at the ADB Research Workshop in Bangkok, 31 January 2008.
Harrigan, F.; W. James; M. Plummer; and F. Zhai (2006). “Bilateralism or Regionalism:
Alternative Scenarios for Asian Trade Liberalization”. Paper presented at the
conference, Shaping the Future: Prospects for Asia’s Long-term Development
Over the Next Two Decades, ADB Resident Mission, Bangkok, December.
Hiratsuka, D.; I. Isono; H. Sato; and S. Umezaki (2008). “Escaping from FTA Trap and
Spaghetti Bowl Problem in East Asia: An Insight from the Enterprise Survey in
Japan”, in Hadi Soesastro (ed.), Deepening Economic Integration in East Asia:
The ASEAN Economic Community and Beyond, IDE-JETRO: Chiba.
Hiratsuka, D.; I. Isono; and H. Sato (2009). “A Study on the Impact of Free Trade
Agreements on Business Activity in Asia: the Case of Japan”. Paper presented
at a conference on FTA Impact Study organized by ADB/ADBI/IDB on 26
January 2009, Tokyo.
James, W. (2006). “Rules of Origin in Emerging Asia-Pacific Preferential Trade
Agreements: Will PTAs Promote Trade and Development”, Asia-Pacific
Research and Training Network on Trade Working Paper Series, No.19.
Kawai, M. and G. Wignaraja (2007). “ASEAN+3 or ASEAN+6: Which way forward?.
ADB.” Paper presented at the Conference on Multilateralising Regionalism,
sponsored and organized by WTO-HEI Co-organized by the Centre for
Economic Policy Research (CEPR).
Kohpaiboon A. (2008). “Export Creation of AFTA and the Response of the Private
Sector: Evidence from Thai Manufacturing”. Paper prepared at the 11th
International Convention of the East Asian Economic Association 15-16
November 2008, Manila.
Melitz, M. (2003). “The Impact of Trade on Intra-Industry Reallocations and Aggregate
Industry Productivity,” Econometrica, 71(6): 1695-1725.
455
Oyamada, K. (2004). “Forward-Looking Effects of Trade Liberalization between Japan
and ASEAN Members: In the Framework of Ramsey-Cass-Koopmans Type
Economic Growth.” Paper presented to the 7th Annual Conference on Global
Economic Analysis, the World Bank, Washington, D.C.
Petri, P. (2008). “Multitrack Integration in East Asia: Noodle Bowl or Matrix?” Asia
Pacific Issues, No. 86, East-West Centre.