maximize csi-owner retention-profits...maximize csi-owner retention-profits presented by: don reed ....
TRANSCRIPT

Managing the Essential Eight Controllables
Maximize CSI-Owner Retention-Profits
Presented by:
Don Reed

Where are we Today
Collectible Efficiency Below 60%
Booked Out Two Weeks in Advance
Can’t Find Technicians
Repair Cycle Times Excessive
Low Profit Margin on Parts
Missed Opportunities with Chassis Work
Substandard Customer Satisfaction
Lack of Up-Sell by Service Advisor
Lack of Accountability for Performance
Low Service Absorption Copyright 2014 RVDealerPRO LLC ©

Service Absorption
Definition: The percentage of dealership
expenses, (less New & Used Unit Sales
departments variable expenses), that are
absorbed by the fixed operations departmental
gross profit
What does 100% Service Absorption mean to
the Dealership’s profitability?
No New or Used Unit Sales Dependency
Copyright 2014 RVDealerPRO LLC ©

How to Increase Absorption
Reduce Expenses
Increase Parts & Labor Profit Margins
Increase Sales per Repair Order
Increase the Number of Repair Orders
Copyright 2014 RVDealerPRO LLC ©

100%
Service
Absorption Effective
Labor Rate
Hours of Operation
Calendar Utilization
Technician Productivity
Number of Technicians
Working Days
The Essential Eight Controllables
Hours
Available
Gross Profit Margins
Copyright 2014 RVDealerPRO LLC ©

Controllable # 1
Working Days What are the Options?
Open Saturday and/or Sunday
Open Holidays
How to Implement?
4 Day Work Week @ 10 Hours per Day
Production Groups (3 Rotating Shifts)
Lateral Support
Simple Support
Production Teams
Copyright 2014 RVDealerPRO LLC ©

Monday Tuesday Wednesday Thursday Friday Saturday Sunday
Team 1 Team 1 Team 1 Team 1 Off 1 Off 2 Off 3
Off 4 Off 5 Team 2 Team 2 Team 2 Team 2 Off 1
Team 3 Team 3 Off 1 Off 2 Team 3 Team 3 Off 1
Monday Tuesday Wednesday Thursday Friday Saturday Sunday
Off 4 Off 5 Team 1 Team 1 Team 1 Team 1 Off 1
Team 2 Team 2 Off 1 Off 2 Team 2 Team 2 Off 1
Team 3 Team 3 Team 3 Team 3 Off 1 Off 2 Off 3
Monday Tuesday Wednesday Thursday Friday Saturday Sunday
Team 1 Team 1 Off 1 Off 2 Team 1 Team 1 Off 1
Team 2 Team 2 Team 2 Team 2 Off 1 Off 2 Off 3
Off 4 Off 5 Team 3 Team 3 Team 3 Team 3 Off 1
W
e
e
k
3
Teams/Groups 4 day 10 Hour ScheduleW
e
e
k
1
W
e
e
k
2
Three Week Rotation Copyright 2014 RVDealerPRO LLC ©

NOW CHANGES Difference Annualized
1 Work Days Per Month X 21 25 4
2 Calendar Utilization % X 85.0% 85.0% 0.0%
3 Hours Available Daily X 8 8 0
4 Techs Available Daily X 8 8 0
5 Tech Productivity % X 55.0% 55.0% 0.0%
Monthly Hours Produced = 628.3 748.0 119.7
6 Effective Labor Rate Overall (CWI) X $85.00 $85.00 $0.00
Monthly Labor Sales = $53,407 $63,580 $10,173
7 Gross Profit Margin (Labor) X 70.0% 70.0% 0.0%
Monthly Labor Gross Profit = $37,385 $44,506 $7,121
Parts to Labor Ratio % X 60.0% 60.0% 0.0%
Monthly Parts Sales = $32,044 $38,148 $6,104
Gross Profit Margin (Parts) X 30.0% 30.0% 0.0%
Monthly Parts Gross Profit = $9,613 $11,444 $1,831
8 Monthly Service Expenses - $34,935 $37,783 $2,848
Expenses as a Percent of Gross (Guide 80%) 93.4% 84.9% -8.6%
Monthly Parts Expenses - $8,907 $9,639 $732
Expenses as a Percent of Gross (Guide 70%) 92.7% 84.2% -8.4%
Monthly Service NET = $2,450 $6,723 $4,273 $51,271
Monthly Parts NET = $706 $1,805 $1,099 $13,184
Combined Parts & Service NET Profit/Loss = $3,156 $8,528 $5,371 $64,455
Essential Eight Pro Forma
Copyright 2014 RVDealerPRO LLC ©

Controllable #2
Calendar Utilization Typically the Least Managed Controllable
Calendar Utilization is a measure of the days actually worked as a percentage of the available work days.
Calendar Utilization is Affected by:
Vacation
Sick Leave (Deer Season & Harvest Time)
Replacement Time (Turnover)
Training
Seasonal Closings Copyright 2014 RVDealerPRO LLC ©

Calendar Utilization Calculation
Work Days - Vacation - Training - Sick - Replacement - Seasonal
Work Days
What Opportunities do You see
for Improvement in Your Store?
Formula:
Copyright 2014 RVDealerPRO LLC ©
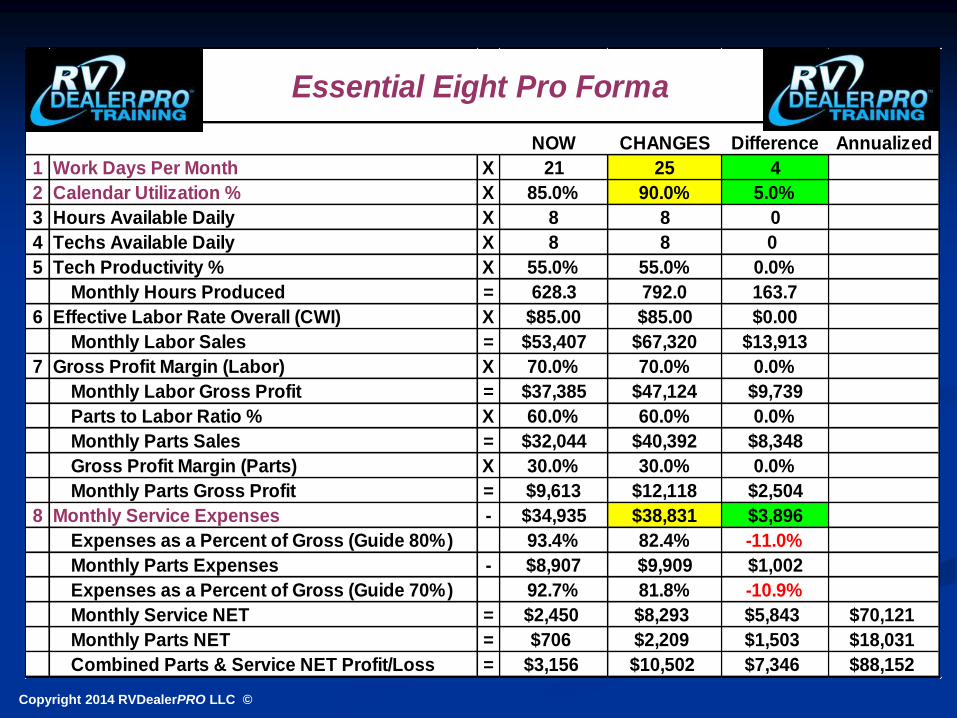
NOW CHANGES Difference Annualized
1 Work Days Per Month X 21 25 4
2 Calendar Utilization % X 85.0% 90.0% 5.0%
3 Hours Available Daily X 8 8 0
4 Techs Available Daily X 8 8 0
5 Tech Productivity % X 55.0% 55.0% 0.0%
Monthly Hours Produced = 628.3 792.0 163.7
6 Effective Labor Rate Overall (CWI) X $85.00 $85.00 $0.00
Monthly Labor Sales = $53,407 $67,320 $13,913
7 Gross Profit Margin (Labor) X 70.0% 70.0% 0.0%
Monthly Labor Gross Profit = $37,385 $47,124 $9,739
Parts to Labor Ratio % X 60.0% 60.0% 0.0%
Monthly Parts Sales = $32,044 $40,392 $8,348
Gross Profit Margin (Parts) X 30.0% 30.0% 0.0%
Monthly Parts Gross Profit = $9,613 $12,118 $2,504
8 Monthly Service Expenses - $34,935 $38,831 $3,896
Expenses as a Percent of Gross (Guide 80%) 93.4% 82.4% -11.0%
Monthly Parts Expenses - $8,907 $9,909 $1,002
Expenses as a Percent of Gross (Guide 70%) 92.7% 81.8% -10.9%
Monthly Service NET = $2,450 $8,293 $5,843 $70,121
Monthly Parts NET = $706 $2,209 $1,503 $18,031
Combined Parts & Service NET Profit/Loss = $3,156 $10,502 $7,346 $88,152
Essential Eight Pro Forma
Copyright 2014 RVDealerPRO LLC ©

Controllable #3
Hours Available
Opportunities for Improvement
6 Days @ 10 Hours each With Three Groups
5 Days @ 9 Hours Each
Second Shift
Production Teams (Multiple Technicians per Bay)
Copyright 2014 RVDealerPRO LLC ©
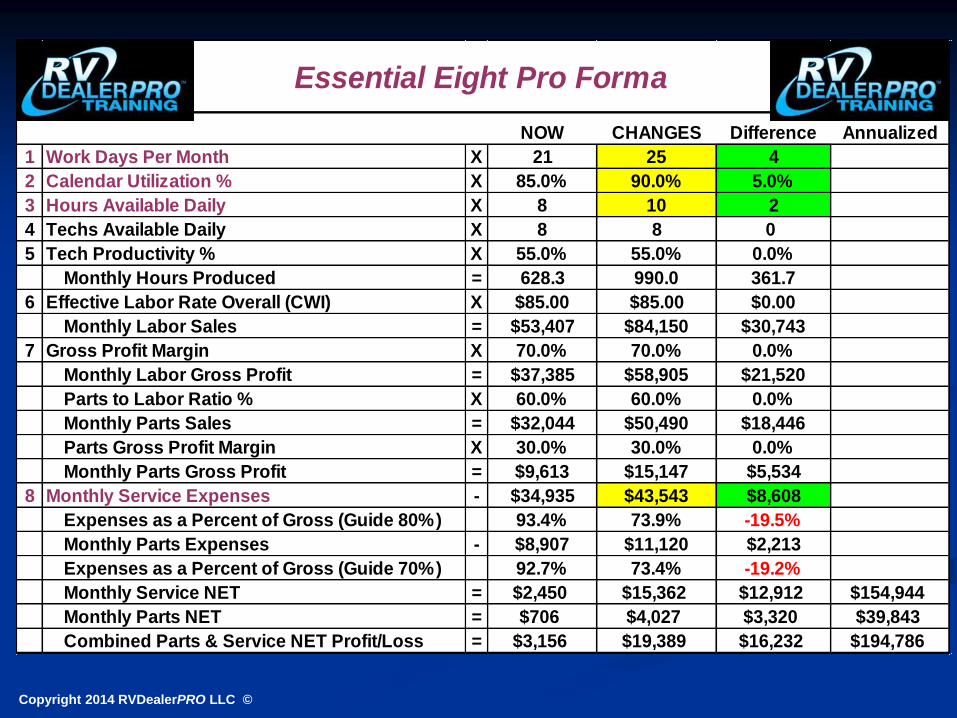
NOW CHANGES Difference Annualized
1 Work Days Per Month X 21 25 4
2 Calendar Utilization % X 85.0% 90.0% 5.0%
3 Hours Available Daily X 8 10 2
4 Techs Available Daily X 8 8 0
5 Tech Productivity % X 55.0% 55.0% 0.0%
Monthly Hours Produced = 628.3 990.0 361.7
6 Effective Labor Rate Overall (CWI) X $85.00 $85.00 $0.00
Monthly Labor Sales = $53,407 $84,150 $30,743
7 Gross Profit Margin X 70.0% 70.0% 0.0%
Monthly Labor Gross Profit = $37,385 $58,905 $21,520
Parts to Labor Ratio % X 60.0% 60.0% 0.0%
Monthly Parts Sales = $32,044 $50,490 $18,446
Parts Gross Profit Margin X 30.0% 30.0% 0.0%
Monthly Parts Gross Profit = $9,613 $15,147 $5,534
8 Monthly Service Expenses - $34,935 $43,543 $8,608
Expenses as a Percent of Gross (Guide 80%) 93.4% 73.9% -19.5%
Monthly Parts Expenses - $8,907 $11,120 $2,213
Expenses as a Percent of Gross (Guide 70%) 92.7% 73.4% -19.2%
Monthly Service NET = $2,450 $15,362 $12,912 $154,944
Monthly Parts NET = $706 $4,027 $3,320 $39,843
Combined Parts & Service NET Profit/Loss = $3,156 $19,389 $16,232 $194,786
Essential Eight Pro Forma
Copyright 2014 RVDealerPRO LLC ©

Controllable #4
Technicians Available What type of Technicians do you Need?
Lower Skilled Technicians (Maintenance)
PDI Technicians
Chassis Technicians
Where do you find them?
Aftermarket Service Facilities
Handymen (Carpenters, Plumbers &
Electricians)
Repairmen (Heating, Cooling & Appliances)
Other RV & Auto Dealers Copyright 2014 RVDealerPRO LLC ©

NOW CHANGES Difference Annualized
1 Work Days Per Month X 21 25 4
2 Calendar Utilization % X 85.0% 90.0% 5.0%
3 Hours Available Daily X 8 10 2
4 Techs Available Daily X 8 9 1
5 Tech Productivity % X 55.0% 55.0% 0.0%
Monthly Hours Produced = 628.3 1113.8 485.4
6 Effective Labor Rate Overall (CWI) X $85.00 $85.00 $0.00
Monthly Labor Sales = $53,407 $94,669 $41,262
7 Gross Profit Margin X 70.0% 70.0% 0.0%
Monthly Labor Gross Profit = $37,385.0 $66,268.1 $28,883.1
Parts to Labor Ratio % X 60.0% 60.0% 0.0%
Monthly Parts Sales = $32,044 $56,801 $24,757
Parts Gross Profit Margin X 30.0% 30.0% 0.0%
Monthly Parts Gross Profit = $9,613 $17,040 $7,427
8 Monthly Service Expenses - $34,935 $46,488 $11,553
Expenses as a Percent of Gross (Guide 80%) 93.4% 70.2% -23.3%
Monthly Parts Expenses - $8,907 $11,878 $2,971
Expenses as a Percent of Gross (Guide 70%) 92.7% 69.7% -22.9%
Monthly Service NET = $2,450 $19,780 $17,330 $207,958
Monthly Parts NET = $706 $5,163 $4,456 $53,475
Combined Parts & Service NET Profit/Loss = $3,156 $24,942 $21,786 $261,433
Essential Eight Pro Forma
Copyright 2014 RVDealerPRO LLC ©
Controllable #5
Technician Productivity
Formula: # of Technician hours Billed on the
Repair Order divided by # of Technician
Hours Worked
How to Increase Productivity to 100%?
Install Performance Based Pay Plans
Measure Productivity Daily
Dispatch Based on Skill Level
Copyright 2014 RVDealerPRO LLC ©

Controllable #5
Technician Productivity
Special Order Parts Process
What is the Primary Mission of a Parts
Department?
Improve Work Mix Retail vs. Warranty
Maintenance Menus (Low Skill & High Return)
Inspection Process for Maximum Reliability
Service Advisor must “Advise”
Utilize a Flat Rate Labor Time Guide
Schedule For Off-Season
-Support the Technicians-
Copyright 2014 RVDealerPRO LLC ©

NOW CHANGES Difference Annualized
1 Work Days Per Month X 21 25 4
2 Calendar Utilization % X 85.0% 90.0% 5.0%
3 Hours Available Daily X 8 10 2
4 Techs Available Daily X 8 9 1
5 Tech Productivity % X 55.0% 80.0% 25.0%
Monthly Hours Produced = 628.3 1620.0 991.7
6 Effective Labor Rate Overall (CWI) X $85.00 $85.00 $0.00
Monthly Labor Sales = $53,407 $137,700 $84,293
7 Gross Profit Margin X 70.0% 70.0% 0.0%
Monthly Labor Gross Profit = $37,385 $96,390 $59,005
Parts to Labor Ratio % X 60.0% 60.0% 0.0%
Monthly Parts Sales = $32,044 $82,620 $50,576
Parts Gross Profit Margin X 30.0% 30.0% 0.0%
Monthly Parts Gross Profit = $9,613 $24,786 $15,173
8 Monthly Service Expenses - $34,935 $58,537 $23,602
Expenses as a Percent of Gross (Guide 80%) 93.4% 60.7% -32.7%
Monthly Parts Expenses - $8,907 $14,976 $6,069
Expenses as a Percent of Gross (Guide 70%) 92.7% 60.4% -32.2%
Monthly Service NET = $2,450 $37,853 $35,403 $424,836
Monthly Parts NET = $706 $9,810 $9,104 $109,243
Combined Parts & Service NET Profit/Loss = $3,156 $47,663 $44,507 $534,079
Essential Eight Pro Forma
Copyright 2014 RVDealerPRO LLC ©

Controllable #6
Effective Labor Rate
Definition: The Actual Labor Rate paid by the
Sales department, the Manufacturer & the
Retail Customer for Services Performed
Formula: Total Labor Sales divided by Total
Hours Billed on the Repair Orders =
Effective Labor Rate
Question: Why is the Effective Labor Rate
typically less than the Posted Retail Rate?
Answer: Discounting
Copyright 2014 RVDealerPRO LLC ©

NOW CHANGES Difference Annualized
1 Work Days Per Month X 21 25 4
2 Calendar Utilization % X 85.0% 90.0% 5.0%
3 Hours Available Daily X 8 10 2
4 Techs Available Daily X 8 9 1
5 Tech Productivity % X 55.0% 80.0% 25.0%
Monthly Hours Produced = 628.3 1620.0 991.7
6 Effective Labor Rate Overall (CWI) X $85.00 $90.00 $5.00
Monthly Labor Sales = $53,407 $145,800 $92,393
7 Gross Profit Margin X 70.0% 70.0% 0.0%
Monthly Labor Gross Profit = $37,385 $102,060 $64,675
Parts to Labor Ratio % X 60.0% 60.0% 0.0%
Monthly Parts Sales = $32,044 $87,480 $55,436
Parts Gross Profit Margin X 30.0% 30.0% 0.0%
Monthly Parts Gross Profit = $9,613 $26,244 $16,631
8 Monthly Service Expenses - $34,935 $60,805 $25,870
Expenses as a Percent of Gross (Guide 80%) 93.4% 59.6% -33.9%
Monthly Parts Expenses - $8,907 $15,559 $6,652
Expenses as a Percent of Gross (Guide 70%) 92.7% 59.3% -33.4%
Monthly Service NET = $2,450 $41,255 $38,805 $465,660
Monthly Parts NET = $706 $10,685 $9,978 $119,741
Combined Parts & Service NET Profit/Loss = $3,156 $51,940 $48,783 $585,401
Essential Eight Pro Forma
Copyright 2014 RVDealerPRO LLC ©

Controllable #7
Gross Profit Margins
Gross Profit = The Sale Amount of a
Product or Service Minus the Cost of Sale
Gross Profit Margin = The Gross Profit
divided by the Sale Amount
Sale Amount Cost of Sale Gross Profit Margin
$100-Labor $25-Tech $75 75%
$100-Part $65-Supplier $35 35%
Copyright 2014 RVDealerPRO LLC ©

NOW CHANGES Difference Annualized
1 Work Days Per Month X 21 25 4
2 Calendar Utilization % X 85.0% 90.0% 5.0%
3 Hours Available Daily X 8 10 2
4 Techs Available Daily X 8 9 1
5 Tech Productivity % X 55.0% 80.0% 25.0%
Monthly Hours Produced = 628.3 1620.0 991.7
6 Effective Labor Rate Overall (CWI) X $85.00 $90.00 $5.00
Monthly Labor Sales = $53,407 $145,800 $92,393
7 Gross Profit Margin X 70.0% 75.0% 5.0%
Monthly Labor Gross Profit = $37,385 $109,350 $71,965
Parts to Labor Ratio % X 60.0% 60.0% 0.0%
Monthly Parts Sales = $32,044 $87,480 $55,436
Parts Gross Profit Margin X 30.0% 35.0% 5.0%
Monthly Parts Gross Profit = $9,613 $30,618 $21,005
8 Monthly Service Expenses - $34,935 $63,721 $28,786
Expenses as a Percent of Gross (Guide 80%) 93.4% 58.3% -35.2%
Monthly Parts Expenses - $8,907 $17,309 $8,402
Expenses as a Percent of Gross (Guide 70%) 92.7% 56.5% -36.1%
Monthly Service NET = $2,450 $45,629 $43,179 $518,148
Monthly Parts NET = $706 $13,309 $12,603 $151,234
Combined Parts & Service NET Profit/Loss = $3,156 $58,938 $55,782 $669,382
Essential Eight Pro Forma
Copyright 2014 RVDealerPRO LLC ©

Controllable #8
Control Expenses
Shop Policy Adjustment
Lot Damage
Comebacks
Tools & Shop Supplies
Charge Out Supplies @ 7% of Labor (State Laws?)
Store & Dispense Supplies in the Parts Department
(Log)
Personnel (1 Support Person for every 2
Productive)
Copyright 2014 RVDealerPRO LLC ©

Controllable #8
Control Expenses
Parts Obsolescence (S. O. Parts not Installed)
Maintain a Special Parts On Order Sheet
Parts Department Notifies Advisor when
Parts Arrive
Service Advisor Calls Customer to Schedule
Appointment
Warranty Write-Offs
Improper Submission (Time & Three C’s)
Lack of Follow-Up (Warranty Log) Copyright 2014 RVDealerPRO LLC ©

Let’s Compare to Sales Department
Performance
Essential Eight NET Profit Potential
$55,782 per Month
$669,382 per year If I’m Wrong by 50% you Still Get
$334,691 NET Profit That Equates to Selling an Additional
67 Units at $5,000 per Retail Unit Copyright 2014 RVDealerPRO LLC ©

Essential Eight Controllables
Strategy for Implementation
Evaluate your Essential Eight Opportunities
Build your Plan for Implementation
Sell your Employees on the Benefits of your Plan
Measure their Performance Daily
Compensate to Motivate
Get Ready for Change
Hold Your People Accountable!
Copyright 2014 RVDealerPRO LLC ©

“It’s time to
get Serious
about
Service!” Copyright 2014 RVDealerPRO LLC ©