maximising economic recovery of the uk’s oil and gas...
TRANSCRIPT
1
Maximising Economic Recoveryof the UK’s Oil and Gas Reserves
Context for the Brownfields Challenge
Report of PILOT 2004Brownfields Studies March 2005

2
CONTENTS: Page
Executive Summary 3
1. Introduction 62. The Size of the Prize 73. Lever 1. Increasing the Resource Base – Maximising the “size of the prize” 8
a. Overviewb. Reservesc. Challengesd. Insights 1-4 and Mid Life Field Case Study
4. Lever 2. Maximising Economic Recovery – Realising the Prize 14a. Overviewb. Challengesc. Insights 5-7 and Satellite Field Development, Gas Injection Project
& Incremental Well Case Studies5. Lever 3. The Life of Infrastructure – Recognising Time Constraints 19
a. Overviewb. Infrastructure lifec. Challengesd. Insight 8 & Late Life Case Study
6. Historical Performance – Meeting Industry Challenges 237. Brownfields Proposals to take forward 24
a. Improving Stewardshipb. Resolving Decommissioning Uncertaintiesc. Improving Supply Chain Effectiveness: Drilling, Subsea/vessels,
Workforce utilization, Technology enablersd. Maintaining a Unified Reserves Model
Appendix 1: Brownfilelds Study: Background and Terms of Reference 29

3
BROWNFIELDS STORY: EXECUTIVE SUMMARY
Context
Over the past 40 years the UK’s oil and gas industry has made a massive contribution to our way of life. It has the potential to go on doing so for decades to come. However, that success and contribution is not inevitable. This report identifies key activities and commitments that will be necessary in and around existing developments, “brownfields”, to maximise economic hydrocarbonrecovery and ensure its continued contribution to the UK.
To the start of 2004, the UK economy has benefited from £195 billion (2003 prices) in North Sea taxes since the mid-1960s. Government tax revenues have been particularly strong in recent years and have averaged around £5 billion per year since 2000. The industry has invested some £211 billion in the exploration and development of the UK offshore sector since activity began. In recent years this sector has provided 17% of total UK industrial investment and employment for 260,000 people in the UK.
The UK has been self sufficient in oil for over 20 years and in gas for nearly 10 years. Whilst the UK is projected to lose its self-sufficiency in energy during the current decade, the industry will continue to meet the majority of the energy needs of the UK economy well into the next one.
The Future Prize – a tale of two futures
The size of the future contribution to the UK’s economy is determined by two related sources of oil and gas: those coming from existing developments and those coming from new discoveries. This “resource base” determines the upper limit of reserves recovery.
The chart below shows the production that is estimated to become available from both of these sources. At the start of 2004, remaining UKCS oil and gas reserves are estimated at between 27 and 29 billion barrels of oil equivalent.
0.0
0.5
1.0
1.5
2.0
2.5
3.0
3.5
4.0
4.5
2002
2004
2006
2008
2010
2012
2014
2016
2018
2020
2022
2024
Mill
ion b
oe/
d
Proven/Sanctioned & Producing Undeveloped Discoveries Incremental Field Recovery
Exploration YTF High Activity Case

4
The Brownfield challenge is…to implement actions which will increase the current rate at which reserves are developed over the next 10 years and beyond, to help realise the PILOT vision of 3 million barrels of oil equivalent production per day in 2010.
There are three areas in which action can be taken to maximise the size of the contribution, as illustrated above: (1) Increase the size of the resource base. (2) Ensure that oil & gas is extracted as efficiently as possible while the infrastructure exists. (3) Extend the life of the infrastructure through which we obtain the resource.
(1) Increasing the size of the resource base
The main focus of the Brownfields Study was to see how we could maximise production of oil & gas in and around existing fields. The key challenges in achieving this are the ability to develop smaller, multi-field opportunities, improve the economics of smaller, riskier projects and identify pan-industry best practice through comparative reviews.
A major advance has been obtained through the development of the concept of “good stewardship”. This has produced a new framework and processes to ensure that asset owners are consistently aligned to doing the right things, i.e. identifying and exploiting opportunities at the right pace.
Another line of study was to identify means that facilitate asset transfers (and subsequent investment) to ensure assets are always in the right hands as their economic parameters change. Decommissioning liabilities and providing securities against default on those liabilities are seen aspotential barriers to trade and incremental development. The report proposes actions to rectify this. Effective implementation of the industry Commercial Code of Practice is also seen as beneficial.

5
(2) Ensure that oil & gas is realised as efficiently as possible – maximising the recovery.
Opportunities need to be planned and implemented quickly and efficiently. There is evidence that cross-industry partnerships and new business models are delivering incremental value. Technologyand supply chain effectiveness play significant roles in enabling this. Collaboration between companies has been identified as a means to provide significant improvements in delivery, where industry needs to pool effort or learning. Examples were identified in workforce utilisation, drilling wells and using subsea equipment/vessels and in the application of new technologies.
(3) Extending the Life of Infrastructure – Recognising Time Constraints
A key insight arising from the study is that time is becoming an increasingly critical factor in the ability of the industry to maximise the economic recovery of the UK’s Oil and Gas reserves. Small new projects will not be able to justify their own, new infrastructure and will need to utilise existing assets. Additionally, infrastructure needs to be both economically and physically viable.
The study shows that, unless we maintain current activity levels, around 40% of infrastructurecould be decommissioned by 2020. On the other hand, if the measures arising from the brownfieldsinitiative are successful and investor confidence is maintained, decommissioning could be delayedby 10-15 years on many of the existing systems, i.e. until 2030-35.
Recommendations
The Brownfields study concluded with the recommendation to take forward actions in:• Improving stewardship – screening all fields to focus more detailed annual field reviews on
those fields where stewardship could be a concern • Resolving decommissioning uncertainties – developing standard securities agreements and
studying other, longer-term issues concerning international commitments and the fiscalregime.
• Improving supply chain effectiveness – with collaborative pilot projects in drilling,subsea/vessels, workforce utilisation and technology
• Maintaining the unified reserves model developed by UKOOA & DTI.
6
Maximising Economic Recovery of the UK’s Oil and Gas ReservesContext for the Brownfields Challenge
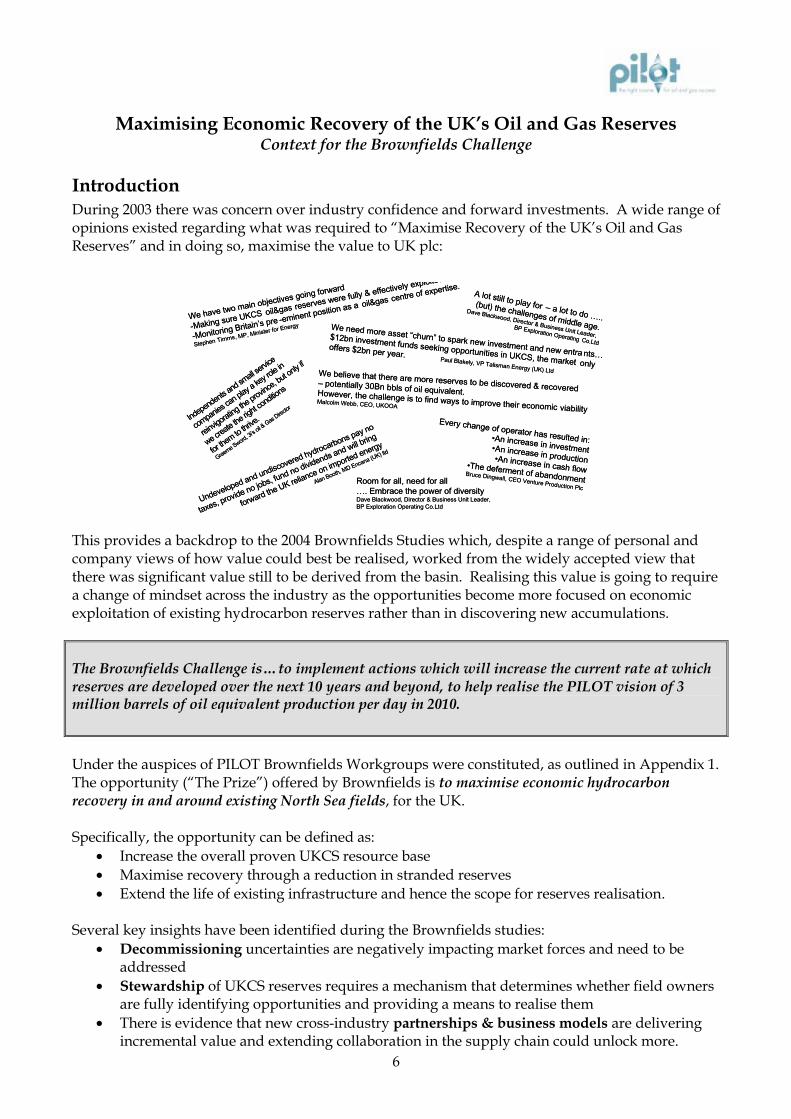
IntroductionDuring 2003 there was concern over industry confidence and forward investments. A wide range of opinions existed regarding what was required to “Maximise Recovery of the UK’s Oil and Gas Reserves” and in doing so, maximise the value to UK plc:
This provides a backdrop to the 2004 Brownfields Studies which, despite a range of personal andcompany views of how value could best be realised, worked from the widely accepted view that there was significant value still to be derived from the basin. Realising this value is going to require a change of mindset across the industry as the opportunities become more focused on economic exploitation of existing hydrocarbon reserves rather than in discovering new accumulations.
The Brownfields Challenge is…to implement actions which will increase the current rate at which reserves are developed over the next 10 years and beyond, to help realise the PILOT vision of 3million barrels of oil equivalent production per day in 2010.
Under the auspices of PILOT Brownfields Workgroups were constituted, as outlined in Appendix 1.The opportunity (“The Prize”) offered by Brownfields is to maximise economic hydrocarbon recovery in and around existing North Sea fields, for the UK.
Specifically, the opportunity can be defined as:• Increase the overall proven UKCS resource base• Maximise recovery through a reduction in stranded reserves• Extend the life of existing infrastructure and hence the scope for reserves realisation.
Several key insights have been identified during the Brownfields studies:• Decommissioning uncertainties are negatively impacting market forces and need to be
addressed• Stewardship of UKCS reserves requires a mechanism that determines whether field owners
are fully identifying opportunities and providing a means to realise them• There is evidence that new cross-industry partnerships & business models are delivering
incremental value and extending collaboration in the supply chain could unlock more.
We have two main objectives going forward
-Making sure UKCS oil&gas reserves were fully & effectively exploited
-Monitoring Britain’s pre -eminent position as a oil&gas centre of expertise.
Stephen Timms, MP, Minister for Energy
Room for all, need for all …. Embrace the power of diversity Dave Blackwood, Director & Business Unit Leader, BP Exploration Operating Co.Ltd
Undeveloped and undiscovered hydrocarbons pay no
taxes, provide no jobs, fund no dividends and will bring
forward the UK reliance on imported energy
Alan Booth, MD Encana (UK) ltd
A lot still to play for – a lot to do …..
(but) the challenges of middle age.
Dave Blackwood, Director & Business Unit Leader, BP Exploration Operating Co.Ltd
Indepe
ndents
and s
mall ser
vice
compan
ies ca
n play
a key
role in
reinvig
orating
the pr
ovince
, but on
ly if
we crea
te the
right co
ndition
s
for the
m to thri
ve.
Graeme S
word, 3i
’s oil &
Gas Direc
tor
Every change of operator has resulted in:•An increase in investment•An increase in production•An increase in cash flow•The deferment of abandonmentBruce Dingwall, CEO Venture Production Plc
We believe that there are more reserves to be discovered & recovered– potentially 30Bn bbls of oil equivalent. However, the challenge is to find ways to improve their economic viabilityMalcolm Webb, CEO, UKOOA
We need more asset “churn” to spark new investment and new entra nts…
$12bn investment funds seeking opportunities in UKCS, the market only
offers $2bn per year.Paul Blakely, VP Talisman Energy (UK) Ltd

7
The Size of the PrizeThere are 2 key levers which can be used to ensure that UKCS reserves are fully and effectively exploited. In addition, “time” creates a key constraint and can be considered to be a 3rd lever.
The following diagram provides an overview of how each of the levers influences the UKCS reserves profile:
These 3 levers can be summarised as:
1. Increase resource base• finding new exploration reserves & appraising discoveries (‘Exploration’)• defining/extending reserves in and around existing fields (‘Brownfields’)
2. Maximise recovery• optimising delivery efficiency and pace in order to maximise economic reserves
3. Extend the life of infrastructure• delineating any regional “windows of opportunity”• understanding the impacts of the various constraints including physical & economic life of
infrastructure, industry resources, etc.
The following sections consider each of these three levers in more detail. We look at the historic evidence associated with each lever together with future challenges and enablers that will support delivery of the “Brownfields Prize”.

8
Lever 1. Increasing the Resource Base – Maximising the “Size of the Prize”
OverviewThe “Resource Base” is defined as the volume of discovered and potential UKCS reserves. This is a critical factor as it defines the upper limit for reserves recovery.
Historically, the Resource Base has primarily been increased through exploration activities –discovery of new accumulations of hydrocarbons. While it is felt that this still offers opportunities within the UKCS it is not a focus for the Brownfields initiative. Instead, the Brownfields initiative is specifically focused on maximising reserves in and around existing fields, through upgrading and extending, then putting into production through development activity. The Brownfields’ prize isthese incremental economic reserves, over and above the existing base “proven, sanctioned and producing” reserves.
Reserves
The remaining UKCS reserves potential is estimated at ca 27-29 billion barrels of oil equivalent, but this depends on the perspective taken on West of Scotland yet-to-find reserves. In the following (simplified) representation, the reserves currently on-stream have been added to ongoing developments, with probable and possible developments and technical reserves included within undeveloped discoveries. Incremental field recovery includes brownfield volumes (probable & possible) over and above 1.5 bn boe already planned by companies and included in the proven/sanctioned & producing category.
Although a key focus of the Brownfields initiative is on incremental field recoveries, the total prize also includes realising those developments not yet sanctioned and the yet-to-find satellite potential around existing field infrastructure.
0
5
10
15
20
25
30
Bill
ion b
oe
Exploration YTF
8.9 bln boe
Incremental Field Recovery 4.0 bln boe
UndevelopedDiscoveries 3.9 bln boe
Proven/Sanctioned& Producing
10.1 bln boe
UKCS Reserves in Model (1.1.04)
Note: Exploration figure of 8.9 bln boe includes 1.5 bln boe of West of Scotland onshore and other UKCS areas, with limited or no data, which was not considered in the modelling work
Exploration
BrownfieldsPrize
Base
(Satellites)
As reserves are discovered, they typically enter an opportunity ‘hopper’ through which they are developed and finally produced. The following diagram provides an overview of this ‘cascade’ of UKCS opportunities, together with 2003 conversion rates. The total expenditure in 2003 for all the opportunities from exploration through development to production was around £8.2 billion. This isprojected to rise to £9.0 billion in 2004.

9
Exploration YTF8.9 bln boe
IncrementalField Recovery
4.0 bln boe
UndevelopedDiscoveries
3.9 bln boe
Proven/Sanctioned& Producing10.1 bln boe
Current Annual Production
~ 1.5 bln boe/yr(*)
0.5-1.0 blnboe/yr
0.2-0.5 blnboe/yr
Spending£ 4.5 bln in
Operating Costs(*)
Investing£ 3.4 bln in
Development(*)
Investing£ 0.3 bln in
Exploration(*)
(*) 2003 data
In 2003 the industry was currently adding 0.5-1.0 Bn boe per year to ‘Proven/Sanctioned and Producing Reserves’. With an annual production rate of approximately 1.5 Bn boe on aProven/Sanctioned Reserves base of 10.1 Bn boe, this equates to an annual reduction in reserves of7% (or a half life of approximately 5 years).
At the current conversion rate, it will require 20-30 years to convert all opportunities into ‘Proven/Sanctioned and Producing Reserves’. It is when we consider such a framework that “time” starts to become a key constraint.
Modelling the ‘cascade’ of reserves, described above, results in the following projection of UKCSproduction profile over time:
0.0
0.5
1.0
1.5
2.0
2.5
3.0
3.5
4.0
4.5
2002
2004
2006
2008
2010
2012
2014
2016
2018
2020
2022
2024
Mill
ion
bo
e/d
Proven/Sanctioned & Producing Undeveloped Discoveries Incremental Field Recovery
Exploration YTF High Activity Case

10
On these current projections, it appears that the industry would just miss the PILOT aspiration of 3 million boe/day in 2010. (2004 projection for 2010 is 2.6-2.8 million boe/d.) However, an effective Brownfields initiative could deliver significant upsides, with the majority realised over the next 15 years, which would improve this picture. The most recent activity survey (published January 2005) shows confidence returning and the projection trending up towards the PILOT vision.
The key to maximising UKCS recovery partially relates to the identification of incremental reserves but is primarily associated with maximising recovery from existing discoveries and developments.It is estimated that there is around 4 bn boe of brownfield potential (over and above existing plans) attributed to raising average field recoveries. Only some of these come through in current projections, so this is a target for improvement through measures outlined in this report. This makes the timing of activity a key factor in delivery of the Brownfields Prize. The life and ultimate recovery of the UKCS therefore is heavily dependent on the rate of translation of opportunities into the “Proven/Sanctioned and Producing Reserves” category.
ChallengesThe key challenges to increasing the UKCS resource base are:
• Ability to develop smaller, multi-field opportunities, in particular securing existing base & improving the economics of smaller/riskier projects
• Recognising the exploitation opportunities for all remaining reserves, identifying pan-industry ‘exploitation’ best practice and having comparative field recovery assessments.

11
Brownfields Insight 1: Good stewards deliver strong performanceIt is widely perceived that asset transfers are the primary mechanism for increasing investment in mature assets and therefore delivering incremental reserves with a new field owner/operator. The diagram below reflects the results of research that demonstrated that similar levels of investment and associated incremental reserves have also been delivered on a range of ‘retained’ assets (i.e. those remaining with the incumbent group of Joint Venture partners).
While a similar, high level, of performance has been achieved for some assets, both retained and traded, there is a significant variation in performance between high and ‘average’ performing assets. The key issue for Brownfield assets is therefore not around the transfer of assets from old to new owners, but identifying which JV owners & operators are properly stewarding their assets andhow can we promote and expand this behaviour across all UKCS assets.
Good stewardship in the UKCS essentially comes down to 2 key areas and if these work effectively, and such practices are embedded, significant opportunity for incremental reserves and investment will be available. Key focus for good stewardship:
1. The asset owners consistently doing the right things to identify and exploit opportunities.2. Ensuring that assets are in the right hands, with an aligned partnership that ensures good
practice is consistently applied and opportunities realised.
Increased Production v Capex per field
-300
-200
-100
0
100
200
300
400
-300 -200 -100 0 100 200 300 400 500 600 700
£ million increased Capex
Incr
ease
- m
illio
n b
arre
ls
Other fieldsFields with operator changes

12
Brownfields Insight 2: Ensuring the right assets are in the right handsThe following provides an overview of how opportunities are identified and exploited. It introduces a number of mechanisms for ensuring that opportunities are identified, properly understood and in the ‘right’ hands to be effectively exploited:
This identifies 3 broad Brownfields delivery “mechanisms”:• Managing the Base• Stimulating Activity• Increasing Understanding
Performance is maximised when the asset owners are aligned and continually considering each of the delivery mechanisms in relation to their assets. Opportunities may exist in situations where assets are not actively being “worked”, for whatever reason. This is clearly detrimental to UK plc.
Note: “Efficient asset transfer” can simply be considered as a way of converting blocked reserves into “Future Opportunities” which will then be delivered through one of the other delivery mechanisms.
The estimated incremental reserves can therefore be considered to be delivered by the three highlevel delivery mechanisms, as shown below:
0
5
10
15
20
25
30
Bill
ion b
oe
Exploration YTF
8.9 bln boe
Incremental Field Recovery 4.0 bln boe
UndevelopedDiscoveries 3.9 bln boe
Proven/Sanctioned& Producing
10.1 bln boe
Satellites IncreaseUnderstanding
Stimulate Activity
Managing the Base
UKCS Reserves in Model (1.1.04)
Realising the Brownfields Prize
Note: Exploration figure of 8.9 bln boe includes 1.5 bln boe of West of Scotland, onshore and other UKCS areas with limited or no data which was not considered in the modelling work
“Stimulate activity”
“Managing the base”
•Life of Field
“Increaseunderstanding”
Future Potential?
Potential being accessed?
Attractive to 3rd
Parties?
Need sale?“Efficient asset transfer”
Ye N
Ye N
Ye
N
Ye N

13
Brownfields Insight 3: Asset trades are complicated by decommissioning securitiesThere are currently a number of issues with the approach to the assessment of, and providingdefault security for, decommissioning liabilities:
• No standard Decommissioning (financial) Security Agreement (DSA) in use• Complexity around former owner liability, Sections 29 & 34 of the Petroleum Act 1998.• Lack of diverse and acceptable forms of security• Variable methodology and assumptions in calculating liabilities• Post-default liability issues without precedent• Questions over who should be parties to the agreements
This can create unnecessary barriers to asset deals which, in turn, slow the process of getting the right assets into the right hands. It is felt that a standard DSA would materially improve the speed at which deals could be concluded and reduce the amount of effort that providers need to put intoDSA compliance on an annual basis. This could also provide a greater degree of security for previous owners and significantly reduce ambiguities and duplication from current agreements.
Brownfields Insight 4: Implementation of the industry Commercial Code of Practice (CCoP) will assist transactions.The Commercial Code of Practice was established to promote co-operative value generation through improved behaviours in commercial negotiations. This was seen to be a vital element in ensuring the UKCS remains a vibrant & efficient business sector. It is tracked through annual surveys, focusing on key aspects of the code:
• setting a negotiation timetable• conducting a post-deal audit/review• involvement of senior management.
The aim is to improve good practices and achieve 75% compliance in the 2004 survey and 90% compliance in the 2005 survey. Survey feedback is used to inform discussions in the CCOP Champions Network.
Case Study: Mid Life Field
Using this case study of a typical mid-life field, we can see that stewardship, good or bad, has a significant impact on the reserve life of a field:• Near term work programme has the biggest
impact on:o Amount of investment o Effectiveness of investment
• Extension of field life adds to ultimate recovery. Important factors are:
o Late life opexo Late life capexo Timely satellite development
• Effective management of decline rate is alsoimportant.
Page 13
Negative Variation
Positive Variation
Remaining Reserves (Mboe) Vs Base Case
Reference RUR: 107 MBOE
Reserve
-40 -30 -20 -10 0 10 20 30 40
3rd Party Income (+/-50%)
Late Life Capex (+/-25%)
Late Life Opex (+/-20%by 2010)
Base Decline (+/-5%)
Incremental Prodn fromInvestment (+/- 25%)

14
Lever 2: Maximising Economic Recovery – Realising the Prize
OverviewOnce reserves have been identified, delivery of these reserves in terms of production is required to monetise the assets and realise the value for the UK economy. It is broadly accepted that once reserves have been converted into the “Proven / Sanctioned and Producing Reserves” category, they will be realised. However, this recovery can be impacted by the pace of development and production within specific time and infrastructure constraints (see below).
ChallengesMaximising recovery of UKCS reserves is highly dependent on setting the appropriate pace of activity. Acceleration of activity will not necessarily maximise recovery (or value), instead the focus needs to be on optimising pace – balancing the need for increased speed of conversion of opportunities with managing resource constraints; financial investment, workforce, plant, etc.
The key challenges to maximising reserves recovery are:• Attracting capital and applying resources, ensuring right opportunities are in right hands
to optimise investments in economic opportunities, possibly using new business models• Introducing technology efficiencies, more an issue of application than of development• Improving supply chain effectiveness, developing skills & capability• Ensuring an effective and responsive regulatory regime, recognising the impact of external
factors
Zero investmentcase gives 16%pa basin decline. Current
Investmentof £4 bngives7% pa basindecline
PILOT ProductionTarget needs 4% pa
Pro
duct
ion
3mmboe/d
Zero investmentcase gives 16%pa basin decline. Current
Investmentof £4 bngives7% pa basindecline
PILOT ProductionTarget needs 4% pa
Pro
duct
ion
3mmboe/d
Pro
duct
ion
3mmboe/d
Remainingundiscovered
andundeveloped
reserves
Today Time
Current Pace
30% reserves replacement ratio
Current view on life of infrastructure
Remainingundiscovered
andundeveloped
reserves
Today Time
Current Pace
30% reserves replacement ratio
Current view on life of infrastructure

15
Brownfields Insight 5: PartnershipIn a complex and highly differentiated industry, true pan industry partnerships are difficult to identify. However the industry has several examples where this has been successfully achieved, e.g. STEP Change in Safety, FPAL, and Progressing Partnership Work Group (PPWG). These initiatives are covered elsewhere but referencing PPWG enables a focus on the Supply Chain Code of Practice (SCCoP).
The SCCoP has thus far grown to over 350 signatories encompassing companies of every size and geographical location within the UK. A number of successes have been delivered, a good example being Share Fairs now recognised as having delivered significant value to the Supply Chain.Significant progress has also been achieved in areas such as 30 Day Payment, the application of FPAL and Standard Contracts.
Clearly much has yet to be done but evidence of the accruing benefit from industry partnerships is growing with, perhaps, more gains being achieved in the past 24 months than has been the case for many years.
Case Study: Satellite Field Developments
• Aggressive engineering is required to make marginal fields economic
o Technical risk is high(drilling and subsurface)
• Little scope for cost reduction,yet cost overruns are a significant risk
• Host tie-in costs are an important factor in capital costs
• Accumulations subject to PRT may be less able to withstand risk due to lower expected value
Reserves & Capex Sensitivity, NPV 10, £MM
0 2 4 6 8 1 1 1 1
Reserves
Reserves No PRT
Capex
Capex No PRT

16
Brownfields Insight 6: Technology efficienciesThe primary opportunity offered by technology is through increased use of existing / emerging technology, rather than new research (seismic resolution an exception):
• Insufficient critical mass of sustainable programmes within each Operator limits implementation & development
• Developing technologies are blocked by reluctance to accept risk of field trials or early adoption – need a track record
• Collaboration between Operators, Service Sector and Developers could overcome blockers. Because of the inherent costs of trials within the UKCS, industry past performance forintroducing new technologies into the UKCS has not had a good record.
• Broad consensus reached on the top ten technologies for the UKCS• A collaboration model should be piloted in 2005-06 on through-tubing rotary drilling, TTRD,
before being applied to the other top ten technologies.
Case Study: Gas Injection Project
• Reserve and capex uncertainty key drivers• Fiscal uncertainty may be the biggest driver
Technology
TechDevtStatus
Lack of TrackRecord
Comm.CostRisk
Collaboration / Fragmentation
Through Tubing Drilling - Platform/Subsea √ √ √∗Stimulation √ √
Downhole Water Control √ √ √ √∗Cost Effective Platform Workovers √4D Seismic - Resolution & Uptake √ √ √ √
Enhanced Oil Recovery √ √Downhole Sand Control √ √ √
Produced Water Treatment √Cost Effective Subsea Intervention √ √ √∗
Size of Prize Range (mmboe)
Key Blockers
0 200 400 600 800 1000
NPV 10%, £M RT 2004, 100% Share
-20 -15 -10 -5 0 5 10 15 20
Reserves
Capex
Opex
CT Increase 2007
No Incremental PRT
No Incremental PRT + Capex
No Incremental PRT + reserves
CT Increase 2012
CT Increase 2012 + capex
CT Increase 2012 + reserves
Base Case = £1.7M

17
Brownfields Insight 7: Supply Chain Effectiveness - Lower OPEX and CAPEX extending field life, releasing funds for further investment with the overall goal of maximising economic recoveryIncreased Supply Chain Effectiveness is possible in the UKCS, largely without the need for regulatory change. Such improvements can bring about a 10-30% reduction in OPEX and CAPEX though this will not necessarily have a material impact on investment decisions. Early engagement of the Supply Chain is where most value is achieved, although Supply Chain efficiency is not considered to be a factor in the lack of exploration activity in the UKCS.
There are several generic opportunity areas through which increased effectiveness can be delivered:• New entrants are challenging existing practices and are able to reduce costs whilst focusing
on value rather than cost; • Competition and continuous improvement is also bringing material efficiencies• Value-based contracting, with fair apportionment of risks and liabilities, offers more
incentives for the Supply Chain than cost-base contracting;• Collaboration between stakeholders at this stage of province maturity can unlock significant
incremental value.
Three areas of Supply Chain have been identified for specific analysis:
Workforce UtilisationThere is scope to improve the use of human capital, the cost of which is approximately 50% of total lifting costs. Potential benefits will not have a material impact on investment decisions unless the following is considered:
• The whole human dimension is addressed for maximum benefit (operator/contractor;onshore/offshore)
• Continuity and repeatability of teams has shown substantial benefits can be generatedthrough capturing the learning that creates performance improvement
• Cost cutting can be counter-productive; competence is at least equally important
This is not about new initiatives but about learning from existing best practice. The achievements to date should be acknowledged; a lot has already been done and unit operating costs on the UKCS have remained fairly flat over the period 1997-2004 ,(despite inflation. ( UKCS has been 0.4% per annum compared to Norway at 3% per annum). However, declining production and less new developments will make it increasingly difficult to retain this position.
There is a strong analogy with safety where performance improvement has been realised through strong leadership that drives engagement and creates alignment from top to bottom.
Four key enablers have been identified to improve the use of human capital:1. Leadership (this is key)2. Collaboration3. Planning and Forecasting4. Alignment

18
Subsea /VesselsKey themes, relating to current Subsea /Vessel market characterisation, need to be addressed:
• Lack of Effective Collaboration• Ineffective demand forecasting , poor level of information on actual /forecast demand for
products & services• Lack of Collaborative working:
o Between Operators – unlike Norwegian Sectoro Between Contractors – usually viewed as “anti-competitive”o Between Operators & Contractors – though there are live examples that not only
focus on cost but also on planning.• Lack of Standardisation in contracts, health and safety, equipment specifications etc.
DrillingThere is a need to drill wells cheaper, safer and smarter going forward.
Collaboration between companies wishing to drill wells can create significant value by lowering costs whilst providing drilling and service contractors with stable and continuous workloads.
The group looked at the feasibility of multiple operators collaborating. Factors which were considered included; weather downtime and non-productive time amortisation; individual companies buying well options; technical and commercial deliverables being openly benchmarked;sharing the benefits of safety and operational efficiencies due to continuous operations.
Examples of inefficiency• Comparing September 2003 with 2002 shows 9 rigs left the UKCS at a round trip cost of
~£43million or ~9 wells; the metric is 1 well lost for one rig leaving the UKCS• Idle UKCS rigs result in ineffective use of capital – some 5 wells equivalent in 2003• Seasonal drilling can lead to a deterioration in safety performance, amounting to a factor of 3• Two pools of drilling rigs and personnel covering Norway and the UK, both making
inefficient use of human and capital resources
Case Study: Incremental Well Investment
• Reserve and capex uncertainty primary drivers
• PRT exemption increases expected value while widening uncertainty band
• Increased expected value increases materiality
• Fiscal uncertainty post investment represents a significant risk
Base Case : £1.8M
NPV 10%, £M RT 2004, 100% Share
-10 -5 0 5 10 15 20
Reserves
Capex
Opex
CT Increase 2007
No Incremental PRT
No Incremental PRTCapex
No Incremental PRTReserves

19
Lever 3: The Life of Infrastructure – Recognising Time Constraints
OverviewTime is becoming an increasingly critical factor in the ability of the Industry to maximise the recovery of the UK’s Oil and Gas reserves. The following diagram provides an overview of some of the specific issues relating to physical infrastructure:
The economic threshold is impacted by a number of factors including maintenance costs and revenue (a factor of throughput). One of the major uncertainties, however, is the degree of certainty and treatment of decommissioning liabilities. A number of examples have been identified in which reserves could be left “stranded” due to premature abandonment of infrastructure driven, in part, by industry’s perception of fiscal uncertainty regarding future decommissioning liabilities.
Reserves increments that could be achieved through extensions of infrastructure life.
0.0
0.5
1.0
1.5
2.0
2.5
3.0
3.5
4.0
4.5
2002
2004
2006
2008
2010
2012
2014
2016
2018
2020
2022
2024
Mill
ion b
oe/
d
Proven/Sanctioned & Producing Undeveloped Discoveries Incremental Field Recovery
Exploration YTF High Activity Case
PotentialInfrastructure
Constraint
Time
Known Throughput
Rate
Physical/ design life of infrastructure
Economic Threshold
Infrastructure Capacity
Generic Life of Infrastructure
Economic life of infrastructure

20
Major hub infrastructure life extension can be achieved
2 0 0 0
2 0 0 5
2 0 1 0
2 0 1 5
2 0 2 0
2 0 2 5
2 0 3 0
2 0 3 5
2 0 4 0
2 0 4 5
Ber
yl
Bra
e
Bre
nt
Bre
nt S
yste
m
Brit
anni
a*
CA
TS
*
Cle
eton
Clip
per*
CM
S
Cor
mor
ant
ET
AP
FLA
GS
For
ties*
Frig
g
Ful
mar
Ful
mar
Sys
tem
Hew
ett
Inde
fatig
able
J B
lock
Lem
an*
Mor
cam
be*
Nin
ian
Nin
ian
Sys
tem
Pip
er/C
laym
ore*
SA
GE
SE
AL*
LOG
GS
Vik
ing
Yea
r o
f fi
nal
pro
du
ctio
n
In c P A R & Y T F$ 3 0 O i l
B a s e C a s e
* M a jo r H u b s e x te n d in g t o 2 0 2 0 u n d e r b a s e c a s e p r i c e a s s u m p tio n s h a v e n o t b e e n a n a l y s e d u n d e r h i g h o i l p r i c ePAR – Potential Additional Reserves; YTF – Yet-to-find
Infrastructure life• Unless we maintain current activity levels, around 40% of infrastructure could be
decommissioned by ca 2020.• If the measures arising from the brownfields initiative are successful and investor confidence is
maintained, then decommissioning could be delayed by 10-15 years on many of the existingsystems (i.e. out to 2030-2035).

21
ChallengesThere are a number of areas in which time is a key factor:1. Economic life of infrastructure
Throughput, economic rent (tariffs) and decommissioning costs all contribute to the economic life of the infrastructure. Maintenance activities (operating costs) are also becoming a strain as investment levels increase simply to maintain the integrity of the infrastructure.
2. Physical life of infrastructureThe physical life of infrastructure is determined by a combination of the physical life of the original infrastructure (capital expenditure) and the ongoing maintenance activities (typically operating expenditure). It is a factor of the economics, that maintenance will be performed when the revenues associated with extending the life of the infrastructure make it economicallyviable.
3. Speed of identification of development opportunitiesAs the basin matures and the size of undeveloped pools reduces, many incremental development opportunities are not independently economically viable. Instead, companies rely on ‘bundling’ development opportunities in order to achieve competitive economic returns. In order to do this effectively, it is important for the industry to have a view of all development opportunities that can be factored into investment decisions. Identifying these opportunities in a timely fashion will maximize the opportunity to ‘bundle’ development plans and therefore maximize economic returns. This reinforces the need for good regional stewardship.
4. Critical mass of industryThe ‘critical mass’ of the industry as a whole is a key driver in the ability to maximise recovery of oil and gas reserves. Maintaining sufficient activity to support the current levels of industry participation is itself a key factor in the ongoing success of the industry.
The key challenges to extending the life of infrastructure are:• Maintain/increase throughput & revenue, attracting further infrastructure usage
e.g. through effective implementation and usage of the Infrastructure Code of Practice, ICOP• Efficiencies to reduce economic threshold, ensuring that activity (pipeline throughput,
development drilling, etc.) is sufficient to deliver economic returns and consider need forfiscal reforms to eliminate economic distortions e.g. recent changes to the treatment of PRTon the tariffs from new fields using existing infrastructure
• Planning & investment, reduce decommissioning uncertainties and better manage liability exposure

22
Brownfields Insight 8: Addressing decommissioning uncertainty is a key challenge• The UK has a liability of between £ 15 & 19 billion, which will crystallise when overall UKCS
cash flows are at a low level. Although this is provided for in accounts, in general there are no dedicated decommissioning funds.
• Existing arrangements to provide securities for this liability are conservative and often duplicative, inhibiting new investors through entry barriers or a drain on future development investment.
• There is significant uncertainty around the application of existing decommissioning standards and regulatory requirements, especially concerning OSPAR derogations to full removal
• Future OSPAR regulatory constraints on derogations in 2008 and beyond, which may place additional decommissioning burdens on industry.
• There is uncertainty about what PRT, CT and Supplementary Charge relief will be available for decommissioning expenditure.
• Inexperienced supply chain capability adds technical and operational risk to programmes.
There is a problem getting traction on this issue due to divergent interests & perspectives and more immediate priorities. However, the approach will need to include the following:
• establishing a framework for an industry standard decommissioning security agreement• finding a long-term solution to uncertainties and funding of securities which don’t inhibit
asset trading or development investment• examining practical requirements for reducing cost exposures, through securing derogations
and managing the residual liabilities• consideration of fiscal measures that reduce uncertainty and widen the forms of security.
To continue to attract investment for North Sea reserves, net cash flow from existing assets need to be maintained at a sufficient level and be competitive internationally on a forward looking basis.Where returns are projected to drop to levels that are unacceptable, decommissioning will occur.When returns are under pressure, investment levels are reduced. This can lead to production declines, early decommissioning and reserves losses. Low oil prices accelerate the velocity as do tax increases, such as the introduction of the Supplementary Charge. Once in a cycle of low investment and reduced maintenance, major equipment failure further accelerates decline.
Case Study: Late Life Field• Near-term decommissioning costs are, by
far, the dominant decision driver,complicated by:
o Uncertainty of those costso Fiscal uncertaintyo Liability provision
• Remaining investment opportunities relatively immaterial
o Transfer of ownership often required• Incremental reserves and capex uncertainty
are key drivers for investment• The above decommissioning uncertainties
are key blockers to maximising recovery.
NPV MMGBP@10% disc. rate
-80 -70 -60 -50 -40 -30 -20 -10 0
Asset integrety
Investment opp.
Opex
Production
Price
PRT abolition
Abandonment
Base NPV -£34.3MMGBP

23
Historical Performance – Meeting Industry ChallengesThe industry has historically been very successful in overcoming economic and technological challenges. This has contributed to the ongoing success of the North Sea industry:
Incremental investment funding is leading to:• Higher volume of deals• Deals being done faster• New owners bringing additional
investment in assets
Technology is contributing to increasing the Resource Base :
• Economic access to small pools• Enhanced field recovery techniques• Over 10 yrs the average field recovery factor
has increased by 10% (1992 = 38% 2002 = 48%)
The focus on Brownfields exploitation is leading to a higher number of smaller fields being developed on the UKCS which is extending ‘Window of Opportunity’ for UKCS as a whole:
• Using near-field tie-backs• Innovative use of existing infrastructure

24
Brownfields Proposals to take forward
1. Improving StewardshipIt was agreed that there was value in developing a new DTI approach to fielddevelopment/operations scrutiny, which focuses on those assets and partnerships where the fullfield potential (in the DTI’s view) may, for whatever reason, not yet be fully accessed. The WorkGroup, comprising representatives from industry and government, developed a new Stewardshipmodel to progress this concept, to provide a mechanism for demonstrating & promoting theeffective management of assets in the UKCS.
By focusing attention only on those assets which merit further conversation, the model helps toreduce administrative overheads. Consequently, the Annual Field Report is replaced by a simplified and more focused data request, although there will continue to be a need to advise the DTI of anymaterial changes to the Field Development Plans eg. major investment programs, significantchanges to operations etc.
This more focused data request is likely to cover a few years of historic data, in-year data and a one year look ahead. Although the data request hasn't been formulated yet, it is likely to cover thefollowing areas/indicators:
Indicator DescriptorProduction Production decline, production efficiency & remaining field lifeReserves Producing/Developed reserves addsExpenditure Expenditure aimed at reserve adds, integrity, decommissioning
& othersActivity Number of wells drilled, sidetracked and/or well interventions“Hopper” Planned activity & JV alignmentSafety Number of improvement notices, LTI rates &/or new lead
indicators for integrity management
The DTI will use this data to identify those assets which require a follow-up conversation. Around~300 fields will provide data, resulting in 20-30 fields which merit further discussion. Despite theincreased effort required for those 20-30 assets, overall this represents a significant simplification for the industry by removing the need for Annual Field Report level detail for 85%+ of the assets.
The overall process will follow an annual cycle as shown in the figure below.
Q1 Q2Q4 Q3
Datacollection
(industry)
DataAnalysis
(DTI)
Feedback &Clarification(DTI/industry)
Follow-up &possible
intervention
25
During the introduction in 2005, a pilot will be carried out in Q1 to address any issues, beforeengaging all the operators in Q2. A number of operators represented on WG2 will be invited toparticipate in this pilot. The overall process will be rolled out to all operators in early Q2, with theaim to collect the data in late Q2. Follow-up conversations with the key 20-30 assets will take placesometime in Q3/early Q4 following analysis of the data by the DTI. It is also anticipated that moregeneral feedback on the process and potential basin insights will be shared in Q3.
For those 20-30 fields meriting further conversation, the following process is envisaged:• Operator/JV clarification meeting with the DTI to discuss asset performance and forward
plans• Following this meeting, the DTI will advise the operator & other JV partners whether DTI
wishes to “audit” the asset’s performance further• If the DTI elect to audit the asset, the DTI will advise the operator & other JV partners of the
outcome of audit• Asset owners to respond
Alongside this process for improving stewardship, the work group also noted that businessbehaviours during commercial transactions, especially those concerning asset transfers and thirdparty infrastructure access, should also be enhanced. It noted that initiatives outside thebrownfields groups were already in action and endorsed those proposals as they wouldcomplement brownfield stewardship efforts. These proposals are:
• The Commercial Code of Practice is to be given a new impetus through the establishment of a network of ‘company champions’, who will provide facilitation at times of difficulty, links to senior management and a resource to review the applications and benefits of the code.
• The Infrastructure Code of Practice, which was endorsed in September 2004, is to be fully implemented and its application/impact on access to infrastructure reviewed in 2005.
2. Resolving Decommissioning Uncertainties
STEP 1: Develop standard decommissioning financial security agreement.
• Review of current situation to define the range of approaches taken in existing Decommissioning Securities Agreements, DSA’s. (Completed by Cameron McKenna study within 2004)
• Identify: - common ground/framework for future agreements- contentious elements, with the underlying rationale for different
solutions, so that ‘drop down’ options can be developed.• Consider cost/benefit of producing a standard legal template, with options.
Subsequently agreed as: - fair, efficient and timely provision of a DSA, to an industry
accepted standard, that helps focus negotiating effort on key issues- identify effective ways to provide protection against
defaulters, give section 29 release and reduce the impact of securities provisions on debt capacity/credit ratings
- reduce overall cost to industry by focusing on risk, tightening methodology & removing duplication
• Finalise standard DSA template (with options) and carry issues into wider decommissioning securities debate.

26
STEP 2: Investigate longer-term options for effectively funding/securitising, without inhibiting asset trading or subsequent development investment – a political issue which may need to challenge current legislative and fiscal practices.
• Through a risk based approach, consider more diverse means of providing approved forms of security, which work for the wider range of players now in the UKCS.
• Consider ways of bringing closure to the international obligations made through OSPAR, so providing some degree of certainty to regulatory requirements. Clearer requirements allow for sharper cost estimates on the level of funds needed, which can release capital for development. This will require work to provide objective programme assessment criteria and an effective management of legacies.
• Consider how to reduce the uncertainty of the fiscal allowances for decommissioning at timeof expenditure. This issue influences all the others.
Another, related issue is to consider how best to develop supply chain competences that enable cost effective executions of decommissioning programmes. Finding ways to reduce the cost of delivering approved decommissioning programmes will be of fundamental benefit.
3. Improving Supply Chain Effectiveness
Industry recognised that a significant prize in the area of Supply Chain Effectiveness might be available but to date, no mechanism had been identified to access the perceived benefit. Four key focus areas have been identified which, if successful, will result in meaningful Brownfield gains, byaddressing the rising trends in UKCS opex.
These plans are all focused on optimising existing human and capital assets by better UKCS supply chain utilisation of resources through collaborative working that will deliver measurable benefits to industry. An implementation plan to test this hypothesis and deliver results in 2005/6 is currently being developed by the work groups in each area.
The 4 areas targeted for Supply Chain Effectiveness initiatives are; Drilling, Subsea/Vessels,Workforce utilisation and Technology enablers.
Drilling
To create a high performance wells and rig share initiative, for both existing asset owners and new entrants, to accelerate production on prospects which are currently unable to progress through an inability to access a rig slot or due to well cost uncertainty.
The initiative will challenge accepted practice on fractional well activity to drive improved technical, safety and cost performance. Leading cost performance would come from lower rig costs (ca 20% against current norms) due to longer contracts, elimination of non productive time and not stacking rigs over the winter. Improved well performance would come from crew continuity & motivation, continuous rig maintenance and improved procurement practices. Benchmarked technical improvement in execution at the well site could yield a combined saving of £10 - 15 million per quartile of improvement per rig year.
Overall, the cost to industry of business as usual may be as much as 5 lost wells per year, which translates to a potential prize of between 25 - 50 million boe per annum.
The group have identified as a goal, two mobile rigs (one semi-sub & one jack-up) shared in the wells club between four or more operators for a minimum period of twelve months, by end 2005,

27
delivering top quartile well performance to the subscribers. The club members will provide engineering & procurement expertise on a shared cost basis (at ca £50k/month). A facility to offer well design services will also be made through the club.
Subsea/Vessels
The subsea market sector is characterised by a lack of effective collaboration due to three key issues:• Ineffective demand forecasting – poor level of information on actual/forecast demand for
products and services• Lack of collaboration between: operators, contractors, operators & contractors, although
there are some examples of planning• Lack of contract standardisation, health & safety requirements, equipment specifications etc.
Three proposals to address this were considered:• To enhance the visibility, type and quality of planning information by enhancing the “share
fair” process and introducing a subsea/vessel information portal (this will requireconsideration of the administrative load and its effect on efficiency)
• To promote more collaborative working within the subsea opex sector (this will requiremore clarity over what would be necessary)
• To quantify the potential prize from more collaborative working on the subsea capex sector (although helpful, probably resource constrained currently)
The specific data suggested would include the following with sufficient detail for each planned field development:
- wellhead, control systems, pipes, valves & chokes and other components- surveys, geotechnical & corrosion monitoring services- design, fabrication, installation and commissioning services- ROVSV, DSV, trenching and construction vessels
The work group’s view was that the current ‘share fairs’ were inadequate inarticulating/disseminating this information with sufficient detail and proposed a web based portalbe established.
To move this forward in 2005, specific recommendations were made for operators to materiallyimprove the quality of market data to enable the subsea supply chain, with the assistance of Subsea UK acting as information broker, to more accurately forecast demand.
Workforce utilisation
The objective is to deliver top quartile OPEX and CAPEX through improved utilisation of the workforce.
Approximately 50% of all spend relate to workforce costs and efficiency gains of 10-30% are possible if people’s talents, onshore/offshore and operator/contractor, are harnessed through improved leadership in a way similar to what has been achieved with safety.
The proposal is to focus on changing the following 5 key behaviours:• Get clear on how each organisation stacks up to the best in class via benchmarking and best
practice sharing• Increase the focus on added value• Increase the focus on competence

28
• Increase the focus on staff costs• Create improved relationships between Operations and the Supply Chain, avoiding the need for
duplication.
The way forward is for the workforce utilisation team to work within companies during 2005 to kick off pilot change programs that test these recommendations in a number of areas:• The engineering process• Shutdowns• Offshore workforce productivity i.e. ‘wrench time’
Technology Enablers
The overall Brownfield technology prize of 0.5 to 3bn boe should be unlocked by concertedcampaigns to ensure the industry-wide implementation of the top ten key technologies.
This can be achieved through a collaborative approach, which should first be piloted to facilitate the implementation of platform-based through-tubing rotary drilling (TTRD). This technology alone isassociated with a prize of up to 800 mmboe. The challenge is to reliably implement and realisesignificant savings against the conventional alternative of drilling sidetracks. The collaboration will be aimed to bring the whole industry up the TTRD implementation learning curve.
The implementation plan calls for the sharing of lessons and experiences from TTRD jobs already in operators’ plans for 2005, whilst developing a co-ordinated campaign including at least 10 TTRDwells for 2006 –07. Initial actions needed to instigate this are:
• To secure commitment from key players (4 operators and 4 contractors) with eachdelegating appropriate technical and commercial experts to form a steering group.
• To identify a champion at ILT level and secure funding (~£50k) to complete detailedplanning and the recruitment of a full-time team leader.
4. Maintaining a Unified Reserves Model
The brownfields reserves work was based on DTI and UKOOA data which was collected over thestudy period Q3 ‘03 to Q2 ’04. Going forward, it is intended to update this reserves/resourcespicture and use it for subsequent projections, as a combined industry/DTI view. The work required to achieve this includes:
• Reconciling uncertainties on reserves data relating to the differences between the UKOOAActivity Survey and the DTI, especially regarding brownfield volumes. UKOOA and DTI mustfind a means to address the confidentiality issues sufficiently to create a single shared data set.
• UKOOA will update the whole model during Q1/2 2005 to incorporate the findings of the latest 2004 Activity Survey and include the reserves review conducted by DTI which they will publish in June 2005.
The above recommendations were produced in draft, then discussed and agreed at a final meeting of the Brownfield’s Steering Group at the end of January 2005. The forward actions are all being worked individually, as outlined in the above sections. The 2004 Brownfields Study can therefore be said to have concluded in January 2005.

29
Brownfields StudiesBackground and Terms of Reference
Appendix 1
BackgroundThe Brownfields “Phase 1” was completed in late 2003. Its outputs were focused on:
• Benchmarking:Two Brownfield Benchmarking studies were completed by AUPEC. The size of the UKCS Brownfield prize is consistently estimated at between 3 and 5 bn boe, but the study highlighted the need for operators, suppliers and government to act quickly to ensure these resources are exploited before host infrastructure is abandoned.
• Blockers:Investigation of the issues blocking the development of known Brownfield opportunities in the UK, by way of a survey issued to both contractors and operators. Technology and low cost / reliable drilling and well interventions emerged as key issues, although operators and suppliers seemed to have differing views as to the nature of the problem. Fiscal and commercial incentivisation, either directly with the individual projects or to facilitate innovation within the industry, was thought to play a role.
• Best Practice:The group has worked in several ways to stimulate exchange of knowledge and best practice. A series of engagement workshops were held and attended by key players across the industry. Brownfield Showcase events were held at which a variety of examples of Brownfield exploitation techniques were presented.
• Business Models:Preparation of case studies of exceptional / innovative Brownfield business models. Thiswork was carried forward into “Phase 2”.
Upon completion of “Phase 1”, it was felt that a more focused effort was required to increase the overall impact. Recommendations from “Phase 1” were acted upon in “Phase 2”:
• Industry sponsorship, funding and structure:Active industry sponsorship is a key success factor in delivering the desired impact from the Brownfields Initiative. The work should be organised as a project with a budget, a client, specific deliverables and agreed timelines. Funding, to fit this budget, should be made available through the sponsoring structure. A significant full or part-time project facilitator would greatly enhance the potential of the group to deliver.
It was decided that UKOOA would provide the central co-ordination point for ongoing activities under the direction of a committed Steering Committee. A small amount of funding was set aside by UKOOA to support Brownfields activities, specifically in relation to external support required to achieve the Brownfields objectives, which was matched by the DTI. Paul Squire (Accenture) wasappointed as Project Manager to co-ordinate and facilitate activities across the work groups.
• Steering group, clear agenda and leadership:The makeup of the steering group comprises representatives from across the supply chain (operators, contractors, suppliers, SME’s, support agencies and government). The group members are knowledgeable and committed to the process. An essential element of the progress of the work groups is the active and demanding participation of the chairpersonwho has respect across the industry and access to the industry decision makers. Maintaininga committed and enthusiastic group with broad and consistent participation is a key to success.

30
The steering group comprised:• Co-chairs: David Blackwood, BP and Jim Campbell, DTI• Kieron McFadyen, Shell and Page Maxson, ConocoPhillips• Roy Franklin, Paladin and John Crum, Apache• Mel Fitzgerald, Halliburton (now Subsea 7) and Jim Atack, Petrofac• Simon Toole, DTI and Paul Dymond, UKOOA
This group provided leadership for 4 workgroups and jointly coordinated and tracked activities by supplying context, direction, targets and resources. Wide industry participation was solicited for each of the work groups. The co-chairs were responsible for finalising the right size, mix and level of resource needed for their work group. The work groups were as follows:
- Workgroup 1 – Defining the prize, putting it into perspective and communicating the study outcome
- Workgroup 2 – Exploring business/regulatory models & enhancing the effectiveness of portfolio trading
- Workgroup 3 – Case studies, supply chain effectiveness and technology deployment- Workgroup 4 – Identifying Economic & Fiscal levers (Industry only)
Brownfields Work Group Activity
Stakeholder Engagement
HMG Operators Contractors Others
Compelling StoryCommunications
& Benefits Delivery Plan
UKCS Baseline“Size of the Prize”
Revised UKCS Reserves/Economics
ModelProposals
WG 1 WG 2 WG 3 WG 4
Case Studies
Pre Trade Preparation & Commitment
Asset Trading Behaviours &
ProcessDecommissioning Technology Levers
Supply Chain Opportunities
Economic & Fiscal Levers
Blockers & Enablers