matzikama municipality
TRANSCRIPT

M A T Z I K A M A M U N I C I P A L I T Y
PO BOX 98
37 CHURCH STREET
VREDENDAL
8160
TEL: 027-201 3300
FAX: 027-213 3238
EMAIL: [email protected]
WEBSITE: www.matzikamamun.co.za

MATZIKAMA INTEGRATED DEVELOPMENT PLAN 2017-2022
Page 3 of 236

MATZIKAMA INTEGRATED DEVELOPMENT PLAN 2017-2022
Page 4 of 236
The 2017/2022 Integrated Development Plan (IDP) of Matzikama Municipality provides a strategic vision of where the municipality will focus its resources and effort over the next five years. In committing ourselves to the IDP, the new Council has envisaged that it is of the utmost importance that Council should apply its mind and take the strategic lead in the planning process. Therefore Council, together with the Senior Management team, embarked on a two-day strategic workshop where the way forward for my Council’s term of office was plotted.
I am proud and impressed to acknowledge the contribution from all our communities and stakeholders who vigorously participated in our public participation processes, which provides them with a distinct opportunity to engage with us as politicians and management, on issues impacting directly on their well-being. Council derived at a decision that the majority of the people of Matzikama suffer from a range of economic and social challenges. It led to a decision that the focus and resources of the Municipality must be directed at secure, healthier and convenient living and working spaces.
Furthermore, it is evident that from the responses of all communities the focus of the Council of Matzikama Municipality, for the next five years, should be directed at developing and growing the local economy. It is a mandate that we received from our communities in no uncertain terms. Therefore, it will also form the direction setting guidelines for the development of strategies, programmes and projects in this IDP. Everything that a municipality does should be done to impact as much as possible on the economic and social development of a locality. Council has also committed itself to the following Values to set the foundation as to how Matzikama Municipality will operate: (i) Integrity and loyalty; (ii) Professional conduct; (iii) Teamwork and excellence; and (iv) Positive attitude.
By approving this IDP, Council accepts it as the principle strategic guideline on which we will base our decisions and which we expect the administration of Matzikama Municipality to implement with the same commitment and diligence. The 2017/2022 IDP, therefore, will be used as a map to navigate the next five years and lead the organisation to the realisation of the vision, mission and strategic objectives.
Finally, the municipality is one of the core developmental role-players in the area, and therefore it is our full intent to manage public funds with great care and responsibility. We understand our responsibility to our public and will do our sheer utmost to provide the best possible “value for money“services.
In our endeavour, to making Matzikama Municipality a success for all the people, I thank all the Matzikama residents for their role in the journey.
“I can do things you cannot, you can do things I cannot; together we can do great things”
- Mother Theresa
Cllr Gerendina Stephan
EXECUTIVE MAYOR

MATZIKAMA INTEGRATED DEVELOPMENT PLAN 2017-2022
Page 5 of 236
Dear Valued Reader,
It is again such time for the Matzikama Municipality to compile a new 5 year Integrated Development Plan (IDP), outlining its Strategies, Key Performance Areas, Priorities and Programmes, in fulfilling its role and mandate as a “developmental local government institution”.
The meaning of the concept “developmental local government”:
Developmental local government means taking care of the needs of the community and the responsibility to make decisions that address past imbalances with regard to services and opportunities. One needs to also be conscious of the impact of these decisions on future generations. The responsibility of a municipality within a democratic framework relies on consultation with community members, ward committee members, organised interest groups and co-ordination between the three spheres of government namely local, provincial and national spheres.
Section 151 of our Constitution provides for the establishment of municipalities. It provides for a municipality’s right to govern the local government affairs of its community, subject to national and provincial legislation.
The establishment of a South African developmental state is based on the vision of the state and society working together to ensure social justice, economic growth and development. The White Paper on Local Government, 1998 attributes its vision to local government that it will “work with local communities to find sustainable ways to meet their social, economic and material needs and improve the quality of their lives”.
For a municipality to effectively follow the developmental local government approach, it means that the municipality will have to structure and manage its administration to give priority to the basic needs of the community and to promote the social and economic development of the community.
The characteristics of a municipality as a developmental local government, is outlined by the White Paper, as follows:
• Maximising social development and economic growth; • Integrating and coordinating; • Democratising development, empowerment and redistribution; and • Leading and learning.
The White Paper lists 3 ways to achieve developmental local government objectives:
• Integrated development planning and budgeting; • Performance management; and • Community participation.
To achieve the above results, municipal role players are expected to play their part to:
• Evaluate the municipality’s policies and programmes; • Consider the needs of people represented;

MATZIKAMA INTEGRATED DEVELOPMENT PLAN 2017-2022
Page 6 of 236
• Make recommendations that can improve these policies and programmes in line with the objectives of developmental local government;
• Provide democratic and responsible government for local communities; • Respond to the needs of local communities; • Ensure sustainable service delivery to local communities; • Promote social and economic development in the municipality; • Involve local communities and community organisations in local government; • Facilitate a culture of public service and accountability among its staff; and • Give the management responsibilities and coordinate these.
Through this 5 year Integrated Development Plan and the aligned Budget, the Matzikama Municipality, its Councillors and Officials, will strive to provide households with infrastructure and services; to create integrated and inclusive towns and rural areas with good living conditions and to promote local economic development and community empowerment.
In closing, let all of us, role players and stakeholders, as part of the Integrated Development Planning process, be able to say that we contribute towards the slogan: “Make Matzikama great again!”
Danie Lubbe
MUNICIPAL MANAGER

MATZIKAMA INTEGRATED DEVELOPMENT PLAN 2017-2022
Page 7 of 236
ANC African National Congress
BF Bitterfontein
CBD Central Business District
CMS Community Services
CS Corporate Services
CWP Community Works Program
DA Democratic Alliance
DCAS Department of Cultural Affairs and Sports
DCS Department of Correctional Services
DEA Department Environmental Affairs
DEADP Department of Environmental Affairs & Development Planning
DEDAT Department Economic Development and Tourism
DFA Development Facilitation Act
DLG Department Local Government
DOA Department of Agriculture
DoCS Department of Community Safety
DOH Department of Health
DOHA Department of Home Affairs
DOHS Department of Human Settlements
DoPW&T Department Public Works & Transport
DRDLR Department Rural Development & Land Reform
DSD Department of Social Development
DTI Department Trade and Industry
DTS Development and Town Planning Services
DWA Department Water Affairs
EDD Economic Development Department
EFF Economic Freedom Fighters
EMC Executive Mayoral Committee
EMS Emergency Medical Services
EPWP Expanded Public Works Program
FS Financial Services
IDP Integrated Development Plan
IDPRF Integrated Development Plan Representative Forum
KPI Key Performance Indicator
MATZIKAMA INTEGRATED DEVELOPMENT PLAN 2017-2022
Page 8 of 236
KR Kliprand
LED Local Economic Development
LEDF Local Economic Development Forum
LORWUA Lower Olifants River Water Users Association
LUPA Land Use Planning Act
MFMA Municipal Finance Management Act
MIDF Matzikama Intergovernmental Dialogue Forum
MIG Municipal Infrastructure Grant
MM Municipal Manager
MSA Municipal Systems Act
MSCOA Municipal Standard Chart of Accounts
MTSF Medium-term Strategic Framework
MV Molsvlei
MYEF Matzikama Youth Entrepreneur Forum
NR Nuwerus
NSDP National Spatial Development Perspective
NT National Treasury
OEAF Olifants River Estuary Advisory Forum
PK Put-se-Kloof
PSDF Provincial Spatial Development Framework
PT Provincial Treasury
RP Rietpoort
RSA Republic of South Africa
SAMPI South African Multidimensional Poverty Index
SAPS South African Police Services
SCM Supply Chain Management
SDBIP Service Delivery and Budget Implementation Plan
SDF Spatial Development Framework
SK Stofkraal
SMME Small Medium and Micro Enterprises
SOP Standard Operating Procedure
SPLUMA Spatial Planning & Land Use Management Act
STATSSA Statistics South Africa
TS Technical Services
UD United Democrats
WSDP Water Services Development Plan

MATZIKAMA INTEGRATED DEVELOPMENT PLAN 2017-2022
Page 9 of 236
NGO Non-Profit Organization
WCDM West Coast District Munisipality
DMA District Municipal Area
LUPO Land use Planning Ordination
NEMA National Environmental Management Act
IWMP Intergraded Waste Management Plan
HSP Human Settlements Plan
IRDP Informal Residential Development Programme
UISP Upgrading Informal Settlement Program
BESP Build Environment Support Program
ICT Information and Communication Technology
SALB Services and the South Africa Library for the blind
GDP Growth in the half of the decade per cent per annum for period
WCG Western Cape Government
Wi- Fi Wireless Internet Free Internet
NDP National Development Plan
CWCBR Cape West Coast Biosphere Reserve
APO Annual Plan of Operation
SRK Bl 110
ICM Integrated Coast Management Act
ICMP Integrated Coast Management Programme
EMP Estuarine Management Plan
WCED West Coast Economic Development
MOD Development and Growth Programme
WCDMA Western Cape Manage Area
LGSS Local Government Support Strategy
LGTAS Local Government Turnaround Strategy
COGTA Cooperative Governance and Traditional Affairs
DOLG Department of Local Government
IPSS Integrated Performance and Support System
DDF District Development Fund
APPs Annual Performance Plans
JPI’S Joint Planning Interventions
DHS Department of Human Settlement
ICASA Independent Communications Authority of South

MATZIKAMA INTEGRATED DEVELOPMENT PLAN 2017-2022
Page 10 of 236
CONTACT DETAILS ....................................................................................................................... 2
MATZIKAMA MUNICIPALITY COUNCILLORS ............................................................................... 3
EXECUTIVE MAYOR’S FOREWORD ............................................................................................... 4
MUNICIPAL MANAGER’S FOREWORD ......................................................................................... 5
ABBREVIATIONS ........................................................................................................................... 7
CHAPTER 1: INTRODUCTION ...................................................................................................... 14
1.1 MATZIKAMA MUNICIPALITY AT A GLANCE ...................................................... 14
1.2 IDP INTENT .......................................................................................................... 15
1.3 OVERVIEW OF THE MUNICIPAL AREA ............................................................. 15
1.4 LIFE CYCLE OF THE IDP .................................................................................... 17
1.5 LEGAL REFERENCE ........................................................................................... 17
1.6 CONTENT OF THE PLAN .................................................................................... 18
CHAPTER 2: THE CURRENT SITUATION ....................................................................................... 21
2.1 INTRODUCTION .................................................................................................. 21
2.1.1 Strategy Formulation Process .......................................................................... 21
2.2 COMMUNITY NEEDS AND CHALLENGES ......................................................... 22
2.2.1 Community Survey 2016/17 ................................................................................. 23
2.3 INTERNAL PROCESSES, PROCEDURES AND ESTABLISHMENTS .................... 36
2.3.1 Personnel Structure ......................................................................................... 37
2.3.2 Municipal Standard Chart of Accounts ............................................................. 38
2.3.3 Public Participation .......................................................................................... 39
2.3.4 IDP and Sector Plans ....................................................................................... 44
2.3.5 Municipal Basic Services.................................................................................. 61
2.3.6 Agency Services .............................................................................................. 67
2.3.7 Financial Norms and Standards ................................................................... 80
2.3.8 2015-2016 Annual Report ................................................................................ 88
2.3.9 Auditor General Report .................................................................................... 89
2.4 SOCIO ECONOMIC PROFILE ............................................................................. 91
2.4.1 Demographics .................................................................................................. 91
2.4.2 The Economy ................................................................................................... 93
2.4.3 Social Matters .................................................................................................. 97
2.5 ENVIRONMENTAL MANAGEMENT .................................................................. 106
2.5.1 Biodiversity ..................................................................................................... 106
2.5.2 The Coastal Zone ........................................................................................... 110
2.5.3 Air Quality Management ................................................................................. 114
MATZIKAMA INTEGRATED DEVELOPMENT PLAN 2017-2022
Page 11 of 236
2.5.4 Waste Treatment and Waste Disposal ........................................................... 115
2.5.5 Climate Change ............................................................................................. 116
2.6 NATIONAL AND PROVINCIAL GOVERNMENT SUPPORT .............................. 116
2.6.1 National Government Spend .......................................................................... 116
2.6.2 Provincial Government Spend ........................................................................ 117
2.7 MATZIKAMA WARDS ............................................................................................ 120
2.7.1 Ward 1............................................................................................................ 121
2.7.2 Ward 2............................................................................................................ 123
2.7.3 Ward 3............................................................................................................ 125
2.7.4 Ward 4............................................................................................................ 127
2.7.5 Ward 5............................................................................................................ 129
2.7.6 Ward 6............................................................................................................ 131
2.7.7 Ward 7............................................................................................................ 133
2.7.8 Ward 8............................................................................................................ 136
2.8 GOVERNMENT - STRATEGIC DIRECTION .......................................................... 138
2.8.1 National Government ..................................................................................... 138
2.8.2 Municipal support initiatives: .......................................................................... 139
2.8.3 Provincial Government ................................................................................... 143
2.8.4 West Coast District Municipality ..................................................................... 147
2.8.5 Partnering for development ............................................................................ 147
CHAPTER 3: ANALYSIS & DIAGNOSTICS ................................................................................. 149
3.1 Focus Area: Local Economic Development and Tourism ................................... 150
3.2 Focus Area: Housing .......................................................................................... 153
3.3 Focus Area: Social .............................................................................................. 156
................................................................................................................................................. 157
3.4 Focus Area: Crime .............................................................................................. 159
3.5 Focus Area: Municipal Basic Services ................................................................ 160
3.6 Focus Area - Transport ....................................................................................... 162
CHAPTER 4: SECTOR PLANS ..................................................................................................... 164
4.1 LOCAL ECONOMIC DEVELOPMENT ............................................................... 164
4.1.1 Overview of the Economy of Matzikama Municipality .................................... 164
4.1.2 Overview of Interventions .............................................................................. 167
4.2 SPATIAL DEVELOMENT FRAMEWORK............................................................... 167
4.3 HUMAN SETTLEMENT PLAN ............................................................................ 171
CHAPTER 5: THE STRATEGY ...................................................................................................... 173
5.1 VISION................................................................................................................ 173
5.2 MISSION............................................................................................................. 173

MATZIKAMA INTEGRATED DEVELOPMENT PLAN 2017-2022
Page 12 of 236
5.3 THE GUIDING PRINCIPLES .............................................................................. 174
5.4 STRATEGIC DIRECTION SETTING .................................................................. 175
CHAPTER 6: THE IMPLEMENTATION PLAN ................................................................................ 181
6.1 INTRODUCTION ................................................................................................. 181
6.2 IMPLEMENTATION ............................................................................................ 182
6.2.1 Strategic Objective No.1................................................................................. 182
6.2.2 Strategic Objective No.2................................................................................. 182
6.2.3 Strategic Objective No.3................................................................................. 182
6.2.4 Strategic Objective No. 4................................................................................ 183
6.2.5 Strategic Objective No.5................................................................................. 183
6.2.6 Strategic Objective No.6................................................................................. 183
6.2.7 Strategic Objective No. 7................................................................................ 184
CHAPTER 7: FINANCIAL PLAN ................................................................................................. 185
7.1 INTRODUCTION ................................................................................................ 185
7.2 AVAILABLE RESOURCES FOR IMPLEMENTATION ........................................... 185
7.2.1 Own Funding .................................................................................................. 185
7.2.2 National & Provincial government .................................................................. 185
7.3 THE BUDGET ..................................................................................................... 186
7.3.1 Consolidated Budget ...................................................................................... 186
7.3.2 Capital Budget .................................................................................................... 186
6.3.3 Operating Budget ............................................................................................... 186
7.4 LINKING THE BUDGET TO THE IDP ................................................................ 196
7.4.1 Introduction......................................................................................................... 196
7.4.2 MSCOA .............................................................................................................. 196
CHAPTER 8: MONITORING & EVALUATION ............................................................................. 198
8.1 INTRODUCTION ................................................................................................ 198
8.2 Performance Management System .................................................................... 198
8.2.1 Performance Planning .................................................................................... 198
8.2.2 Performance Monitoring and Evaluation ........................................................ 198
8.3 IDP Projects for 2017/2022 ............................................................................... 199
ANNEXURES ............................................................................................................................. 236
MATZIKAMA INTEGRATED DEVELOPMENT PLAN 2017-2022
Page 13 of 236
MATZIKAMA INTEGRATED DEVELOPMENT PLAN 2017-2022
Page 14 of 236
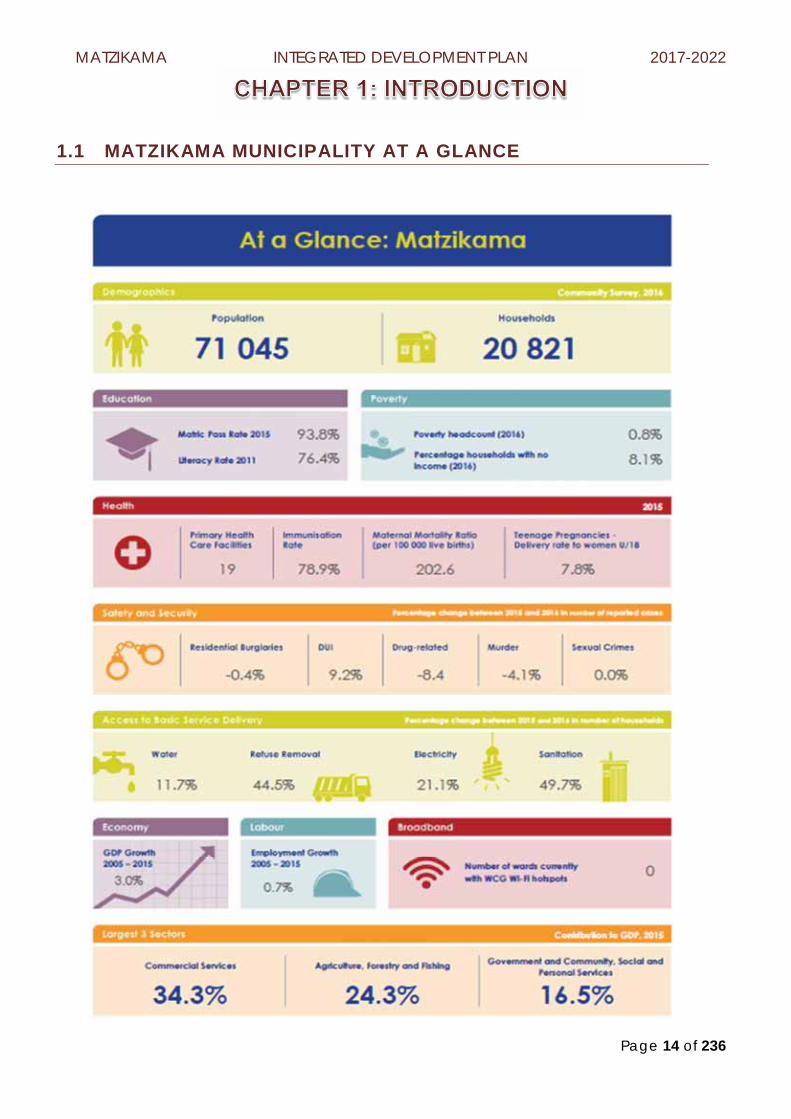
1.1 MATZIKAMA MUNICIPALITY AT A GLANCE
MATZIKAMA INTEGRATED DEVELOPMENT PLAN 2017-2022
Page 15 of 236
1.2 IDP INTENT
Integrated Development Planning is an approach to planning that involves the entire municipality and its citizens in finding the best solutions to achieve good long-term development.
Apart from the IDP being a legislative requirement its ultimate purpose is to be an instrument of Council and its social partners to accomplish the vision of Council through the successful implementation of the strategic objectives and strategies. These developmental objectives and strategies of Council are developed by the same Council based on a comprehensive consultation process with all the Communities in the Municipal area. The IDP does a number of things but first and foremost it enables the Municipality to manage the process of fulfilling its strategic objectives followed by a number of other things including but not limited to:
The IDP through its public participation processes makes provision for Council to be informed of the challenges facing its social partners
Through its integrated processes and programs the IDP equip Council to develop strategies and projects to resolve the challenges of its social partners in a manner that is effective and efficient
The IDP facilitate the removal of the silo-approach to development practices with the intent to expedite delivering of services amongst other things
Because the IDP is the only strategic plan that guide development it is instrumental in guiding other spheres of government, the private sector and aid organizations to allocate funds for projects that is aligned with the developmental objectives and strategies of the Municipality
The IDP is a key strategy of the government to strengthen democracy and transform institutions
The South African government system comprise three spheres of government that must work together to bring effective and efficient services to the public. The IDP is instrumental in facilitating and coordinating inter-governmental processes between the three spheres of government that is needed to deliver services to the public
1.3 OVERVIEW OF THE MUNICIPAL AREA
The Matzikama Municipality is located on the north-west coast of the Western Cape. The Municipality borders the Atlantic Ocean to the west, the Kamiesberg and Hantam Municipalities in the Northern Cape to the north and east respectively and the Cederberg Municipality in the Western Cape to the south.

MATZIKAMA INTEGRATED DEVELOPMENT PLAN 2017-2022
Page 16 of 236
The Matzikama Municipality is a category B municipality proclaimed in terms of Provincial Notice No 481/2000 of September 2000. As of May 2011 the previous district managed area to the north (showing in purple on the map) of Matzikama Municipality has been incorporated as per notice in the Provincial Gazette Extraordinary 6825. As a result the geographical area of the Municipality increased from roughly 8000 km2 to 12900 km2. The municipal area comprises 18 towns and or villages. These towns and villages include Doring Bay, Strandfontein, Papendorp, Ebenaeser, Lutzville-West, Lutzville, Koekenaap, Vredendal, Klawer, Vanrhynsdorp, Nuwerus, Bitterfontein, Kliprand, Put-se-Kloof, Rietpoort, Molsvlei and Stofkraal.
Matzikama is characterized by an arid environment but is served by a life-giving arterial namely the Olifants River. The river with its associated canal systems supports a flourishing agricultural sector that is mainly built on viniculture. Apart from the previously district-municipality managed area to the north as well as the towns of Doring Bay, Strandfontein and Vanrhynsdorp the rest of the population is concentrated along the river and canal system. Vredendal is by far the largest town in the area and it is also centrally located rendering it the logical economic and administrative centre of the municipal area.

MATZIKAMA INTEGRATED DEVELOPMENT PLAN 2017-2022
Page 17 of 236
1.4 LIFE CYCLE OF THE IDP
The cycle of the IDP is equal to a five year period commencing 1st July 2017 until 30 June 2022. The cycle extends one year beyond the term of the newly elected Council, which comes to an end in 2021. The IDP will be revised and if necessary amended as per legislation on an annual basis for which a time schedule will be adopted by Council no later than the end of August for every annual revision.
1.5 LEGAL REFERENCE
Section 25(1) of the Municipal Systems Act (32 of 2000) indicates that: Each Municipal Council must within the prescribed period after the start of its elected term, adopt a single, all-inclusive and strategic plan for the development of the municipality which:
a) Links, integrates and coordinates plans and takes into account proposals for the development of the community;
b) Aligns the resources and capacity of the municipality with the implementation of the plan;
c) Complies with the provisions of the Chapter (Chapter 5 MSA; and d) Is compatible with national and provincial development plans and planning
requirements binding on the municipality in terms of legislation
In terms of the core components of the IDP, chapter 5 and section 26 of the MSA (2000) indicate that: An IDP must reflect:
The municipal council’s vision for the long term development of the municipality with special emphasis on the municipality’s most critical development and internal transformation needs
An assessment of the existing level of development in the municipality, which must include an identification of communities which do not have access to basic municipal services
The council’s development priorities and objectives for its elected term, including its local economic development aims and its internal transformation needs;
The council’s development strategies which must be aligned with national and provincial sector plans and planning requirements binding on the municipality in terms of legislation;
A spatial development framework, which must include the provision of basic guidelines for a land use management system for the municipality
The council’s operational strategies; Applicable disaster management plans;

MATZIKAMA INTEGRATED DEVELOPMENT PLAN 2017-2022
Page 18 of 236
A financial plan, which must include a budget projection for at least the next three years; and
The key performance indicators and performance targets determined in terms of section
Section 28 of the MSA (32 of 2000) stipulates that:
Each municipal council, within a prescribed period after the start of its elected term, must adopt a process set out in writing to guide the planning, drafting, adoption an review of its IDP;
The municipality must through appropriate mechanisms, processes and procedures established in term of chapter 4 of the MSA (32 of 2000), consult the community before adopting the process; and
A municipality must give notice to the local community of particulars of the process it intends to follow
The way in which the IDP process will be outlined will be undertaken in the process plan, which is a legal requirement for all municipalities to have in place not later than the end of August. The Local Government Municipal Planning and Performance Management Regulation 2001, explicitly reveals the content of the IDP as well as the processes the municipality must subject the IDP process to when doing its development or review of the IDP.
Section 29 (1) of the MSA (32 of 2000) outlines the process to be followed as:
The process to be followed by a municipality to draft its IDP, including its consideration and adoption of the draft plan must –
a) Be in accordance with a predetermined programme specifying the time-frames for the different steps;
b) Through appropriate mechanisms, processes and procedures established in terms of chapter 4 of the same Act, allow for :
i. The local community to be consulted on its development needs and priorities; ii. The local community to participate in the drafting of the IDP; and iii. Organs of state, including traditional authorities, and other role players to be
identified and consulted on the drafting of the IDP c) Provide for the identification of all plans and planning requirements binding on the
municipality in terms of national and provincial legislation; and d) Be consistent with any other matter that may be prescribed by regulation
1.6 CONTENT OF THE PLAN
The IDP is divided in to four sections for the ease of understanding and implementation. Below is a description of each of the sections:
Section One: Establishment Phase
The section consists of chapter one which focuses on establishing the plan by laying the foundation trough an introduction to the Municipality and relevant legislation, amongst others.
Section Two: Frame of Reference

MATZIKAMA INTEGRATED DEVELOPMENT PLAN 2017-2022
Page 19 of 236
The section consists of chapters two, three and four with a focus on contextualising the strategy and providing the reader with a reference in relation to the strategies adopted. The section looks at the current situation, analysis and diagnostics & prognoses of the challenges and obstacles.
Chapter Two provides the reader with a detailed description of the current situation
Chapter Three focuses on analysing the current situation and installs the basis for the strategy and consequential interventions to address the underlying problem Council is trying to solve
Section Three: Course of Action
The section reveals actions and interventions proposed and extended by the three spheres of Government. Moreover, it lays the foundation for the SDBIP. The section consists of chapters five, six, seven and eight.
Chapter Four focuses on the sector plans as required by legislation. The chapter, also, shows alignment between sector plans and Council’s strategic objectives
Chapter Five focuses on operational strategies devised by Council to respond to the critical challenges and obstacles to ultimately achieve the vision
Chapter Six focuses on the implementation or action plan to give effect to the strategies revealed in chapter six
Chapter Seven focuses on the financial plan showing alignment between the budget and the strategic objectives of Council. The Chapter, also, shows alignment between spending by the other two spheres of Government and Council’s strategic objectives
Section Four: Are We Making Progress?
The main purpose of the section is to show progress in terms of the implementation plan of the IDP.

MATZIKAMA INTEGRATED DEVELOPMENT PLAN 2017-2022
Page 20 of 236

MATZIKAMA INTEGRATED DEVELOPMENT PLAN 2017-2022
Page 21 of 236
2.1 INTRODUCTION
Imperative to any strategy is to understand the current environment for which the strategy is being developed. By describing the current situation in as much detail as possible provides for an adequate assessment, which in turn will provide for a solid foundation for strategy development.
The chapter provides detailed information of the status quo of the environment as per the jurisdiction of the Matzikama Municipality.
A thorough consultation process involving the public, Municipality and Government took place in order to understand the current environment that has an impact in one way or another on all of the above stakeholders.
The table below is indicative of the process that was followed by the Matzikama Municipality that involved all the stakeholders.
2.1.1 Strategy Formulation Process
DATE ACTIVITY DESCRIPTION ROLE PLAYER(S) Aug – Sept 2017 Ward Committee
establishment Following the Local Government elections on 3 August 2017, Ward Committees with help of Provincial Government have been established in all eight wards
Local Communities in all wards and the process was facilitated by the officials responsible for IDP and Public Participation
Sept 2017 Ward Committee meetings
Newly established ward committees identified and prioritised challenges and interventions
Ward Committee members facilitated by officials responsible for public participation.
16 November 2016 IDP steering committee establishment
The IDP steering committee comprising the Municipal Manager and all directors was established. To process of developing the IDP was discussed with the committee.
Acting Municipal Manager and Directors
24 November 2016 IDP Representative Forum meeting
The committee represented by a variety of stakeholders including civil society, business and Government discussed issues related to social and economic dimensions
All members of the Matzikama IDP Repforum
Feb 2017 Workshop with the EMC and senior management regarding the personnel structure
Workshop regarding personnel structure to consider alignment with strategy
EMC members and senior management facilitated by AGITO Minds

MATZIKAMA INTEGRATED DEVELOPMENT PLAN 2017-2022
Page 22 of 236
DATE ACTIVITY DESCRIPTION ROLE PLAYER(S) 6&7 December 2016
Strategic planning session with Council and management
Strategy development including vision, mission, values, strategic objectives and strategies
Council and Management
30 March 2017 Workshop on draft IDP Workshop draft IDP with Councillors and management before submitting for Council’s approval
Council and Management
30 March 2017 Prescription to Council Statutory submission to Council – Draft IDP
Council
03-10 April 2017 Consulting Communities on draft IDP
Feedback from communities on draft IDP for consideration by Council
Communities
20 Apr 2017 Workshop regarding performance management
Workshop on finalizing 2017/2018 KPIs and targets
Council and Management
30 May 2017 Prescription to Council Statutory submission to Council Council
2.2 COMMUNITY NEEDS AND CHALLENGES
The Municipality conducted several consultation sessions to involve all communities in the municipal area in the development processes of the IDP as determined by legislation.
The consultation process with the Communities, preceded by the establishment of ward committees in all eight wards, commenced in October 2016 with ward committee workshops. IDP ward meetings followed from 31 October 2016 to 09 November 2016 in all eight wards to allow for further comment on identification and prioritisation of community needs.
To finalise the determination and prioritisation of Ward needs an IDP Repforum meeting was held 24 November 2016. The meeting was well attended by a combination of representatives from Government, the business community, NGOs and civil society.
Recognising the importance of economic growth and development, the Municipality conducted three more engagements with representatives of the local commercial sector, commercial farmers sector as well as the emerging farmers in the area.
The consultation sessions with the various communities in the municipal area referred to above, sent a clear message to the Council of Matzikama Municipality regarding what the priorities of the public are about the challenges they facing.
A comprehensive list of the needs and priorities identified by the different Communities of Matzikama Municipality, namely Civil Society, Business Community, Farming Community as well as the Matzikama Administration is included as an Annexure to this IDP.
Below follows a list of needs, identified through the public participation processes, from the agricultural worker census and community survey.

2.2.1 Community Survey 2016/17
2.2.1.1. Community survey ward 1
Below is the response by the Community of Ward one concerning the most important service they want the Council of Matzikama Municipality to address in next five years.
Economic development appeared from the survey as the most important service the Community of Ward one wants the Council of Matzikama Municipality to attend to over the next five years. Low cost housing surfaced as the second most valuable need the Community wants Council to attend to.
When asked what the most important service the Community of Ward one wants the Provincial and National Governments to attend to over the next five years is, they responded as follows.
Answer Choices Responses a) Economic development / Job
creation 69.05% 58
b) Low cost housing 28.19% 22 c) Gap Housing 3.57% 3 d) Roads and storm water 0.00% 0 e) Electricity 0.00% 0
f) Potable water 0.00% 0
g) Sewerage 0.00% 0
h) Refuse removal 1.19% 1
Total 84
Answer Choices Responses
a) Education 30.95% 26
b) Crime / Safety and Security 25.00% 21 c) Economic Development / Job
Creation 19.05% 16
d) Sports 0.00% 0
e) Health 14.29% 12
f) Support to Emerging Farmers 10.71% 9
Total 84

The Communities of Ward one identified education and crime/Safety and security as the most important services they want the Provincial Government to attend to over the next five years.
2.2.1.2 Community survey ward 2
DORING BAY − Below is the response by the Community of Doring Bay concerning the most
important service they want the Council of Matzikama Municipality to address in next five years.
Economic development appeared from the survey as the most important service the Community of Doring Bay wants the Council of Matzikama Municipality to attend to over the next five years. Low cost housing surfaced as the second most valuable need the Community wants Council to attend to.
− When the Community of Doring Bay was asked which provincial or national service they want these spheres of government to focus on for the next five years they responded as follows.
Answer Choices Responses a) Economic development / Job
creation 81.48% 22
b) Low cost housing 14.81% 4 c) Gap Housing 3.70% 1 d) Roads and storm water 0.00% 0 e) Electricity 0.00% 0
f) Potable water 0.00% 0
g) Sewerage 0.00% 0
h) Refuse removal 0.00% 0
Total 27
Answer Choices Responses
a) Education 55.56% 15
b) Crime / Safety and Security 14.81% 4 c) Economic Development / Job
Creation 29.63% 8
d) Sports 0.00% 0
e) Health 0.00% 0
f) Support to Emerging Farmers 0.00% 0
Total 27

MATZIKAMA INTEGRATED DEVELOPMENT PLAN 2017-2022
Page 25 of 236
Education emerged as the service that the Community of Doring Bay wants to see improvement in from a provincial and national function perspective. Again economic development from a provincial and national perspective surfaced as important to the Communities of Doring Bay. The Doring Bay Communities in no uncertain terms prioritised economic development as an essential service they want all three spheres of government to focus on.
STRANDFONTEIN
The people of Strandfontein responded as follows on the question as to which municipal service they want Council to focus on for the next five years.
From the information above, economic development surfaced as the most important service the people of Strandfontein wants Council to pay attention to for the next five-year cycle. The second service they want Council to direct their attention to is refuse removal followed by electricity. As with Doring Bay Economic development from a municipal service perspective surfaced as an essential service for the population of Strandfontein. − When posed the question, which service from a provincial and national function
perspective the population of Strandfontein wants these spheres of Government to focus on they responded as per the graph and table below:
Answer Choices Responses a) Economic development / Job
creation 58.33% 7
b) Low cost housing 0.00% 0 c) Gap Housing 0.00% 0 d) Roads and storm water 0.00% 0 e) Electricity 8.33% 1
f) Potable water 0.00% 0
g) Sewerage 0.00% 0
h) Refuse removal 33.33% 4
Total 12
Answer Choices Responses
a) Education 8.33% 1
b) Crime / Safety and Security 75% 9 c) Economic Development / Job
Creation 8.33% 1
d) Sports 8.33% 1
e) Health 0.00% 0
f) Support to Emerging Farmers 0.00% 0
Total 12

MATZIKAMA INTEGRATED DEVELOPMENT PLAN 2017-2022
Page 26 of 236
There are no schools in Strandfontein and very few school going children lives in Strandfontein. Therefore the focus is different from what they want national and provincial government to focus on. Crime/safety and security surfaced as important to the residents of Strandfontein. Economic development from a national and provincial function perspective and education surfaced as second tier priorities for the residents.
PAPENDORP − The residents of Papendorp responded as follows to the question, which municipal
service is most important to them?
Explicit in their response, the residents of Papendorp prioritised economic development as the key service they want Council to focus on for the next five years.
− When posed the question, which national and provincial service they want these spheres of government to focus on the residents responded as per the graph and table below.
As with Doring Bay the residents of Papendorp requested that from a provincial and national government function perspective, education receive the most attention
Answer Choices Responses a) Economic development / Job
creation 100% 10
b) Low cost housing 0.00% 0 c) Gap Housing 0.00% 0 d) Roads and storm water 0.00% 0 e) Electricity 0.00% 0 f) Potable water 0.00% 0
g) Sewerage 0.00% 0
h) Refuse removal 0.00% 0
Total 10
Answer Choices Responses
a) Education 60% 6
b) Crime / Safety and Security 10.00% 1 c) Economic Development /
Job Creation 30.00% 3
d) Sports 0.00% 0
e) Health 0.00% 0
f) Support to Emerging Farmers 0.00% 0
Total 10
MATZIKAMA INTEGRATED DEVELOPMENT PLAN 2017-2022
Page 27 of 236
followed by economic development and to a lesser extent crime/safety and security. Unemployment and poverty in these two towns are rife and it is clear from the responses to the questions that communities in no uncertain terms want all three spheres of government to direct their attention to local economic development.
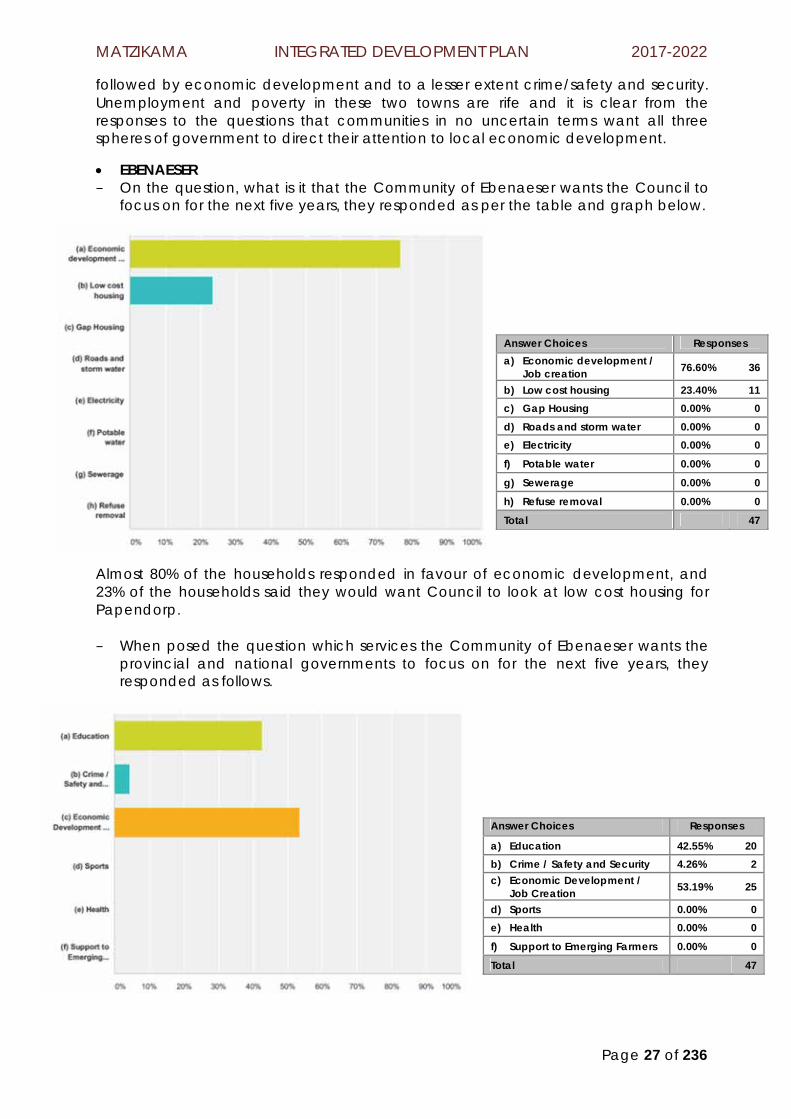
EBENAESER − On the question, what is it that the Community of Ebenaeser wants the Council to
focus on for the next five years, they responded as per the table and graph below.
Almost 80% of the households responded in favour of economic development, and 23% of the households said they would want Council to look at low cost housing for Papendorp. − When posed the question which services the Community of Ebenaeser wants the
provincial and national governments to focus on for the next five years, they responded as follows.
Answer Choices Responses a) Economic development /
Job creation 76.60% 36
b) Low cost housing 23.40% 11 c) Gap Housing 0.00% 0 d) Roads and storm water 0.00% 0 e) Electricity 0.00% 0
f) Potable water 0.00% 0
g) Sewerage 0.00% 0
h) Refuse removal 0.00% 0
Total 47
Answer Choices Responses
a) Education 42.55% 20 b) Crime / Safety and Security 4.26% 2 c) Economic Development /
Job Creation 53.19% 25
d) Sports 0.00% 0 e) Health 0.00% 0
f) Support to Emerging Farmers 0.00% 0
Total 47

MATZIKAMA INTEGRATED DEVELOPMENT PLAN 2017-2022
Page 28 of 236
More than 50% of the Community emphasized the importance of economic development from a provincial and national perspective, when they requested that both spheres government direct their focus to economic development. The consolidated response by the Ward is explicit as the Community of Ward Two unanimously in no uncertain terms provided the Council of Matzikama Municipality with a very clear mandate. Focus on economic development for the next five years was the message from the Community of Ward Two. Apart from Strandfontein that listed refuse removal as a second focus area and Papendorp that did not list a second focus area, both Doring Bay and Ebenaeser listed low cost housing as a second focus area for the Council of Matzikama Municipality to respond to in the next five years. From a provincial and national government perspective the Community of Ward Two requested that education and, again, economic development receive government’s attention for the next five years.
2.2.1.3 Community survey wards 3, 4 & 5
− Vredendal is divided into three wards. When posed the question as to what it is that the communities in these wards want the Council of Matzikama to focus on for the next five years, they responded as follows.
Economic development surfaced as the priority for the Community followed by low cost housing and gap housing.
− When asked the question what it is that they want the other two spheres of government to focus on for the next five years, they responded as follows.
Answer Choices Responses
a) Economic development / Job creation 43.43% 152
b) Low cost housing 32.86% 115
c) Gap Housing 12.86% 45
d) Roads and storm water 3.14% 11
e) Electricity 3.43% 12
f) Potable water 2.29% 8
g) Sewerage 0.00% 0
h) Refuse removal 2.00% 7
Total 350

MATZIKAMA INTEGRATED DEVELOPMENT PLAN 2017-2022
Page 29 of 236
Crime & Safety and Security followed by economic development from a provincial and national government perspective emerged as critical challenges that the Communities of these wards want the two spheres of government to focus on.
2.2.1.4 Community survey ward 6
− The Community of Ward six responded as follows to the question, which municipal service they want council to focus on for the next five years. The graph and table below reflect the responses of the Community of Ward six.
Low cost housing followed by economic development is the key services the Community of Ward six wants the Council of Matzikama to focus on in their five year term.
− When asked the same question about the services of provincial and national
government, the Community responded as follows.
Answer Choices Responses
i) Economic development / Job creation 35.97% 50
j) Low cost housing 45.32% 63
k) Gap Housing 11.51% 16
l) Roads and storm water 3.60% 5
m) Electricity 1.44% 2
n) Potable water 0.72% 1
o) Sewerage 0.00% 0
p) Refuse removal 1.44% 2
Total 139
Answer Choices Responses
a) Education 11.43% 40
b) Crime / Safety and Security 50.29% 176
c) Economic Development / Job Creation 31.43% 110
d) Sports 1.43% 5
e) Health 4.29% 15
f) Support to Emerging Farmers 1.14% 4
Total 350 350
MATZIKAMA INTEGRATED DEVELOPMENT PLAN 2017-2022
Page 30 of 236
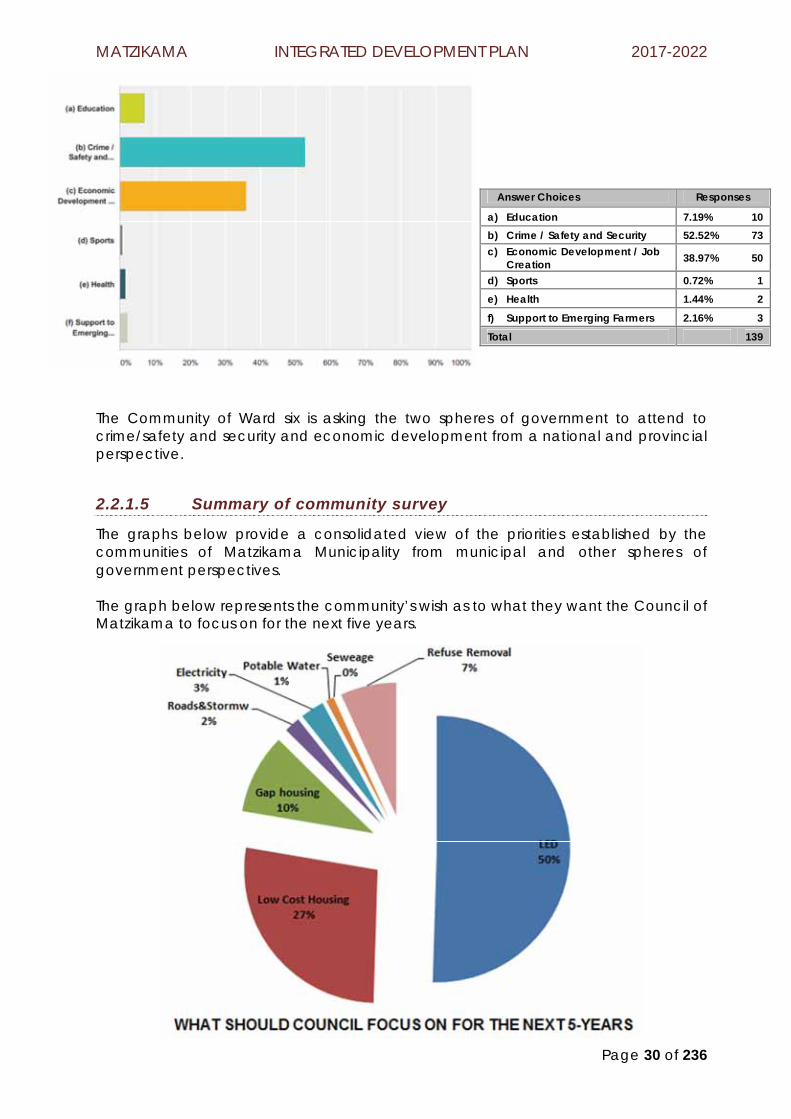
The Community of Ward six is asking the two spheres of government to attend to crime/safety and security and economic development from a national and provincial perspective.
2.2.1.5 Summary of community survey
The graphs below provide a consolidated view of the priorities established by the communities of Matzikama Municipality from municipal and other spheres of government perspectives. The graph below represents the community’s wish as to what they want the Council of Matzikama to focus on for the next five years.
Answer Choices Responses
a) Education 7.19% 10 b) Crime / Safety and Security 52.52% 73 c) Economic Development / Job
Creation 38.97% 50
d) Sports 0.72% 1 e) Health 1.44% 2
f) Support to Emerging Farmers 2.16% 3
Total 139

MATZIKAMA INTEGRATED DEVELOPMENT PLAN 2017-2022
Page 31 of 236
From the pie chart above it is clear that 50% of civil society want the Council of Matzikama to focus on LED with the intent to grow the economy and create jobs. Twenty-seven percent of civil society wants the Council to focus on building low cost houses and ten percent expresses their need for gap housing. In summary LED and Housing makes up the lion’s share of what civil society wants Council to focus on for the next five years. A similar question was posed to civil society as to what they want Provincial and National Government to focus on. The Community’s wish as to what they want the other two spheres of government to focus on at least for the life of the 4th generation IDP is reflected in the pie chart below.
Civil society in Matzikama wants Government to focus on crime, economic development and education at least for the life of the 4ht generation IDP. Forty-two percent of the Community wants government to focus on fixing crime, thirty percent of the Community wants Government to support economic development and nineteen percent of civil society wants Government to focus on addressing the challenges in relation to education.
2.2.2. Agricultural worker census
The DOA of the Western Cape Government conducted a census to (i) establish a database of agricultural workers in the Western Cape and (ii) to identify and respond to the needs of agricultural workers and their families. The census, which delivered a close to 57 percent response, attended to 1 773 farms in the Province, visited 14 091 households and received information from 55 033 individuals.
MATZIKAMA INTEGRATED DEVELOPMENT PLAN 2017-2022
Page 32 of 236
Key provincial challenges
Through the census it was established, from a provincial point of view, that poor rural education and rural youth unemployment will be critical pressure points for the next fifteen years. The census further revealed that 78, 8 percent will be entering the job market in the next fifteen years and only 2.3% of current agricultural workers will be exiting the job market over the same period.
West coast district farms
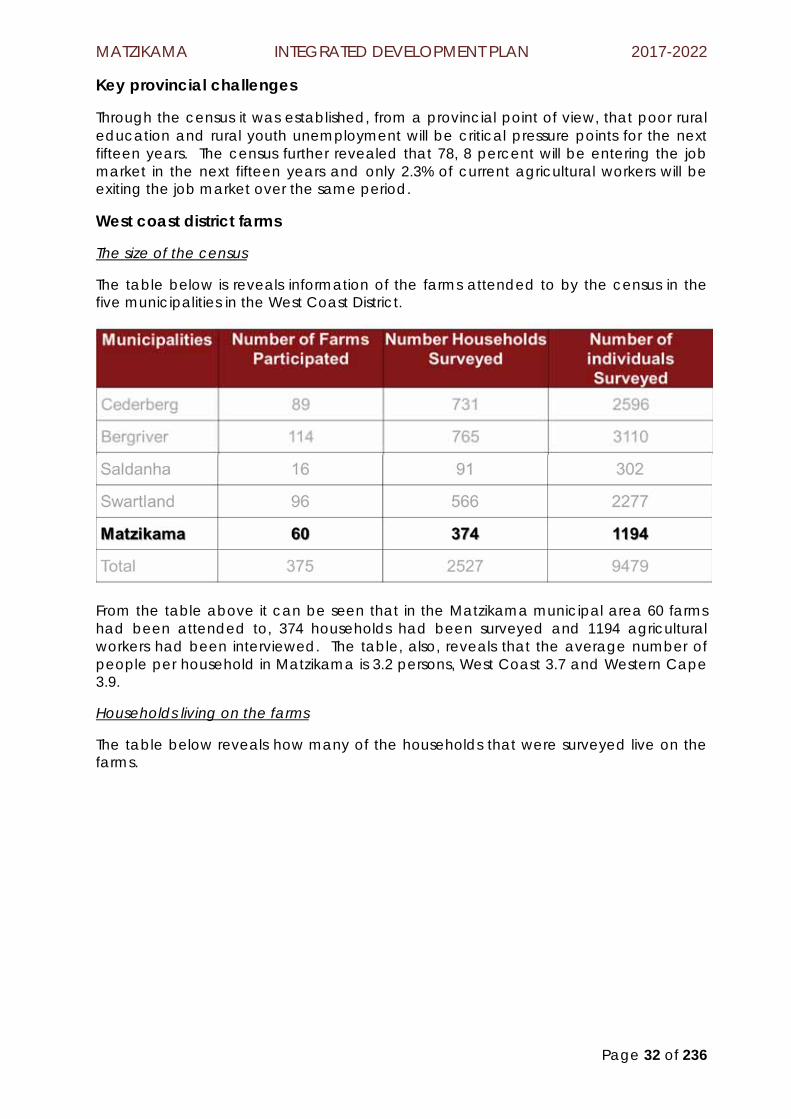
The size of the census
The table below is reveals information of the farms attended to by the census in the five municipalities in the West Coast District.
From the table above it can be seen that in the Matzikama municipal area 60 farms had been attended to, 374 households had been surveyed and 1194 agricultural workers had been interviewed. The table, also, reveals that the average number of people per household in Matzikama is 3.2 persons, West Coast 3.7 and Western Cape 3.9.
Households living on the farms
The table below reveals how many of the households that were surveyed live on the farms.

MATZIKAMA INTEGRATED DEVELOPMENT PLAN 2017-2022
Page 33 of 236
Eighty-six percent of households surveyed lives on the farms, and slightly less than fourteen percent lives elsewhere. Matzikama is second to Saldanha regarding the number of households living on the farms. It should also be noted that Saldanha only represents 4 percent of the total farms attended to by the census.
How old are the individuals that participated in the census
The bar chart below reveals the age of the individuals that participate in the census.
It can be seen from the bar chart above that the bulk of the individuals are below the age of 35 years (66%), with only 4.41% of the population above the age of 60 years. The bar chart below provides a breakdown of age between male and female.

MATZIKAMA INTEGRATED DEVELOPMENT PLAN 2017-2022
Page 34 of 236
The bar chart above reveals that 34.6 percent of individuals interviewed are below the age of 19 years, 31.4 percent are between the age of 19 and 34 years, only 2 percent are older than 65 years and 11 percent are between the ages of 50 and 64 years.
Education
The bar chart below reveals the highest levels of education achieved by the individuals that participated in the survey.
Educational Assistance Required
The census revealed that the following educational related assistance is required.
MATZIKAMA INTEGRATED DEVELOPMENT PLAN 2017-2022
Page 35 of 236
School uniforms were the greatest with 32.03 people indicating this need. School fees were the second highest with 19.54% indicating they need help with
the fees. Thirteen percent indicated that they need help with textbooks. Slightly less than seven percent reported that they needed help with bursaries. Slightly more than twelve percent reported no need for assistance. School transport is a big concern in all the municipal areas
Occupations
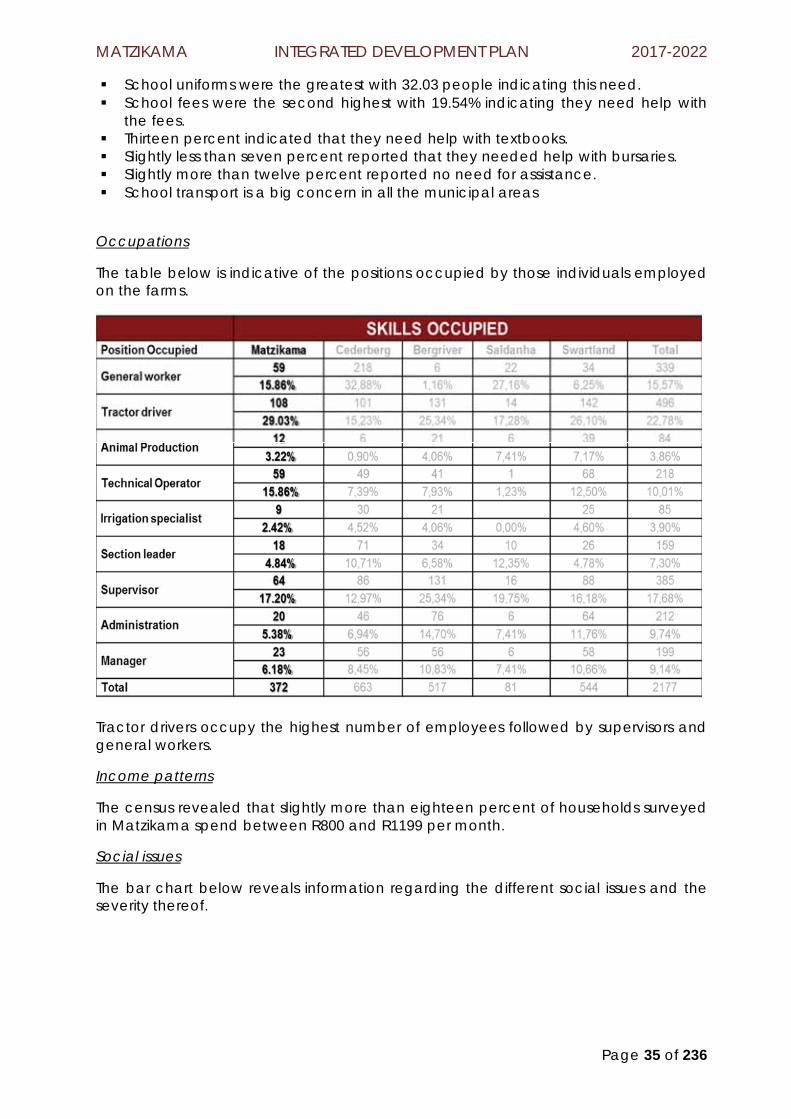
The table below is indicative of the positions occupied by those individuals employed on the farms.
Tractor drivers occupy the highest number of employees followed by supervisors and general workers.
Income patterns
The census revealed that slightly more than eighteen percent of households surveyed in Matzikama spend between R800 and R1199 per month.
Social issues
The bar chart below reveals information regarding the different social issues and the severity thereof.

MATZIKAMA INTEGRATED DEVELOPMENT PLAN 2017-2022
Page 36 of 236
Alcoholism stands out as the most severe social issue experienced on the farms followed by drug abuse and unemployment.
2.3 INTERNAL PROCESSES, PROCEDURES AND ESTABLISHMENTS
Institutional arrangements The Matzikama Municipality currently employs 397 officials, who individually and collectively contribute to the achievement of the Municipality’s objectives. The current approved organogram for the municipality has 481 posts and 427 of the posts were budgeted for. The 30 budgeted posts which are currently vacant, resulting in a vacancy rate of 7% for budgeted posts, which is quite normal. A newly designed macro and micro organisational structure for the municipality with approximately 500 posts will be implemented in phases from the 2018/19 financial year to the 2021/22. The implementation of the new structure will be according to a cost-effective budget and implementation plan with the key focus on filling of critical posts which will enable the Municipality to achieve its objectives after the revision and evaluation of all TASK job descriptions. The turnover rate of employees improved from 11.2% in the 2014/15 financial year to 6.7% in the 2015/16 financial year and must also improve in the 2017-2022 term, together with the vacancy rate.

Page
37
of 2
36
2.3.
1 Pe
rson
nel S
truc
ture

Page 38 of 236
2.3.2 Municipal Standard Chart of Accounts
Background
As at 01 July 2017, all municipalities will have to be live on the new Municipal Standard Chart of Accounts (mSCOA), as required by the Municipal Regulations on a Standard Chart of Accounts, published 22 April 2014.
MSCOA is a multi-dimensional classification framework providing the method and format for recording and classifying financial transaction information in the general ledger forming part of the books of account containing a standard list of all available accounts.
The objective of MSCOA is to provide a national standard for the uniform recording and classification of municipal budget and financial information at a transactional level by prescribing a standard chart of accounts for municipalities and municipal entities.
MSCOA stands for “municipal standard chart of accounts” and provides a uniform and standardised financial transaction classification framework. Essentially this means that MSCOA prescribes the method (the how) and format (the look) that municipalities and their entities should use to record and classify all expenditure (capital and operating), revenue, assets, liabilities, equity, policy outcomes and legislative reporting.
Uniform expenditure classifications have already been established and implemented for national and provincial government departments. In order to enable the National Treasury to provide consolidated local government information for incorporation in national accounts, national policy and other purposes, it must obtain financial information from individual municipalities. All 278 municipalities currently manages and reports on its financial affairs according to its own organisational structure and unique chart of accounts classification framework. The result is a disjuncture amongst municipalities and municipal entities and between municipalities and the other spheres of government as to how they classify revenue and expenditure and consequently report thereon. This compromises transparency, reliability and accuracy throughout the planning and reporting process and impedes the ability of national government to integrate information and to formulate coherent policies in response to the objectives of local government.
Therefore it is necessary for the Minister of Finance to specify national norms and standards for the recording and collection of local government budget, financial and non-financial information which will include in some instances the specification of information required for national policy coordination and reporting. It is very difficult for National and Provincial Treasury to compare financial information across all municipalities due to them having a non-standardised chart of accounts. The challenge left is how to reliably assess municipality’s financial performance relative to one another?
Benefits of MSCOA
MSCOA modernises financial management through updated systems and technology. There is a general improvement of systems offerings since vendors are upgrading systems to align with MSCOA – this should result in better audit outcomes. Furthermore the Auditor-General currently has to audit the multiple charts of accounts of municipalities. Standardising the chart of accounts for all municipalities reduces Auditor-General interpretations across multiple charts of accounts thereby reducing audit costs and auditing time.
Page 39 of 236
1. MSCOA enforces alignment between the strategic and operational documents of the municipality (IDP, Budget and SDBIP).
2. Relieves reporting fatigue and the cost of reporting. By enforcing MSCOA from transaction inception to data extraction in a municipality’s systems ensures a credible, reliable and timely database of municipal information at a very detailed level. This information can be used in multi-dimensional reporting. MSCOA therefore focus on data extraction making reporting possibilities endless which will eliminate current excessive user requests to municipalities, resulting in endless templates asking for the same information in different formats. MSCOA does not fix historic information but going forward it forces credible information through its validation principles;
3. Improves transparency and accountability leading to a high level of service delivery;
4. Brings higher levels of cooperative government. MSCOA makes it easier to navigate across municipal systems to prioritise support. National and provincial government can now provide pro-active and preventative support because we will have credible, reliable and timely municipal information;
5. MSCOA Implementation Status
The MSCOA Steering Committee of Matzikama Municipality fulfils the MSCOA implementation oversight role. A project manager is appointed that accounts to the MSCOA Steering Committee. The implementation has reached several milestones of which classifying the municipality’s current chart of accounts to the mSCOA version 6.1 chart of accounts is one. The municipality also conducted an analysis of its ICT infrastructure in anticipation of higher system requirements by service providers. The municipality has appointed a service provider to implement their mSCOA compliant core system after a due diligence was conducted. The mSCOA implementation of Matzikama Municipality has many challenges but is resolved effectively and efficiently as the project is supported by the whole municipality.
2.3.3 Public Participation
The Constitution of the Republic of South Africa (Act 108 of 1996) provides the policy basis and guidance for all public participation programmes. In terms of institutional arrangements, all ten legislative institutions have operational public participation units of varying capacity in place, while some also have a political structure dealing specifically with public participation.
To strengthen public participation and ultimately the democracy, the South African government established the ward committee system in December 2000, with the intention of improving service delivery by bridging the gap between the respective communities and the municipal structures. Among others ward committees, should be able to enhance participatory democracy by collectively organizing communities in as far as ward jurisdiction is concerned. Albeit the municipal challenges ward committees should be able to encourage and formulate programmes that promote public participation, so that the municipal council can be better positioned when making decisions, so as to ensure better service delivery. Public participation is essentially a process where communities are engaged from the planning to the implementation and the evaluation phases of a particular activity or project. Over the past few years municipalities have been faced with challenges of providing equitable public service

Page 40 of 236
delivery throughout the Country, and as such this led to protests over service delivery. What might have triggered these protests could originate from a variety of reasons ranging from misaligned local governing structures to the lack of public participation by the community members in decision making.
The Council of Matzikama Municipality adopted the ward committee system to meet the requirements of the Constitution of South Africa and the Local Government White Paper of 1998 in terms of public participation and Developmental Local Government respectively. Section 72 (1) of the Local Government: Municipal Structures Act, 1998: Act 117 of 1998 determines that in local government, the sphere of government closest to the people, ward committees can only be established within the metropolitan and local municipalities of a special type. These are the municipalities in category A as well as the category B (section 8 and 9 of the local Government: Municipal Structures Act, 1998: Act 117 of 1998). Furthermore, Section 72(3) of the same Act declares that the objective of the ward committees is the enhancement of participatory democracy in local government.
2.3.3.1 Ward committees
A ward committee should comprise the ward councillor, also the chairperson of the committee, and persons representing women, youth groups, sports and welfare, environment, education, community-based organizations, traditional leaders associations, employment agricultural associations and community safety forums. The committee, as per legislation, should not exceed 10 members excluding the chairperson or ward councillor. Only registered voters living in the particular ward are allowed to participate in that ward committee structure.
The ward committee policy of the Matzikama Municipality does not allow for members of the community involved in any form of crime or has been convicted of crime. Also, persons with municipal accounts in arrears without any prior arrangements are not allowed to participate as a ward committee member.
The representation below is a delineation of the ward committee system used by the Council of Matzikama Municipality to promote public participation and ultimately enhancing democracy and developmental government.

Page 41 of 236
Explicit in the representation above is the bottom-up approach adopted by the Council of Matzikama Municipality to ensure the involvement of the public in the day-to-day planning, development and management operations.
The four stages revealed in the representation above consist of:
Community sector representation: communities are allowed to take up representation in different community sectors and or geographic spaces in the areas where they live
Sector meetings: bi-monthly sector and or geographic spaces meetings are held with the ward committee member selected by the community of the sector or geographic space as the chairperson of the meeting. Communities are given the opportunity to discuss and prioritise issues related to needs and challenges in the sector and or geographic space for escalation to ward committee level
Ward committee meetings: bi-monthly meetings, following the sector or geographic space meetings, are taking place to discuss and prioritise issues and concerns that surfaced from sector and geographic space meetings for further escalation to either the Municipal Manager if no council decision is required or to council level in the event a decision at that level is required to attend to the issues raised
Council meetings: issues escalated to this level will either be ratified of rejected and communicated back to the community via the chairperson or ward councillor of the ward committee
2.3.3.2 IDP representative forum
Section 15 of the Local Government: Municipal Planning and Performance Regulations (No. 796, 24 August 2001) make provision for the establishment of a municipal wide structure for community participation. Regulation 796 obliges municipalities, in the absence of a municipal wide structure, to establish a forum that will enhance

Page 42 of 236
community participation in (i) the drafting and implementation of the municipality’s integrated development plan; and (ii) the monitoring, measurement and review of the municipality’s performance in relation to the key performance indicators and performance targets set by the municipality.
The Matzikama Municipality established an IDP Representative Forum to promote public participation and ultimately enhancing democracy.
The roles of the IDP Representative Forum of the Matzikama Municipality
Represent the interest of the Municipality’s constituency in the IDP process Provide an organizational mechanism for discussion, negotiation and decision
making between the stakeholders inclusive of municipal government Ensure communication between all stakeholder representatives inclusive of
municipal government Monitoring the performance of the planning and implementation process
Responsibilities of the IDP Representative Forum
Form a structural link between the Municipality and the public by informing interests groups, communities and organizations on relevant planning activities and their outcomes
Analyse and integrate issues affecting various sectors, determine priorities, strategies, projects and programmes and identify budget requirements
Discuss and comment on the draft IDP and Budget Monitor performance of the planning and implementation process through the
quarterly and mid-year performance reports and the annual report of the municipality
Composition of the IDP Representative Forum of the Matzikama Municipality
The table below reveals the different organizational stakeholders and their respective members who participate in the IDP Representative Forum.
Stakeholder Members No. of members Matzikama Municipality Directors
IDP/LED Manager IDP Official Public Participation Staff LED Officials
11
West Coast District Municipality
Strategic Manager Staff in the office of the Strategic Manager
3
Government Departments
Provincial Departments DLG DEADP DEDAT DoPW&T DCAS WCED DSD DoHS DoCS PT DoA DoH
National Departments SAPS STATSSA
19

Page 43 of 236
Stakeholder Members No. of members DRDLR DWA/LORWUA DoL DCS DoHA
Community Stakeholders Representatives of organized groups Advocates of un-organized groups Representatives of organized business Advocates of informal business Representatives of ward committees NGOs
20
Neighbouring Municipalities (ad hoc membershp)
Cederberg Municipality Kamiesberg Municipality (Northern Cape) Hantam Municipality (Northern Cape)
3
TOTAL 56
2.3.3.3 Local economic development forum
Everything that a municipality does should be done to impact as much as possible on the social development of an area. In particular, municipalities must be serious about their responsibility to provide services that meet the basic needs of the poor in their communities in a cost-effective and affordable manner. However, none of the above is achievable in the absence of a healthy local economy. It is evident that social development and other basic services in struggling local economies are of a mediocre nature.
Municipalities have great influence over local economic development and therefore need to work in partnership with local communities and local business to improve job creation and investment. Therefore, local government should play a pertinent role in the process of creating jobs by taking active steps to improve the conditions in the area for the creation of employment opportunities. When the municipality provides new basic household infrastructure such as water and sewage, contracts should preferably be given to local small businesses that will employ local people. Other programmes that could be initiated to alleviate poverty and enhance job creation are for example, the provision of support services, such as training to small businesses or community development organisations.
In light of the above the Matzikama Municipality created a LEDF to assist Council in the process of developing and growing the local economy of Matzikama Municipality.
The roles of the LEDF of Matzikama Municipality
Represent the interest of the Municipality in developing and growing the local economy
Provide an organizational mechanism for discussion, negotiation and decision making between the stakeholders inclusive of municipal government
Ensure communication between all stakeholder representatives inclusive of municipal government
Monitoring the performance of the planning and implementation process Make recommendations to Council on the development of the local economy
Responsibilities of the LEDF of Matzikama Municipality
Play a key role in the development of a local economic development strategy

Page 44 of 236
Form a structural link between the Municipality and the public by informing interests groups, communities and organizations on local economic development initiatives and their outcomes
Analyse and integrate issues affecting various economic sectors, determine priorities, strategies, projects and programmes and identify budget requirements
Discuss and comment on the draft LED strategy Monitor performance of the implementation process of the LED strategy
Composition of the LEDF of Matzikama Municipality
The concept LED framework makes provision for the following members to form part of the Municipality’s LEDF. The forum meets quarterly unless issues of an urgent nature must be addressed.
STAKEHOLDER MEMBER NO. OF MEMBERS
Matzikama Municipality
Municipal Manager Director Responsible for LED LED Manager LED Support Staff
6
West Coast District Municipality
Strategic Manager Support Staff 2
Government Departments
Provincial Government DEDAT DOA PT DLG DSD
National Government DTI EDD DRDLR DMR
10
Local Interest Groups
Organized Business (2) Informal Business (2) Commercial Farmers (2) Local Mining Companies (2) Small Scale Fishers (2) Civil Society (8, one per ward) Community Development Organizations (4)
22
TOTAL 40
2.3.4 IDP and Sector Plans
The sector plans form an integral part of the planning process of the IDP of the Matzikama Municipality. However, it should be noted that the IDP is not a sum of the sector plans mainly due to its nature which is strategic as oppose to the operational nature of the sector plans. Apart from the spatial development framework that forms the basis of the planning process there is one more sector plan, including the local economic development strategy that is transversal in nature, as it cuts across the development spectrum. It will have an elaborative section in the Matzikama IDP whilst other plans will be influenced by the IDP and form an integral part of the operational plans of departments.

Page 45 of 236
Due to the strategic nature of the IDP and the vast amount of sector and department plans; makes it almost impractical to elaborate and or incorporate all the plans. For this reason Departments must compare its plans strategically against Council’s strategy and consider it integrated if aligned with the IDP.
2.3.4.1 Spatial development framework
National Spatial Development Perspective
The NSDP provides a framework for deliberating the future development of the national space economy and recommends mechanisms to bring about optimum alignment between infrastructure investments and development programmes within localities. The NSDP is not a national development plan, nor does it predetermine what should happen where, when and how. Instead, it utilizes principles and notions of need and potential as a common backdrop against which investment and spending decisions should be considered and made. Important to note is that this is not a definitive measure, instead PGDSs and IDPs of municipalities will need to provide more rigorous assessments of potential by combining the NSDP’s initial interpretation with local knowledge and research.
The principles of the NSDP
In order to contribute to the broader growth and development policy objectives of government, the NSDP puts forward a set of five normative principles including:
Principle 1: Rapid economic growth that is sustained and inclusive is a pre-requisite for the achievement of other policy objectives, among which poverty alleviation is key.
Principle 2: Government has a constitutional obligation to provide basic services to all citizens (e.g. Water, energy, health and educational facilities)
Principle 3: Government spending in fixed investments should be focused on localities of economic growth and/or economic potential in order to gear up private-sector investment to stimulate sustainable economic activities and to create long-term employment opportunities.
Principle 4: Efforts to address past and current social inequalities should focus on people not places. In localities where there are both high level of poverty and demonstrated economic potential.
Principle 5: In order to overcome the spatial distortions of apartheid, future settlement and economic development opportunities should be channelled into activity corridors and nodes that are adjacent to or that link the main growth centres.
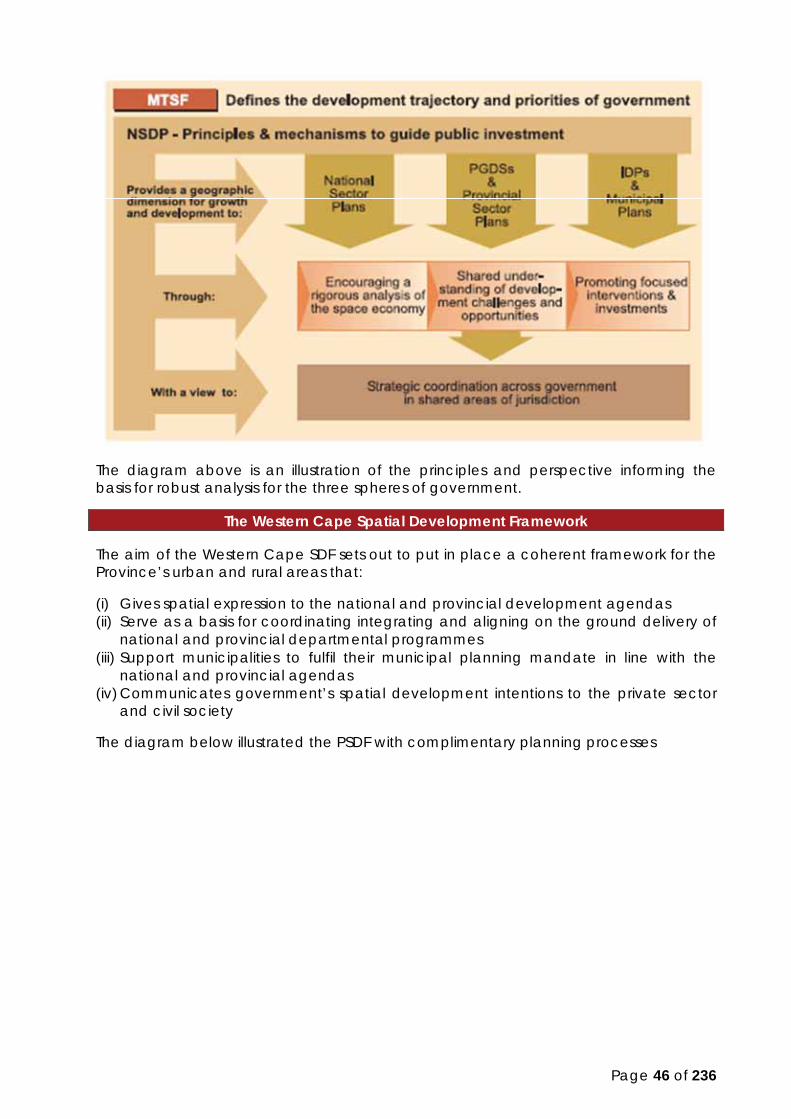
Page 46 of 236
The diagram above is an illustration of the principles and perspective informing the basis for robust analysis for the three spheres of government.
The Western Cape Spatial Development Framework
The aim of the Western Cape SDF sets out to put in place a coherent framework for the Province’s urban and rural areas that:
(i) Gives spatial expression to the national and provincial development agendas (ii) Serve as a basis for coordinating integrating and aligning on the ground delivery of
national and provincial departmental programmes (iii) Support municipalities to fulfil their municipal planning mandate in line with the
national and provincial agendas (iv) Communicates government’s spatial development intentions to the private sector
and civil society
The diagram below illustrated the PSDF with complimentary planning processes
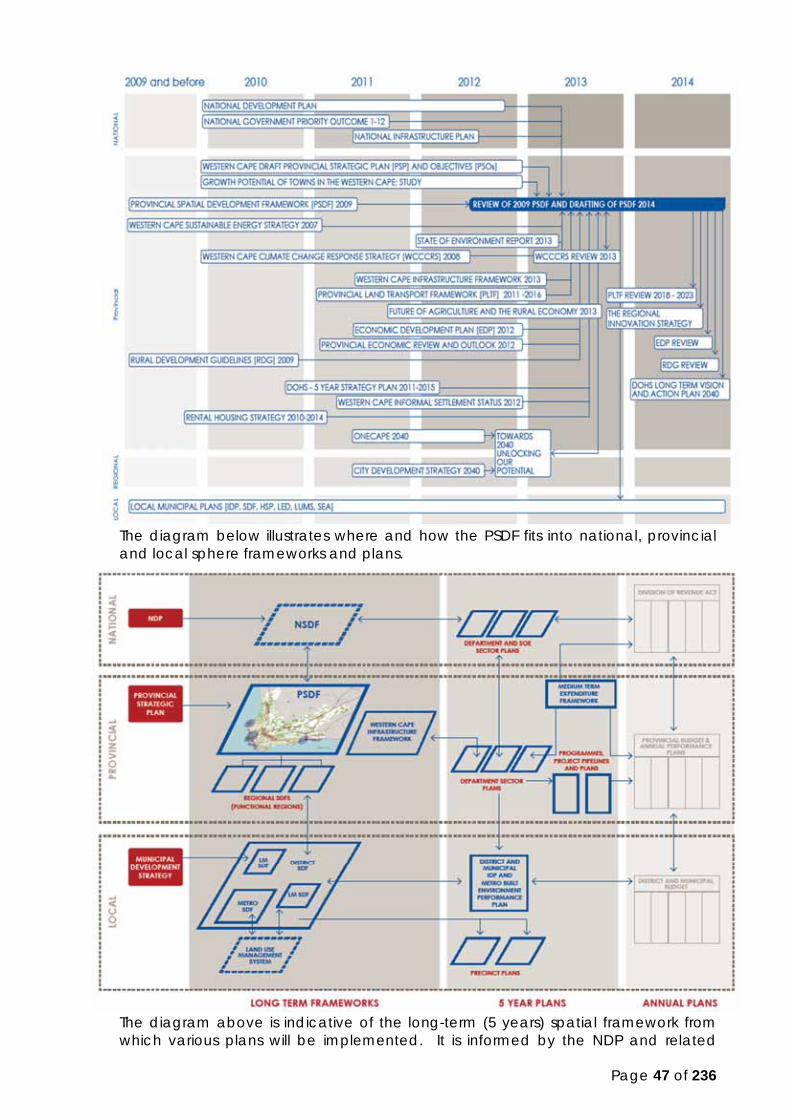
Page 47 of 236
The diagram below illustrates where and how the PSDF fits into national, provincial and local sphere frameworks and plans.
The diagram above is indicative of the long-term (5 years) spatial framework from which various plans will be implemented. It is informed by the NDP and related
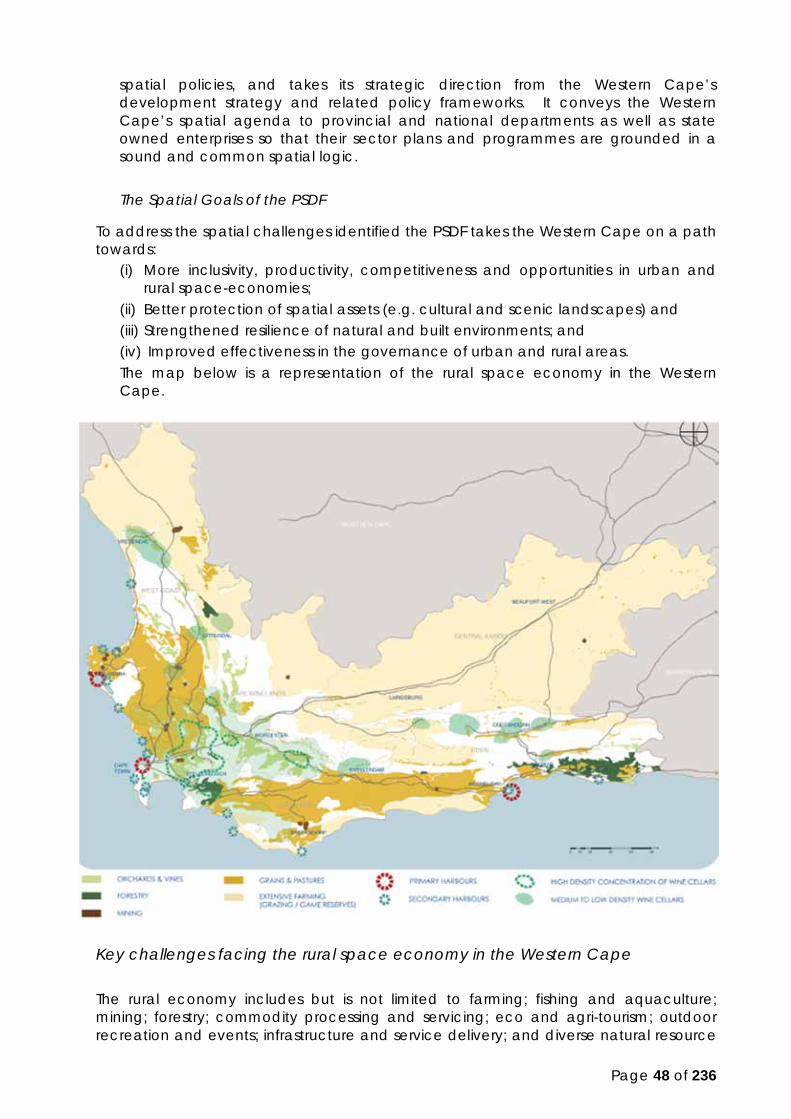
Page 48 of 236
spatial policies, and takes its strategic direction from the Western Cape’s development strategy and related policy frameworks. It conveys the Western Cape’s spatial agenda to provincial and national departments as well as state owned enterprises so that their sector plans and programmes are grounded in a sound and common spatial logic.
The Spatial Goals of the PSDF
To address the spatial challenges identified the PSDF takes the Western Cape on a path towards:
(i) More inclusivity, productivity, competitiveness and opportunities in urban and rural space-economies;
(ii) Better protection of spatial assets (e.g. cultural and scenic landscapes) and (iii) Strengthened resilience of natural and built environments; and (iv) Improved effectiveness in the governance of urban and rural areas. The map below is a representation of the rural space economy in the Western Cape.
Key challenges facing the rural space economy in the Western Cape The rural economy includes but is not limited to farming; fishing and aquaculture; mining; forestry; commodity processing and servicing; eco and agri-tourism; outdoor recreation and events; infrastructure and service delivery; and diverse natural resource

Page 49 of 236
related activities (e.g. extraction, rehabilitation, harvesting, etc.). Agriculture is going through a difficult transition period with its traditional export market in recession, escalating pressure on operating margins (i.e. input costs escalations exceed commodity price increases), more stringent international and national compliance requirements, and instability in the labour market.
Spatial Development Framework of the West Coast District Municipality The key overarching spatial issues in the WCDM can be summarised as follows: Settlement Pattern/Growth Potential North-South divide Low growth potential in rural areas Growing population creates increased pressure on infrastructure Growing human settlement backlogs Poorly defined economic linkages/corridors Lack of sufficient water supply to sustain economic growth Underutilised Saldanha Bay Harbour Degradation of critical biodiversity areas Diminishing agricultural sector Lack of appropriate economic land reform The WCDM adopted the generic spatial principles combined with international best practice, as the overarching spatial principles for the West Coast District SDF. These are summarised as follows: The public good should prevail over private interests; All residents should have equal protection and benefits and no unfair discrimination
be allowed; Work harmoniously with nature and restrict the ecological footprint of human
activities and urban areas; Adopt a precautionary approach to the use of resources, switch to sustainable
patterns of resource use and mitigate negative development impacts; Encourage local, national and international connectivity; Improve urban efficiency by aligning planned growth with infrastructure provision; Offer maximum access to the district’s resources and amenities; Be responsive to the basic needs of communities; Create safe, high-quality living environments with a vibrant mix of land uses; Promote cross-sector planning (spatial, environmental and economic, etc.)
Objectives of the WCDM SDF The following objectives are the backbone for development in the West Coast District: Ensuring environmental integrity for the West Coast District Pursuing economic growth and facilitation of jobs opportunities Promoting social wellbeing of the community Providing essential bulk services in the region Ensuring good governance and financial viability The SDF of the WCDM has three overarching spatial goals that reflect the direction of spatial growth and management in the district. These goals are further based on the key spatial issues that were identified from the status quo assessment.

Page 50 of 236
Goal 1 Enhance the capacity and quality of infrastructure in the areas with the highest economic growth potential, while ensuring continued provision of sustainable basic services to all residents in the District. Goal 2 To facilitate and create an enabling environment for employment, economic growth and tourism development, while promoting access to public amenities such as education and health facilities. Goal 3 Enhance and protect the key biodiversity and agricultural assets in the district and plan to minimise the human footprint on nature, while also mitigating the potential impact of nature (climate change) on the residents of the district.
Spatial Development Framework of Matzikama Municipality Please, read this section in conjunction with the SDF of Matzikama Municipality. The SDF of the Matzikama, approved 26 June 2014, focuses on spatial and land use planning matters within the area of jurisdiction of the Matzikama, addressing spatial planning categories, urban growth and hierarchy of towns within the municipality. The Matzikama Municipality’s SDF is one of the Sector Plans of the Integrated Development Plan (IDP). According to the Municipal Systems Act (MSA) 2000 (Act 32 of 2000), the purpose of an SDF is to provide general direction to guide spatial decision making on an on-going basis. The SDF is an important policy instrument as it forms the base document to guide land use and development of the Municipality toward a sustainable opportunity-rich-future. Strategies, projects and development plans in the Integrated Development Plan of the Matzikama Municipality (IDP) are initially informed by the SDF before any other sector plans are considered in development processes. However, recent developments are indicative of the shortcomings in the SDF for the municipal area and include the following:
Provide no guidance to mining activities, renewable energies (includes wind and solar farms) and green economics;
Lack guidance on architectural guidelines and development of specific focus areas and further small scale structure plans;
No guidance on time frames in terms of the long term spatial vision; Partial alignment between the SDF and other sector plans such as the LED
strategy is a concern; The SDF is aligned with the principles of the IDP and growth points that are identified within the municipal area to enable sustainable spatial land use planning. Matzikama municipal area experienced significant growth over the last 15 to 20 years in terms of its population and land area. In more recent years and months the municipal area experienced unprecedented change; its land area almost doubled between the years 2000 to 2011; the land area increased from about 7000 km2 to 12 900 km2 following the inclusion of the previously DMA. The population increased in the last 15 to 20 years from 40000 to more than 70000. Despite being a sparsely populated area (approximately, 0.22km2 per person) the unprecedented change in the land area attributed to pressures on engineering services (such as water resources, waste management sites, roads and environmental management) and other negative
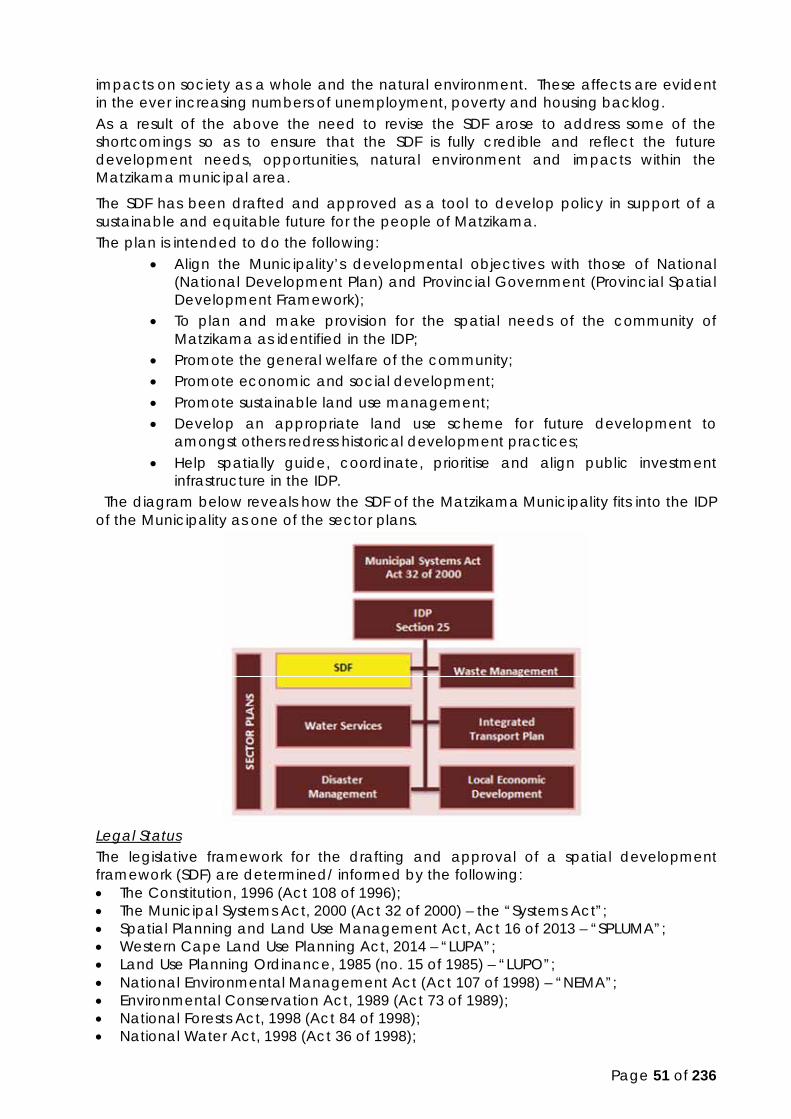
Page 51 of 236
impacts on society as a whole and the natural environment. These affects are evident in the ever increasing numbers of unemployment, poverty and housing backlog. As a result of the above the need to revise the SDF arose to address some of the shortcomings so as to ensure that the SDF is fully credible and reflect the future development needs, opportunities, natural environment and impacts within the Matzikama municipal area.
The SDF has been drafted and approved as a tool to develop policy in support of a sustainable and equitable future for the people of Matzikama. The plan is intended to do the following:
Align the Municipality’s developmental objectives with those of National (National Development Plan) and Provincial Government (Provincial Spatial Development Framework);
To plan and make provision for the spatial needs of the community of Matzikama as identified in the IDP;
Promote the general welfare of the community; Promote economic and social development; Promote sustainable land use management; Develop an appropriate land use scheme for future development to
amongst others redress historical development practices; Help spatially guide, coordinate, prioritise and align public investment
infrastructure in the IDP. The diagram below reveals how the SDF of the Matzikama Municipality fits into the IDP of the Municipality as one of the sector plans.
Legal Status The legislative framework for the drafting and approval of a spatial development framework (SDF) are determined/ informed by the following: The Constitution, 1996 (Act 108 of 1996); The Municipal Systems Act, 2000 (Act 32 of 2000) – the “Systems Act”; Spatial Planning and Land Use Management Act, Act 16 of 2013 – “SPLUMA”; Western Cape Land Use Planning Act, 2014 – “LUPA”; Land Use Planning Ordinance, 1985 (no. 15 of 1985) – “LUPO”; National Environmental Management Act (Act 107 of 1998) – “NEMA”; Environmental Conservation Act, 1989 (Act 73 of 1989); National Forests Act, 1998 (Act 84 of 1998); National Water Act, 1998 (Act 36 of 1998);

Page 52 of 236
Mountain Catchment Areas Act, 1970 (Act 63 of 1983); Conservation of Agricultural Resources Act, 1983 (Act 43 of 1983); The subdivision of Agricultural Land Act (Act 70 of 1970); National Heritage Resources Act, Act 25 of 1999.
The following legislation is considered as the most current and applicable legislation for the review of the Matzikama Municipality’s SDF process: Municipal Systems Act, 2000 (Act 32 of 2000); Land Use Planning Ordinance, 1985 (Ordinance 15 of 1985) – “LUPO”; Spatial Planning and Land Use Management Act, Act 16 of 2013 – “SPLUMA”; Western Cape Land Use Planning Act, 2014 – “LUPA”; National Environmental Management Act (Act 107 of 1998) – “NEMA”
According to section 21 of the SPLUMA, (Act 16 of 2013) a municipal SDF must: a) Give effect to the development framework principles and applicable norms and
standards, b) Include a written and spatial representation of a five-year spatial development plan
for the spatial form of the municipality, c) Include a longer term spatial development vision statement for the municipal area
which indicates a desired spatial growth and development pattern for the next 10 to 20 years,
d) Identify current and future significant structuring and restructuring elements of the spatial form of the municipality, including development corridors, activity spines and economic nodes where public and private investment will be prioritised and facilitated,
e) Include population growth estimates for the next five years, f) Include estimates of the demand for housing units across different socio-economic
categories and the planned location and density of future housing developments, g) Include estimates of economic activity and employment trends and locations in
the municipal area for the next five years, h) Identify, quantify and provide location requirements of engineering infrastructure
and services provision for existing and future development needs for the next five years,
i) Identify the designated areas where a national or provincial inclusionary housing policy may be applicable,
j) Include a strategic assessment of the environmental pressures and opportunities within the municipal area, including the spatial location of environmental sensitivities, high potential agricultural land and coastal access strips, where applicable,
k) Identify the designation of areas in the municipality where incremental upgrading approaches to development and regulation will be applicable,
l) Identify the designation of areas in which- (i) more detailed local plans must be developed, and (ii) shortened land use development procedures may be applicable and
land use schemes may be so amended, m) Provide the spatial expression of the coordination, alignment and integration of
sectoral policies of all municipal departments, n) Determine a capital expenditure framework for municipality’s development
programmes, depicted spatially,
Page 53 of 236
o) Determine the purpose, desired impact and structure of the land use management scheme to apply in that municipal area,
p) Include an implementation plan comprising of- (i) Sectoral requirements, including budgets and resources for
implementation, (ii) Necessary amendments to a land use scheme, (iii) Specification of institutional arrangements necessary for implementation. (iv) Specification of implementation targets, including dates and monitoring
indicators, and (v) Specification, where necessary, of any arrangements for partnerships in
the implementation process.”
Section 10(2) of the Western Cape LUPA (Act 3 of 2014) states that a municipal SDF must at least Comply with other applicable legislation, Promote predictability in the utilisation of land, Address development priorities, Where relevant, provide for specific spatial focus areas, including towns, other
nodes, sensitive areas, or areas experiencing specific development pressure, Consist of a report and maps covering the whole municipal area, reflecting
municipal planning and the following structuring elements: − Transport routes, − Open space systems, − proposed major projects of organs of state with substantial spatial implications, − Outer limits to lateral expansion, and − Densification of urban areas.”

Page 54 of 236
The map below represents a synthesis of the socio-economic and built environment of Matzikama Municipality.
The municipality appears to have experienced an unusual demographic trend with its population declining from 50 000 (2001) to 46 000 (2007) and then increasing to 71 500 (2016 community survey)
2.3.4.2 Local economic development strategy
In setting out this economic development strategy a number of questions were posed about what needs to be achieved to improve the lives of the people of Matzikama. In general terms, the answers are quite clear: reduce the levels of unemployment, poverty and inequality through a combination of public and private sector initiatives and also mobilise the resources in civil society. Spelling this out in specific terms, however, is much more daunting for it involves transforming the economy and institutions of Matzikama and identifying the right approach to effect social, political and economic change.
Growth is certainly what is needed to reduce unemployment and poverty but Matzikama is not likely to advance to a sustainable growth path if policies and institutions do not show a commitment to also reducing inequality and bridging the racial divide. The World Bank cites evidence to show that growth depends on education and life expectancy, particularly for those at lower income levels. High levels of unemployment accompanied by entrenched poverty and inequality can erode the gains made by growth. Growth, however, should not be seen as synonymous with poverty alleviation even though it is often correlated with a reduction of poverty. The

Page 55 of 236
literature on development is replete with studies of countries that achieve high rates of growth only to flounder because poverty and inequality were not tackled comprehensively. The preference therefore is for a set of prescriptions that cover job creation, poverty reduction and a reduction in inequality in one comprehensive strategy rather than as separate targets that have to be achieved independently of one another.
We recognise that there are development issues that will require short and long term solutions and that the strategy ought to reflect this. Reducing vulnerability of the poor to disasters or other crises, for example, is a relatively short term goal while the development of skills can take much longer. It is essential that resources are allocated in a way that take cognizance of these variable time frames for achieving particular development goals.
One of the aims of the strategy is to achieve a higher level of integration of sectors where possible and greater coordination between government, business and community organisations. The findings of our research showed a need for integration and coordination within and between industries and sectors if economic gains are to be realised. The experience of other countries show that spin-offs from such an arrangement of industries include new product development, an expanding pool of skills and the creation of jobs. The strategy therefore emphasises the formation of forums that will, among other things, discuss the creation of clusters in various industries.
Associated with the issue of coordination is that of the linkage between the formal and informal sectors of the economy. At worst this linkage is non-existent and at best it is tenuous, yet there are several reasons for advocating that it be made an essential part of future planning and business strategy: one is that the informal sector can be a valuable supplier of inputs for the formal sector or an outlet for end user products; secondly, it will impose the discipline of the market on emerging small enterprises; thirdly, it will gradually bring the informal sector into the revenue net and thereby expand the tax base; fourthly, the perceived potential for success could motivate previously disadvantaged youth to look at starting a small business as an alternative to other careers; lastly, it will serve as a means of identifying any lack of skills that constrain the formation of small businesses in previously disadvantaged communities.
Another important objective of the strategy is the plugging of leakages that occur in many of its poor communities. This is directly related to the spatial separation of communities from areas of economic activity and is inextricably tied to the formation of skills and small businesses as well as to the provision of finance. Assistance to the informal sector can make a major contribution to plugging the leaks in the short term but ultimately this can only be dealt with through a well-functioning system of retail trade and an associated supply chain that is owned and operated by local residents.
The rather specialized economy of Matzikama is also in need of diversification (allowing new sectors to come into being) and the expansion of existing sectors. Local economies of non-metropolitan areas are often more vulnerable than those of metropolitan centres mainly because of their total dependence on one or two sectors. Diversification not only reduces vulnerability but stimulates the formation of a range of skills that improves the prospects for investment and, hence, growth.
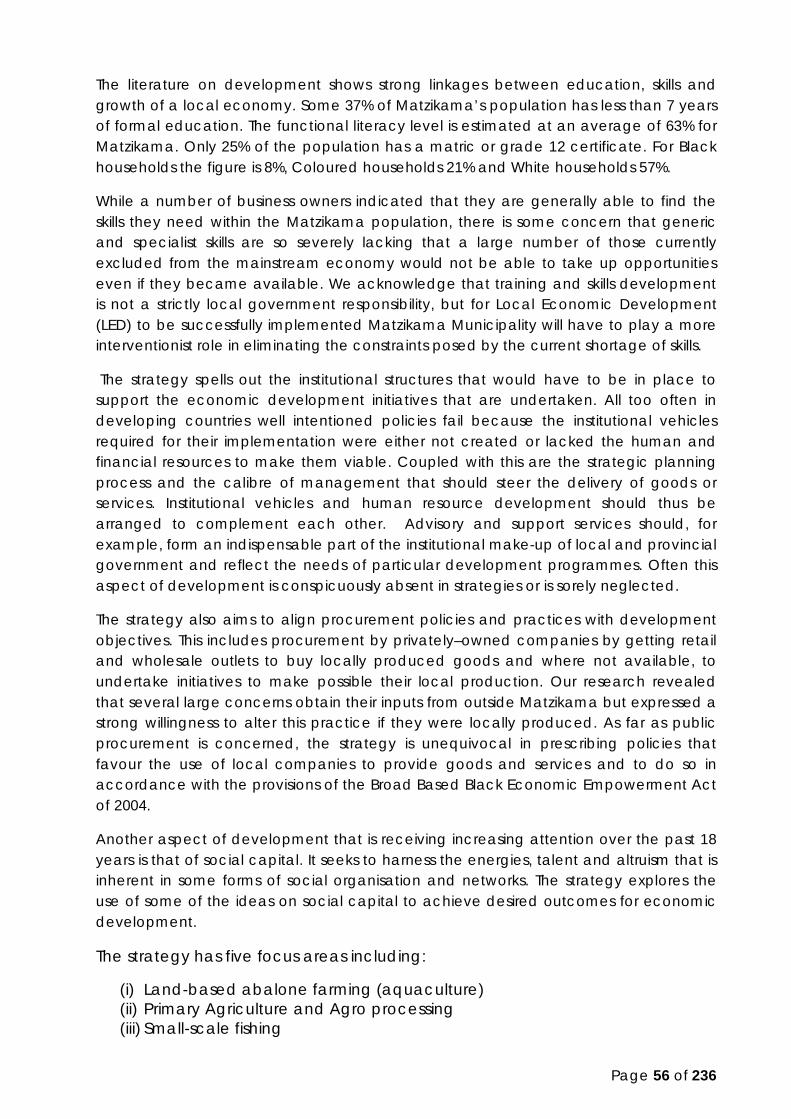
Page 56 of 236
The literature on development shows strong linkages between education, skills and growth of a local economy. Some 37% of Matzikama’s population has less than 7 years of formal education. The functional literacy level is estimated at an average of 63% for Matzikama. Only 25% of the population has a matric or grade 12 certificate. For Black households the figure is 8%, Coloured households 21% and White households 57%.
While a number of business owners indicated that they are generally able to find the skills they need within the Matzikama population, there is some concern that generic and specialist skills are so severely lacking that a large number of those currently excluded from the mainstream economy would not be able to take up opportunities even if they became available. We acknowledge that training and skills development is not a strictly local government responsibility, but for Local Economic Development (LED) to be successfully implemented Matzikama Municipality will have to play a more interventionist role in eliminating the constraints posed by the current shortage of skills.
The strategy spells out the institutional structures that would have to be in place to support the economic development initiatives that are undertaken. All too often in developing countries well intentioned policies fail because the institutional vehicles required for their implementation were either not created or lacked the human and financial resources to make them viable. Coupled with this are the strategic planning process and the calibre of management that should steer the delivery of goods or services. Institutional vehicles and human resource development should thus be arranged to complement each other. Advisory and support services should, for example, form an indispensable part of the institutional make-up of local and provincial government and reflect the needs of particular development programmes. Often this aspect of development is conspicuously absent in strategies or is sorely neglected.
The strategy also aims to align procurement policies and practices with development objectives. This includes procurement by privately–owned companies by getting retail and wholesale outlets to buy locally produced goods and where not available, to undertake initiatives to make possible their local production. Our research revealed that several large concerns obtain their inputs from outside Matzikama but expressed a strong willingness to alter this practice if they were locally produced. As far as public procurement is concerned, the strategy is unequivocal in prescribing policies that favour the use of local companies to provide goods and services and to do so in accordance with the provisions of the Broad Based Black Economic Empowerment Act of 2004.
Another aspect of development that is receiving increasing attention over the past 18 years is that of social capital. It seeks to harness the energies, talent and altruism that is inherent in some forms of social organisation and networks. The strategy explores the use of some of the ideas on social capital to achieve desired outcomes for economic development.
The strategy has five focus areas including:
(i) Land-based abalone farming (aquaculture) (ii) Primary Agriculture and Agro processing (iii) Small-scale fishing

Page 57 of 236
(iv)Tourism (v) Green economy
2.3.4.3 Revenue enhancement strategy
The Municipality lacks a revenue enhancement strategy despite it being an important instrument for financial survival of the Municipality. The Municipality, with the help of the Provincial Department of Local Government, is currently in a process that assesses the revenue streams of the Municipality with the intent to develop a strategy to either enhance or supplement existing sources of income. The revenue enhancement strategy will form part of the IDP before final adoption at the end of May 2017.
2.3.4.4 Infrastructure development plan
The Municipality has an infrastructure development plan that focus mainly on essential infrastructure and maintenance of existing infrastructure. The same plan is used when MIG funding is applied for. A comprehensive infrastructure plan based on the development needs of the Municipality is required if Council wants to address the critical development challenges faced by the Municipality and its Communities.
2.3.4.5 Disaster management plan
Disaster Management Plan
Matzikama Municipality adopted the Disaster Management Plan in June 2007. This plan confirms the arrangements for managing disaster risk and for preparing for- and responding to disasters within the Matzikama Municipality as required by the Disaster Management Act. No further processes were done in able to review the Plan because of a lack of funds. As soon as the municipality can find the necessary funds the municipality will start the review process.
Legal Framework
The Matzikama Municipality is legally obliged to prepare a disaster management plan for its area according to the circumstances prevailing in the area; to co-ordinate and align the implementation of its plan with those of other organs of state and institutional role players; and to regularly review and update its plan. The municipality must also consult the local community on the preparation or amendment of its plan.
The Legislation that regulates Disaster Management in South Africa:
Section 53(1)(a) of the Disaster Management Act, 2002 (Act 57 of 2002)
Section 53(2)(a) of the Disaster Management Act, 2002 (Act 57 of 2002)
Section 26(g) of the Local Government: Municipal Systems Act, 2000 (Act 32 of 2000)
The Key Outcomes of the Disaster Management Plan is as follows: Integration of Disaster Risk Management into the strategic and operational
planning and project implementation of all line functions and role players within the municipality.

Page 58 of 236
Resilient communities
An integrated, fast and efficient response to emergencies and disasters by all role players.
Linkage with the Integrated Development Plan of the Matzikama Local Municipality
Both the Municipal Systems Act and the Disaster Management Act requires the inclusion of this plan into the Integrated Development Plan (IDP) of the Matzikama Municipality. Disaster Management should also be integrated into the IDP Risk Management.
Linkage with the Disaster Management Framework of the West Coast District Municipality
The Matzikama Local Municipality must prepare and execute its disaster management plan within the disaster management framework of the West Coast District Municipality.
Structure of the plan
The Municipal Disaster management Plan of the Matzikama Local Municipality consists of the components as indicated in the figure below.
Corporate Disaster Risk Management Structure for the Matzikama Municipality
The Corporate Disaster Risk Management structure for the Matzikama municipality must deal with both pro-active and reactive disaster management issues and encompasses more than the department which is responsible for the function. The figure below illustrates the components of the Corporate Disaster Management Structure.

Page 59 of 236
Risk assessment
The following disaster risks were identified in Matzikama Municipality during a risk assessment process conducted in 2006:
Priority risks
Fire Drought Severe Weather (Storms, Wind, Rain) Hazardous Materials Incidents (especially road accidents) Communicable diseases/Health
Risk Reduction Plans
Risk reduction plans providing for prevention and mitigation strategies have been compiled through a participative process and have not been vetted or submitted to feasibility studies.
Possible risk reduction projects have been identified through analysis of information collected during consultation with the West Coast District Municipality, Bergrivier Local Municipality, Matzikama Local Municipality, Saldanha Bay Municipality, Swartland Municipality and the West Coast District Management Area.
The following disaster risks for Matzikama Municipal area were identified:
Drought Disaster Risk Reduction
Health Disaster Risk Reduction
Severe weather Disaster Risk Reduction
Hazardous Materials Disaster Risk Reduction
Fire Disaster Risk Reduction

Page 60 of 236
Disaster Preparedness Plan
The purpose of this plan is to ensure a high level of disaster preparedness within the West Coast District Municipality and more specifically within the Matzikama Local Municipality.
This plan will focus on the activities falling within the sphere of responsibility of the Municipality in preparing for and responding to a disaster within the area of responsibility of the Municipality.
2.3.4.6 Integrated waste management plan
The Integrated Waste Management Plan (IWMP) of the Matzikama Municipality has been formulated to address the challenge of waste management in the Matzikama area, home to more than 70000 people. The Plan was born out of the requirements of the National Waste Management Strategy and formed the first action plan in terms of this strategy. The first IWMP was drafted in March 2006 and the current plan was drafted in July 2010 and updated annually.
The Municipality, with private sector financial support, was able to build a mini materials recovery facility near the dumping site in Vredendal-North. DEA provided two wheelie bins per household (black and green) to all households in Vredendal in support of the Municipality’s recycling program. The Municipality was not able to commence the programme as a result of a lack of infrastructure to collect the waste separately at household level.
The Municipality is much closer to commence recycling at source; the only outstanding infrastructure is at least two trucks to collect recyclables separately from non-recyclable waste. Other infrastructure already in place includes:
− A weigh bridge with a capacity of 30 tonnes has been built by the operator at his cost
− A mini materials recovery facility able to handle cardboard, paper, glass, plastic and metal cans
− Two wheelie bins per household (Vredendal only) − An operator (service provider, The Recycle Bin) has already been appointed
2.3.4.7 Water services development plan
The WSDP was approved in June 2016. The Water Services Development Plan (WSDP) is in the process of being reviewed and will be completed by June 2017.
This WSDP is for the 2016/2017 financial year and is an update of Matzikama Municipality’s 2015/2016 WSDP. The WSDP is aligned and integrated with the 2017/2022 IDP of Matzikama Municipality and forms an integral part of the IDP public participation and consultation processes.
Part of the WSDP is to identify strategies that need to be developed to address the information shortfalls and other constraints, which impact on service delivery. The WSDP is revised regularly
Critical developments and associated factors that has an impact on our area: Urban versus Rural Backlogs Reliance on Water Resources Available and Bulk Infrastructure Links between Water Supply and Sanitation Limited Implementation and Operating Capacity in some Municipalities Available funding

Page 61 of 236
Affordability of Service Levels (Operation and Maintenance Costs) Growing Backlog in Refurbishment of Existing Infrastructure Major Economic Development Associated Population Growth and Water Demand
2.3.5 Municipal Basic Services
This section provides the status quo in terms of the quality and quantity of basic services provided by the Matzikama Municipality.
2.3.5.1 Electricity
The table below is indicative of the number of households with access to electricity.
Source: Socio Economic Profile 2016, Matzikama Municipality
The biggest source of energy for lighting purposes in Matzikama in 2016 is electricity with 20 232 households (97.2 %) having access to this energy source compared to 16 713 (88.7%) in 2011. This equates to a significant increase of 21.1% in the number of households that enjoy access to electricity between 2011 and 2016. A total of 2.8% of households (588) in 2016 however still make use of other sources of energy i.e. sources which they do not pay for, generators, solar home systems, battery and no access to electricity.
The percentage change in the number of households that enjoy access to electricity for lighting purposes throughout the District has been equally impressive, increasing by 21.2 % from 106 781 in 2011 to 122 205 in 2016.
The table below gives an overview of the number of households in the Matzikama Municipality that have access to electricity.
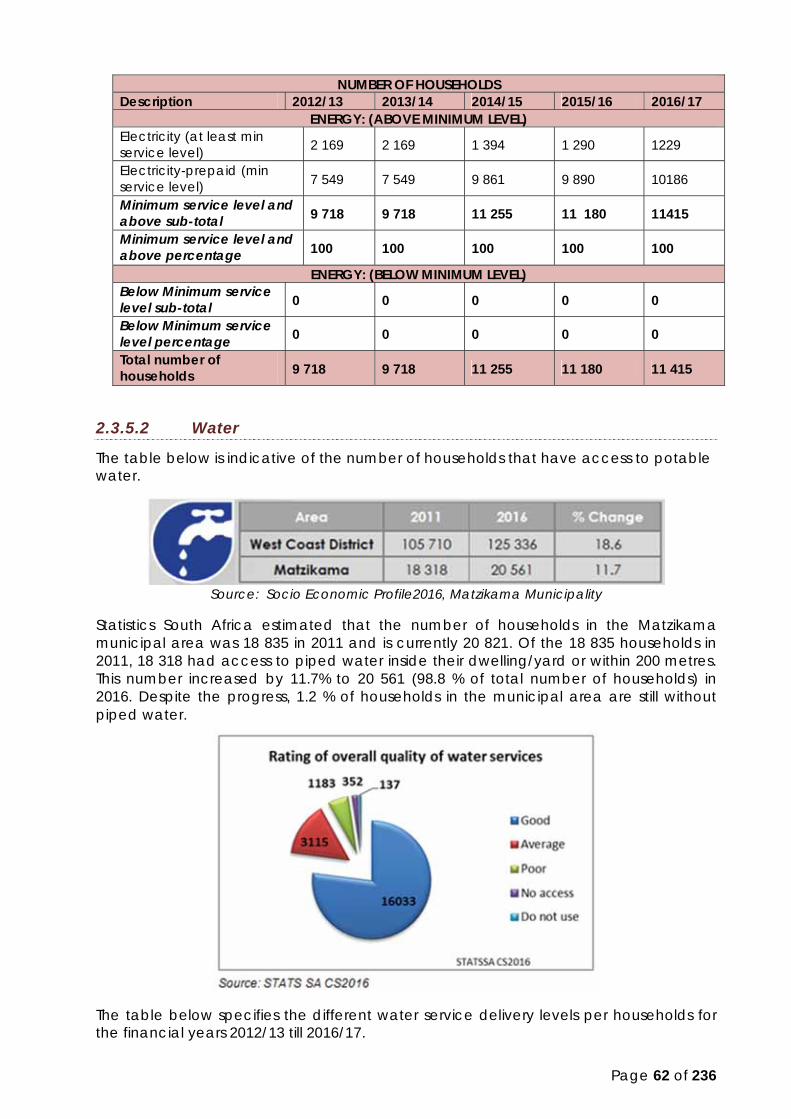
Page 62 of 236
NUMBER OF HOUSEHOLDS Description 2012/13 2013/14 2014/15 2015/16 2016/17
ENERGY: (ABOVE MINIMUM LEVEL) Electricity (at least min service level) 2 169 2 169 1 394 1 290 1229
Electricity-prepaid (min service level) 7 549 7 549 9 861 9 890 10186
Minimum service level and above sub-total 9 718 9 718 11 255 11 180 11415
Minimum service level and above percentage 100 100 100 100 100
ENERGY: (BELOW MINIMUM LEVEL) Below Minimum service level sub-total 0 0 0 0 0
Below Minimum service level percentage 0 0 0 0 0
Total number of households 9 718 9 718 11 255 11 180 11 415
2.3.5.2 Water
The table below is indicative of the number of households that have access to potable water.
Source: Socio Economic Profile2016, Matzikama Municipality
Statistics South Africa estimated that the number of households in the Matzikama municipal area was 18 835 in 2011 and is currently 20 821. Of the 18 835 households in 2011, 18 318 had access to piped water inside their dwelling/yard or within 200 metres. This number increased by 11.7% to 20 561 (98.8 % of total number of households) in 2016. Despite the progress, 1.2 % of households in the municipal area are still without piped water.
The table below specifies the different water service delivery levels per households for the financial years 2012/13 till 2016/17.

Page 63 of 236
NUMBER OF HOUSEHOLDS
Description 2011/12 2012/13 2013/14 2014/15 2015/16
WATER: (ABOVE MINIMUM LEVEL) Piped (tap) water inside dwelling/institution
9 083 13 871 13 886 14 236 14 593
Piped (tap) water inside yard incl 1 959 3 301 3 301 3 301 Piped (tap) water on community stand: distance less than 200m from dwelling/institution
incl 1 102 1 451 1 451 1 451
Sub-Total: Minimum Service Level and Above
9 083 16 932 18 638 18 988 19 345
WATER: (BELOW MIN LEVEL) Piped (tap) water on community stand: distance between 200m and 500m from dwelling/institution
6 849 0 61 61 61
Piped (tap) water on community stand: distance between 500m and 1000m (1km) from dwelling /institution
incl 0 15 15 15
Piped (tap) water on community stand: distance greater than 1000m (1km) from dwelling/institution
incl 0 3 3 3
No access to piped (tap) water incl 815 798 798 798 Sub-Total: Below Minimum Service Level
6 849 815 877 877 877
Total number of households 15 932 17 747 19 515 19 865 20 222 Source: Matzikama Water Services Delivery Plan
0.0%10.0%20.0%30.0%40.0%50.0%60.0%70.0%80.0%90.0%
HH's with access topiped water
HH's with access tocommunal water
points*
HH's below minimumservice level
Access to water
2015/2016
2014/2015
2013/2014
2012/2013
2011/2012

Page 64 of 236
2.3.5.3 Sewage
The table below is indicative of the number of households that have access to flush toilets.
Source: Socio Economic Profile 2016, Matzikama Municipality
There has been a significant improvement in access to sanitation within the Matzikama region between 2011 and 2016. The percentage of households with access to a flush toilet connected to sewage system/chemical toilet improved from 70.3% in 2011 to 95.2% in 2016 reflecting an increase in access of 6 584 households. Matzikama’s access level in 2016 (95.2%) was therefore higher than that of the broader West Coast District with 92.5 %.)
A total of 999 households (4.8% of total households) within Matzikama in 2016 still have to make use of other sanitation services i.e. to toilet facilities other than flushed and chemical (i.e. pit latrine, ecological toilets, bucket toilets or none).
The table below gives an overview of the number of households that have access to sanitation services in the municipal area.
NUMBER OF HOUSEHOLDS
Description 2011/12 2012/13 2013/14 2014/15 2015/16
SANITATION (ABOVE MIN LEVEL)
Flush toilet (connected to sewerage system)
11545 9 888 9 741 9 999 10 262
Flush toilet (with septic tank) incl 4 612 3 486 3 578 3 672 Chemical toilet incl 0 46 46 46 Pit toilet with ventilation (VIP) and UDS
incl 339 630 630 630
Other / Communal Services incl 0 1 113 1 113 1 113 Sub-Total: Minimum Service Level and Above
11545 14 839 15 016 15 366 15 723
SANITATION (BELOW MIN LEVEL) Pit toilet without ventilation incl 374 110 110 110 Bucket toilet incl 380 268 268 268 Other toilet provision (below min. service level
incl 647 2 745 2 745 2 745
No toilet provisions 2909 1 508 1 376 1 376 1 376 Sub-Total: Below Minimum Service Level
2909 2 909 4 499 4 499 4 499
Total number of households 14454 17 748 19 515 19 865 20 222 Source: Matzikama Water Services Delivery Plan

Page 65 of 236
Source: Matzikama Water Services Delivery Plan
2.3.5.4 Storm water and roads
The following tables give an overview of gravel and surfaced roads infrastructure within the municipal area.
Gravel Roads infrastructure: Kilometres
Year Total gravel roads
New gravel roads
constructed
Gravel roads upgraded to tar
(paving)
Gravel roads graded/maintained
2011/12 28.7 0 2.4 28.7 2012/13 26.3 0 1.8 26.3 2013/14 26.3 0 5.13 26.3 2014/15 26.3 0 0 26.3 2015/16 26.3 0 0 26.3
Tarred Roads infrastructure: Kilometres
Year Total tarred roads
New tar roads constructed
Existing tar roads re-
tarred
Existing tar roads re-sheeted
Tarred roads maintained
2011/12 113.6 2.365 (paved) 0 0 42 2012/13 118 1.8 (paved) 0 0 45 2013/14 118 5.13 (paved) 0 0 42 2014/15 118 0 1 0 36 2015/16 118 0 1 1 42
The average road network within the municipal area can be rated as fair to poor. To restore the existing condition of the roads, the Municipality will have to budget extensively over the next few years. Routine maintenance, for example patching of potholes, replacement of curbs and cleaning of storm water networks, is done by the maintenance team of the municipality. Gravel roads are graded on a monthly basis to ensure that they are in a fairly good condition.
The priorities for the municipality are to maintain existing tarred roads by means of re-sealing and to construct new paved roads (upgrading of existing gravel roads) that include storm water systems. A technical report for the upgrading of gravel roads and
0%10%20%30%40%50%60%70%80%90%
HH's with access toflush toilets
HH's with access to on-site toilets (above min.
service level)
HH's below minimumservice level
Access to sanitation
2011/2012
2012/2013
2013/2014
2014/2015
2015/2016

Page 66 of 236
storm water systems was completed to give the municipality an overall perspective of the cost to upgrade all the gravel roads to paved roads with storm water systems. This document will be used to apply for Municipal Infrastructure Grant (MIG) funds and to explore for other services of funding.
Storm water Master Plans need to be developed for all the towns within the municipal area as informal settlements were allocated to areas where there is storm water drainage.
The municipality are faced with challenges like limited funding to reseal existing roads and additional funding to develop a Storm water Master Plan.
There are currently 26.3 kilometres of gravel roads, 118 kilometres of tarred roads and 25 kilometres of storm water channels in the municipal area
2.3.5.5 Waste management
The table below is indicative of the number of households that have access to refuse removal services.
Source: Socio Economic Profile 2016, Matzikama Municipality
There has been a significant increase in the number of households receiving refuse removal services between 2011 and 2016. Eighteen thousand four hundred and sixty four (18 464) households currently (2016) receive refuse removal services, compared to 12 780 in 2011 which equates to a 44.5 % increase.
Despite this progress, only 88.7 % of the total number of households in Matzikama currently has their refuse removed at least once a week. This is however quite higher than the District’s 83.4 %.
It is of concern to note that 10.4% of households (2165 households) in Matzikama still currently have to make use of communal/own refuse dumps or alternatively dump or leave rubbish anywhere. A further 0.9% of households do receive refuse removal services by the local authority, albeit not once a week. (SEPLG 2016)
Very little investment is going into waste management with only 1% of total capital expenditure in 2014/15 rising to 7% in 2015/16 then dropping to a projected 1% in 2018/19, this may be evident of the fact that demand for waste management services are low, especially in urban areas whereas in rural areas a large amount of waste is managed by the household. (MERO2016)

Page 67 of 236
The table below gives an overview of the number of households that have access to the solid waste services delivered by the municipality.
Number of households Description 2012/13 2013/14 2014/15 2015/16 2016/17
Solid Waste Removal: (above minimum level) Removed at least once a week 9 953 10 289 10 282 11 492 11 848 Minimum service level and above sub-total 9 953 10 289 10 282 11 492 11 848
Minimum service level and above percentage 100 100 100 100 100
Solid Waste Removal: (below minimum level) Removed less frequently than once a week 0 0 0 0 0
Using communal refuse dump 0 0 0 0 0 Using own refuse dump 0 0 0 0 0 Other rubbish disposal 0 0 0 0 0 No rubbish disposal 0 0 0 0 0 Minimum service level and above sub-total 0 0 0 0 0
Minimum service level and above percentage 0 0 0 0 0
Total number of households 9 953 10 289 10 282 11 492 11 848
2.3.6 Agency Services
Agency services are those services that are not according to the Constitution of South Africa functions of Local Government. However, legislation allow for agency agreements between government meaning that another sphere of government can perform the function based on an agreement between the parties. The provincial government services perform by Matzikama Municipality include:

Page 68 of 236
Low Cost Housing Library Services Motor Registration Services
2.3.6.1 Human settlement plan
The Constitution of the Republic of South Africa (Act 108 of 1996) Sections 26, 27 and 29 of Chapter 2 - Bill of Rights – states that, “everyone has the right to access to adequate housing, health care services, social security and education.”
Furthermore, Schedules 4 and 5 states that, “the Province has legislative competence in regard to (inter alia): Environment; Urban and Rural development; Welfare services; Housing, Health Services; Regional planning and development; (concurrent competence with national) and Provincial planning and Provincial Roads and Traffic (exclusive competence).”
Section 9(1) (a) (i) and (f) of the Housing Act 107 of 1997 identifies the primary role of the municipality as taking all reasonable and necessary steps, within the framework of national and provincial legislation and policy, to ensure that the inhabitants within its area of jurisdiction have access to adequate housing on a progressive basis; and to initiate, plan, coordinate, facilitate, promote and enable appropriate housing development in its area of jurisdiction. The Housing Chapter/Sector Plan is a five (5) year housing plan undertaken by the municipality and incorporated into the Municipal IDP with the aim of fulfilling the abovementioned role assigned to the municipality in terms of the Housing Act 107 of 1997 read with the National Housing Code. The Housing Chapter/ Matzikama Human Settlements Strategy in the IDP are reviewed annually as part of the annual review of the IDP.
The Human Settlements Plan (HSP) responds to the needs and projected demands within the municipality and is directed at addressing housing demand over the whole spectrum of income groups as this is regarded as key to supporting sustainable human settlement development within the municipality over time.
In keeping with the Comprehensive Plan for Sustainable Human Settlement (September 2014), the Matzikama Municipality HSP focuses in improving the quality of housing and housing environments by integrating communities and settlements. The Matzikama Municipality has embarked on a program to create the necessary infrastructure to sustain future housing projects. Our objective is to eradicate informal settlements and to provide every house with a basic service which will include a toilet, electricity and water.
Accordingly, the focus is on the development of integrated human settlements in well-located areas that provide convenient access to urban amenities, including places of employment. At the same time it is recognized that the Matzikama Municipality is characterized by a large rural population whose needs also need to be accommodated in the strategy. A key concern in the municipality, which is emphasized in the LED and IDP, is the high level of dependency within the municipality, and the resultant impact this has on the municipality’s ability to provide for basic services to the poorest of the poor. The Matzikama HSP therefore looks at the complete range of available housing instruments to address the current and projected future housing need within the municipality.

Page 69 of 236
Housing statistics
The HSP is directed at integration and consolidation of the urban fabric, and the identification of well-located areas that support the sustainable development of communities. However, it recognizes that where the need is high and a large number of households need to be provided for. Therefore “Greenfield” development adjacent to the urban edge may be the most appropriate solution. The approach, in such cases, places an emphasis on ensuring that social and community facilities are also provided for and where appropriate, commercial opportunities should be incorporated into the detailed development of new suburbs.
Source: Socio Economic Profile 2016, Matzikama Municipality
The majority of households (18 350households or 88.1per cent) in Matzikama currently reside in formal dwellings, compared to 16 650(79.0per cent) in 2011. This equates to a 10.2per cent change in terms of the number of households. In comparison, 85.7 per cent of households (111389) in the District currently reside in formal dwellings.
A total of 11.9per cent of households in Matzikama currently reside in either an informal (2300), traditional (81) or other (89) dwellings in 2016.
Highlights Housing
The table below specifies the highlights for the year: 2015 – 2016
Highlights Description
GAP Housing The council approved sites for GAP housing. The administration process has commenced to determine how many people do qualify for this project.
Transfer of houses in Vredendal-North
A total of 55 title deeds were completed and are ready to be handed over to the owners of the houses.
Provincial Planning Committee Resolutions
Final findings
Ward 1: Lutzville and Lutzville-Wes
Lutzville, the main town in Ward 1 is the center of social and economic services and infrastructure in the ward. Lutzville-Wes is a small predominantly housing cluster located some kilometers out of the town. The rural population in Ward 1 demonstrates a negative population growth rate over the period, which is an indication of urbanization or outmigration within the ward.
In 2013, the housing waiting list indicates that 543 individuals wish to be accommodated in Lutzville. A housing project is already in the pipeline, which will accommodate 155 people in Lutzville with the purpose of formalizing Mbeki Square in Lutzville. Additional land will need to be earmarked for the next phase of housing delivery in Lutzville.
Page 70 of 236
Ward 2: Doring Bay, Ebenaeser, Papendorp, Strandfontein and a Portion of Vredendal South
The Draft SDF 2013 identifies sufficient vacant land in the towns of Doring Bay, Strandfontein and Ebenaeser to accommodate the existing and projected future housing demand. It must be noted that Ebenaeser falls within an Act 9 Area. The future development of the settlement is therefore subject to specific legislative requirements and falls outside the jurisdiction of the Matzikama Municipality. The municipality can therefore not implement housing delivery within Ebenaeser. A process has commenced in terms of Act 9 provisions, but the outcome will determine the future of the settlement. Strandfontein is a predominantly holiday. Papendorp is a traditional fishing village on the Olifants River estuary. The town has a significant number of vacant erven.
Census 2011 indicates that Ebenaeser and Strandfontein have demonstrably high population growth rates. While population growth rate in Doring Bay and Papendorp are low. The rural surroundings demonstrate a negative growth rate.
The housing waiting list indicates a number of 495 people on the waiting list in this ward. 363 beneficiaries (73%) want to be housed in Doring Bay whilst 74 beneficiaries occupied houses in Doring Bay end of December 2013, 131 (27%) want to live in Ebenaeser, half of which are rural. A housing project in Doring Bay was completed in 2013 and 76 houses were built. There is one person on the waiting list for Papendorp. Strandfontein does not have a waiting list. It is evident from the current income profile that most of the demand in this ward exists for RDP/BNG housing and only a very small portion of land will be required to accommodate GAP, FLISP and private development housing.
Ward 3, 4 and 5: Vredendal
The SDF (2013) identifies sufficient land to accommodate existing and projected housing demand. Land is identified in both Vredendal North and Vredendal South. The land ownership issues in Vredendal South will need to be overcome to implement housing delivery in Vredendal South. The outcomes of the Eureka land claim are still uncertain, but may present an opportunity for housing delivery in the future. Land identified for future development to the western part of Vredendal North however, is steep and the topography complex and will therefore be expensive to develop.
Vredendal North demonstrates a higher population growth rate than Vredendal South. There is also a negative rural population growth rate which is indicative of urbanisation taking place in these wards. The town of Vredendal also demonstrates the highest incidence of backyard dwellings.
There are currently 3 829 people on the waiting list who want to live in Vredendal. In Vredendal North 268 sites were serviced during 2015/16 for future housing development. The development was done in accordance with the Upgrading Informal Settlement Program (UISP) and Informal Residential Development Program (IRDP) of the Department of Human Settlements.
The vast majority of land (85%) for new housing will be required for RDP/BNG. The housing project currently on the Matzikama Municipal pipeline in Vredendal North is being implemented and can accommodate 1500 households.

Page 71 of 236
Ward 6: Klawer
The Draft SDF 2013 identifies sufficient land to accommodate existing and projected housing demand. The town demonstrates a relatively high population growth rate and a negative population growth rate is evident in the rural area within the ward.
There are currently 1330 people on the housing waiting list in Klawer after 183 houses were built and handed over to the beneficiaries. In Klawer 283 sites were serviced during 2015/16 for future housing development and were done in accordance with the Upgrading Informal Settlement Program (UISP) and Informal Residential Development Program (IRDP) of the Department of Human Settlements.
Future phases of the project are still subject to environmental and planning approval. A large proportion of the waiting list originates in the rural population. There are also a significant number of individuals on the list for a period between 6 and 10 years.
Ward 7: Vanrhynsdorp
The Draft SDF 2013 identifies sufficient land to accommodate the existing and medium term housing demand. Future revisions of the SDF may identify more land and the Matzikama Municipality should monitor whether or not this is required in future revisions of the SDF. Vanrhynsdorp has the third largest waiting list in the Matzikama Municipality with a total of 977. More than 44% have been on the list for between 6 and 10 years. More than 10% may be regarded as backyard dwellers while 706 (58%) of the beneficiaries are under the age of 45.
Population growth rate within the town is lower than for Vredendal, Klawer or Lutzville. There is also marginal growth in the rural population. Projected housing demand will therefore be less. Although a housing project has been completed in the town in the recent past, there is currently no active project identified or on the project pipeline. The Department of Correctional Services has indicated to the Municipality that they would like to assist their employees to access housing close to their facility in Vanrhynsdorp.
Ward 8: Koekenaap, Bitterfontein, Nuwerus, Kliprand, Stofkraal, Molsvlei, Put-Se-Kloof and Rietpoort
The projections calculated for Ward 8, using the municipal growth rate of 8.2%, shows an unrealistically high demand for housing and associated requirements for land provision. Therefore another projection has been calculated for this ward using the Municipal average growth rate of 2.17% and it is believed that this more accurately reflects the future housing demand in this part of the municipality.
There is sufficient land earmarked in Koekenaap. However, Mandela Park is located outside the proposed urban edge, access to adequate services is an imported consideration in launching a UISP project in Koekenaap. The Draft SDF 2013 identifies sufficient land to accommodate the existing and future projected demand. It must be noted that Rietpoort, Put-Se-Kloof, Molsvlei and Stofkraal are Act 9 areas, and subjected to planning process in terms of related legislation. These processes have not commenced yet and until such time that the process will be completed, the settlements fall outside of the jurisdiction of the municipality. Currently therefore no housing delivery projects can be initiated by the municipality in these settlements.
An analysis of the population growth rate per town shows that Rietpoort is the fastest growing settlement in this ward (growth rate of 3.57%) in 2013, while Kliprand’s population was found to actually be diminishing (growth rate of – 2%). The housing waiting list of 2013 shows that 46 people wish to be housed in Rietpoort, 6 people want
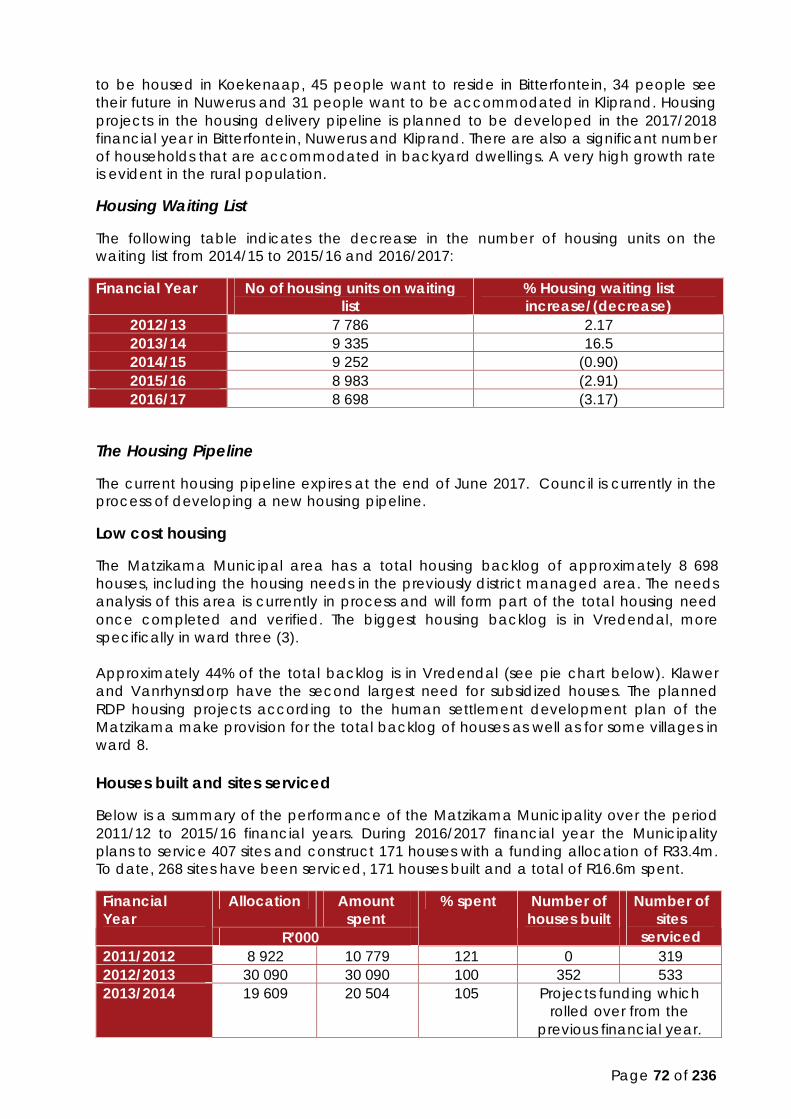
Page 72 of 236
to be housed in Koekenaap, 45 people want to reside in Bitterfontein, 34 people see their future in Nuwerus and 31 people want to be accommodated in Kliprand. Housing projects in the housing delivery pipeline is planned to be developed in the 2017/2018 financial year in Bitterfontein, Nuwerus and Kliprand. There are also a significant number of households that are accommodated in backyard dwellings. A very high growth rate is evident in the rural population.
Housing Waiting List
The following table indicates the decrease in the number of housing units on the waiting list from 2014/15 to 2015/16 and 2016/2017:
Financial Year No of housing units on waiting list
% Housing waiting list increase/(decrease)
2012/13 7 786 2.17 2013/14 9 335 16.5 2014/15 9 252 (0.90) 2015/16 8 983 (2.91) 2016/17 8 698 (3.17)
The Housing Pipeline
The current housing pipeline expires at the end of June 2017. Council is currently in the process of developing a new housing pipeline.
Low cost housing
The Matzikama Municipal area has a total housing backlog of approximately 8 698 houses, including the housing needs in the previously district managed area. The needs analysis of this area is currently in process and will form part of the total housing need once completed and verified. The biggest housing backlog is in Vredendal, more specifically in ward three (3). Approximately 44% of the total backlog is in Vredendal (see pie chart below). Klawer and Vanrhynsdorp have the second largest need for subsidized houses. The planned RDP housing projects according to the human settlement development plan of the Matzikama make provision for the total backlog of houses as well as for some villages in ward 8. Houses built and sites serviced
Below is a summary of the performance of the Matzikama Municipality over the period 2011/12 to 2015/16 financial years. During 2016/2017 financial year the Municipality plans to service 407 sites and construct 171 houses with a funding allocation of R33.4m. To date, 268 sites have been serviced, 171 houses built and a total of R16.6m spent.
Financial Year
Allocation Amount spent
% spent Number of houses built
Number of sites
serviced R’000 2011/2012 8 922 10 779 121 0 319 2012/2013 30 090 30 090 100 352 533 2013/2014 19 609 20 504 105 Projects funding which
rolled over from the previous financial year.

Page 73 of 236
2014/2015 19 000 15 458 81 0 283 2015/2016 9 000 9 000 100 183 268 2016/2017 33 400 16 600 50 171 268
The total cost for eradicating the current backlog is approximately R 1,409,076,000. However, due to the lack of sufficient funds from the Housing Department of the provincial government to construct the house the municipality is currently implementing the housing policy of the provincial government. The policy basically entails that funds forthcoming from the provincial housing department be utilized to provide serviced plots with basic municipal services for backyard dwellers and the homeless on the housing list to construct their own shacks until such time when houses can be delivered by the provincial government. To date no clear indication by the housing department of the provincial government has been given as to when funding will become available to start with the top structures. The table also indicates that a needs analysis was done in all the towns in the 8 wards of the Matzikama Municipality. As a result the current human settlement plan was reviewed and reflects the most recent housing demand in the Matzikama municipal area. The housing demand along with other developments will also be taken up in the Build Environment Support Program (BESP) currently rolled out by the provincial Department Environmental Affairs and Development Planning (DEA&DP). Challenges: Housing
The challenges that are experienced are as follows:
Description Actions to address To provide a house for everyone
To submit funding applications to the Department of Human Settlements.
Protests To establish a committee in every town to assist the housing processes.
Building of illegal shacks Work closely with Law Enforcement to support with monitoring of informal areas.
HOUSING BACKLOG
The Human Settlements Plan of the Matzikama Municipality was reviewed and approved by Council in October 2013. The IDP and in particular this section, should be read in conjunction with the Matzikama Human Settlements Plan. The pie chart below provides a clear picture of the housing backlog currently that exists in the Matzikama Municipality. Please note that the pie chart include all the towns in the 8 wards of the Matzikama Municipality
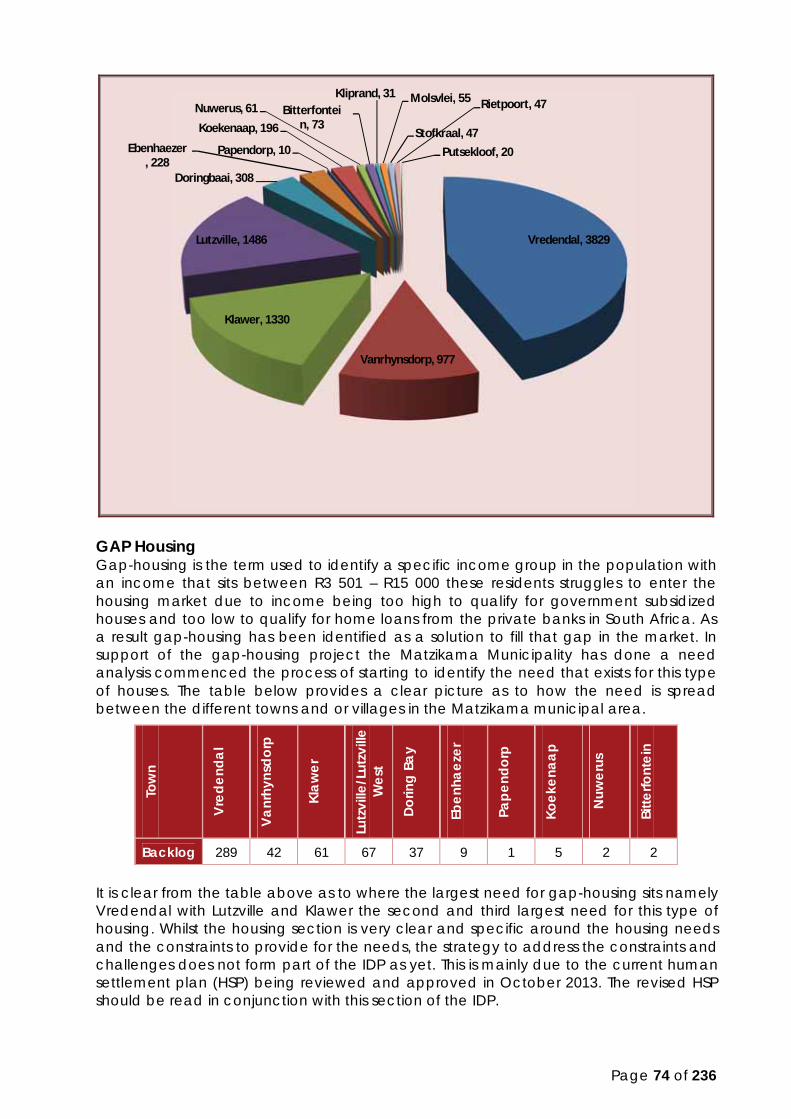
Page 74 of 236
GAP Housing Gap-housing is the term used to identify a specific income group in the population with an income that sits between R3 501 – R15 000 these residents struggles to enter the housing market due to income being too high to qualify for government subsidized houses and too low to qualify for home loans from the private banks in South Africa. As a result gap-housing has been identified as a solution to fill that gap in the market. In support of the gap-housing project the Matzikama Municipality has done a need analysis commenced the process of starting to identify the need that exists for this type of houses. The table below provides a clear picture as to how the need is spread between the different towns and or villages in the Matzikama municipal area.
Tow
n
Vred
enda
l
Vanr
hyns
dorp
Klaw
er
Lutz
ville
/Lut
zvill
e W
est
Dorin
g Ba
y
Eben
haez
er
Pape
ndor
p
Koek
enaa
p
Nuw
erus
Bitte
rfont
ein
Backlog 289 42 61 67 37 9 1 5 2 2
It is clear from the table above as to where the largest need for gap-housing sits namely Vredendal with Lutzville and Klawer the second and third largest need for this type of housing. Whilst the housing section is very clear and specific around the housing needs and the constraints to provide for the needs, the strategy to address the constraints and challenges does not form part of the IDP as yet. This is mainly due to the current human settlement plan (HSP) being reviewed and approved in October 2013. The revised HSP should be read in conjunction with this section of the IDP.
Vredendal, 3829
Vanrhynsdorp, 977
Klawer, 1330
Lutzville, 1486
Doringbaai, 308
Ebenhaezer, 228
Papendorp, 10
Koekenaap, 196
Nuwerus, 61 Bitterfontein, 73
Kliprand, 31 Molsvlei, 55
Stofkraal, 47
Rietpoort, 47
Putsekloof, 20
Page 75 of 236
The human settlement section of the IDP reveals the core information around the housing needs for RDP-houses and gap-houses as well as some of the constraints faced by the Municipality to deliver on the housing needs. The section is merely an abstract of the housing plan and should not be seen by the reader as the complete housing strategy. The housing strategy is one of the sector plans of the IDP and should be read in conjunction with the IDP.
2.3.6.2 Library services
Libraries are an important and essential part of the community and social services rendered by the Municipality. They promote the economic and social upliftment of the communities within the municipal area by providing a wide range of information and recreational library materials free of charge to communities. To provide this information and materials to the most rural parts in the municipal area, wheelie wagon “libraries” are provided in some of the settlement i.e. Stofkraal, Molsvlei and Kliprand.
Many learners and students, especially from those communities living in poverty, visit the libraries for information regarding their studies, assignments and other school work as the school libraries are not adequately equipped and/or do not exist anymore. Jobseekers can get information regarding job opportunities with free access to internet at 10 of the libraries in the municipal area and can even create and update their CV’s on the computers at the libraries. The personnel at the libraries also present special programmes and exhibitions for library users and especially for children to promote reading habits, the correct usage of the indexes of encyclopaedias to find information and in-book education (the correct way to use a book while reading).
The table below specifies the highlights for the year:
HIGHLIGHTS DESCRIPTION Financial support for the library services from the Provincial Government Western Cape and relevant National Department.
Municipal Replacement Funds (MRF) of R3, 900 million and a conditional grant of R1, 760 million was received from the Western Cape Library Services and the relevant national department to utilise for personnel-, operational- and capital expenses.
The installation of a book detective system in the Ebenhaeser Library
A book detective system was installed in Ebenhaeser library to minimize the theft of library material.
The installation of new and safe book shelves in the Bitterfontein library and the purchase of new furniture, shelves and other equipment for several other libraries.
All the book shelves in the Bitterfontein Library were old and dangerous for library users and it was replaced by new and safe book shelves.
New furniture, shelves and other equipment were purchased for several other libraries.
The installation of an enhanced broad band internet connection at nearly all libraries in the municipal area by the Western Cape Provincial Library Services as part of their ICT project to provide computers and internet connections at libraries for public access to internet information and to access the Provincial information Management System (SLIMS/Brocade).
Computers were already installed at the Vredendal- South, Vredendal-North, Vanrhynsdorp, Lutzville, Klawer, Tru-Tru (Vanrhynsdorp), Uitkyk (Lutzville), Ebenhaeser, Bitterfontein and Nuwerus Libraries for internet usage by the public and to obtain access to all library materials available in the Provincial Library Services. These installations were enhanced by the broad band internet connections that were installed in the year under review.
The partnership agreement between the Municipality and Unisa regarding the rendering of library services.
A mobile library of UNISA was parked monthly at the Vredendal South Library for UNISA students to obtain the necessary study books. The personnel of the library also assisted the students to use the UNISA library via internet.

Page 76 of 236
HIGHLIGHTS DESCRIPTION The Municipality was privileged to be the host for the launch of the National Library Week of 2016 in the Western Cape and a very successful library week was hosted afterwards at all the libraries of the Municipality.
This event took place on Monday, 14 March 2016 at the Maskam Mall in Vredendal and Minister Anroux Marais, the MEC for Cultural Affairs and Sport in the Western Cape, officially opened the Library Week. The librarians and assistant librarians from the different libraries in the municipal area hosted special exhibitions and programmes during the Library Week to promote library services in the community.
A mini-library for the blind was installed at Vredendal Library by a joint initiative between the Western Cape Provincial Library Services and the South African Library for the blind (SALB)
In May 2016 a mini-library for the blind was installed at the Vredendal Library by the Western Cape Provincial Library Services which includes computer hard-and software specially designed for visually impaired users, a text reader and access to online resources and materials including braille books supplied by the SALB. The library staff of Vredendal Library will also receive training in the use of the equipment and how to assist the visually impaired.
The delivering of library books to the elderly people staying in the old age home Vredendal.
The library personnel of Vredendal-South library visited the old age home in Vredendal monthly and deliver library books door-to-door to the elderly people.
A weekly book review-programme on the local radio station, Radio Namaqualand.
One of the senior librarians enhances the reading habit of the public by means of a weekly book review programme on the local radio station, Radio Namaqualand.
Successful Library Forum meetings of the Provincial Regional Library Office in the municipal area.
All library personnel attended the Library Forum meetings held in October 2015 and May 2016 to collectively discuss and implement more effective library services.
Conflict and Diversity Management training that some librarians and assistant librarians received.
Five librarians and assistant librarians of Vredendal, Lutzville, Klawer and Vanrhynsdorp Libraries attended a workshop on 26 and 27 August 2015 to receive training in Conflict and Diversity Management.
The challenges experienced are as follow:
Description Actions to address The replacement of the manual lending-out system of library materials at all remaining libraries with the SLIMS/ Brocade computerized library system of the Western Cape Provincial Library Services. Only Vredendal-South, Eureka in Vredendal-North, Vanrhynsdorp and Lutzville libraries were computerised in this regard.
Facilitate the training and the replacement of the manual lending out system with the SLIMS/Brocade computerised library system by the Western cape Provincial Library Services at the remaining libraries.
Increasing public access to information at libraries with the utilisation of information technology at the remaining libraries. Vredendal-South, Eureka in Vredendal-North, Vanrhynsdorp, Lutzville, Klawer, Tru-Tru in Vanrhynsdorp, Uitkyk in Lutzville, Ebenhaeser, Bitterfontein and Nuwerus libraries have computers for access in this regard.
Facilitate the instalment of computer work stations with internet access by the Western Cape Provincial Library Services at the remaining libraries.
The decrease of the circulation numbers of library books due to the availability of internet access for information at 10 libraries.
To do more awareness of the free lending out of library books and to promote a reading culture among the community.

Page 77 of 236
The table specifies the statistics for library services for the year under review:
Type of service 2012/13 2013/14 2014/15 2015/16 Library members 10 703 10 885 4908 5644 Books circulated 224 519 211 889 210 499 196 596 Exhibitions held 240 89 104 105 Internet users 7 633 7 209 9340 9017 Children programmes
50 41 74 59
Visits by school groups
176 34 31 35
Book group meetings for adults
25 50 11 5
Primary and Secondary Book Education sessions
18 61 21 38
Book reviews and marketing
n/a 15 13 13
2.3.6.3 Traffic services
Security and Safety
Our objective is to limit crime in the municipal area in collaboration with other Government institutions and implement security measures within the available budget.
We are experiencing theft, damage and vandalism at our municipal properties, which happens especially over weekends and at night. A further challenge is the number of homeless people in the Vredendal CBD. These challenges are as a result of the high rate of unemployed in the area that increases the level of crime in the municipal area.
Traffic Services and Law Enforcement
The traffic and Law enforcement division comprises of 14 officers which is divided into three districts as follows:
Area Towns Capacity Central District Vredendal and Vredendal North Driver’s license testing and
roadworthy facility 1 Superintendent, 2 Senior Traffic Officers (testing of
vehicles & driver’s licenses) 3 Traffic Officers (traffic safety and law
enforcement) Western District Lutzville, Koekenaap & Doring Bay 1 Superintendent
3 Traffic Officers (traffic safety and law enforcement)
Eastern District Vanrhynsdorp to Klawer North to Bitterfontein (including the old district municipal area)
1 Superintendent 3 Traffic Officers (traffic safety and law enforcement)
The following traffic services are rendered within the Matzikama Municipal area.
Enforcement of By-Laws

Page 78 of 236
Roads safety training at schools Roadworthy of motor vehicles Testing of learner and drivers licenses Escort duties Traffic Safety enforcement Accident control Safety education at businesses Issuing of warrants of arrest, and Deployment in times of disasters and major incidents
We have four vehicle registration and licensing offices in Vredendal, Vanrhynsdorp, Lutzville and Klawer respectively. This division comprises of 1 Senior Officer and 4 cashiers of which 2 posts are currently vacant. They are responsible for the following services:
Motor vehicle registration and all related functions Application and issuing of learner and drivers licences Eye testing, and Leaner’s Classes
The Office for summons administration and fines is situated in Vredendal with 1 Administration Clerk who is responsible for amongst other the following:
Capturing of summonses on the MVS system for provincial and local traffic offences,
Managing and capturing of warrant of arrest on the provincial e-NATIS system, Managing the financial administration of fines that are paid, Liaison with the Public Prosecutor Managing the case representations, and
Attending the cash-flow meetings with the National Prosecuting Authority
Highlights: Traffic Services and Law Enforcement
Highlights Description Service Delivery with regard to Motor Registration & Licensing
Permanent appointment of two general workers in Community Services as Registration Cashiers in the Motor Registration division
Social Empowerment The Training for learner’s licenses and driving training in conjunction with Coke Cola is still ongoing and we also had various pedestrian safety training sessions within the communities.
Scholar Safety The issuing of reflective bands and reflecting rug sacks has been expanded to another three schools situated on major routes. Continuous pedestrian safety and scholar patrols are monitored by Road Safety Management in conjunction with three of our local officers who are project champions within the three districts.
Training and development One of our officers completed his National Diploma in Road Traffic and Municipal Police Management at the Tshwane University of Technology and is currently in the final stage of his B-Tech degree.
Management The new organogram for Traffic Services make provision for a separate management representative which is a challenge currently.

Page 79 of 236
Highlights Description Law Enforcement The new organogram for Traffic Services make provision
for a Law Enforcement division which is a challenge currently
Public Transport During the year there was unrest within the local Taxi organisation (OTV) with regards to the transportation of Industrial workers to and from Brand-se-baai. It escalated to the extent that roads were blocked and illegal marches were organised. The Traffic Department facilitated the process and assisted with the applications for new operating licenses permits(OLB) to ensure that the transportation of workers meet the legal requirements.
Challenges: Traffic Services and Law Enforcement
Description Actions to address Staff and working hours The current operational staff is 8- traffic & Law
Enforcement, 3- Testing Officers & 3 Superintendents. The working hours are from 08h00 to 17h00 with only 3 Officers and 1 Superintendent on standby which is not sufficient. The Staff establishment must be revised to cater for additional staff needed.
Transport to access certain areas. Superintendents to attend RTMCC meetings and Senior Registration to attend WCeNUG meetings.
Pound facilities for animals and vehicles
Budget for registered and adequate pound facilities.
Office Space Expand the current office space to make it more user-friendly.
Information Desk Incorporate an information desk in the current staff establishment.
Total number of vehicles tested Expand the current one vehicle testing line to two lanes. Driving license testing centre Expand the driving license testing centres to Lutzville and
Vanrhynsdorp and a learner’s testing centre to Bitterfontein.
Training for staff Refreshers course in different categories must be organised.
Traffic Services and Law Enforcement Service Delivery Statistics
Type of service 2012/13 2013/14 2014/15 2015/16 Road Traffic accidents handled n/a n/a 726 839
By-Law infringements attended to n/a n/a 50 106
Animals impounded 6 7 (animal care) 8 goats and 3 dogs 7 dogs Motor vehicle licenses processed 18 064 16 250 22 207 29 316
Learner driver licenses processed 912 1 461 1097 1039
Driver licenses processed 1 008 1 134 506 478
Driver licenses issued 2 328 2 729 4127 5634

Page 80 of 236
Fines issued for traffic offenses 1 345 (sect 56)
5 505 (speed) 1 044 (sect. 56) 2 226 (speed)
1606 (Municipal) 6 030 (Provincial)
4 977 (speed)
2 913 (Municipal) 10 871(Provincial)
1 127 (Speed) R-value of fines collected R1 101 000 R589 030 R 1 890 640 R 1 731 935
Operational call-outs 136 124 206 169 Roadblocks held 25 18 22 20 Special Functions -Escorts 96 hours 52 hours 38 hours 31 hours
Awareness initiatives on public safety 136 hours 178 hours 60 hours
56 hours
Complaints attended to by Traffic Officers n/a n/a 0.67 per day 0.49 per day
2.3.7 Financial Norms and Standards
This section provides the reader with information regarding the financial norms and standards as recommended by the National Treasury.
2.3.7.1 Salaries and wages Employee-related costs are usually the largest portion of operating expenditure, but should not be allowed to increase to the extent that it threatens the sustainability of the operating budget. The norm for this indicator is between 25 and 40 percent of total operational costs. It is critical that Municipalities guard against abnormally high salary bills while at the same time ensuring sufficient personnel to deliver good quality services. The bar chart below is indicative of the personnel costs over the past five years.
The bar chart above indicates a growth in salaries and wages over the past five financial years. It varied between 33% and 37% over the past five years.
2.3.7.2 Maintenance
Infrastructure must be maintained so that service delivery is not affected. This indicator looks at how much money was budgeted for repairs and maintenance, as a percentage of total fixed assets (property, plant and equipment). For every R10 spent
33.0%
34.8%
36.8% 36.1%
36.7%
2012 2013 2014 2015 2016

Page 81 of 236
on building/replacing infrastructure, R0.80 should be spent every year on repairs and maintenance. This translates into a Repairs and Maintenance budget that should be eight percent of the value of property, plant and equipment.
The bar chart above reflects a decrease in money spent on maintenance and repairs for the municipality from 3.8% in 2011/12 to 1.66% in 2015/16. Explicit in the bar chart is the under spending on repairs and maintenance in terms of the norms and standards of NT.
2.3.7.3 Cash balance at the end of the financial year
A municipality's cash balance refers to the money it has in the bank that it can access easily. If a municipality's bank account is in overdraft it has a negative cash balance. Negative cash balances are a sign of serious financial management problems. A municipality should have enough cash on hand from month to month so that it can pay salaries, suppliers, etc.
Matzikama Municipality’s Cash balance at the end of the 2015/16 financial year was R10 510 526. There was a growth in the municipality’s Cash Balance from 2011/12 till 2015/16 by 131.8% as illustrated in the graph below.
From the bar chart above it can be seen that Matzikama Municipality was able to maintain a positive cash bank balance for the past five years.
2.3.7.4 Cash coverage

Page 82 of 236
Cash coverage measures the length of time, in months, that a municipality could manage to pay for its day-to-day expenses using just its cash reserves. So, if a municipality had to rely on its cash reserves to pay all short-term bills, how long could it last? Ideally, a municipality should have at least three months' of cash cover. The bar chart below shows the cash available to the Municipality to cover its short-term expenses.
The bar chart reveals that the municipality operated over the past five financial years far below the National Treasury norm with average cash coverage for 10 days. The Cash coverage at the end of 2015/16 was 15 days.
2.3.7.5 Spending operating budget
This indicator is how much more a municipality spent on its operating expenses, than was planned and budgeted for. It is important that a municipality controls its day-to-day expenses in order to avoid cash shortages. If a municipality significantly overspends its operating budget this is a sign of poor operating controls or something sinister. Overspending by up to 5% is usually condoned; overspending in excess of 15% is a sign of high risk. The bar chart bellows depicts the operating budget spending patterns for the past five years.
The bar chart above reveals spending above the National Treasury norm for the financial year 2011/12 but for the remaining period until 2015/16 spending remained within the norm of NT.
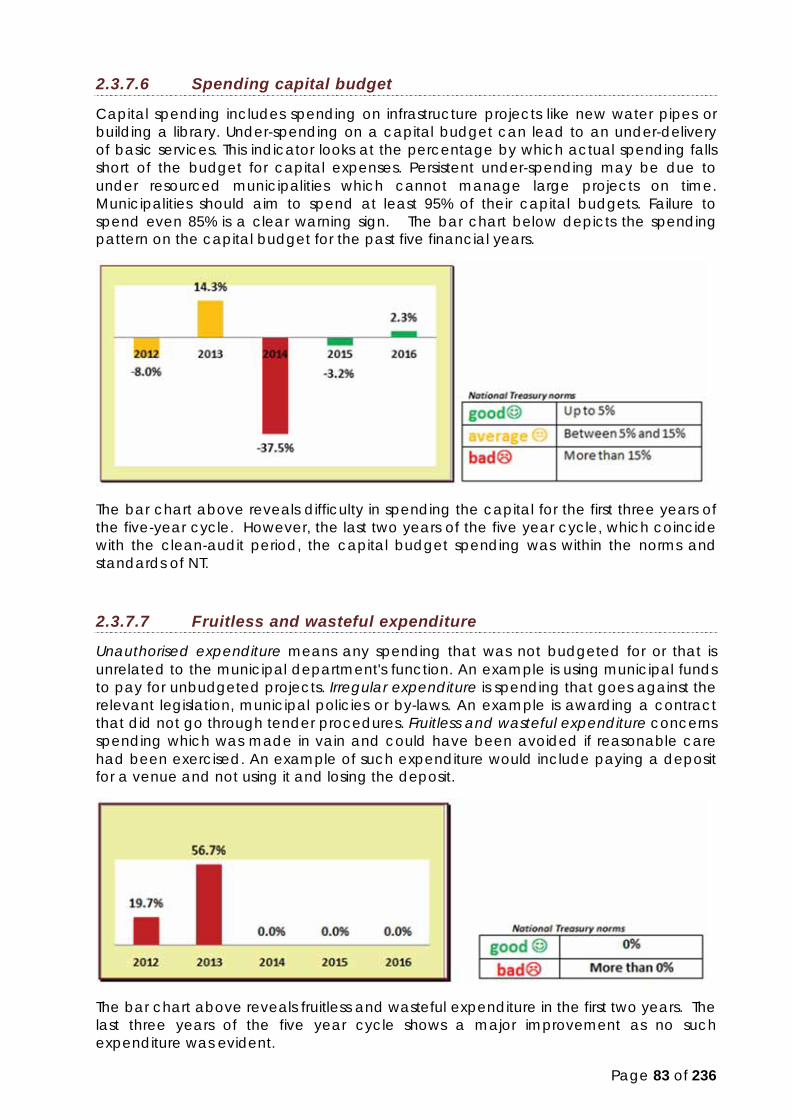
Page 83 of 236
2.3.7.6 Spending capital budget
Capital spending includes spending on infrastructure projects like new water pipes or building a library. Under-spending on a capital budget can lead to an under-delivery of basic services. This indicator looks at the percentage by which actual spending falls short of the budget for capital expenses. Persistent under-spending may be due to under resourced municipalities which cannot manage large projects on time. Municipalities should aim to spend at least 95% of their capital budgets. Failure to spend even 85% is a clear warning sign. The bar chart below depicts the spending pattern on the capital budget for the past five financial years.
The bar chart above reveals difficulty in spending the capital for the first three years of the five-year cycle. However, the last two years of the five year cycle, which coincide with the clean-audit period, the capital budget spending was within the norms and standards of NT.
2.3.7.7 Fruitless and wasteful expenditure
Unauthorised expenditure means any spending that was not budgeted for or that is unrelated to the municipal department's function. An example is using municipal funds to pay for unbudgeted projects. Irregular expenditure is spending that goes against the relevant legislation, municipal policies or by-laws. An example is awarding a contract that did not go through tender procedures. Fruitless and wasteful expenditure concerns spending which was made in vain and could have been avoided if reasonable care had been exercised. An example of such expenditure would include paying a deposit for a venue and not using it and losing the deposit.
The bar chart above reveals fruitless and wasteful expenditure in the first two years. The last three years of the five year cycle shows a major improvement as no such expenditure was evident.

Page 84 of 236
2.3.7.8 Current ratio
The current ratio compares the value of a municipality's short-term assets (cash, bank deposits, etc.) with its short-term liabilities (creditors, loans due and so on). A higher current ratio is a good reflection of the state of the Municipality’s cash flow, therefore, the higher the ratio, the better. The standard range of the current ratio is 1.5 to 2 (if the municipality has assets more than that and the municipality may struggle to keep up with its payments).
In the bar chart above the municipality maintained a ratio between 1 and 1.5 over the period of 2011/12 to 2015/16 which is on average within the norms and standards of NT.
2.3.7.9 Liquidity ratio
Liquidity ratios show the ability of a municipality to pay its current liabilities (monies it owes immediately such as rent and salaries) as they become due, and their long-term liabilities (such as loans) as they become current. These ratios also show the level of cash the municipality has and / or the ability it has to turn other assets into cash to pay off liabilities and other current obligations. The bar chart below depicts the liquidity ratio of the Municipality for the past five years.
In the graph above the municipality’s Liquidity ratio is below 1 for the period quarter 1 (Q1) of 2016 till quarter 1 (Q1) of 2017. It is therefore rated as inferior according to the norms and standards of NT.

Page 85 of 236
2.3.7.10 Current debtors collection rate
Municipalities don't manage to collect all of the monies they charge for rates and services. The current debtors collection rate looks at the percentage of new revenue that a municipality collects. It is also referred to as the Current Debtors Collection Ratio.
The bar chart above reveals outstanding performance by the municipality for the past financial year with a ratio between 110.2% and 134.3%.
2.3.7.11 Sources of income
Municipalities that are able to generate sufficient income from own revenue sources are best placed to deliver good quality services. The more own revenue a municipality is able to generate, the more self-sufficient it is. Municipalities should not be too reliant on transfers and grants from other spheres of government. The pie chart below is indicative of the sources of Matzikama Municipality’s revenue.
The pie chart above shows that Matzikama municipality’s income is made up of Government grants equal to 27.4% and own income generated from trading services of 72.6%. Trading services include water, electricity, property taxes, licenses & fines, refuse removal, rentals, interests, investments and sewage. Money is generated locally from residents paying for water & electricity, rates,

Page 86 of 236
The bar charts below show contributions by the three spheres of government for capital and operational expenditures.
From the above chart it is clear that transfers and subsidies from national government is the biggest contributor to municipal capital expenditure. Transfers and subsidies from provincial government declined from the 2013-14 year onwards. During the 2012-13 transfers and subsidies from national government amounted to 61% of total capital expenditure and transfers and subsidies from provincial government amounted to 39% of total capital expenditure. The pre-audited capital expenditure from own funding amounts to 12% of total capital expenditure.
During the 2012-13 financial year the municipality contributed 80% towards total operational expenditure. From financial years 2013/14 -2015/16 afore-mentioned figure remained at 82%. The pre-audited contribution towards operational expenditure for the 2016-17 year is 84%. Transfers and subsidies from national government through the equitable share amounted to 17 % for 2012/13-2013/14 and 15% for 2014/15-2015/16. The pre-audited transfers and subsidies from national government is 14%. A pattern of declining equitable share contributions from national government as a percentage of

Page 87 of 236
total operational expenditure indicates growth within revenue raised by the municipality. Transfers and subsidies from provincial government vary between 2% and 3% in-between financial years.
2.3.7.12 Spending on contractor services
Private contractors are sometimes needed for certain work but they are usually more expensive than municipal staff. This should be kept to a minimum and efforts should be made to provide services in-house, where possible. This measure is normally between 2 percent and 5 percent of total operating expenditure. In the graph below it is illustrated that the municipality’s spending on contractor services for 2011/12 and 2012/13 was 0.2% and 1.4% respectively however, for the 2013/14 till 2015/16 period no money was spent on contractor services.
2.3.7.13 What is money spent on?
Municipalities spend money on providing services and maintaining existing infrastructure in their municipal areas. The bar chart below illustrates the operational spending of Matzikama Municipality for the financial years 2011/12-2015/16.
0.2%
1.4%
0.0% 0.0% 0.0%
2012 2013 2014 2015 2016
Page 88 of 236
It is evident that the largest portion of the budget is spent on employee cost including wages and salaries followed by bulk purchases and other expenditures. Bulk purchases include purchasing of electricity and water from Eskom and LORWUA respectively.
2.3.8 2015-2016 Annual Report
The Annual Report of Matzikama Municipality is compiled in terms of Section 46 of the Local Government: Municipal Systems Act No. 32 of 2000 and Section 121 & 127(2) of the Local Government: Municipal Finance Management Act No.56 of 2003. The recent report covers performance information and progress made on service delivery of the municipality for the financial period 2015/2016.
Process followed:
The draft Annual Report 2015/16, reflecting the performance over the fiscal period July 2015 till June 2016, was approved by Council on 29 November 2016 and published for public comment for 30 days on the municipal website as well as in the local newspapers. No comments, however, were received on the draft Annual Report 2015/16 from the public. The Matzikama Municipality Oversight Committee, consisting of 2x DA councillors, 1x ANC councillor, 1x UD councillor and 1x EFF councillor discussed and recommended the Annual Report for approval to Council during an Oversight Committee meeting held on 23 January 2017. The final Annual Report was adopted by Council on 31 January 2017.
Content of report
The Annual Report 2015/16 includes an overview on the current status of the municipal area in terms of its demographics, service delivery, financial health, organisational development, audit outcomes as well as the 2015/16 IDP/Budget process followed.
The report includes all successes and challenges with regards to institutional as well as operational functionality for the year under review. It gives an overview of all projects implemented for the financial year 2015/16.
The Annual Report also highlights the strategic performance in terms of the municipality’s Top Layer Service Delivery Budget Implementation Plan (SDBIP) in terms of the Strategic Objectives and performance on the National Key Performance Indicators as prescribed in terms of Section 43 of the Municipal Systems Act, 2000. The Top Layer SDBIP shows the alignment between the IDP, Budget and Performance Plans. The municipality’s overall performance as illustrated by the Top Layer SDBIP 2015/16 was excellent with six Key Performance Indicators (KPIs) out of a total number of 68 KPIs not achieved.
The report furthermore, includes the audited Annual Financial Statements of the municipality for the 2015/16 fiscal year in terms Section 126(2) of the MFMA.
Also included is the report of the Auditor-General to the Western Cape Provincial Parliament and the Council on Matzikama Municipality in terms of Section 126(3).
Particulars of corrective actions on how to better performance of KPIs not met as well as recommendations from the Auditor-General in its audit report are also included.
It is significant that the 2015/16 Annual Report reflects on the performance of Matzikama Municipality during the last year of the five-year term of the Council for 2012/2016.
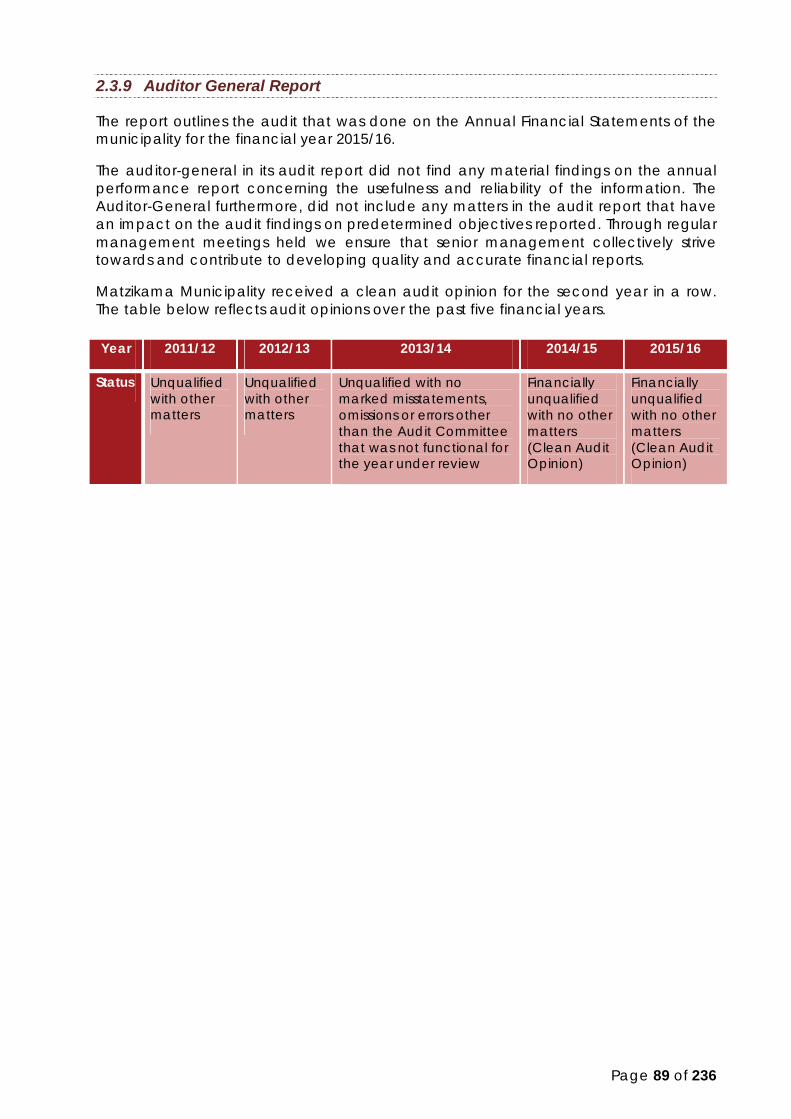
Page 89 of 236
2.3.9 Auditor General Report
The report outlines the audit that was done on the Annual Financial Statements of the municipality for the financial year 2015/16.
The auditor-general in its audit report did not find any material findings on the annual performance report concerning the usefulness and reliability of the information. The Auditor-General furthermore, did not include any matters in the audit report that have an impact on the audit findings on predetermined objectives reported. Through regular management meetings held we ensure that senior management collectively strive towards and contribute to developing quality and accurate financial reports.
Matzikama Municipality received a clean audit opinion for the second year in a row. The table below reflects audit opinions over the past five financial years.
Year 2011/12 2012/13 2013/14 2014/15 2015/16
Status Unqualified with other matters
Unqualified with other matters
Unqualified with no marked misstatements, omissions or errors other than the Audit Committee that was not functional for the year under review
Financially unqualified with no other matters (Clean Audit Opinion)
Financially unqualified with no other matters (Clean Audit Opinion)

Page 90 of 236

Page 91 of 236
2.4 SOCIO ECONOMIC PROFILE
Profiling provides a summary of the key political, social, demographic, economic and biophysical characteristics of the Matzikama Municipality and its people. Demographic and other available data are used to build a picture of the relevant community or communities.
The profile assists Matzikama Municipality to identify those characteristics which will influence the way people interact and engage. In addition, updating the profile over time enables the tracking of change and the identification of trends. Profiling is an important activity in understanding the context in which a planning process is occurring, identifying and collating information on relevant stakeholders, and identifying gaps in information.
Profiling enables the identification of characteristics that connect the community of Matzikama and the way community members interact with natural resources. It also provides a baseline and, in updating the profile, will enable the tracking of change over time.
2.4.1 Demographics
Demographics is broadly defined as the study of population dynamics which is significantly influenced by a wide array of factors such as birth and death rates, immigration patterns, age, race, gender, life expectancy etc.
The following section provides a concise, yet meaningful overview of the most prominent demographic indicators relevant for municipal planning and budgeting.
2.4.1.1 Population breakdown
The Matzikama Municipality is estimated to account for 17% of the West Coast District’s population of 395 137 in 2014/15.
Total Population
The table below reveals the total population in the municipal area for the past five years.
2011/2012 2012/2013 2013/2014 2014/2015 2015/2016
65 290 67 146 68 584 70 052 71 045
The population increased from the 2013/14 financial year to the 2014/15 financial year by 2.09%.
According to the forecast of the Western Cape Department of Social Development, Matzikama’s population is expected to reach 71 813 in 2017. This total gradually increases across the 5-year planning cycle and is anticipated to reach 76 172 by 2023. This equates to an approximate 6.1 per cent growth off the 2017 base estimate.
2016 Socio-economic Profile: Matzikama Municipality
Total estimated population size in 2017 Total estimated population size in 2023
71 813 76 172

Page 92 of 236
In 2017, Matzikama’s population gender breakdown will be relatively evenly split between male (35 844, 49.9 per cent) and female (35 969, 5.1 per cent). For 2023, the split is anticipated to be 37 892 (49.7 per cent) and 38 280 (50.3 per cent) for males and females respectively. The bar chart below reveals the relationship between male and female in terms of the numbers.
2016 Socio-economic Profile: Matzikama Municipality
Matzikama will in 2017 largely consists of younger generations which could potentially increase the Municipality’s dependency ratio. It is interesting to note that the population concentration between the age groups 15 – 19 and 20 – 24 remains relatively the same, indicating that school leavers do not necessarily move out of the area, but are potentially absorbed within the local labour market. As the labour market, largely driven by agricultural activity, is more than ever requiring semi-skilled labour, the up-skilling of such youths should be prioritized to decrease unemployed and to stimulate economic growth.
Households
In order to ensure basic service delivery to all, municipal budget allocations should be informed by credible and accurate assumptions regarding the number of households within a municipal area.
According to Census 2011, there were 18 835 households within the greater Matzikama region in 2011. As per the 2016 Community Survey estimates, the number of households increased to 20 821 in 2016 which equates to 10.54 growth of the 2011 base.
Age Cohorts
Matzikama is expected to have decreasing dependency ratios of 49.4, 48.5 and 48.2 for the respective years of 2011, 2017 and 2023. As lower dependency ratios imply less strain on the working age to support their economic dependents (children and age), this decrease will have positive social, economic and labour market implications.
A decrease in the dependency ratio is often associated with a relative increase in the working age population.
At the municipal level, this increase will also result in a smaller base from which local authorities can collect revenue for basic services rendered and will necessitate the prioritization of municipal spending.

Page 93 of 236
2.4.2 The Economy
Economic growth at the municipal level is essential for the attainment of economic development, the reduction of poverty and improved accessibility. Fostering this growth requires an in-depth understanding of the economic landscape with which each respective municipality operates.
Matzikama comprised R2.90 billion (or 15.2 per cent) of the District’s total R19.16 billion GDPR as at the end of 2015. GDP growth averaged 3.0 per cent per annum over the period 2005 – 2015. This is below the District’s average of 3.4 per cent. Average annual growth of 2.6 per cent per annum in the post-recessionary period is below the long-term trend and District average of 2.8 per cent per annum.
Matzikama employed 15.8 per cent (26 142 laborers) of the West Coast District’s labour force in in 2015, and employed growth remain fairly stagnant, averaging 0.7 per cent per annum since 2005 (which was below the overall District employment growth rate of 1.1 per cent per annum). Employment growth has nevertheless picked up in the post-recessionary period (2010 – 2015) averaging 2.49 per cent per annum (which is slightly below the District’s rate of 2.7 per cent over the same period). Matzikama has experienced significant job losses prior to and during the recession, but these jobs have been recovered and approximately 1973 (net) additional jobs have been created since 2005.
GDP Contribution & Average Growth Rates Per Municipality Average GDPR Growth
Municipality Contribution to GDPR 2015
Trend 2005 – 2015
Pre-Recession
2005 – 2007
Recession 2008 – 2009
Recovery 2010 – 2015
Matzikama 15% 3,5% 4,8% 4,4% 2,6% Cederberg 12% 5,1% 7,9% 4,8% 3,8% Bergrivier 15% 4,4% 6,5% 6,9% 2,6% Saldanha Bay 29% 3,1% 5,4% 0,7% 2,8% Swartland 28% 4,4% 6,9% 5,2% 2,9% Total West Coast District 100% 3,9% 6,1% 3,9% 2,9% Western Cape Province - 3,3% 1,3% 2,5% 3,3% (Quantec, 2016)
West Coast District Employment Growth
Employment (net change)
Municipality Contribution to Employment
2015 (%)
Trend 2005 – 2015
Pre-Recession
2000 – 2007
Recession 2008 – 2009
Recovery 2010 – 2015
Matzikama 17,2% 295 822 -1 855 749 Cederberg 13,9% 297 542 -1 217 679 Bergrivier 17,5% 115 651 -2 644 766 Saldanha Bay 23,2% 197 895 -1 773 504 Swartland 28,2% 823 1 581 -1 656 1 271 Total West Coast District 100% 1 727 4 492 -9 144 3 969
The majority (42.6 per cent or 11 132) of the workforce in Matzikama operate within the low-skill sector, which has contracted by 0.7 per cent per annum on average since 2005. Most of the job losses experienced during the recession emanated from this sector. The semi-skilled sector employed 24.8 per cent of the municipality’s workforce,

Page 94 of 236
and stagnated (contracting by only 0.03 per cent per annum on average since 2005). The informal sector (which employs 5794 workers or 22.2 per cent of the municipality’s workforce) experienced robust growth of 6.1 per cent per annum over the past decade and absorbed most of the job losses from the low and semi-skilled sectors. The skilled sector employed only 2720 workers, and grew at a moderate rate of 1,01 per cent per annum since 2005. A detailed sectoral analysis is provided in the ensuing section.
2.4.2.1 The primary sector: Agriculture, Forestry & Fisheries
This industry comprised R705.44 million (or 24.3 per cent) of the Municipality’s GDP in 2015. It displayed robust growth of 5.4 per cent for the period 2005 – 2015. Growth has nevertheless deteriorated since the recession – the industry experiencing a growth rate of 4.1 per cent per annum over a period 2010 – 2015).
Agriculture, forestry and fishing employed 36.4 per cent of the Municipality’s workforce. Employment contracted by one percent on average over the period 2005 – 2015. Employment growth nevertheless rebounded and grew at a rate of 4.6 per cent per annum on average since 2010, which is significantly higher. Despite the post-recessionary improvement, not all the jobs lost prior to and during the recession have been recovered, 1 346 jobs have been lost on net.
The majority (63.2 per cent or 6021 workers) of the workforce in agriculture, forestry and fishing operate within the low-skill sector, which has experienced growth of 4.4 per cent since 2010. The semi-skilled sector employs 1463 workers and the sector has grown at a rate of 4.8 per cent per annum since 2010. Despite the fast growth since 2010, employment in these two categories has contracted over the long term (2005 – 2015. The skilled sector employs the smallest proportion of the Municipality’s workforce (3.1 per cent or 297 workers). This segment has shown robust growth post-recession (this growth nevertheless stemming from a small base), and more moderate growth over the long term. The informal sector makes up 18.3 per cent of the industry’s workforce experienced the most favorable long term growth as employment grew by 2.5 per cent per annum over the period 2005 – 2015. Informal employment within the agriculture, forestry and fishing industry furthermore experienced robust growth of 4.6 per cent per annum since 2010.
GDP
2015 Trend 2005 - 2015
Recovery 2010 - 2015
R705.44 million 5.4% 4.1%
Employment 9 523 -1.0% 4.6%
Skills
Levels
Skilled 297 0.7% 6.7%
Semi-skilled 1 463 -1.2% 4.8%
Low-skilled 6 021 -1.7% 4.4%
Informal 1 742 2.5% 4.6%
Source: Socio Economic Profile 2016, Matzikama Municipality
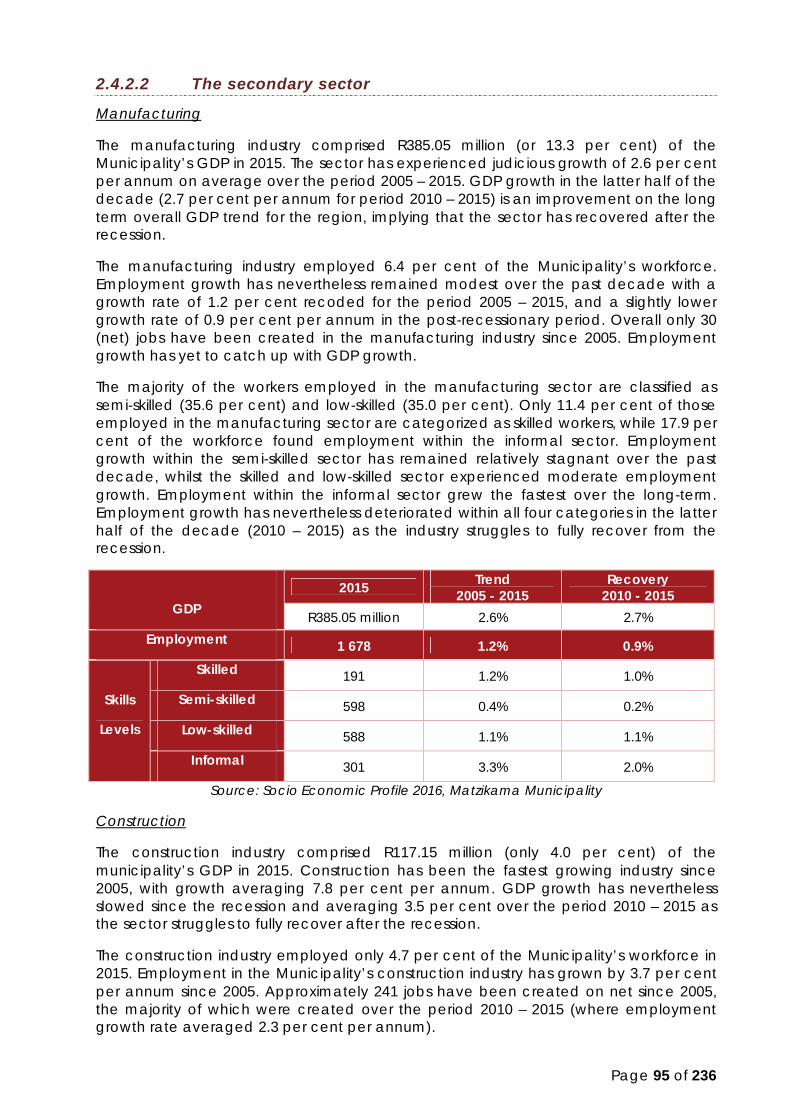
Page 95 of 236
2.4.2.2 The secondary sector
Manufacturing
The manufacturing industry comprised R385.05 million (or 13.3 per cent) of the Municipality’s GDP in 2015. The sector has experienced judicious growth of 2.6 per cent per annum on average over the period 2005 – 2015. GDP growth in the latter half of the decade (2.7 per cent per annum for period 2010 – 2015) is an improvement on the long term overall GDP trend for the region, implying that the sector has recovered after the recession.
The manufacturing industry employed 6.4 per cent of the Municipality’s workforce. Employment growth has nevertheless remained modest over the past decade with a growth rate of 1.2 per cent recoded for the period 2005 – 2015, and a slightly lower growth rate of 0.9 per cent per annum in the post-recessionary period. Overall only 30 (net) jobs have been created in the manufacturing industry since 2005. Employment growth has yet to catch up with GDP growth.
The majority of the workers employed in the manufacturing sector are classified as semi-skilled (35.6 per cent) and low-skilled (35.0 per cent). Only 11.4 per cent of those employed in the manufacturing sector are categorized as skilled workers, while 17.9 per cent of the workforce found employment within the informal sector. Employment growth within the semi-skilled sector has remained relatively stagnant over the past decade, whilst the skilled and low-skilled sector experienced moderate employment growth. Employment within the informal sector grew the fastest over the long-term. Employment growth has nevertheless deteriorated within all four categories in the latter half of the decade (2010 – 2015) as the industry struggles to fully recover from the recession.
GDP 2015 Trend
2005 - 2015 Recovery
2010 - 2015 R385.05 million 2.6% 2.7%
Employment 1 678 1.2% 0.9%
Skills
Levels
Skilled 191 1.2% 1.0%
Semi-skilled 598 0.4% 0.2%
Low-skilled 588 1.1% 1.1%
Informal 301 3.3% 2.0%
Source: Socio Economic Profile 2016, Matzikama Municipality
Construction
The construction industry comprised R117.15 million (only 4.0 per cent) of the municipality’s GDP in 2015. Construction has been the fastest growing industry since 2005, with growth averaging 7.8 per cent per annum. GDP growth has nevertheless slowed since the recession and averaging 3.5 per cent over the period 2010 – 2015 as the sector struggles to fully recover after the recession.
The construction industry employed only 4.7 per cent of the Municipality’s workforce in 2015. Employment in the Municipality’s construction industry has grown by 3.7 per cent per annum since 2005. Approximately 241 jobs have been created on net since 2005, the majority of which were created over the period 2010 – 2015 (where employment growth rate averaged 2.3 per cent per annum).
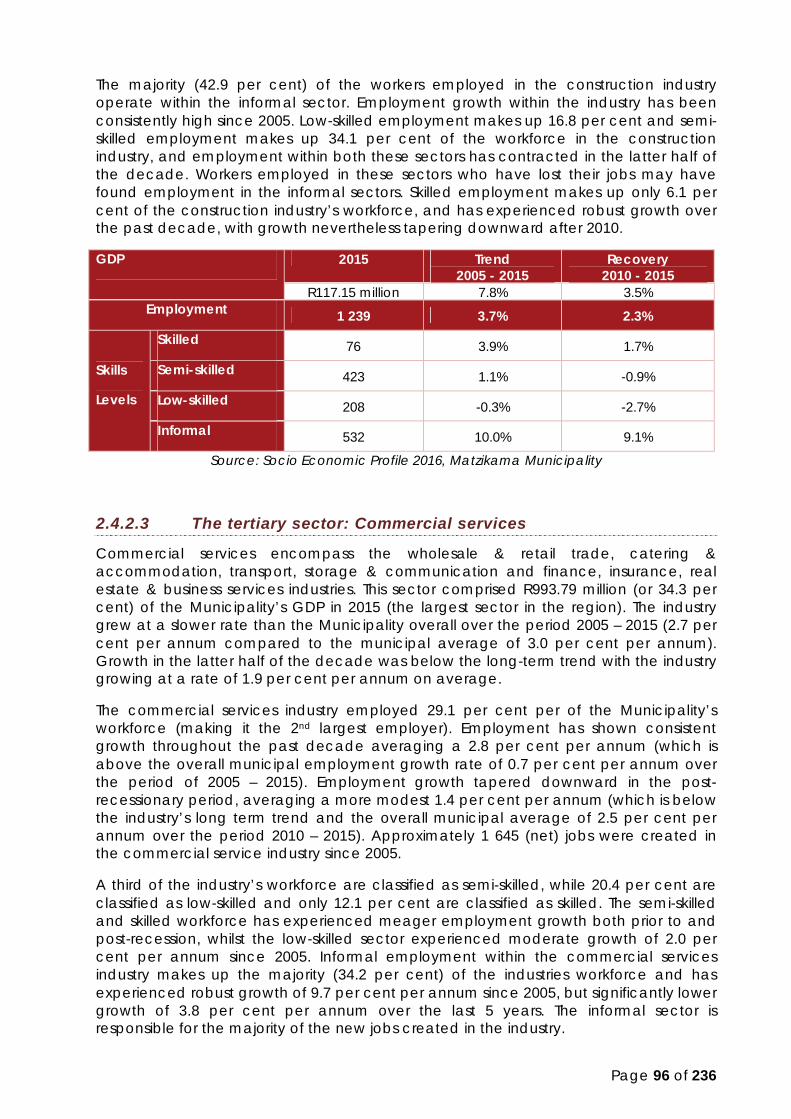
Page 96 of 236
The majority (42.9 per cent) of the workers employed in the construction industry operate within the informal sector. Employment growth within the industry has been consistently high since 2005. Low-skilled employment makes up 16.8 per cent and semi-skilled employment makes up 34.1 per cent of the workforce in the construction industry, and employment within both these sectors has contracted in the latter half of the decade. Workers employed in these sectors who have lost their jobs may have found employment in the informal sectors. Skilled employment makes up only 6.1 per cent of the construction industry’s workforce, and has experienced robust growth over the past decade, with growth nevertheless tapering downward after 2010.
GDP 2015 Trend 2005 - 2015
Recovery 2010 - 2015
R117.15 million 7.8% 3.5% Employment 1 239 3.7% 2.3%
Skills
Levels
Skilled 76 3.9% 1.7%
Semi-skilled 423 1.1% -0.9%
Low-skilled 208 -0.3% -2.7%
Informal 532 10.0% 9.1%
Source: Socio Economic Profile 2016, Matzikama Municipality
2.4.2.3 The tertiary sector: Commercial services
Commercial services encompass the wholesale & retail trade, catering & accommodation, transport, storage & communication and finance, insurance, real estate & business services industries. This sector comprised R993.79 million (or 34.3 per cent) of the Municipality’s GDP in 2015 (the largest sector in the region). The industry grew at a slower rate than the Municipality overall over the period 2005 – 2015 (2.7 per cent per annum compared to the municipal average of 3.0 per cent per annum). Growth in the latter half of the decade was below the long-term trend with the industry growing at a rate of 1.9 per cent per annum on average.
The commercial services industry employed 29.1 per cent per of the Municipality’s workforce (making it the 2nd largest employer). Employment has shown consistent growth throughout the past decade averaging a 2.8 per cent per annum (which is above the overall municipal employment growth rate of 0.7 per cent per annum over the period of 2005 – 2015). Employment growth tapered downward in the post-recessionary period, averaging a more modest 1.4 per cent per annum (which is below the industry’s long term trend and the overall municipal average of 2.5 per cent per annum over the period 2010 – 2015). Approximately 1 645 (net) jobs were created in the commercial service industry since 2005.
A third of the industry’s workforce are classified as semi-skilled, while 20.4 per cent are classified as low-skilled and only 12.1 per cent are classified as skilled. The semi-skilled and skilled workforce has experienced meager employment growth both prior to and post-recession, whilst the low-skilled sector experienced moderate growth of 2.0 per cent per annum since 2005. Informal employment within the commercial services industry makes up the majority (34.2 per cent) of the industries workforce and has experienced robust growth of 9.7 per cent per annum since 2005, but significantly lower growth of 3.8 per cent per annum over the last 5 years. The informal sector is responsible for the majority of the new jobs created in the industry.
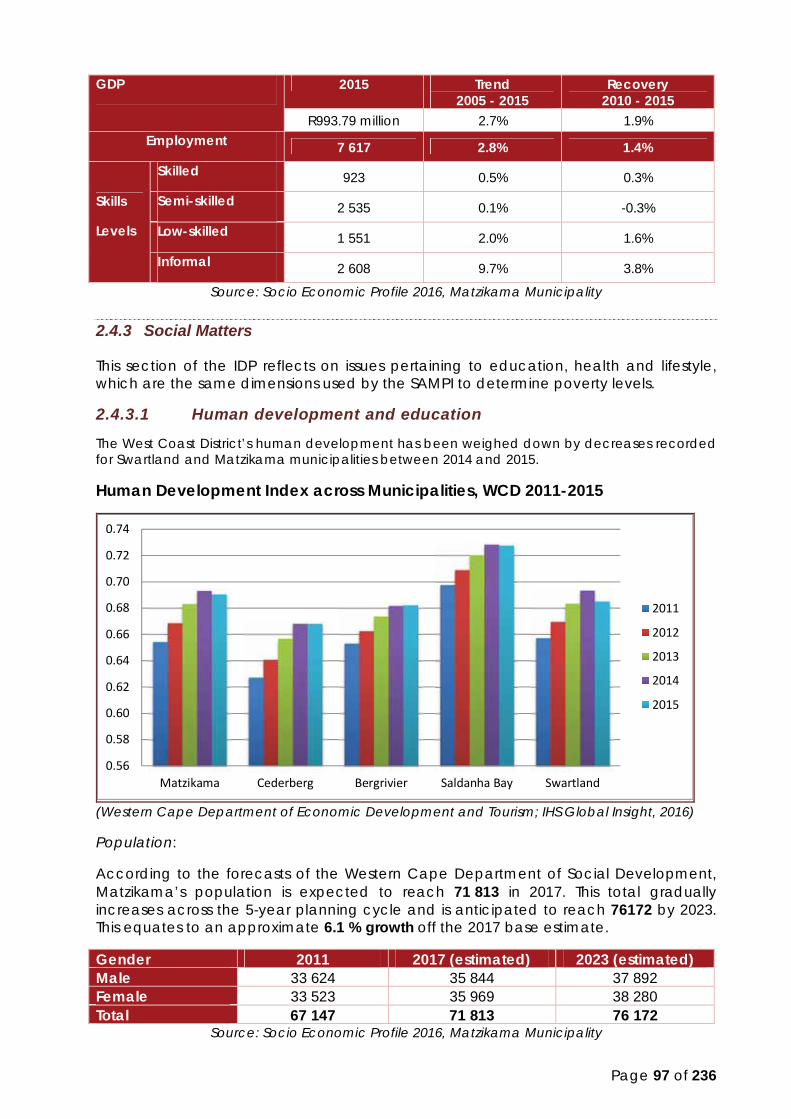
Page 97 of 236
GDP 2015 Trend 2005 - 2015
Recovery 2010 - 2015
R993.79 million 2.7% 1.9% Employment 7 617 2.8% 1.4%
Skills
Levels
Skilled 923 0.5% 0.3%
Semi-skilled 2 535 0.1% -0.3%
Low-skilled 1 551 2.0% 1.6%
Informal 2 608 9.7% 3.8%
Source: Socio Economic Profile 2016, Matzikama Municipality
2.4.3 Social Matters
This section of the IDP reflects on issues pertaining to education, health and lifestyle, which are the same dimensions used by the SAMPI to determine poverty levels.
2.4.3.1 Human development and education
The West Coast District’s human development has been weighed down by decreases recorded for Swartland and Matzikama municipalities between 2014 and 2015.
Human Development Index across Municipalities, WCD 2011-2015
(Western Cape Department of Economic Development and Tourism; IHS Global Insight, 2016)
Population:
According to the forecasts of the Western Cape Department of Social Development, Matzikama’s population is expected to reach 71 813 in 2017. This total gradually increases across the 5-year planning cycle and is anticipated to reach 76172 by 2023. This equates to an approximate 6.1 % growth off the 2017 base estimate.
Gender 2011 2017 (estimated) 2023 (estimated) Male 33 624 35 844 37 892 Female 33 523 35 969 38 280 Total 67 147 71 813 76 172
Source: Socio Economic Profile 2016, Matzikama Municipality
0.56
0.58
0.60
0.62
0.64
0.66
0.68
0.70
0.72
0.74
Matzikama Cederberg Bergrivier Saldanha Bay Swartland
2011
2012
2013
2014
2015

Page 98 of 236
Matzikama’s population will in 2017 largely consist of younger generations which could potentially increase the Municipality’s dependency ratio. It is interesting to note that the population concentration between the age groups 15 –19 and 20 –24 remains relatively the same, indicating that school leavers do not necessarily move out of the area, but are potentially absorbed within the local labour market. As the labour market, largely driven by agricultural activity, is more than ever requiring semi-skilled labour, the up-skilling of such youths should be prioritised to decrease unemployment and to stimulate economic growth.
The literacy rate in Matzikama was recorded at 76.4% in 2011 which is significantly lower than the average literacy rates of the West Coast (79.1 %), Western Cape (87.2 %) the rest of South Africa (80.9 %).
Education plays a key role in the development of an individual as well as a community, and therefore a community with a high number of educated persons is likely to be more developed and more prosperous than one with less educated individuals. Higher levels of education generally lead to higher paying jobs and vice versa.
Source: Socio Economic Profile 2016, Matzikama Municipality
Learner enrolment in Matzikama increased slightly at an annual average growth of 0.8 % between 2013 and 2015, which is an indication that access to education has improved in the Matzikama area and should translate into opportunities for an inclusive society.
Learner-teacher ratio
The learner-teacher ratio within Matzikama remained below 30 in 2012 and increased 2013 and 2014, but increased to 30.2 in 2013 and 38.5 in 2015. According to the Department of Education, the number of learners per teacher was 30.3 in 2010. Factors influencing the learner-teacher ratio are the ability of schools to employ more educators when needed and the ability to collect school fees.

Page 99 of 236
Gr 12 Drop-out rate
The drop-out rate within Matzikama for learners that enrolled from Grade 10 in 2014 to Grade12 in 2016 was recorded at 33 %, which is higher than the average drop-out rate for the District (29.2 %) over the same period. These high levels of high school drop-outs are influenced by a wide array of variables including socio-economic factors such as teenage pregnancies, availability of no-fee schools, indigent households and unemployment.
Source: Socio Economic Profile 2016, Matzikama Municipality
Matzikama’s matric outcomes have remained consistently above 90 % between 2011 and 2015, with the highest pass rate of 93.8 % recorded in 2015.
2.4.3.2 Health
Health care facilities
Source: Socio Economic Profile 2016, Matzikama Municipality
The West Coast District has a range of primary healthcare facilities which includes 26 fixed clinics, 14 mobile/satellite clinics, 1 community day centre and 7 district hospitals.
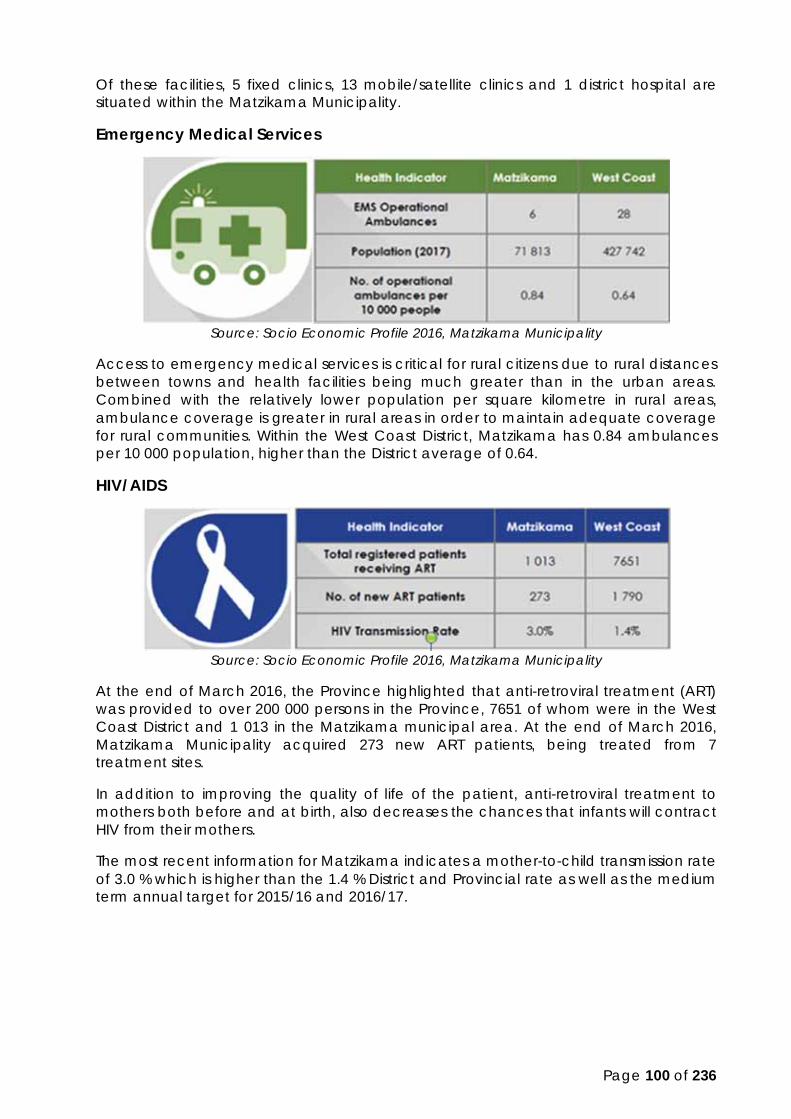
Page 100 of 236
Of these facilities, 5 fixed clinics, 13 mobile/satellite clinics and 1 district hospital are situated within the Matzikama Municipality.
Emergency Medical Services
Source: Socio Economic Profile 2016, Matzikama Municipality
Access to emergency medical services is critical for rural citizens due to rural distances between towns and health facilities being much greater than in the urban areas. Combined with the relatively lower population per square kilometre in rural areas, ambulance coverage is greater in rural areas in order to maintain adequate coverage for rural communities. Within the West Coast District, Matzikama has 0.84 ambulances per 10 000 population, higher than the District average of 0.64.
HIV/AIDS
Source: Socio Economic Profile 2016, Matzikama Municipality
At the end of March 2016, the Province highlighted that anti-retroviral treatment (ART) was provided to over 200 000 persons in the Province, 7651 of whom were in the West Coast District and 1 013 in the Matzikama municipal area. At the end of March 2016, Matzikama Municipality acquired 273 new ART patients, being treated from 7 treatment sites.
In addition to improving the quality of life of the patient, anti-retroviral treatment to mothers both before and at birth, also decreases the chances that infants will contract HIV from their mothers.
The most recent information for Matzikama indicates a mother-to-child transmission rate of 3.0 % which is higher than the 1.4 % District and Provincial rate as well as the medium term annual target for 2015/16 and 2016/17.

Page 101 of 236
Tuberculosis
Source: Socio Economic Profile 2016, Matzikama Municipality
The number of TB patients in the West Coast District increased over the past few years, reaching 3 806 in 2015/16 treated at 76 clinics or treatment sites. In the Matzikama municipal area, patient load has shown a slight increase in the last year. Most recent information shows a patient load of 958 with treatment administered from 20clinics or treatment sites.
Child health
Source: Socio Economic Profile 2016, Matzikama Municipality
In 2016, the full immunisation coverage rate for the West Coast was 81.7 %. In Matzikama it was lower at 78.9 %, showing a slight improvement over the 2014 rate.
The number of malnourished children under five years in the West Coast District in 2016 was 2.3 per100 000. Matzikama’s rate is currently at 0.5.
The District’s neonatal mortality rate (3.6) is well below the Province’s 2019 target of 6.0 per 1000 live births. Matzikama’s neonatal mortality rate is high at 10.5. This has also increased from its 2014 rate of 8.9.
In the West Coast District, 14 % of babies were born underweight. At 18 %, Matzikama’s rate is currently higher than the Provincial average of 14.5 %.

Page 102 of 236
Maternal health
Source: Socio Economic Profile 2016, Matzikama Municipality
Maternal mortality rate: Matzikama Municipality’s most recent figures show a maternal mortality ratio of 202.6 per 100 000 live births compared to the District’s ratio 70.7. The Province has a maternal mortality ratio target of 65 by 2019.
Births to teenage mothers: In the 2015/16 financial year, the delivery rate to women under 18years in the West Coast was 8.0%. Matzikama’s rate at 7.8 % is lower than the District rate.
Termination of pregnancy: Matzikama’s termination of pregnancy rate of 0.3 % per 1000 live births is on par with the District’s 0.3 %.
Overall, the indicators for child and maternal health have improved in the last year which reflects that Matzikama is doing well in achieving the provincial health targets. A concern however is with regards to the neonatal mortality rate which has increased in the last year and is far higher than the provincial target.
2.4.3.3 Safety and security
Murder
Source: Socio Economic Profile 2016, Matzikama Municipality
The murder rate per 100 000 people in Matzikama decreased by 4.1 % from 44 reported cases in 2015 to 42 in 2016.Although the number of murders in the broader West Coast District decreased from 33 in 2015 to 32 in 2016, it remains relatively high.
Sexual crimes
Source: Socio Economic Profile 2016, Matzikama Municipality
The number of sexual related offences decreased notably within the broader West Coast region from 147 reported cases in 2015 to 132 in 2016. This equates to a 9.7per

Page 103 of 236
cent decrease. The number of reported sexual offences in Matzikama over the same period remained unchanged at 170 cases. The total number of offences per 100 000 population in Matzikama for 2016 remains significantly above the District average.
Drug related
Source: Socio Economic Profile 2016, Matzikama Municipality
Drug-related crimes – possession, manufacturing, distribution of illegal substances (including alcohol-related transgressions) – are a major concern throughout the West Coast District. The drug-related crime rate per 100 000 people in the District however remained relatively unchanged between 2015 and 2016. Inversely, the number of reported cases per 100 000 in Matzikama decreased from 968 in 2015 to 887 in 2016 which equates to 8.4% change. Incidences of sexual offences within Matzikama in 2016 (887) are however still considerably lower than the District total of 1 313.
Driving under the influence of alcohol
Source: Socio Economic Profile 2016, Matzikama Municipality
There has been a notable decrease in the number of reported cases per 100 000 people of driving under the influence of either alcohol or drugs throughout the West Coast District to the extent of 6.1% between 2015 (119 cases) and 2016 (112). This decrease can amongst other factors be attributed to visible policing strategies and projects. DUI occurrences however increased considerably in Matzikama from 123 reported cases per 100 000 people in 2015 to 134 in 2016 (9.2 % increase).
Residential burglaries
Source: Socio Economic Profile 2016, Matzikama Municipality

Page 104 of 236
Given its regular occurrence and the psychological impact on victims, residential burglaries are an obstinate concern in South Africa. It is therefore of great concern that the number of burglaries per 100 000 people in the broader West Coast District increased by 7.4 % from 2015 to 2016. Reported incidence in Matzikama ever so slightly decreased from 539 in 2015 to 537 in 2016, equating to a -0.4 % change.
2.4.3.4 Poverty
Poverty tends to be prevalent in areas where the majority of households fall within the low income bracket.
The number of poor people within the Matzikama municipal area decreased from 3.4 % of the population in 2011 to 0.8 % in 2016. The decreasing poverty headcount is positive as it translates to less strain on municipal resources.
Area Poverty Headcount (Percentage)
Poverty Intensity (Percentage)
2011 2016 2011 2016 Matzikama 3.4 0.8 42.4 42.5 West Coast District 2.0 2.9 41.9 44.5 Western Cape 3.6 2.7 42.6 40.1
Source: Socio Economic Profile 2016, Matzikama Municipality
The intensity of poverty, i.e. the proportion of poor people that are below the poverty line within the Matzikama municipal area, increased marginally from 42.4 % in 2011 to 42.5% in 2016. This percentage is still high and should be moving towards zero as income of more households within the Matzikama municipal area moves away from the poverty line.
In the following table poverty is measured in terms of money available to be spent per person per day
POVERTY No income persons R3.41 per person
per day R23 per person per
day R28 per person per
day 5 755 7 090 23 162 33 340
The table above reveals average income per household based on an average of 3.9 persons per household.
The red shaded area represents more than 85.3% of the households with an average annual income of R52 802 or R42.88 per person per day. The green shaded area represents 14.7% of the households with an average annual income of R547 738 or R445 per person per day.
Household income

Page 105 of 236
Source: Socio Economic Profile 2016, Matzikama Municipality
Approximately 55.4 % of households in Matzikama fall within the low income bracket, of which 8.1 % have no income. A sustained increase in economic growth within the Matzikama municipal area is needed if the 2030 NDP income target of R110 000 per person, per annum is to be achieved.
Indigent households:
Area 2014 2015 Change Matzikama 2 374 2 281 -93 West Coast District 19 194 22 083 2 889 Western Cape 413 259 360 238 -53 021
Source: Socio Economic Profile 2016, Matzikama Municipality
The Matzikama municipal area experienced a decrease in the number of indigents between 2014 and 2015, which implies a reduced burden on municipal resources.
2.4.3.5 Unemployment
The unemployment rate for Matzikama according to Census 2011 is 14% with Youth unemployment rate at 19.3%. The current unemployment rate for the 2015/2016 financial year is:
Economic active people 15% Working population (approximately) 29%
2.4.3.6 Broadband
As broadband penetration is an official Western Cape Government (WCG) Game Changer, the Province has a broadband vision that by 2030, every citizen in every town and village will have access to affordable high speed broadband infrastructure and services, will have the necessary skills to be able to effectively utilise this infrastructure and is actively using broadband in their day to day lives. Striving towards this vision, the WCG aims to by 2020 improve business competiveness and the livelihoods of citizens through various broadband initiatives. This 2020 objective includes the goal of increasing internet penetration in the Province to 70 %. The WCG has allocated R1.6billion towards this Game Changer across the 2016 MTEF.

Page 106 of 236
One such initiative entails the establishment of a Wi-Fi hotspot at a provincial government building (schools, libraries, clinics, community centres and other public facilities) in each ward of each local municipality across the Province. These hotspots will allow limited access (250MB per month) to each user, as well as to allow free of charge access to all gov.za websites. Although there are currently no WCG Wi-Fi hotspots within the Matzikama region, a hotspot will be installed in all of the Municipality’s 8 wards by 1 March 2018.
2.5 ENVIRONMENTAL MANAGEMENT
Strategic objectives
Objectives are designed within the milieu of Municipal government objectives as set out in section 152(1) of the Constitution referring to the objective “To promote a safe and healthy environment” including the Principles of the National Environmental Management Act (NEMA) and the Bill of Rights as stated in the Constitution. Government’s commitment to long-term sustainable development is achieved, when explicit recognition is given in its policy-making processes that its economic systems are essentially products of and dependent on social systems, which in turn are products or, and dependent on, natural systems. Effective management of the interdependencies between ecosystem health, social equity and economic growth will further require a significant change in current governance practices, in adopting an integrated and co-operative environmental management approach to governance that includes an accurate valuation of environmental goods and services. Environmental management further aims to ensure that ecosystem services and biodiversity are protected and maintained for equitable use by future human generations, and also, maintains ecosystem integrity as an end in itself by taking into consideration ethical, economic, and scientific (ecological) variables. Environmental management tries to identify the factors that have a stake in the conflicts that may rise between meeting the needs and protecting the environment.
2.5.1 Biodiversity
A Bioregional Planning approach forms the basis of the current spatial planning in the West Coast District (Ninham Shand, 2006). Bioregional Planning refers to land use planning and management that promotes sustainable development. The Knersvlakte Bioregion (Matzikama Local Municipality) and the CWCBR (Swartland and Saldanha Bay Municipalities) are the first important planning initiatives in this regard in the West Coast District (Ninham Shand, 2006).
Vegetation in Matzikama Municipal area
Namaqualand Strandveld is the predominant vegetation type along the coastline of the Matzikama Local Municipality. It has been identified as having a conservation status as Least Threatened. Vegetation of the Arid Estuarine Salt Marshes is found along the edges of the Olifants River Estuary of which 85% of the original extend of this vegation type remains.
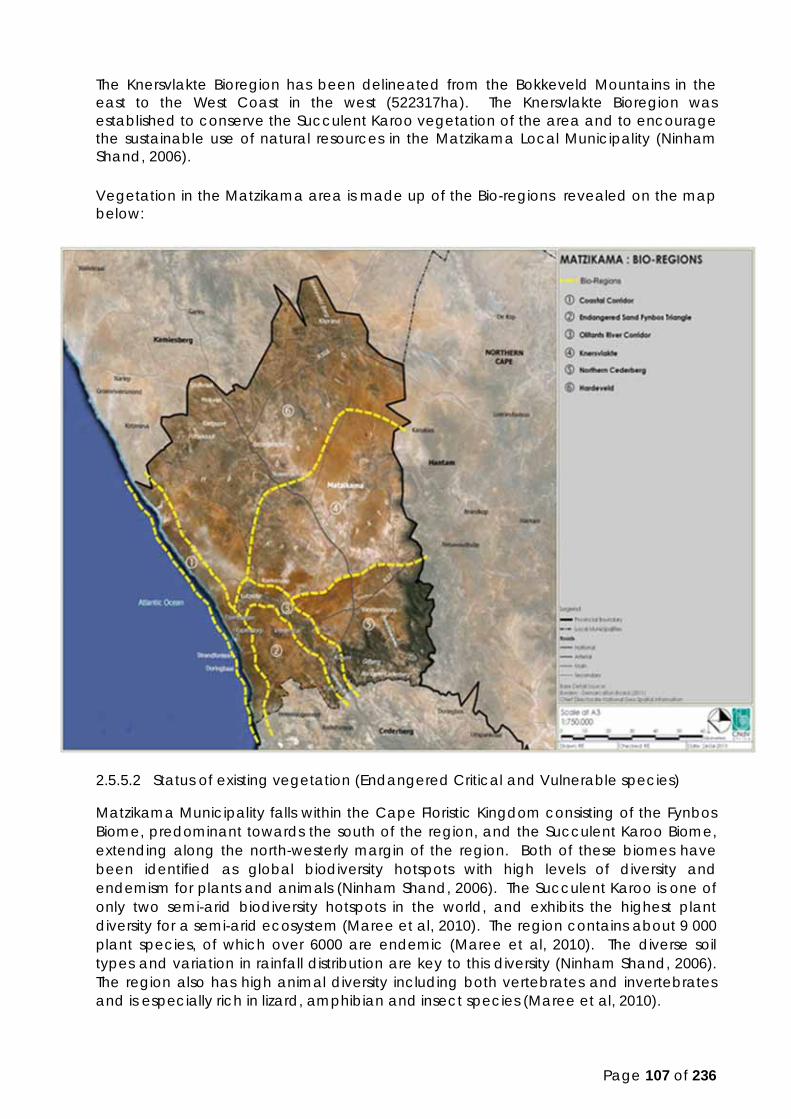
Page 107 of 236
The Knersvlakte Bioregion has been delineated from the Bokkeveld Mountains in the east to the West Coast in the west (522317ha). The Knersvlakte Bioregion was established to conserve the Succulent Karoo vegetation of the area and to encourage the sustainable use of natural resources in the Matzikama Local Municipality (Ninham Shand, 2006). Vegetation in the Matzikama area is made up of the Bio-regions revealed on the map below:
2.5.5.2 Status of existing vegetation (Endangered Critical and Vulnerable species)
Matzikama Municipality falls within the Cape Floristic Kingdom consisting of the Fynbos Biome, predominant towards the south of the region, and the Succulent Karoo Biome, extending along the north-westerly margin of the region. Both of these biomes have been identified as global biodiversity hotspots with high levels of diversity and endemism for plants and animals (Ninham Shand, 2006). The Succulent Karoo is one of only two semi-arid biodiversity hotspots in the world, and exhibits the highest plant diversity for a semi-arid ecosystem (Maree et al, 2010). The region contains about 9 000 plant species, of which over 6000 are endemic (Maree et al, 2010). The diverse soil types and variation in rainfall distribution are key to this diversity (Ninham Shand, 2006). The region also has high animal diversity including both vertebrates and invertebrates and is especially rich in lizard, amphibian and insect species (Maree et al, 2010).

Page 108 of 236
According to the Biodiversity Sector Plans (Maree et al, 2010), the most prominent Special Habitats occurring within the area include coastal forests, rocky outcrops along the coast, wetland mosaics, inselbergs (isolated mountain peaks) and rocky coastal gorges. Many of these ecosystems are also considered threatened (Vulnerable, Endangered or Critically Endangered) as a result of extensive loss and degradation of natural habitat.
Existing Conservation Areas & Priority Areas
Knersvlakte Maintenance Project:
Cape Nature compiled an Annual Plan of Operation (APO) for the Knersvlakte Nature reserve for the next 5 years. Through this process a total number of 17 people from the Vanrhynsdorp are appointed for the completion of the work as planned.
Olifants River Estuary Conservation Area:
The Olifants River estuary is identified as one of the most important estuaries in the Western Cape. An Olifants River Estuary Advisory Forum was established through the management plan compiled by consultants through Cape Nature. This forum is active and is represented by a number of people namely, Governmental organisation, Matzikama and West Coast District municipalities and other NGO’s which included the Ebenhaezer and Papendorp communities (Ebenhaezer Community Property Association) and Fisherman.
Through the Integrated Coastal Management Act, the local municipalities are responsible for the management of estuaries. The Olifants River estuary Forum has regular meetings where the implementation/project and concern are discussed.
With the support of all the role-players Cape Nature is in the process of requesting the National Department of Public Works to transfer the “Eiland” and Water body to the Department of Environmental Affairs and Development Planning (DEADP) for managing by Cape Nature and the municipalities in the form of “Co-management”.
This project will create work opportunities in the Papendorp community and needs to be on the IDP for the next 5 years.

Page
109
of 2
36

Page 110 of 236
Aquatic Systems and special habitats
Olifants River Estuary
The Olifants Estuary at Papendorp has been classified as the fourth most important South African Estuary in terms of Estuarine Conservation. The estuary is permanently open, thereby creating a unique ecosystem for birds, fish and botanical importance. The Olifants Estuary is 36 km long to the low water bridge of Lutzville. Birds and Fish: With a high diversity of habitats including significant areas of salt marsh the estuary is host to 38 fish species of which 12 endemic and 6 species are entirely estuarine dependent. 12 Species of fish utilize the Estuary at some stage of their Life Cycle making this an important habitat for west coast fish. More than 200 coastal and estuarine bird species have been recorded in the region of the Olifants Estuary (86 species of estuarine water birds), of which 11 species of red data. The Estuary has been recorded to support more than 15 000 individual birds; species include lesser and Greater Flamingos, African Marsh Harrier, Black Oystercatcher, Black Oystercatcher, Caspian and Swift Terns. Damara Tern can be found occasionally, significant numbers of Harlaubs Gull, Curlew Sandpiper and South African Shelduck. The area boasts important breeding sites for Cape Cormorants and Sift Terns. Salt Marsh vegetation is highly threatened by antropogenic impacts and this has knock on effects on the rest of the estuary functional zone. The Olifants Estuary has the largest supratidal and floodplain salt marshes in SA. More importantly they are still in very good shape and are the only good representative of salt marshes along the West Coast. Abalone The Matzikama Municipality, with the support of the Provincial Department of Agriculture, Department of Economic Development and Tourism, Western Cape Aquaculture Development Initiative and TRONOX a local mining company, through the social and labour plan program of the Department Mineral Resources, launched this successfully established local economic development intervention on the 13the of November 2014. The first black-owned Abalone farm of South Africa with 55% black owned equity is located in Doring Bay, one of the fishing villages on the West Coast. The significance of this LED intervention by the Municipality extends far beyond creating jobs and relieving people from poverty. The intervention, which has the potential to eradicate poverty completely in Doring Bay and surrounding villages, laid the foundation for the development of the full value chain of Aquaculture and in particular the Abalone subsector, which in turn will contribute significantly to the diversification of the specialized economy of Matzikama Municipality. Currently the project has created a total of 50 full time permanent jobs and is still growing.
2.5.2 The Coastal Zone
Matzikama Integrated Coastal Management Plan
The National Environmental Management Integrated Coastal Management Act No 24 of 2008 (NEM:ICMA) specifies a number of responsibilities for local and district municipalities, provincial and national government regarding the sustainable development and management of the coastal environment in South Africa. In response to these requirements, the West Coast District Municipality (WCDM) appointed SRK Consulting to develop an Integrated Coastal Management

Page 111 of 236
Programme (ICMP) for its area of jurisdiction including the Local Municipalities of Swartland, Saldanha Bay, Bergrivier, Cederberg and Matzikama. Matzikama Municipality is currently in the process of adapting the above Mentioned document as their Coastal Management Strategy. Alignment with National and Regional initiatives The Minister for Local Government, Environmental Affairs and Development
Planning in the Western Cape, adopted the Western Cape Coastal Management Programme (WC CMP) in accordance with the National Environmental Management: Integrated Coastal management Act (Act No. 24 of 2008).
Relevant informative letters has been tabled to District as well as Local Municipalities. The WC CMP provides for a five year strategy programme for coastal management for the Western Cape Government. It is a transversal initiative which will be implemented through partnerships between all sectors of government and other stakeholders.
The relative documents are available electronically at https://www.westerncape.gov.za/eadp/your-resourcelibrary/policies-guidelines.
The Municipality plans to budget for Coastal Management out of “state grants” or external funding to be sourced as budget constraints is upholding the implementation of Coastal and Estuary Management.
Olifants River Estuary Management Plan
The South African National Estuarine Management Protocol (the Protocol), promulgated in May 2013 under the National Environmental Management: Integrated Coastal Management Act (Act No. 24 of 2008, as amended 20141) (ICM Act), sets out the minimum requirements for individual Estuarine Management Plans (EMPs). In 2013/2014, a review was conducted by the National Department of Environmental Affairs: Oceans and Coasts (DEA: O&C) (DEA, 2014) on the existing management plans to ensure, inter alia, the alignment of these plans with the Protocol. This revision of the Draft Olifants River Estuarine Management Plan (EMP), including the Situation Assessment Report and the Management Plan itself, is in response to the comments received during the review process only, to ensure compliance with the minimum requirements for estuarine management plans as per the Protocol. In summary, this entailed: · Including socio-economic information in the Situation Assessment; · Updating the terminology as per the Protocol; · Including a summary of the Situation Assessment; · Including a map of geographical boundaries based on the Estuarine Functional
Zone; · Updating the management objectives and activities to include those related to
management of living resources; · Extending the monitoring plan to explicitly include a performance monitoring plan
to gauge progress towards achieving EMP objectives (i.e. using performance indicators)
· Including description of institutional capacity and arrangements to manage elements of EMP provided as per the Protocol.
Page 112 of 236
The work of the original authors and input received from stakeholders remains largely unchanged. This revision does not represent, or replace, the full five-year review process required to re-evaluate the applicability of the plan and to provide new information. This process is therefore still required. Nonetheless, this EMP must be considered a living document that should be regularly updated and amended as deemed necessary. The Responsible Management Authority in the case of the Olifants River EMP is the Matzikama Local Municipality who will be responsible for drafting the EMP and for ensuring coordination for implementing the EMP. The “shared responsibility” entails that each organ of state implement their respective mandates derived from the Constitution. By implication the municipality will only be responsible for budgeting in respect of the functions that they already are performing. Finances for the implementation and budget of the Olifants River Estuary Management Plan would be a shared responsibility between all the different departments according to their different mandates allocated to them as well as the Management Authority (Local Municipality) who will be the and the Implementing agent to play a coordination role. The plan has to be revised every 5 years and the municipality will have to give feedback on the implementation thereof every 2 years. Cape Nature is currently in negotiations with Public Works to transfer / put a management agreement in place regarding a part of Farm 269 from which the protected area at the Olifants River Mouth forms part of. All stakeholders including the Community, Fishermen, Municipality and Cape Nature are in support of a stewardship Nature Reserve status that has been suggested by Cape Nature. If all goes according to plan this could be the 1st Community Conservation area in South Africa in co-arrangement between Cape Nature, the Community and Matzikama Municipality. Reprint: Moneys was received for a reprint of 2000 brochures of the Olifants River Estuary brochure. Cape Nature (represented by Elbé Cloete) and OEAF (represented by Suzanne du Plessis) is registered on the Matzikama IDP Forum as Stakeholders to give input on Coastal / Estuarine / Environmental matters.
The next step in the process of managing the listed public launch sites (PLS) is the development of operational plans for each PLS; to give effect to regulation 3(3) of the Public Launch Site regulations; bearing in mind that each operational plan must make provision for the MEC’s considerations as contemplated in regulation 2(2) of the PLS regulations. To assist with the development of operational plans, the department have developed a framework plan for the following purposes (see attached): to serve as a guideline which can be adapted to site specific conditions of your launch sites; to encourage further input into the document which can improve its quality so that the process of developing the plans are a collaborative effort. The framework operational plan was also being distributed to DAFF for their input, as well as SAMSA and any other affected organs of state or organisations for further input.
Matzikama Municipality has 3 gazetted slipways which needs Management/ Operational Plans. 1. Strandfontein at the Café 2. Doring Bay Harbor 3. Papendorp
The Municipality is currently liaising with the Department to develop these plans.

Page 113 of 236
Coastal Setback Lines
The Western Cape Department of Environmental Affairs and Development Planning (DEA&DP) regards the establishment and adoption of both the coastal management lines; the EIA development setback lines as well as the designation of coastal access land as high priority issues for the provincial government of the Western Cape. To ensure effective planning and policy instruments and direct utilisation of the coast and its resources they need to provide guidance to our stakeholders.
One mechanism that will assist the Department in achieving this is the establishment of the coastal management line (CML) in terms of the National Environmental Management: Integrated Coastal Management Act, 2008 (Act No. 24 of 2008, “ICM Act”). The Department, as the provincial lead authority in terms of the ICM Act has embarked on a process to establish coastal management lines along the provincial coastline. The technical delineation of the coastal management line for the West Coast and the Overberg District municipal areas as well as the City of Cape Town has already been conducted. The delineation of the coastal management line for the Eden District aims to complete this process for the province.
The ICM Act facilitates the integrated management of the coast and necessitates consultation between relevant organs of state and all interested and affected parties before establishing such a coastal management line(s). Once established in the Provincial Gazette, it will then be the responsibility of the local municipalities to ensure that they delineate the coastal management line(s) on a map or maps that form part of the municipal zoning scheme and municipal planning in general in order to enable the public to determine the position of the coastal management line(s) in relation to existing cadastral boundaries.
The DEA&DP is currently in a process to share the draft coastal management lines with all coastal stakeholders and providing opportunities to discuss the implications for government in terms of the implementation thereof. Matzikama Municipality is currently through its planning department participating in the above mentioned engagements through workshops.
Coastal Access Points
Coastal Access Strategy and Plan
The National Environmental Management: Integrated Coastal Management Act, 2008 (Act No. 24 of 2008) requires each coastal metro and district municipality, to, within four years of the commencement of the Act; make a by-law that designates land for coastal access.
The Western Cape Government has commissioned the development of a provincial coastal access strategy and plan, in line with the National Coastal Access Strategy, which will reflect the situation in the Western Cape with specific reference to concerns, conflicts and opportunities which prevail in the province.
The Directorate: Biodiversity and Coastal Management are currently busy engaging with delegates of local and district coastal municipalities to participate in the development of a provincial coastal access strategy.
Objectives of the engagements are to:
Identify common challenges to planning and management of coastal access;
Page 114 of 236
Provide a forum to discuss conflicts in coastal access and possible solutions Provide a platform for municipalities to input to the development of the
provincial strategy and plan
Matzikama Municipality is currently participating in the above mentioned engagements through workshops.
State of the Coast report
EOH Coastal and Environmental Services Consulting was appointed to undertake a State of the Coast report for the Western Cape and develop a system for monitoring and reporting on the State of the Coast. The State of the Coast report will slot into the State of the Environment report of which the stakeholder engagement will take place in Sept/Oct 2017.
The State of the Coast report will include a website for viewing up-to-date indicator information will be made available to the public. It will be be used as a monitoring and evaluation tool for setting up systems and protocols that will enable government to continuously update indicator information and Evaluate data in order to achieve proactive management along the Western Cape Coastline.
2.5.3 Air Quality Management
Matzikama Municipality adopted the Air Quality Management Plan in 2012 which was developed by the West Coast District Municipality. The National Environmental Management Air Quality Act 39 of 2004 requires municipalities to introduce Air Quality Management Plans that set out what will be done to achieve the prescribed air quality standards.
Strategic Goals and Objectives
Implementing the Air Quality Management Plan within the Municipality Assigning clear responsibilities and functions for air quality management at both
district and local levels Air quality training of current and future air quality personnel at both district and
local levels Obtaining the necessary resources and funding for air quality management Preliminary monitoring of identified „hotspot‟ areas in the municipality to
determine air pollutant concentrations Undertaking continuous ambient air quality monitoring to obtain a long term
record of air quality in the municipality Maintaining good air quality within the boundaries of the Local Municipality Compliance monitoring and enforcement of air quality legislation, policies and
regulations in the Local Municipality Assessing the contribution of agriculture to ambient air quality and establishing
measures to control emissions from these sources.
Threats and challenges
The Municipality do not experience any challenges with respect to air quality currently.
The air pollution function in the Matzikama Municipal area is executed in terms of a Service Level Agreement with the West Coast District Municipality (WCDM). The main function is to regulate the listed activities licenced in terms of the National Environmental Management: Air Quality Act, 2004 (Act 39 of 2004). These activities

Page 115 of 236
include major industries such as steel manufacturing, cement manufacturing, handling and export of iron ore in bulk, fishmeal production, galvanizing, crude oil storage, clay brick manufacturing, lime processes, waste incineration, etc. Two of these activities namely, clay brick manufacturing and lime processes, are located in the Municipal Area. The air quality levels on pollution in our area are within the legislative requirements.
A communication platform with industry, the West Coast Air Quality Working Group chaired by die WCDM has been established. The Municipality attends the quarterly meetings and report on the listed activities in a specific agreed upon format. The minutes of these meetings are distributed to all that include the Provincial Government and all the local municipalities in the West Coast District.
Air Quality Management Plan
According to the abovementioned Act, Municipalities must compile Air Quality Management Plans that set out what will be done to achieve the prescribed air quality standards. Our plan forms part of the Municipality’s IDP. The WCDM appointed external expertise to draft the plans and by-laws for all the municipalities within the West Coast District.
2.5.4 Waste Treatment and Waste Disposal
This topic includes: Waste Management (Refuse Collections, Waste Disposal, Street Cleaning and Recycling)
To minimise the financial burden on residents, the implementation of the Waste Management Plan was postponed and we utilised the EPWP program and Youth Jobs in Waste as alternatives for waste minimisation. Through the EPWP programme and DEA/Tedcor, 90 Job opportunities were created for the cleansing of streets and public spaces. This alternative was funded externally and a saving of ±R2,5 million was realised for the Municipality.
Discussions will be continued with the applicable role-layers to build a recycle plant in 2016/2-17 as it will be too expensive to transfer all our waste that can be recycled to Cape Town where the industries are located.
From waste management to integrated waste management
There is a shortage of available landfill airspace across the Province. The recovery of waste material for the waste economy is only at 9 per cent. It is paramount to move away from the landfill bias to integrated waste management. To achieve this, more integrated waste management infrastructure is urgently needed. This will increase the recovery of waste material and thereby save landfill airspace, promote the waste economy, reduce the environmental impacts of waste management and create jobs. A mind shift also is needed from municipalities to move away from seeing waste just as a nuisance and risk to realise the intrinsic value of waste and to utilise the potential value of it.
Recycling
The Matzikama Municipality, with the support of the West Coast District Municipality and three local mining companies including TRONOX, Cawood Salts and Transhex, through the social and labour plan program of the Department Mineral Resources (DMR) launched this successfully established local economic development intervention on the 14th of November 2014 in Vanrhynsdorp. This intervention
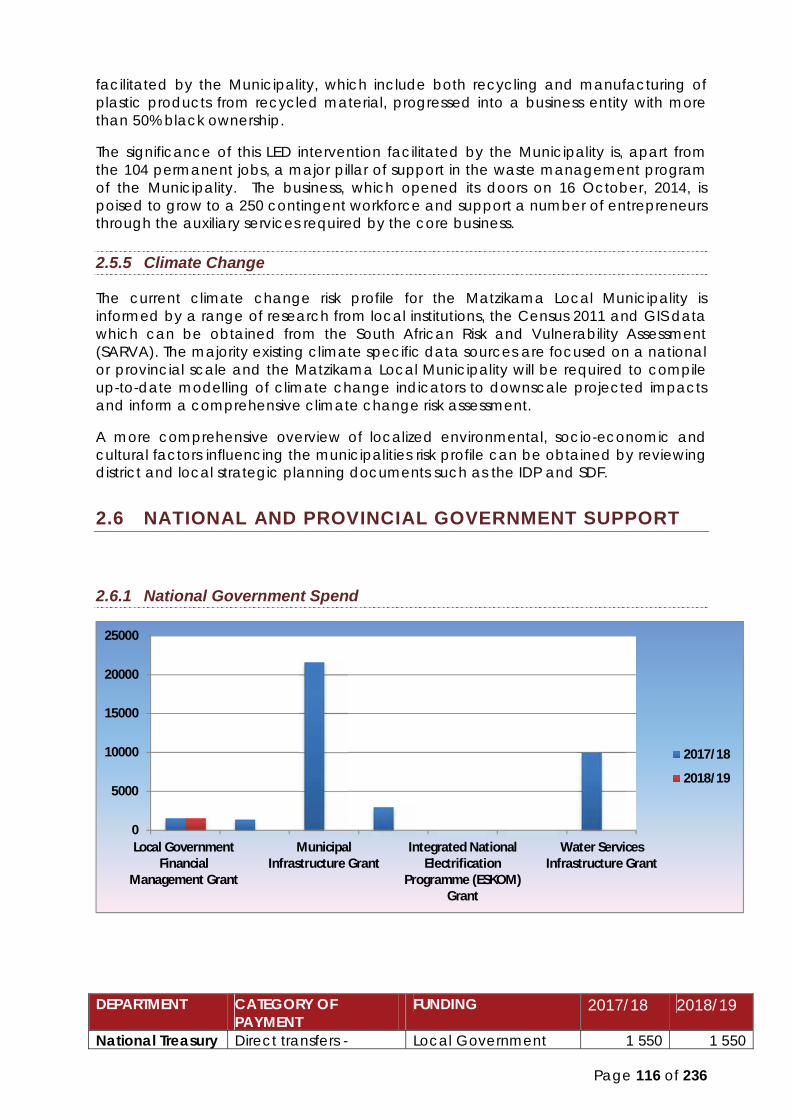
Page 116 of 236
facilitated by the Municipality, which include both recycling and manufacturing of plastic products from recycled material, progressed into a business entity with more than 50% black ownership.
The significance of this LED intervention facilitated by the Municipality is, apart from the 104 permanent jobs, a major pillar of support in the waste management program of the Municipality. The business, which opened its doors on 16 October, 2014, is poised to grow to a 250 contingent workforce and support a number of entrepreneurs through the auxiliary services required by the core business.
2.5.5 Climate Change
The current climate change risk profile for the Matzikama Local Municipality is informed by a range of research from local institutions, the Census 2011 and GIS data which can be obtained from the South African Risk and Vulnerability Assessment (SARVA). The majority existing climate specific data sources are focused on a national or provincial scale and the Matzikama Local Municipality will be required to compile up-to-date modelling of climate change indicators to downscale projected impacts and inform a comprehensive climate change risk assessment.
A more comprehensive overview of localized environmental, socio-economic and cultural factors influencing the municipalities risk profile can be obtained by reviewing district and local strategic planning documents such as the IDP and SDF.
2.6 NATIONAL AND PROVINCIAL GOVERNMENT SUPPORT
2.6.1 National Government Spend
DEPARTMENT CATEGORY OF PAYMENT
FUNDING 2017/18 2018/19
National Treasury Direct transfers - Local Government 1 550 1 550
0
5000
10000
15000
20000
25000
Local GovernmentFinancial
Management Grant
MunicipalInfrastructure Grant
Integrated NationalElectrification
Programme (ESKOM)Grant
Water ServicesInfrastructure Grant
2017/18
2018/19

Page 117 of 236
capacity building and other current transfers
Financial Management Grant
Public Works Direct transfers - capacity building and other current transfers
Expanded Public Works Programme Integrated Grant for Municipalities
1 406 0
Cooperative Governance and Traditional Affairs
Direct transfers - infrastructure
Municipal Infrastructure Grant
21 614 0
Energy Direct transfers - infrastructure
Integrated National Electrification Programme (Municipal) Grant
3 000 0
Indirect transfers - infrastructure
Integrated National Electrification Programme (ESKOM) Grant
0 0
Water and Sanitation
Indirect transfers - infrastructure
Regional Bulk Infrastructure Grant
0 0
Water Services Infrastructure Grant
10 000 0
2.6.2 Provincial Government Spend
Estimated Public Expenditure on Infrastructure over the MTEF 2017/20 For Matzikama Municipality, a total of 10 infrastructure projects are planned by Provincial Departments for the MTEF period 2017/18 to 2019/20, as set out in more detail below. It should be noted that the infrastructure projects and related capital projects are in various different stages of implementation, with some being in the planning phase, others in implementation with construction happening, and some are in the process of being finalized and therefore in the ‘close-out’ phase. The information may be subject to change, depending on fiscal constraints and the availability of resources. The summary of infrastructure and capital related projects, as classified in the Estimates of Provincial Revenue and Expenditure (EPRE 2017) are as follows: i. The Department of Transport and Public Works have 7 infrastructure and/or
capital expenditure projects listed over the MTEF for implementation with a budgeted allocation value of R72.7 million over the period 2017/18 to 2019/20. All 7 projects are classified to achieve ‘Economic Affairs’ outcomes – in other words, investment aims to support economic outcomes. The nature of the projects includes refurbishments, upgrades and rehabilitations; and
ii. The Department of Health listed 2 infrastructure and/or capital expenditure projects in the planning phase or including investment in technology with the total value of budgetary allocations over the MTEF to the tune of R50’000. The projects aim to achieve ‘Health’ outcomes. No new infrastructure is planned for the MTEF period.

Page 118 of 236
iii. The Department of Social Development aims to support 1 project in the ECD sector over the MTEF, and budgetary provision is included over the MTEF to the tune of R73’000. The project aims to achieve outcomes in the ‘Social Protection’ domain.
The specific projects listed in the Budget EPRE 2017 as per WC Government: PT Budget Estimates of Provincial Revenue and Expenditure, 2017 are as follows:
Number of Infrastructure Projects
Project Name Type of Project Economic Classification [e.g. outcome focus areas]
Western Cape: Department of Transport and Public Works [7 Projects]
C832 Vanrhynsdorp regravel C991 Vredendal-Vanrhynsdorp reseal C834.2 Lutzville C991 PRMG Vredendal-Vanrhynsdorp reseal C830 Bitterfontein regravel C834.3 Lutzville C834.4 Lutzville
Refurbishment and rehabilitation Refurbishment and rehabilitation Upgrades and additions Refurbishment and rehabilitation Refurbishment and rehabilitation Upgrades and additions Upgrades and additions
Economic affairs Economic affairs Economic affairs Economic affairs Economic affairs Economic affairs Economic affairs
Western Cape: Department of Health [2 Projects]
CI810097: Vredendal - Vredendal North Clinic - Upgrade and Additions CH830070: Vredendal - Vredendal Hospital - HT - Upgrade
PHC - Clinic Health Technology
Health Health
Western Cape: Department of Social Development [1 Project]
Wielie Walie Educare Centre – maintenance and repairs ECD Centre Social protection

Page 119 of 236
Department Planned & est imated
expenditure
Health
R 50, 000
Socia l Development
R 73, 000
Transpor t & Public Works
R72 700, 000
Grand total R72 823, 000

Page 120 of 236
2.7 MATZIKAMA WARDS
Matzikama Municipality’s jurisdiction traverses a geographical space equal to 12900 km2. The Municipality is made up of eight wards; ward eight is the largest in terms of geographical space and the most sparsely populated. Ward four is the smallest in terms of geographical space but one of the most densely populated.

Page 121 of 236
2.7.1 Ward 1
Ward Councillor: Mariana Carosini
The map below indicates the location of Ward One in the Matzikama municipal area in relation to the other seven wards. Ward One consists of two towns/villages including Lutzville and Lutzville-West.
Lutzville developed from a farm established in 1923 and is located 48km west from Vanrhynsdorp on the West Coast Tourism Route.
Apart from the many farming activities in the area tourism has the potential to add to the economic base of the local economy and is linked to the wine industry, annual agriculture expo, annual wild flower season and its location on the West Coast Tourism Route. The town accommodates a large number of the workers employed by TRONOX Namakwa Sands as well as agricultural workers employed by the surrounding farms hence the low unemployment rate relative to the unemployment rate in the other areas.
The map below is a representation of the town Lutzville and the village Lutzville-West.

Page 122 of 236
Lutzville is home to two primary schools and one high school of the WCED. In terms of other services the town is home to a police station of SAPS, a clinic of the DOH, MOD centre and library of the DCAS. On the other hand, the community of Lutzville-West does not have access to any government services.

Page 123 of 236
2.7.2 Ward 2
Ward Councillor: Amelia Job
The map below indicates the location of Ward Two in the Matzikama municipal area in relation to the other seven wards. Ward two consists of four towns/villages. Two of the towns namely Papendorp and Ebenaeser are located adjacent to the Olifants River and the other two namely Doring Bay and Strandfontein are located on the coast. The Ward is home to 787 households. Ward Two along with wards five and eight occupies a section of the Matzikama coastline.
Papendorp and Ebenaeser function as residential settlements with very few economic activities apart from government services, farm labourers and subsistence farming activities. The villages are located on the banks of the Olifants River and play an important role in protecting the sensitive eco system of the Olifants River. These two villages developed from a mission station founded by the Rynse Church in 1831. Doring Bay is located on the coastline, 80 km west of Vanrhynsdorp and 20 km north of Lamberts Bay, making it ideal for tourism and aquaculture development. Both aquaculture and tourism has huge potential and can play an important role in mitigating unemployment caused by the decline of the fishing industry. Strandfontein has been a holiday resort and retirement village since its existence. The town recorded a relatively high ranking in terms of its resources and development potential. Out of the 131 towns situated in the Western Cape Province, Strandfontein was ranked 28th in terms of composite development potential and 2nd in terms of composite resource potential. The town is located on the coast line 5 km

Page 124 of 236
north of Doring Bay and 75 km west of Vanrhynsdorp. The town draws many tourists and holiday makers annually and has become more sought after than ever before.
The Map below is a representation of the four towns located in the ward.
In terms of Government services the Ward is home to two schools of the WCED, one police station of the SAPS, two satellite clinics (Doring Bay and Ebenaeser

Page 125 of 236
2.7.3 Ward 3
Ward Councillor: Anna Links
The map below indicates the location of Ward Three in the Matzikama municipal area in relation to the other seven wards
The ward is one of three wards located in Vredendal and is home to more than 2000 households. Ward Three is one of three wards that are located in Vredendal. The Ward is also surrounded by a number of wine farms to the west
Vredendal is by far the largest town in the area and is also centrally located rendering it the logical economic and administrative centre. The town is located 24 km east of Vanrhynsdorp on the West Coast Tourism Route and 300 north of Cape Town.
The red lines on the map below indicate the boundaries of Ward Three

Page 126 of 236
Despite being the largest of the three wards in terms of the number of households and the fact that an additional 2000 houses are being planned for the ward no Government services are located in the ward apart from a primary school of the WCED. The ward has no health services and people are required to walk as much 2km to access these services. The ward is also furthest away from the police station despite the high crime rates in the area. Library services, essential to the school going child, is one to two kilometres away from the ward.

Page 127 of 236
2.7.4 Ward 4
Ward Councillor: Willem Loff
The map below indicates the location of Ward Four in the Matzikama municipal area in relation to the other seven wards. Ward FOUR is one three wards that are located in Vredendal. The Ward is also surrounded by a number of wine farms to the west.
Vredendal is by far the largest town in the area and is also centrally located rendering it the logical economic and administrative centre. The town is located 24 km east of Vanrhynsdorp on the West Coast Tourism Route and 300 north of Cape Town.
The red lines on the map below indicate the boundaries of Ward Three.
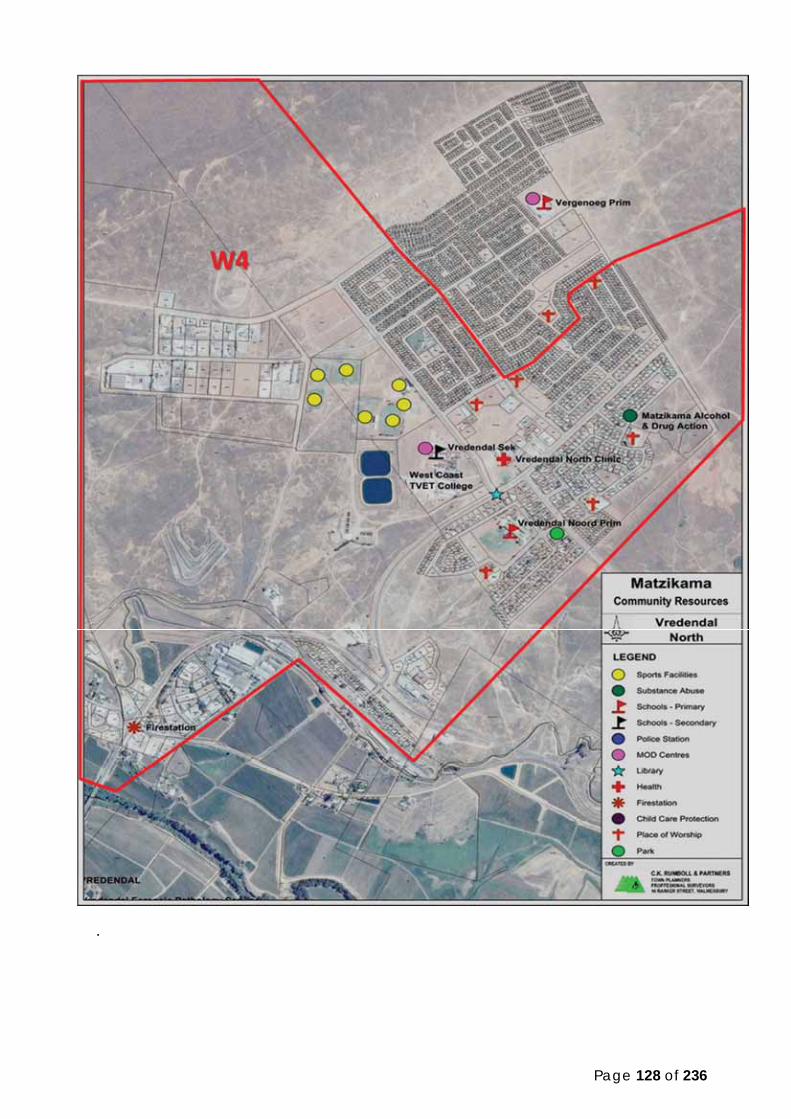
Page 128 of 236
.

Page 129 of 236
2.7.5 Ward 5
Ward Councillor: Kallie Louw (Speaker)
The map below indicates the location of Ward Five in the Matzikama municipal area in relation to the other seven wards. Ward Five is one three wards that are located in Vredendal. The Ward is also surrounded by a number of wine farms.
Vredendal is by far the largest town in the area and is also centrally located rendering it the logical economic and administrative centre. The town is located 24 km east of Vanrhynsdorp on the West Coast Tourism Route and 300 km north of Cape Town.
The map below is a representation of ward five, one of three wards located in Vredendal.

Page
130
of 2
36
In te
rms
of G
over
nmen
t ser
vice
s th
e w
ard
is h
ome
to a
sta
te h
ospi
tal &
com
mun
ity c
linic
of t
he D
OH,
a fi
re s
tatio
n of
the
WC
DM
, a
prim
ary
& h
igh
scho
ol o
f the
WC
ED, a
n EM
S st
atio
n of
the
DO
H, a
libr
ary
of th
e D
CA
S an
d a
pol
ice
stat
ion
of th
e SA
PS.

Page 131 of 236
2.7.6 Ward 6
Ward Councillor: Robbie Nutt
The map below indicates the location of Ward Six in the Matzikama municipal area in relation to the other seven wards. As with ward seven, Ward six consists of only one town, Klawer, and surrounding farms.
The town is located 22 km south of Vanrhynsdorp on the Cape/Namibia tourism route and developed from a railway line between Cape Town and Bitterfontein. Since the reduction in rail transport the agriculture sector and services industry continued to sustain the economy of Klawer. Klawer is surrounded by many farms and attracts a large number of tourists to the area, especially during the flower season of the year.
The map below is a representation of Klawer in ward Six.

Page 132 of 236
In terms of Government services, Klawer is home to two primary schools of the WCED, police station of the SAPS, library of the DCAS and a clinic of the DOH.

Page 133 of 236
2.7.7 Ward 7
Ward Councillor: Andreas Sindyamba (Deputy Mayor)
The map below indicates the location of Ward Seven in the Matzikama municipal area in relation to the other seven wards. Unlike some of the other wards, Ward Seven consists of only one town, Vanrhynsdorp, and surrounding farms.
Vanrhynsdorp is the most southern and oldest town in Namaqualand. It exists since 1661. The town is also the gate way to the Western Cape, Upington, Johannesburg, Namibia, Vredendal and the coastal towns. Vanrhynsdorp is located 300km north of Cape Town on the intersection to Cape Namibia, Namakwari and West Coast Karoo tourism routes. The economic base comprises the service and agriculture industries.

Page 134 of 236
The map above is a representation of the north eastern section of the ward, commonly known as Maskamsig. In terms of government services, the area is home to one primary school of the WCED, community clinic of the DOH and a MOD centre and library of the DCAS
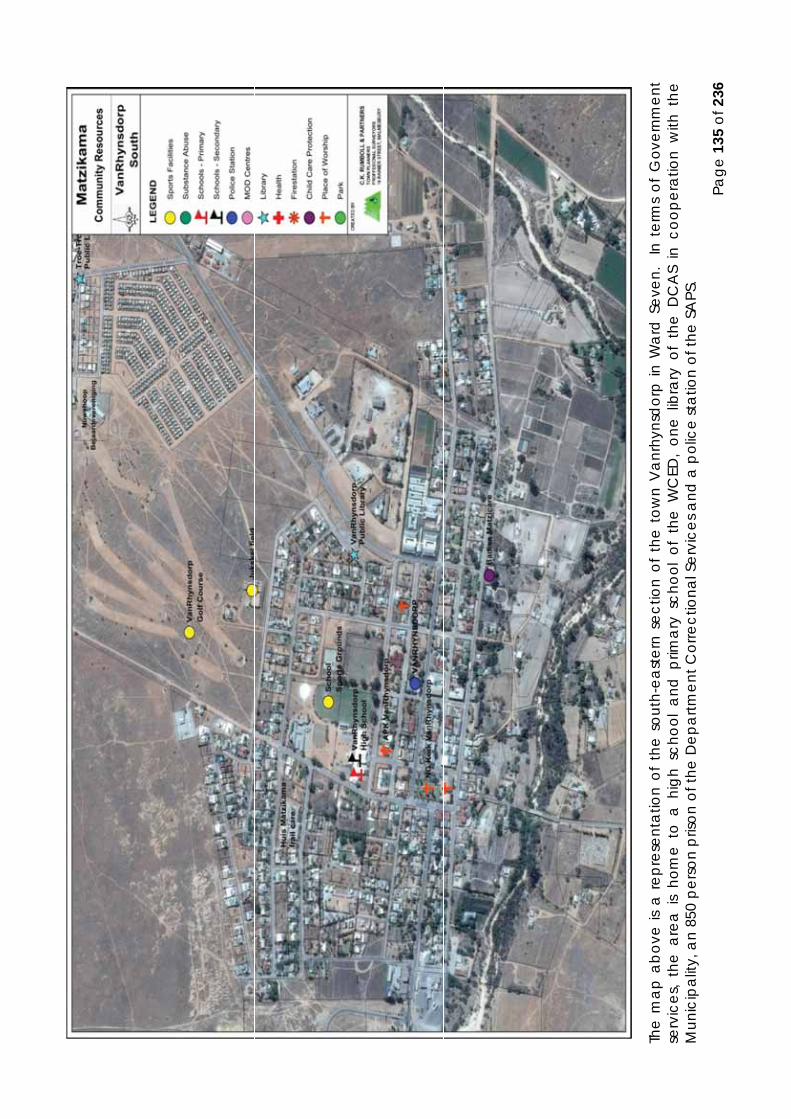
Page
135
of 2
36
The
map
abo
ve is
a r
epre
sent
atio
n of
the
sou
th-e
aste
rn s
ectio
n of
the
tow
n V
anrh
ynsd
orp
in W
ard
Sev
en.
In t
erm
s of
Gov
ernm
ent
serv
ices
, th
e ar
ea i
s ho
me
to a
hig
h sc
hool
and
prim
ary
scho
ol o
f th
e W
CED
, on
e lib
rary
of
the
DC
AS
in c
oope
ratio
n w
ith t
he
Mun
icip
ality
, an
850
pers
on p
rison
of t
he D
epar
tmen
t Cor
rect
iona
l Ser
vice
s and
a p
olic
e st
atio
n of
the
SAPS
.

Page 136 of 236
2.7.8 Ward 8
Ward Councillor: Mario Cloete
The map below indicates the location of Ward eight in the Matzikama municipal area in relation to the other seven wards. The ward comprises 8 towns/villages and also occupies the biggest geographical space in the municipal area.
The area of roughly 8000 km2 with a population of just over 7000 people consists of 8 different towns/villages including Kliprand, Bitterfontein, Nuwerus, Molsvlei, Stofkraal, Rietpoort , Put-se-Kloof and Koekenaap. Apart from livestock farming, a small retail sector and a few government services no other major economic activity exists in the area. The area is basically a residential area with most of the population being unemployed. As a result of the insignificant economy most of the employed people in the area are forced to work away from home.
The map below is a representation of the eight towns/villages that made up the Ward.

Page 137 of 236
It can be seen from the map above that the towns/villages are small settlement areas with very few government services, especially when comparing to the rest of the municipal area. The area, which previously formed part of the West Coast District

Page 138 of 236
managed area (WCDMA), is an arid environment and home to the poorest of people in the municipal area. In terms of government services the area is home to six primary schools of the WCED, two police stations of the SAPS, one MOD centre in Bitterfontein of the DCAS and four clinics of the DOH.
2.8 GOVERNMENT - STRATEGIC DIRECTION
2.8.1 National Government
Twelve National Outcomes
Improved quality of basic education. A long and healthy life for all South Africans. All people in South Africa are and feel safe. Decent employment through inclusive economic growth. A skilled and capable workforce to support an inclusive growth path. An efficient, competitive and responsive economic infrastructure network. Vibrant, equitable and sustainable rural communities with food security for all. Sustainable human settlements and improved quality of household life. A responsive, accountable, effective and efficient local government system. Environmental assets and natural resources that is well protected and
continually enhanced. Create a better South Africa and contribute to a better and safer Africa and
World. An efficient, effective and development oriented public service and an
empowered, fair and inclusive citizenship.
National Development Plan 2030
The overarching national development agenda to facilitate the transition to the AU Agenda 2063 and sustainable development goals (SDGs) is the NDP Vision 2030. Nationally, all of government must work to realise the objectives of the National
Development Plan (NDP 2030). The NDP defines the destination the country wants to be at in 2030 and also identifies the roles different sectors of society need to play in reaching that goal. The Plan aims to ensure that all South Africans attain a decent standard of living through the elimination of poverty and reduction of inequality. The core elements of a decent standard of living identified in the Plan are:
Housing, water, electricity and sanitation; Safe and reliable public transport; Quality education and skills development; Safety and security; Quality health care; Social protection; Employment; Recreation and leisure; Clean environment; and Adequate nutrition.

Page 139 of 236
2.8.2 Municipal support initiatives:
DEA&DP alignment/involvement with municipal support initiatives in the three spheres of Government are indicated below:
2.8.2.1 The Environmental Sector Local Government Support Strategy (LGSS)
The LGSS is a National Support Environmental Programme Co-ordinated by the Department of Environmental Affairs which allows for consistency and synergy in approach with provinces on local government environmental support programmes. In July 2009, a Local Government Indaba on Environment was held to discuss broader issues relating to environmental sustainability within municipalities. Some of the outcomes of the Local Government Indaba included:
National, Provincial and Local Government should act on a common set of environmental sector priorities to ensure maximum impact and collective implementation and municipalities are the most appropriate sphere to ensure effective service delivery in ensuring implementation at a local level.
The three categories of municipalities have different environmental management responsibilities and functions, it is imperative to ensure that these are implemented in the most integrated manner aligned with both provincial and national priorities and programmes.

Page 140 of 236
Called on National, Provincial and Local Government to act on a common set of environmental sector priorities to ensure maximum impact and collective implementation.
A LGSS was therefore developed by the National Department of Environmental Affairs in February 2014 in response to the Local Government Indaba Outcomes. The objectives of the LGSS are to: Clarify the environmental sector mandate for local government support. Clarify the local government mandate for environmental management. Identify opportunities for streamlining and integrating the support initiatives of the
environment sector with the local government development agenda. Identify gaps in cooperation with the local government sector. Rationalize municipal reporting requirements. Promote consistency and synergy in approach with provinces on local
government support programmes. Maximise the environmental sector’s relations with the South Africa Local
Government Association (“SALGA”), the South African Cities Network (“SACN”) and COGTA as representative organs of local government.
The vision of the LGSS is “environmentally sustainable and climate-change resilient municipalities” and this will be realised through the following goals: Improved environmental governance systems (institutions, finance, legislation,
capacity); Effective integration of sustainability into all policies, planning and decision-
making; Sustainable and efficient management and use of natural resources; Green economy; and Climate change response
The LGSS is accompanied by an implementation plan which is compiled annually and contains all the environmental municipal support projects/programmes being undertaken in each Province. Each Province must report against the implementation plan every quarter by providing their progress with respect to each municipal support project being undertaken, as well as by providing an indication of the challenges experienced and the corrective measures identified. The DEA&DP has been actively involved in the development of the DEA LGSS Implementation Plan, and timeously supplies quarterly progress updates to the DEA. The DEA&DP is also represented on the National Local Government Support Forum (LGSF). The Local Government Support Forum was established to promote consistency with regards to consultation with provinces on local government programmes, promote synergy, and alignment and co-ordination between local government initiatives within DEA and other national and provincial departments as well as implement and report on the LGSS. The LGSF is held every quarter and Municipalities are represented on the forum. 2.2.2.2 Back 2 Basics
The B2B is a National Support Programme Co-ordinated by the Department of Co-operative Governance and Department of Local Government (WC). Matzikama Municipality is one of ten (10) B2B municipalities identified for support in terms of ‘getting the basics right’.

Page 141 of 236
Various programmes have been introduced to improve the performance of local government based on the understanding that if the basics as prescribed by laws governing local government, are performed well, higher levels of performance would be realised.
Building on these, the Back to Basics programme (B2B), was launched in September 2014, based on a foundation of doing the basics right:
• Putting people first: listening and communicating. • Adequate and community-oriented service provision. • Good governance and transparent administration. • Sound financial management and accounting. • Robust institutions with skilled and capable staff.
The B2B Programme has three priorities: Get all municipalities out of the not doing well state (No municipality should be
below the middle path). Support municipalities in the middle path to progress to the top path and to stay
there. Support and incentivize municipalities on the top path to remain there.
The Back to Basics was launched in the Western Cape on 16 March 2015. In the Western Cape, the Local Government Turnaround Strategy (LGTAS) programme was replaced by the B2B Programme. A Western Cape B2B Task Team has been established, with COGTA being the national coordinator, and the Western Cape Department of Local Government (“DoLG”) being the main Provincial partner. B2B Steering Committee Meetings are also held every quarter with each of the Municipalities and relevant Sector departments. In as far as the B2B support to be given to a Municipality relates to the functional areas for which DEA&DP is responsible, DEA&DP has also been supporting COGTA and DoLG with the roll-out of the B2B Programme in the Western Cape.

Page
142
of 2
36

Page 143 of 236
2.8.3 Provincial Government
The Western Cape Government has identified the following five Strategic Goals to deliver on its vision and to help realise the objectives of the NDP over its five-year term:
2.8.3.1 The Integrated Performance and Support System (IPSS)
The IPSS is a Provincial Support Programme Co-ordinated by the Department of Local Government which aims to create a single platform to combine municipal support initiatives of the various sector departments in order to eliminate duplication and ensure integration between Departments in the Western Cape. The DoLG: MS has been tasked with providing a “single window of coordination” in terms of municipal support in the Western Cape. The DDF acts as DEA&DP’s contact point for the DoLG: MS. Support needs identified by the DoLG: MS are reported to the DDF, who then communicates it to the relevant components within DEA&DP, and facilitates and monitors progress in terms of the requested support. The DoLG identified that there is a lack of a single or consolidated model within the Province to categorise municipalities in terms of their current level of functioning and service delivery. This model will yield a comprehensive, individual support plan, which will be designed to address the specific support requirements of each municipality. In addition, through this process, all the support to be potentially provided by the different sector departments will also be combined and pooled to ensure single application and combined impact. The process of categorising municipalities and having a combined approach to providing support will facilitate a process to benchmark municipalities and have a sustained impact on their service delivery ability and sustainability. The IPSS will therefore create a single platform to combine support initiatives of the various sector departments in order to eliminate duplication and ensure integration between departments. In terms of the proposed model, each municipality in the province will be evaluated and categorized based on their performance and compliance to a set of pre-determined indicators, underpinned by Key Performance

Page 144 of 236
Areas (KPA’s), that cut across all levels of functioning and service delivery in a municipality. The outcome of this categorisation process will then plot each municipality in one of the phases that describe their level of maturity, functioning and service delivery and which will ultimately determine the content and extent of their own individualised support plan. These support plans will contain input and support initiatives from all sector departments and other support partners. Once these support plans are developed, DEA&DPs own support plans will align with them. As a sector department, the DEA&DP has been actively involved in the development of the model and has developed Key Performance Indicators (KPIs) for the KPAs that relate directly to its legal mandate. The municipality has identified officials who will be responsible to report on KPIs for each KPA on a quarterly basis on the system. A training session was held in this regard during February 2017 by the DoLG: MS at the municipality. The DEA&DP will continue to be involved with the development of the model and with the monitoring and evaluation of each municipality’s performance with respect to its KPIs and support plans. 2.8.3.2 SALGA Workgroups
In terms of the coordination of municipal support and capacity building, SALGA is one of the key partners of DEA&DP. SALGA’s Work Groups are used as key platforms to support and capacitate municipalities and DEA&DP therefore has formal representatives on the following SALGA Work Groups: Economic Development, Planning and Environment; Municipal Infrastructure Services (Climate Change, Environmental Affairs and
Sustainability; Municipal Trading Services and Municipal Infrastructure Planning); Municipal Finance; Community Development; Human Resource Development and Collective Bargaining; and Governance and Intergovernmental Relations
c. Joint Planning Interventions
During October 2014, the Western Cape Government embarked on a Joint Planning Initiative (JPI) with all its Municipalities which resulted in a set of priorities to be implemented over 5 to 15 years (extending to 2030 in line with the National Development Plan). The focus of this was to ensure that the JPIs are mainstreamed into the Provincial Strategic Plan, the Annual Performance Plans (APPs) and budgets of provincial departments. The focus over the next few years is to ensure that the identified initiatives are prioritised by the departments in partnership with Municipalities. The West Coast District has in total 22 JPIs of which Matzikama Municipality have 4 JPIs. Reporting on the above JPIs is done regularly through the West Coast District Forums within the next 5-year cycle, ensuring further expansion on the JPIs is given effect and challenges are addressed pro-actively.

Page
145
of 2
36
The
tabl
e be
low
dep
icts
the
four
(4) J
PIs t
hat w
ere
disc
usse
d an
d a
gree
d up
on fo
r Mat
zikam
a M
unic
ipal
ity.
JPI O
utco
me/
O
bjec
tive
JP
I Typ
e Pr
opos
ed J
PI p
roje
cts
Lead
De
partm
ent
Supp
ortin
g De
partm
ents
Pr
ogre
ss/C
urre
nt S
tatu
s
Aqu
acul
ture
Ec
onom
ic
Gro
wth
In
itia
tives
1.
DEA
DP
to
ass
ist
Mun
icip
ality
in
fa
st
traci
ng
EIA
a
pplic
atio
n fo
r acc
ess t
o la
nd.
2.
Mun
icip
ality
to
com
ple
te b
usin
ess
plan
sup
porte
d b
y D
OA
and
DED
AT.
3.
C
ompi
latio
n of
A
qua
cultu
re
Plan
fo
r th
e W
est
Coa
st.
4.
Trai
ning
req
uire
d cl
osin
g th
e ga
p b
etw
een
skills
sh
orta
ge a
nd g
row
ing
aqua
cultu
re in
dus
try.
5.
An
entit
y ne
eds
to b
e es
tab
lishe
d to
aid
in
the
ma
nage
men
t of a
qua
cultu
re p
roje
cts.
6.
Iden
tify
ma
rket
and
tran
spor
t op
tions
.
DED
AT
DO
A
DEA
DP
Ma
tzik
am
a M
unic
ipal
ity
WC
DM
DED
AT
indi
cate
d
tha
t th
ey
coul
d
not
fund
a
fea
sibilit
y st
udy
for A
qua
cultu
re; a
nd th
at
PT i
s al
so u
nab
le t
o he
lp a
nd
tha
t po
tent
ial
help
reg
ardi
ng
the
fea
sibilit
y st
udy
is av
aila
ble
from
Op
era
tion
Pakh
isa.
The
m
unic
ipa
lity
rece
ived
R4
70 0
00
from
D
LG
on
21/1
2/20
16
for
the
dev
elop
men
t of
an
A
qua
cultu
re
fea
sibilit
y st
udy
whi
ch
will
supp
lem
ent
the
exist
ing
wor
k co
nduc
ted
by
M
atz
ika
ma
Mun
icip
alit
y in
aid
of
th
e d
evel
opm
ent
of
the
Aq
uacu
lture
se
ctor
, w
hich
in
tu
rn w
ill pr
ovid
e a
sou
nd b
asis
fo
r a
ttra
ctin
g p
riva
te
sect
or
and
gov
ernm
ent i
nves
tmen
t. Yo
uth
Deve
lopm
ent
Educ
atio
n a
nd
Skills
D
evel
opm
ent
1.
Yout
h St
rate
gy
2.
Mun
icip
ality
will
co-o
rdin
ate
you
th d
evel
opm
ent
par
tner
s to
alig
n pr
ojec
ts a
nd p
rogr
am
s. 3.
D
epar
tmen
t of t
he P
rem
ier t
o sp
eed
up
impl
emen
tatio
n of
the
esta
blis
hmen
t of t
he
envi
sage
d Y
outh
Uni
t. 4.
Im
pact
stud
y re
quire
d to
ass
ess w
hat t
he im
pa
ct o
f cu
rrent
pro
gra
ms i
s. 5.
C
omm
unic
atio
n d
rives
to e
nsur
e th
at c
omm
uniti
es
are
aw
are
of w
hat t
he c
urre
nt p
rogr
am
s in
the
mun
icip
alit
y a
re.
DSD
D
oTP
Ma
tzik
am
a M
unic
ipal
ity
Mun
icip
ality
took
not
e of
p
rogr
ess a
nd p
rovi
ded
no
furth
er in
put.
Agr
eem
ent w
as
sub
mitt
ed a
s gre
en.

Page
146
of 2
36
JPI O
utco
me/
O
bjec
tive
JP
I Typ
e Pr
opos
ed J
PI p
roje
cts
Lead
De
partm
ent
Supp
ortin
g De
partm
ents
Pr
ogre
ss/C
urre
nt S
tatu
s
6.
Ince
ntiv
es fo
r com
mun
ities
to e
nsur
e p
artic
ipa
tion
(col
labo
rativ
e in
itia
tive
bet
wee
n th
e m
unic
ipal
ity
and
soci
al c
lust
er d
epar
tmen
ts).
Hous
ing
back
log
Inte
gra
ted
Settl
emen
t D
evel
opm
ent
1.
Upgr
adin
g of
info
rmal
settl
emen
ts
2.
Prov
ide
serv
ice
sites
for n
ew o
wne
rs.
3.
Esta
blish
pa
rtner
ship
with
priv
ate
sect
or a
nd o
ther
st
ake
hold
ers (
e.g.
farm
ow
ners
, fin
anci
al
inst
itutio
ns) t
o a
ssist
with
hou
sing.
4.
Ec
onom
ic d
evel
opm
ent w
ill re
duce
hou
sing
need
a
nd su
ppor
t inf
rast
ruct
ure
req
uire
men
ts.
5.
Prov
ide
rent
al st
ock.
6.
A
vaila
bilit
y of
Lan
d.
7.
Land
rele
ase
stra
tegy
requ
ired
to re
lea
se la
nd
(priv
ate
and
sta
te) f
or se
ttlem
ent d
evel
opm
ent.
8.
Inve
stig
ate
fund
ing
optio
ns to
pur
cha
se la
nd.
9.
Porti
ons o
f dev
elop
men
t con
trib
utio
ns to
be
set
asid
e fo
r la
nd d
evel
opm
ent.
10.
Regi
onal
Ap
pro
ach
.
DH
S M
atz
ika
ma
Mun
icip
ality
D
EAD
P
Mun
icip
ality
to
ok
note
of
p
rogr
ess
and
pro
vid
ed
no
furth
er i
nput
. A
gree
men
t w
as
sub
mitt
ed a
s gre
en.
Infra
stru
ctur
e In
tegr
ate
d Se
ttlem
ent
Dev
elop
men
t
1.
Incr
ease
Cap
aci
ty o
f Ca
nal.
2.
Incr
ease
stor
age
ca
paci
ty fo
r wa
ter (
e.g.
con
stru
ct
raw
wa
ter d
am
). 3.
Pu
rific
atio
n of
trea
ted
sew
age
effl
uent
to
acc
epta
ble
stan
dar
d fo
r agr
icul
tura
l use
. 4.
Im
plem
ent w
ate
r con
serv
atio
n an
d d
eman
d m
ana
gem
ent s
trate
gies
. 5.
W
ate
r Tre
atm
ent P
lant
, Res
ervo
ir &
Ele
ctric
ity.
DLG
: MI
DW
S M
atz
ika
ma
Mun
icip
ality
Mun
icip
ality
to
ok
note
of
p
rogr
ess
and
pro
vid
ed
no
furth
er i
nput
. A
gree
men
t w
as
sub
mitt
ed a
s gre
en.
Page 147 of 236
2.8.3.3 Game Changers
The Western Cape Government furthermore, has selected several priority projects called “Game Changers”, because they have the potential to be catalysts for substantial improvements in people’s lives. Game Changers centre on very particular problems and opportunities that need new and innovative solutions. They are focused initiatives intended to have bold and visible impact of high value for the people and the economy of the Western Cape. The following priority projects were selected:
Broadband and e-learning After school facilities Alcohol harms reduction The Economy: “People and Power” Better Living: addressing the apartheid legacy
2.8.4 West Coast District Municipality
The West Coast District Municipality has identified the following five Strategic Objectives/Goals in order to accomplish their vision over the next five year term (2017/22): 1. To ensure the environmental integrity of the district is improved. 2. To pursue economic growth and the facilitation of job opportunities. 3. To promote the social well–being of residents, communities and targeted social
groups in the district. 4. Promoting bulk infrastructure development services. 5. To ensure good governance and financial viability.
2.8.5 Partnering for development
The Municipality has the following partnerships for development in place:
Initiative/opportunity Partner(s) Recycling of municipal solid waste DTS & CS mSCOA All Departments Revenue enhancement All Department Development of the aquaculture sector DLG, DEDAT, DOA & PT Revenue enhancement DLG & PT Social and Labour Plans Projects DMR Agri Parks DRDLR & DoA Small harbour development DoPW (N) & (P) JPIs DEDAT, DoA, SD, DLG & PT Aquaculture Sector Development Doring bay Abalone, DDT Emerging farmers development ACO

Page
148
of 2
36
NA
TION
AL D
EVEL
OPM
ENT P
LAN
(NDP
) O
BJEC
TIVES
PR
OVI
NC
IAL
STRA
TEG
IC O
BJEC
TIVES
W
EST C
OA
ST D
ISTR
ICT M
UNIC
IPA
LITY
STRA
TEG
IC O
BJEC
TIVES
M
ATZ
IKA
MA
STR
ATE
GIC
OBJ
ECTIV
ES (S
O)
6. B
uild
ing
a ca
pab
le a
nd
dev
elop
men
tal s
tate
4. E
nab
le a
resil
ient
, sus
tain
abl
e,
qua
lity
and
incl
usiv
e liv
ing
envi
ronm
ent
4. P
rom
otin
g bu
lk in
frast
ruct
ure
dev
elop
men
t ser
vice
s. 1.
Pro
vide
mun
icip
al b
asic
serv
ices
to
mee
t dem
ands
of g
row
ing
popu
latio
n an
d de
velo
pmen
t cha
lleng
es
4. F
ocus
ing
on k
ey c
apa
bilit
ies o
f bot
h p
eop
le a
nd th
e co
untry
5. E
mb
ed g
ood
gove
rna
nce
and
inte
gra
ted
serv
ice
del
iver
y th
roug
h p
artn
ersh
ips a
nd sp
atia
l alig
nmen
t.
5. T
o en
sure
goo
d go
vern
anc
e an
d fin
anc
ial v
iabi
lity.
2.
Mai
ntai
n su
ffici
ent r
even
ue so
urce
s to
enab
le th
e m
unic
ipal
ity to
mee
t its
co
nstit
utio
nal o
blig
atio
ns
3. R
aisi
ng e
cono
mic
gro
wth
, p
rom
otin
g ex
por
ts a
nd m
akin
g th
e ec
onom
y m
ore
labo
ur a
bso
rbin
g
1. C
rea
te o
ppor
tuni
ties f
or g
row
th a
nd
job
s 2.
To
pursu
e ec
onom
ic g
row
th a
nd
the
faci
lita
tion
of jo
b op
portu
nitie
s.
3. C
oord
inat
e, fa
cilit
ate
and
stim
ulat
e su
stai
nabl
e ec
onom
ic d
evel
opm
ent
thro
ugh
strat
egy,
pol
icy
and
prog
ram
me
deve
lopm
ent
5. C
apab
ilitie
s inc
lud
e sk
ills,
infra
stru
ctur
e, so
cia
l sec
urity
, stro
ng
inst
itutio
ns a
nd p
artn
ersh
ips b
oth
with
in th
e co
untry
and
with
key
in
tern
atio
nal p
artn
ers
3. I
ncre
ase
wel
lnes
s and
safe
ty, a
nd
tack
le so
cial
ills
3. T
o pr
omot
e th
e so
cial
wel
l–b
eing
of
resid
ents
, com
mun
ities
and
ta
rget
ed so
cial
gro
ups i
n th
e d
istric
t.
4. R
educ
e po
verty
leve
ls as
mea
sure
d by
the
SAM
PI
2. E
ncou
rage
citi
zens
to b
e a
ctiv
e in
th
eir o
wn
dev
elop
men
t, in
st
reng
then
ing
dem
ocra
cy a
nd in
ho
ldin
g th
eir g
over
nmen
t a
ccou
ntab
le
5. E
mb
ed g
ood
gove
rna
nce
and
inte
gra
ted
serv
ice
del
iver
y th
roug
h p
artn
ersh
ips a
nd sp
atia
l alig
nmen
t
3. T
o pr
omot
e th
e so
cial
wel
l–b
eing
of
resid
ents
, com
mun
ities
and
ta
rget
ed so
cial
gro
ups i
n th
e d
istric
t.
5.
Mai
ntai
n su
ffici
ent
orga
niza
tiona
l re
sour
ces,
enha
nce
the
invo
lvem
ent
of th
e pu
blic
in th
e de
velo
pmen
t and
de
cisio
n m
akin
g pr
oces
ses
and
prov
ide
ethi
cal
and
prof
essio
nal
serv
ices
to
supp
ort
the
need
s of
the
co
mm
uniti
es
1. U
nitin
g So
uth
Afri
cans
of a
ll ra
ces
and
cla
sses
aro
und
a c
omm
on
pro
gra
mm
e to
elim
ina
te p
over
ty
and
redu
ce in
equa
lity
7. S
trong
lea
der
ship
thro
ugho
ut
soci
ety
tha
t wor
k to
geth
er to
solv
e ou
r pro
ble
ms
2. I
mpr
ove
educ
atio
n ou
tcom
es a
nd
oppo
rtuni
ties
for y
outh
d
evel
opm
ent
1. C
rea
te o
ppor
tuni
ties f
or g
row
th a
nd
job
s
5. T
o en
sure
goo
d go
vern
anc
e an
d fin
anc
ial v
iabi
lity.
6. P
rovi
de o
ppor
tuni
ties t
o of
ficia
ls an
d co
unci
llors
for t
he d
evel
opm
ent o
f pr
ofes
siona
l and
lead
ersh
ip sk
ills a
nd
enha
nce
empl
oym
ent e
quity
in th
e or
gani
zatio
n
6. B
uild
ing
a ca
pab
le a
nd
dev
elop
men
tal s
tate
1.
To
ensu
re th
e en
viro
nmen
tal
inte
grity
of t
he d
istric
t is i
mp
rove
d.
4. E
nab
le a
resil
ient
, sus
tain
abl
e, q
ualit
y a
nd in
clus
ive
livin
g en
viro
nmen
t
Page 149 of 236
The Chapter provides an analysis of the current situation, as articulated in chapter two of the IDP, thus laying the foundation for problem solving and decision making. The analysis that follows will enable the Council of the Matzikama Municipality to gain a better understanding of their area of jurisdiction, the communities they serve and the role of other spheres of government in their area of jurisdiction.
Divide the municipality into external internal and community
A good strategy - to address the undesirable situation experienced by the citizens of Matzikama Municipality - requires a good understanding of the challenges and obstacles. The Chapter on diagnostics and prognoses provides the reader with information in relation to the identification and understanding of the challenges and obstacles facing the Municipality and its citizens. In order to devise the best and most appropriate strategy to address the undesirable situation identified in the diagnostics section, the Chapter provides the reader with a likely outcome should the Municipality and the other two spheres of Government fail to address the current challenges and obstacles.
The chapter installs the basis for the strategy and consequential interventions to address the underlying problem Council is trying to solve.
(Should address the underlying causes of the problem you’re trying to solve, as well as its symptoms)

Page
150
of 2
36
3.1
Focu
s A
rea:
Loc
al E
cono
mic
Dev
elop
men
t an
d To
uris
m
Po
verty
POVE
RTY
La
ck of
fund
ing
Un
emplo
ymen
t
Avail
able
land/p
lots
Bu
lk se
rvice
s inf
rastr
uctur
e
Migr
ation
La
ck of
fund
ing fo
r NG
Os
No
reha
bilita
tion o
r su
ppor
t pro
gram
s
Sc
hool
drop
outs
Ad
justm
ent o
f lear
ners
from
farms
at S
econ
dary
scho
ols
Le
arne
r Tra
nspo
rt
La
ck of
Stud
y Bur
sarie
s
Unem
ploym
ent
Un
stable
fami
lies
Do
mesti
c viol
ence
Low
mora
le
Scho
ol dr
op ou
ts
Un
stable
fami
lies
Un
safe
envir
onme
nt
Tour
ism
Inv
estm
ents
Di
seas
es
De
aths/
morta
lity
W
ork f
orce
Po
or at
tenda
nce o
f pu
blic m
eetin
gs
Po
or st
akeh
older
inv
olvem
ent
La
ngua
ge B
arrie
rs
Lo
w ca
pacit
y clin
ics
Co
nfide
ntiali
ty at
clinic
s
Over
crowd
ed ho
useh
olds
No
t usin
g tre
atmen
t
Malnu
trition
Ag
ricult
ure s
ector
lar
gest
labou
r pro
vider
Low
salar
y lev
els in
Pr
imar
y Agr
icultu
re
secto
r
HEAL
TH
DISE
ASE
S
SUPP
ORT
VU
LNER
ABL
E G
ROUP
S LA
CK
OF
SKILL
S
LOW
HO
USEH
OLD
IN
CO
ME
LAC
K O
F A
WA
REN
ESS
MA
LNUT
RITIO
N
SUBS
TANC
E A
BUSE
CRI
ME
CAUSE EFFECT

Page
151
of 2
36
Unem
ploy
men
t
UNEM
PLO
YMEN
T
LACK
OF
FUND
ING
Sc
hool
drop
outs
La
ck of
care
er gu
idanc
e at
Seco
ndar
y sch
ool le
vel
La
ck of
inve
stmen
t poli
cy
Hi
gh ta
riffs a
nd ra
tes
No
/affor
dable
servi
ces b
usine
ss
plots
Ins
uffici
ent b
ulk in
frastr
uctur
e
NO
WAT
ER
Ins
uffici
ent s
upply
from
Ca
nal
Ca
pacit
y of D
am
LACK
OF
TOUR
ISM
DISE
ASES
Pres
sure
on H
ealth
servi
ces
Inc
reas
e dep
ende
ncy r
ate
Un
stable
fami
ly
Unsa
fe ne
ighbo
urho
od
Ke
ep in
vesto
rs aw
ay
Re
venu
e for
gone
Low
Mora
le
Ins
uffici
ent s
uppo
rt
No fu
nding
OVER
CON
CENT
RATE
D EC
ONOM
Y
Depe
nden
cy on
Agr
icultu
re
secto
r
Unde
r dev
elope
d se
cond
ary a
gricu
lture
se
ctor
OVER
CROW
DED
HOME
S
Dis f
uncti
onal
familie
s
Socia
l cha
lleng
es
Di
seas
es
LAC
K O
F SK
ILLS
SH
ORT
AGE
OF
ENTR
EPRE
NEU
RS
NO
INVE
STM
ENT
DWIN
DLIN
G
ECO
NOM
Y
GRA
NT D
EPEN
DEN
CY
MA
LNUT
RITIO
N
CRI
ME
N
O H
OUS
ING
CAUSE EFFECT
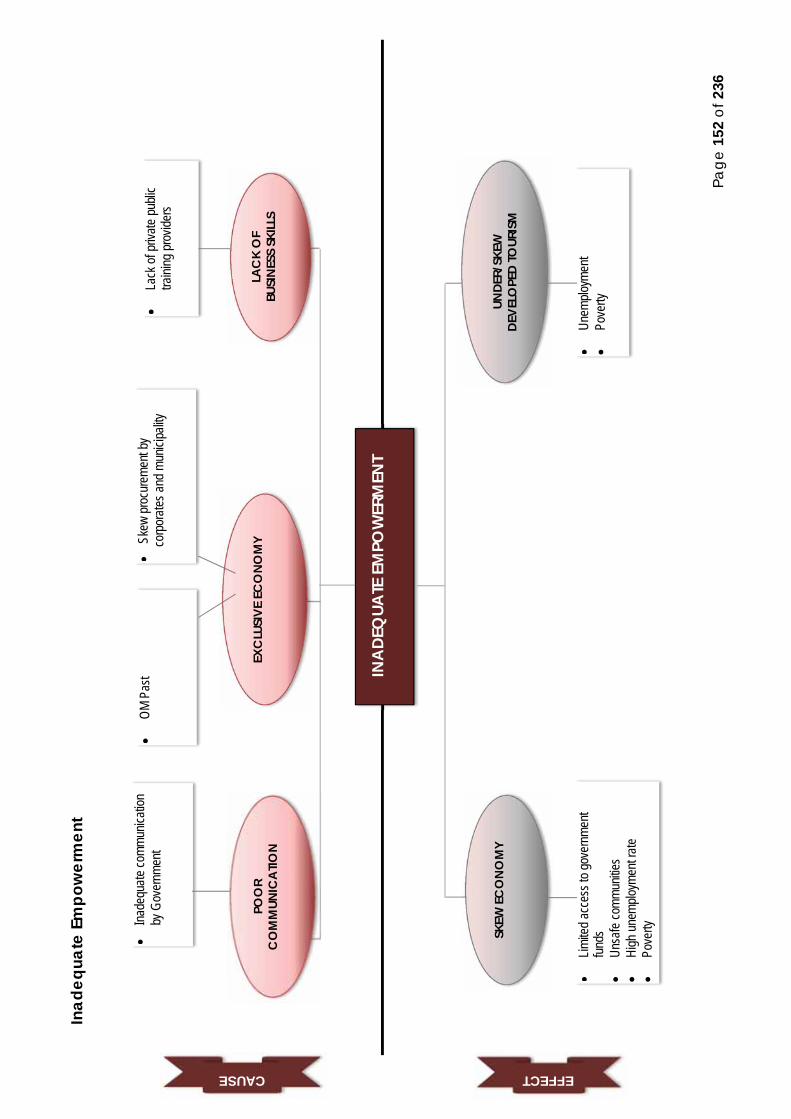
Page
152
of 2
36
Inad
equa
te E
mpo
wer
men
t
INA
DEQ
UATE
EM
POW
ERM
ENT
Ina
dequ
ate co
mmun
icatio
n by
Gov
ernm
ent
OM
Pas
t
Ske
w pr
ocur
emen
t by
corp
orate
s and
mun
icipa
lity
Un
emplo
ymen
t
Pove
rty
Lim
ited a
cces
s to g
over
nmen
t fun
ds
Un
safe
comm
unitie
s
High
unem
ploym
ent r
ate
Po
verty
La
ck of
priva
te pu
blic
traini
ng pr
ovide
rs
POO
R C
OM
MUN
ICA
TION
UNDE
R/SK
EW
DEVE
LOPE
D TO
URIS
M
EXC
LUSI
VE E
CO
NOM
Y
LAC
K O
F BU
SIN
ESS
SKILL
S
SKEW
EC
ON
OM
Y
CAUSE EFFECT

Page
153
of 2
36
3.2
Focu
s A
rea:
Hou
sing
Gap
Hou
sing
GA
P HO
USIN
G
No
budg
et
Stag
natin
g
NO
BUL
K IN
FRAS
TRUC
TURE
CAUSE EFFECT

Page
154
of 2
36
No
serv
iced
site
s fo
r hou
sing
NO
SER
VIC
ED S
ITES
FOR
HOUS
ING
Involv
emen
t OF
DoPW
Pr
ivate
Secto
r invo
lveme
nt
La
ck O
F inv
estm
ent
St
agna
ting e
cono
my
Inc
reas
e of u
nemp
loyme
nt
Pove
rty
Ov
ercro
wded
home
s
No pr
oper
ty av
ailab
le
Di
seas
es
Lo
ss O
F inc
ome
SHO
RTAG
E O
F HO
USIN
G
LAC
K O
F IN
VEST
MEN
T
NO
LAND
AVA
ILABL
E
EXPE
NSI
VE P
ROPE
RTY
LAC
K O
F FU
NDS
CAUSE EFFECT
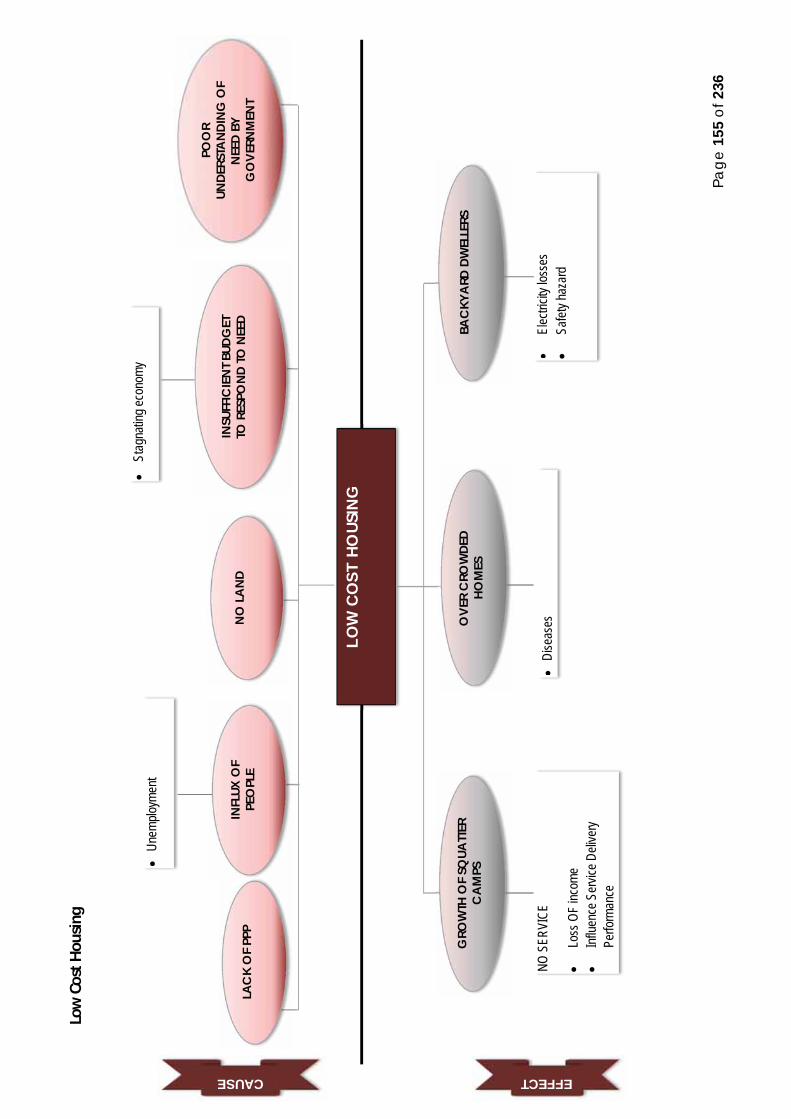
Page
155
of 2
36
Low
Cos
t Hou
sing
LOW
CO
ST H
OUS
ING
S
tagna
ting e
cono
my
Di
seas
es
El
ectric
ity lo
sses
Safet
y haz
ard
NO S
ERVI
CE
Lo
ss O
F inc
ome
Inf
luenc
e Ser
vice D
elive
ry Pe
rform
ance
Un
emplo
ymen
t
LAC
K O
F PP
P
NO
LAND
INSU
FFIC
IEN
T BUD
GET
TO
RES
POND
TO N
EED
POO
R UN
DERS
TAND
ING
OF
NEE
D BY
G
OVE
RNM
ENT
GRO
WTH
OF
SQUA
TTER
C
AM
PS
OVE
R C
ROW
DED
HOM
ES
BAC
KYA
RD D
WEL
LERS
INFL
UX O
F PE
OPL
E
CAUSE EFFECT

Page
156
of 2
36
3.3
Focu
s A
rea:
Soc
ial
Heal
th
HEA
LTH
Un
stable
socie
ty
Vulne
rabil
ity fo
r dise
ases
Scho
ol dr
op ou
ts
Pa
tient
files n
ot se
cure
d
Abse
nces
of di
gital
syste
m
Patie
nt frie
ndly
struc
ture
Ins
uffici
ent m
edica
tion
To
o few
clini
cs
Lo
w ca
pacit
y (sta
ff)
Ins
uffici
ent
infra
struc
ture
Po
or or
ganis
ation
No bu
dget
DISC
HARG
ED
PATIE
NT
TRA
NSPO
RT
CLIN
IC
SERV
ICES
CO
NFI
DEN
TIALIT
Y A
T CLIN
ICS
NEE
D FO
R A
MBU
LANC
E W
AITI
NG R
OO
MS
LANG
UAG
E BA
RRIE
RS
TO F
EW
DOC
TORS
INSU
FFIC
IEN
T IM
MUN
ISA
TION
OF
BABI
ES
INC
REA
SE IN
DI
SEA
SES
DEM
ORA
LISIN
G
HUM
AN
DIG
NITY
LESS
PRO
DUC
TIVE
LABO
UR
PERF
ORM
ANC
E
CAUSE EFFECT

Page
157
of 2
36
No
/ Litt
le Y
outh
Dev
elop
men
t
NO
/LITT
LE Y
OUT
H DE
VELO
PMEN
T
Co
ntact
and P
rope
rty R
elated
Cr
imes
Unsta
ble S
ociet
y
Lack
Of P
artic
ipatio
n in t
he
econ
omic
secto
r
Incre
ase i
n Equ
itable
Sha
re G
rant
Lo
ss O
f Mun
icipa
l Inco
me
St
udy b
ursa
ries
Sc
hool
drop
out
Dr
ug ab
use
No
Bud
get
La
ck of
invo
ice fr
om lo
cal
econ
omy
Ab
senc
e Of Y
outh
Deve
lopme
nt St
rateg
y
No F
undin
g
ABS
ENC
E O
F DE
VELO
PMEN
T C
OO
RDIN
ATO
R LA
CK
OF Y
OUT
H DE
VELO
PMEN
T PO
LICIE
S
SUBS
TAND
ARD
ISED
SC
HOO
LS:
INSU
FFIC
IEN
T SPO
RT
FAC
ILITIE
S
LOW
LEVE
LS O
F ED
UCAT
ION UN
EMPL
OYM
ENT
SU
BSTA
NCE
ABU
SE
TH
REA
THEN
S FU
TURE
EC
ONO
MIC
GRO
WTH
CAUSE EFFECT

Page
158
of 2
36
Educ
atio
n
EDUC
ATIO
N
Po
or pe
rform
ance
- po
or re
sults
for
unive
rsity
entra
nce
Sc
hool
drop
outs
Inade
quate
Tra
nspo
rt Po
licy
Inf
rastr
uctur
e Staf
f
Insuff
icien
t Per
sonn
el Bu
dget
WEA
K ED
UCA
TION
SYST
EM
SAFE
TY O
F LE
ARN
ERS
PO
OR
LEA
RNER
PE
RFO
RMA
NCE
POO
R/ N
O
PARE
NTA
L SUP
PORT
NO
N EX
ISTA
NT
AFT
ER C
ARE
LAC
K O
F BU
RSAR
IES
INSU
FFIC
IEN
T TR
ANS
PORT
OVE
RCRO
WDE
D SC
HOO
LS
MED
IOC
RE
GO
VERN
MEN
T FU
NDE
D SC
HOO
LS
(FA
CILI
TIES)
LOW
LEVE
LS
OF
EDUC
ATIO
N
CAUSE EFFECT

Page
159
of 2
36
3.4
Focu
s A
rea:
Cri
me
Subs
tanc
e ab
use
SUBS
TAN
CE
ABU
SE
No R
ecre
ation
al Inf
rastr
uctur
e
FAS
CHI
LDRE
N
CO
NTA
CT
CRI
MES
M
ISUS
E O
F G
OVE
RNM
ENT
GRA
NTS
DOM
ESTIC
VI
OLE
NCE
SCHO
OL D
ROP
OUT
S
LAC
K O
F RE
CRE
ATIO
NAL
A
CTIV
ITIES
UNEM
PLO
YMEN
T
ILLEG
AL
SHEB
EENS
PEER
PR
ESSU
RE
LAC
K O
F VI
SIBL
E PO
LICIN
G
EASI
LY
AVA
ILABL
E
LOC
ATIO
N O
F LE
GA
L LIQ
UOR
SELL
ERS
IN
RESI
DENT
IAL
ARE
AS
CAUSE EFFECT
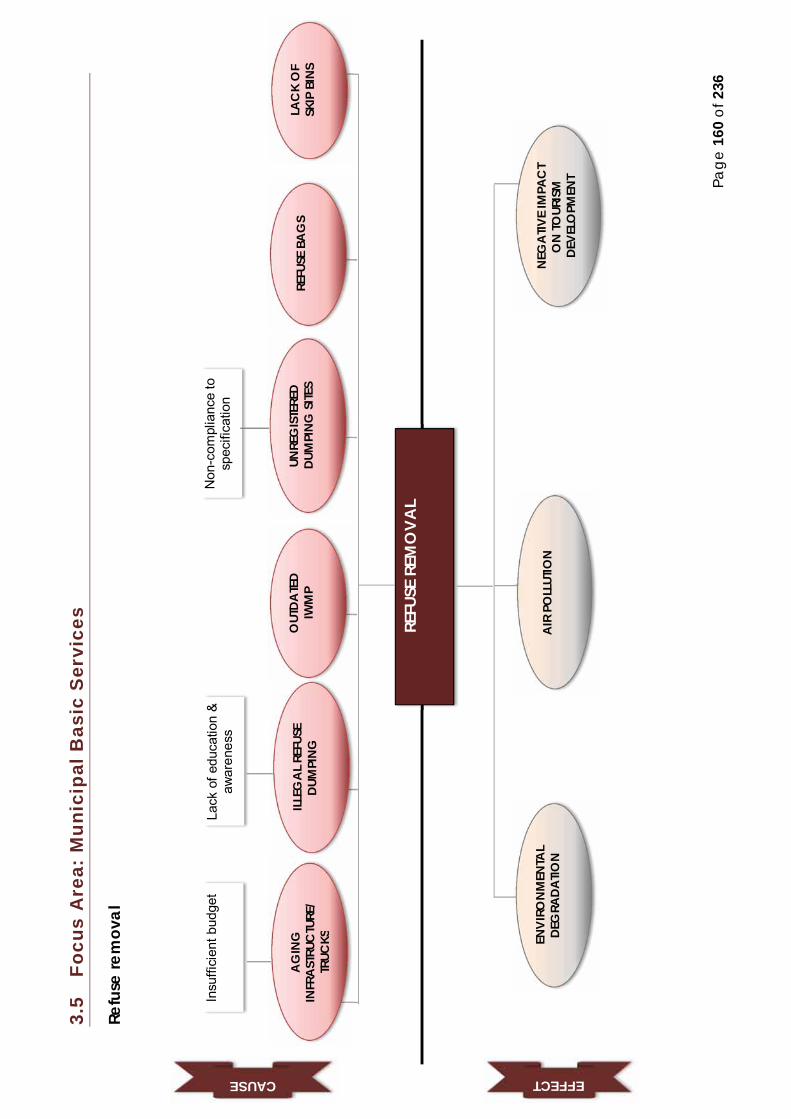
Page
160
of 2
36
3.5
Focu
s A
rea:
Mun
icip
al B
asic
Ser
vice
s
Refu
se re
mov
al
REFU
SE R
EMO
VAL
Insu
ffici
ent b
udge
t La
ck o
f edu
catio
n &
aw
aren
ess
Non
-com
plia
nce
to
spec
ifica
tion
AIR
PO
LLUT
ION
N
EGA
TIVE
IMPA
CT
ON
TOUR
ISM
DE
VELO
PMEN
T
ENVI
RON
MEN
TAL
DEG
RADA
TION
AG
ING
IN
FRAS
TRUC
TURE
/ TR
UCKS
ILLEG
AL R
EFUS
E DU
MPI
NG
UNRE
GIS
TERE
D DU
MPI
NG
SITE
S
OUT
DATE
D IW
MP
REFU
SE B
AG
S
LAC
K O
F SK
IP B
INS
CAUSE EFFECT

Page
161
of 2
36
Infra
stru
ctur
e De
velo
pmen
t
INFR
AST
RUC
TURE
DEV
ELO
PMEN
T
Stag
natin
g eco
nomy
Maint
aining
curre
nt inf
rastr
uctur
e
Incre
ased
unem
ploym
ent
Comm
unity
prote
sts/
unha
ppine
ss
PREV
ENT D
IREC
T IN
VEST
MEN
T
SUB-
STA
NDAR
D SE
RVIC
E
GRO
WIN
G N
EED
FOR
INFR
ASTU
CTU
RE
DEVE
LOPM
ENT I
N RU
RAL T
OW
NS
INSU
FFIC
IEN
T O
WN
FUND
S
INAD
EQUA
TE
MIG
FUN
DS
INAD
EQUA
TE
GO
VERN
MEN
T FI
NA
NCIA
L SU
PPO
RT
NO
MA
STER
IN
FRAS
TUC
TURE
PL
AN
NO
BUD
GET
CAUSE EFFECT
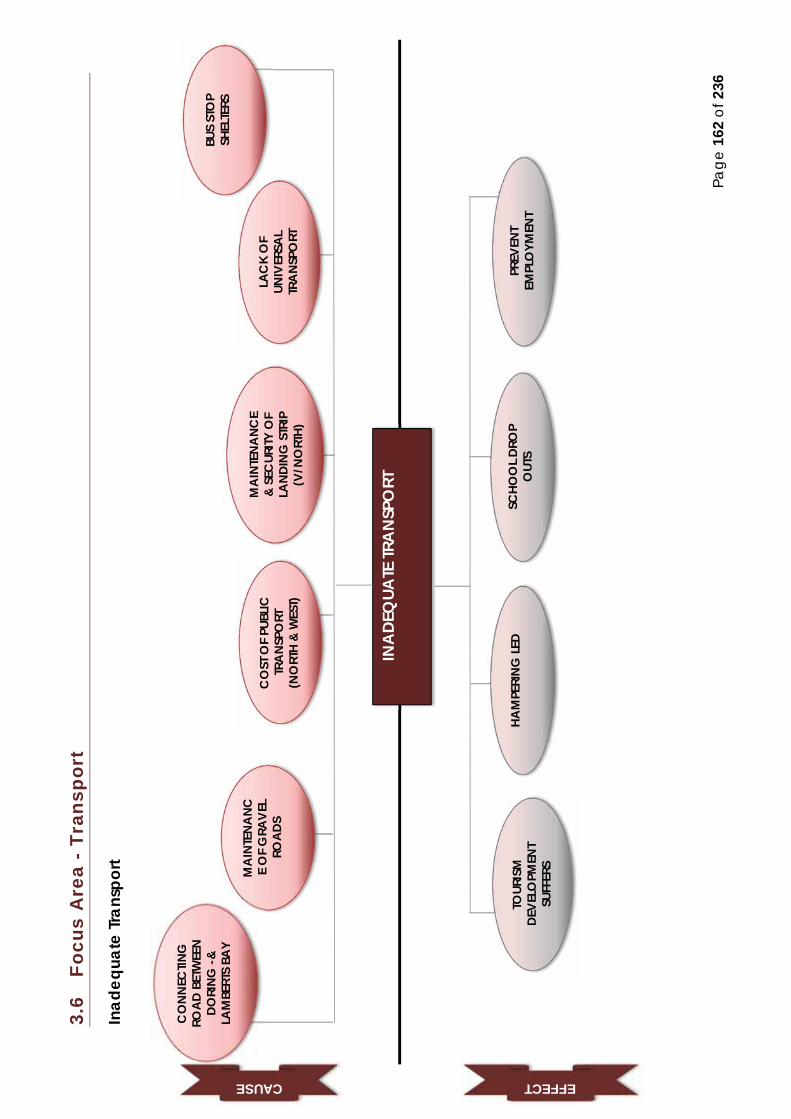
Page
162
of 2
36
3.6
Focu
s A
rea
- Tr
ansp
ort
Inad
equa
te Tr
ansp
ort
INA
DEQ
UATE
TRA
NSP
ORT
LAC
K O
F UN
IVER
SAL
TRA
NSPO
RT
BUS
STO
P SH
ELTE
RS
M
AIN
TENA
NCE
&
SEC
URITY
OF
LAND
ING
STR
IP
(V/N
ORT
H)
CO
ST O
F PU
BLIC
TR
ANS
PORT
(N
ORT
H &
WES
T)
MA
INTE
NANC
E O
F G
RAVE
L RO
ADS
CO
NN
ECTIN
G
ROAD
BET
WEE
N
DORI
NG -&
LA
MBE
RTS
BAY
SCHO
OL D
ROP
OUT
S PR
EVEN
T EM
PLO
YMEN
T HA
MPE
RIN
G LE
D
TOUR
ISM
DE
VELO
PMEN
T SU
FFER
S
CAUSE EFFECT

Page 163 of 236

Page 164 of 236
4.1 LOCAL ECONOMIC DEVELOPMENT
This section summarises the current local economic development strategy of the Matzikama Municipality. It provides the reader with information about the trajectory the Municipality is taking to achieving a healthy economy.
It is evident from the responses of all communities, including business, civil society, farmers and NGOs that the focus of the Council of Matzikama Municipality, for the next five years, should be directed and developing and growing the local economy. The call by the communities is echoed by the financial position of the Matzikama Municipality. The liquidity ratio and cash coverage are but a few indicators that send red lights to Council. It was therefore, an easy decision for Council to make Local Economic Development the focus of the fourth generation IDP.
Everything that a municipality does should be done to impact as much as possible on the social development of an area. In particular, municipalities must be serious about their responsibility to provide services that meet the basic needs of the poor in their communities in a cost-effective and affordable manner. However, it would not be possible to provide good quality and sustainable services in a particular municipal space without having a healthy local economy to feed the input that is needed to provide and sustain those services.
A healthy local economy thus becomes the critical success factor for the achievement of cost-effective and affordable services that meet the needs of the citizens living in a particular municipal space.
4.1.1 Overview of the Economy of Matzikama Municipality
The local economy of Matzikama Municipality experienced average year-on-year growth of 1.0 per cent from 2005 - 2013, which is significantly below the Western Cape Province’s growth rate of 3.6% over this period.
The negative growth rate over the period mentioned above resulted in job losses equal to more than 8% of the current working population and more than 21% of the economic active people (EAP).
The most recent studies of the local economy identified the Tertiary Sector as the most productive in terms of contributing towards economic growth and employment. The sector, which primarily consists of financial and businesses services as well as trade and accommodation, contributed 54% to the GDPR. The same studies highlighted the fact that these services created more than 50% of jobs over the same period whilst significant job losses have been sustained in the agriculture and manufacturing sectors.
The poor education and skills levels in Matzikama have a direct impact on the ability of people taking up employment in the most productive sector in the local economy. The literacy rate, which has an influence in the quality and quantity of local skills levels, is 76.4 per cent, which is significantly below the Provincial average of 87.2 per

Page 165 of 236
cent. The inability of local people to take up employment in the Tertiary Sector encourages in-migration and consequential strain on scarce resources.
The agriculture sector still remains the largest employer despite a significant decrease in the number of jobs over the same period. More than 50% of the total workforce (including seasonal employment) is employed in this sector. The fact that skills levels are relatively low explains the high number of jobs (permanent and seasonal) taken up in the agriculture sector, which is also the sector that generates the lowest household income. Implicitly, poverty levels, in the Municipality, are a consequence of the largest number of people being employed by the agriculture sector.
The dire situation sketched above is exacerbated by the fact that developments in the current primary sectors, including agriculture, mining and capture fisheries are limited and do not allow for expansion to the extent that it can accommodate the socio-economic challenges. Consequently, Matzikama Municipality is forced to look at the introduction of new economic sectors and or subsectors to develop and grow its local economy.
An investigation into sector growth revealed that very little potential exists for development and growth opportunities in the primary sectors including agriculture, mining and captured fisheries.
The primary end of agriculture sector is limited to an expansion of 4000 – 6000 hectares if and when the Clanwilliam Dam wall is raised. It is also a fact that a raised dam wall without an increase in the capacity of the current canal system negates any additional downstream development. Furthermore, it is highly unlikely that construction works for the dam wall and the water conveyance system will be completed before 2022 given the fact that no budget has been approved for the construction of a water conveyance system. According to the most recent presentation by the Department of Water Affairs (DWA) it will cost in the region of R3 – 4 billion for a water conveyance system large enough to accommodate the additional 4000-6000 hectares of water.
The mining sector in Matzikama, despite being the largest in the Western Cape, is a small contributor to the GDPR and employment in the municipal area. The contribution by the mining sector in terms of employment and GDPR growth is less than 1% of the working population and 1% respectively. Moreover, the potential for the development of new mines exists, however, prospects for the local economy do not look good as development of new mines from licensing to commissioning can easily take up to 10 years. It is thus highly unlikely for the mining sector to contribute timeously and holistically to economic development and growth as processing of minerals is in most cases taking place abroad.
Due to the dwindling fishing stocks the capture fisheries industry closed down more than 10 years ago and the likeliness of it being restored to its original form is non-existent. The only remaining activity in Matzikama of this 100-year industry is subsistence and small scale fishing. Large fishing corporations closed their doors on the north-west coast due to the dwindling fishing stocks and, which is highly unlikely to recover according to scientists.
The above is testimony to the fact that the existing primary sectors of the Matzikama Municipality’s economy are unlikely to contribute to the immediate to medium term socio-economic development requirements.

Page 166 of 236
Not only is the current economic position risky for investors and local businesses it places financial sustainability of the Municipality on a knife-edge whilst simultaneously threatens provision of affordable, effective and good quality service delivery.
4.1.1.1 Overview of the Wine Industry in Matzikama
The wine industry is currently in a slump, with only a third of grape producers farming at financially sustainable levels and return on income dropping below 1%. The average farming income is at around R45000 per hectare compared to the R70000 per hectare that is required to be sustainable. Wine prices need to be increased to achieve that income. The graph below reveals that the wine industry receives the lowest net income.
The national situation described above is no different to the wine industry in Matzikama Municipality. The graph below reveals that the current situation is further exacerbated over the next five years.

Page 167 of 236
The Lower Olifantsriver from Trawal to Koekenaap is the biggest wine grape producing area in South Africa. The region accounts for fifteen percent of total wine grapes production in South Africa. The amount excludes between 6000 and 10000 tonnes that are processed in the Winelands due to insufficient storage capacity. Wine grape farming is also (by far) the biggest of al agricultural activities along the Lower Olifantsriver region. Given the undesirable situation articulated above, the economy of the area is at risk to deteriorate even further. Consequences are increases in unemployment which will first affect the poorest of the poor. It is therefore imperative for the Matzikama Municipality in conjunction with the producers (farmers) and all other relevant parties to work together to find ways to address the challenges of the wine cellars in the Lower Olifantsriver/Matzikama area.
One of the main challenges facing the cellars in Matzikama is the lack of adequate and sufficient storage capacity. Addressing the problem will go a long way in producing better quality wine and making the cellars economically viable operations. Furthermore, increasing storage capacity will help farmers to process grapes locally instead of sending it to the Winelands for processing. The cellars are not in a financial position to incur capital expenses, which is a consequence of the producers not being able to fund the capital expenditure.
In summary, the Lower Olifantsriver wine grape producers, as with most of the other wine grape producers elsewhere in the country, are struggling to survive. The fact that the wine industry is the largest contributor to local economic growth in Matzikama compels role players to work together to turn the industry around. See annexure E for a full report on the status of the wine industry.
4.1.2 Overview of Interventions
The following interventions were identified at a participatory workshop held over five days and attended by all role players including communities, business, farmers NGOs, industry experts and all spheres of government.
Growing the existing agriculture industry that will support retention of existing farms and inclusion of new black-owned farms
Develop the full value chain of land-based Abalone farms along the coast and explore the development of freshwater fishing farming
Promote the development of Agro-processing in the region Promote the development of the tourism sector; and Grow the recycling and renewable energy sectors in the region
The above five interventions will form the basis for the Municipality’s LED strategy.
4.2 SPATIAL DEVELOMENT FRAMEWORK
The section below provides the reader with information relevant to what legislation prescribes when compiling a spatial development framework for a Municipality. 4.1.1 SPATIAL PLANNING AND LAND USE MANAGEMENT ACT, 2013 (NO 16 OF 2013) (SPLUMA) Section 12: “Preparation of spatial development frameworks:

Page 168 of 236
(1) The national and provincial spheres of government and each municipality must prepare spatial development frameworks that-: (a) Interpret and represent the spatial development vision of the responsible sphere of government and competent authority, (b) Are informed by a long-term spatial development vision statement and plan, (c) Represent integration and trade-off of all relevant sector policies and plans, (d) Guide planning and development decisions across all sectors policies and plans, (e) Guide a provincial department or municipality in taking any decision or exercising any discretion in terms of this Act or any other law relating to spatial planning and land use management systems, (f) Contribute to a coherent , planned approach to spatial development in the national, provincial and municipal spheres, (g) Provide clear and accessible information to the public and private sector and provide direction for investment purposes, (h) Include previously disadvantaged areas, areas under traditional leadership, rural areas, informal settlements, slums and land holdings of state-owned enterprises and government agencies and address their inclusion and integration into spatial, economic, social and environmental objectives of the relevant sphere, 6 (i) Address historical spatial imbalances in development, (j) Identify long-term risks of particular spatial patterns of growth and development and that policies and strategies necessary to mitigate those risks, (k) Provide direction for strategic developments, infrastructure investment, promote efficient, sustainable and planned investments by all sectors and indicate priority areas for investment in land development, (l) Promote a rational and predictable land development environment to create trust and stimulate investment, (m) Take cognisance of any environmental management instrument adopted by the relevant environmental management authority, (n) Give effect to national legislation and policies on mineral resources and sustainable utilisation and protection of agricultural resources, and (o) Consider and, where necessary, incorporate the outcomes of sustainable public engagement, including direct participation in the process through public meetings, public exhibitions, public debates and discourses in the media and any other forum or mechanisms that promote such direct involvement. (2) (a) The national government, a provincial government and a municipality must participate in the spatial planning and land use management processes that impact on each other to ensure that the plans and programmes are coordinated, consistent and in harmony with each other. (b) A spatial development framework adopted in terms of this Act must guide and inform the exercise of any discretion or of any decision taken in terms of this Act or any other law relating to land use and development of land by that sphere of government.

Page 169 of 236
(3) The national spatial development framework must contribute to and give spatial expression to national spatial development policy and plans as well as integrate and give spatial expression to policies and plans emanating from the various sectors of national government, and may include any regional spatial development frame work. 7 (4) A provincial spatial development framework must contribute and to and express provincial development policy as well as integrate and spatially express policies and plans emanating from the various sectors of the provincial and national spheres of government as they apply at the geographic scale of the province. (5) A municipal spatial development framework must assist in integrating, coordinating, aligning and expressing development policies and plans emanating from the various sectors of the spheres of government as they apply within the municipal area. (6) Spatial development frameworks must outline specific arrangements for prioritising, mobilising, sequencing and implementing public and private infrastructural and land development investment in the priority spatial structuring areas identified in spatial development frameworks.” Section 20: “Preparation of municipal spatial development framework: (1) The Municipal Council of a municipality must by notice in the Provincial Gazette adopt a municipal spatial development framework for the municipality. (2) The municipal spatial development framework must be prepared as part of a municipality’s integrated development plan in accordance with the provisions of the Municipal Systems Act. (3) Before adopting the municipal spatial development framework contemplated in subsection (1) and any proposed amendments to the municipal spatial development framework, the Municipal Council must- (a) Give notice of the proposed municipal development framework in the Gazette and the media, (b) Invite the public to submit written representations in respect of the proposed municipal spatial development framework to the Municipal Council within 60 days after the publication of the notice referred to in paragraph (a), and (c) Consider all representations received in respect of the proposed municipal spatial development framework.” 8 Section 21: “Content of municipal spatial development framework: A municipal spatial development framework must: (a) Give affect to the development principles and applicable norms and standards set out in Chapter 2, (b) Include a written and spatial representation of a five-year spatial development plan for the spatial form of the municipality, (c) Include a longer term spatial development vision statement for the municipal area which indicates a desired spatial growth and development pattern for the next 10 to 20 years, (d) Identify current and future significant structuring and restructuring elements of the spatial form of the municipality, including development

Page 170 of 236
corridors, activity spines and economic nodes where public and private investment will be prioritised and facilitated, (e) Include population growth estimates for the next five years, (f) Include estimates of the demand for housing units across different socio-economic categories and the planned location and density of future housing developments, (g) Include estimates of economic activity and employment trends and locations in the municipal area for the next five years, (h) Identify, quantify and provide location requirements of engineering infrastructure and services provision for existing and future development needs for the next five years, (i) Identify the designated areas where a national or provincial inclusionary housing policy may be applicable, (j) Include a strategic assessment of the environmental pressures and opportunities within the municipal area, including the spatial location of environmental sensitivities, high potential agricultural land and coastal access strips, where applicable, (k) Identify the designation of areas in the municipality where incremental upgrading approaches to development and regulation will be applicable, (l) Identify the designation of areas in which- (i) More detailed local plans must be developed, and (ii) Shortened land use development procedures may be applicable and land use schemes may be so amended, (m) Provide the spatial expression of the coordination, alignment and integration of sectoral policies of all municipal departments, (n) Determine a capital expenditure framework for the municipality’s development programmes, depicted spatially, (o) Determine the purpose, desired impact and structure of the land use management scheme to apply in that municipal area, and (p) Include an implementation plan comprising of- (i) Sectoral requirements, including budgets and resources for implementation, (ii) Necessary amendments to a land use scheme, (iii) Specification of institutional arrangements necessary for implementation. (iv) Specification of implementation targets, including dates and monitoring indicators, and 9 (v) Specification, where necessary, of any arrangements for partnerships in the implementation process.” Section 22: “Status of municipal spatial development framework: (1) A Municipal Planning Tribunal or any other authority required or mandated to make a land use development decision in terms of this Act or any other law relating to land development, may not make a decision which is inconsistent with a municipal spatial development framework. (2) Subject to Section 42, a Municipal Planning Tribunal or any other authority required or mandated to make a land development decision, may depart from the provisions of a municipal spatial development framework only if site-specific circumstances justify a departure form the provisions of such municipal spatial development framework.
Page 171 of 236
(3) Where a provincial spatial development framework is inconsistent with a municipal spatial development framework, the Premier must , in accordance with the Intergovernmental Relations Framework Act, take the necessary steps, including the provision of technical assistance, to support the revision of those spatial development frameworks in order to ensure consistency between the two.”
For more information of the spatial development framework of the Matzikama please read the IDP in conjunction with the SDF.
4.3 HUMAN SETTLEMENT PLAN
The Constitution of the Republic of South Africa (Act 108 of 1996) Sections 26, 27 and 29 of Chapter 2 - Bill of Rights – states that, “everyone has the right to access to adequate housing, health care services, social security and education.”
Furthermore, Schedules 4 and 5 states that, “the Province has legislative competence in regard to (inter alia): Environment; Urban and Rural development; Welfare services; Housing, Health Services; Regional planning and development; (concurrent competence with national) and Provincial planning and Provincial Roads and Traffic (exclusive competence).”
Section 9(1) (a) (i) and (f) of the Housing Act 107 of 1997 identifies the primary role of the municipality as taking all reasonable and necessary steps, within the framework of national and provincial legislation and policy, to ensure that the inhabitants within its area of jurisdiction have access to adequate housing on a progressive basis; and to initiate, plan, coordinate, facilitate, promote and enable appropriate housing development in its area of jurisdiction. The Housing Chapter/Sector Plan is a five (5) year housing plan undertaken by the municipality and incorporated into the Municipal IDP with the aim of fulfilling the abovementioned role assigned to the municipality in terms of the Housing Act 107 of 1997 read with the National Housing Code. The Housing Chapter/ Matzikama Human Settlements Strategy in the IDP are reviewed annually as part of the annual review of the IDP.
The Human Settlements Plan (HSP) responds to the needs and projected demands within the municipality and is directed at addressing housing demand over the whole spectrum of income groups as this is regarded as key to supporting sustainable human settlement development within the municipality over time.
In keeping with the Comprehensive Plan for Sustainable Human Settlement (September 2014), the Matzikama Municipality HSP focuses in improving the quality of housing and housing environments by integrating communities and settlements. The Matzikama Municipality has embarked on a program to create the necessary infrastructure to sustain future housing projects. Our objective is to eradicate informal settlements and to provide every house with a basic service which will include a toilet, electricity and water.
Accordingly, the focus is on the development of integrated human settlements in well-located areas that provide convenient access to urban amenities, including places of employment. At the same time it is recognized that the Matzikama Municipality is characterized by a large rural population whose needs also need to be accommodated in the strategy. A key concern in the municipality, which is emphasized in the LED and IDP, is the high level of dependency within the municipality, and the resultant impact this has on the municipality’s ability to provide

Page 172 of 236
for basic services to the poorest of the poor. The Matzikama HSP therefore looks at the complete range of available housing instruments to address the current and projected future housing need within the municipality.
Read this section in conjunction with section 2.3.6.1 of this document and the HSP.

Page 173 of 236
The chapter on strategy is an explicit and defined statement about how the Council of Matzikama Municipality intends to remove the challenges and barriers that hinders the Municipality to advance from the current situation to the vision. The diagram below is a graphic demonstration summarising the strategy process that the Matzikama Municipality followed.
The strategy process commenced with a clear understanding of the current circumstances and living conditions faced by the Municipality and its citizens. Critical success factors (CSFs) and barriers that hinder development are identified followed by a number of strategic interventions that are capable of achieving CSFs and removing barriers to ultimately achieve the vision.
5.1 VISION
The Council of Matzikama Municipality, guided by a detailed analysis and assessment of the current situation, derived at a decision that the majority of the people of Matzikama suffer from a range of economic and social challenges. It led to a decision that the focus and resources of the Municipality must be directed at secure, healthier and convenient living and working spaces. The preferred future of Matzikama Municipality has been captured in the vision below.
“A Safe and Prosperous Matzikama”
5.2 MISSION
The Council of Matzikama Municipality devised a mission statement that defines the overall purpose of the Municipality. Before defining the mission statement, Council identified the strengths, opportunities, weaknesses and threats of the Municipality with a view to derive at a mission statement that is supported by the strengths and opportunities intrinsic to the organization and its environment. It is clear from the
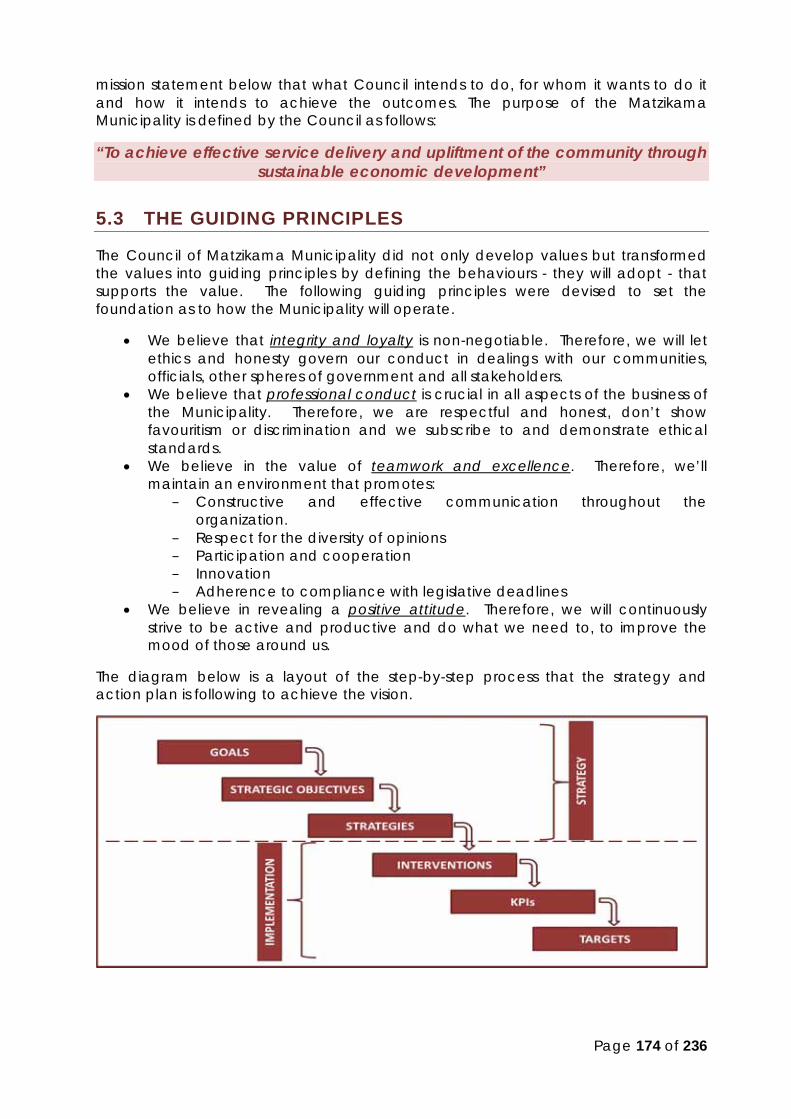
Page 174 of 236
mission statement below that what Council intends to do, for whom it wants to do it and how it intends to achieve the outcomes. The purpose of the Matzikama Municipality is defined by the Council as follows:
“To achieve effective service delivery and upliftment of the community through sustainable economic development”
5.3 THE GUIDING PRINCIPLES
The Council of Matzikama Municipality did not only develop values but transformed the values into guiding principles by defining the behaviours - they will adopt - that supports the value. The following guiding principles were devised to set the foundation as to how the Municipality will operate.
We believe that integrity and loyalty is non-negotiable. Therefore, we will let ethics and honesty govern our conduct in dealings with our communities, officials, other spheres of government and all stakeholders.
We believe that professional conduct is crucial in all aspects of the business of the Municipality. Therefore, we are respectful and honest, don’t show favouritism or discrimination and we subscribe to and demonstrate ethical standards.
We believe in the value of teamwork and excellence. Therefore, we’ll maintain an environment that promotes:
− Constructive and effective communication throughout the organization.
− Respect for the diversity of opinions − Participation and cooperation − Innovation − Adherence to compliance with legislative deadlines
We believe in revealing a positive attitude. Therefore, we will continuously strive to be active and productive and do what we need to, to improve the mood of those around us.
The diagram below is a layout of the step-by-step process that the strategy and action plan is following to achieve the vision.

Page
175
of 2
36
5.4
STR
ATE
GIC
DIR
EC
TIO
N S
ETT
ING
The
Cou
ncil
of M
atzik
ama
Mun
icip
ality
dec
ided
on
seve
n go
als
that
def
ine
acco
mpl
ishm
ent
of t
he m
issio
n.
The
tabl
e th
at fo
llow
s ar
ticul
ates
the
vario
us c
ompo
nent
s in
the
stra
tegi
c d
irect
ion
setti
ng p
roce
ss u
sed
by
the
Cou
ncil
of M
atzik
ama
Mun
icip
ality
to re
ach
its g
oals
and
ultim
atel
y ac
hiev
e th
e vi
sion.
GO
ALS
/KPA
s ST
RATE
GIC
OBJ
ECTIV
E C
ON
STRA
INTS
TO A
CHI
EVIN
G S
TRA
TEG
IC
OBJ
ECTIV
ES
STRA
TEG
IES
RISK
S
(bro
ad a
ims t
hat
defin
e ac
com
plish
men
t of
the
miss
ion)
(a b
road
ly d
efin
ed
obje
ctiv
e, if
met
Cou
ncil
will
ach
ieve
its G
oals
and
ultim
atel
y th
e Vi
sion)
Barri
ers
Crit
ical
succ
ess f
acto
rs
(CSF
) (b
road
act
iviti
es to
ach
ieve
ob
ject
ives
, cre
ate
a cr
itica
l co
nditi
on o
r rem
ove
a ba
rrier
)
(if o
bjec
tives
are
not
m
et)
(exi
stin
g or
pot
entia
l ch
alle
nges
that
hin
der
achi
evem
ent o
f ob
ject
ives
)
(key
con
ditio
ns th
at
mus
t be
crea
ted
to
achi
eve
obje
ctiv
es)
1. F
unct
iona
l M
unic
ipal
Ba
sic
Serv
ices
Prov
ide
mun
icip
al b
asic
se
rvic
es to
mee
t d
ema
nds o
f gro
win
g p
opul
atio
n a
nd
dev
elop
men
t cha
lleng
es
In
suffi
cien
t fun
ds t
o in
sta
ll new
serv
ices
Insu
ffici
ent f
und
s to
supp
ort
ma
inte
nanc
e of
ex
istin
g in
frast
ruct
ure
Illega
l mun
icip
al
dum
pin
g sit
es
D
eter
iora
ted
wa
ter
retic
ula
tion
infra
stru
ctur
e
N
ot su
ffici
ent
elec
trici
ty c
apa
city
to
acc
omm
oda
te
new
dev
elop
men
ts
La
ck o
f suf
ficie
nt
pot
abl
e w
ate
r so
urce
s in
certa
in
are
as
Un
der
stan
ding
the
exte
nt a
nd
cons
eque
nces
of t
he
lack
of s
ervi
ces
D
evel
op a
nd im
plem
ent a
n in
frast
ruct
ure-
nee
ds
stra
tegy
to ra
ise a
war
enes
s of
the
cons
eque
nces
and
re
sour
ces r
equi
red
Ra
ise fu
nds f
rom
go
vern
men
t on
the
ba
ck o
f th
e in
frast
ruct
ure-
need
s st
rate
gy to
resp
ond
to
criti
cal in
frast
ruct
ure
chal
leng
es
C
ondu
ct a
n in
vest
iga
tion
into
des
alin
ate
d se
aw
ate
r a
s a p
oten
tial p
otab
le
wa
ter s
ourc
e.
Pr
iorit
ize m
aint
enan
ce o
f ex
istin
g in
frast
ruct
ure
and
equi
pm
ent t
o su
stai
n cu
rrent
ly le
vels
of se
rvic
e d
eliv
ery
Th
e qu
ality
of s
ervi
ces
ma
y d
eter
iora
te a
s a
cons
eque
nce
of th
e in
abi
lity
of th
e M
unic
ipal
ity to
mee
t th
e st
rate
gic
obje
ctiv
e
Dev
elop
ers a
nd
inve
stor
s ma
y d
ecid
e to
refra
in fr
om in
vest
ing
in th
e ec
onom
y of
M
atz
ika
ma
bec
aus
e of
p
oor s
ervi
ce d
eliv
ery,
w
hich
may
cau
se
reve
nue
to d
eclin
e
Alre
ad
y hi
gh p
over
ty
leve
ls m
ay in
crea
se
even
furth
er b
ecau
se
of a
lack
of a
dec
line
in
mun
icip
al r
even
ue
Page
176
of 2
36
GO
ALS
/KPA
s ST
RATE
GIC
OBJ
ECTIV
E C
ON
STRA
INTS
TO A
CHI
EVIN
G S
TRA
TEG
IC
OBJ
ECTIV
ES
STRA
TEG
IES
RISK
S
(bro
ad a
ims t
hat
defin
e ac
com
plish
men
t of
the
miss
ion)
(a b
road
ly d
efin
ed
obje
ctiv
e, if
met
Cou
ncil
will
ach
ieve
its G
oals
and
ultim
atel
y th
e Vi
sion)
Barri
ers
Crit
ical
succ
ess f
acto
rs
(CSF
) (b
road
act
iviti
es to
ach
ieve
ob
ject
ives
, cre
ate
a cr
itica
l co
nditi
on o
r rem
ove
a ba
rrier
) (if
obj
ectiv
es a
re n
ot m
et)
(exi
stin
g or
pot
entia
l ch
alle
nges
that
hin
der
achi
evem
ent o
f ob
ject
ives
)
(key
con
ditio
ns th
at
mus
t be
crea
ted
to
achi
eve
obje
ctiv
es)
2. S
uffic
ient
Re
venu
e M
ain
tain
suffi
cien
t re
venu
e so
urce
s to
enab
le th
e m
unic
ipal
ity
to m
eet i
ts c
onst
itutio
nal
oblig
atio
ns
Es
kom
dist
ribut
ion
are
as
H
igh
tarif
fs fo
r som
e se
rvic
es
H
igh
pro
per
ty ta
x ra
tes
Un
der
stan
ding
re
venu
e so
urce
s of
the
Mun
icip
ality
and
ho
w it
per
form
s in
term
s of c
ontri
but
ing
to th
e co
ffers
of t
he
Mun
icip
ality
D
evel
op a
nd im
plem
ent a
re
venu
e en
hanc
emen
t st
rate
gy to
gai
n a
bet
ter
und
erst
andi
ng o
f sou
rces
of
inco
me
as w
ell a
s its
p
erfo
rma
nce
to u
ltim
ate
ly
incr
ease
reve
nue
A
pp
roa
ch re
leva
nt
gove
rnm
ent d
epa
rtmen
ts
to le
ad th
e di
scus
sions
on
Esko
m d
istrib
utio
n a
rea
s
Dev
elop
and
impl
emen
t a
fina
ncia
l pla
n w
ith re
leva
nt
pol
icie
s tha
t ad
dres
ses
conc
erns
abo
ut h
igh
tarif
fs a
nd p
rop
erty
tax
rate
s
Wor
k w
ith w
ard
cou
ncillo
rs to
impr
ove
paym
ent c
ultu
re
in a
ll w
ard
s of t
he
Mun
icip
ality
Intro
duc
e ta
x br
eaks
and
re
duct
ion
in ta
riffs
to a
ttra
ct
inve
stm
ent t
o th
e ar
ea
Th
e M
unic
ipa
lity
ma
y b
ecom
e m
ore
relia
nt o
n G
over
nmen
t gra
nts t
o m
eet o
per
atio
nal
requ
irem
ents
if su
ffici
ent
reve
nue
sour
ces a
re n
ot
ava
ilabl
e
The
pro
visio
n of
serv
ices
m
ay
det
erio
rate
to le
vels
not a
ccep
tab
le to
the
citiz
ens a
nd in
vest
men
t co
mm
unity
cau
sed
by
insu
ffici
ent r
even
ue
Th
e M
unic
ipa
lity
ma
y b
e co
mp
elle
d to
incr
ease
ta
riffs
and
ma
ke it
eve
n m
ore
diffi
cult
to p
rom
ote
econ
omic
dev
elop
men
t ca
used
by
the
inab
ility
to in
crea
se th
e ta
x-b
ase
Fina
nces
may
be
insu
ffici
ent t
o m
eet
oper
atio
nal e
xpen
ses
due
to th
e la
ck o
f su
ffici
ent r
even
ue
sour
ces
3. E
cono
mic
G
row
th a
nd
Coo
rdin
ate
, fa
cilit
ate
a
nd st
imul
ate
sust
aina
ble
Long
lea
d tim
es to
a
ppro
ve b
uild
ing
Ded
ica
ted
buy
-in a
nd
com
mitm
ent f
rom
Dev
elop
stan
dard
op
era
ting
proc
edur
es to
Unem
plo
ymen
t may
in
crea
se d
ue to
the
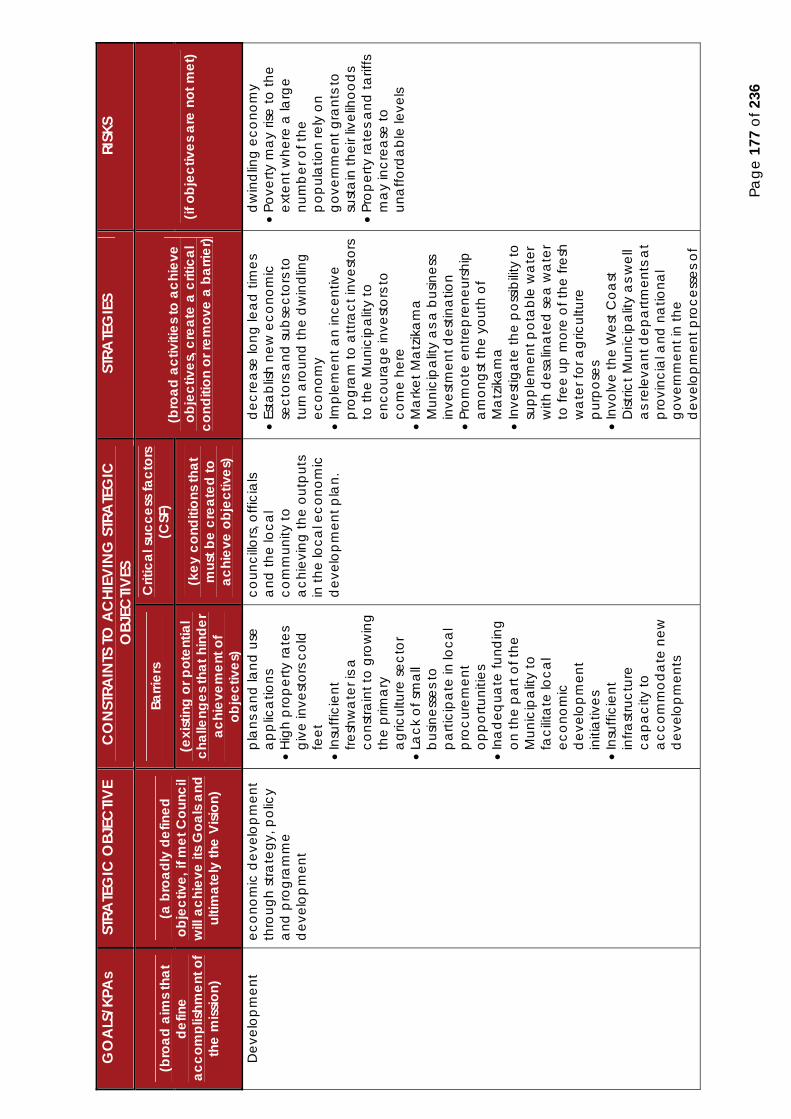
Page
177
of 2
36
GO
ALS
/KPA
s ST
RATE
GIC
OBJ
ECTIV
E C
ON
STRA
INTS
TO A
CHI
EVIN
G S
TRA
TEG
IC
OBJ
ECTIV
ES
STRA
TEG
IES
RISK
S
(bro
ad a
ims t
hat
defin
e ac
com
plish
men
t of
the
miss
ion)
(a b
road
ly d
efin
ed
obje
ctiv
e, if
met
Cou
ncil
will
ach
ieve
its G
oals
and
ultim
atel
y th
e Vi
sion)
Barri
ers
Crit
ical
succ
ess f
acto
rs
(CSF
) (b
road
act
iviti
es to
ach
ieve
ob
ject
ives
, cre
ate
a cr
itica
l co
nditi
on o
r rem
ove
a ba
rrier
) (if
obj
ectiv
es a
re n
ot m
et)
(exi
stin
g or
pot
entia
l ch
alle
nges
that
hin
der
achi
evem
ent o
f ob
ject
ives
)
(key
con
ditio
ns th
at
mus
t be
crea
ted
to
achi
eve
obje
ctiv
es)
Dev
elop
men
t ec
onom
ic d
evel
opm
ent
thro
ugh
stra
tegy
, pol
icy
and
pro
gra
mm
e d
evel
opm
ent
pla
ns a
nd la
nd u
se
app
lica
tions
Hig
h p
rop
erty
rate
s gi
ve in
vest
ors c
old
feet
Insu
ffici
ent
fresh
wa
ter i
s a
cons
train
t to
grow
ing
the
prim
ary
agr
icul
ture
sect
or
La
ck o
f sm
all
bus
ines
ses t
o p
artic
ipa
te in
loca
l p
rocu
rem
ent
oppo
rtuni
ties
In
ad
equa
te fu
ndin
g on
the
part
of th
e M
unic
ipal
ity to
fa
cilit
ate
loca
l ec
onom
ic
dev
elop
men
t in
itia
tives
Insu
ffici
ent
infra
stru
ctur
e ca
paci
ty to
a
ccom
mod
ate
new
d
evel
opm
ents
coun
cillo
rs, o
ffici
als
and
the
loca
l co
mm
unity
to
ach
ievi
ng th
e ou
tput
s in
the
loca
l eco
nom
ic
dev
elop
men
t pla
n.
dec
rea
se lo
ng le
ad ti
mes
Esta
blish
new
eco
nom
ic
sect
ors a
nd su
bse
ctor
s to
turn
aro
und
the
dw
indl
ing
econ
omy
Im
plem
ent a
n in
cent
ive
pro
gra
m to
attr
act
inve
stor
s to
the
Mun
icip
ality
to
enco
ura
ge in
vest
ors t
o co
me
here
Ma
rket
Ma
tzik
am
a M
unic
ipal
ity a
s a b
usin
ess
inve
stm
ent d
estin
atio
n
Prom
ote
entre
pre
neur
ship
a
mon
gst t
he y
outh
of
Ma
tzik
am
a
Inve
stig
ate
the
pos
sibilit
y to
su
pple
men
t pot
abl
e w
ate
r w
ith d
esa
lina
ted
sea
wa
ter
to fr
ee u
p m
ore
of th
e fre
sh
wa
ter f
or a
gric
ultu
re
pur
pose
s
Invo
lve
the
Wes
t Coa
st
Dist
rict M
unic
ipal
ity a
s wel
l a
s rel
evan
t dep
artm
ents
at
pro
vinc
ial a
nd n
atio
nal
gove
rnm
ent i
n th
e d
evel
opm
ent p
roce
sses
of
dw
ind
ling
econ
omy
Po
verty
may
rise
to th
e ex
tent
whe
re a
larg
e nu
mb
er o
f the
p
opul
atio
n re
ly o
n go
vern
men
t gra
nts t
o su
sta
in th
eir l
ivel
ihoo
ds
Pr
oper
ty ra
tes a
nd ta
riffs
m
ay
incr
ease
to
una
fford
abl
e le
vels

Page
178
of 2
36
GO
ALS
/KPA
s ST
RATE
GIC
OBJ
ECTIV
E C
ON
STRA
INTS
TO A
CHI
EVIN
G S
TRA
TEG
IC
OBJ
ECTIV
ES
STRA
TEG
IES
RISK
S
(bro
ad a
ims t
hat
defin
e ac
com
plish
men
t of
the
miss
ion)
(a b
road
ly d
efin
ed
obje
ctiv
e, if
met
Cou
ncil
will
ach
ieve
its G
oals
and
ultim
atel
y th
e Vi
sion)
Barri
ers
Crit
ical
succ
ess f
acto
rs
(CSF
) (b
road
act
iviti
es to
ach
ieve
ob
ject
ives
, cre
ate
a cr
itica
l co
nditi
on o
r rem
ove
a ba
rrier
) (if
obj
ectiv
es a
re n
ot m
et)
(exi
stin
g or
pot
entia
l ch
alle
nges
that
hin
der
achi
evem
ent o
f ob
ject
ives
)
(key
con
ditio
ns th
at
mus
t be
crea
ted
to
achi
eve
obje
ctiv
es)
the
Mun
icip
ality
’s L
ED
initi
ativ
es
4. A
qua
lity
livin
g en
viro
nmen
t Re
duc
e po
verty
leve
ls a
s m
easu
red
by
the
SAM
PI
La
ck o
f ad
equa
te
inve
stm
ent i
n so
cial
se
rvic
es b
y ot
her
sphe
res o
f go
vern
men
t
Hig
h po
verty
leve
ls
Hig
h sc
hool
dro
p-
outs
Ad
equa
te fu
ndin
g
Enco
ura
ge re
gula
r dia
logu
e w
ith re
leva
nt g
over
nmen
t d
epa
rtmen
ts to
pro
mot
e in
vest
men
t in
educ
atio
n a
nd h
ealth
serv
ices
Dev
elop
a fu
ndin
g p
lan
in
resp
onse
to e
ssen
tial s
ocia
l d
evel
opm
ent n
eed
s as
def
ined
by
the
SAM
PI
En
cour
age
the
poo
r to
par
ticip
ate
in th
e M
unic
ipal
ity’s
ind
igen
t’s
pro
gra
m
Po
verty
leve
ls m
ay
incr
ease
to n
ew h
eigh
ts
caus
ing
furth
er d
ecay
in
the
livel
ihoo
ds o
f soc
iety
, w
hich
may
lead
to
viol
ent p
rote
sts
Th
e a
lread
y hi
gh le
vels
of d
ecea
ses s
uch
as
tub
ercu
losis
and
HIV
and
A
IDS
may
rea
ch
epid
emic
leve
ls
A
lack
of e
duca
tion
may
ha
ve lo
ng-te
rm
impl
ica
tions
for t
he lo
cal
econ
omy
caus
ing
unem
plo
ymen
t and
p
over
ty to
incr
ease
eve
n fu
rther
5.
A
Dev
elop
men
tal
Mun
icip
ality
Ma
inta
in su
ffici
ent
orga
niza
tiona
l res
ourc
es,
enha
nce
the
invo
lvem
ent o
f the
pub
lic
in th
e d
evel
opm
ent a
nd
dec
ision
ma
king
p
roce
sses
and
pro
vid
e
Po
or p
arti
cipa
tion
by
com
mun
ities
in th
e d
evel
opm
ent a
nd
ma
nage
men
t p
roce
sses
of t
he
Mun
icip
ality
Insu
ffici
ent r
even
ue
Com
mun
ities
un
der
stan
ding
thei
r ro
les i
n th
e da
y-to
-d
ay o
per
atio
ns o
f the
M
unic
ipal
ity
Ad
equa
te fu
ndin
g
Pr
olife
rate
aw
are
ness
ab
out
the
role
s of c
omm
uniti
es in
d
evel
opm
ent a
nd
ma
nage
men
t pro
cess
es o
f th
e M
unic
ipal
ity
G
row
and
exp
and
reve
nue
stre
am
s to
resp
ond
to
In
ad
equa
te re
sour
ces
ma
y re
sult
in p
oor
serv
ices
del
iver
y, w
hich
m
ay
have
furth
er
impl
ica
tions
for o
wn
reve
nue
stre
am
s and
ul
tima
tely
a b
igge
r

Page
179
of 2
36
GO
ALS
/KPA
s ST
RATE
GIC
OBJ
ECTIV
E C
ON
STRA
INTS
TO A
CHI
EVIN
G S
TRA
TEG
IC
OBJ
ECTIV
ES
STRA
TEG
IES
RISK
S
(bro
ad a
ims t
hat
defin
e ac
com
plish
men
t of
the
miss
ion)
(a b
road
ly d
efin
ed
obje
ctiv
e, if
met
Cou
ncil
will
ach
ieve
its G
oals
and
ultim
atel
y th
e Vi
sion)
Barri
ers
Crit
ical
succ
ess f
acto
rs
(CSF
) (b
road
act
iviti
es to
ach
ieve
ob
ject
ives
, cre
ate
a cr
itica
l co
nditi
on o
r rem
ove
a ba
rrier
) (if
obj
ectiv
es a
re n
ot m
et)
(exi
stin
g or
pot
entia
l ch
alle
nges
that
hin
der
achi
evem
ent o
f ob
ject
ives
)
(key
con
ditio
ns th
at
mus
t be
crea
ted
to
achi
eve
obje
ctiv
es)
ethi
cal a
nd p
rofe
ssio
nal
serv
ices
to su
ppor
t the
ne
eds o
f the
co
mm
uniti
es
to p
rovi
de
for
effe
ctiv
e re
sour
ces
and
per
sonn
el
stru
ctur
e
insu
ffici
ent r
esou
rces
Impl
emen
t pro
gra
ms t
hat
give
the
pub
lic o
wne
rshi
p in
th
e d
evel
opm
ent a
nd
ma
nage
men
t pro
cess
es o
f th
e M
unic
ipal
ity
Im
plem
ent a
per
sonn
el
stru
ctur
e th
at s
uppo
rts
Cou
ncil’
s stra
tegy
and
ul
tima
tely
ach
ieve
the
visio
n
relia
nce
on g
over
nmen
t gr
ants
A la
ck o
f pub
lic
par
ticip
atio
n m
ay
resu
lt in
unn
eces
sary
and
or
non-
prio
ritize
d
dev
elop
men
ts, w
hich
m
ay
resu
lt in
frui
tless
w
ast
eful
exp
end
iture
6. A
Qua
lity
Ad
min
istra
tion
and
Inte
rna
l Ef
ficie
ncy
Prov
ide
oppo
rtuni
ties t
o of
ficia
ls an
d c
ounc
illors
fo
r the
dev
elop
men
t of
pro
fess
iona
l and
le
ader
ship
skills
and
en
hanc
e em
ploy
men
t eq
uity
in th
e or
gani
zatio
n
Ina
deq
uate
fund
ing
Ad
equa
te fu
ndin
g
Invo
lve
gove
rnm
ent i
n th
e fu
ndin
g p
rogr
am
s to
ensu
re
ad
equa
te re
spon
ses t
o th
e la
ck o
f pro
fess
iona
l and
le
ader
ship
skills
Hol
d re
gula
r cou
ncil
and
ma
yora
l com
mitt
ee
mee
tings
to e
nsur
e ge
rma
ne re
spon
ses b
y m
ana
gem
ent
Es
tabl
ish th
e le
vel o
f ski
lls
am
ongs
t offi
cial
s and
co
unci
llors
with
the
inte
nt to
re
spon
d to
the
skills
ga
p
Enha
nce
the
per
form
anc
e of
inte
rna
l rev
enue
stre
am
s to
ens
ure
an e
ffici
ent a
n
M
edio
cre
skills
leve
ls m
ay
have
an
imp
act
on
the
qua
lity
of se
rvic
es
and
the
abilit
y to
m
ana
ge th
e M
unic
ipal
ity
in lin
e w
ith le
gal
requ
irem
ents
, whi
ch m
ay
resu
lt in
pro
foun
d a
udit
find
ings

Page
180
of 2
36
GO
ALS
/KPA
s ST
RATE
GIC
OBJ
ECTIV
E C
ON
STRA
INTS
TO A
CHI
EVIN
G S
TRA
TEG
IC
OBJ
ECTIV
ES
STRA
TEG
IES
RISK
S
(bro
ad a
ims t
hat
defin
e ac
com
plish
men
t of
the
miss
ion)
(a b
road
ly d
efin
ed
obje
ctiv
e, if
met
Cou
ncil
will
ach
ieve
its G
oals
and
ultim
atel
y th
e Vi
sion)
Barri
ers
Crit
ical
succ
ess f
acto
rs
(CSF
) (b
road
act
iviti
es to
ach
ieve
ob
ject
ives
, cre
ate
a cr
itica
l co
nditi
on o
r rem
ove
a ba
rrier
) (if
obj
ectiv
es a
re n
ot m
et)
(exi
stin
g or
pot
entia
l ch
alle
nges
that
hin
der
achi
evem
ent o
f ob
ject
ives
)
(key
con
ditio
ns th
at
mus
t be
crea
ted
to
achi
eve
obje
ctiv
es)
qua
lity
ad
min
istra
tion
7.
A R
esp
onsiv
e N
atu
ral a
nd B
uilt
Envi
ronm
ent
Dev
elop
and
Sus
tain
our
Sp
atia
l, N
atu
ral a
nd B
uilt
Envi
ronm
ent.
In
suffi
cien
t fun
ds
O
ut-d
ate
d sp
atia
l d
evel
opm
ent
fram
ewor
k
A la
ck o
f per
sonn
el
and
reso
urce
s
Dw
indl
ing
econ
omic
gr
owth
Spa
tial
fragm
enta
tion
Hig
h un
empl
oym
ent
Pr
olife
rate
d p
over
ty
leve
ls
Ad
equa
te fu
ndin
g
Failin
g to
pro
vid
e a
resp
onsiv
e na
tura
l and
b
uilt
envi
ronm
ent m
ay
resu
lt in
the
colla
pse
of
the
loca
l eco
nom
y
Vio
lent
pro
test
act
ion
by
the
loca
l pub
lic m
ay
surfa
ce a
s a m
eans
to
exp
ress
diss
atis
fact
ion
with
the
dw
indl
ing
econ
omy
Th
e M
unic
ipa
lity
ma
y ha
ve to
redu
ce
per
sonn
el a
s a re
sult
of
an
envi
ronm
ent t
hat i
s un
resp
onsiv
e to
the
reve
nue
stre
am
s of t
he
orga
niza
tion
Th
e M
unic
ipa
lity
ma
y re
ly
incr
easin
gly
mor
e on
go
vern
men
t gra
nts t
o su
sta
in th
e ve
ry b
asic
ne
eds o
f the
pub
lic
Page 181 of 236
6.1 INTRODUCTION
The implementation plan part of the IDP reveals information about what deliverables or projects the Municipality are planning to implement to achieve the strategy. These refer to the interventions made by the Municipal Manager and Directors that will if successfully implemented realise the objective or contribute towards achieving the vision of Council.
The implementation or action plan states what projects or actions the Municipality is taking to implement the strategy devised to overcome the barriers, create a specific condition to achieve the critical success factors or achieve the strategic objective. To verify implementation of the deliverables or interventions a KPI that complies with the S.M.A.R.T principles as well as targets are developed for each of the deliverables or interventions.

Page
182
of 2
36
6.2
IMP
LEM
EN
TATI
ON
6.2.
1 St
rate
gic
Obj
ectiv
e N
o.1
STRA
TEG
Y SE
CTIO
N
EXEC
UTIN
G TH
E ST
RATE
GY
Stra
tegi
c O
bjec
tive
Goa
l 20
17-2
020
MTR
EF B
udge
t to
give
ef
fect
to in
terv
entio
ns /
pro
ject
s (0
00)
Tota
l cos
t of t
he
stra
tegi
c ob
ject
ive
17/1
8 18
/19
19/2
0 Pr
ovid
e m
unic
ipa
l ba
sic se
rvic
es to
mee
t d
ema
nds o
f gro
win
g po
pula
tion
and
dev
elop
men
t cha
lleng
es
Func
tiona
l Mun
icip
al B
asic
Ser
vice
s
R 33
0 14
6 22
0
R 33
6 96
3 15
3 R
360
217
557
R1 0
27 3
26 9
30
6.2.
2 St
rate
gic
Obj
ectiv
e N
o.2
STRA
TEG
Y SE
CTIO
N
EXEC
UTIN
G TH
E ST
RATE
GY
Stra
tegi
c O
bjec
tive
Goa
l 20
17-2
020
MTR
EF B
udge
t to
give
ef
fect
to in
terv
entio
ns /
pro
ject
s (0
00)
Tota
l cos
t of t
he
stra
tegi
c ob
ject
ive
17/1
8 18
/19
19/2
0 M
ain
tain
suffi
cien
t rev
enue
sour
ces t
o en
able
the
mun
icip
ality
to m
eet i
ts
cons
titut
iona
l obl
iga
tions
Suffi
cien
t Rev
enue
R 1
988
290
R
2 01
5 36
2 R
2 04
3 47
4 R
6 0
47 1
26
6.2.
3 St
rate
gic
Obj
ectiv
e N
o.3
STRA
TEG
Y SE
CTIO
N
EXEC
UTIN
G TH
E ST
RATE
GY
Stra
tegi
c O
bjec
tive
Goa
l 20
17-2
020
MTR
EF B
udge
t to
give
ef
fect
to in
terv
entio
ns /
pro
ject
s (0
00)
Tota
l cos
t of t
he
stra
tegi
c ob
ject
ive
17/1
8 18
/19
19/2
0 C
oord
ina
te, f
aci
lita
te a
nd st
imul
ate
su
sta
ina
ble
econ
omic
dev
elop
men
t th
roug
h st
rate
gy, p
olic
y a
nd p
rogr
am
me
dev
elop
men
t
Econ
omic
Gro
wth
and
Dev
elop
men
t R
3 12
8 39
6 R
3 30
6 71
5
R 3
491
891
R 9
927
002

Page
183
of 2
36
6.2.
4 St
rate
gic
Obj
ectiv
e N
o. 4
STRA
TEG
Y SE
CTIO
N
EXEC
UTIN
G TH
E ST
RATE
GY
Stra
tegi
c O
bjec
tive
Goa
l 20
17-2
020
MTR
EF B
udge
t to
give
ef
fect
to in
terv
entio
ns /
pro
ject
s (0
00)
Tota
l cos
t of t
he
stra
tegi
c ob
ject
ive
17/1
8 18
/19
19/2
0 Re
duc
e po
verty
leve
ls a
s mea
sure
d b
y th
e SA
MPI
A
qua
lity
livin
g en
viro
nmen
t R
15 9
30
R 16
838
R
17
781
R 5
0 54
9
6.2.
5 St
rate
gic
Obj
ectiv
e N
o.5
STRA
TEG
Y SE
CTIO
N
EXEC
UTIN
G TH
E ST
RATE
GY
Stra
tegi
c O
bjec
tive
Goa
l 20
17-2
020
MTR
EF B
udge
t to
give
ef
fect
to in
terv
entio
ns /
pro
ject
s (0
00)
Tota
l cos
t of t
he
stra
tegi
c ob
ject
ive
17/1
8 18
/19
19/2
0 M
ain
tain
suffi
cien
t org
aniza
tiona
l re
sour
ces,
enha
nce
the
invo
lvem
ent o
f the
p
ublic
in th
e d
evel
opm
ent a
nd d
ecisi
on
ma
king
pro
cess
es a
nd p
rovi
de
ethi
cal a
nd
pro
fess
iona
l ser
vice
s to
supp
ort t
he n
eed
s of
the
com
mun
ities
A D
evel
opm
enta
l Mun
icip
alit
y R
1 37
9 59
3 R
1 55
8 22
3 R
1 7
39 1
07
R 4
676
923
6.2.
6 St
rate
gic
Obj
ectiv
e N
o.6
STRA
TEG
Y SE
CTIO
N
EXEC
UTIN
G TH
E ST
RATE
GY
Stra
tegi
c O
bjec
tive
Goa
l 20
17-2
020
MTR
EF B
udge
t to
give
ef
fect
to in
terv
entio
ns /
pro
ject
s (0
00)
Tota
l cos
t of t
he
stra
tegi
c ob
ject
ive
17/1
8 18
/19
19/2
0 Pr
ovid
e op
portu
nitie
s to
offic
ials
and
co
unci
llors
for t
he d
evel
opm
ent o
f p
rofe
ssio
nal a
nd le
ader
ship
skills
and
en
hanc
e em
ploy
men
t equ
ity in
the
orga
niza
tion
A Q
ualit
y A
dm
inist
ratio
n an
d In
tern
al
Effic
ienc
y
R 1
655
438
R 1
749
798
R 1
847
787
R 5
253
023

Page
184
of 2
36
6.2.
7 St
rate
gic
Obj
ectiv
e N
o. 7
STRA
TEG
Y SE
CTIO
N
EXEC
UTIN
G TH
E ST
RATE
GY
Stra
tegi
c O
bjec
tive
Goa
l 20
17-2
020
MTR
EF B
udge
t to
give
ef
fect
to in
terv
entio
ns /
pro
ject
s (0
00)
Tota
l cos
t of t
he
stra
tegi
c ob
ject
ive
17/1
8 18
/19
19/2
0 D
evel
op a
nd S
usta
in o
ur S
patia
l, N
atu
ral
and
Bui
lt En
viro
nmen
t A
Res
pon
sive
Na
tura
l and
Bui
lt En
viro
nmen
t R
724
000
R 76
5 26
8 R
808
123
R 2
297
391

Page 185 of 236
7.1 INTRODUCTION
The 2016 Medium Term Budget Policy Statement emphasised that the global recovery from the 2008 financial crisis remains precarious, with growth forecast at 3.4 percent for 2017. Matzikama Municipality is also adversely impacted by the downturn in the economy, which has had a considerable influence not only disposable income levels in our area, but has further lowered the level of employment and growth prospects. The effects of continuously rising costs in inputs such as fuel and electricity amongst other with the resultant multiplier effect on our expenditure( outflow of cash) requirements, have culminated in increased costs to provide basic and community services, making the achievement of the service delivery objectives so much more difficult and an even greater challenge.
Matzikama experienced negative growth in the past two financial years. The national GDP growth rate is forecasted to increase by 1.3 per cent in 2017 and to improve moderately over the medium term with to 2 per cent and 2.2 per cent in 2018 and 2019 respectively. Matzikama Municipality shall focus on economic development and continue to limit non-priority spending and implement stringent cost-containment measures. We will continue to partner with the government to investigate how we achieve more with our existing resources.
Municipal revenues and cash flows will remain under pressure in 2017/18 resulting in a conservative budget approach. Council will ensure that the capital budget is effectively utilised and productivity, good governance and effective management of our resources shall drive the service delivery programme of Council.
7.2 AVAILABLE RESOURCES FOR IMPLEMENTATION
7.2.1 Own Funding
Source of funding 2017/2018 (R’000)
2018/2019 (R’000)
2019/2020 (R’000)
Public contributions & donations 3 700 - - Own funding 8 513 3 579 3 560 Total 12 213 3 579 3 560
7.2.2 National & Provincial government
Source of funding 2017/2018 (R’000)
2018/2019 (R’000)
2019/2020 (R’000)
National Government 34 614 35 144 41 731 Provincial Government 205 - -
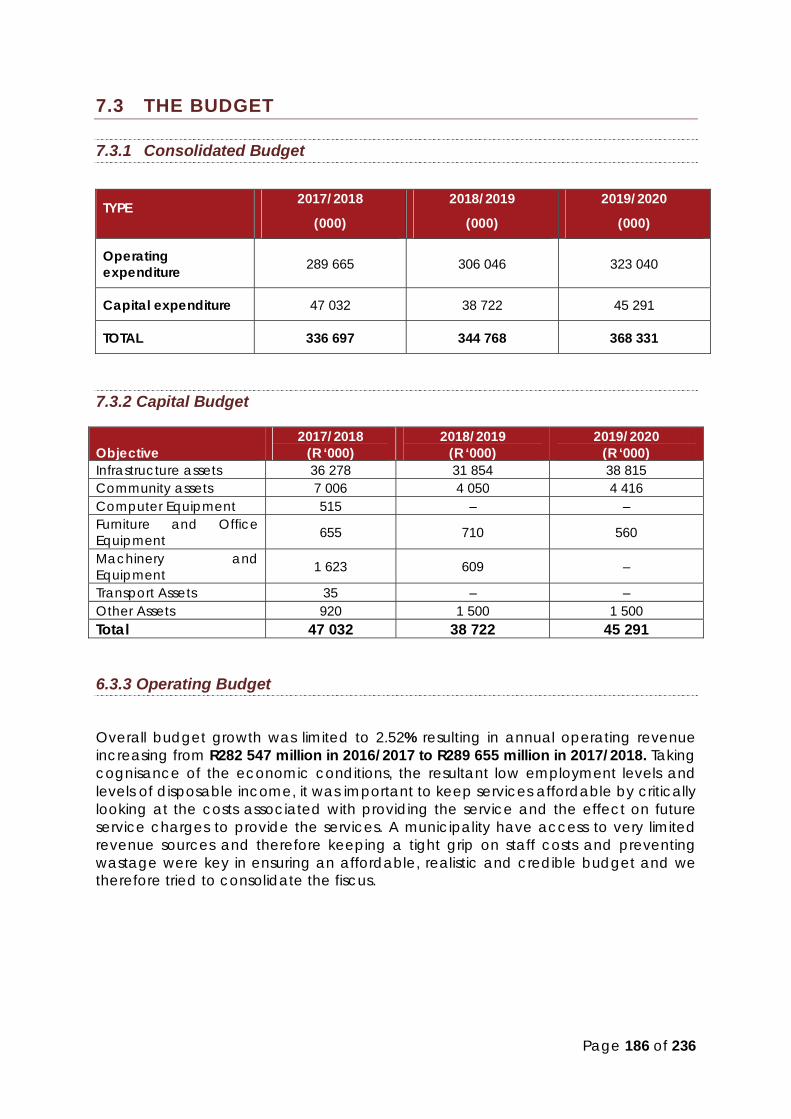
Page 186 of 236
7.3 THE BUDGET
7.3.1 Consolidated Budget
7.3.2 Capital Budget
Objective 2017/2018
(R ‘000) 2018/2019
(R ‘000) 2019/2020
(R ‘000) Infrastructure assets 36 278 31 854 38 815 Community assets 7 006 4 050 4 416 Computer Equipment 515 – – Furniture and Office Equipment 655 710 560
Machinery and Equipment 1 623 609 –
Transport Assets 35 – – Other Assets 920 1 500 1 500 Total 47 032 38 722 45 291
6.3.3 Operating Budget
Overall budget growth was limited to 2.52% resulting in annual operating revenue increasing from R282 547 million in 2016/2017 to R289 655 million in 2017/2018. Taking cognisance of the economic conditions, the resultant low employment levels and levels of disposable income, it was important to keep services affordable by critically looking at the costs associated with providing the service and the effect on future service charges to provide the services. A municipality have access to very limited revenue sources and therefore keeping a tight grip on staff costs and preventing wastage were key in ensuring an affordable, realistic and credible budget and we therefore tried to consolidate the fiscus.
TYPE 2017/2018
(000)
2018/2019
(000)
2019/2020
(000)
Operating expenditure 289 665 306 046 323 040
Capital expenditure 47 032 38 722 45 291
TOTAL 336 697 344 768 368 331

WC
011
Mat
zikam
a - S
uppo
rting
Tabl
e SA
36 D
etai
led
Cap
ital B
udge
t
Mun
icip
al V
ote/
Cap
ital p
roje
ct
Ref
Prog
ram
/Pro
ject
des
crip
tion
Proj
ect n
umbe
r
2017
/18
Med
ium
Term
Rev
enue
&
Expe
nditu
re F
ram
ewor
k Pr
ojec
t inf
orm
atio
n
R th
ousa
nd
4 Bu
dget
Ye
ar
2017
/18
Budg
et
Year
+1
2018
/19
Budg
et
Year
+2
2019
/20
War
d lo
catio
n N
ew o
r re
new
al
Vote
1 -
Exe
cutiv
e &
Cou
ncil
Upgr
ad
ing
of m
unic
ipa
l hea
d o
ffice
2
012
012
843
650
500
500
ALL
RE
NEW
AL
Vote
2 -
Fin
ance
C
omp
uter
eq
uip
men
t and
Prin
ters
for I
CT
2 16
2 62
2 20
9 40
0 A
LL
NEW
Vo
te 3
- C
orpo
rate
St
eel C
ab
inet
s for
HR
Offi
ce
2 11
2 62
2 87
6 5
ALL
N
EW
Vote
3 -
Cor
pora
te
Wa
ter d
ispen
ser
2 10
2 62
2 20
3 5
ALL
N
EW
Vote
3 -
Cor
pora
te
Elec
troni
c Fi
re S
yste
m
2 10
2 62
2 93
3 40
A
LL
NEW
Vo
te 3
- C
orpo
rate
Fr
ank
ing
Ma
chin
e fo
r Rec
ord
s Offi
ce
2 10
2 62
2 87
8 45
A
LL
NEW
Vo
te 3
- C
orpo
rate
SY
STEM
S/PC
UPG
RAD
ING
2
162
622
002
100
ALL
RE
NEW
AL
Vote
3 -
Cor
pora
te
Mov
able
Ste
el S
helv
es fo
r Rec
ord
s Offi
ce
2 10
2 62
2 87
7 13
0 A
LL
NEW
Vo
te 4
- C
omm
unity
Ser
vice
s G
eyse
rs
2 41
2 32
2 87
4 5
3 N
EW
Vote
4 -
Com
mun
ity S
ervi
ces
Inst
all a
Disa
ble
d fr
iend
ly ra
mp
10
7
NEW
Vo
te 4
- C
omm
unity
Ser
vice
s C
hain
saw
2
712
612
383
15
7 N
EW
Vote
4 -
Com
mun
ity S
ervi
ces
Upgr
ad
e b
ath
roo
m fa
cilit
ies -
20
3
NEW
Vo
te 4
- C
omm
unity
Ser
vice
s Tw
o W
hea
t ea
ters
3
202
612
371
30
2.7
NEW
Vo
te 4
- C
omm
unity
Ser
vice
s O
ffice
Eq
uip
men
t 2
412
622
014
40
40
All
NEW
Vo
te 4
- C
omm
unity
Ser
vice
s La
wnm
ower
s Poo
ls 2
712
612
887
50
3,4,
5 N
EW
Vote
4 -
Com
mun
ity S
ervi
ces
Cut
ting
torc
h w
ith g
as b
ottl
e 2
122
612
336
50
3,4,
5 N
EW
Vote
4 -
Com
mun
ity S
ervi
ces
Pole
Run
ners
2
712
612
337
50
3,4,
5 N
EW
Vote
4 -
Com
mun
ity S
ervi
ces
Book
shel
ves
2 40
2 62
2 30
7 70
A
LL
NEW
Vo
te 4
- C
omm
unity
Ser
vice
s V
acu
um-C
lea
ner :
Ma
in O
ffice
bui
ldin
g
2 41
2 62
2 34
3 80
A
ll N
EW
Vote
4 -
Com
mun
ity S
ervi
ces
Tab
les a
nd C
hairs
for c
om
mun
ity h
alls
2
412
322
024
100
100
100
ALL
N
EW
Vote
4 -
Com
mun
ity S
ervi
ces
Furn
iture
(Ta
ble
s, c
hairs
, etc
.) 2
402
622
014
100
ALL
N
EW
Vote
4 -
Com
mun
ity S
ervi
ces
Blow
er m
ower
2
712
612
053
100
3,4,
5 N
EW
Vote
4 -
Com
mun
ity S
ervi
ces
Whe
at e
ate
rs
2 71
2 61
2 88
5 15
0 3,
4,5
NEW
Vo
te 4
- C
omm
unity
Ser
vice
s V
red
end
al N
orth
: New
Out
doo
r Gym
/Pla
y Pa
rks
2 71
2 30
2 37
7 18
0 3,
4,5
NEW
Vo
te 4
- C
omm
unity
Ser
vice
s Re
fuse
Bin
s 50
2 90
2 61
2 88
6 20
0 3,
4,5
NEW
Vo
te 4
- C
omm
unity
Ser
vice
s W
eld
ing
Ma
chin
e 2
122
612
335
200
3,4,
5 N
EW
Vote
4 -
Com
mun
ity S
ervi
ces
Vre
den
da
l Nor
th: N
ew O
utd
oor G
ym/P
lay
Park
s 2
712
302
377
816
3,4,
5 N
EW
Vote
4 -
Com
mun
ity S
ervi
ces
Pla
y Pa
rk e
qui
pm
ent
2 71
2 30
2 33
8 50
3,
4,5
NEW

Page
188
of 2
36
Mun
icip
al V
ote/
Cap
ital p
roje
ct
Ref
Prog
ram
/Pro
ject
des
crip
tion
Proj
ect n
umbe
r
2017
/18
Med
ium
Term
Rev
enue
&
Expe
nditu
re F
ram
ewor
k Pr
ojec
t inf
orm
atio
n
R th
ousa
nd
4 Bu
dget
Ye
ar
2017
/18
Budg
et
Year
+1
2018
/19
Budg
et
Year
+2
2019
/20
War
d lo
catio
n N
ew o
r re
new
al
Vote
4 -
Com
mun
ity S
ervi
ces
Va
cuum
-Cle
ane
r : K
law
er C
om
mun
ity H
all
2 41
2 62
2 34
2 80
A
ll N
EW
Vote
4 -
Com
mun
ity S
ervi
ces
Va
cuum
-Cle
ane
r: Ko
eken
aa
p C
om
mun
ity H
all
2 41
2 62
2 34
2 80
A
ll N
EW
Vote
4 -
Com
mun
ity S
ervi
ces
Va
cuum
-Cle
ane
r: Eb
enha
eser
Co
mm
unity
Ha
ll 2
412
622
342
80
All
NEW
Vo
te 4
- C
omm
unity
Ser
vice
s V
acu
um-C
lea
ner:
Stra
ndfo
ntei
n C
om
mun
ity H
all
2 41
2 62
2 34
2 80
A
ll N
EW
Vote
4 -
Com
mun
ity S
ervi
ces
Law
nmow
er V
red
end
al N
orth
Co
mm
unity
Ha
ll 2
412
612
884
200
3,4,
5 N
EW
Vote
4 -
Com
mun
ity S
ervi
ces
Law
nmow
er V
red
end
al C
om
mun
ity H
all
2 41
2 61
2 88
4 20
0 3,
4,5
NEW
Vote
4 -
Com
mun
ity S
ervi
ces
Up
gra
din
g o
f Vre
den
da
l Tra
ffic
bui
ldin
g a
nd T
est
sta
tion
2 60
2 01
2 34
0
1 00
0
ALL
UP
GRA
DE
Vote
4 -
Com
mun
ity S
ervi
ces
Va
cuum
-Cle
ane
r: V
red
end
al C
om
mun
ity H
all
2 41
2 62
2 34
2 80
A
ll N
EW
Vote
4 -
Com
mun
ity S
ervi
ces
Va
cuum
-Cle
ane
r: V
anr
hyns
dor
p M
ain
offi
ce
2 41
2 62
2 34
3 80
A
ll N
EW
Vote
4 -
Com
mun
ity S
ervi
ces
V
acu
um-C
lea
ner :
Vre
den
da
l Nor
th C
om
mun
ity
Ha
ll 2
412
622
342
80
All
NEW
Vote
4 -
Com
mun
ity S
ervi
ces
Offi
ce fu
rnitu
re C
om
mun
ity H
alls
2
412
622
014
80
All
NEW
Vote
4 -
Com
mun
ity S
ervi
ces
Up
gra
din
g o
f Sta
ble
s fo
r Co
mm
unity
Ser
vice
s of
fices
2
122
012
341
1 00
0 3,
4,5
UPG
RAD
E
Vote
4 -
Com
mun
ity S
ervi
ces
Vre
den
da
l Nor
th: U
pgr
ad
e Fa
cilit
ies a
t Sp
ort f
ield
4
000
3,4,
5 UP
GRA
DE
Vote
5 -
Pub
lic W
orks
and
Bas
ic S
ervi
ces
Upgr
ad
ing
of B
ulk
Elec
trici
ty V
red
end
al
– 2
500
8 00
0 3
NEW
Vo
te 5
- P
ublic
Wor
ks a
nd B
asic
Ser
vice
s H
and
rad
ios a
nd c
harg
ers
3 20
2 82
2 80
6 10
A
LL
NEW
Vo
te 5
- P
ublic
Wor
ks a
nd B
asic
Ser
vice
s D
ump
y le
vel,
trip
od, s
taff
3 20
2 61
2 38
5 10
A
LL
NEW
Vo
te 5
- P
ublic
Wor
ks a
nd B
asic
Ser
vice
s Ro
ds
3 00
2 61
2 80
8 15
5
ALL
N
EW
Vote
5 -
Pub
lic W
orks
and
Bas
ic S
ervi
ces
Gen
era
tor
3 20
2 61
2 05
4 15
6
NEW
Vo
te 5
- P
ublic
Wor
ks a
nd B
asic
Ser
vice
s H
igh
pre
ssur
e sp
ray
for v
ehic
les
3 20
2 61
2 36
6 20
7
NEW
Vo
te 5
- P
ublic
Wor
ks a
nd B
asic
Ser
vice
s W
ash
ing
ma
chin
es :S
ewer
ag
e W
orks
3
002
622
364
20
3,4,
5,6,
7 N
EW
Vote
5 -
Pub
lic W
orks
and
Bas
ic S
ervi
ces
Mob
ile W
ate
r pum
ps
3 20
2 61
2 06
8 25
3,
4,5
NEW
Vo
te 5
- P
ublic
Wor
ks a
nd B
asic
Ser
vice
s Ex
tens
ion
pet
rol s
aw
3
202
612
365
25
6 N
EW
Vote
5 -
Pub
lic W
orks
and
Bas
ic S
ervi
ces
Con
cret
e M
ixer
3
102
612
807
27
7 N
EW
Vote
5 -
Pub
lic W
orks
and
Bas
ic S
ervi
ces
Fenc
ing
Sew
era
ge
Pum
p s
tatio
n (V
red
end
al)
3 00
2 06
2 34
9 30
3,
4,5
NEW
Vo
te 5
- P
ublic
Wor
ks a
nd B
asic
Ser
vice
s Tr
act
or w
ith h
aul
scra
per
(Lut
zville
) 3
102
602
382
35
1 N
EW
Vote
5 -
Pub
lic W
orks
and
Bas
ic S
ervi
ces
Stra
ndfo
ntei
n Po
wer
out
lets
Up
gra
de
3 30
2 05
2 88
1 50
2
REN
EWA
L Vo
te 5
- P
ublic
Wor
ks a
nd B
asic
Ser
vice
s Fe
ncin
g Se
wer
ag
e Pu
mp
sta
tion
(Kla
wer
) 3
002
062
348
50
6 N
EW
Vote
5 -
Pub
lic W
orks
and
Bas
ic S
ervi
ces
Up
gra
de
of
chlo
rine
gas s
tore
Pub
lic W
orks
(V
red
end
al)
3 20
2 03
2 31
6 50
3,
4,5
UPG
RAD
E

Page
189
of 2
36
Mun
icip
al V
ote/
Cap
ital p
roje
ct
Ref
Prog
ram
/Pro
ject
des
crip
tion
Proj
ect n
umbe
r
2017
/18
Med
ium
Term
Rev
enue
&
Expe
nditu
re F
ram
ewor
k Pr
ojec
t inf
orm
atio
n
R th
ousa
nd
4 Bu
dget
Ye
ar
2017
/18
Budg
et
Year
+1
2018
/19
Budg
et
Year
+2
2019
/20
War
d lo
catio
n N
ew o
r re
new
al
Vote
5 -
Pub
lic W
orks
and
Bas
ic S
ervi
ces
Fenc
ing
Wa
ste
Wa
ter T
rea
tmen
t Wor
ks (R
ietp
oort)
3
002
062
347
60
8 N
EW
Vote
5 -
Pub
lic W
orks
and
Bas
ic S
ervi
ces
Fenc
ing
rese
rvoi
r (St
rand
font
ein)
3
202
032
350
60
2 N
EW
Vote
5 -
Pub
lic W
orks
and
Bas
ic S
ervi
ces
Rep
lace
ga
lva
nise
d p
ipes
Eng
en p
ump
sta
tion
3 20
2 03
2 36
7 60
6
REN
EWA
L Vo
te 5
- P
ublic
Wor
ks a
nd B
asic
Ser
vice
s Ro
of o
f wor
ksho
p in
Kla
wer
3
102
012
361
70
6 N
EW
Vote
5 -
Pub
lic W
orks
and
Bas
ic S
ervi
ces
Sign
ag
e fo
r Pla
nts
3 20
2 61
2 35
4 80
A
LL
NEW
Vo
te 5
- P
ublic
Wor
ks a
nd B
asic
Ser
vice
s Re
pla
ce E
ben
haes
er W
ate
r Tre
atm
ent W
orks
pip
es
3 20
2 03
2 35
5 80
2
NEW
Vo
te 5
- P
ublic
Wor
ks a
nd B
asic
Ser
vice
s M
ach
iner
y a
nd e
qui
pm
ent(d
rill,
grin
der
) 3
102
612
817
81
4 A
ll N
EW
Vote
5 -
Pub
lic W
orks
and
Bas
ic S
ervi
ces
Dor
ing
Bay:
New
Out
doo
r Gym
/Pla
y Pa
rks
2 71
2 30
2 37
5 98
2
NEW
Vote
5 -
Pub
lic W
orks
and
Bas
ic S
ervi
ces
Fu
rnitu
re fo
r cha
lets
(frid
ges
/sto
ves/
mic
row
ave
ov
ens/
TV)
2 75
2 62
2 83
5 10
0 10
0 10
0 2
NEW
Vote
5 -
Pub
lic W
orks
and
Bas
ic S
ervi
ces
Upgr
ad
e o
f chl
orin
e d
osin
g sy
stem
s 3
202
032
316
100
1,2
NEW
Vo
te 5
- P
ublic
Wor
ks a
nd B
asic
Ser
vice
s W
ate
r ca
non
for s
por
t fie
lds
100
7 N
EW
Vote
5 -
Pub
lic W
orks
and
Bas
ic S
ervi
ces
Luza
anw
eg H
igh
Vo
ltag
e Up
gra
de
3 30
2 05
2 88
0 10
0 5
REN
EWA
L
Vote
5 -
Pub
lic W
orks
and
Bas
ic S
ervi
ces
Ke
rb- S
tone
s: Ja
cara
nda
Stre
et a
nd N
ieuw
oud
t St
reet
3
102
022
362
100
6 N
EW
Vote
5 -
Pub
lic W
orks
and
Bas
ic S
ervi
ces
Stor
m w
ate
r pip
es (N
ieuw
oud
t Stre
et)
3 10
2 02
2 36
9 10
0 6
NEW
Vo
te 5
- P
ublic
Wor
ks a
nd B
asic
Ser
vice
s St
orm
wa
ter p
ipes
(Ma
in S
teet
Vre
den
da
l) 3
102
022
370
100
6 N
EW
Vote
5 -
Pub
lic W
orks
and
Bas
ic S
ervi
ces
Con
stru
ct P
ublic
Wor
ks O
ffice
s fo
r Lut
zville
3
102
012
351
150
1 N
EW
Vote
5 -
Pub
lic W
orks
and
Bas
ic S
ervi
ces
Wa
ter a
nd s
ewer
ag
e te
st a
pp
ara
tus
3 20
2 61
2 35
3 18
0 A
LL
NEW
Vo
te 5
- P
ublic
Wor
ks a
nd B
asic
Ser
vice
s Lu
tzvi
lle-W
est:
New
Out
doo
r Gym
/Pla
y Pa
rks
2 71
2 30
2 37
6 18
0 2
NEW
Vo
te 5
- P
ublic
Wor
ks a
nd B
asic
Ser
vice
s Fe
ncin
g o
f Kl
aw
er d
ump
ing
site
2
902
092
346
200
6 N
EW
Vote
5 -
Pub
lic W
orks
and
Bas
ic S
ervi
ces
Tow
er f
or r
ad
ios (
Bitte
rfont
ein)
3
202
112
390
200
8 N
EW
Vote
5 -
Pub
lic W
orks
and
Bas
ic S
ervi
ces
Fire
hyd
rant
s 3
202
032
035
200
3,4,
5,6,
7 N
EW
Vote
5 -
Pub
lic W
orks
and
Bas
ic S
ervi
ces
Va
lves
(75m
m -
300m
m)
3 20
2 03
2 35
6 20
0 3,
4,5,
6,7
NEW
Vo
te 5
- P
ublic
Wor
ks a
nd B
asic
Ser
vice
s Bo
uma
g ro
ller a
nd tr
aile
r 3
102
602
345
250
6 N
EW
Vote
5 -
Pub
lic W
orks
and
Bas
ic S
ervi
ces
Sew
era
ge P
ump
s Ma
tzik
am
a T
owns
3
002
062
809
300
160
All
NEW
Vo
te 5
- Pu
blic
Wor
ks a
nd B
asic
Ser
vice
s
Mon
itorin
g Bo
reho
les
for W
ast
e W
ate
r Tre
atm
ent
Wor
ks
3 00
2 06
2 35
2 30
0 30
0
ALL
N
EW
Vo
te 5
- Pu
blic
Wor
ks a
nd B
asic
Ser
vice
s Re
pa
ir /
Rese
al o
f res
ervo
ir (S
trand
font
ein)
3
202
032
360
300
2 N
EW
Vo
te 5
- Pu
blic
Wor
ks a
nd B
asic
Ser
vice
s Kl
aw
er: U
pgr
ad
e o
f Sp
ort f
aci
lity
2 71
2 31
2 38
1 30
0 6
UPG
RAD
E V
ote
5 -
Pub
lic W
orks
and
Ba
sic S
ervi
ces
Pum
ps M
atz
ika
ma
Tow
ns
3 20
2 03
2 81
0 40
0 50
A
ll N
EW
Vo
te 5
- Pu
blic
Wor
ks a
nd B
asic
Ser
vice
s Lu
tzvi
lle-W
est:
Upgr
ad
e of
Sp
ort f
aci
lity
2 71
2 31
2 38
0 50
0 2
UPG
RAD
E
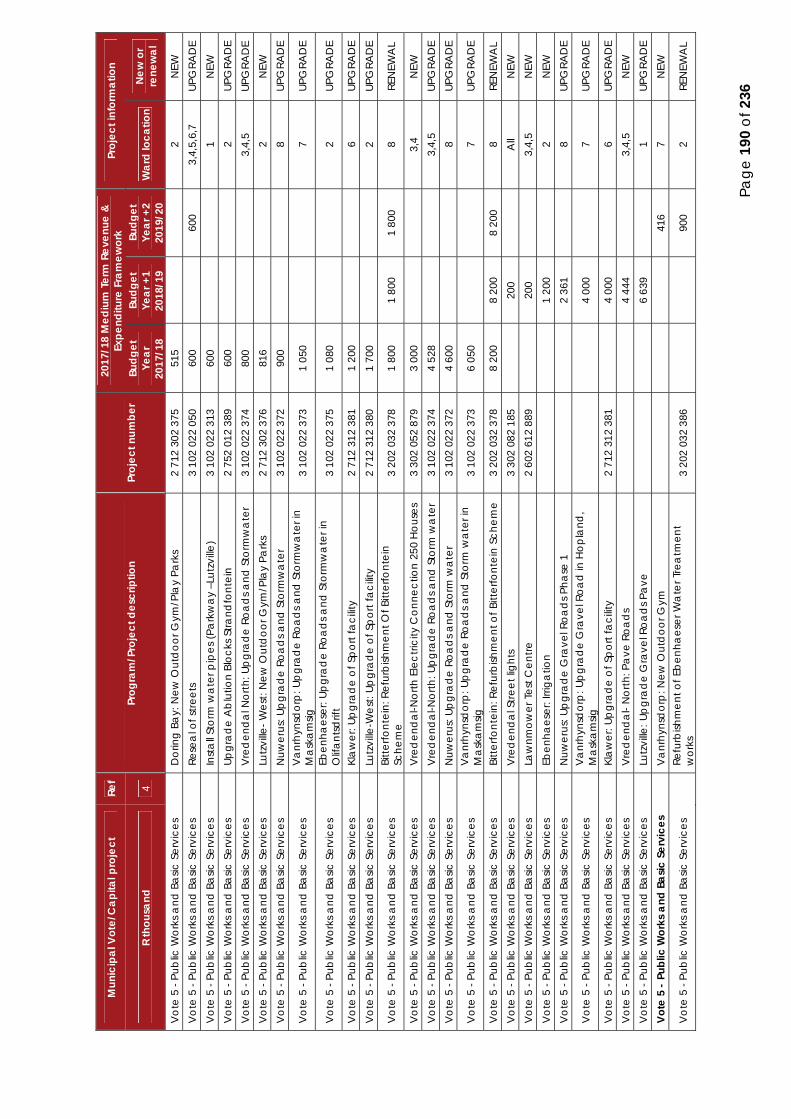
Page
190
of 2
36
Mun
icip
al V
ote/
Cap
ital p
roje
ct
Ref
Prog
ram
/Pro
ject
des
crip
tion
Proj
ect n
umbe
r
2017
/18
Med
ium
Term
Rev
enue
&
Expe
nditu
re F
ram
ewor
k Pr
ojec
t inf
orm
atio
n
R th
ousa
nd
4 Bu
dget
Ye
ar
2017
/18
Budg
et
Year
+1
2018
/19
Budg
et
Year
+2
2019
/20
War
d lo
catio
n N
ew o
r re
new
al
Vo
te 5
- Pu
blic
Wor
ks a
nd B
asic
Ser
vice
s D
orin
g Ba
y: N
ew O
utd
oor G
ym/P
lay
Park
s 2
712
302
375
515
2 N
EW
Vo
te 5
- Pu
blic
Wor
ks a
nd B
asic
Ser
vice
s Re
sea
l of s
treet
s 3
102
022
050
600
600
3,4,
5,6,
7 UP
GRA
DE
Vo
te 5
- Pu
blic
Wor
ks a
nd B
asic
Ser
vice
s In
sta
ll Sto
rm w
ate
r pip
es (P
ark
wa
y –L
utzv
ille)
3 10
2 02
2 31
3 60
0 1
NEW
V
ote
5 -
Pub
lic W
orks
and
Ba
sic S
ervi
ces
Upgr
ad
e A
blu
tion
Bloc
ks S
trand
font
ein
2 75
2 01
2 38
9 60
0 2
UPG
RAD
E V
ote
5 -
Pub
lic W
orks
and
Ba
sic S
ervi
ces
Vre
den
da
l Nor
th: U
pgr
ad
e Ro
ad
s and
Sto
rmw
ate
r 3
102
022
374
800
3,4,
5 UP
GRA
DE
Vo
te 5
- Pu
blic
Wor
ks a
nd B
asic
Ser
vice
s Lu
tzvi
lle- W
est:
New
Out
doo
r Gym
/Pla
y Pa
rks
2 71
2 30
2 37
6 81
6 2
NEW
V
ote
5 -
Pub
lic W
orks
and
Ba
sic S
ervi
ces
Nuw
erus
: Up
gra
de
Roa
ds a
nd S
torm
wa
ter
3 10
2 02
2 37
2 90
0 8
UPG
RAD
E
Vo
te 5
- Pu
blic
Wor
ks a
nd B
asic
Ser
vice
s
Va
nrhy
nsd
orp
: Up
gra
de
Roa
ds a
nd S
torm
wa
ter i
n M
ask
am
sig
3 10
2 02
2 37
3 1
050
7 UP
GRA
DE
Vo
te 5
- Pu
blic
Wor
ks a
nd B
asic
Ser
vice
s
Eben
haes
er: U
pgr
ad
e Ro
ad
s and
Sto
rmw
ate
r in
Olif
ant
sdrif
t 3
102
022
375
1 08
0
2
UPG
RAD
E
Vo
te 5
- Pu
blic
Wor
ks a
nd B
asic
Ser
vice
s Kl
aw
er: U
pgr
ad
e o
f Sp
ort f
aci
lity
2 71
2 31
2 38
1 1
200
6 UP
GRA
DE
Vo
te 5
- Pu
blic
Wor
ks a
nd B
asic
Ser
vice
s Lu
tzvi
lle-W
est:
Upgr
ad
e of
Sp
ort f
aci
lity
2 71
2 31
2 38
0 1
700
2 UP
GRA
DE
Vo
te 5
- Pu
blic
Wor
ks a
nd B
asic
Ser
vice
s
Bitte
rfont
ein:
Ref
urb
ishm
ent O
f Bitt
erfo
ntei
n Sc
hem
e 3
202
032
378
1 80
0 1
800
1 80
0 8
REN
EWA
L
Vo
te 5
- Pu
blic
Wor
ks a
nd B
asic
Ser
vice
s V
red
end
al-N
orth
Ele
ctric
ity C
onne
ctio
n 25
0 H
ouse
s 3
302
052
879
3 00
0 3,
4 N
EW
Vo
te 5
- Pu
blic
Wor
ks a
nd B
asic
Ser
vice
s V
red
end
al-N
orth
: Up
gra
de
Roa
ds a
nd S
torm
wa
ter
3 10
2 02
2 37
4 4
528
3,4,
5 UP
GRA
DE
Vo
te 5
- Pu
blic
Wor
ks a
nd B
asic
Ser
vice
s N
uwer
us: U
pgr
ad
e Ro
ad
s and
Sto
rm w
ate
r 3
102
022
372
4 60
0 8
UPG
RAD
E
Vo
te 5
- Pu
blic
Wor
ks a
nd B
asic
Ser
vice
s
Va
nrhy
nsd
orp
: Up
gra
de
Roa
ds a
nd S
torm
wa
ter i
n M
ask
am
sig
3 10
2 02
2 37
3 6
050
7 UP
GRA
DE
Vo
te 5
- Pu
blic
Wor
ks a
nd B
asic
Ser
vice
s Bi
tterfo
ntei
n: R
efur
bish
men
t of B
itter
font
ein
Sche
me
3 20
2 03
2 37
8 8
200
8 20
0 8
200
8 RE
NEW
AL
Vo
te 5
- Pu
blic
Wor
ks a
nd B
asic
Ser
vice
s V
red
end
al S
treet
ligh
ts
3 30
2 08
2 18
5 20
0 A
ll N
EW
Vo
te 5
- Pu
blic
Wor
ks a
nd B
asic
Ser
vice
s La
wnm
ower
Tes
t Cen
tre
2 60
2 61
2 88
9 20
0 3,
4,5
NEW
V
ote
5 -
Pub
lic W
orks
and
Ba
sic S
ervi
ces
Eben
haes
er: I
rriga
tion
1 20
0 2
NEW
V
ote
5 -
Pub
lic W
orks
and
Ba
sic S
ervi
ces
Nuw
erus
: Up
gra
de
Gra
vel R
oad
s Pha
se 1
2
361
8 UP
GRA
DE
Vo
te 5
- Pu
blic
Wor
ks a
nd B
asic
Ser
vice
s
Va
nrhy
nsd
orp
: Up
gra
de
Gra
vel R
oad
in H
opla
nd,
Ma
ska
msig
4
000
7
UPG
RAD
E
Vo
te 5
- Pu
blic
Wor
ks a
nd B
asic
Ser
vice
s Kl
aw
er: U
pgr
ad
e o
f Sp
ort f
aci
lity
2 71
2 31
2 38
1 4
000
6 UP
GRA
DE
Vo
te 5
- Pu
blic
Wor
ks a
nd B
asic
Ser
vice
s V
red
end
al-
Nor
th: P
ave
Roa
ds
4 44
4 3,
4,5
NEW
V
ote
5 -
Pub
lic W
orks
and
Ba
sic S
ervi
ces
Lutz
ville
: Up
gra
de
Gra
vel R
oad
s Pa
ve
6 63
9 1
UPG
RAD
E Vo
te 5
- P
ublic
Wor
ks a
nd B
asic
Ser
vice
s V
anr
hyns
dor
p: N
ew O
utd
oor G
ym
416
7 N
EW
Vo
te 5
- Pu
blic
Wor
ks a
nd B
asic
Ser
vice
s
Refu
rbish
men
t of E
ben
haes
er W
ate
r Tre
atm
ent
wor
ks
3 20
2 03
2 38
6
90
0 2
REN
EWA
L

Page
191
of 2
36
Mun
icip
al V
ote/
Cap
ital p
roje
ct
Ref
Prog
ram
/Pro
ject
des
crip
tion
Proj
ect n
umbe
r
2017
/18
Med
ium
Term
Rev
enue
&
Expe
nditu
re F
ram
ewor
k Pr
ojec
t inf
orm
atio
n
R th
ousa
nd
4 Bu
dget
Ye
ar
2017
/18
Budg
et
Year
+1
2018
/19
Budg
et
Year
+2
2019
/20
War
d lo
catio
n N
ew o
r re
new
al
Vo
te 5
- Pu
blic
Wor
ks a
nd B
asic
Ser
vice
s
Eben
haes
er: N
uwes
tasie
: Up
gra
din
g o
f exi
stin
g gr
ave
l roa
ds a
nd s
torm
wa
ter
2
015
2 UP
GRA
DE
Vo
te 5
- Pu
blic
Wor
ks a
nd B
asic
Ser
vice
s Lu
tzvi
lle: S
torm
wa
ter
3 50
0 1
UPG
RAD
E V
ote
5 -
Pub
lic W
orks
and
Ba
sic S
ervi
ces
Koek
ena
ap
: Up
gra
de
Gra
vel R
oad
Pa
ve
4 50
0 8
UPG
RAD
E Vo
te 5
- P
ublic
Wor
ks a
nd B
asic
Ser
vice
s V
red
end
al N
orth
: Bul
k w
ate
r Up
gra
de
4 50
0 3,
4,5
UPG
RAD
E V
ote
5 -
Pub
lic W
orks
and
Ba
sic S
ervi
ces
Pap
end
orp
Oxi
da
tion
Pond
s 4
800
2 N
EW
Vo
te 6
- D
evel
opm
ent a
nd T
own
Pla
nnin
g Se
rvic
es
La
pto
p
15
A
ll N
EW
Vote
6 -
Dev
elop
men
t and
Tow
n Pl
anni
ng S
ervi
ces
O
ffice
Eq
uip
men
t
15
All
NEW
Vo
te 6
- D
evel
opm
ent a
nd T
own
Pla
nnin
g Se
rvic
es
Fu
rnitu
re a
nd E
qui
pm
ent
2 03
2 62
2 01
4 20
40
ALL
N
EW
Vo
te 6
- D
evel
opm
ent a
nd T
own
Pla
nnin
g Se
rvic
es
A
ircon
s 2
122
622
004
100
All
NEW
Vo
te 6
- D
evel
opm
ent a
nd T
own
Pla
nnin
g Se
rvic
es
A
ircon
s 2
032
622
004
20
ALL
N
EW
Pare
nt C
apita
l exp
endi
ture
1
47 0
32
38 7
22
45 2
91
Tota
l Cap
ital e
xpen
ditu
re
47 0
32
38 7
22
45 2
91
0 –

Page
192
of 2
36
WC
011
Mat
zikam
a - T
able
A1
Budg
et S
umm
ary
Desc
riptio
n 20
13/1
4 20
14/1
5 20
15/1
6 C
urre
nt Y
ear 2
016/
17
2017
/18
Med
ium
Te
rm
Reve
nue
& Ex
pend
iture
Fra
mew
ork
R th
ousa
nds
Aud
ited
Out
com
e A
udite
d O
utco
me
Aud
ited
Out
com
e O
rigin
al
Budg
et
Adj
uste
d Bu
dget
Fu
ll Ye
ar
Fore
cast
Pr
e-au
dit
outc
ome
Budg
et
Year
20
17/1
8
Budg
et
Year
+1
20
18/1
9
Budg
et
Year
+2
20
19/2
0 Fi
nanc
ial P
erfo
rman
ce
Pr
oper
ty ra
tes
28
858
32 5
74
36
598
43 2
74
43
242
43 2
42
43
242
46 6
32
49
323
52 1
17
Serv
ice
cha
rges
1
09 4
07
128
031
1
35 2
22
158
216
1
58 6
68
158
668
1
58 6
68
159
814
1
68 9
24
178
383
In
vest
men
t rev
enue
2
31
939
1 6
54
1
118
1 4
88
1
488
1 4
88
1
550
1 6
38
1
730
Tr
ans
fers
reco
gnise
d -
oper
atio
nal
45
000
49 6
40
52
131
52 9
51
55
160
55 1
60
55
160
57 0
74
61
133
65 7
53
Oth
er o
wn
reve
nue
16
503
21 6
65
18
507
20 2
01
21
323
21 3
23
21
323
24 5
98
26
000
27 4
56
Tota
l Re
venu
e (e
xclu
ding
ca
pita
l tra
nsfe
rs a
nd c
ontri
butio
ns)
199
998
232
849
244
113
275
761
279
881
279
881
279
881
289
668
307
017
325
439
Emp
loye
e co
sts
74
336
81 3
64
93
529
1
01 5
86
104
439
1
04 4
39
104
439
1
12 7
49
119
175
1
25 8
49
Rem
uner
atio
n of
cou
ncillo
rs
5
301
5 6
42
5
908
6 4
69
6
416
6 4
16
6
416
6 6
05
6
982
7 3
73
Dep
reci
atio
n &
ass
et im
pa
irmen
t
9 0
94
12
067
12 8
85
12
529
13 4
45
13
445
13 4
45
14
822
15 6
67
16
544
Fi
nanc
e ch
arg
es
7
663
8 1
80
8
313
8 5
94
9
729
9 7
29
9
729
10 1
59
10
713
11 2
89
Ma
teria
ls a
nd b
ulk
pur
cha
ses
66
829
73 8
19
82
656
89 6
62
89
662
89 6
62
89
662
90 2
81
95
427
1
00 7
71
Tra
nsfe
rs a
nd g
rant
s
8
80
928
9
57
1
038
1 0
68
1
068
1 0
68
1
132
1 1
97
1
264
O
ther
exp
end
iture
37 9
68
44
658
50 4
59
52
495
57 7
88
57
788
57 7
88
53
907
56 8
84
59
950
To
tal E
xpen
ditu
re
202
072
2
26 6
59
254
707
2
72 3
72
282
547
2
82 5
47
282
547
2
89 6
55
306
046
3
23 0
40
Surp
lus/
(Def
icit)
(2 0
73)
6
190
(
10 5
94)
3
389
(2 6
66)
(2
666
)
(2 6
66)
12
9
72
2
399
Tr
ans
fers
reco
gnise
d -
cap
ital
27
593
26 6
21
25
497
23 7
03
24
125
24 1
25
24
125
34 8
19
35
144
41 7
31
Con
trib
utio
ns r
eco
gnise
d -
ca
pita
l &
con
trib
uted
ass
ets
–
11 5
60
27
281
–
–
–
–
3 8
00
–
–
Surp
lus/
(Def
icit)
afte
r cap
ital t
rans
fers
&
cont
ribut
ions
25
520
44
371
42
184
27
092
21
459
21
459
21
459
38
631
36
116
44
130
Sha
re
of
surp
lus/
(d
efic
it)
of
ass
ocia
te
–
–
–
–
–
–
–
–
–
–
Surp
lus/
(Def
icit)
for t
he y
ear
25
520
44 3
71
42
184
27 0
92
21
459
21 4
59
21
459
38 6
31
36
116
44 1
30
Cap
ital e
xpen
ditu
re &
fund
s so
urce
s
C
apita
l exp
endi
ture
27 0
27
35
823
29 7
73
27
077
28 5
17
28
517
28 5
17
47
032
38 7
22
45
291
Tr
ans
fers
reco
gnise
d -
cap
ital
25
797
26 2
51
25
497
23 7
03
24
125
24 1
25
24
125
34 8
19
35
144
41 7
31

Page
193
of 2
36
Desc
riptio
n 20
13/1
4 20
14/1
5 20
15/1
6 C
urre
nt
Year
20
16/1
7
2017
/18
Med
ium
Te
rm
Reve
nue
& Ex
pend
iture
Fr
amew
ork
R th
ousa
nds
Aud
ited
Out
com
e A
udite
d O
utco
me
Aud
ited
Out
com
e O
rigin
al
Budg
et
Adj
uste
d Bu
dget
Fu
ll Ye
ar
Fore
cast
Pr
e-au
dit
outc
ome
Budg
et
Year
20
17/1
8
Budg
et
Year
+1
20
18/1
9
Budg
et
Year
+2
20
19/2
0 Pu
blic
co
ntrib
utio
ns &
don
atio
ns
–
–
–
–
–
–
–
3 7
00
–
–
Borro
win
g
–
–
–
–
–
–
–
–
–
–
In
tern
ally
gen
era
ted
fund
s
1 2
30
9
572
4 2
75
3
375
4 3
92
4
392
4 3
92
8
513
3 5
79
3
560
To
tal s
ourc
es o
f cap
ital f
unds
27 0
27
35
823
29 7
73
27
077
28 5
17
28
517
28 5
17
47
032
38 7
22
45
291
Fi
nanc
ial p
ositi
on
Tota
l cur
rent
ass
ets
18
311
28 6
11
31
283
41 4
78
35
264
35 2
64
35
264
36 5
20
50
073
64 9
02
Tota
l non
-cur
rent
ass
ets
503
366
5
46 3
91
587
033
5
75 6
95
611
516
6
11 5
16
611
516
6
59 1
14
681
169
7
08 9
16
Tota
l cur
rent
lia
bilit
ies
44
904
41 5
07
37
916
38 0
76
39
646
39 6
46
39
646
42 0
47
47
940
53 3
22
Tota
l non
curre
nt lia
bilit
ies
94
916
1
09 1
35
112
567
1
05 8
71
116
824
1
16 8
24
116
824
1
30 3
26
129
607
1
26 2
50
Com
mun
ity w
ealth
/Eq
uity
3
81 8
57
424
360
4
67 8
34
473
227
4
90 3
10
490
310
4
90 3
10
523
260
5
53 6
95
594
246
C
ash
flow
s
N
et c
ash
fro
m (u
sed
) op
era
ting
30 4
49
40
174
30 2
33
24
925
29 4
82
29
482
29 4
82
42
069
44 1
58
52
609
Net
ca
sh fr
om
(use
d) i
nves
ting
(
23 8
69)
(26
982
)
(
26
150)
(
22
975)
(
23
267)
(
23
267)
(
23
267)
(
41 0
32)
(32
38
0)
(38
59
4)
Net
ca
sh fr
om
(use
d) f
ina
ncin
g
(6
200
)
(5 1
58)
(4
305
)
(3 7
78)
(3
917
)
(3 9
17)
(3
917
)
(4 9
38)
(5
516
)
(8 5
06)
Cas
h/ca
sh e
quiv
alen
ts a
t th
e ye
ar
end
2
699
10 7
33
10
511
14 7
98
12
808
12 8
08
12
808
6 6
10
12
872
18 3
81
Cas
h ba
ckin
g/su
rplu
s re
conc
iliat
ion
Ca
sh a
nd in
vest
men
ts a
vaila
ble
2 6
99
10
733
10 5
11
14
798
12 8
08
12
808
12 8
08
6
610
12 8
72
18
381
A
pp
lica
tion
of
cash
a
nd
inve
stm
ents
14 6
39
14
664
6 0
75
1
461
7 3
50
7
350
7 3
50
389
(2 6
53)
(9
581
) Ba
lanc
e -
surp
lus
(sho
rtfal
l)
(
11 9
40)
(3
931
)
4 4
36
13
337
5 4
58
5
458
5 4
58
6
221
15 5
25
27
962
Ass
et m
anag
emen
t
Ass
et re
gist
er su
mm
ary
(W
DV
)
5
03 2
06
546
237
5
86 9
21
575
550
6
11 4
04
611
404
–
646
114
6
69 1
69
697
916
D
epre
cia
tion
& a
sset
imp
airm
ent
9
094
12 0
67
12
885
12 5
29
13
445
13 4
45
–
14 8
22
15
667
16 5
44
Rene
wa
l of E
xist
ing
Ass
ets
3
515
26 8
23
10
235
7 5
90
7
876
7 8
76
7
876
10 9
60
10
500
11 4
00
Rep
airs
and
Ma
inte
nanc
e
8 4
00
8
685
8 2
72
10
342
11 4
68
11
468
–
7
713
8 1
52
8
609

Page
194
of 2
36
Desc
riptio
n 20
13/1
4 20
14/1
5 20
15/1
6 C
urre
nt
Year
20
16/1
7
2017
/18
Med
ium
Te
rm
Reve
nue
& Ex
pend
iture
Fr
amew
ork
R th
ousa
nds
Aud
ited
Out
com
e A
udite
d O
utco
me
Aud
ited
Out
com
e O
rigin
al
Budg
et
Adj
uste
d Bu
dget
Fu
ll Ye
ar
Fore
cast
Pr
e-au
dit
outc
ome
Budg
et
Year
20
17/1
8
Budg
et
Year
+1
20
18/1
9
Budg
et
Year
+2
20
19/2
0 Fr
ee s
ervi
ces
C
ost o
f Fre
e Ba
sic S
ervi
ces p
rovi
ded
–
–
13 6
29
14
872
14 8
72
14
872
–
18
178
19 9
96
21
995
Re
venu
e co
st
of
free
serv
ices
p
rovi
ded
75
115
3
32
342
6
03
603
–
1
173
1 2
07
1
243
Ho
useh
olds
bel
ow m
inim
um s
ervi
ce
leve
l
Wa
ter:
–
–
–
–
–
–
–
–
–
–
Sani
tatio
n/se
wer
ag
e:
–
–
–
–
–
–
–
–
–
–
Ener
gy:
11
11
12
12
12
12
–
9
9
9
Re
fuse
:
–
–
–
–
–
–
–
–
–
–
Type
20
17/2
018
(R ‘0
00)
2018
/201
9 (R
‘000
) 20
19/2
020
(R ‘0
00)
Reve
nue
289
668
308
572
327
081
Exp
endi
ture
28
9 65
5 30
6 04
6 32
3 04
0
Ca
pita
l tra
nsfe
rs 38
619
35
144
41
731
Surp
lus
38 6
31
37 6
71
45 7
72

Page 195 of 236
Operating Income
Operating Expenditure
Capital Expenditure
(R ‘000) (R ‘000) (R ‘000) Executive and Council – 13 915 650
Financial Services 129 827 34 293 400
Corporate Services 328 16 064 195
Community Services 36 525 52 715 2 286
Public Works and Basic Services 150 959 158 269 43 351
Development and Planning 11 222 14 399 150
Total 328 860 289 655 47 032
The biggest contributor to revenue is electricity followed by operational grants and property rates. Employee related costs take the lion share of the expenditure budget followed by bulk purchases and other expenditures.

Page 196 of 236
7.4 LINKING THE BUDGET TO THE IDP
7.4.1 Introduction
This section provides the reader with information showing how the budget of the Municipality is linked to the development objectives of Council.
7.4.2 MSCOA
Matzikama Municipality must be mSCOA compliant on 1 July 2017, meaning we must be able to transact across all the mSCOA segments and its core system and all sub-systems must seamlessly integrate. Matzikama shall prioritise the maximum integration capabilities of our core financial system so that it integrates with the Debtors main sub-system (including cash management and receipting), Payroll and the Assets Management sub-system modules. This approach will facilitate seamless integration of the Integrated Development Plan (IDP), Service Delivery and Budget Implementation Plan (SDBIP) and Budget facilities into the core financial system.

Page 197 of 236
Page 198 of 236
8.1 INTRODUCTION
This section will be used in the future (as part of the revision of the IDP) to report progress on the implementation of the strategy.
8.2 Performance Management System
8.2.1 Performance Planning
The Performance Management System implemented at the municipality provides a comprehensive performance planning process which is intended to help the municipality with the process of performance planning and measurement. A Performance Management Policy was adopted by Council. The IDP of the municipality sets out what the municipality intends to achieve or what the community can expect. The Budget gives effect to the strategic objectives of Council. The IDP and Budget of the municipality are implemented through the Service Delivery and Budget Implementation Plan (SDBIP) thus giving effect to the IDP and Budget.
The SDBIP is a layered plan with the top layer containing consolidated service delivery targets and in-year deadlines which are linked to top management. The Top Layered SDBIP is made public and tabled to council. Once the top layer targets are set - senior managers compile the lower level detail of the SDBIP. The lower level of the SDBIP is used to hold junior to middle level managers accountable.
8.2.2 Performance Monitoring and Evaluation
The Top Layer SDBIP is used as a scorecard to measure, monitor, evaluate and report on institutional performance. Institutional performance is updated monthly on a web enabled system. The system produces monthly, quarterly, bi-annual and annual reports. Quarterly performance reports are submitted to council as required by section 52(d) of the MFMA. The performance of the first 6 months of the financial year is assessed during January and reported on in terms of section 72 of the MFMA. This assessment is submitted to council and includes the measurement of performance, the identification of corrective actions and recommendations for the adjustments of KPI’s, if necessary. An Annual Report is produced annually to give an overview of institutional performance against set targets.

Page 199 of 236
8.3 IDP Projects for 2017/2022
The tables and graphs below reveal the Projects that emanated from the Community needs including Civil Society, Business Society, Farming Communities as well as the Administration of Matzikama Municipality. Responsible Departments and role players for each project were identified according to their respective functional roles. This section will also be utilised as a monitoring tool in future reviews.
WARD 1 STATUS OWNER PROJECT FUNCTION 17/18 18/19 19/20 20/21 21/22
Civil Society Encourage mining companies to do more for social and economic development
DMR
Civil Society Upgrade sport facilities Lutzville-Uitkyk MATZ
Civil Society Fencing at Vlermuisklip monument MATZ
Civil Society Improve and encourage education through ABET classes WCED
Civil Society Increase Xhosa-speaking teachers at the primary school in Lutzville-Uitkyk
WCED
Civil Society Improve ambulance response times DOH
Civil Society Increase doctor’s hours at community clinics DOH
Civil Society Provide an ambulance waiting room in Ward DOH
Civil Society Provide first aid training to volunteers to assist while waiting for the ambulance
DOH
Civil Society Provide low cost housing in Mbeki Square DOHS
Civil Society Create job opportunities Joint function: MATZ, DEDAT, Private sector
Civil Society Establish a sports facility in Lutzville West MATZ
Civil Society Provide adequate tables and chairs to halls MATZ
Civil Society Upgrade sewage network in Hopland Lutzville (Uitkyk) MATZ
Civil Society Use commonage land for housing projects MATZ
Civil Society Develop serviced plots for churches MATZ
Civil Society Fenced oxidation dams Lutzville (Uitkyk) MATZ
Civil Society Install and repair street lights in dark areas Lutzville (Uitkyk) MATZ
Civil Society Install road signs & speed bumps in Mbeki Square MATZ
Civil Society Install speed bumps in Lutzville- MATZ

Page 200 of 236
WARD 1 STATUS OWNER PROJECT FUNCTION 17/18 18/19 19/20 20/21 21/22
West
Civil Society Install street lights near school Lutzville-West MATZ
Civil Society Make land available for a sports field in Lutzville-West DOPW
Civil Society Pave gravel road MATZ
Civil Society Provide serviced plots for new business development in Lutzville (Uitkyk)
MATZ
Civil Society Provision of serviced residential plots in Lutzville West MATZ
Civil Society Reduce rental of community halls to churches MATZ
Civil Society Safeguard play park in Lutzville -Uitkyk MATZ
Civil Society Safeguard taxi rank in Lutzville -Uitkyk MATZ
Civil Society Supply wheelie bins to the ward MATZ
Civil Society Upgrade kitchen equipment of community hall MATZ
DMR 3% WCED
7%
DoH 14%
Joint: MATZ, DoHS
3%
DoPW 3% Joint function: MATZ, DEDAT, Private Sector
3%
MATZ 67%
WARD 1
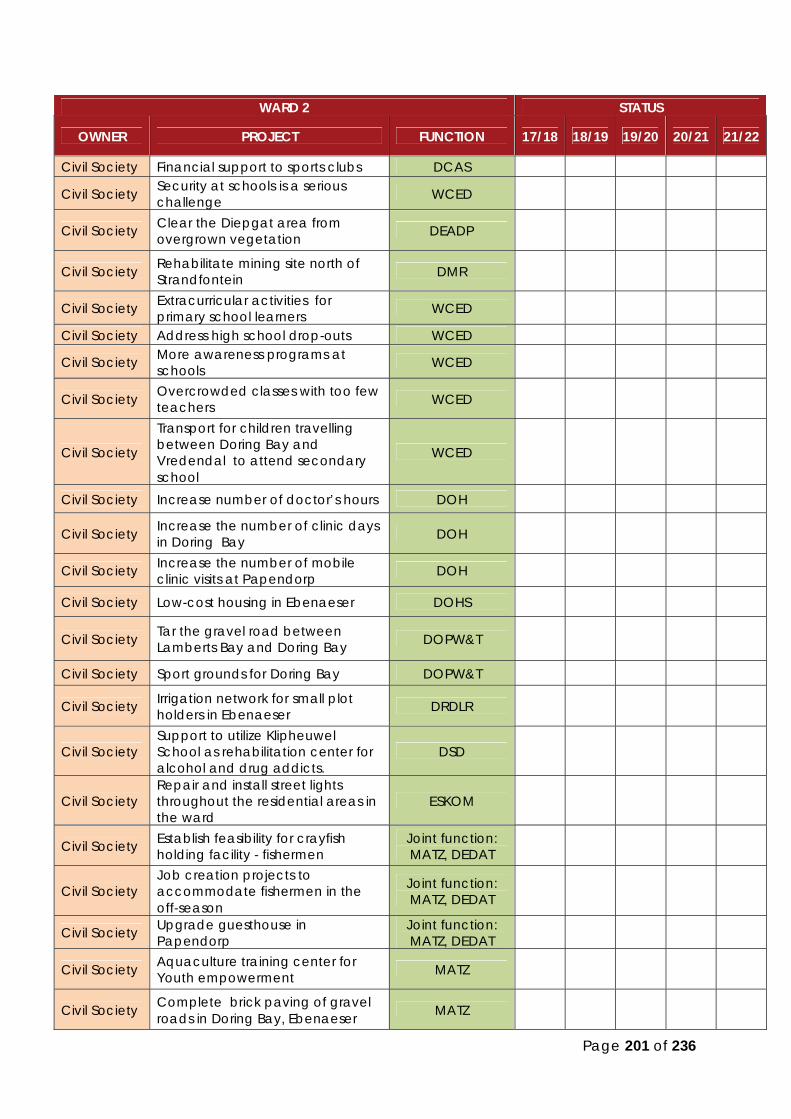
Page 201 of 236
WARD 2 STATUS
OWNER PROJECT FUNCTION 17/18 18/19 19/20 20/21 21/22
Civil Society Financial support to sports clubs DCAS
Civil Society Security at schools is a serious challenge WCED
Civil Society Clear the Diepgat area from overgrown vegetation DEADP
Civil Society Rehabilitate mining site north of Strandfontein DMR
Civil Society Extracurricular activities for primary school learners WCED
Civil Society Address high school drop-outs WCED
Civil Society More awareness programs at schools WCED
Civil Society Overcrowded classes with too few teachers WCED
Civil Society
Transport for children travelling between Doring Bay and Vredendal to attend secondary school
WCED
Civil Society Increase number of doctor’s hours DOH
Civil Society Increase the number of clinic days in Doring Bay DOH
Civil Society Increase the number of mobile clinic visits at Papendorp DOH
Civil Society Low-cost housing in Ebenaeser DOHS
Civil Society Tar the gravel road between Lamberts Bay and Doring Bay DOPW&T
Civil Society Sport grounds for Doring Bay DOPW&T
Civil Society Irrigation network for small plot holders in Ebenaeser DRDLR
Civil Society Support to utilize Klipheuwel School as rehabilitation center for alcohol and drug addicts.
DSD
Civil Society Repair and install street lights throughout the residential areas in the ward
ESKOM
Civil Society Establish feasibility for crayfish holding facility - fishermen
Joint function: MATZ, DEDAT
Civil Society Job creation projects to accommodate fishermen in the off-season
Joint function: MATZ, DEDAT
Civil Society Upgrade guesthouse in Papendorp
Joint function: MATZ, DEDAT
Civil Society Aquaculture training center for Youth empowerment MATZ
Civil Society Complete brick paving of gravel roads in Doring Bay, Ebenaeser MATZ

Page 202 of 236
WARD 2 STATUS
OWNER PROJECT FUNCTION 17/18 18/19 19/20 20/21 21/22
and Papendorp
Civil Society Complete reseal of main road leading into Kreef- as well as Skulpies Road
MATZ
Civil Society Housing needs analysis for the ward MATZ
Civil Society Implementation of proper vermin and pest control program in Strandfontein
MATZ
Civil Society Implementation of proper waste management and recycling program
MATZ
Civil Society Improve communication to and from ward committees MATZ
Civil Society Intervention/funding to renew/upgrade Strandfontein water network
MATZ
Civil Society Investigate land ownership in Doring Bay MATZ
Civil Society Provide technical skills to technical personnel (Strandfontein) MATZ
Civil Society Provision of enough water to reservoirs and water pressure in town (Strandfontein)
MATZ
Civil Society Provision of recycling domes for glass, tin and paper MATZ
Civil Society Registration of Strandfontein dumping site, monitor, manage and fund
MATZ
Civil Society Regular maintenance of chalets and camping sites in Strandfontein
MATZ
Civil Society
Repair and upgrade town hall facilities in Strandfontein, Miriam Owies and MPRC halls in Doring Bay
MATZ
Civil Society Replace obsolete waste bins in Strandfontein with new ones MATZ
Civil Society Upgrade sewage pump station at Kommetjie - Strandfontein MATZ
Civil Society Upgrade storm water network and brick pave sidewalks (Strandfontein)
MATZ
Civil Society Upgrade the sewerage system in Ebenaeser MATZ
Civil Society Upgrade/safeguard municipal pay office - Strandfontein MATZ
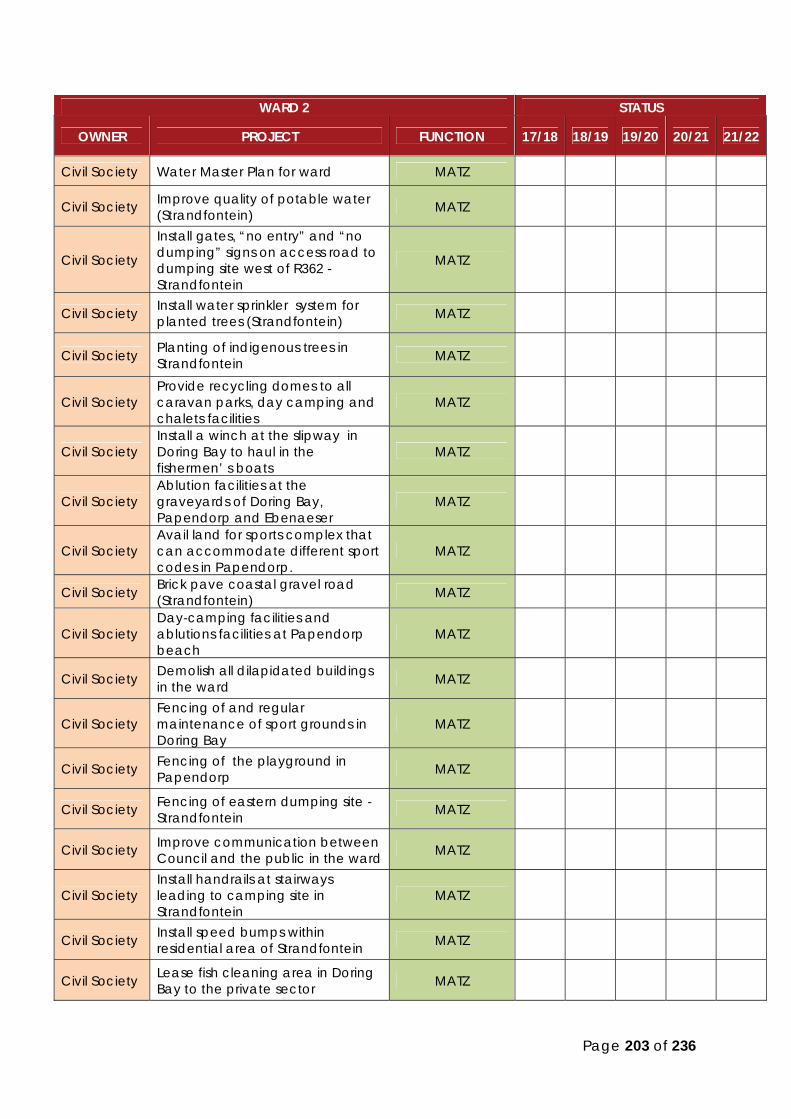
Page 203 of 236
WARD 2 STATUS
OWNER PROJECT FUNCTION 17/18 18/19 19/20 20/21 21/22
Civil Society Water Master Plan for ward MATZ
Civil Society Improve quality of potable water (Strandfontein) MATZ
Civil Society
Install gates, “no entry” and “no dumping” signs on access road to dumping site west of R362 - Strandfontein
MATZ
Civil Society Install water sprinkler system for planted trees (Strandfontein) MATZ
Civil Society Planting of indigenous trees in Strandfontein MATZ
Civil Society Provide recycling domes to all caravan parks, day camping and chalets facilities
MATZ
Civil Society Install a winch at the slipway in Doring Bay to haul in the fishermen’ s boats
MATZ
Civil Society Ablution facilities at the graveyards of Doring Bay, Papendorp and Ebenaeser
MATZ
Civil Society Avail land for sports complex that can accommodate different sport codes in Papendorp.
MATZ
Civil Society Brick pave coastal gravel road (Strandfontein) MATZ
Civil Society Day-camping facilities and ablutions facilities at Papendorp beach
MATZ
Civil Society Demolish all dilapidated buildings in the ward MATZ
Civil Society Fencing of and regular maintenance of sport grounds in Doring Bay
MATZ
Civil Society Fencing of the playground in Papendorp MATZ
Civil Society Fencing of eastern dumping site - Strandfontein MATZ
Civil Society Improve communication between Council and the public in the ward MATZ
Civil Society Install handrails at stairways leading to camping site in Strandfontein
MATZ
Civil Society Install speed bumps within residential area of Strandfontein MATZ
Civil Society Lease fish cleaning area in Doring Bay to the private sector MATZ

Page 204 of 236
WARD 2 STATUS
OWNER PROJECT FUNCTION 17/18 18/19 19/20 20/21 21/22
Civil Society Relocate oxidation dams in Ebenaeser to address health risk MATZ
Civil Society Maintenance of all internal roads in Strandfontein MATZ
Civil Society Repair the Multi-purpose resource center in Doring Bay to make it safer
MATZ
Civil Society Pave pedestrian walk- and stairways in Strandfontein MATZ
Civil Society Pave the gravel road to the harbour in Doring Bay MATZ
Civil Society Pave the main road and sidewalks of Doring Bay MATZ
Civil Society Seating at sport grounds in Doring Bay MATZ
Civil Society Upgrade and pave all public parking areas in Strandfontein MATZ
Civil Society Upgrade street signs and -names (Strandfontein) MATZ
Civil Society Satellite police station in Ebenaeser SAPS
Civil Society Increase personnel at police station in Doring Bay SAPS
Civil Society Target crime hotspots SAPS
Civil Society The police must become more involve in CPFs SAPS
DCAS 2%
WCED 8%
DEADP 2%
DMR 1%
DOH 4%
JOINT: MATZ, DOHS
1%
DOPW&T 3%
DRDLR 1% DSD
1% ESKOM
1%
JOINT: MATZ, DEDAT
4%
MATZ 66%
SAPS 6%
WARD 2
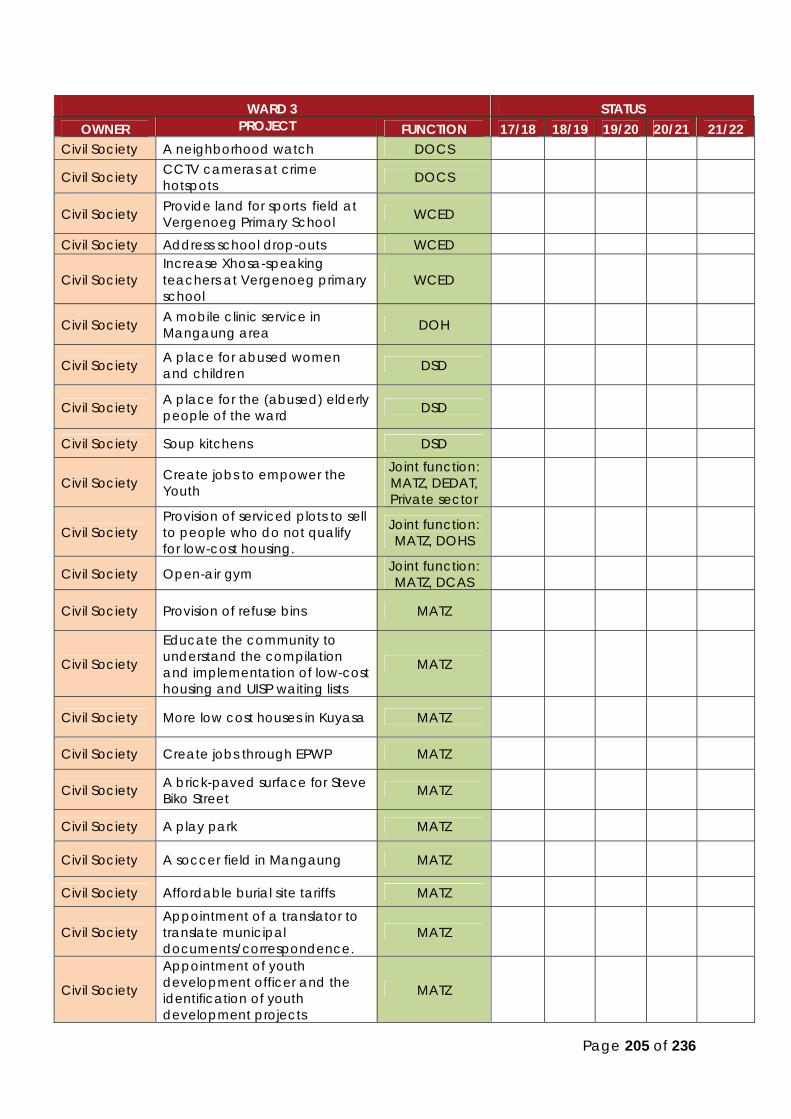
Page 205 of 236
WARD 3 STATUS OWNER PROJECT FUNCTION 17/18 18/19 19/20 20/21 21/22
Civil Society A neighborhood watch DOCS
Civil Society CCTV cameras at crime hotspots DOCS
Civil Society Provide land for sports field at Vergenoeg Primary School WCED
Civil Society Address school drop-outs WCED
Civil Society Increase Xhosa-speaking teachers at Vergenoeg primary school
WCED
Civil Society A mobile clinic service in Mangaung area DOH
Civil Society A place for abused women and children DSD
Civil Society A place for the (abused) elderly people of the ward DSD
Civil Society Soup kitchens DSD
Civil Society Create jobs to empower the Youth
Joint function: MATZ, DEDAT, Private sector
Civil Society Provision of serviced plots to sell to people who do not qualify for low-cost housing.
Joint function: MATZ, DOHS
Civil Society Open-air gym Joint function: MATZ, DCAS
Civil Society Provision of refuse bins MATZ
Civil Society
Educate the community to understand the compilation and implementation of low-cost housing and UISP waiting lists
MATZ
Civil Society More low cost houses in Kuyasa MATZ
Civil Society Create jobs through EPWP MATZ
Civil Society A brick-paved surface for Steve Biko Street MATZ
Civil Society A play park MATZ
Civil Society A soccer field in Mangaung MATZ
Civil Society Affordable burial site tariffs MATZ
Civil Society Appointment of a translator to translate municipal documents/correspondence.
MATZ
Civil Society
Appointment of youth development officer and the identification of youth development projects
MATZ
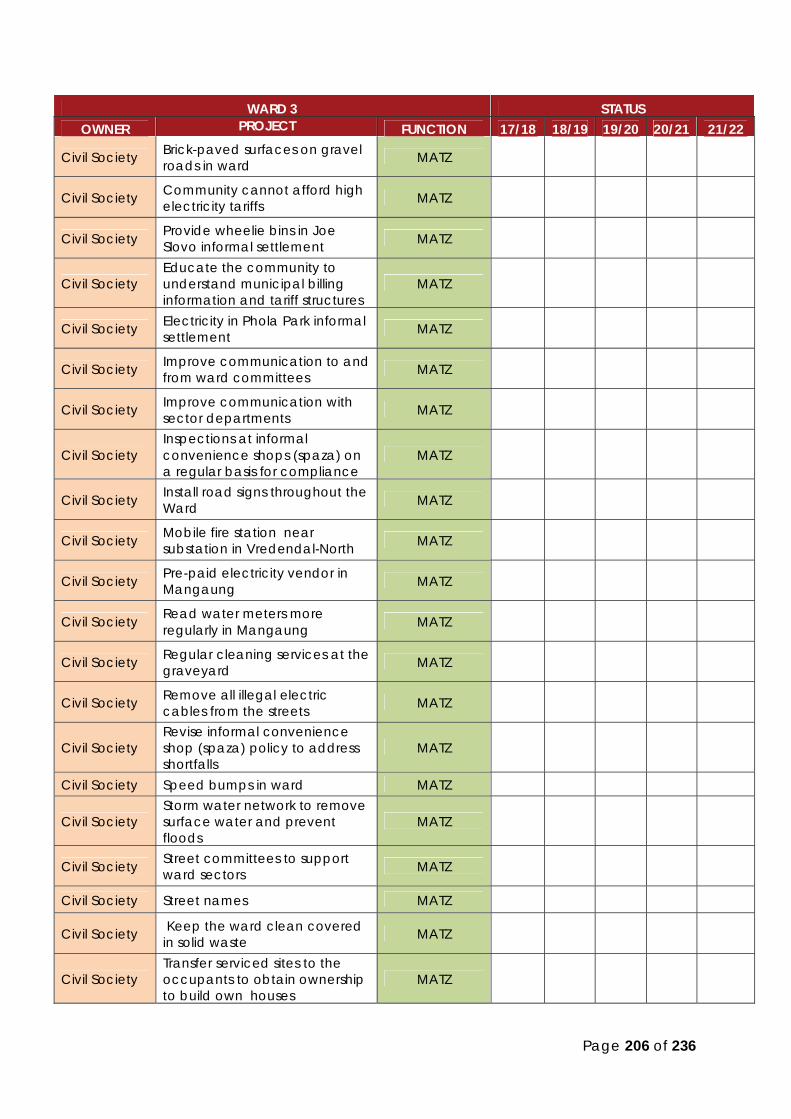
Page 206 of 236
WARD 3 STATUS OWNER PROJECT FUNCTION 17/18 18/19 19/20 20/21 21/22
Civil Society Brick-paved surfaces on gravel roads in ward MATZ
Civil Society Community cannot afford high electricity tariffs MATZ
Civil Society Provide wheelie bins in Joe Slovo informal settlement MATZ
Civil Society Educate the community to understand municipal billing information and tariff structures
MATZ
Civil Society Electricity in Phola Park informal settlement MATZ
Civil Society Improve communication to and from ward committees MATZ
Civil Society Improve communication with sector departments MATZ
Civil Society Inspections at informal convenience shops (spaza) on a regular basis for compliance
MATZ
Civil Society Install road signs throughout the Ward MATZ
Civil Society Mobile fire station near substation in Vredendal-North MATZ
Civil Society Pre-paid electricity vendor in Mangaung MATZ
Civil Society Read water meters more regularly in Mangaung MATZ
Civil Society Regular cleaning services at the graveyard MATZ
Civil Society Remove all illegal electric cables from the streets MATZ
Civil Society Revise informal convenience shop (spaza) policy to address shortfalls
MATZ
Civil Society Speed bumps in ward MATZ
Civil Society Storm water network to remove surface water and prevent floods
MATZ
Civil Society Street committees to support ward sectors MATZ
Civil Society Street names MATZ
Civil Society Keep the ward clean covered in solid waste MATZ
Civil Society Transfer serviced sites to the occupants to obtain ownership to build own houses
MATZ

Page 207 of 236
WARD 3 STATUS OWNER PROJECT FUNCTION 17/18 18/19 19/20 20/21 21/22
Civil Society Visible traffic to control speeding vehicles MATZ
Civil Society A community hall with thusong center MATZ
Civil Society ECDC for Mangaung MATZ
Civil Society A satellite police station in the ward SAPS
WARD 4 STATUS OWNER PROJECT FUNCTION 17/18 18/19 19/20 20/21 21/22
Civil Society Address adapting issue of learners from farming schools to high school
WCED
Civil Society Safety of learners at school WCED Civil Society School drop-outs WCED
Civil Society Upgrading of sports ground at schools in ward 4 WCED
Civil Society Develop a day camping site at the eco park DEADP
Civil Society Awareness programs of HIV and AIDS, TB DOH
Civil Society Divisions in clinics for infectious diseases DOH
Civil Society Improve functionality of clinics DOH
Civil Society Minimize unhygienic conditions at clinic DOH
DCS&S 4% WCED
7% DOH 2% DSD
6%
JOINT: MATZ, DEDAT,
PRIVATE SECTOR
2%
JOINT: MATZ, DOHS
2%
MATZ 75%
SAPS 2%
WARD 3

Page 208 of 236
WARD 4 STATUS OWNER PROJECT FUNCTION 17/18 18/19 19/20 20/21 21/22
Civil Society Waiting room for patients to be transported to Cape Town DOH
Civil Society Provide Wi-Fi spots DLG Civil Society Assist CAB with funding DSD
Civil Society Rehabilitation Centre for alcoholic and drug addicts DSD
Civil Society Establish recycling factory to create jobs
Joint function: MATZ, DEDAT
Civil Society Job creation for youth Joint function: MATZ, DEDAT, Private sector
Civil Society Building of houses for farm workers
Joint function: MATZ, DOHS
Civil Society Maintenance of gravel road to Beeswater
Joint function: MATZ, WCDM,
DoTPW
Civil Society Maintenance of road to Ratelgat during festive season
Joint function: MATZ, WCDM,
DoTPW
Civil Society Improve access to Beeswater Joint function: MATZ, WCDM,
DoTPW Civil Society Need for indoor sport facility MATZ Civil Society Recreational amenities for youth MATZ
Civil Society Address affordability of tariffs for graves MATZ
Civil Society Appointment of security officer at the graveyard MATZ
Civil Society Assist with funding for community festivals MATZ
Civil Society Business hours of Tavern in Ward 4 problematic MATZ
Civil Society Ward cleansing project MATZ Civil Society Demolish taxi rank MATZ
Civil Society
Education and awareness programs to communities regarding payment for municipal services
MATZ
Civil Society Establish a taxi rank near Vergenoeg school MATZ
Civil Society Establish sidewalks at Morgenson Street and Avon Street MATZ
Civil Society Establish speed bumps in Gegund Street MATZ
Civil Society Fencing of play park in Vanrhynweg MATZ
Civil Society Fencing of cemetery MATZ Civil Society Fencing of sewerage dams MATZ
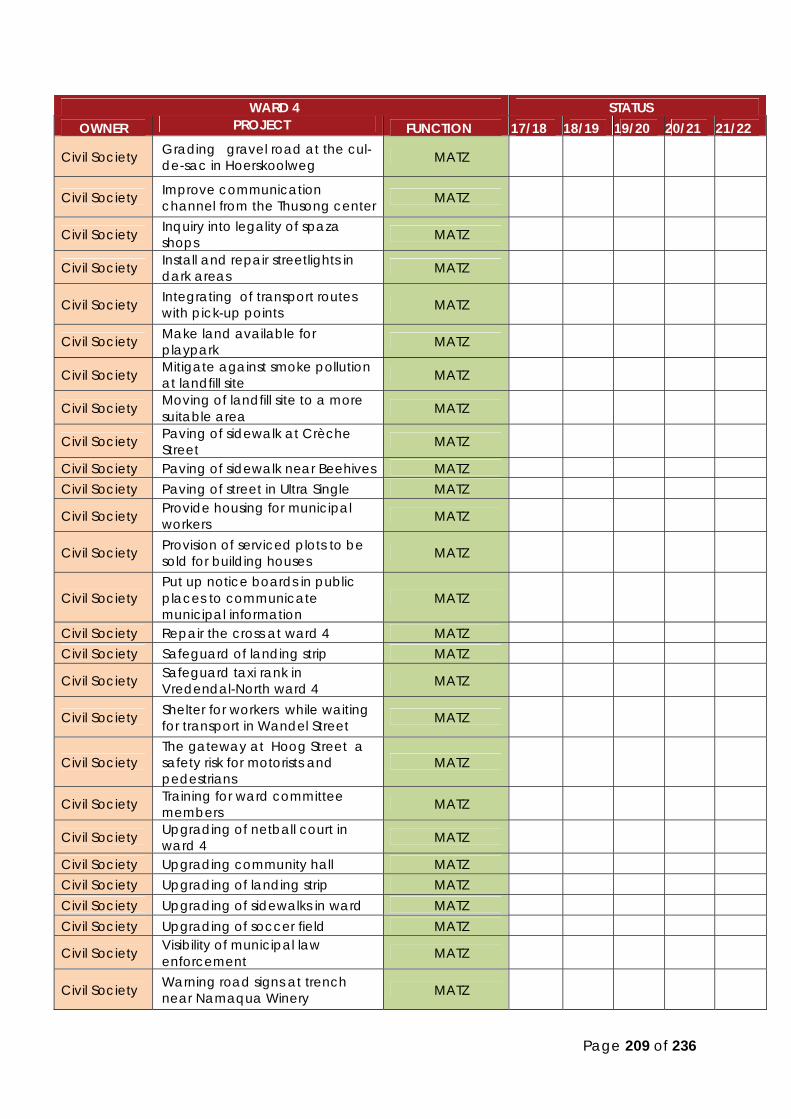
Page 209 of 236
WARD 4 STATUS OWNER PROJECT FUNCTION 17/18 18/19 19/20 20/21 21/22
Civil Society Grading gravel road at the cul-de-sac in Hoerskoolweg MATZ
Civil Society Improve communication channel from the Thusong center MATZ
Civil Society Inquiry into legality of spaza shops MATZ
Civil Society Install and repair streetlights in dark areas MATZ
Civil Society Integrating of transport routes with pick-up points MATZ
Civil Society Make land available for playpark MATZ
Civil Society Mitigate against smoke pollution at landfill site MATZ
Civil Society Moving of landfill site to a more suitable area MATZ
Civil Society Paving of sidewalk at Crèche Street MATZ
Civil Society Paving of sidewalk near Beehives MATZ Civil Society Paving of street in Ultra Single MATZ
Civil Society Provide housing for municipal workers MATZ
Civil Society Provision of serviced plots to be sold for building houses MATZ
Civil Society Put up notice boards in public places to communicate municipal information
MATZ
Civil Society Repair the cross at ward 4 MATZ Civil Society Safeguard of landing strip MATZ
Civil Society Safeguard taxi rank in Vredendal-North ward 4 MATZ
Civil Society Shelter for workers while waiting for transport in Wandel Street MATZ
Civil Society The gateway at Hoog Street a safety risk for motorists and pedestrians
MATZ
Civil Society Training for ward committee members MATZ
Civil Society Upgrading of netball court in ward 4 MATZ
Civil Society Upgrading community hall MATZ Civil Society Upgrading of landing strip MATZ Civil Society Upgrading of sidewalks in ward MATZ Civil Society Upgrading of soccer field MATZ
Civil Society Visibility of municipal law enforcement MATZ
Civil Society Warning road signs at trench near Namaqua Winery MATZ
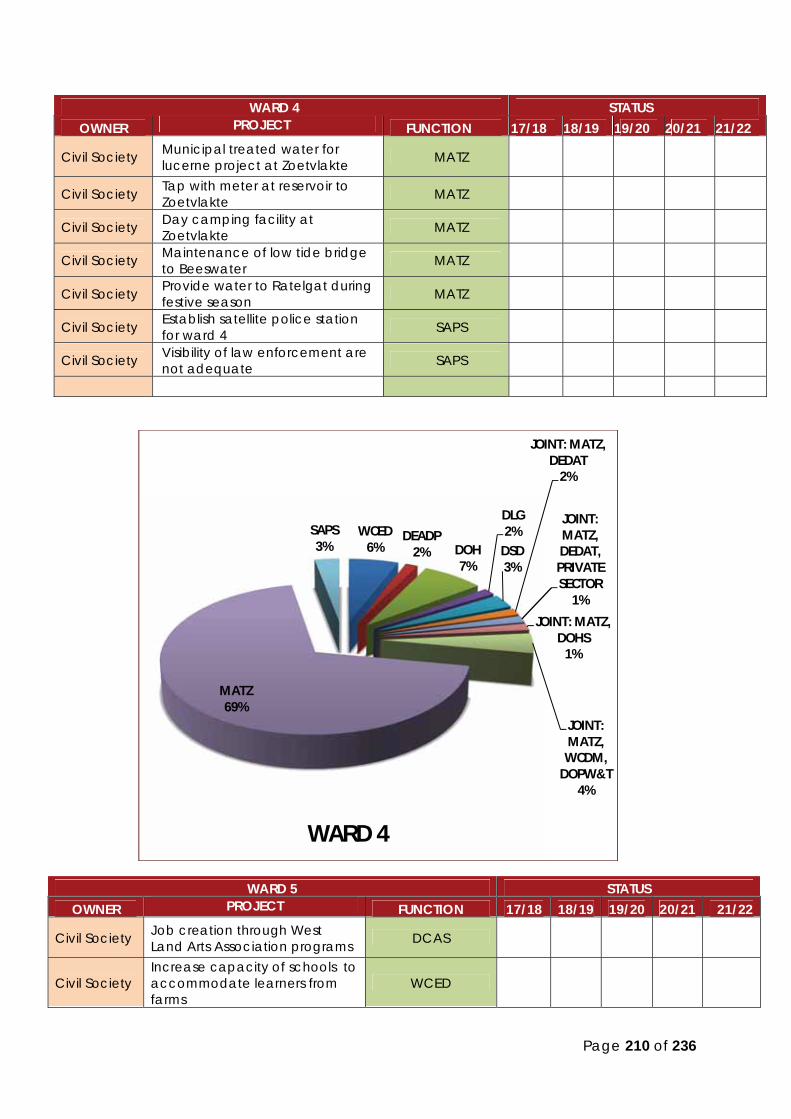
Page 210 of 236
WARD 4 STATUS OWNER PROJECT FUNCTION 17/18 18/19 19/20 20/21 21/22
Civil Society Municipal treated water for lucerne project at Zoetvlakte MATZ
Civil Society Tap with meter at reservoir to Zoetvlakte MATZ
Civil Society Day camping facility at Zoetvlakte MATZ
Civil Society Maintenance of low tide bridge to Beeswater MATZ
Civil Society Provide water to Ratelgat during festive season MATZ
Civil Society Establish satellite police station for ward 4 SAPS
Civil Society Visibility of law enforcement are not adequate SAPS
WARD 5 STATUS OWNER PROJECT FUNCTION 17/18 18/19 19/20 20/21 21/22
Civil Society Job creation through West Land Arts Association programs DCAS
Civil Society Increase capacity of schools to accommodate learners from farms
WCED
WCED 6%
DEADP 2% DOH
7%
DLG 2%
DSD 3%
JOINT: MATZ, DEDAT
2%
JOINT: MATZ, DEDAT,
PRIVATE SECTOR
1%
JOINT: MATZ, DOHS
1%
JOINT: MATZ,
WCDM, DOPW&T
4%
MATZ 69%
SAPS 3%
WARD 4

Page 211 of 236
WARD 5 STATUS OWNER PROJECT FUNCTION 17/18 18/19 19/20 20/21 21/22
Civil Society Clearing of alien trees (eucalyptus) in river DEADP
Civil Society Build technical school in Vredendal WCED
Civil Society Increase capacity at Hospital & Clinic DOH
Civil Society Upgrade road between farms DOPW
Civil Society Initiate aftercare programmes for youth (Westland Arts Association)
DSD
Civil Society Effective re-seal of streets in Ward 5 MATZ
Civil Society Apply and regulate municipal by-laws in Vredendal MATZ
Civil Society Apply contract management on private plots (property tax) MATZ
Civil Society Availability of plots (residential & industrial) MATZ
Civil Society Buy-back of low cost houses to sell (preference to people who pay for services)
MATZ
Civil Society Clean open spaces which are fire hazards MATZ
Civil Society Compile and implement Tourism Plan for MATZ MATZ
Civil Society Distribute wheelie bins MATZ
Civil Society Effective implementation of performance management system of municipality
MATZ
Civil Society Effective monitoring/supervision of workers who clean streets (EPWP)
MATZ
Civil Society Establish a composting project MATZ
Civil Society Investigate establishment of municipal court MATZ
Civil Society Fencing of Voortrekker Street MATZ
Civil Society Provide Gap housing MATZ
Civil Society Improve feedback timeframe regarding building plan & rezoning applications
MATZ
Civil Society Improve visibility and services at Matzikama Traffic Department MATZ
Civil Society Improved communication with public regarding Strandfontein MATZ

Page 212 of 236
WARD 5 STATUS OWNER PROJECT FUNCTION 17/18 18/19 19/20 20/21 21/22
Resort bookings during weekends
Civil Society Install road signs at Karin building indicating direction to Lutzville
MATZ
Civil Society Install directions signage to tourism office MATZ
Civil Society Investigate possibility of outdoor gym MATZ
Civil Society Investigate/limit contracts awarded to ASLA MATZ
Civil Society Issue fines to people that dump waste illegally MATZ
Civil Society Maintain sport grounds MATZ
Civil Society Maintaining municipal infrastructure regularly MATZ
Civil Society Maintenance of gravel road in Industrial area MATZ
Civil Society Make consolidated statement for municipal debt available MATZ
Civil Society Monitor effectiveness/ productivity of weekly planning for municipal officials
MATZ
Civil Society Paving of Eureka-, Peace- & Marble Street MATZ
Civil Society Possibility of upgrading parks to sell as plots MATZ
Civil Society Preparation of graves in advance MATZ
Civil Society Provide permission and support to beautify parks to Westland Arts
MATZ
Civil Society Provide premises/space for arts exhibition MATZ
Civil Society Regulation of alcohol consumption on sports fields MATZ
Civil Society Repair sewage pump MATZ
Civil Society Safeguard sport ground MATZ
Civil Society Safeguard taxi rank behind Lewis MATZ
Civil Society Sell plots in Vredendal - North to support housing development for farm workers
MATZ
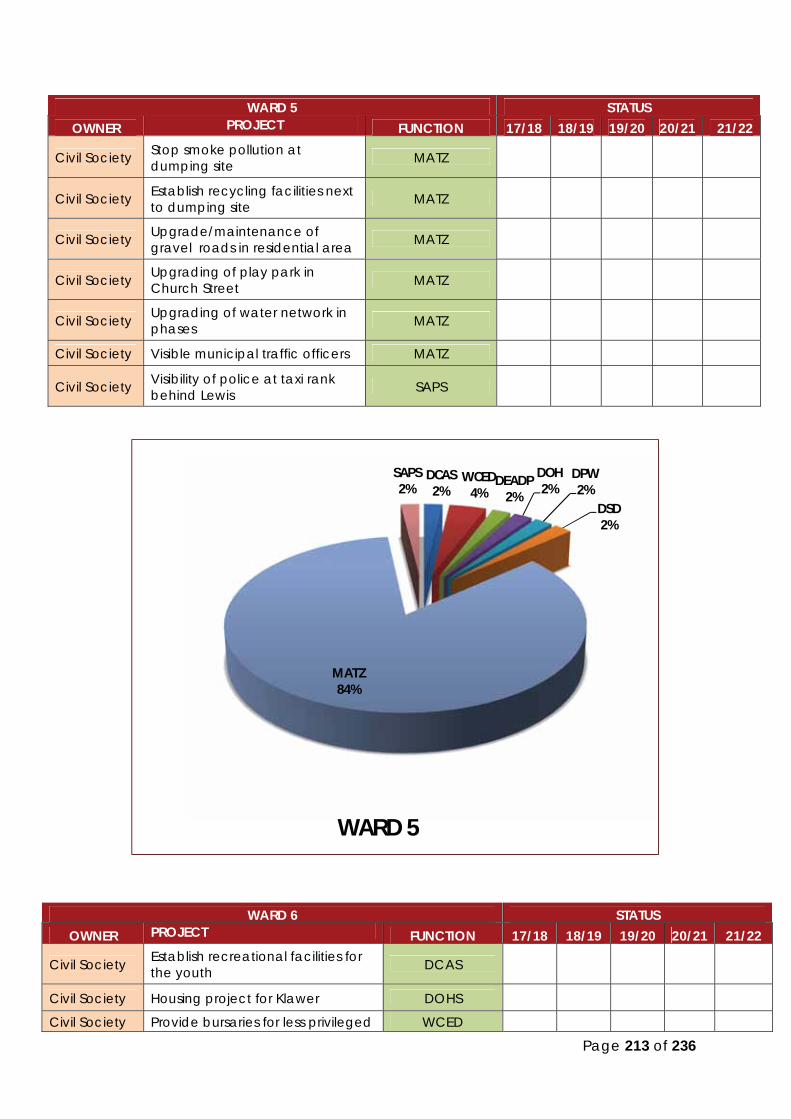
Page 213 of 236
WARD 5 STATUS OWNER PROJECT FUNCTION 17/18 18/19 19/20 20/21 21/22
Civil Society Stop smoke pollution at dumping site MATZ
Civil Society Establish recycling facilities next to dumping site MATZ
Civil Society Upgrade/maintenance of gravel roads in residential area MATZ
Civil Society Upgrading of play park in Church Street MATZ
Civil Society Upgrading of water network in phases MATZ
Civil Society Visible municipal traffic officers MATZ
Civil Society Visibility of police at taxi rank behind Lewis SAPS
WARD 6 STATUS OWNER PROJECT FUNCTION 17/18 18/19 19/20 20/21 21/22
Civil Society Establish recreational facilities for the youth DCAS
Civil Society Housing project for Klawer DOHS Civil Society Provide bursaries for less privileged WCED
DCAS 2%
WCED 4%
DEADP 2%
DOH 2%
DPW 2%
DSD 2%
MATZ 84%
SAPS 2%
WARD 5
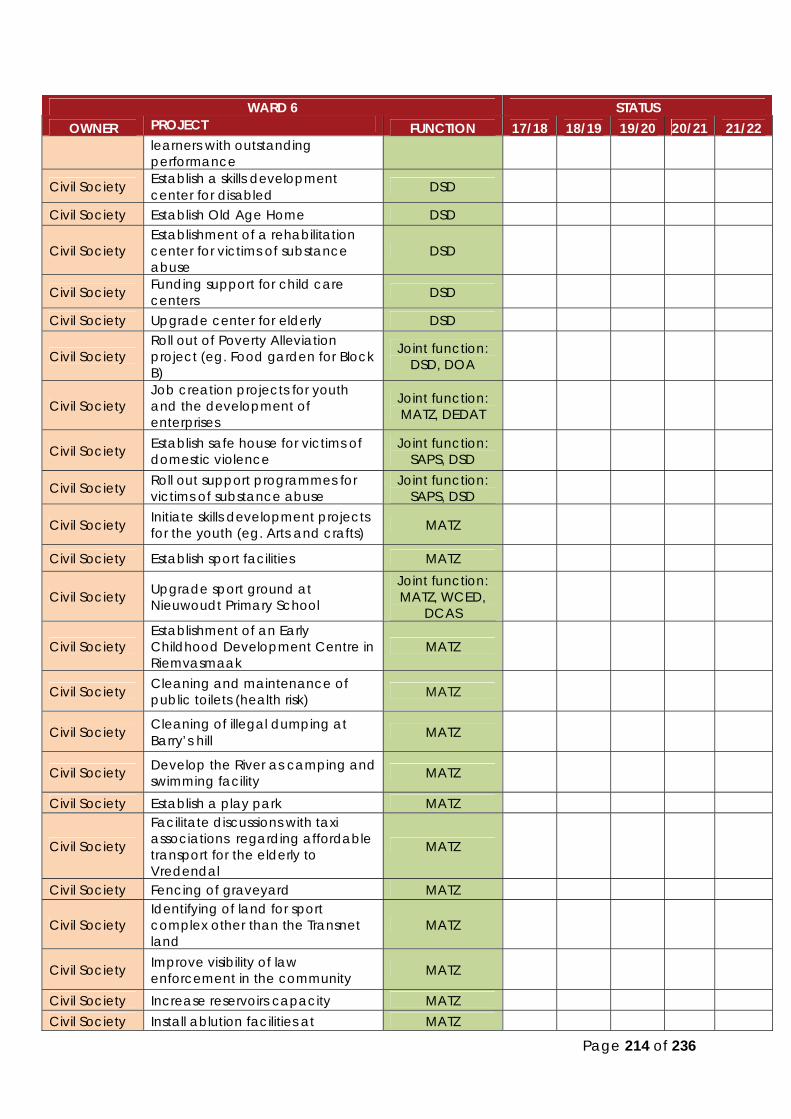
Page 214 of 236
WARD 6 STATUS OWNER PROJECT FUNCTION 17/18 18/19 19/20 20/21 21/22
learners with outstanding performance
Civil Society Establish a skills development center for disabled DSD
Civil Society Establish Old Age Home DSD
Civil Society Establishment of a rehabilitation center for victims of substance abuse
DSD
Civil Society Funding support for child care centers DSD
Civil Society Upgrade center for elderly DSD
Civil Society Roll out of Poverty Alleviation project (eg. Food garden for Block B)
Joint function: DSD, DOA
Civil Society Job creation projects for youth and the development of enterprises
Joint function: MATZ, DEDAT
Civil Society Establish safe house for victims of domestic violence
Joint function: SAPS, DSD
Civil Society Roll out support programmes for victims of substance abuse
Joint function: SAPS, DSD
Civil Society Initiate skills development projects for the youth (eg. Arts and crafts) MATZ
Civil Society Establish sport facilities MATZ
Civil Society Upgrade sport ground at Nieuwoudt Primary School
Joint function: MATZ, WCED,
DCAS
Civil Society Establishment of an Early Childhood Development Centre in Riemvasmaak
MATZ
Civil Society Cleaning and maintenance of public toilets (health risk) MATZ
Civil Society Cleaning of illegal dumping at Barry’s hill MATZ
Civil Society Develop the River as camping and swimming facility MATZ
Civil Society Establish a play park MATZ
Civil Society
Facilitate discussions with taxi associations regarding affordable transport for the elderly to Vredendal
MATZ
Civil Society Fencing of graveyard MATZ
Civil Society Identifying of land for sport complex other than the Transnet land
MATZ
Civil Society Improve visibility of law enforcement in the community MATZ
Civil Society Increase reservoirs capacity MATZ Civil Society Install ablution facilities at MATZ

Page 215 of 236
WARD 6 STATUS OWNER PROJECT FUNCTION 17/18 18/19 19/20 20/21 21/22
graveyard
Civil Society Install security gates at public toilets and control MATZ
Civil Society Install solar geysers at low cost households MATZ
Civil Society Install speed bump at the Police Station MATZ
Civil Society Install speed bump in Mossie Street MATZ
Civil Society Upgrade Klawer's existing sports facilities to accommodate shortcomings
MATZ
Civil Society Install spotlights before the bridge at Eikevlei MATZ
Civil Society Install toilets in households of elderly (Boom-, Lang- & Keerom Street)
MATZ
Civil Society Investigate the possibility to use the old barn as an indoor sport facility
MATZ
Civil Society Investigation of ownership of Windhoek Farm MATZ
Civil Society Land for local economic development including Barry’s Hill MATZ
Civil Society Pave streets in Mazoli Park MATZ
Civil Society Provide communal taps for “ Donkerhoek” Area MATZ
Civil Society Provide fire hydrants for Riemvasmaak MATZ
Civil Society Provide land for build of churches MATZ
Civil Society Provide land for development of SMME’s (investigate possibility of land near Engen close to the N7)
MATZ
Civil Society Provide land for GAP Housing MATZ
Civil Society Provide service sites to municipal workers (on open plots, Riemvasmaak)
MATZ
Civil Society Provide toilets for Riemvasmaak MATZ Civil Society Provide wheelie bins MATZ Civil Society Reduce tariffs for electricity MATZ
Civil Society Regulate business hours of spaza shops MATZ
Civil Society Relocate dumping site away from Eikevlei MATZ
Civil Society Re-opening of municipal office in Klawer, Skuil Street as electricity pay point
MATZ

Page 216 of 236
WARD 6 STATUS OWNER PROJECT FUNCTION 17/18 18/19 19/20 20/21 21/22
Civil Society Reseal of existing roads in Klawer MATZ
Civil Society Roll out Volunteer program for Community fire-fighters MATZ
Civil Society Safeguard entrance to the graveyard MATZ
Civil Society Safeguard walk-through to Eikevlei MATZ
Civil Society Sound systems for community meetings MATZ
Civil Society Upgrade Community Hall MATZ
Civil Society Upgrade sport field and ablution facilities MATZ
Civil Society Upgrading of swimming pool next to Transnet rugby field. MATZ
Civil Society Upgrading of water network to accommodate future housing project
MATZ
Civil Society Widen narrow streets in neighbourhood. MATZ
WARD 7 STATUS OWNER PROJECT FUNCTION 17/18 18/19 19/20 20/21 21/22
Civil Society Assist Maskamsig Primary school with sports equipment WCED
DCAS 2%
DOHS 2%
WCED 2% DSD 7%
JOINT: DSD, DOA 2%
JOINT: MATZ, DEDAT
2% JOINT: SAPS, DSD 3%
MATZ 80%
WARD 6
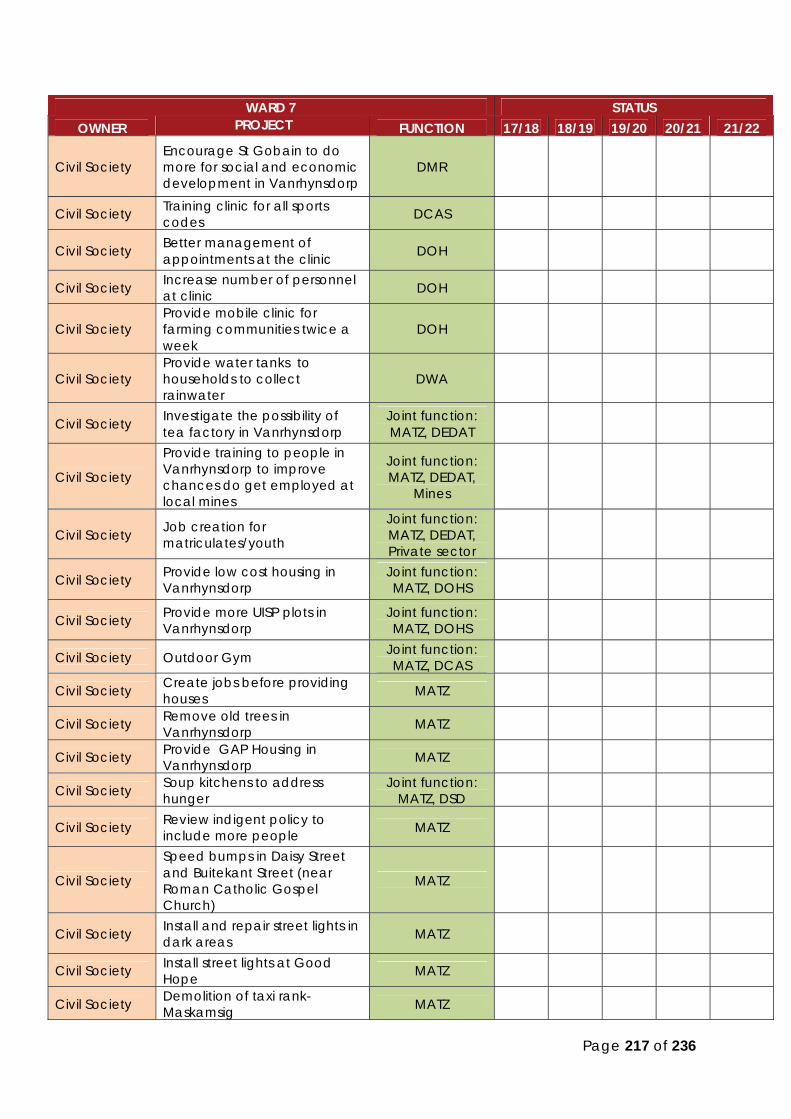
Page 217 of 236
WARD 7 STATUS OWNER PROJECT FUNCTION 17/18 18/19 19/20 20/21 21/22
Civil Society Encourage St Gobain to do more for social and economic development in Vanrhynsdorp
DMR
Civil Society Training clinic for all sports codes DCAS
Civil Society Better management of appointments at the clinic DOH
Civil Society Increase number of personnel at clinic DOH
Civil Society Provide mobile clinic for farming communities twice a week
DOH
Civil Society Provide water tanks to households to collect rainwater
DWA
Civil Society Investigate the possibility of tea factory in Vanrhynsdorp
Joint function: MATZ, DEDAT
Civil Society
Provide training to people in Vanrhynsdorp to improve chances do get employed at local mines
Joint function: MATZ, DEDAT,
Mines
Civil Society Job creation for matriculates/youth
Joint function: MATZ, DEDAT, Private sector
Civil Society Provide low cost housing in Vanrhynsdorp
Joint function: MATZ, DOHS
Civil Society Provide more UISP plots in Vanrhynsdorp
Joint function: MATZ, DOHS
Civil Society Outdoor Gym Joint function: MATZ, DCAS
Civil Society Create jobs before providing houses MATZ
Civil Society Remove old trees in Vanrhynsdorp MATZ
Civil Society Provide GAP Housing in Vanrhynsdorp MATZ
Civil Society Soup kitchens to address hunger
Joint function: MATZ, DSD
Civil Society Review indigent policy to include more people MATZ
Civil Society
Speed bumps in Daisy Street and Buitekant Street (near Roman Catholic Gospel Church)
MATZ
Civil Society Install and repair street lights in dark areas MATZ
Civil Society Install street lights at Good Hope MATZ
Civil Society Demolition of taxi rank- Maskamsig MATZ
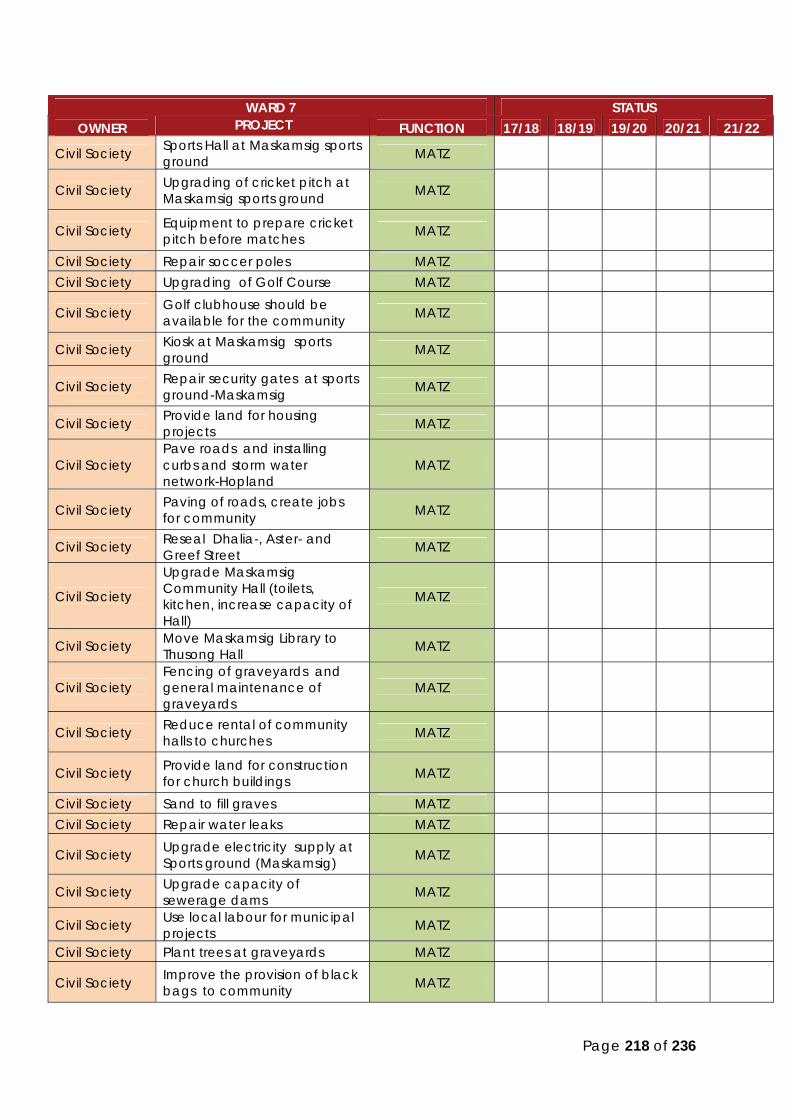
Page 218 of 236
WARD 7 STATUS OWNER PROJECT FUNCTION 17/18 18/19 19/20 20/21 21/22
Civil Society Sports Hall at Maskamsig sports ground MATZ
Civil Society Upgrading of cricket pitch at Maskamsig sports ground MATZ
Civil Society Equipment to prepare cricket pitch before matches MATZ
Civil Society Repair soccer poles MATZ Civil Society Upgrading of Golf Course MATZ
Civil Society Golf clubhouse should be available for the community MATZ
Civil Society Kiosk at Maskamsig sports ground MATZ
Civil Society Repair security gates at sports ground-Maskamsig MATZ
Civil Society Provide land for housing projects MATZ
Civil Society Pave roads and installing curbs and storm water network-Hopland
MATZ
Civil Society Paving of roads, create jobs for community MATZ
Civil Society Reseal Dhalia-, Aster- and Greef Street MATZ
Civil Society
Upgrade Maskamsig Community Hall (toilets, kitchen, increase capacity of Hall)
MATZ
Civil Society Move Maskamsig Library to Thusong Hall MATZ
Civil Society Fencing of graveyards and general maintenance of graveyards
MATZ
Civil Society Reduce rental of community halls to churches MATZ
Civil Society Provide land for construction for church buildings MATZ
Civil Society Sand to fill graves MATZ Civil Society Repair water leaks MATZ
Civil Society Upgrade electricity supply at Sports ground (Maskamsig) MATZ
Civil Society Upgrade capacity of sewerage dams MATZ
Civil Society Use local labour for municipal projects MATZ
Civil Society Plant trees at graveyards MATZ
Civil Society Improve the provision of black bags to community MATZ

Page 219 of 236
WARD 7 STATUS OWNER PROJECT FUNCTION 17/18 18/19 19/20 20/21 21/22
Civil Society Investigate the legality of Spaza Shops in Vanrhynsdorp MATZ
Civil Society Fill vacant Centre Manager position MATZ
Civil Society Satellite police station on farms SAPS
Civil Society Better communication from police to community regarding cases
SAPS
Civil Society Visible policing SAPS
WARD 8 STATUS OWNER PROJECT FUNCTION 17/18 18/19 19/20 20/21 21/22
Civil Society Initiate Projects to generate an income for unemployed community of Koekenaap
DOA
Civil Society Initiation/roll out of ABET classes (Ward 8) WCED
Civil Society Transport for learners to attend learnerships in Vredendal WCED
Civil Society Establish e-Centre (Rietpoort) DLG Civil Society Provide internet service at library DLG
WCED 2%
DMR 2% DOH
6%
DWA 2%
JOINT: MATZ, DEDAT
2%
JOINT: MATZ, DEDAT, PRIVATE
SECTOR 4%
JOINT: MATZ, DOHS
4%
JOINT: MATZ,
DSD 2%
JOINT: MATZ, DCAS
2%
MATZ 68%
SAPS 6%
WARD 7

Page 220 of 236
WARD 8 STATUS OWNER PROJECT FUNCTION 17/18 18/19 19/20 20/21 21/22
(Rietpoort)
Civil Society Encourage mining companies to do more social and economic dev.
DMR
Civil Society Mining sectors to provide study bursaries for matriculates (Ward 8)
DMR
Civil Society Equip clinic suitably (Molsvlei) DOH
Civil Society Establish ambulance waiting room in (Molsvlei) DOH
Civil Society
Improved response of ambulance services (Stofkraal, Molsvlei, Rietpoort, Putsekloof & Kliprand)
DOH
Civil Society Provide/build a bigger clinic facility for Rietpoort DOH
Civil Society Upgrading of ambulance station in Bitterfontein DOH
Civil Society Doctors should also visit Kliprand and Stofkraal DOH
Civil Society Provide transport for discharged/ referred patients to Dr/Hospital DOH
Civil Society Tarring of road between Bitterfontein and Stofkraal DOPW
Civil Society Skills Development programmes for youth DSD
Civil Society Cellular phone network tower/internet coverage for Kliprand & Rietpoort
ICASA
Civil Society Develop skills and provide job opportunities (Ward 8)
Joint function: MATZ, DEDAT
Civil Society Create job opportunities (Ward 8) Joint function: MATZ, DEDAT, Private sector
Civil Society Vegetable garden project with necessary irrigation
Joint function: MATZ, DoA,
DRDLR
Civil Society Provision of houses (Nuwerus & Bitterfontein)
Joint function: MATZ, DOHS
Civil Society Provision of housing for Bitterfontein
Joint function: MATZ, DOHS
Civil Society Initiate support programmes to minimise substance abuse (ALL)
Joint function: SAPS, DSD
Civil Society Support from municipality i.to. different sport codes (Molsvlei, Nuwerus)
MATZ
Civil Society Address challenges regarding current toilet systems (Putsekloof, Stofkraal & Rietpoort)
MATZ
Civil Society Address problems with sewerage project from DRDLR MATZ
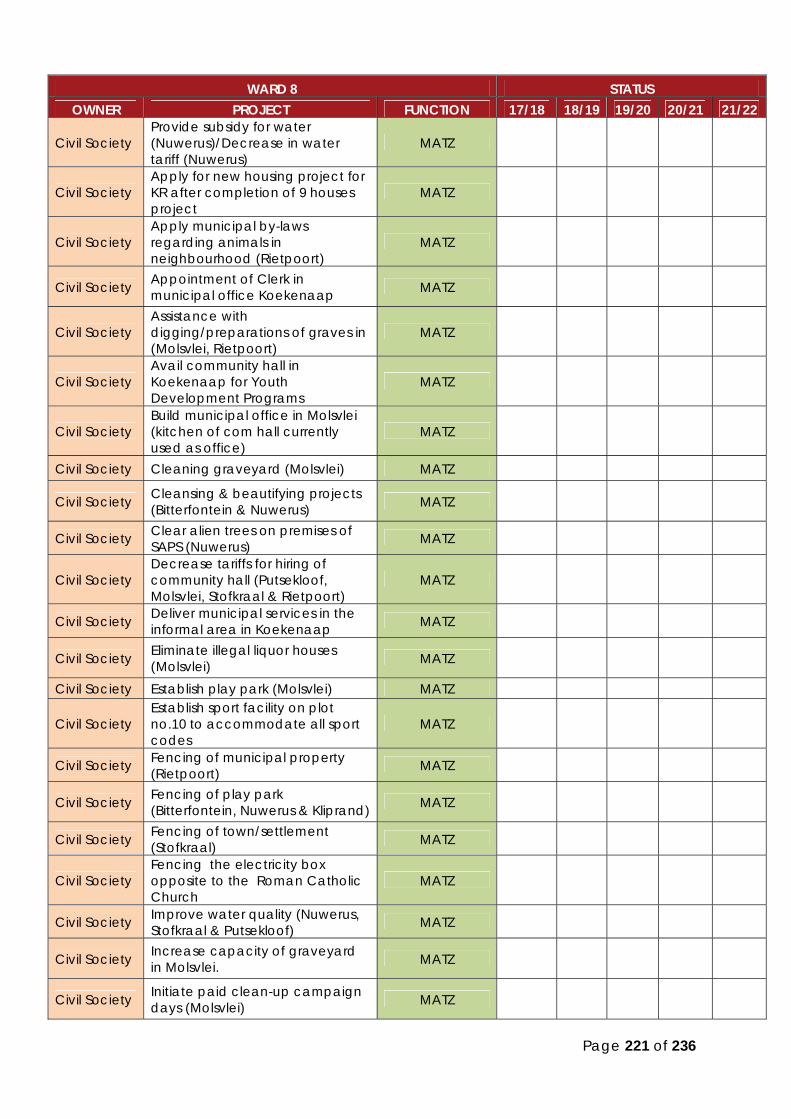
Page 221 of 236
WARD 8 STATUS OWNER PROJECT FUNCTION 17/18 18/19 19/20 20/21 21/22
Civil Society Provide subsidy for water (Nuwerus)/Decrease in water tariff (Nuwerus)
MATZ
Civil Society Apply for new housing project for KR after completion of 9 houses project
MATZ
Civil Society Apply municipal by-laws regarding animals in neighbourhood (Rietpoort)
MATZ
Civil Society Appointment of Clerk in municipal office Koekenaap MATZ
Civil Society Assistance with digging/preparations of graves in (Molsvlei, Rietpoort)
MATZ
Civil Society Avail community hall in Koekenaap for Youth Development Programs
MATZ
Civil Society Build municipal office in Molsvlei (kitchen of com hall currently used as office)
MATZ
Civil Society Cleaning graveyard (Molsvlei) MATZ
Civil Society Cleansing & beautifying projects (Bitterfontein & Nuwerus) MATZ
Civil Society Clear alien trees on premises of SAPS (Nuwerus) MATZ
Civil Society Decrease tariffs for hiring of community hall (Putsekloof, Molsvlei, Stofkraal & Rietpoort)
MATZ
Civil Society Deliver municipal services in the informal area in Koekenaap MATZ
Civil Society Eliminate illegal liquor houses (Molsvlei) MATZ
Civil Society Establish play park (Molsvlei) MATZ
Civil Society Establish sport facility on plot no.10 to accommodate all sport codes
MATZ
Civil Society Fencing of municipal property (Rietpoort) MATZ
Civil Society Fencing of play park (Bitterfontein, Nuwerus & Kliprand) MATZ
Civil Society Fencing of town/settlement (Stofkraal) MATZ
Civil Society Fencing the electricity box opposite to the Roman Catholic Church
MATZ
Civil Society Improve water quality (Nuwerus, Stofkraal & Putsekloof) MATZ
Civil Society Increase capacity of graveyard in Molsvlei. MATZ
Civil Society Initiate paid clean-up campaign days (Molsvlei) MATZ

Page 222 of 236
WARD 8 STATUS OWNER PROJECT FUNCTION 17/18 18/19 19/20 20/21 21/22
Civil Society Install bus stop/pickup & signage for learners (Molsvlei) MATZ
Civil Society Install electricity connections for households (Stofkraal) MATZ
Civil Society Install electricity vendor closer to neighbourhood (Kliprand & Stofkraal)
MATZ
Civil Society Install fire hydrants in ward MATZ
Civil Society Install floodlights at soccer field for the 40 years celebration of the Football Club, Koekenaap
MATZ
Civil Society Install flush toilets for households in (Molsvlei) MATZ
Civil Society Install new & maintain street lights (Putsekloof, Rietpoort, Nuwerus, Stofkraal, Kliprand & Molsvlei)
MATZ
Civil Society Install public ablution facilities (toilets) in Bitterfontein MATZ
Civil Society Install road sign and provide crossing for learners & patrol @ R363 (Nuwerus)
MATZ
Civil Society Install signage at entrance of Bitterfontein town to promote and market local businesses
MATZ
Civil Society Install speed bumps (Putsekloof, Molsvlei, Stofkraal & Koekenaap) MATZ
Civil Society Install stormwater connections (Bitterfontein & PK) MATZ
Civil Society Install toilet in ambulance waiting room (Stofkraal) MATZ
Civil Society Install toilets at graveyard in Bitterfontein MATZ
Civil Society Install traffic road signs (Stofkraal, Molsvlei) MATZ
Civil Society Install water connections for households (Molsvlei & Stofkraal) MATZ
Civil Society Install water pump in Stofkraal MATZ
Civil Society Install water tap at hiking spot (Nuwerus) MATZ
Civil Society Investigate and give feedback on road works project (Bitterfontein)
MATZ
Civil Society Pave/tar main road in Stofkraal MATZ
Civil Society Placement of jackhammer in Bitterfontein for grave digging MATZ
Civil Society Provide water network for households in Molsvlei MATZ
Civil Society Provide assistance to level the surface of the soccer field in Koekenaap
MATZ

Page 223 of 236
WARD 8 STATUS OWNER PROJECT FUNCTION 17/18 18/19 19/20 20/21 21/22
Civil Society Provide green water storage tank at community hall (Stofkraal & Bitterfontein)
MATZ
Civil Society Provide land for a graveyard (Stofkraal) MATZ
Civil Society Provide land for two churches (Stofkraal) MATZ
Civil Society Provide land for residential service sites (Nuwerus) MATZ
Civil Society Provide streetlights at dark areas and at the entrance of Koekenaap
MATZ
Civil Society Provide vehicle test facility in Bitterfontein MATZ
Civil Society Provision of residential service plots MATZ
Civil Society
Put up notice boards at central point in Koekenaap to market opportunities for jobs, businesses and tourism.
MATZ
Civil Society Quarterly community meetings (Bitterfontein) MATZ
Civil Society Recycle of household waste (Molsvlei) MATZ
Civil Society Safeguard of play parks (Nuwerus & KR) MATZ
Civil Society Grade/rehabilitate streets in Kliprand MATZ
Civil Society Build sidewalks in Nuwerus MATZ
Civil Society Strict approval processes for spaza shops of foreigners (Nuwerus)
MATZ
Civil Society Sufficient supply of stationery & office equipment (mun pay point) SK
MATZ
Civil Society Tarring of roads in neighbourhood (Bitterfontein) MATZ
Civil Society Upgrade community hall in Stofkraal (too small) MATZ
Civil Society Upgrade of large septic tank in Rietpoort (hygiene risk) MATZ
Civil Society Upgrade/maintain all municipal property including all community halls (ward 8)
MATZ
Civil Society Upgrade/maintain equipment in play park (Nuwerus) MATZ
Civil Society Upgrading of graveyard (Bitterfontein) MATZ
Civil Society Upgrading of Sports grounds and facilities (Nuwerus, Bitterfontein, Putsekloof, Molsvlei, Stofkraal)
MATZ
Civil Society Upgrading of water pipes (Kliprand) MATZ

Page 224 of 236
WARD 8 STATUS OWNER PROJECT FUNCTION 17/18 18/19 19/20 20/21 21/22
Civil Society Utilize local labour to maintain play parks (Molsvlei) MATZ
Civil Society Safeguard main road in (Bitterfontein) MATZ
Civil Society Establish satellite police station (Molsvlei) SAPS
Civil Society Improve response time & services of SAPS (Molsvlei, Stofkraal) SAPS
Civil Society Maintenance of road between Nuwerus & Landplaas WCDM
Civil Society Grade of road between Stofkraal and Garies WCDM
Civil Society Tar/Maintenance of gravel roads in ward 8 WCDM
MATZIKAMA MUNICIPALTY - ADMINISTRATION STATUS OWNER PROJECT FUNCTION 17/18 18/19 19/20 20/21 21/22
DOA 1%
WCED 2%
DOH 7%
DLG 2% DMR
3%
DOPW 1%
DSD 1%
ICASA 1%
JOINT: MATZ, DEDAT
1%
JOINT: MATZ, DEDAT, PRIVATE SECTOR
1%
JOINT: MATZ, DOA,
DRDLR 1%
JOINT: MATZ, DOHS
2%
JOINT: SAPS, DSD 1%
MATZ 72%
SAPS 2%
WCDM 3%
WARD 8

Page 225 of 236
MATZIKAMA MUNICIPALTY - ADMINISTRATION STATUS OWNER PROJECT FUNCTION 17/18 18/19 19/20 20/21 21/22
Corporate Services
Upgrade all libraries in accordance with Western Cape library standards and requirements.
DLG
Technical Services
Tar of road between Lamberts Bay and Doring Bay. DOPW
Community Services
Establishment of Central landfill site and closure and/or rehabilitate existing landfill sites in the respective towns;
Joint function: MATZ, CEDER, WCDM, DLG,
DEADP
Technical Services Upgrading of roads in Ward 8.
Joint function: MATZ, DEA,
DoPW&T
Development & Town Planning
To play a facilitating role which will enable growth in the secondary sector of Agriculture
Joint function: MATZ, DEDAT, DoA, DRDLR
Development & Town Planning
Expand/develop Local Economy to include at least one (1) new economic sector/subsector
Joint function: MATZ, DEDAT, DTI, ED, DST,
DAFF
Community Services
Upgrade and repair of Municipal buildings with the aim to address the current backlog and compilation & implementation of a preventative maintenance program
MATZ
Community Services
Upgrading and beautifying existing public facilities as well as entrances to towns with the aim to compete for "greenest town of the year“ award
MATZ
Community Services
Upgrade/adjust all municipal buildings and facilities to make it more accessible for disabled persons (wheelchair-friendly)
MATZ
Community Services
To establish a fully functional and capacitated Traffic Department that complies with legislative requirements and is effective in terms of law enforcement and visibility.
MATZ
Corporate Services
The successful implementation of the newly developed macro and micro staff structure (organizational chart), including the review/evaluation of all job descriptions.
MATZ
Corporate Services
The development and implementation of an HR plan, including the revision and development of all necessary HR policies.
MATZ
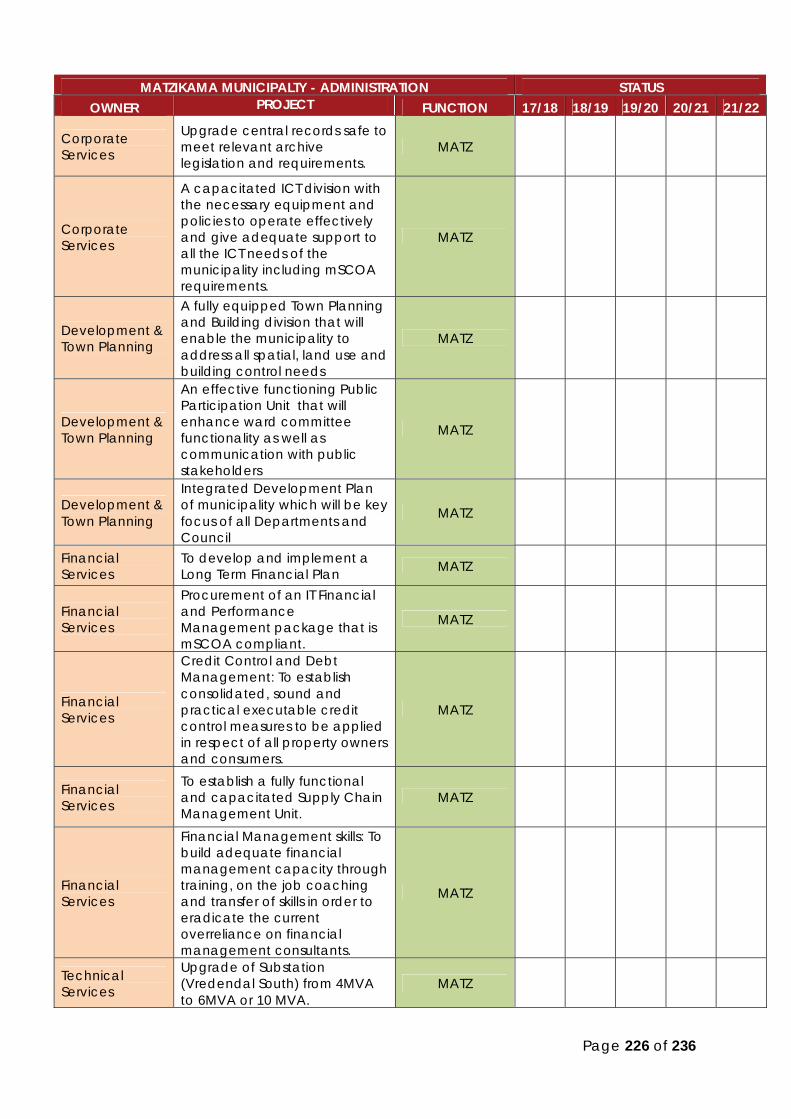
Page 226 of 236
MATZIKAMA MUNICIPALTY - ADMINISTRATION STATUS OWNER PROJECT FUNCTION 17/18 18/19 19/20 20/21 21/22
Corporate Services
Upgrade central records safe to meet relevant archive legislation and requirements.
MATZ
Corporate Services
A capacitated ICT division with the necessary equipment and policies to operate effectively and give adequate support to all the ICT needs of the municipality including mSCOA requirements.
MATZ
Development & Town Planning
A fully equipped Town Planning and Building division that will enable the municipality to address all spatial, land use and building control needs
MATZ
Development & Town Planning
An effective functioning Public Participation Unit that will enhance ward committee functionality as well as communication with public stakeholders
MATZ
Development & Town Planning
Integrated Development Plan of municipality which will be key focus of all Departments and Council
MATZ
Financial Services
To develop and implement a Long Term Financial Plan MATZ
Financial Services
Procurement of an IT Financial and Performance Management package that is mSCOA compliant.
MATZ
Financial Services
Credit Control and Debt Management: To establish consolidated, sound and practical executable credit control measures to be applied in respect of all property owners and consumers.
MATZ
Financial Services
To establish a fully functional and capacitated Supply Chain Management Unit.
MATZ
Financial Services
Financial Management skills: To build adequate financial management capacity through training, on the job coaching and transfer of skills in order to eradicate the current overreliance on financial management consultants.
MATZ
Technical Services
Upgrade of Substation (Vredendal South) from 4MVA to 6MVA or 10 MVA.
MATZ
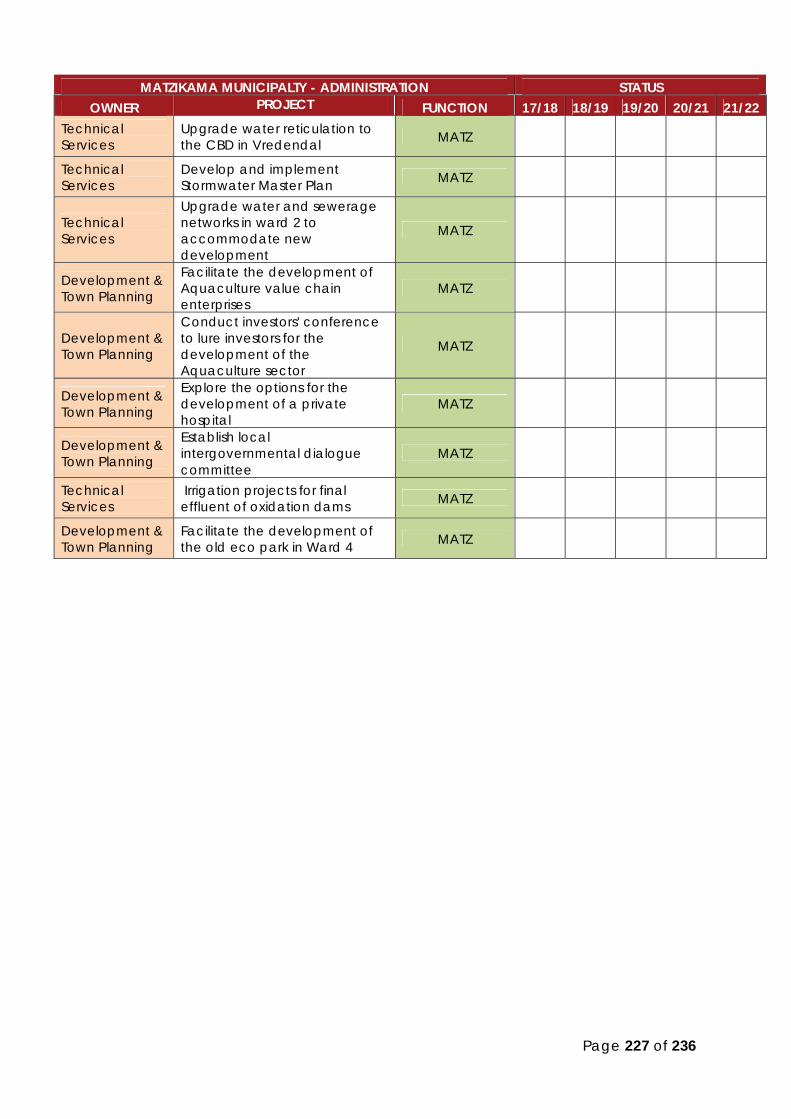
Page 227 of 236
MATZIKAMA MUNICIPALTY - ADMINISTRATION STATUS OWNER PROJECT FUNCTION 17/18 18/19 19/20 20/21 21/22
Technical Services
Upgrade water reticulation to the CBD in Vredendal MATZ
Technical Services
Develop and implement Stormwater Master Plan MATZ
Technical Services
Upgrade water and sewerage networks in ward 2 to accommodate new development
MATZ
Development & Town Planning
Facilitate the development of Aquaculture value chain enterprises
MATZ
Development & Town Planning
Conduct investors' conference to lure investors for the development of the Aquaculture sector
MATZ
Development & Town Planning
Explore the options for the development of a private hospital
MATZ
Development & Town Planning
Establish local intergovernmental dialogue committee
MATZ
Technical Services
Irrigation projects for final effluent of oxidation dams MATZ
Development & Town Planning
Facilitate the development of the old eco park in Ward 4 MATZ
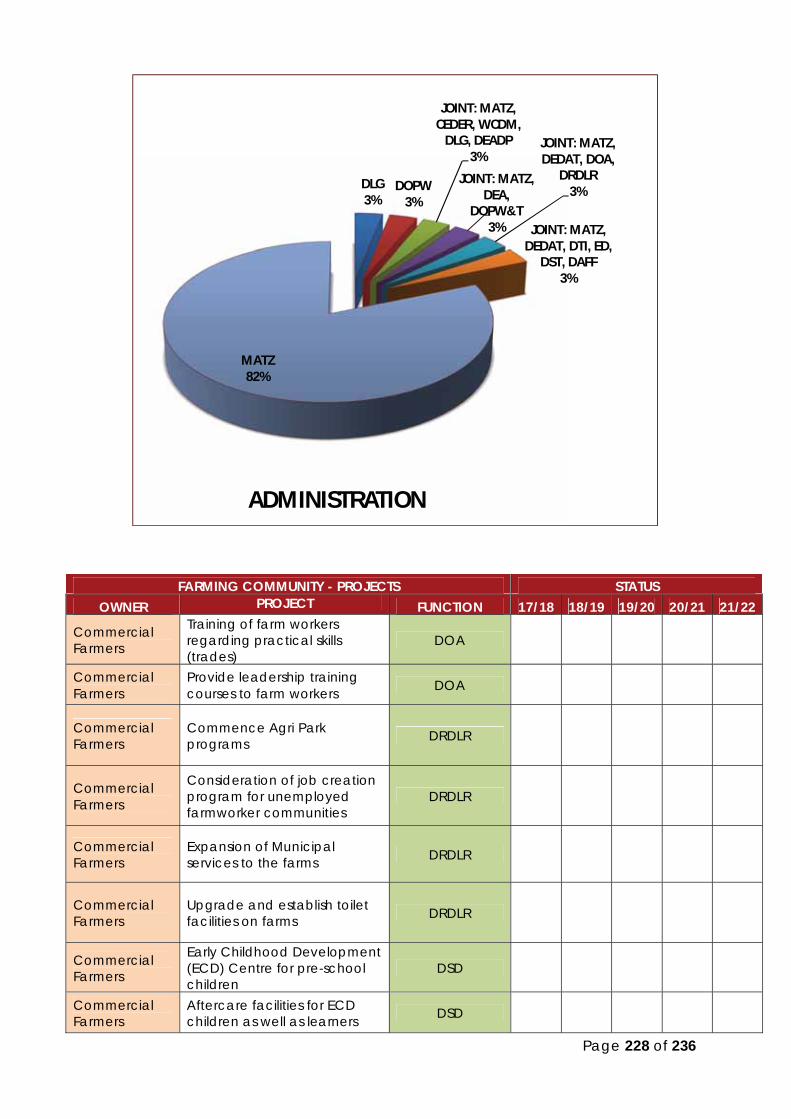
Page 228 of 236
FARMING COMMUNITY - PROJECTS STATUS OWNER PROJECT FUNCTION 17/18 18/19 19/20 20/21 21/22
Commercial Farmers
Training of farm workers regarding practical skills (trades)
DOA
Commercial Farmers
Provide leadership training courses to farm workers DOA
Commercial Farmers
Commence Agri Park programs DRDLR
Commercial Farmers
Consideration of job creation program for unemployed farmworker communities
DRDLR
Commercial Farmers
Expansion of Municipal services to the farms DRDLR
Commercial Farmers
Upgrade and establish toilet facilities on farms DRDLR
Commercial Farmers
Early Childhood Development (ECD) Centre for pre-school children
DSD
Commercial Farmers
Aftercare facilities for ECD children as well as learners DSD
DLG 3%
DOPW 3%
JOINT: MATZ, CEDER, WCDM,
DLG, DEADP 3%
JOINT: MATZ, DEA,
DOPW&T 3%
JOINT: MATZ, DEDAT, DOA,
DRDLR 3%
JOINT: MATZ, DEDAT, DTI, ED,
DST, DAFF 3%
MATZ 82%
ADMINISTRATION

Page 229 of 236
FARMING COMMUNITY - PROJECTS STATUS OWNER PROJECT FUNCTION 17/18 18/19 19/20 20/21 21/22
Commercial Farmers
Reduce red tape relating to establishment of ECDs and aftercare facilities.
DSD
Commercial Farmers ECDC in farming area DSD
Commercial Farmers
Transport for farmworkers from town to farms DoPW&T
Commercial Farmers
Packing and cooling facility for local farming produce
Joint function: MATZ, DEDAT
Commercial Farmers
The implementation of a sustainable land development plan for emerging farmers, with focus on expansion of the economy by means of job creation
Joint function: MATZ, DEDAT, DoA, DRDLR
Commercial Farmers
Allocate a space in town to farm workers to dispose of farming produce in Vredendal CBD
MATZ
Commercial Farmers
Allocate a space in town to farm workers to dispose of farming produce in Bitterfontein CBD
MATZ
Commercial Farmers
Roads maintenance especially gravel roads in and around Vredendal
MATZ
Commercial Farmers
Access to public toilets in town. (Vredendal) MATZ
Commercial Farmers
Making available land or serviced plots for agricultural producers who want to build houses for their workers which is mostly pensioners, at own cost.
MATZ
Commercial Farmers
Early liaison with the Agriculture Community Organization like in the past regarding property rates relating to farm property
MATZ
Commercial Farmers
Provide basic services to rural/farm areas of Ward 8. MATZ
Commercial Farmers
Establish a taxi rank near Check-Inn for farmworkers in Vredendal
MATZ
Emerging Farmers
Establish abattoir for emerging farmers in Ward 6 DOA
Emerging Farmers
Abattoirs for emerging farmers (Ward 7) DOA
Emerging Farmers
Install water meters in camps to save on water usage. (Vanrhynsdorp)
DOA

Page 230 of 236
FARMING COMMUNITY - PROJECTS STATUS OWNER PROJECT FUNCTION 17/18 18/19 19/20 20/21 21/22
Emerging Farmers
Upgrade livestock water and feeding facilities (Rietpoort and Putsekloof )
DOA
Emerging Farmers
Financial support for seed, fodder, livestock and medicine for livestock.
DOA
Emerging Farmers
Provision of necessary farming equipment: tractors, fencing, storage, water pumps & tanks.
DOA
Emerging Farmers
Support emerging farmer development (Ward 3) DOA
Emerging Farmers
Assist with the development of fodder production/grazing land for emerging farmers
DOA
Emerging Farmers
Provide irrigation system to support emerging farmers (Ward 6)
DOA
Emerging Farmers
Land for livestock farming (Ward 3) DRDLR
Emerging Farmers
Access to funding for project development from relevant government departments.
Joint function: MATZ, DoA,
DRDLR Emerging Farmers
Availability of water for farming activities. (All) LORWUA
Emerging Farmers
A map indicating commonage land, land owned by Government.
MATZ
Emerging Farmers
Availability of treated waste water for farming activities in Lutzville.
MATZ
Emerging Farmers
Need longer term contract instead of 3 year lease agreements for land.
MATZ
Emerging Farmers
Develop a support system to facilitate challenges with relevant departments.
MATZ
Emerging Farmers
Establish commonage committee and develop commonage policy.
MATZ
Emerging Farmers
Make available commonage land to emerging farmers (Bitterfontein)
MATZ
Emerging Farmers
Supply irrigation water to emerging farmers (Ward 3) MATZ
Emerging Farmers
Install proper floodlights at emerging farmers (Ward 7) MATZ
Emerging Farmers
Contracts for emerging farmers (Ward 7) MATZ

Page 231 of 236
FARMING COMMUNITY - PROJECTS STATUS OWNER PROJECT FUNCTION 17/18 18/19 19/20 20/21 21/22
Emerging Farmers
Fencing of dumping site near emerging farmers LV MATZ
Emerging Farmers
Make commonage land available to emerging farmers MATZ
Emerging Farmers
Make farming land available to emerging farmers in Ward MATZ
Emerging Farmers
Provide land for emerging farmers to increase farming activities (Ward 6)
MATZ
Commercial 46%
Emerging 54%
FARMING COMMUNITY

Page 232 of 236
BUSINESS COMMUNITY - PROJECTS STATUS OWNER PROJECT FUNCTION 17/18 18/19 19/20 20/21 21/22
Business Society Marketing support for Kliprand Snipper Needle Work Project
DEDAT
Business Society SMME training (Ward 3) DEDAT
Business Society Provide financial Assistance to SMME’s
DEDAT
Business Society Mentorship programs for new business owners
DEDAT
Business Society Industrial development in Ward 3
Joint function: MATZ, DEDAT
Business Society Investigate tourism/guesthouse development in Ward 3
Joint function: MATZ, DEDAT
Business Society Prioritise tourism development at the coast
Joint function: MATZ, DEDAT
Business Society Facilitate the development of new economic sectors
Joint function: MATZ, DEDAT
Business Society Encourage entrepreneurial development with support
Joint function: MATZ, DEDAT
DOA 24%
DRDLR 11%
DSD 9%
DOPW&T 2%
JOINT: MATZ, DEDAT
2%
JOINT: MATZ, DEDAT,
DOA, DRDLR
2%
JOINT: MATZ, DOA, DRDLR
2%
LORWUA 2%
MATZ 46%
FARMING COMMUNITY PROJECTS PER FUNTIONAL DEPT

Page 233 of 236
BUSINESS COMMUNITY - PROJECTS STATUS OWNER PROJECT FUNCTION 17/18 18/19 19/20 20/21 21/22
from corporates (ward 5)
Business Society Address the needs of existing businesses
Joint function: MATZ, DEDAT
Business Society Promote the establishment of BEE businesses
Joint function: MATZ, DEDAT
Business Society Develop tourism projects to support growth in the tourism sector
Joint function: MATZ, DEDAT
Business Society Develop Tourism sector (wine, lobster, etc.)
Joint function: MATZ, DEDAT
Business Society Commence development of value adding services of abalone sector
Joint function: MATZ, DEDAT
Business Society Develop more aquaculture/abalone farms in Doring Bay
Joint function: MATZ, DEDAT
Business Society Inclusion of Snippers Needle Work Project (Kliprand) on Suppliers Database (SCM)
MATZ
Business Society New sewing machines for Snipper Needle Work Project (Kliprand)
MATZ
Business Society Provide training programs via the West Coast Business Development Centre (Ward 8)
MATZ
Business Society Support for SMME development (Kliprand) MATZ
Business Society Assist with transport for Snipper Needle Work Project (Kliprand) MATZ
Business Society Business Plan for Snipper Needle Work Project to apply for funding (Kliprand)
MATZ
Business Society Create a database for unemployed people and skills needed (Ward 3)
MATZ
Business Society Serviced plots in Doring Bay for business development MATZ
Business Society Better maintenance of municipal assets MATZ
Business Society Develop more serviced sites in Lutzville for housing MATZ
Business Society Maintain and clean graveyards regularly MATZ
Business Society Secure taxi ranks MATZ Business Society Develop plan to repair roads. MATZ
Business Society Support and promote separation of municipal waste at source
MATZ
Business Society Stop the use of never-ending contracts MATZ
Business Society Facilitate cooperation between Large Companies and Small businesses.
MATZ
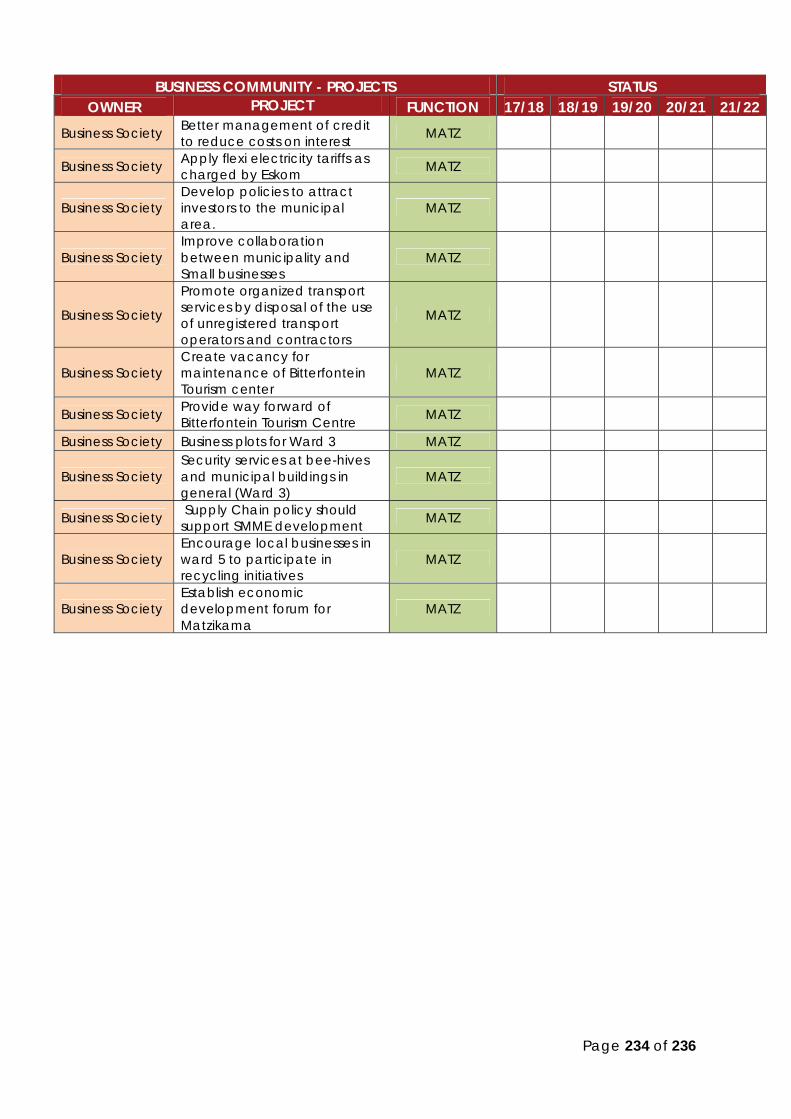
Page 234 of 236
BUSINESS COMMUNITY - PROJECTS STATUS OWNER PROJECT FUNCTION 17/18 18/19 19/20 20/21 21/22
Business Society Better management of credit to reduce costs on interest MATZ
Business Society Apply flexi electricity tariffs as charged by Eskom MATZ
Business Society Develop policies to attract investors to the municipal area.
MATZ
Business Society Improve collaboration between municipality and Small businesses
MATZ
Business Society
Promote organized transport services by disposal of the use of unregistered transport operators and contractors
MATZ
Business Society Create vacancy for maintenance of Bitterfontein Tourism center
MATZ
Business Society Provide way forward of Bitterfontein Tourism Centre MATZ
Business Society Business plots for Ward 3 MATZ
Business Society Security services at bee-hives and municipal buildings in general (Ward 3)
MATZ
Business Society Supply Chain policy should support SMME development MATZ
Business Society Encourage local businesses in ward 5 to participate in recycling initiatives
MATZ
Business Society Establish economic development forum for Matzikama
MATZ
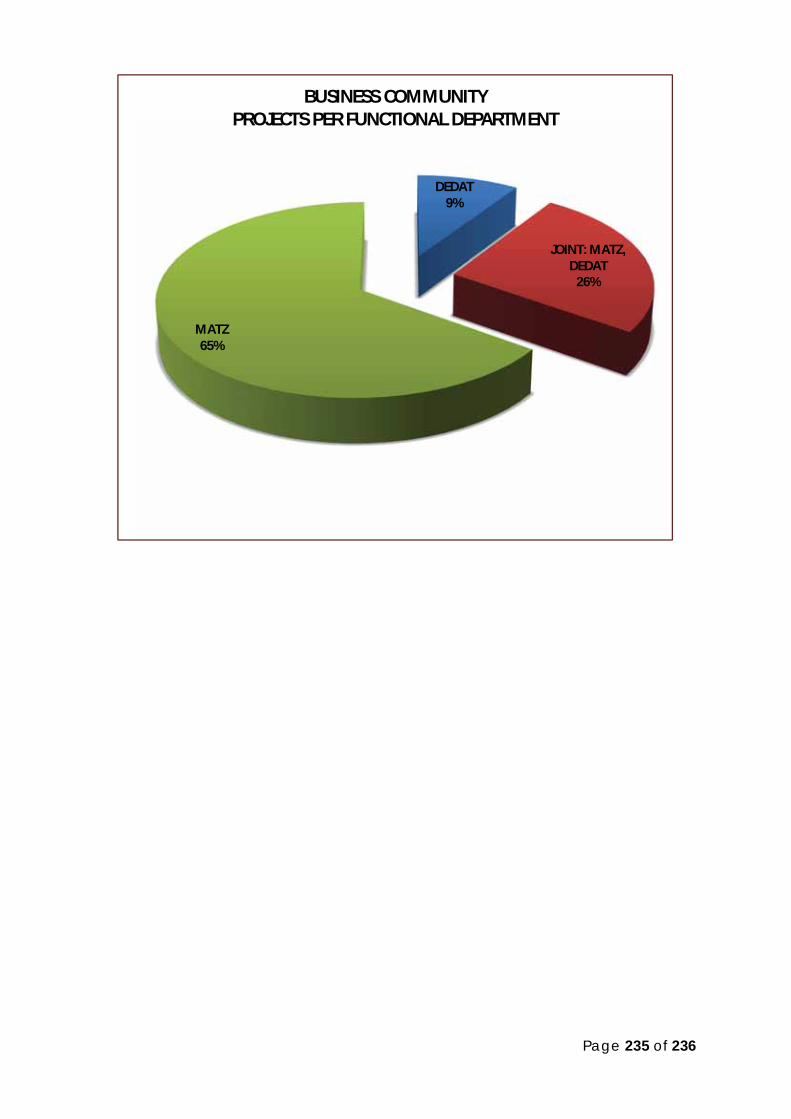
Page 235 of 236
DEDAT 9%
JOINT: MATZ, DEDAT
26%
MATZ 65%
BUSINESS COMMUNITY PROJECTS PER FUNCTIONAL DEPARTMENT

Page 236 of 236
ANNEXURE A:- Needs - Civil Society
ANNEXURE B: - Needs – Farming Communities
ANNEXURE C:- Needs – Business Society
ANNEXURE D:- IDP Project Description list