maturation of neuron types in nucleus of solitary tract
TRANSCRIPT
THE JOURNAL OF COMPARATIVE NEUROLOGY 345:359-376 (1994)
Maturation of Neuron Types in Nucleus of Solitary Tract Associated With Functional Convergence During Development of Taste Circuits
CHARLOTTE M. MISTRETTA AND SUSAN E. LABYAK School of Dentistry and Center for Human Growth and Development, University of Michigan,
Ann Arbor, Michigan 48109-1078
ABSTRACT Late fetal through postnatal development in sheep is a period of increasing convergence of
afferent taste fibers onto second-order neurons in the nucleus of the solitary tract (NST). To learn whether neuron morphology alters in concert with convergence and neurophysiological development in NST, three-dimensional neuron reconstructions were made of cells in a functionally defined region of gustatory NST from Golgi preparations of the brainstem. Elongate, multipolar, and ovoid neurons were studied in fetuses from 85 days of gestation through the perinatal period (term = 147 days of gestation), to postnatal stages. Soma1 size and form, and dendritic complexity and extent, increased markedly from 85 to about 110 days of gestation in both of the proposed NST projection neurons, elongate and multipolar. From 130 days of gestation to postnatal ages, growth of dendrites of elongate neurons plateaued or declined, whereas dendrites of multipolar neurons apparently continued to increase in size and extent. In addition, spine density decreased on elongate neurons but remained stable on multipolar neurons. Morphological variables of ovoid cells, proposed interneurons in NST, did not alter over this later period. The data suggest that multipolar, not elongate or ovoid, neurons are logical candidates to receive the increasing afferent fiber input onto NST cells during late gestation. Also, neural activity from taste afferent fibers is more likely to have a role in altering NST neuron morphology at later, rather than earlier, developmental periods. o 1994 Wiley-Liss, Inc.
Key words: gustatory, solitary nucleus, morphology, neuron reconstruction
An important aspect of functional differentiation of taste circuits is the progressive convergence during development of first-order fibers onto second-order neurons. Based on neurophysiological comparisons of receptive field sizes be- tween chorda tympani taste afferents and their projection neurons in the nucleus of the solitary tract (NST) in fetal, perinatal, and postnatal sheep, we know that functional convergence increases markedly between late fetal and perinatal stages (Vogt and Mistretta, 1990).
Order is maintained during development of convergent projections. For example, the receptive fields of NST neu- rons are comprised of fungiform papillae that are clustered together; nonresponsive papillae are not interspersed within the fields, nor are fields spatially split on the tongue (Vogt and Mistretta, 1990). Receptive field coherence is also observed for chorda tympani afferent fibers (Nagai et al., 1988). Therefore, the large NST fields must receive input from chorda tympani fibers with smaller, but contiguous or overlapping, receptive fields. The convergent afferent projec-
tion may be through fascicles of associated chorda tympani fibers (Mistretta, 1993).
Based on the neurophysiological data on receptive field characteristics, we propose that the morphology of second- order neurons receiving afferent input alters in association with the period of functional convergence. This conver- gence is associated with an increased responsiveness of central neurons to salts and apparently has a role in amplifying low-frequency, peripheral nerve responses to sodium chloride. In other neural systems, the complexity of dendrites in postsynaptic neurons is directly related to the extent of presynaptic innervation (Purves and Hume, 19811,
Accepted February 1,1994. Susan E. Labyak is now at the Department of Neurobiology and Physiol-
Address reprint requests to Charlotte M. Mistretta, Room 6226, School of ogy, Northwestern University, Evanston, IL 60208.
Dentistry, University of Michigan, Ann Arbor, MI 48109-1078.
o 1994 WILEY-LISS, INC.
360 C.M. MISTRETTA AND S.E. LABYAK
and therefore we suggest that a similar relation may exist in developing NST.
Studies of morphological development of central neurons can also identify properties of neurons that are established in advance of functional differentiation and those that are acquired or altered during functional differentiation, and thereby suggest how sensory circuits are established. In addition, quantitative morphometric analyses of dendritic patterns, spine density and distribution, and neuron orien- tation can yield information that relates to synaptic input and cell function.
Therefore, we used Golgi preparations for three-dimen- sional reconstruction of neurons in a functionally defined region of gustatory NST during development in fetal, perinatal, and postnatal sheep. Neurophysiological re- sponse and receptive field characteristics were used to define a specific region of the NST for neuron reconstruc- tions.
MATERIALS AND METHODS Animals and surgical preparation
Neurophysiological and/or morphological data were col- lected from Suffolk sheep in six fetal and postnatal age groups (term = 147 days): 85 days of gestation (range: 81-86 days); 100 days of gestation (100-101 days); 110 days of gestation (109-112 days); 130 days of gestation (129-134 days); perinatal(143 days of gestation to 8 days postnatal); and postnatal lamb (35-57 days after birth). Pregnant ewes at required gestational ages and postnatal lambs were provided by a local breeder.
For all experimental procedures, pregnant ewes or postna- tal lambs were anesthetized with an intravenous injection of sodium pentobarbital (30 mgikg for ewes; 20 mgikg for lambs). Subsequent anesthetic was administered through an in-dwelling jugular catheter. Ewes and lambs were tracheotomized and received supplemental oxygen. Fetuses were delivered onto a water-circulating heating pad on a table next to the ewe and were covered with cotton pads. Umbilical and placental circulation remained intact, so the fetus was anesthetized through and maintained by the ewe (Bradley and Mistretta, 1973). Ewe and fetus, or postnatal lambs, were deeply anesthetized throughout experiments and received a lethal overdose of anesthetic at the end of experiments .
Neurophysiology To ensure that we studied neurons from a standardized
area of the NST across developmental age groups, we used neurophysiological taste responses to define functionally a specific region of the nucleus in 130-day gestation fetuses, perinatal animals, and postnatal lambs. These experiments allowed functional localization of a specific region of the NST, and the three age groups were the same as those in previous studies of receptive fields (Nagai et al., 1988; Vogt and Mistretta, 1990). In younger fetal age groups, it is difficult to obtain and maintain stable neurophysiological recordings (Bradley and Mistretta, 1980); therefore, ana- tomical criteria were used to define the appropriate NST region in these age groups.
The animal’s head was flexed at a right angle to the body and secured in a stereotaxic holder with blunt earbars. A portion of the posterior skull was removed, and the cerebel- lum was aspirated to reveal the floor of the fourth ventricle. The exposed brainstem was covered with warm mineral oil.
With obex as the zero reference point, extracellular recordings were made from taste neurons in the rostral NST with tungsten microelectrodes (at about 0.2-0.5 MOhm). Coordinates were based on previous studies of taste neurons in NST of fetal and postnatal sheep (Bradley and Mistretta, 1980; Vogt and Mistretta, 1990). Neural activity was monitored with a preamplifier, oscilloscope, and audio amplifier and recorded on tape with voice cues for subsequent analysis.
Recordings were from multiunit preparations because the goal was to identify rapidly a functionally defined region of the NST across age groups. We recorded from rostral NST in a region with neurons that had high-response frequencies to NaCl, compared with NH&l and KCl, and that had receptive fields on the extreme tongue tip. Based on previous work in our laboratory, these combined criteria ensured that we recorded from a very rostral NST zone that received afferent input primarily (or exclusively) from cranial nerve VIH. After taste neurons were initially local- ized through general search procedures (Vogt and Mis- tretta, 19901, the receptive field location was characterized by electrically stimulating the tongue with 10-pA anodal current delivered through a monopolar stimulating elec- trode. Electrical stimulation procedures are described else- where (Nagai et al., 1988; Vogt and Mistretta, 1990).
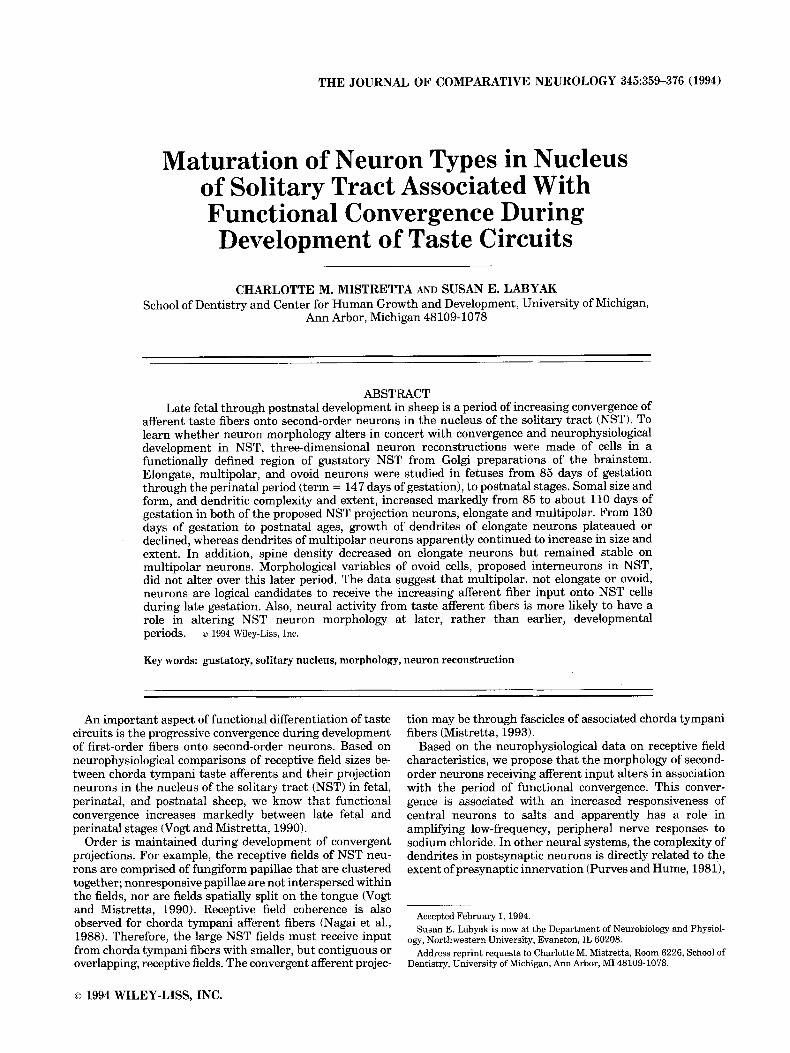
When neurons with receptive fields on the extreme tongue tip were identified, chemical stimuli were applied to the tongue (Fig. 1). Chemicals were reagent grade, 0.5 M NH4C1, NaCl, and KCl dissolved in distilled water. Ten milliliters of each stimulus was applied to the tongue from a glass syringe for about 10 seconds, followed by three distilled water rinses of 20 ml each. Between each salt stimulation, a period of at least 1 minute elapsed. The entire stimulation sequence was repeated two to three times. Neural activity was passed through an ac-to-dc converter (Beidler, 1953) to determine response magnitude to the three salts.
Once a region of the NST was localized with receptive fields on the tongue tip and high-intensity responses to NaCl relative to the other salts, a small electrolytic lesion was made at the recording site (8 pA direct current for 20 seconds or 4 pA for 30 seconds). The experimental animal was then overdosed with sodium pentobarbital, exsangui- nated, and the brainstem was rapidly removed from the skull and placed in Golgi-Cox solution (Glaser and Van der Loos, 1981). In Golgi-prepared sections, lesions were lo- cated and used for defining the region of the NST for neuron reconstructions (Fig. 2).
Golgi procedure Fetal, perinatal, and postnatal animals used in neuro-
physiological experiments were prepared as described in the preceding paragraph. Fetuses in 85, loo-, and 110-day gestational groups were not used in neurophysiological experiments. These fetuses were delivered and deep anesthe- sia was ensured. The umbilical cord was tied and cut, and the animal was exsanguinated. The skull was then opened, and the brainstem was rapidly removed and placed in the Golgi-Cox solution (Glaser and Van der Loos, 1981). The Golgi-Cox method was used because it resulted in more impregnated neurons in adult hamster NST than rapid Golgi methods (Whitehead, 1988) and yielded large num- bers of impregnated neurons in rat (King and Hill, 1993).
Brainstems from all animals were immersed in a modi- fied, aged Golgi-Cox solution that contained 5% potassium
NEURON DEVELOPMENT IN NUCLEUS OF SOLITARY TRACT 361
e e e e N t i 4 Na K t "4 Na NH4 - 30 s
Fig. 1. Brainstem recording site, lingual receptive field, and neuro- physiological responses from nucleus of the solitary tract (NST) cells. Top left: Photograph of perinatal brainstem with general location of recording site marked by a black dot. Top right: Photograph of anterior tongue with receptive field area demarcated by a dashed line. Bottom: Summated neurophysiological responses to stimulation of the
tongue with 0.5M NH,Cl, NaCl, and KCI. A tactile stimulus (t) of stroking the tongue with a glass rod also was used. At times e, anodal current was applied to the tongue to determine receptive field location. The tongue tip was stimulated at the first and fourth e; more posterior tongue regions were stimulated at the second and third e.
chromate, 5% potassium dichromate, and 5% mercuric chloride (Glaser and Van der Loos, 1981) and stored in the dark for 21 days (fetal age groups) or 25 days (perinatal and postnatal ages). After the first 48 hours, the Golgi-Cox solution was changed, but thereafter tissues were undis- turbed. Impregnation times were determined by testing trial tissue after 7-30 days. After impregnation, tissues were dehydrated through a graded alcohol series into an alcohol/ether mixture and then into Parlodion (Fisher Scientific). Brainstems remained 48 hours in each concen- tration of 2,4,6, and 12% Parlodion, were embedded in 12% Parlodion, hardened in chloroform, and stored in 70% ethanol at 4°C.
Horizontal sections of the brainstem were cut at 160 ym (85, loo-, 110-, and 130-day fetal groups) or 200 pm (perinatal and postnatal groups). The horizontal plane was used because NST neurons have a preferred horizontal orientation (Davis, 1988; Davis and Jang, 1988). Sections were processed and counterstained with methylene blue as described by Glaser and Van der Loos (1981) and were mounted and coverslipped with Hystomount (Hughes and Hughes, England).
Neuron reconstruction Selection of brainstem sections for reviewing neurons.
The NST is a large structure, and the entire portion of the nucleus rostral to the obex receives input from gustatory
nerves (Hanamori and Smith, 1989; Bradley, 1994). In perinatal sheep, we can record responses to anterior and posterior tongue stimulation over a region of the nucleus that exceeds 4.0 mm in rostral/caudal extent. Therefore, to ensure that neurons from a comparable region of the nucleus are being studied across developmental groups, criteria must be established to standardize the region. We used functional criteria to define the region in older age groups, and then derived anatomical criteria from these animals that apply to the younger age groups.
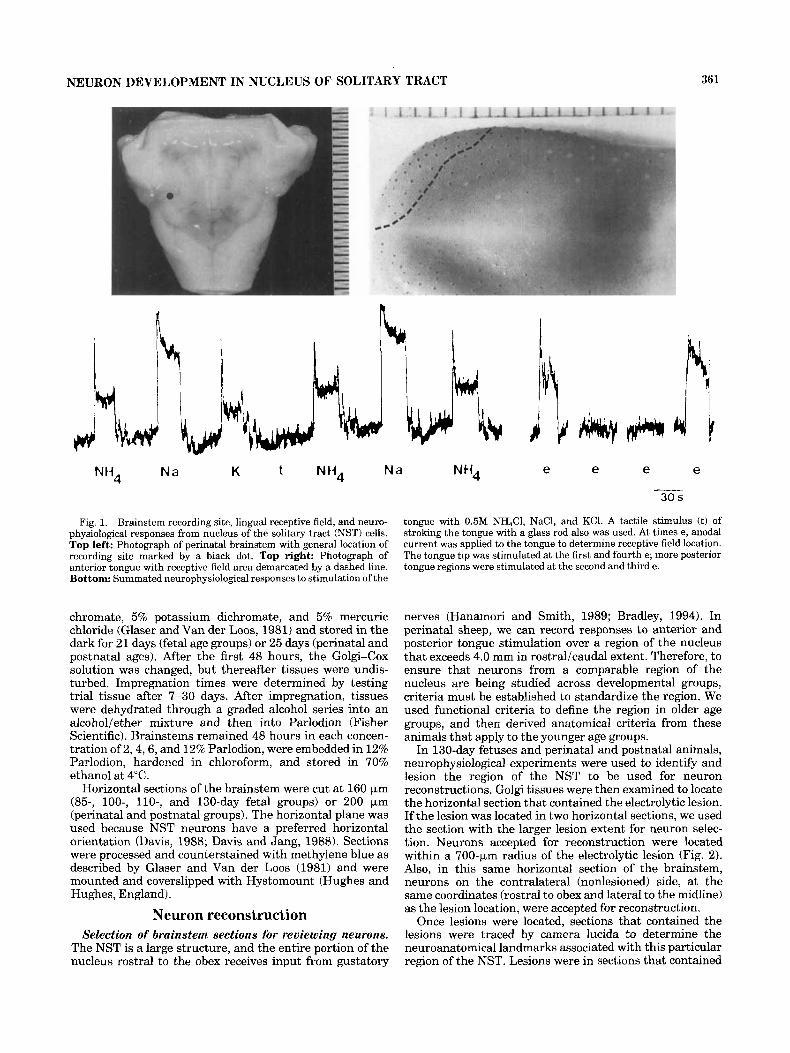
In 130-day fetuses and perinatal and postnatal animals, neurophysiological experiments were used to identify and lesion the region of the NST to be used for neuron reconstructions. Golgi tissues were then examined to locate the horizontal section that contained the electrolytic lesion. If the lesion was located in two horizontal sections, we used the section with the larger lesion extent for neuron selec- tion. Neurons accepted for reconstruction were located within a 700-bm radius of the electrolytic lesion (Fig. 2). Also, in this same horizontal section of the brainstem, neurons on the contralateral (nonlesioned) side, at the same coordinates (rostral to obex and lateral to the midline) as the lesion location, were accepted for reconstruction.
Once lesions were located, sections that contained the lesions were traced by camera lucida to determine the neuroanatomical landmarks associated with this particular region of the NST. Lesions were in sections that contained
362 C.M. MISTRETTA AND S.E. LABYAK
Fig. 2. Photomicrographs of lesion and neuron types in Golgi preparations of fetal brainstem at 130 days of gestation. A Low-power micrograph illustrates lesion made during the neurophysiological experi- ment (surrounded by a dashed circle) and nearby neurons used for reconstructions (lesion and neurons are contained within a black rectangle). Width of black rectangle is scaled at 0.6 mm. The edge of the cochlear nucleus and brainstem is indicated by dashed white lines on
the left. B: Higher power view of lesion (L, surrounded by dashed circle) and three nearby neurons. C: Spiny dendrite of neuron marked by a black dot in B. Bottom: Elongate (EL), multipolar (MU), and ovoid (OV) neurons from another fetus. The 50-km scale bar applies to high-power photomicrophs of each neuron; low-power insets illustrate more of the neuron and surrounding tissue.
seventh nerve fiber bundles and were in an area that could be defined by the intersection of a horizontal line drawn from the most caudal edge of the cochlear nucleus and a vertical line drawn caudally from the seventh nerve bundles (Fig. 3).
Because it is very difficult to record from the NST in fetuses younger than 110 days, in this study we restricted our neurophysiological experiments to the older age groups. Therefore, we used neuroanatomical landmarks derived from the older age groups and from prior neurophysiologi-
cal studies in young fetuses (Bradley and Mistretta, 1980) to define the NST region for neuron reconstruction in 8 5 , loo-, and 110-day fetal groups.
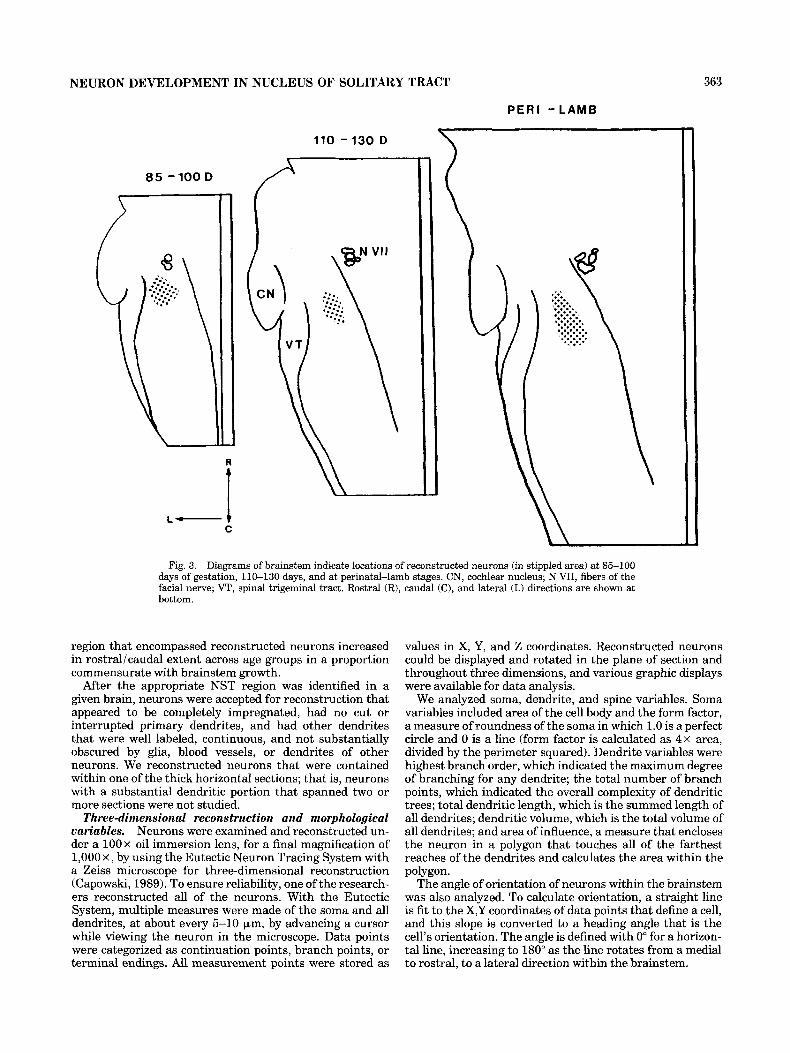
Because the sheep brainstem grows during the period from 85 days of gestation to two months postnatal, we imposed functional and anatomical restrictions before ac- cepting NST cells for reconstruction. In practice, neurons from all age groups in the study were located in a region of the NST that was just rostral or just caudal to the level of the caudal edge of the cochlear nucleus (Fig. 3). The NST
NEURON DEVELOPMENT IN NUCLEUS OF SOLITARY TRACT 363
85 -100 D
L- i C
110 -130 D
PER1 - L A M B
4 \
Fig. 3. Diagrams of brainstem indicate locations of reconstructed neurons (in stippled area) at 85-100 days of gestation, 110-130 days, and at perinatal-lamb stages. CN, cochlear nucleus; N VII, fibers of the facial nerve; VT, spinal trigeminal tract. Rostral (R), caudal (C), and lateral (L) directions are shown at bottom.
region that encompassed reconstructed neurons increased in rostral/caudal extent across age groups in a proportion commensurate with brainstem growth.
After the appropriate NST region was identified in a given brain, neurons were accepted for reconstruction that appeared to be completely impregnated, had no cut or interrupted primary dendrites, and had other dendrites that were well labeled, continuous, and not substantially obscured by glia, blood vessels, or dendrites of other neurons. We reconstructed neurons that were contained within one of the thick horizontal sections; that is, neurons with a substantial dendritic portion that spanned two or more sections were not studied.
Three-dimensional reconstruction and morphological Variables. Neurons were examined and reconstructed un- der a 1 0 0 ~ oil immersion lens, for a final magnification of 1,000 X, by using the Eutectic Neuron Tracing System with a Zeiss microscope for three-dimensional reconstruction (Capowski, 1989). To ensure reliability, one of the research- ers reconstructed all of the neurons. With the Eutectic System, multiple measures were made of the soma and all dendrites, at about every 5-10 pm, by advancing a cursor while viewing the neuron in the microscope. Data points were categorized as continuation points, branch points, or terminal endings. All measurement points were stored as
values in X, Y, and Z coordinates. Reconstructed neurons could be displayed and rotated in the plane of section and throughout three dimensions, and various graphic displays were available for data analysis.
We analyzed soma, dendrite, and spine variables. Soma variables included area of the cell body and the form factor, a measure of roundness of the soma in which 1.0 is a perfect circle and 0 is a line (form factor is calculated as 4~ area, divided by the perimeter squared). Dendrite variables were highest branch order, which indicated the maximum degree of branching for any dendrite; the total number of branch points, which indicated the overall complexity of dendritic trees; total dendritic length, which is the summed length of all dendrites; dendritic volume, which is the total volume of all dendrites; and area of influence, a measure that encloses the neuron in a polygon that touches all of the farthest reaches of the dendrites and calculates the area within the polygon.
The angle of orientation of neurons within the brainstem was also analyzed. To calculate orientation, a straight line is fit to the X,Y coordinates of data points that define a cell, and this slope is converted to a heading angle that is the cell's orientation. The angle is defined with 0" for a horizon- tal line, increasing to 180" as the line rotates from a medial to rostral, to a lateral direction within the brainstem.
364 C.M. MISTRETTA AND S.E. LABYAK
TABLE 1. Summary of Animals and Numbers of Neurons Used in Study Spine counts. All visible spines on each neuron were identified and entered in the Eutectic System. Spines were classified into four categories: pendunculate, sessile, fili- form, and complex (Maley et al., 1983). Pendunculate spines had a thin stalk with a rounded or mushroom- shaped head; sessiles were short and stubby, and the stem was not distinguishable from the head; filiforms had long stalks of roughly uniform diameter throughout their length; and complex spines had double heads or stalks, or other morphologies. We also quantified filipodia and appendages, which were more complex structures.
Obviously, many spines were not counted because they were obscured by the dendrite itself. A correction factor for spine counts (Feldman and Peters, 1979), when used by other investigators, indicates that observed spine density for various neuron types in different age groups is between approximately 50 and 60% of estimated density (Lund and Holbach, 1991). We have not adjusted the observed number of spines hidden beneath the dendrites, and therefore spine numbers are not absolute but are an underestimate of the total.
Statistics Data were analyzed by mixed-model analysis of variance
(ANOVA, Dixon et al., 1988) across age groups for multipo- lar and elongate neurons. We used the mixed model ANOVA because there were not equal numbers of neurons recon- structed from each animal (from one to four neurons of a given type were analyzed for each animal), and it is an appropriate analysis for an unbalanced design. The mixed- model ANOVA treats developmental age as a fixed effect and animal as a random effect. The reported statistic is a maximum likelihood ratio (x2) that compares the model’s fit with and without effects (developmental age; animal). Therefore, it is possible to determine whether recording from more than one neuron in some animals produced an effect. In practice, the results were virtually identical to analysis with one-way ANOVA across age groups treating each neuron independently. Ovoid neurons were analyzed with a one-way ANOVA because each neuron was recon- structed from a separate animal (Table 1). Probability values of I 0.05 were considered statistically significant, but we report actual values in the text. Pairwise t tests with a Bonferroni correction were used to analyze differences between age groups (P I 0.003 were statistically signifi- cant).
RESULTS Neuron categories, numbers, and qualitative observations
We categorized neurons into three morphological groups: elongate, multipolar, and ovoid (Fig. 2). Elongate neurons had two, or sometimes three, primary dendrites originating at opposite ends of an elongated soma. In contrast, multipo- lar neurons had three or more primary dendrites originat- ing almost equidistantly from a triangular or pentagonal soma. Ovoid neurons usually had two very thin primary dendrites originating from opposite ends of a very small ovoid-shaped soma. In contrast to elongate and multipolar neurons, the primary dendrites of ovoid cells extended over a long distance and exhibited little or no branching. Other investigators described these basic neuron categories in the NST of rat (Lasiter, Wong and Kachele, 1989; King and Hill, 1993) and hamster (Whitehead, 1988). We also occa-
Age group 85 days of
gestation 100 days of
gestation 110 days of
gestation 130 days of
gestation Perinatal
Lamb
Animals per Age range group
81-86 3
100-101 I
109-112 6
129-134 11
143 days of 11
35 to 57 days 9
gestation to 8 days postnatal
Dostnatal
~~ ~~
Number of neurons ~
Multipolar Elongate Ovoid
6 6
7 7
16 6
11 I 5
9 3 5
4 3 5
sionally identified neurons with characteristics similar to those categorized as “tufted” by Whitehead (1988) in adult hamster NST. However, tufted neurons were seen so infrequently in our sections of rostra1 NST that they are not included for data quantification.
Numbers of animals and neurons reconstructed at each age are presented in Table 1. Overall, 53 multipolar, 32 elongate, and 15 ovoid neurons were studied. These are neurons that met inclusion criteria based on functional location and morphology, described under Methods. More animals were studied than are represented in Table 1, but because inclusion criteria for neurons were strict, several animals did not yield cells that could be reconstructed. Because multipolar and elongate neurons in NST are thought to be projection neurons (Lasiter and Kachele, 1988; Whitehead, 1990), we focused our analysis on these cell types. Ovoid neurons, often regarded as interneurons (Lasiter and Kachele, 1988; Davis, 1993), were studied in the last three age groups only; these are the age groups for which we have parallel functional data on convergence from previous studies (Vogt and Mistretta, 1990).
Completely stained, multipolar neurons were more fre- quently encountered than elongate neurons in the region of NST that we studied. Well-filled, ovoid neurons were most frequently observed of all three types; we deliberately restricted our sample to five ovoid cells from each of the three oldest groups.
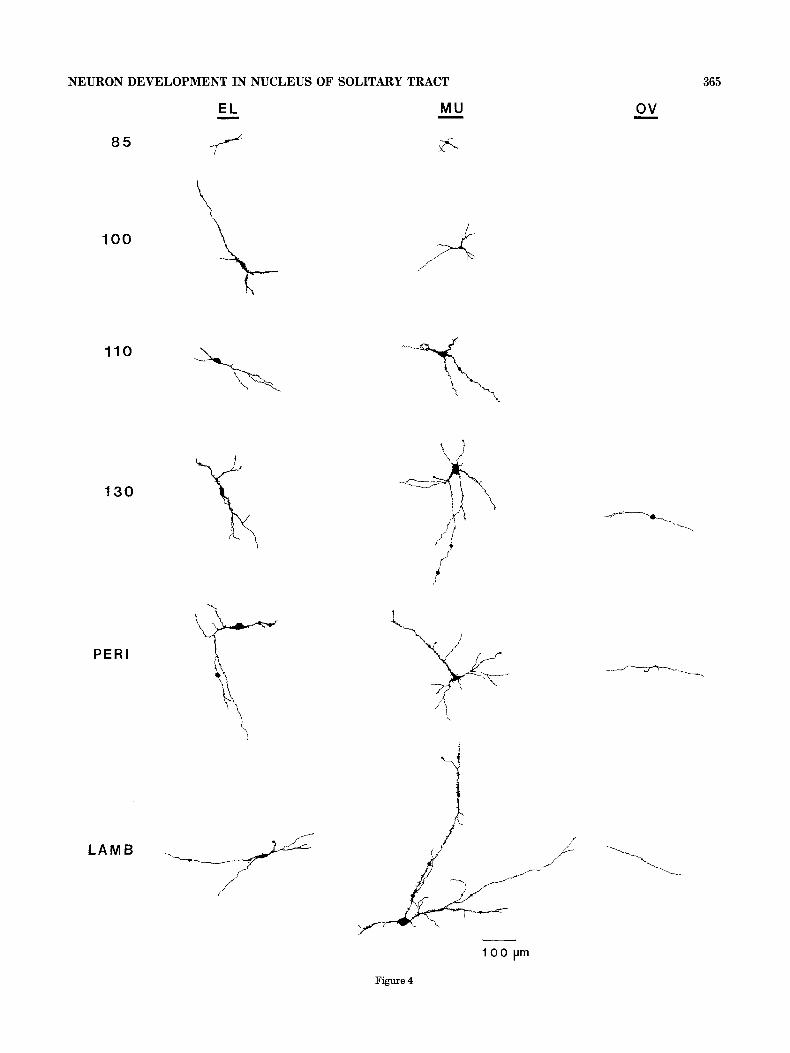
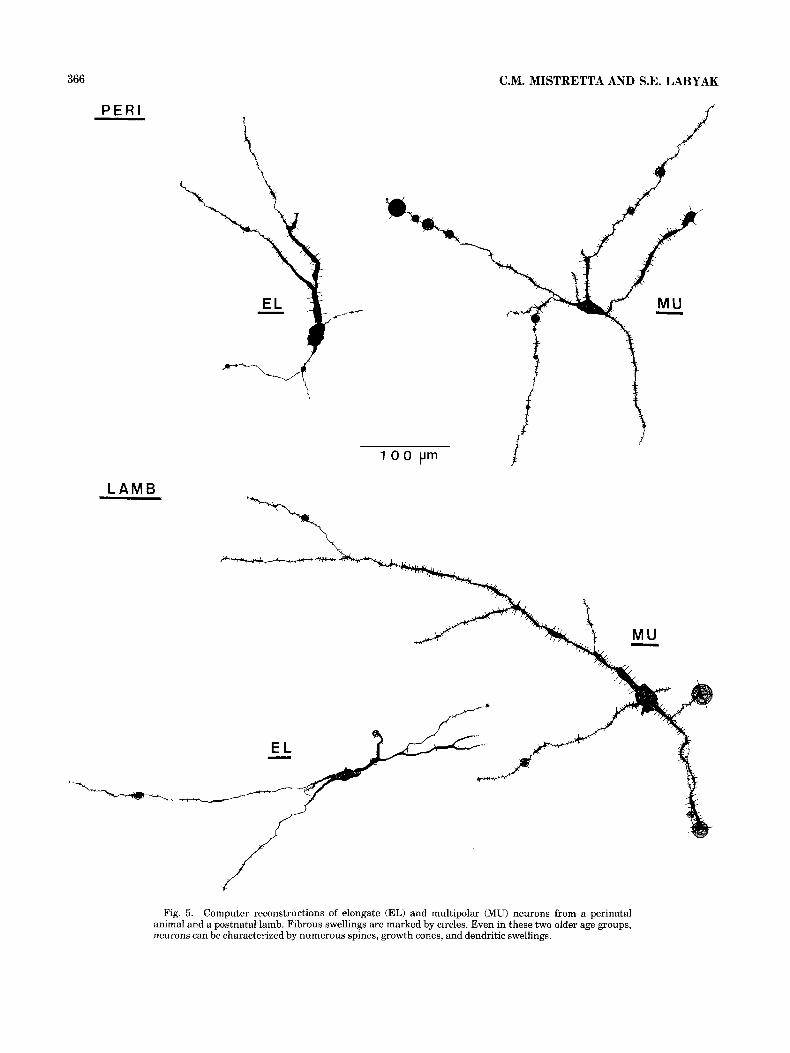
At 85 days of gestation, NST neurons are very small compared with cells in older age groups, both in soma size and total dendritic extent (Fig. 4). However, some dendrites already have third and fourth branch orders so neuron geometry can be complex, and both multipolar and elongate neurons are readily identified in the youngest age group. Numerous growth cones and filopodia characterize den- drites of elongate and multipolar neurons from 85 to about 110 days of gestation and continue to be notable features of some cells through the perinatal period (Figs. 2, 5 ) . In addition, dendrites of both neuron types exhibit numerous spines throughout the pre- and postnatal periods (Fig. 5).
Basic neuron geometry during development Soma. Somal areas for elongate neurons range from an
average of 140-400 pm2 across age groups and increase
Fig. 4. Computer reconstructions of elongate (EL), multipolar (MU), and ovoid (OV) neurons at 85 days of gestation through the postnatal lamb period. The large circles or ovals on several dendrites are computer markings for fibrous swellings and indicate areas of dendritic enlargement or complexity.
NEURON DEVELOPMENT IN NUCLEUS OF SOLITARY TRACT
E L - /
8 5
100
\ 110
PER1
-4 L A M B
MU -
A i
i’
365
ov -
Figure 4
366 C.M. MISTRETTA AND S.E. LABYAK
PER1
L A M 5
1
1 0 0 pm
Fig. 5. Computer reconstructions of elongate (EL) and multipolar (MU) neurons from a perinatal animal and a postnatal lamb. Fibrous swellings are marked by circles. Even in these two older age groups, neurons can be characterized by numerous spines, growth cones, and dendritic swellings.
NEURON DEVELOPMENT IN NUCLEUS OF SOLITARY TRACT 367
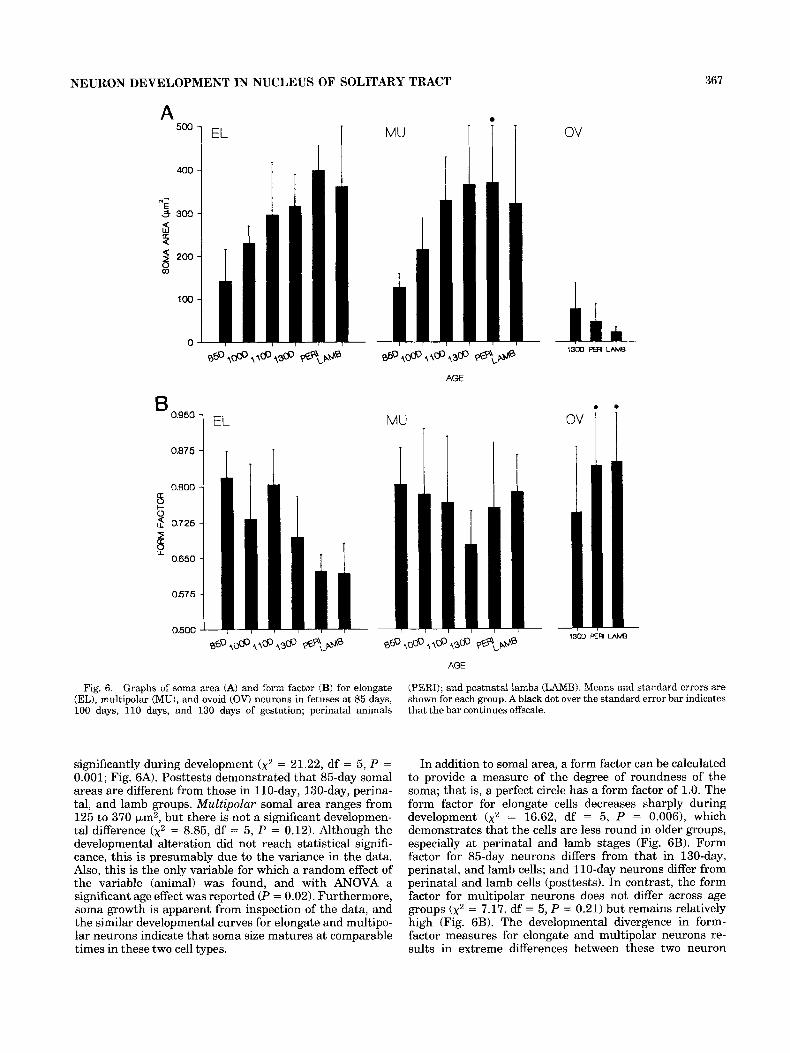
A 500 1 EL I MU I l l ov
0.860 B
0.876
0.800 [I
0 2 0.726 I
P
0.650 8,
0.576
0.600
AGE
EL MU
/ I l l /
Fig. 6. Graphs of soma area (A) and form factor (B) for elongate (EL), multipolar (MU), and ovoid (OV) neurons in fetuses at 85 days, 100 days, 110 days, and 130 days of gestation; perinatal animals
significantly during development ( x 2 = 21.22, df = 5, P = 0.001; Fig. 6A). Posttests demonstrated that 85-day somal areas are different from those in 110-day, 130-day, perina- tal, and lamb groups. Multipolar somal area ranges from 125 to 370 km2, but there is not a significant developmen- tal difference (x2 = 8.85, df = 5 , P = 0.12). Although the developmental alteration did not reach statistical signifi- cance, this is presumably due to the variance in the data. Also, this is the only variable for which a random effect of the variable (animal) was found, and with ANOVA a significant age effect was reported (P = 0.02). Furthermore, soma growth is apparent from inspection of the data, and the similar developmental curves for elongate and multipo- lar neurons indicate that soma size matures at comparable times in these two cell types.
j(l 13oD PER LAME
AGE
(PERI); and postnatal lambs (LAMB). Means and standard errors are shown for each group. A black dot over the standard error bar indicates that the bar continues offscale.
In addition to somal area, a form factor can be calculated to provide a measure of the degree of roundness of the soma; that is, a perfect circle has a form factor of 1.0. The form factor for elongate cells decreases sharply during development (x2 = 16.62, df = 5 , P = 0.006), which demonstrates that the cells are less round in older groups, especially at perinatal and lamb stages (Fig. 6B). Form factor for 85-day neurons differs from that in 130-day, perinatal, and lamb cells; and 110-day neurons differ from perinatal and lamb cells (posttests). In contrast, the form factor for multipolar neurons does not differ across age groups (x2 = 7.17, df = 5, P = 0.21) but remains relatively high (Fig. 6B). The developmental divergence in form- factor measures for elongate and multipolar neurons re- sults in extreme differences between these two neuron
368 C.M. MISTRETTA AND S.E. LABYAK
A MU
1
C
l y l EL
- . . @,@,\I
MU
A E
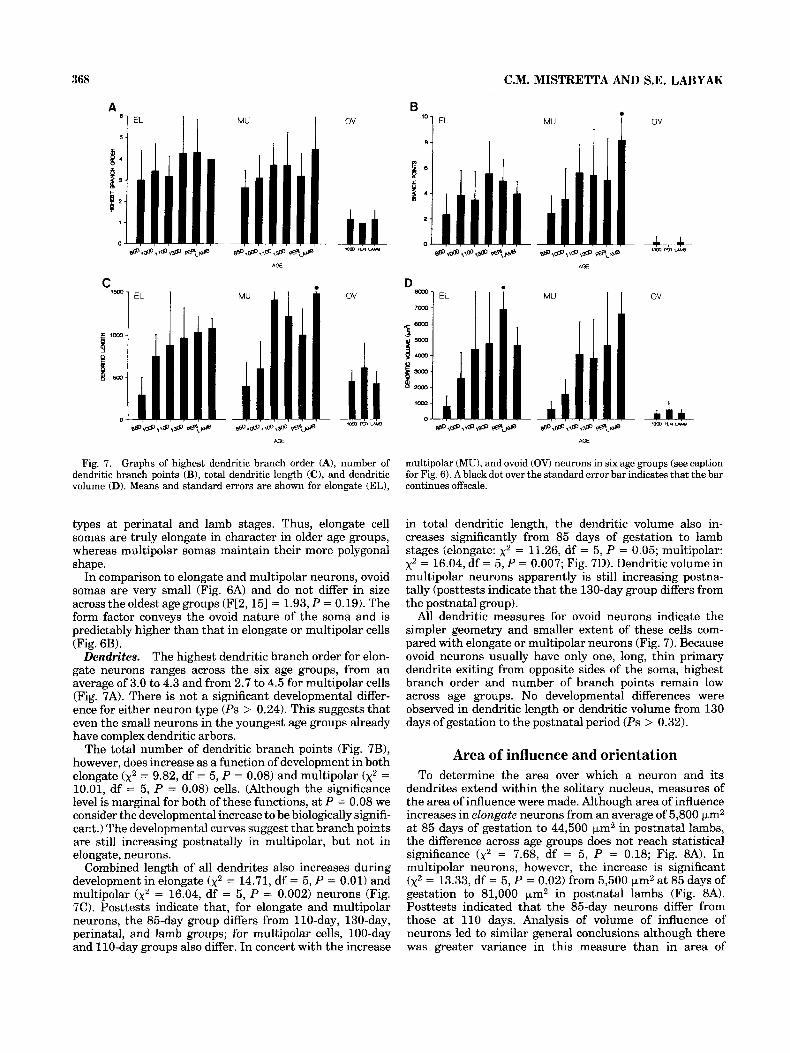
Fig. 7. Graphs of highest dendritic branch order (A), number of dendritic branch points (B), total dendritic length (C), and dendritic volume (D). Means and standard errors are shown for elongate (EL),
types at perinatal and lamb stages. Thus, elongate cell somas are truly elongate in character in older age groups, whereas multipolar somas maintain their more polygonal shape.
In comparison to elongate and multipolar neurons, ovoid somas are very small (Fig. 6A) and do not differ in size across the oldest age groups (F[2,15] = 1.93, P = 0.19). The form factor conveys the ovoid nature of the soma and is predictably higher than that in elongate or multipolar cells (Fig. 6B).
The highest dendritic branch order for elon- gate neurons ranges across the six age groups, from an average of 3.0 to 4.3 and from 2.7 to 4.5 for multipolar cells (Fig. 7A). There is not a significant developmental differ- ence for either neuron type (Ps > 0.24). This suggests that even the small neurons in the youngest age groups already have complex dendritic arbors.
The total number of dendritic branch points (Fig. 7B), however, does increase as a function of development in both elongate (x2 = 9.82, df = 5 , P = 0.08) and multipolar ( x 2 = 10.01, df = 5 , P = 0.08) cells. (Although the significance level is marginal for both of these functions, at P = 0.08 we consider the developmental increase to be biologically signifi- cant.) The developmental curves suggest that branch points are still increasing postnatally in multipolar, but not in elongate, neurons.
Combined length of all dendrites also increases during development in elongate ( x2 = 14.71, df = 5 , P = 0.01) and multipolar (x2 = 16.04, df = 5 , P = 0.002) neurons (Fig. 7C). Posttests indicate that, for elongate and multipolar neurons, the 85-day group differs from 110-day, 130-day, perinatal, and lamb groups; for multipolar cells, 100-day and 110-day groups also differ, In concert with the increase
Dendrites.
MU I ov
D I I i MU
AGE
multipolar (MU), and ovoid (OV) neurons in six age groups (see caption for Fig. 6). A blackdot over the standard error bar indicates that the bar continues offscale.
in total dendritic length, the dendritic volume also in- creases significantly from 85 days of gestation to lamb stages (elongate: x2 = 11.26, df = 5, P = 0.05; multipolar: x2 = 16.04, df = 5 , P = 0.007; Fig. 7D). Dendritic volume in multipolar neurons apparently is still increasing postna- tally (posttests indicate that the 130-day group differs from the postnatal group).
All dendritic measures for ovoid neurons indicate the simpler geometry and smaller extent of these cells com- pared with elongate or multipolar neurons (Fig. 7). Because ovoid neurons usually have only one, long, thin primary dendrite exiting from opposite sides of the soma, highest branch order and number of branch points remain low across age groups. No developmental differences were observed in dendritic length or dendritic volume from 130 days of gestation to the postnatal period (Ps > 0.32).
Area of influence and orientation To determine the area over which a neuron and its
dendrites extend within the solitary nucleus, measures of the area of influence were made. Although area of influence increases in elongate neurons from an average of 5,800 km2 a t 85 days of gestation to 44,500 pm2 in postnatal lambs, the difference across age groups does not reach statistical significance ( x 2 = 7.68, df = 5 , P = 0.18; Fig. 8A). In multipolar neurons, however, the increase is significant ( x 2 = 13.33, df = 5, P = 0.02) from 5,500 pm2 at 85 days of gestation to 81,000 pm2 in postnatal lambs (Fig. 8A). Posttests indicated that the 85-day neurons differ from those at 110 days. Analysis of volume of influence of neurons led to similar general conclusions although there was greater variance in this measure than in area of
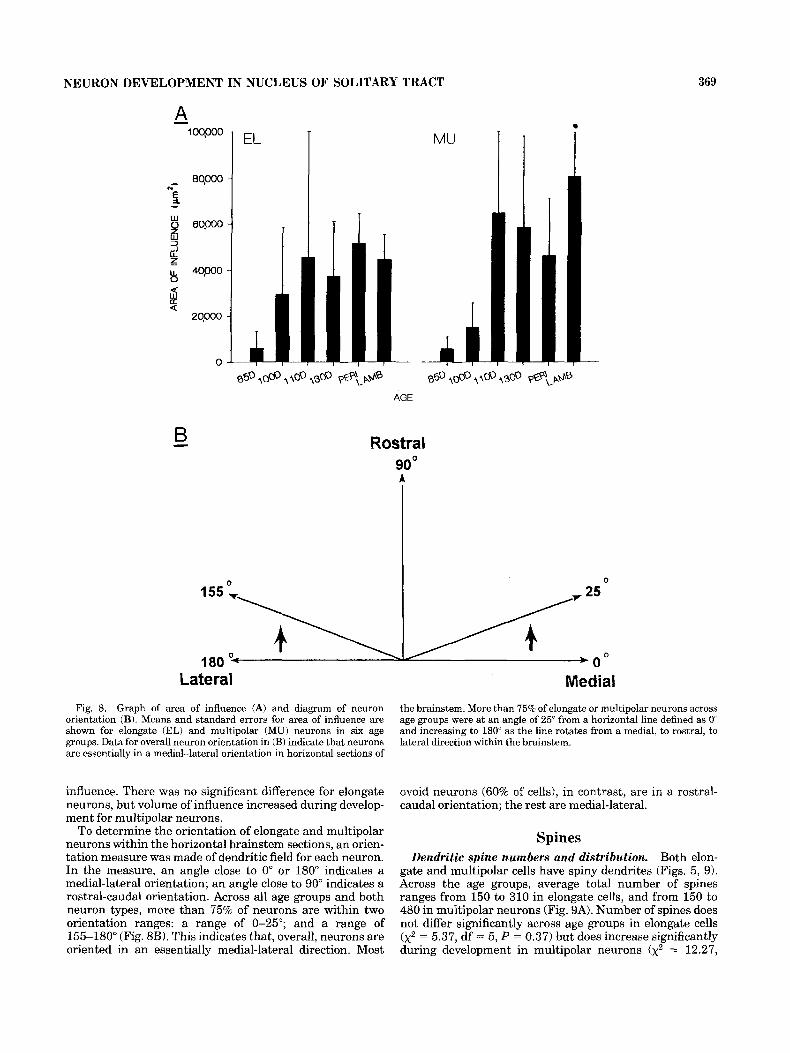
NEURON DEVELOPMENT IN NUCLEUS OF SOLITARY TRACT 369
- A 1 00p00
00.000
% 4
MU
# 80,000 - 2 z
40,000 - b S 2
24000 -
0
B Rostra1 90" A
0 0
Lateral Fig. 8. Graph of area of influence (A) and diagram of neuron
orientation (B). Means and standard errors for area of influence are shown for elongate (EL) and multipolar (MU) neurons in six age groups. Data for overall neuron orientation in (B) indicate that neurons are essentially in a medial-lateral orientation in horizontal sections of
influence. There was no significant difference for elongate neurons, but volume of influence increased during develop- ment for multipolar neurons.
To determine the orientation of elongate and multipolar neurons within the horizontal brainstem sections, an orien- tation measure was made of dendritic field for each neuron. In the measure, an angle close to 0" or 180" indicates a medial-lateral orientation; an angle close to 90" indicates a rostral-caudal orientation. Across all age groups and both neuron types, more than 75% of neurons are within two orientation ranges: a range of 0-25"; and a range of 155-180" (Fig. 8B). This indicates that, overall, neurons are oriented in an essentially medial-lateral direction. Most
Medial the brainstem. More than 75% of elongate or multipolar neurons across age groups were at an angle of 25" from a horizontal line defined as 0" and increasing to 180" as the line rotates from a medial, to rostral, to lateral direction within the brainstem.
ovoid neurons (60% of cells), in contrast, are in a rostral- caudal orientation; the rest are medial-lateral.
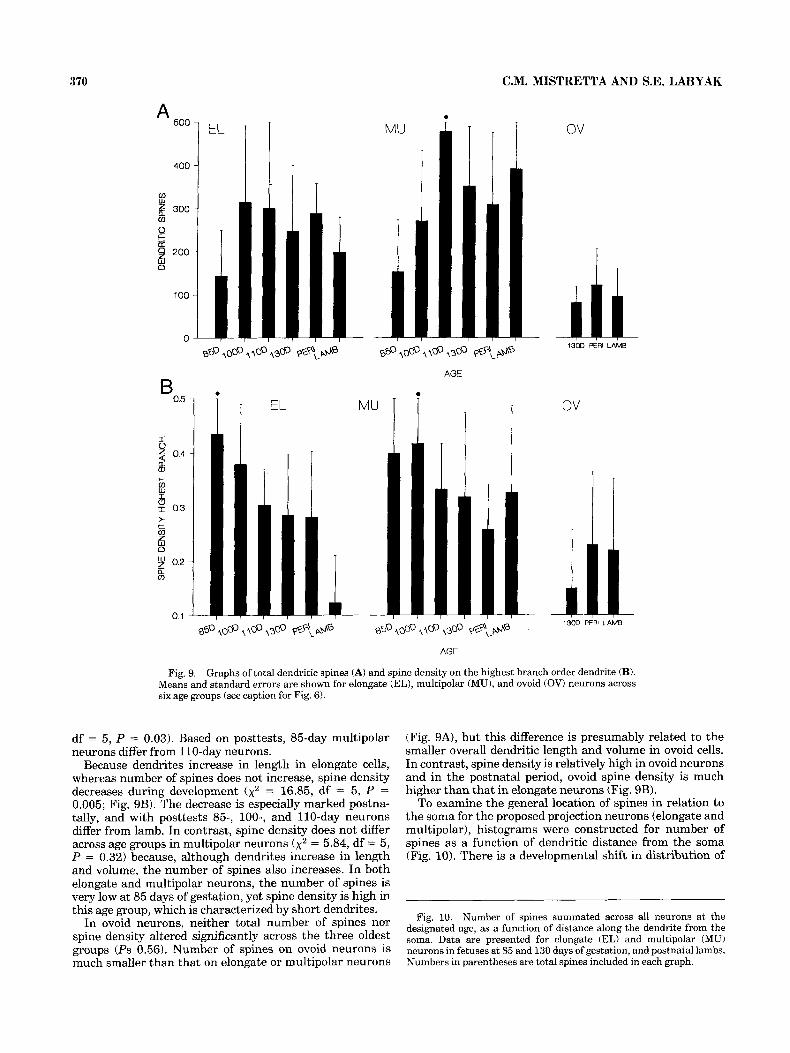
Spines Dendritic spine numbers and distribution. Both elon-
gate and multipolar cells have spiny dendrites (Figs. 5 , 9). Across the age groups, average total number of spines ranges from 150 to 310 in elongate cells, and from 150 to 480 in multipolar neurons (Fig. 9A). Number of spines does not differ significantly across age groups in elongate cells ( ~ 2 = 5.37, df = 5, P = 0.37) but does increase significantly during development in multipolar neurons (x2 = 12.27,
370 C.M. MISTRETTA AND S.E. LABYAK
50C A
EL
EL I 1 M U i i
ov
1300 P& LAMB
ov
1300 PER1 LAMB
Fig. 9. Graphs of total dendritic spines (A) and spine density on the highest branch order dendrite (B). Means and standard errors are shown for elongate (EL), multipolar (MU), and ovoid (OV) neurons across six age groups (see caption for Fig. 6).
df = 5 , P = 0.03). Based on posttests, 85-day multipolar neurons differ from 110-day neurons.
Because dendrites increase in length in elongate cells, whereas number of spines does not increase, spine density decreases during development (x2 = 16.85, df = 5 , P = 0.005; Fig. 9B). The decrease is especially marked postna- tally, and with posttests 8 5 , loo-, and 110-day neurons differ from lamb. In contrast, spine density does not differ across age groups in multipolar neurons (x2 = 5.84, df = 5 , P = 0.32) because, although dendrites increase in length and volume, the number of spines also increases. In both elongate and multipolar neurons, the number of spines is very low at 85 days of gestation, yet spine density is high in this age group, which is characterized by short dendrites.
In ovoid neurons, neither total number of spines nor spine density altered significantly across the three oldest groups (Ps 0.56). Number of spines on ovoid neurons is much smaller than that on elongate or multipolar neurons
(Fig. 9A), but this difference is presumably related to the smaller overall dendritic length and volume in ovoid cells. In contrast, spine density is relatively high in ovoid neurons and in the postnatal period, ovoid spine density is much higher than that in elongate neurons (Fig. 9B).
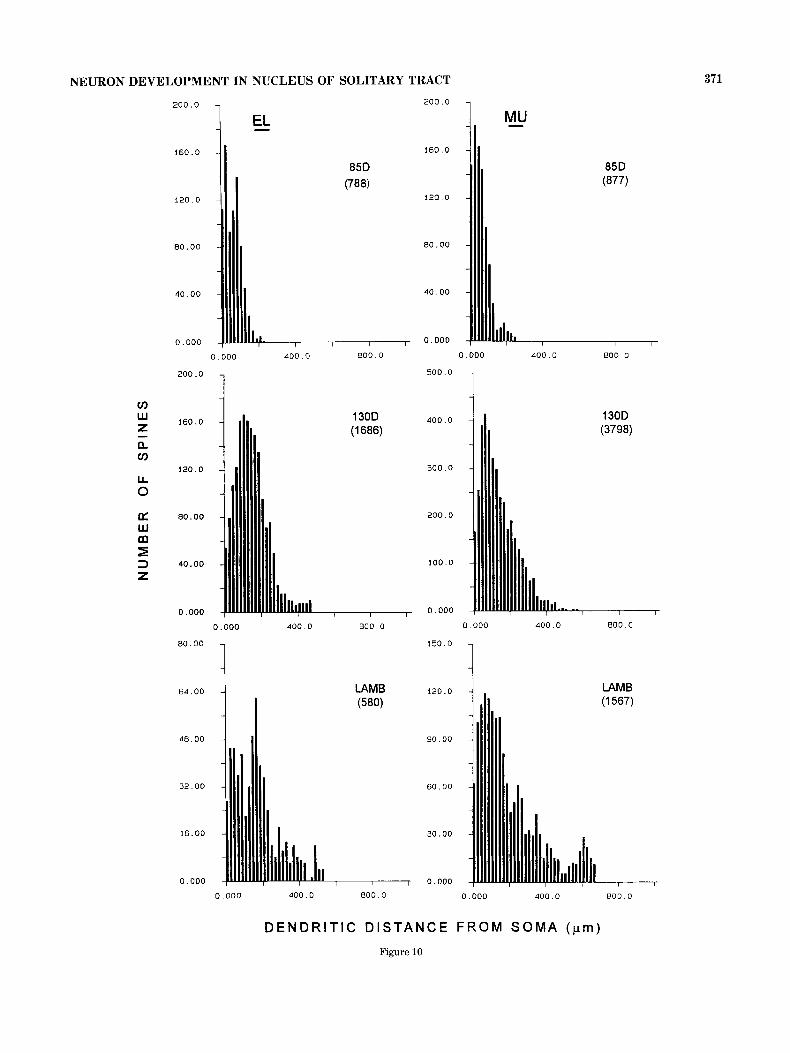
To examine the general location of spines in relation to the soma for the proposed projection neurons (elongate and multipolar), histograms were constructed for number of spines as a function of dendritic distance from the soma (Fig. 10). There is a developmental shift in distribution of
Fig. 10. Number of spines summated across all neurons at the designated age, as a function of distance along the dendrite from the soma. Data are presented for elongate (EL) and multipolar (MU) neurons in fetuses at 85 and 130 days of gestation, and postnatal lambs. Numbers in parentheses are total spines included in each graph.
NEURON DEVELOPMENT IN NUCLEUS OF SOLITARY TRACT 371
2 0 0 . 0
J E L 160.0
120.0
8 0 . 0 0
40.00
0 . 0 0 0
200.0
160.0
850 (788)
120.0
80 .oo
40.00
0.000
1
85D (877)
0 000 400 0 800 0 0 000 400 0 BOO 0
1 200.0
160.0
120.0
80.00
40.00
0.000
0.000 400.0
i I 64.00
48.00
32.00
16.00
0 . 0 0 0
1 5 0 0 . 0
400.0
300 0
2 0 0 . 0
100.0
0 . 0 0 0
130D (3798)
800 0 0 000 400 0 800 a
150'0 1 120.0
90 00
6 0 . 0 0
3 0 . 0 0
0.000
1 LAMB (1 567)
1 0 000 400 0 BOO 0 0 000 400 0 BOO 0
D E N D R l T l C D I S T A N C E F R O M SOMA (prn)
Figure 10
372 C.M. MISTRETTA AND S.E. LABYAK
spines in relation to distance from the soma in both elongate and multipolar neurons. Spines are located closer to the soma in younger cells and are a t a greater distance in later stages. Thus, there is a change from a more “electri- cally compact” neuron to one that is less compact.
For both elongate and multipo- lar neurons, the most frequently observed spine types across developmental ages are pedunculate and sessile. There are far fewer filiform spines, and complex spines are fewest in number at any age.
Few soma spines are observed in either elongate or multipolar neurons. Average numbers in elon- gates range from a high of 12 at 85 days of gestation to about 7 in postnatal lambs; and in multipolars, numbers range from an average of 7 at 85 days to 3 in lambs.
Convergence and neuron geometry We know from previous studies that there is increased
functional convergence of primary taste af€erents onto second-order neurons in NST during the period from late fetal to perinatal and postnatal stages (Vogt and Mistretta, 1990). Therefore, we examined quantitative aspects of morphological development during the ages for which data on convergence had been collected: 130 days of gestation, perinatal, and postnatal. Figure 11 indicates that number of branch points, total dendritic length, dendritic volume, and area of influence are apparently still increasing in multipolar, but not elongate, neurons during this period. However, spine density is decreasing on elongate dendrites but remaining constant for multipolar cells.
Dendritic spine types.
Soma spines.
DISCUSSION From 85 days of gestation through about two months
postnatal, neurons in the rostral NST increase in physical size and alter in geometry. There are different developmen- tal functions for morphological parameters in the two proposed projection neuron types, elongate and multipolar, that suggest different time courses for maturation. Some parameters apparently continue to increase postnatally in multipolar cells, whereas these same characteristics peak or plateau prenatally in elongate neurons. The sections that follow discuss developmental differences for NST neuron types in relation to neurophysiological development and convergence, and the basic neurobiology of the NST.
Limitations of study and Golgi technique Before discussing the data on development of NST
neurons, some qualifying statements are appropriate. Limi- tations of Golgi procedures for neuron morphology have been described extensively (e.g., Desmond and Levy, 1982; Claiborne et al., 1990). These include the selectivity of the Golgi method, so that all neuron types might not be sampled; loss of neuron extent due to cut dendrites; and the possibility of incomplete neuron impregnation, especially of distal dendrites.
We do not believe that selectivity presents a major problem for our study. Other investigations of both gusta- tory and caudal nongustatory regions of the solitary nucleus, in various species with various Golgi methods and other labeling and Nissl techniques, all report essentially the same neuron types: multipolar or stellate, elongate or fusiform, ovoid, and, occasionally, tufted (Maley et al., 1983; Davis and Jang, 1988; Whitehead, 1988; Lasiter et al., 1989; King and Hill, 1993). Furthermore, in other
systems, the Golgi-Cox method reportedly yields a random sample of neuron types (Albers and Meek, 1991).
Because we only reconstructed neurons contained in one thick section of the Golgi material and excluded neurons with cut primaries, loss of dendritic extent due to cut dendrites should not present a major limitation of this study. In addition, ovoid neurons in our data set have very long, thin dendrites that were well impregnated in the three oldest age groups. We cannot, however, exclude the possibil- ity that dendrites were incompletely impregnated. For example, rat NST neurons filled with biocytin (King and Bradley, 1994) have substantially greater total dendritic length than Golgi-impregnated rat NST cells (King and Hill, 1993).
Finally, because we limited our analysis to neurons in a functionally or neuroanatomically circumscribed region of gustatory NST, our total sample size is restricted. However, restricting neurons to a defined region of the NST (the extreme rostral region) contributes validity to conclusions about development and permits comparisons with previous receptive field studies (Vogt and Mistretta, 1990).
Development of NST neuron geometry and neurophysiological taste responses
Our quantitative data based on Golgi impregnations indicate that there are two broad periods of morphological development in elongate and multipolar neurons. The first is 85-110 days of gestation, when very steep, increasing functions are observed for soma growth; dendritic branch- ing, length, volume, and area of influence; and number of spines (Figs. 6-9). For example, dendritic volume increases fourfold and number of spines doubles. This is a period of extremely active growth for second-order gustatory neu- rons. Interestingly, during this initial period, measures for elongate and multipolar neurons are quite comparable in magnitude. In contrast, during the second period from late fetal (130 days of gestation) through postnatal stages, the developmental curves either plateau or decline, and mea- sures for elongate and multipolar neurons diverge. This latter period may be one of refining and remodeling neuron morphology.
During the earlier period of accelerated growth of second- order soma and dendrites, only low-frequency neural im- pulses are transmitted centrally through peripheral taste afferents (Bradley and Mistretta, 1973; Mistretta and Brad- ley, 1983). I t is very difficult to record successfully from taste afferents younger than 100 days of gestation, and even at 110 days the magnitude of neural responses is small. Indeed, taste buds in fetuses younger than about 100 days of gestation lack essential characteristics of mature organs.
Neurophysiological taste responses also have been re- corded from NST neurons at 85-110 days of gestation. Responses are low frequency, rapidly adapting, and have a long latency compared with neurons in older fetal and postnatal animals (Bradley and Mistretta, 1980). Further- more, neurons in the younger animals respond to a more narrow range of chemical stimuli than those in older groups.
We propose that the observed growth and morphogenesis of second-order neurons from 85 through 110 days of gestation are primarily under intrinsic cell controls. During this time, afferent taste input and second-order neurophysi- ological characteristics are highly immature. After this period, neuron types diverge in morphological characteris- tics, and altered gustatory activity from the periphery may

NEURON DEVELOPMENT IN NUCLEUS OF SOLITARY TRACT 373
\ \ \ .E
0 ' 3 1 1300 PWI LAMB 1300 PERl LAMB
AGE AGE
7000
1400
W 1300- I
9 5000 - t a: 0 z
3 \ \
Q .EL
# 4000-
5 1100- 6 0
, 1000 - , m- 900 3000 ~
1300 PER1 LAMB 1300 PERl LAMB
AGE AGE
goo00
# 70000 z 3
B U
2 5000c Q
3000(
P MU
/ /
/
d
1300 PERl LAMB AGE
Fig. 11. Comparison of functional convergence in the nucleus of the solitary tract (NST) with dendritic and spine density alterations during late fetal to postnatal development. Top left: Means and standard errors for number of fungiform papillae in receptive fields of chorda tympani fibers (CT) and NST taste neurons in 130-day fetal, perinatal, and lamb groups (from Mistretta and Vogt, 1990); data demonstrate increasing convergence of taste fibers onto NST cells from late fetal to perinatal stages. Other graphs present data from neuron reconstructions on
influence continued development of second-order cells. Studies on receptive fields of first- and second-order taste neurons provide information about convergence onto NST cells that support this proposition (Vogt and Mistretta, 1990).
0.4
> 0.3 t (D Z U n w z
0.2
0.1
\ \ \ \ \ \ i a
1300 PER1 LAMB
AGE
dendritic branch points, length, and volume; area of influence; and spine density for elongate (EL) and multipolar (MU) neurons in 130-day fetal, perinatal, and postnatal lamb age groups. Whereas dendrite variables for elongate neurons have reached a plateau or are declining in lambs, these variables appear to be increasing after birth in multipolar neurons. The standard error bars have been omitted from these graphs for clarity but can be found in Figures 7-9.
Functional convergence and dendritic development
Previous neurophysiological experiments have demon- strated that from 130 days of gestation to perinatal stages,
374 C.M. MISTRETTA AND S.E. LABYAK
there is convergence of first-order taste afferents onto second-order neurons in the NST (Vogt and Mistretta, 1990). The period of convergence is associated with an increased responsiveness of central neurons to salts and apparently has a special role in amplifying low-frequency peripheral nerve responses to sodium chloride. Therefore, both the extent and nature of afferent input to NST neurons alters over this period. The extent of presynaptic innervation is directly related to dendritic complexity of postsynaptic neurons in other systems (Purves and Hume, 1981). Furthermore, in the visual system, after intraocular tetrodotoxin injections, there are alterations in the struc- tural development and pattern of synapses within the lateral geniculate nucleus (Kalil et al., 1986).
Based on studies from other systems that link presynap- tic innervation and activity to postsynaptic neuronal prop- erties, we hypothesized that numbers and/or morphology of dendrites and spines during the late fetal to perinatal period would correlate with functional convergence. We ensured that morphological and neurophysiological data would be based on neurons from the same region of the NST by reconstructing cells from a functionally (neurophysi- ologically) defined area of the nucleus.
Data from reconstructions of Golgi material demonstrate that numerous aspects of neuron morphology correlate well with neurophysiological convergence. From 130 days of gestation to about two months after birth, multipolar neurons apparently still undergo increases in number of branch points, dendritic length, dendritic volume, and area of influence. In addition spine density is maintained over this period. In contrast, elongate neurons do not exhibit increases in dendritic parameters at these stages. Further- more, spine density decreases in elongates from prenatal to postnatal stages. Morphological development of NST neu- rons therefore suggests that multipolar neurons, with increasing dendritic extent and maintained spine density, may be receiving more afferent input than elongate neu- rons over late fetal to postnatal ages. More studies would be necessary to experimentally test this proposition.
Golgi studies of neurons in rat NST during the postnatal period have also indicated that elongate and multipolar neurons mature at different times (Lasiter et al., 1989). Whereas dendritic length of elongate neurons plateaus at about 20 days after birth, second-order dendrites of multi- polar cells continue to increase in length between 40 and 70 days postnatal. Thus there are data from two species to suggest a more prolonged morphological maturation for multipolar neurons compared with elongate cells.
Ovoid neurons do not seem good candidates for second- order recipients of converging afferent input because den- dritic parameters for these cells do not change between 130 days of gestation and postnatal periods (Fig. 7). In.addition, the simple geometry of these neurons does not suggest a correlation with substantial afferent fiber input. The very long, thin primary dendrites of oviod cells do, however, reinforce the idea that these cells are interneurons (Lasiter and Kachele, 1988; Davis, 1993), and their orientation and extent indicates that they could provide a connection between neurons separated by a considerable distance in the NST.
Spines Spines provide the major postsynaptic membrane for
excitatory synaptic input (Rall and Segev, 1987; Jaslove, 1992), and, therefore, quantitative measures of spines can
give an indication of the overall excitatory input to second- order gustatory neurons. In neurons as diverse as pyrami- dal cells in the hippocampus, Purkinje cells in the cerebel- lum, and various cortical neurons, the majority of distal excitatory synapses are formed on spines; inhibitory syn- apses rarely occur on spines but generally form on the dendritic shaft near the soma, on the soma, and at dendritic branch points (Jaslove, 1992). Thus, distal spines may play an important role in excitatory neural transmission.
Electron microscopic studies of horseradish-peroxidase- labeled NST cells in adult hamster provide data on spine distribution and synapse characteristics in elongate and multipolar neurons (Whitehead, 1993). In both neuron types, spines of distal dendrites receive the largest number of synapses and greatest degree of coverage from primary endings that resemble chorda tympani afferent synaptic input. Whereas afferent input is concentrated on spines of distal dendrites, there are proportionately more endings with morphologies that suggest input from the GABAergic interneurons on the soma and proximal dendrites of both neuron types.
Although both elongate and multipolar hamster neurons receive most of their synaptic input on distal dendrites and this input is principally from primary afferent fibers, distal dendritic spines of multipolar cells apparently receive all of their synaptic input from primary-type endings (White- head, 1993). Furthermore, multipolar dendrites receive a greater number of synaptic endings overall than dendrites of elongate cells. These data on adult hamster NST cells suggest that multipolar neurons receive more excitatory afferent input than elongate cells, and that distal dendritic spines are the principal location for afferent excitatory input in both neuron types.
Our data on sheep NST cells also suggest that the more branched and spiny multipolar cells receive more excitatory input than elongate neurons. The very spiny distal den- drites may be the principal location for this input. These observations further implicate the multipolar neurons as more directly involved than elongate cells in the process of functional convergence during the late fetal to postnatal period. Increased afferent input would presumably synapse on the more extensive, elaborate, and spiny multipolar dendrites, which could integrate a large number of synaptic inputs. The data also suggest that the elongate and multipo- lar cell types may receive different inputs that develop with different time courses; examples would be afferent projec- tions versus projections from NST interneurons, different categories of afferent input, or different proportions of excitatory versus inhibitory input.
Data on rat NST from King and Hill (1993) support this proposal. Animals that experience maternal sodium chlo- ride depletion, and subsequent repletion after birth, exhibit alterations in number and length of dendrites that differ in elongate and multipolar neurons. Both neuron types are affected by salt depletion, but elongate cells recover from the depletion effect when sodium chloride is reinstituted in the diet, whereas a subset of multipolar neurons does not recover.
In other sensory systems, measures of spine number and density demonstrate fluctuations during development that relate to function. For example, in the rat olfactory system, spine density on granule cells in the olfactory bulb first increases from about 0.10 spines/pm at 0 days to 0.25 at 12 days postnatal; then there is a decrease to about 0.20 spines/pm at 21 days postnatal (Shepherd and Greer,
NEURON DEVELOPMENT IN NUCLEUS OF SOLITARY TRACT 375
1988). In macaque primary visual cortex, spine density on spiny stellate neurons increases and then decreases in early postnatal weeks (Lund and Holbach, 1991). Spine acquisi- tion and loss on the alpha neuron type precedes these phases on beta neurons. Then, at about 30 weeks of age, spine density is similar on the two neuron types. In this system, each spine has a type 1 synapse at its tip, and synaptic loss relates to spine “retraction.” The investiga- tors concluded that visual activity modulates development of the spiny stellate neurons but is not an initiator or terminator for the maturational sequence (Lund et al., 1991).
We quantified four types of spines in the current study and found a predominance of sessile and penduncular spines across age groups in both elongate and mulitpolar neurons. Although morphology may not relate directly to electrotonic properties of spines (Jaslove, 1992), different morphological types could relate to the various configura- tions of axon terminal endings and synapses on NST neurons (Whitehead, 1993).
Comparisons with other NST data Several other laboratories have identified elongate (or
fusiform), multipolar (or stellate), and ovoid neurons as the main morphological types within gustatory NST (Davis and Jang, 1988; Whitehead, 1988; Lasiter et al., 1989; King and Hill, 1993; King and Bradley, 1994). Of these types, ovoid soma are always identified as smallest in size. Therefore, data from rat, hamster, and now sheep present a similar general categorization of cells in gustatory NST.
Some data on spines in adult NST are published that can be compared with our data on postnatal sheep, the oldest age group we studied. Spine densities are 0.05-0.10 spines/km in adult hamster elongate and multipolar neu- rons (Davis and Jang, 1988). In adult rat NST (King and Bradley, 19941, spine densities on the highest branch order dendrite average 0.004 in elongate, 0.069 in multipolar, and 0.004 in ovoid cells. This suggests that multipolar neurons in rat NST are much more spiny than elongate or ovoid neurons. In postnatal lambs, multipolar neurons retain very spiny dendrites (Figs. 8, 9). In fact, because our observed spine counts do not include spines obscured by the dendrites themselves, the sheep NST neurons are even more spiny than our data indicate. Theoretically, for neu- rons with high spine density, the functional unit may be not the synapse but the distal spiny dendrites (Jaslove, 1992). The potential role of individual dendrites in taste process- ing has been ignored, but with converging reports about relatively numerous spines on some NST neurons, the spiny distal dendrite as a computational unit should be considered.
Neuron reconstructions of NST cells usually support a medial-lateral orientation of dendritic trees (Davis and Jang, 1988; Whitehead, 1988) that corresponds well with the reported lateral to medial trajectory of preterminal facial taste afferent axons entering the NST (Whitehead, 1986) or a rostral-caudal orientation (Davis and Jang, 1988). However, King and Bradley (1994) reported that elongate and multipolar neurons in rat are at an average angle of 145” from the medial axis, an angle that is approximately parallel to the solitary tract. Orientation data across age groups in sheep suggest a predominantly medial-lateral orientation. However, the orientation mea- sure reduces the total cell orientation to one angle. This could be misleading for functional correlations, because one
or two very spiny dendrites oriented in a rostral-caudal direction could have a major role in processing.
In summary, as more numerous publications have ap- peared with quantitative morphological data about ham- ster, rat, and sheep NST neurons, consistencies across species have emerged in identification of types of neurons, relative size among types, dendritic orientation, and spine density among types.
SUMMARY AND CONCLUSIONS Elongate and multipolar neurons in a functionally de-
fined region of gustatory NST alter markedly and in a parallel manner, in somal size, dendritic extent and complex- ity, and acquisition of spines from 85 through about 110 days of gestation (term = 147 days). From 130 days of gestation to about two months postnatal, dendritic param- eters in elongate neurons plateau or decline and spine density decreases, whereas in multipolar neurons dendrites continue to grow and spine density remains stable. Ovoid neurons do not alter morphologically over this later period. These data suggest that multipolar, rather than elongate or ovoid, neurons are prime candidates to receive the increas- ing, converging afferent input to NST cells. During the early period of rapid, parallel growth in elongate and multipolar cells, neural responses from afferent taste fibers, and in the NST neurons themselves, are of low frequency and immature in chemical sensitivity. During the later period when elongate neurons apparently cease morphologi- cal growth and exhibit a decline in some characteristics and multipolar neurons continue to grow and remain very spiny, neurophysiological input from taste fibers is of higher frequency and acquires mature chemical response properties. Neural activity may be one of several possible variables that affect development of neuron morphology among specific cell types within gustatory NST.
ACKNOWLEDGMENTS This research was supported by NIDCD, NIH grant
DC00456 to C.M.M. Dr. Suat Gurkan and Ms. Mary Womble provided expert technical assistance with the Golgi preparations. We thank Drs. Robert Bradley and Michael King for helpful comments on drafts of the manuscript.
LITERATURE CITED Albers, F.J., and J. Meek (1991) Dendritic and synaptic properties of
collicular neurons: A quantitative light and electron microscopical study of Golgi-impregnated cells. Anat. Rec. 2313524-537.
Beidler, L.M. (1953) Properties of chemoreceptors of tongue of rat. J. Neurophysiol. 163595-607.
Bradley, R.M. (1994) Neurobiology of the gustatory zone of the nucleus tractus solitarius. In R.A. Barraco (ed): Nucleus of the Solitary Tract. Boca Raton: CRC Press, pp. 50-62.
Bradley, R.M., and C.M. Mistretta (1973) The gustatory sense in foetal sheep during the last third of gestation. J. Physiol. 2313271-282.
Bradley, R.M., and C.M. Mistretta (1980) Developmental changes in neuro- physiological taste responses from the medulla in sheep. Brain Res. 191.2-34.
Capowski, J.J. (1989) Computer Techniques in Neuroanatomy. New York: Plenum Press.
Claiborne, B.J., D.G. Amaral, and W. M. Cowan (1990) Quantitative, three-dimensional analysis of granule cell dendrites in the rat dentate gyrus. J. Comp. Neurol. 302206-219.
Davis, B.J. (1988) Computer-generated rotation analyses reveal a key three-dimensional feature of the nucleus of the solitary tract. Brain Res. Bull. 20:545-548.
376 C.M. MISTRETTA AND S.E. LABYAK
Davis, B.J. (1993) GABA-like immunoreactivity in the gustatory zone of the nucleus of the solitary tract in the hamster: Light and electron micro- scopic studies. Brain Res. Bull. 30.69-77.
Davis, B.J., and T. Jang (1988) A Golgi analysis of the gustatory zone of the nucleus of the solitary tract in the adult hamster. J. Comp. Neurol. 278:388-396.
Desmond, N.L., and W.B. Levy (1982) A quantitative anatomical study of the granule cell dendritic fields of the rat dentate gyrus using a novel probabilistic method. 6. Comp. Neurol. 212:131-145.
Dixon, W.J., M.B. Brown, L. Engelman, M A Hill, and R.I. Jennrich (1988) BMDP Statistical Software Manual, vol. 2. Los Angeles: University of California Press, pp. 1025-1043.
Feldman, M.L., and A. Peters (1979) A technique for estimating total spine numbers on Golgi impregnated dendrites. J. Comp. Neurol. 188527- 542.
Glaser, E.M., and H. Van der Loos (1981) Analysis of thick brain sections by obverse-reverse computer microscopy: Application of a new, high clarity Golgi-Nissl stain. J. Neurosci. Meth. 4.117-125.
Hanamori, T., and D.V. Smith (1989) Gustatory innervation in the rabbit: Central distribution of sensory and motor components of the chorda tympani, glossopharyngeal, and superior laryngeal nerves. J. Comp. Neurol. 282:1-14.
Jaslove, S.W. (1992) The integrative properties of spiny distal dendrites. Neuroscience 47:495-519.
Kalil, R.E., M.W. Dubin, G. Scott, and L.A. Stark (1986) Elimination of action potentials blocks the structural development of retinogeniculate synapses. Nature 323:156-158.
King, C. Tessitore, and D.L. Hill (1993) Neuroanatomical alterations in the rat nucleus of the solitary tract following early maternal NaCl depriva- tion and subsequent NaCl repletion. J. Comp. Neurol. 333:531-542.
King, M., and R.M. Bradley (1994) Relationship between structure and function of neurons in rat rostral nucleus tractus solitarii. J. Comp. Neurol. (in press).
Lasiter, P.S., and D.L. Kachele (1988) Organization of GABA and GABA- transaminase containing neurons in the gustatory zone of the nucleus of the solitary tract. Brain Res. Bull. 21325-636.
Lasiter, P.S., D.M. Wong, and D.L. Kachele (1989) Postnatal development of the rostral solitary nucleus in rat: Dendritic morphology and mitochon- drial enzyme activity. Brain Res. Bull. 22.313-321.
Lund, J.S., and S.M. Holbach (1991) Postnatal development of thalamic recipient neurons in the monkey striate cortex: I. Comparison of spine acquisition and dendritic growth of layer 4C alpha and beta spiny stellate neurons. J. Comp. Neurol. 309:115-128.
Lund, J.S., S.M. Holbach, and W.-W. Chung (1991) Postnatal development of thalamic recipient neurons in the monkey striate cortex: 11. Influence of afferent driving on spine acquisition and dendritic growth of layer 4C spiny stellate neurons. J. Comp. Neurol. 309t129-140.
Maley, B., T. Mullett, and R. Elde (1983) The nucleus tractus solitarii of the cat: A comparison of Golgi impregnated neurons with methionine- enkephalin and substance P-immunoreactive neurons. J. Comp. Neurol. 21 7:405417.
Mistretta, C.M. (1993) Developmental remodeling of peripheral and central taste receptive fields and circuits. In J. Pearl (ed): Development, Growth and Senescence in the Chemical Senses. NIDCD Monograph. Bethesda, MD: NIH No. 93-3483, pp, 31-39.
Mistretta, C.M., and R.M. Bradley (1983) Neural basis of developing salt taste sensation: Response changes in fetal, postnatal and adult sheep. J. Comp. Neurol. 215:199-210.
Nagai, T., C.M. Mistretta, and R.M. Bradley (1988) Developmental decrease in size of peripheral receptive fields of single chorda tympani nerve fibers and relation to increasing NaCl taste sensitivity. J. Neurosci. 8.64-72.
Purves, D., and R.I. Hume (1981) The relation of postsynaptic geometry to the number of presynaptic axons that innervate autonomic ganglion cells. J. Neurosci. 1:441-452.
Rall, W., and I. Segev (1987) Functional possibilities for synapses on dendrites and dendritic spines. In G.M. Edelman, G.E. Gall, and W.M. Cowan (eds): Synaptic Function. New York: Wiley, pp. 605-636.
Shepherd, G.M., and C.A. Greer (1988) The dendritic spine: Adaptations of structure and function for different types of synaptic integration. In R.J. Lasek and M.M. Black (eds): Intrinsic Determinants of Neuronal Form and Function. New York: Alan R. Liss, pp. 245-262.
Vogt, M.B., and C.M. Mistretta (1990) Convergence in mammalian nucleus of solitary tract during development and functional differentiation of salt taste circuits. J. Neurosci. 10:3148-3157.
Whitehead, M.C. (1986) Anatomy of the gustatory system in the hamster: Synaptology of facial afferent terminals in the solitary nucleus. J. Comp. Neurol. 244.72-85.
Whitehead, M.C. (1988) Neuronal architecture of the nucleus of the solitary tract in the hamster. J. Comp. Neurol. 276t547-572.
Whitehead, M.C. (1990) Subdivisions and neuron types of the nucleus of the solitary tract that project to the parabrachial nucleus in the hamster. J. Comp. Neurol. 301556574.
Whitehead, M.C. (1993) Distribution of synapses on identified cell types in a gustatory subdivision of the nucleus of the solitary tract. J. Comp. Neurol. 332326-340,