mattawoman creek briefing booklet - sierra club
TRANSCRIPT

1
Mattawoman Creek Briefing Booklet
www.mattawomanwatershed.org
Prepared by the Mattawoman Watershed Society
I. Introduction
II. Value of Mattawoman
III. Vulnerabilities & threats
IV. A 1st step of responsible stewardship: being informed.

2
Executive Summary
•Mattawoman Creek is of unusually high value.
•“The best, most productive tributary to the Chesapeake Bay.”(MD DNR fisheries biologists, in presentation to Charles County Commissioners, June 14, 2005)
•Mattawoman is deeply embedded in the character of Charles County.
•Yet the Creek is highly threatened by overdevelopment:
•EPA lists its waters as impaired.
•Losing forest, the best land use for aquatic quality, at a rapidrate.
•Impervious cover, associated with degraded waters, is at the tipping point.
•Proposal for a major highway across its watershed—extension of Cross County Connector—would have severe direct & growth-inducing impacts.
Full study through a properly scoped Environmental Impact Statement for the CCC-extension is essential to determine the actual effects this highway could have before any permitting decision is made.

3
Mason Neck
Potomac R
iver
Waldorf
St. Charles
La Plata
Bryans Road
Mattawoman Watershed
I. Introduction
Washington
Waldorf
Chesapeake
Bay
•Watershed ~95 square miles.•Majority forested.•20-mile non-tidal stream.•7-mile freshwater tidal estuary.•About ¾ of watershed in Charles
and ¼ in Prince Georges County.•The finest Chesapeake Bay trib
from a fisheries standpoint.•Outstanding biodiversity.•Highly vulnerable to overdevelopment.
Political and satellite maps of the watershed

4
Thumbnail Tour20 miles of free-flowing stream
7 miles of tidal freshwater estuary
Approximate source Free flowing stream
Varied habitat (beaver meadow) Head of tide
Freshwater tidal estuary Smallwood State Park near mouth with Potomac River
5
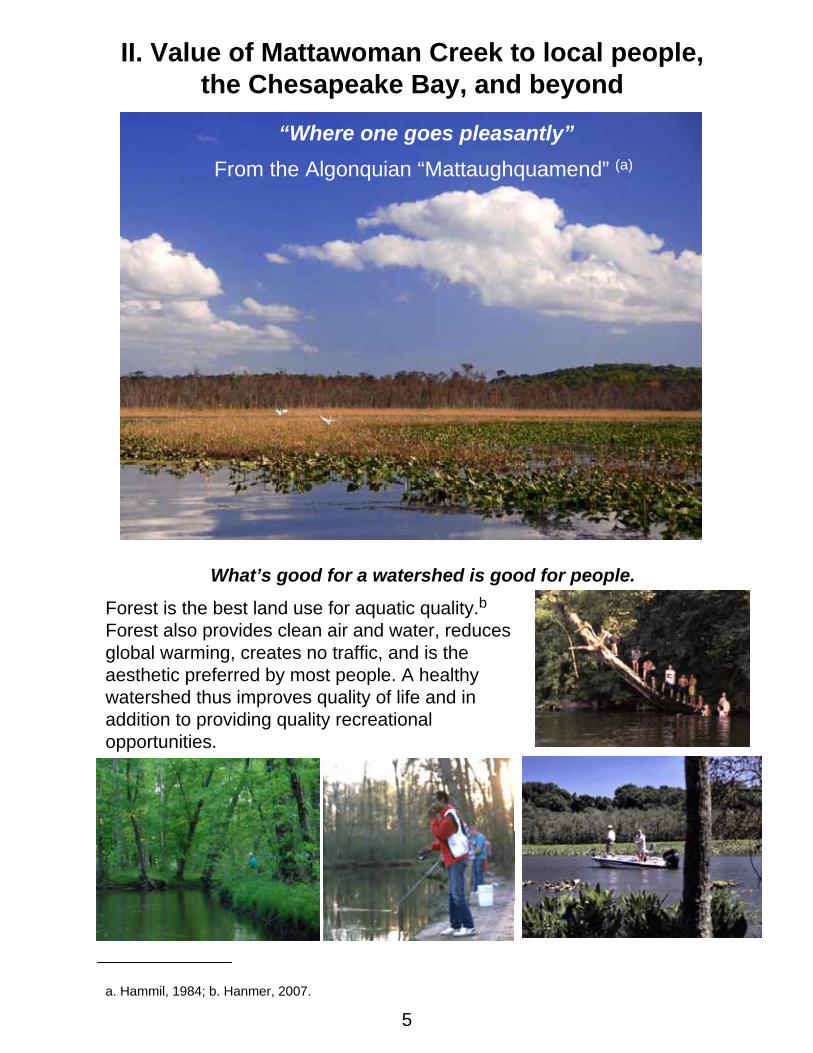
“Where one goes pleasantly”From the Algonquian “Mattaughquamend” (a)
II. Value of Mattawoman Creek to local people, the Chesapeake Bay, and beyond
What’s good for a watershed is good for people.
Forest is the best land use for aquatic quality.bForest also provides clean air and water, reduces global warming, creates no traffic, and is the aesthetic preferred by most people. A healthy watershed thus improves quality of life and in addition to providing quality recreational opportunities.
a. Hammil, 1984; b. Hanmer, 2007.

6
Mattaowoman is renowned for fish habitat
Largemouth Bass
Migratory Fish and their fry
One of the healthiestaquatic food-webs Baywidea
Regular fish assessments by Maryland’s Department of Natural Resources include seine net (shown) and trawl samples.
a. Carmichael (1992); b. Uphoff (2005).
Bass are at the top of the food chain and benefit
from Mattawoman having among the healthiest food-
webs in the Chesapeake Bay system.a
Mattawoman is the ChesapeakeBay’s most productive nursery for
migratory (or anadromous) fish,a, b
which live in the ocean but spawn infreshwater. Here anglers fish for
River Herring as they swim upstream to spawn

7
Mattawoman is the Potomac’s last remaining large tidal-freshwaterestuary beyond the urban gradient.
Port Tobacco R.
NanjemoyCrk
Wicomico R.
Zeki
ah S
wam
p
Potomac River
Mattawoman Crk
PiscatawayBroad Crk
Salinity decrease
Urban decrease
Mallows Bay
Fall Salinity a
< 0.5 ppt
0.5-5 ppt
5-18 ppt
0
10
20
30
40
Broad C
rk
Piscata
way Crk
Mattawom
an
Mallows B
ay
Fish
per
hou
r
Largemouth BassSummer surveyDNR 2004 b
Resident
0
100
200
300
Mat South Wicomico
Cat
ch p
er u
nit e
ffor
American ShadDNR 2004 b
Migratory
Mattawoman’s location lends unique qualities no longer attainable elsewhere
a. Lippson (1992); b. Uphoff (2005).

8
Largemouth Bass
Maryland Dept. Natural Resources finds:
•Twice the density of Largemouth Bass than the Potomac River.a
•Three to ten times more than Piscataway Creek (depending on year).b
“Mattawoman Creek is the most productive tributary of all the fine Potomac River branches.”c
Ken Penrod, author and professional fishing guide:
Largemouth Bass in Maryland tidal freshwaters are specifically assessed by DNR.
The Potomac’s recreational bass fishery generates many tens of millions in commerce annually in Maryland alone.d
Bass fishing in tidal Mattawoman
A weigh-in at one of over a hundred tournaments launched annually from Mattawoman’s Smallwood State Park. Tournaments attract an international clientele of anglers.
a. Fewless(1996). b. Uphoff (2005). c. Penrod d. Fedler (1989).

9
MD Department of Natural Resources, Fisheries Service finds thatMattawoman is 40 times more productive of migratory fish than other Chesapeake Bay Tributary’s studied.a
Chesapeake Bay’s most productive migratory-fish nursery
River Herring migrate from the Atlantic to spawn in free-flowing Mattawoman (picture at right) and some of its tributaries from March through May.b
Other migratory fish include: American Shad, Hickory Shad, White Perch, Yellow Perch, and Rockfish.a
American Shad caught in the Potomac River near Marshall Hall (picture at right) for propagation by the Interstate Commission on the Potomac River Basin. A Maryland moratorium on Shad fishing has been in place since 1980. Shad numbers have recently turned around in the Potomac.
Migratory Fish
0
100
200
300
Mat South Wicomico
Cat
ch p
er u
nit e
ffor
American ShadDNR 2004 c
However, Shad number just a few percent of historical levels and continue to decline on the eastern seaboard as a whole.
Mattawoman is an unusually productive nursery.
Whether using dip-net or rod & reel, catching herring is a tradition among many. Some salt or freeze their catch for later consumption.
a. Carmichael (1992). b. O’Dell (1975); Long (1999). c. Uphoff (2005).

10
“Mattawoman is the best, most productive tributary in the Bay.”a
“Mattawoman represents as near to ideal conditions as can be
found in the northern Chesapeake Bay, perhaps unattainable in
the other systems, and should be protected from
overdevelopment.”b
DNR Fisheries Service concludes:
a. Uphoff (2005). b. Carmichael (1992).

11
Mattawoman is noted for high biodiversity
Exceptional tidal freshwater marshes.
Wild Rice
One of only three MD sites with wild populations of the American Lotus.
55 fish species.
Four freshwater mussel species, incl. state-rare Alewife Floater
Botanically rich.
(sta
tera
re)
Camphor Weed
Possum Haw
(sta
te ra
re)
Among the richest concentrations of reptiles & amphibians in MD.Spotted Salamander larva
American Toad
MD’s largest breeding Wood Duck population
Great Egret
Fish support unusually large numbers of egrets.

12
Of Maryland’s 138 comparably sized watersheds, only 12, including Mattawoman, were found to be both of very high quality (Selected Cat. 3) and at very high risk (Priority Cat. 1).
•Clean Water Action Plan, a federal-state-local assessment (a)
III. Vulnerabilities
“The ecological integrity of the Mattawoman is at risk from current and future development pressures within the watershed.”
•Army Corps Mattawoman Watershed Management Plan (b)
•EPA lists Mattawoman as impaired under Section 303(d) of the Clean Water Act (c)
“These watersheds may deserve special attention in order to reverse or slow degradation before the pristine resources are lost.”
In the case of Mattawoman, increased urbanization and loss of forest are the primary risk factors.
(a) Clean Water Action Plan (1998). (b) Army Corps (2003). (c) EPA (2004).
•Impacted living resourcesSince 2002
Since 1996
•High suspended sediment-suffocates living resources-blocks visibility of predators
•Excessive nutrients-clouds water with algae growth-lowers oxygen via algal decomposition
Algae spurred by excess nutrients cloud water, blocking sunlight needed by submerged aquatic vegetation, an important element of quality fish habitat. Decaying algae depletes oxygen.
Example vulnerability: Yellow Perch, a popular fish with anglers. Unlike Mattawoman, the Severn no longer supports a resident population, a consequence of watershed urbanization.
Fish eggs and larvae are vulnerable to sediment.
Yellow Perch eggs near Mattawoman’s head of tide 3/07

13
Washington DC
Charles County’s Development District
61 square miles
83 square miles
Vulnerability to urbanization stems from Charles County’s inappropriately large Development District
•35% larger than Washington DC—promotes sprawl over an exceptionally large area.
•Covers much of the Mattawoman watershed.
•Maryland Department of Natural Resources’ comments on 1996 comprehensive plan:
“Protection of this watershed appears to be in direct conflict with the location and size of the development district.”
Mattawoman watershed
Development district

14
Urbanized landscapes are characterized by impervious cover, which correlates with aquatic degradation
Rooftops, sidewalks, roads, and parking lots are impervious to water infiltration.
Pomonkey Creek tributary
MD DNR data for the Combined Biotic Index (CBI) for aquatic integrity.(a)
As measured by a loss of sensitive aquatic species, a high-quality watershed cannot survive increasing impervious cover. The combined biotic index (CBI) is based on the integrity of both fish and benthic macroinvertabrate (e.g. insect larvae) communities.
In Mattawoman, problems are magnified because it tends to run dry•Porous coastal plain soils are unforgiving of low groundwater•Impervious cover exacerbates stress from natural tendency for low flow
4-25-98 8-9-98
10% impervious fraction corresponds to about one residence per acre. (Center for Watershed Protection)
(a). Boward (1999).

15
Mattawoman’s fate is tied to the amount and distribution of forest vs impervious cover
Mattawoman watershed (light green outline) has benefited from significant forest cover. However, forest-cover estimates and projections show an accelerating decline, while impervious cover is projected to reach crisis proportions.
a. State Office of Planning; b. Chesapeake Bay Program, Know your watershed website.c. Army Corps of Engineers Mattawoman Watershed Management Plan (2003); d. Center for Watershed Protection.
Non-functioning d
Significant impacts d
Severe impacts c
Impervious cover for various management scenarios Best case scenario projects impervious fraction associated with severe impacts. Note that a 10% cover, associated with significant impacts, could be passed as early as 2010.
(a)
(b)
(c)
Decreasing Forest Increasing Impervious Cover

16
Forest Value vs Impervious Cover“Forests are the best land cover for improving water quality in the Chesapeake Bay.”(a)
Towson State GIS web site1990
Forest:
a. Hanmer (2007).
•Improves in-stream habitat.•Permits infiltration—provides baseflow to stream.•Growing forests absorb the greenhouse gas CO2
•Cools streams.•Slows storm flow—less erosion.•Provides proper nutrient mix.•Moderates water quantity reaching streams.
•prevents infiltration, diminishes water table—streams go dry•delivers excess nutrients leading to algal blooms•excess sedimentation-- fish can’t see; plants can’t grow•increased water temperature•heavy metals…
•funnels water in erosive torrents.•increases flooding.•alters water chemistry.•reduces oxygen
Impervious cover and associated urbanization alters hydrology & water chemistry to the detriment of living resources (loss of species, smaller populations).
Impervious cover seals soils
Urbanization:
The Chesapeake Bay’s web of life is adapted to the ecological services provided by a forested landscape—beginning with the provision of important foodstuffs to the smallest streams.

17
“The pollution increases associated with land development—such as converting farms and forests to urban and suburban developments—have surpassed the gains achieved from improved landscape design and stormwater management practices. Pollution from urban and suburban lands is now the only pollution sector in the Bay watershed that is still growing. ” (a)
Science-based Reality-checks:
Current Best Management Practices help, BUT
fall short of protecting living resources
2007
“Loads are expected to increase by over 50% in the next 20 years. Even with aggressive regulatory enforcement, there is still a significant increase in the pollutants.”
“During high flow events, there will be large sediment loadings associated with runoff, erosion and severe channel change. The severe alterations in hydrology will dramatically increase the rate of sediment input during high flow events. Much of the sediment will be associated with bank erosion, down-cutting, and other examples of stream instability.”
Army Corps Mattawoman Watershed Management Plan(b)
EPA Inspector General’s report
(a) Chesapeake Bay Program (2007); (b) Army Corps (2003).
Chesapeake Bay Program report
The brown bars on this graph(a) show that growing pollution from urbanization is defeating Bay restoration goals so that, as the report concludes, “progress is negative.”

18(a) Chesapeake Bay Foundation, 2006.
New highways are detrimental to watershed health
Direct impacts are magnified many fold by highway-induced growth
Example: Intercounty Connector (ICC) (a)
45 acres direct wetland loss 200 additional acres 795 acres direct forest loss 3500 additional acres
PlusIncreased impervious surface from the growth—tipping Mattawoman over the edge
spurred growth
Mattawoman is threatened by two major highway proposals that would spur very significant growth:
•Connector extension (CCC-ex) •Western Waldorf Bypass Cross County
•Increases vehicle miles traveled and global warming•Runoff—thermal pollution•Wildlife: road kill, impeded migration, habitat loss.•Forest loss & fragmentation•Direct impacts to streams (e.g. bridges, runnoff)•Chemicals—deicing, herbicides•Vehicle pollutants: oil, antifreeze, tire & brake-lining debris •Floodplain loss.
•Nitrogen generation & deposition•Wetland loss.
A highway’s direct impacts
•The Western Waldorf Bypass would fall within the mapped study area. It is endorsed by Charles Co. officials, but opposed by Prince Georges Co. and two Citizens Advisory Committees appointed by each county. Previously, the EPA and Army Corps opposed it on environmental grounds. The Eastern Waldorf Bypass has never been seriously considered. Note the viable Alternative 3, a full upgrade of Rte. 301 which passes over cross roads and impacts businesses minimally. This alternative also has much less impact on Mattawoman.
•The CCC-ex would be funded only by Charles Co. Unlike the Bypass, authorities are trying to skirt an Environmental Impact Statement, even though an EIS is common for projects of this magnitude and impacts to Mattawoman from induced growth would be severe. Again, a viable existing alternative is apparent via newly widened Middletown Road and Rte. 228.

19
Charles County’s Proposed Cross County Connector Extension
Rt. 228
Rt. 301
Rt. 210
CCC-ex
Bryans Road
WaldorfMid
dlet
wn
Rd
Rt. 210R
t. 22
7
Road
Billingsley
BryansRoad
Mat
taw
oman
To Rt. 301
Length ~6.5 miles
Brookwood Estates
Kingsview
Foxhall
Cree
k
Highgrove
Eutaw Forest
Road
Mid
dlet
own
The proposed Cross County Connector extension
CCC-extension
The top two maps make plain that the CCC-ex, if built, would promote growth in forested and less populated areas.
The top map shows the CCC and proposed CCC-ex at the boundary of a dense road network to the north. The CCC-ex would promote enlarging the network to the south.
The 2nd map shows forested areas around the CCC-ex. Note the gray urbanization sprawling along recently widened Rte. 228, which would similarly expand from the CCC-ex.
Bottom map shows proposed route. The Kingsview and Highgrovesubdivisions were permitted in the late 90’s only after Right of Way was provided by the developer for a “Western Connector” (now the CCC-ex). Neighborhoods would experience division, noise, and unhealthy particulate air pollution.

20
500 m
500 m
Potential Health Effects: particulates
Particulate matter
Our area does not meet EPA standards for 2.5 micron particulate matter.
Vehicle soot aggravates asthma.(b)
“residential distance [within 500 m] from a freeway is associatedwith significant deficits in 8-year respiratory growth, which result in important deficits in lung function at age 18 years.” (a)
An EIS for the CCC-ex should examine these potential health issues for people near the proposed right of way.
(a) Gauderman (2007) (b) Thurston (2006).
The CCC-ex would split communities and runs in such close proximity to homes that some would lose yard space. Note that most homes are within the 500 m distance identified with deficient respiratory development in children. (a)
Ozone:•Is a respiratory irritant. •Aggravates asthma.•Is a component of smog.
Washington Post Metro May 7, 2007
Ozone
KINGSVIEW
HIGHGROVE
Ozone is generated by photochemical reaction with vehicle exhaust. Charles Co. is in a non-compliance area.

21
New highways spur additional growth
‘New highways open up land for development by increasing the accessibility of locations that once were remote or difficult to reach.’ *
Excerpts from an EPA report: †
† http://www.epa.gov/livablecommunities/pdf/built_chapter2.pdf*World Bank. Sustainable Transport: Priorities for Policy Reform. Washington, D.C.: 1996, p. 59.** Ibid, p. 61
CCC-ex alternative using the present 4-lane highways, Middletown Road and Rte. 228.
Bryans Road
Satellite map showing sprawl following Rte. 228.
Wooded areas of the water shed that would be opened by the CCC-ex.
In addition, the CCC-ex would enable massive new growth in Bryans Road, presently a one stoplight town, at densities proposed to exceed those in Waldorf.
The CCC-ex would also clearly apply pressure to open the deferred development district (grey area in map at right). In order to save Mattawoman, we need to reconsider the size of a development district larger than the Washington DC.
Waldorf
Rt. 228
Rt. 301
Rt. 210
CCC-ex
Bryans Road
Waldorf
…transportation infrastructure enables more land to be available for development. The availability of more land allows people to use more transportation and land resources without an increase in transport cost.
…’where transport prices do not reflect full social and environmental costs, the land market can generate inefficient land-use patterns.’ **
CCC-ex

22
New highways lead to “induced traffic” that can increasecongestion
•Induced traffic saturates new capacity, often within 5 yrs. •Spurred growth causes even more traffic, increasing use of connecting roads.
““The peerThe peer--reviewed results are statistically robust reviewed results are statistically robust
and quite clear: induced travel can occur and can and quite clear: induced travel can occur and can
absorb all new capacity.absorb all new capacity.””
•EPA’s summary of a seminal transportation study: (a)
•On induced traffic on connecting roads:
“…adding lane miles in a given county increases
Vehicle Miles Traveled throughout the wider
region.”
“A decision to use the new road probably means a decision to use a road connecting to it.”
•In other words, as EPA states:
(a) EPA, 2001; (b) Chesapeake Bay Foundation, 2006.
Official studies have found that Maryland’s proposed ICC would increase driving on local roads and the beltway. (b)
•Implies traffic on Billingsley would likely increase!
•It’s safety issues would have to be addressed anyway, and in fact should be addressed now.
Example: The Inter-county Connector
DC
ICC
CCC-ex
It is reasonable to include a full traffic study in an EIS for the CCC extension, including effects on local roads and Route 210 through Prince Georges County.

23
Mattawoman exemplifies how watershed loss to sprawl leads to increased emission of global warming gases
Mattawoman Creek exemplifies the threats urbanization poses to our living resources. Despite its recognized worth, a severe degradation is projected because continuing sprawl development may cover over 20% of the watershed with impervious cover. Driving this growth are proposed new highways, the Cross County Connector extension (CCC-ex) and the Western Waldorf Bypass, that would open vast tracts to new growth.
Mattawoman’s value is tied to its forests, the best land use for aquatic living resources. Protecting forest against sprawl not only protects aquatic living resources, but also significantly reduces production of carbon dioxide (CO2), the most important human-generated greenhouse gas:
•Wood in mid-Atlantic forests secure ~300 tons of CO2equivalent per acre. Much of this returned to the atmosphere when forests are cleared.
•Sub-climax forests such as Maryland’s convert ~3 tons of CO2 per acre per year to wood. This “sequestration” is lost when forest is cleared.
•Today’s sprawl is characterized by houses much larger than in the past, which generate disproportionately more CO2.
•Sprawl engenders long commutes. An average commute from the CCC-ex to DC would produce ~6 tons of CO2 per year.
In the 90’s, population in the Bay watershed increased 5% compared to 41% for impervious surface, a mismatch defining sprawl. By 2030, if the population projected to flood Charles County’s development district (larger than the District of Columbia) instead lived more compactly and used mass transit, about ~0.4 million tons of excess CO2 per year could be averted, or 13% of the total now emitted.
Protecting a watershed’s forests against sprawl not only protects living resources, but also reduces production of greenhouse gases.
Washington
Waldorf
Heating, air conditioning, and lighting the large houses of modern sprawl generate more CO2 than smaller houses. House size has increased more than 50% since the 1970’s. Electricity accounts for about 38% of Maryland’s CO2 emissions. (a)
Transportation accounts for ~32% of CO2emissions in MD.(a) New exurban highways promote accelerated increases in CO2 emission.(a) Maryland Climate Action Plan (2007).

24
IV. Informed stewardship:Why an EIS is needed for the proposed CCC extension
•Major wetland impacts should trigger an EIS.•Over 7.5 acres, a significant fraction of the annual loss in theentire state.•Does not include isolated wetlands that would be filled due to alegal technicality. Isolated wetlands also protect Mattawoman and should be of concern to County stewardship.
•Induced growth—secondary and cumulative impacts•Probable upzoning of 15,000-acre deferred Development District.•Town of Bryans Road: densities higher than in Waldorf•Known to multiply wetland and forest losses many fold. How much in this case?
•Induced traffic•No comprehensive traffic study. Safety issues on local roads.
•Impervious surface•How much would be induced?
•Health and safety issues•Especially in Kingsview, Highgrove, Foxhall Est., Brookwood Estates.
•Increased emission of global warming gases:•increased Vehicle Miles Driven•loss of forest•energy usage of sprawl development
•Air and water pollution
•Mattawoman is too good to lose because of poorly informed decisions.

25
Army Corps, 2003. Mattawoman Watershed Management Plan, U.S. Army Corps of Engineers, Baltimore District.
Boward, Daniel et al., 1999. From the Mountains to the Sea: the State of Maryland’s Freshwater Streams, Maryland Dept. of Natural Resources and EPA. Report EPA/903/R-99/023.
Carmichael, J. et al.,1992. Fish Sampling in Eight Chesapeake Bay Tributaries, Maryland DNR, Chesapeake Bay Research and Monitoring Div., Report CBRM-HI-92-2.
Chesapeake Bay Program, 2007. Chesapeake Bay 2006 Health & Restoration Assessment, Part Two: Restoration Efforts, Report identifiers CBP/TRS 284/07; EPA 093R-07002. (www.chesapeakebay.net/assess).
Chesapeake Bay Foundation, 2006. “The ICC,” March 2006, quotes from the Environmental Impact Statement for the Inter-county Connector and other studies. See also /www.taxpayer.net/road2ruin/roads/icc.htm that cites 1997 State & Federal Highway Administration studies showing the ICC increases congestion on north-south routes.
Clean Water Action Plan, 1998. www.dnr.state.md.us/cwap/EXECSUM.htm
EPA, 2001. Our Built and Natural Environments: A Technical Review of the Interactions Between Land Use, Transportation, and Environmental Quality, Report 231-R-01-002, summarizing a Hansen et al. Transportation Research, 31, 213. (see www.epa.gov/livablecommunities/pdf/built_chapter3.pdf)
EPA, 2004. “Total Maximum Daily Loads of Nitrogen and Phosphorus for Mattawoman Creek,“ Maryland Department of Environment, submitted to U.S. EPA, January 2004.
Fewless, Leon, 1996. Statewide Fisheries Survey and Management Study V: Investigations of largemouth bass populations inhabiting Maryland's tidal waters. Maryland DNR, Freshwater Fisheries Division, Report F-48-R.
Fedler, Anthony, 1989. An examination of Maryland angler characteristics, behaviors, and economic values, Univ. of Maryland. Correcting for inflation, prorating for the Potomac’s relative bass population, and accounting for growth in the fishery, a value of over $60 million to Maryland can be derived for the Potomac’s Largemouth Bass fishery.
Gauderman, W.J et al., 2007. Effect of exposure to traffic on lung development from10 to 18 years of age: a cohort study, Lancet 368, 1. Hammil, Kenny, 1984. The Place Names of Maryland, Maryland Historical Soc., Baltimore.
Hanmer, Rebecca, Jan. 2007. Money doesn’t grow on trees, or does it? Written while director, EPA’s Chesapeake Bay Program Office.
Lippson, Alice J., et al., 1979. Environmental Atlas of the Potomac Estuary, Environmental Center, Martin Marietta Corp., prepared for Maryland Dept. Nat. Res.
Long, J.P., 2000. Icthyoplankton sampling of anadromous fish usage in Mattawoman Creek, one of its unnamed tributaries draining Chapman Forest, and Reeder Run: Spring 1999, filed under Maryland DNR under permit #SCP-99042.
Maryland Interim Climate Action Plan (2007). Maryland Commission on Climate Change.
O’Dell, J., et al., 1975. Survey of anadromous fihs spawning areas-Completion Report, Fisheries Administration, Maryland DNR, Annapolis.
Penrod, Ken. http://www.penrodsguides.com/articles/mattawomancreek.htm
Thurston, G., 2006. A Study Links Trucks’ Exhaust to Bronx Schoolchildren’s Asthma, reported by M. Fernandez, N.Y. Times, Oct. 29, 2006, summarizing a 5-year study (G. Thurston, Principle Investigator, NYU) linking diesel exhaust with asthma in school children.
Uphoff, J., 2005. What could happen to tidal fish habitat and fisheries in Mattawoman? Lessons learned in Severn River and other developed Bay tributaries, Powerpoint presentation to Charles County Commissioners, June 14, 2005.
References

When printing, check the box in the main print dialog window “Scale to fit paper.”
This reduces slightly and makes the material look much better on the page!
Note: set up for double sided printing. Put page numbers in center. Wider margin to left on odd numbered pages, to right on even numbered pages.