matsuoka 1999 rockfall activity from an alpine cliff during thawing periods
TRANSCRIPT
Ž .Geomorphology 28 1999 309–328
Rockfall activity from an alpine cliff during thawing periods
Norikazu Matsuoka a,), Hiroaki Sakai b,1
a Institute of Geoscience, UniÕersity of Tsukuba, Ibaraki 305-8571, Japanb Graduate School of EnÕironmental Earth Science, Hokkaido UniÕersity, Sapporo 060-0810, Japan
Received 14 September 1998; received in revised form 1 December 1998; accepted 3 December 1998
Abstract
Rockfall activity during thawing periods was investigated by collecting rockfall debris fallen on the snow-covered talusslope in a cirque in the Japanese Alps. Near-surface rock temperature was also monitored on the cirque wall. Maximumrockfall activity occurs on average about 10 days after the meltout of the cirque wall. The intensive activity is rarelyassociated with precipitation events or diurnal frost cycles on the rockface. A thermal conduction model suggests thatrockfalls at this site occur most frequently when the seasonal thawing front penetrates to a depth of about 1 m in thebedrock. While the freeze–thaw penetration controls the maximum dimensions of detachable rock mass, joint spacing on therockface affects the size distribution of rockfall debris. Boulder falls resulting from seasonal frost weathering are consideredto be the most important process responsible for the contemporary modification of the cirque wall. The rockfall volumeduring a thawing period is usually 1–3 m3, which is equivalent to the rate of cirque wall retreat of the order of 0.01 mmyeary1. However, big boulder falls that occur once per decade can increase the retreat rate significantly. q 1999 ElsevierScience B.V. All rights reserved.
Keywords: rockfalls; frost action; physical weathering; joints; mountains
1. Introduction
Rockfalls are one of the major geomorphic pro-Žcesses acting on steep mountain slopes e.g., Whal-
.ley, 1984 . The role of rockfalls in the total denuda-tion of mountain slopes is significant in cold moun-tains where vegetation is sparse and frost action is
Ž .active e.g., Rapp, 1960 . Previous studies have ad-Ždressed the timing and frequency of rockfalls e.g.,
.Luckman, 1976; Gardner, 1980 , the origin and ki-
) Corresponding author. Fax: q81-298-51-9764; E-mail:[email protected]
1 Current address: Muroran Fire Department, Muroran 050-0082, Japan.
Žnetics of rockfalls e.g., Statham, 1976; Fahey and.Lefebure, 1988 , and the rates of cliff retreat by
Ž .rockfalls e.g., Rapp, 1960; Barsch, 1977 . Recentadvances have been achieved by both physical andhistorical approaches to rockfall studies. Automatic
Žmeasurements of rock temperature e.g., Coutard and.Francou, 1989; Gardner, 1992 and joint movements
Ž .e.g., Matsuoka et al., 1997; Kostak et al., 1998ˇ ´have provided detailed information on rockwall in-stability, while lichenometry and other dating meth-ods have allowed evaluation of long-term changes in
Žrockfall activity e.g., Luckman and Fiske, 1995;.McCaroll et al., 1998 .
Several weathering processes may contribute torockfall generation in cold mountains. A number of
0169-555Xr99r$ - see front matter q 1999 Elsevier Science B.V. All rights reserved.Ž .PII: S0169-555X 98 00116-0

( )N. Matsuoka, H. SakairGeomorphology 28 1999 309–328310
studies suggest that many rockfalls originate fromthawing of the bedrock fractured during diurnal
Žandror seasonal freezing Rapp, 1960; Church et al.,1979; Douglas, 1980; Fahey and Lefebure, 1988;
.Matsuoka, 1991 , while others highlight rockwallinstability resulting from thermal stress in polar desert
Ž .areas Hall, 1997 or paraglacial unloading in re-Žcently deglaciated valleys Luckman and Fiske,
.1997 . Despite such numerous studies, the paucity ofconcurrent observations of rockfall activity and asso-ciated climate variables has long prevented the un-derstanding of the connection between climate androckfalls. The unsolved problems include, e.g., thetimelag between freeze–thaw cycles on bedrock and
Ž .major rockfall events Rapp, 1960; Lautridou, 1988 .This paper describes observations of rockfall ac-
tivity in Hosozawa Cirque in the Japanese Alps,from 1984 to 1998. The period includes intensiveobservations of both rockfalls and rock temperatures
Ž .for 3 years 1993–1995 . Rock debris transportedonto snow surfaces was measured during seasonalthawing periods. The temporal variation in rockfall
volume was then compared with records of rockwalltemperature. Thaw penetration depths were calcu-
Žlated using a thermal conduction model Aldrich,.1956 and correlated with rockfall generation. Based
on these analyses, discussion is focused on the mech-anism of rockfall generation and controls of thedimension of rockfall debris.
2. The study area
Hosozawa Cirque is a relict glacial landform lo-cated at the head of an U-shaped valley descending
Ž .eastward from Mt. Ainodake 3189 m ASL in theŽAkaishi Range, southern Japanese Alps Figs. 1 and
.2 . The cirque is bounded by a well-defined moraineŽridge or, possibly, by the outermost ridge of a relict
.rock glacier at 2850 m ASL, which probably formedat the end of the last glacial period. At the maximumglacial limit, ice extended to the lower end of theU-shaped valley at 2300 m ASL. Deglaciation wasfollowed by rockfalls and rockslides that have devel-oped a number of screes under the cirque wall.
Ž .Fig. 1. Geomorphological map of Hosozawa Cirque, indicating the monitoring sites for rock temperature H1 to H3 . Contour interval 5 m.

( )N. Matsuoka, H. SakairGeomorphology 28 1999 309–328 311
Ž .Fig. 2. Hosozawa Cirque during a thawing period 10 June 1988 , areal view from the southeast. While large part of the rockwall isŽ .exposed, the whole talus slope still lies under the snow. No rockfall debris can move beyond the terminal ridge TM . Rock temperature was
monitored at H1, H2, H3 and AR sites. The location of AR site is not shown on the photograph.
Although the cirque wall seems to be stable, rock-falls of a variety of scales still occur during thawingperiods. At present, snow covers a large part of thecirque in winter, but it disappears completely in latesummer.
Mt. Ainodake is underlain by Cretaceous sedi-mentary rocks. The rockwall of Hosozawa Cirque isabout 200 m high and composed of sandstone andshale. The intact rock samples have porosities of0.3–3.6% and tensile strengths of 10–17 MPa, indi-cating high compaction and hardness. However, therockwall was highly fractured during the Quaternarycrustal movements that have uplifted the mountainrange at a rate of 100 mm yeary1. The bedrockfissures, occasional earthquakes and heavy rainscombine to result in numerous large rockslides in theAkaishi Range.
The entire cirque is located above timberlinewhich is about 2650 m ASL. The cirque wall isvegetation-free except for creeping alpine pinesŽ .Pinus pumila growing on ledges. The mean annual
Ž .air temperature 1994–1998 is about y28C at 3070
m ASL. Rainfalls occur most frequently between lateJune and early October, including occasional heavyrains brought by typhoons and the polar front. Dur-ing the two freeze–thaw periods which precede andfollow this rainy summer, the passage of low pres-sures brings periodic but less frequent precipitation.
Snow conditions in the Mt. Ainodake area aretypical of the Pacific side of the Japanese Island.Snow accumulation is rare in early winter, increasesfrom January and reaches a maximum in March toApril. The snow fields usually start melting in lateApril when the mean daily air temperature risesabove 08C. Such a seasonal variation favours deepfrost penetration in winter and delayed thaw penetra-tion in summer, although rock temperature data sug-gest that a large part of the rockwalls around Mt.
Ž .Ainodake lack permafrost Matsuoka, 1990, 1994 .The cirque wall is currently subject to modifica-
tion due mainly to rockfalls which, in fact, happenedmany times during our fieldwork. Granular weather-
Žing may also contribute to the cirque wall retreat cf..Hinchliffe et al., 1998 , and part of its products is

( )N. Matsuoka, H. SakairGeomorphology 28 1999 309–328312
transported to the talus slope by debris flows insummer, as inferred from the presence of small
Ž .gullies and debris flow deposits Fig. 1 . During theobservation period, we have never witnessed snowavalanches that dislodge rock debris directly fromthe cirque wall. This is probably because of insuffi-cient snow cover on the cirque wall.
3. Field methodology
3.1. Rockfall actiÕity
Several methods have been used to evaluate rock-fall activity in the previous studies. The most com-mon one is audial observations of the timing and
Žfrequency of rockfall generation Gardner, 1970,˚1980; Luckman, 1976; Church et al., 1979; Aker-
.man, 1984 . Debris detachment from a rockwall hasbeen investigated by a comparison of photographs
Žtaken at certain time intervals Suwa and Okuda,.1988; Matsuoka, 1990 or monitoring kinematics of
Ž .a toppling block Glawe et al., 1993 . Rockfall de-Žbris has been collected using artificial traps Church
et al., 1979; Douglas, 1980; Fahey and Lefebure,.1988 or natural traps, such as large flat-top boulders
Ž .Luckman, 1988 and snow fields below rockwallsŽ .Rapp, 1960; Gray, 1973; Ono and Watanabe, 1986 .The artificial traps and flat-top boulders may fail tocollect infrequent large boulder falls which are volu-metrically most important. In contrast, snow fieldspermit collection of all debris released from therockwall, though observations are restricted tosnow-melting periods. The topography of HosozawaCirque is suitable for a natural trap, because norockfall debris can move beyond the terminal ridgeŽ .Fig. 2 .
Rockfalls in Hosozawa Cirque rarely take placebefore May because of the snow cover protecting thecirque wall and start with the exposure of the rock-face. Rock debris released during thawing periodswas measured from early May to early July, duringwhich time the rockwall was being exposed whilesnow still covered both steep debris slopes and talus
Ž .slopes see Fig. 1 . After this period, secondaryrockfalls released from the exposed debris slopesmade the identification of the primary rockfall debrisderived from the bedrock difficult. Observations alsoincluded the area of exposed rockwall and the loca-
tion, lithology and dimensions of rockfall debris. Theexposed area was drawn on a map of 1:5000 scale bysketches and photographs taken from several direc-tions. The ratio of exposed total area of the rockwallwas then calculated. During the 1994 thawing pe-riod, snow ablation on the cirque floor was measuredfrom 21 May to 15 June at intervals of 2–4 daysusing 32 snow sticks. Ablation rate was nearly con-stant over this period at the average rate of 7.2 cmdayy1.
Ž .Lithology and three dimensions, long A , inter-Ž . Ž .mediate B and short C axis diameters, were
determined for all clasts with the A-axis diameter 10cm or larger lying on the snow. The path of the rockdelivery, if it remained on the snow, was also tracedon the map. Such a trail clearly indicates new bounc-ing of the clasts, although the rapid snow ablationcan erase the trails of small clasts within a few days.Clasts smaller than 10 cm in the A-axis diameterwere only counted. A number of fragments smallerthan 5 cm in the A-axis diameter seem to have beenmissed, but these fragments are assumed to be volu-metrically insignificant. Marking the measured clastsavoided double measurement. All of these observa-tions were made at intervals of 1 day to 2 weeksduring the thawing periods from 1993 to 1995. Di-
Žmensions of all rockfall debris )10 cm in the.A-axis diameter were also measured once during
late thawing periods in 1984, 1987, 1992, 1996 and1998, and only the 30 largest clasts were examinedonce in 1988, 1990 and 1991. No large earthquakesnor heavy rainfalls occurred during the observationperiods.
Some rockfalls can be generated also by diurnalfreeze–thaw action in early winter and the releasedrock debris may fall on a veneer of snow cover. Thisindicates that the rock debris devoid of a trail onsnow possibly includes clasts already fallen in earlywinter and ablating out of the snow in thawingperiods. However, most of the trail-free clasts sam-pled in 1993–1995 were small enough to be ignoredin terms of volume. This is partly because diurnalfreeze–thaw action operates mainly in the outermost20 cm of rock and rarely produces cobbles or boul-
Ž .ders Matsuoka, 1994 . In addition, a large part ofthe old rockfall debris is unlikely to be exposed onthe snow surface until the end of thawing, thus,rarely being counted as new rockfall debris.
( )N. Matsuoka, H. SakairGeomorphology 28 1999 309–328 313
Dimensions of rock debris were translated intovolumes. Since the simple product of the three di-mensions seriously overestimates the real volumes of
Ža clast, a correction factor is necessary e.g., Luck-.man, 1988 . For this purpose, 100 clasts with the
A-axis diameter of 10–50 cm were collected at ran-dom from the talus slope. Three dimensions of theseclasts were measured. The real volume was deter-mined from a rise in water level, when a clast wassubmerged in a water-filled box. The real volume Vr
was then approximated by the formula:
V skABC , 1Ž .r
where A, B and C are, respectively, the A-, B- andC-axes diameter, and k is the correction factor. Themean correction factor was calculated to be 0.45with the correlation coefficient 0.93 for sandstoneand 0.48 with the correlation coefficient 0.92 forshale. The obtained k values are close to the mini-
Žmum in the previously suggested range 0.42–0.76.by Luckman, 1988 . The small values probably re-
flect the tapering shape of clasts derived from theŽ .sedimentary rocks. Eq. 1 was applied to estimate
the volume of rock debris with the A-axis diameterof 10 cm or greater.
The total volume of debris smaller than 10 cm inthe A-axis diameter was calculated by multiplyingtheir number by a volume coefficient. Fifty rockfragments with the A-axis diameter smaller than 10cm were collected at random from the talus slope
Ž .and their volume was calculated by Eq. 1 . Themean volume was then computed to be 53 cm3 andthis value was taken as the volume coefficient.
Ž .Following terminology by Rapp 1960 , rockfallswere classified in terms of dimensions of individual
Ž .events into three grades: pebble falls B-20 cm ,Ž .small boulder falls 20FB-50 cm and big boul-
Ž .der falls BG50 cm .
3.2. Rock joint spacing
One of the significant parameters affecting thesize of rockfall debris is joint spacing, because arock block enclosed by intercrossing joints tends tobe detached from the rockwall. A window surveyŽ .e.g., Hencher, 1987 was employed to determine
Ž .joint spacing. The two dimensions, the long L andŽ .short S axis diameters, were measured for all blocks
enclosed by joint sets within a square of 5 m=1 mon a rockface. Blocks crossing the margin, but morethan half of the area included within the observationwindow, were measured. The lithology of each blockwas also investigated. In total, 1034 blocks weremeasured from 27 windows randomly spaced overthe cirque wall.
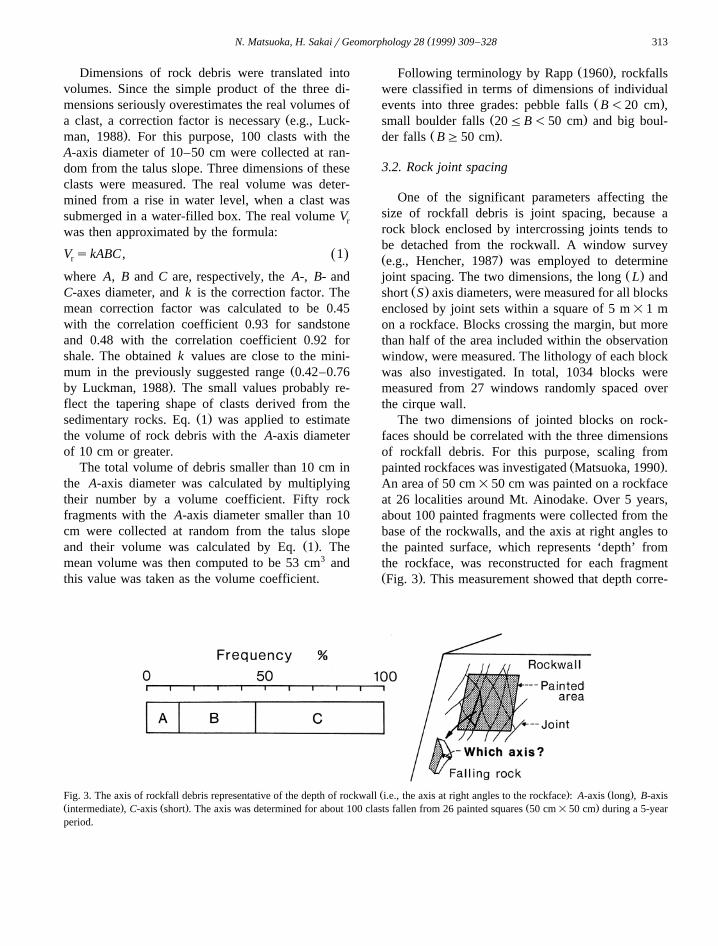
The two dimensions of jointed blocks on rock-faces should be correlated with the three dimensionsof rockfall debris. For this purpose, scaling from
Ž .painted rockfaces was investigated Matsuoka, 1990 .An area of 50 cm=50 cm was painted on a rockfaceat 26 localities around Mt. Ainodake. Over 5 years,about 100 painted fragments were collected from thebase of the rockwalls, and the axis at right angles tothe painted surface, which represents ‘depth’ fromthe rockface, was reconstructed for each fragmentŽ .Fig. 3 . This measurement showed that depth corre-
Ž . Ž .Fig. 3. The axis of rockfall debris representative of the depth of rockwall i.e., the axis at right angles to the rockface : A-axis long , B-axisŽ . Ž . Ž .intermediate , C-axis short . The axis was determined for about 100 clasts fallen from 26 painted squares 50 cm=50 cm during a 5-yearperiod.
( )N. Matsuoka, H. SakairGeomorphology 28 1999 309–328314
sponds to the C-axis diameter by 54% and theB-axis diameter by 32% of the fragments, indicatingthat depth is mainly reflected in the C- or B-axis ofthe rockfall debris.
3.3. Rock temperature
ŽRock temperature was monitored at three H1, H2. Ž .and H3 sites on the cirque wall and at one AR site
Žon a large rockslide scar outside the cirque Figs. 1.and 2 . Thermistor probes were installed to record
temperatures at the surface, 10 and 40 cm depth.Only surface temperature was monitored at H2 site.Data loggers read temperatures with a resolution of0.18C and an error of no more than 0.28C. Data were
Ž . Ž .recorded at hourly H1 and AR sites , 2-h H2 siteŽ .or 3-h H3 site intervals.
The three measurement sites on the cirque wallface northeast to east but are different in elevationand micro-environments. H1 and H2 sites are locatedon the upper rockwall at elevations of 3130 m and3110 m, respectively. H3 site lies on the lowerrockwall at an elevation of 2950 m. Both H1 and H3sites are continuously covered with snow duringseveral months in winter, while H2 site is snow-freeduring winter because of its crest location and over-
Žhanging cliff. The southeast-facing AR site 2910 m.ASL is located 700 m south of the cirque wall. This
site represents the southeast-facing portion of thecirque wall because of the similar elevation andlithology.
3.4. Weather conditions
In addition to bedrock thermal regimes, moisturemay also play a vital role in rockfall activity. Be-cause of the difficulty in direct monitoring, rockmoisture was simply estimated from weather condi-tions. Visual observations indicated the occurrenceof snow or rainfall during the intermittent stay in thestudy area. Weather conditions during other observa-tion periods were evaluated from meteorological data
Ž .at the Mt. Fuji station 3775 m ASL , located 50 kmsoutheast of Hosozawa Cirque, on the assumptionthat precipitation was simultaneous between the twosites. A comparison between our visual observationsin the study area and data at the Mt. Fuji stationprovided an empirical rule that snow tends to fall on
Hosozawa Cirque when air temperature at Mt. Fuji islower than y48C. This rule was applied to infer the
Ž .type of precipitation rain or snow in the cirque.
4. Observations
4.1. Rockfall actiÕity in the intensiÕe obserÕation( )period 1993–1995
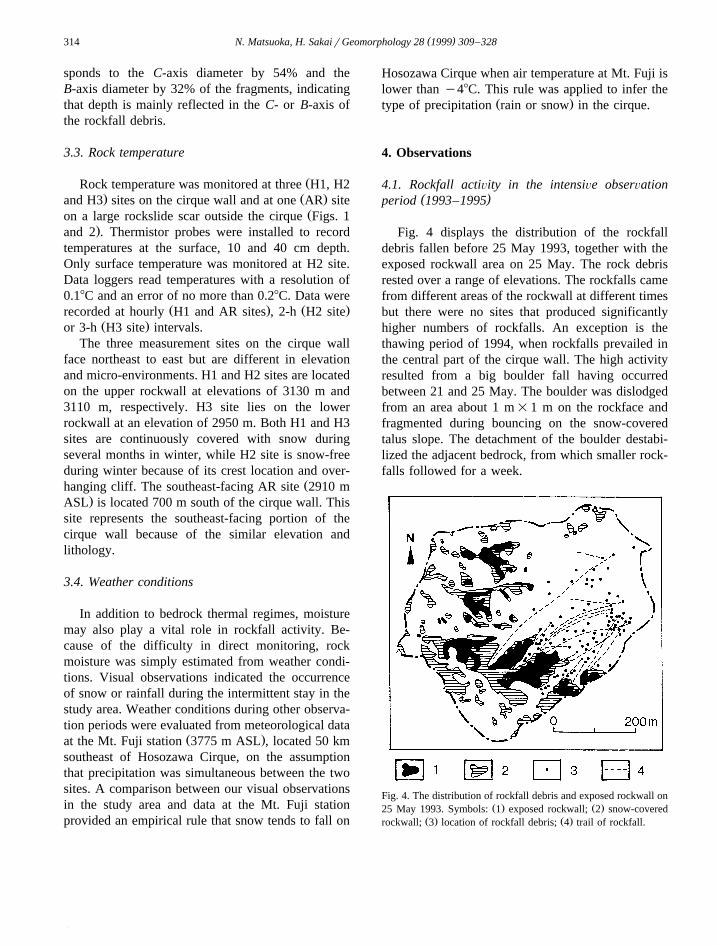
Fig. 4 displays the distribution of the rockfalldebris fallen before 25 May 1993, together with theexposed rockwall area on 25 May. The rock debrisrested over a range of elevations. The rockfalls camefrom different areas of the rockwall at different timesbut there were no sites that produced significantlyhigher numbers of rockfalls. An exception is thethawing period of 1994, when rockfalls prevailed inthe central part of the cirque wall. The high activityresulted from a big boulder fall having occurredbetween 21 and 25 May. The boulder was dislodgedfrom an area about 1 m=1 m on the rockface andfragmented during bouncing on the snow-coveredtalus slope. The detachment of the boulder destabi-lized the adjacent bedrock, from which smaller rock-falls followed for a week.
Fig. 4. The distribution of rockfall debris and exposed rockwall onŽ . Ž .25 May 1993. Symbols: 1 exposed rockwall; 2 snow-covered
Ž . Ž .rockwall; 3 location of rockfall debris; 4 trail of rockfall.

( )N. Matsuoka, H. SakairGeomorphology 28 1999 309–328 315
The magnitude of rockfall activity significantlychanged within a thawing period. Fig. 5 shows thevariations in rockfall volume and exposed area in1993. Rockfalls dominated between 5 and 15 June.Preceding and following this period, rockfall activitywas modest. The volume of rockfall debris duringthe most active period occupied 58% of the totalvolume in the observation period. The cirque wallwas exposed most rapidly between 25 May and 5June, namely, 5–20 days prior to the maximumrockfall activity. Since the talus slope was partiallyexposed between 15 June and 2 July, some sec-ondary rockfalls may have been included in thisperiod. The total volume of debris fallen before 2July was 2.79 m3. The rockfall debris, 10 cm or
larger in the A-axis diameter, consisted of 417 shaleand 418 sandstone clasts.
Both snowmelt and rockfall activity in 1994 be-Ž .gan earlier than in 1993 Fig. 6 , reflecting higher
temperatures in April and May. Rockfall activityreached a maximum between 21 and 30 May, 2weeks ahead of that in 1993. The volume of rockfalldebris during this period, half of which was providedby the boulder fall mentioned above, contributed to66% of the total volume in the observation period.Fig. 6 demonstrates that the maximum rockfall activ-ity took place while there was little change in thesnow cover on the cliff. The most rapid exposure ofthe cliff occurred between 7 and 21 May, whichpreceded the maximum rockfall activity by 5–15
Ž .Fig. 5. Rockfall activity and rock temperature at the surface and 40 cm depth during the thawing period of 1993. The exposed rockwallarea is given by the ratio to the total rockwall area. The triangles and quadrangles in the upper graph indicate, respectively, sampling datesfor rockfall debris and those for rockwall exposure. The open and solid circles below the upper graph, respectively, indicate snowfall andrainfall.

( )N. Matsuoka, H. SakairGeomorphology 28 1999 309–328316
Fig. 6. Rockfall activity and rock temperature during the thawing period of 1994. See Fig. 5 for explanation.
days. No part of the debris slope was exposed before15 June when the final measurement was accom-plished. The total volume of debris fallen before 15
3 Ž .June was 2.29 m . The rockfall debris AG10 cmconsisted of 1080 shale and 779 sandstone clasts.
In 1995, both snowmelt and rockfall activity be-Ž .gan earlier than in the preceding 2 years Fig. 7 .
The cumulated rockfall volume was already cumu-lated in 0.35 m3 before 3 May when the first mea-
surement was undertaken. Part of this volume mayhave been produced between 29 April and 2 May,during which time a combination of rainfalls andpositive surface temperatures on the exposed rock isconsidered to have led to thaw penetration in thebedrock. The volume of rockfall debris increasedgradually and reached a maximum between 24 Mayand 6 June. However, whether rockfalls were stillactive or inactive after 6 June was unclear because of

( )N. Matsuoka, H. SakairGeomorphology 28 1999 309–328 317
Fig. 7. Rockfall activity and rock temperature during the thawing period of 1995. See Fig. 5 for explanation.
()
N.M
atsuoka,H.Sakair
Geom
orphology28
1999309
–328
318
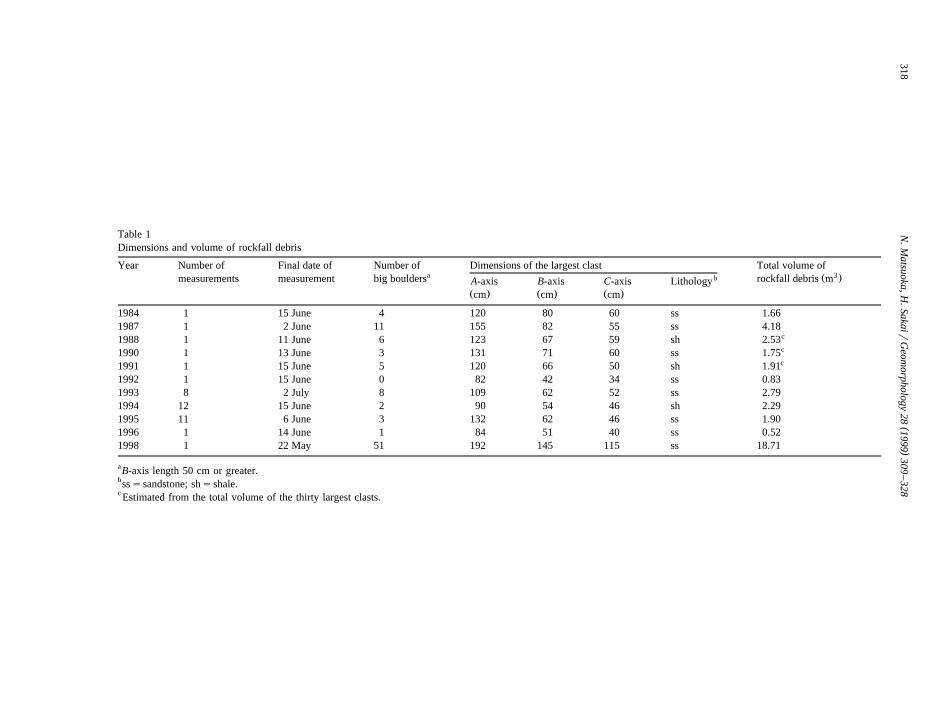
Table 1Dimensions and volume of rockfall debris
Year Number of Final date of Number of Dimensions of the largest clast Total volume ofa 3b Ž .measurements measurement big boulders rockfall debris mA-axis B-axis C-axis Lithology
Ž . Ž . Ž .cm cm cm
1984 1 15 June 4 120 80 60 ss 1.661987 1 2 June 11 155 82 55 ss 4.18
c1988 1 11 June 6 123 67 59 sh 2.53c1990 1 13 June 3 131 71 60 ss 1.75c1991 1 15 June 5 120 66 50 sh 1.91
1992 1 15 June 0 82 42 34 ss 0.831993 8 2 July 8 109 62 52 ss 2.791994 12 15 June 2 90 54 46 sh 2.291995 11 6 June 3 132 62 46 ss 1.901996 1 14 June 1 84 51 40 ss 0.521998 1 22 May 51 192 145 115 ss 18.71
aB-axis length 50 cm or greater.bssssandstone; shsshale.c Estimated from the total volume of the thirty largest clasts.

( )N. Matsuoka, H. SakairGeomorphology 28 1999 309–328 319
the lack of observation. Timelag between the rock-wall exposure and maximum rockfall activity wasalso unclear. The total volume of debris fallen before
3 Ž15 June was 1.90 m . The rockfall debris AG10.cm consisted of 627 shale and 609 sandstone clasts.
4.2. Rockfall actiÕity in other years
Table 1 summarizes the total volume of rockfalldebris in a thawing period. For the years duringwhich only the 30 largest clasts were measured, thetotal volume was estimated using the ratio of thetotal volume of the 30 largest clasts to that of the alldebris in the other years. The total volume wasusually of the order of 1 m3. Seasonal thawing in1988 and 1998 triggered a big boulder fall as in1994, providing numerous fragments on snow sur-
Ž .face Fig. 8 . Whereas the boulder fall in 1988 didnot increase the total rockfall volume significantly,that in 1998 raised the total volume to 18.7 m3,which was one order of magnitude larger than thetotal volume in the other years. The big boulder fallin 1998 itself provided a debris volume of at least8.5 m3, which was estimated from the debris volume
Ž .involved in the tongue-shaped deposit Fig. 8 . Sincethe boulder fall is likely to have been followed bynumerous smaller rockfalls, of which the largest was
3 Ž .1.5 m in volume Fig. 8 , the total debris volumeassociated with the boulder fall must have beenslightly larger than 10 m3.
The maximum rockfall activity in 1993–1995 oc-curred prior to the exposure of two-thirds of the
Ž .rockface see Fig. 10a . It is therefore assumed,based on the snow cover of the rockwall at the timeof sampling, that the annual measurements fromearlier years would also have sampled the period ofmaximum rockfall activity in those years. The mea-surement in 1998 was done in late May, but anextraordinary warm April led to snow melting 1month earlier. Thus, the values listed in Table 1 arelikely close to the total volume in spring, unless abig boulder fall happened in the end of the thawingperiod.
4.3. Bedrock thermal regimes
The bedrock thermal regime reflects micro-en-Ž .vironments Fig. 9 . The lack of diurnal fluctuation
Fig. 8. A big boulder fall in May 1998. The boulder was detachedfrom the base of the rockwall and fragmented during bouncing.The boulder fall is likely to have induced snow avalanche on thetalus slope, producing the tongue-shaped deposit of snow and
Ždebris. The arrow indicates the largest clast 192 cm=145 cm =.115 cm , which is considered to have fallen separately, as indi-
Ž .cated by the new trail on snow Photo: 22 May 1998 .
in surface temperature from December to early Juneindicates that snow covered the H3 rockwall site forhalf year. Similarly, H1 site was snowcovered fromFebruary to May. In contrast, large diurnal tempera-ture ranges even during midwinter demonstrate thatH2 and AR sites were virtually snow-free throughoutthe year. In response to the long daily exposure tosunshine, the rockface at the southeast-facing ARsite experienced frequent diurnal freeze–thaw cyclesfrom October to May. Sunlight also contributed tohigh daytime temperatures in early winter at thesoutheast-facing H1 site, resulting in a number offreeze–thaw cycles. Despite the absence of snowcover, the east-facing H2 site was shaded by an

( )N. Matsuoka, H. SakairGeomorphology 28 1999 309–328320
Ž . Ž .Fig. 9. Annual variations in air temperature top and rock surface temperatures others , given by daily ranges. Air temperature wasobserved on the southern slope of Mt. Ainodake. MAAT and MAST, respectively, indicate the mean annual air and surface temperatures.
( )N. Matsuoka, H. SakairGeomorphology 28 1999 309–328 321
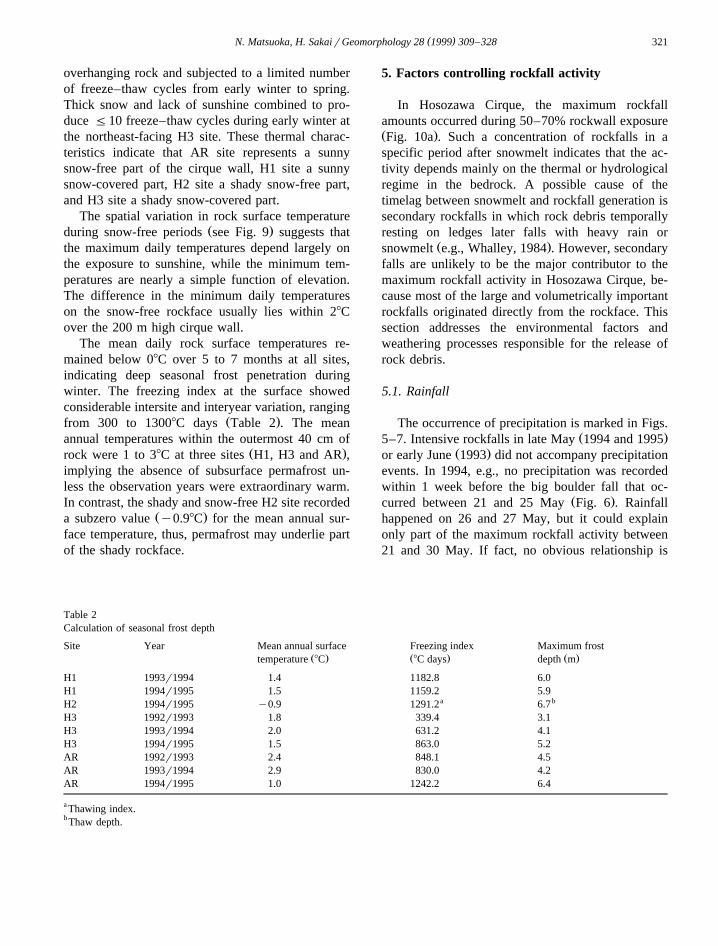
overhanging rock and subjected to a limited numberof freeze–thaw cycles from early winter to spring.Thick snow and lack of sunshine combined to pro-duce F10 freeze–thaw cycles during early winter atthe northeast-facing H3 site. These thermal charac-teristics indicate that AR site represents a sunnysnow-free part of the cirque wall, H1 site a sunnysnow-covered part, H2 site a shady snow-free part,and H3 site a shady snow-covered part.
The spatial variation in rock surface temperatureŽ .during snow-free periods see Fig. 9 suggests that
the maximum daily temperatures depend largely onthe exposure to sunshine, while the minimum tem-peratures are nearly a simple function of elevation.The difference in the minimum daily temperatureson the snow-free rockface usually lies within 28Cover the 200 m high cirque wall.
The mean daily rock surface temperatures re-mained below 08C over 5 to 7 months at all sites,indicating deep seasonal frost penetration duringwinter. The freezing index at the surface showedconsiderable intersite and interyear variation, ranging
Ž .from 300 to 13008C days Table 2 . The meanannual temperatures within the outermost 40 cm of
Ž .rock were 1 to 38C at three sites H1, H3 and AR ,implying the absence of subsurface permafrost un-less the observation years were extraordinary warm.In contrast, the shady and snow-free H2 site recorded
Ž .a subzero value y0.98C for the mean annual sur-face temperature, thus, permafrost may underlie partof the shady rockface.
5. Factors controlling rockfall activity
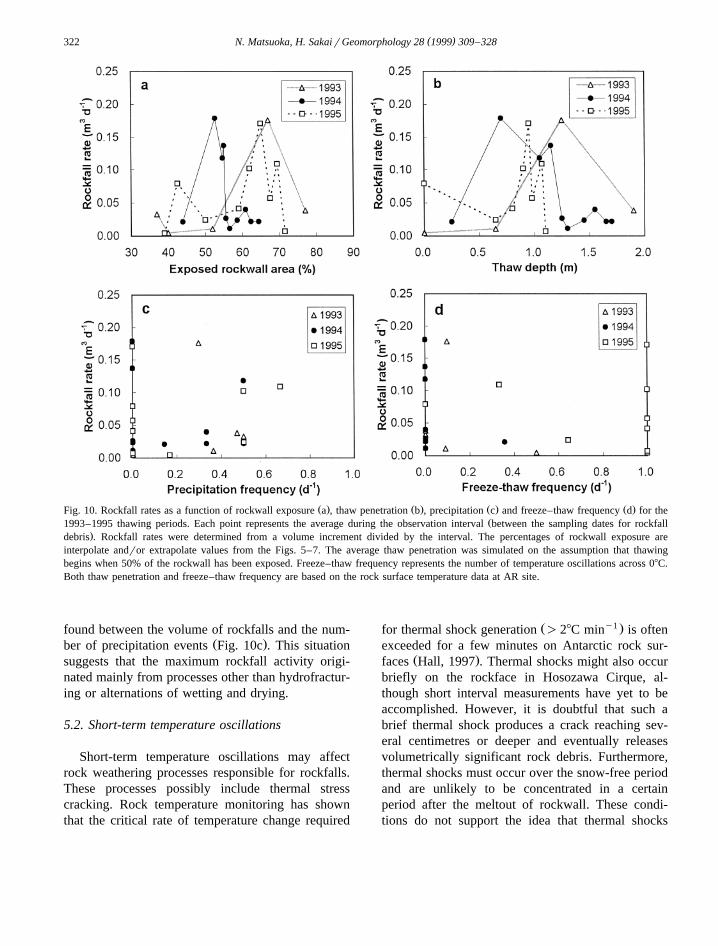
In Hosozawa Cirque, the maximum rockfallamounts occurred during 50–70% rockwall exposureŽ .Fig. 10a . Such a concentration of rockfalls in aspecific period after snowmelt indicates that the ac-tivity depends mainly on the thermal or hydrologicalregime in the bedrock. A possible cause of thetimelag between snowmelt and rockfall generation issecondary rockfalls in which rock debris temporallyresting on ledges later falls with heavy rain or
Ž .snowmelt e.g., Whalley, 1984 . However, secondaryfalls are unlikely to be the major contributor to themaximum rockfall activity in Hosozawa Cirque, be-cause most of the large and volumetrically importantrockfalls originated directly from the rockface. Thissection addresses the environmental factors andweathering processes responsible for the release ofrock debris.
5.1. Rainfall
The occurrence of precipitation is marked in Figs.Ž .5–7. Intensive rockfalls in late May 1994 and 1995
Ž .or early June 1993 did not accompany precipitationevents. In 1994, e.g., no precipitation was recordedwithin 1 week before the big boulder fall that oc-
Ž .curred between 21 and 25 May Fig. 6 . Rainfallhappened on 26 and 27 May, but it could explainonly part of the maximum rockfall activity between21 and 30 May. If fact, no obvious relationship is
Table 2Calculation of seasonal frost depth
Site Year Mean annual surface Freezing index Maximum frostŽ . Ž . Ž .temperature 8C 8C days depth m
H1 1993r1994 1.4 1182.8 6.0H1 1994r1995 1.5 1159.2 5.9
a bH2 1994r1995 y0.9 1291.2 6.7H3 1992r1993 1.8 339.4 3.1H3 1993r1994 2.0 631.2 4.1H3 1994r1995 1.5 863.0 5.2AR 1992r1993 2.4 848.1 4.5AR 1993r1994 2.9 830.0 4.2AR 1994r1995 1.0 1242.2 6.4
a Thawing index.b Thaw depth.
( )N. Matsuoka, H. SakairGeomorphology 28 1999 309–328322
Ž . Ž . Ž . Ž .Fig. 10. Rockfall rates as a function of rockwall exposure a , thaw penetration b , precipitation c and freeze–thaw frequency d for theŽ1993–1995 thawing periods. Each point represents the average during the observation interval between the sampling dates for rockfall
.debris . Rockfall rates were determined from a volume increment divided by the interval. The percentages of rockwall exposure areinterpolate andror extrapolate values from the Figs. 5–7. The average thaw penetration was simulated on the assumption that thawingbegins when 50% of the rockwall has been exposed. Freeze–thaw frequency represents the number of temperature oscillations across 08C.Both thaw penetration and freeze–thaw frequency are based on the rock surface temperature data at AR site.
found between the volume of rockfalls and the num-Ž .ber of precipitation events Fig. 10c . This situation
suggests that the maximum rockfall activity origi-nated mainly from processes other than hydrofractur-ing or alternations of wetting and drying.
5.2. Short-term temperature oscillations
Short-term temperature oscillations may affectrock weathering processes responsible for rockfalls.These processes possibly include thermal stresscracking. Rock temperature monitoring has shownthat the critical rate of temperature change required
Ž y1 .for thermal shock generation )28C min is oftenexceeded for a few minutes on Antarctic rock sur-
Ž .faces Hall, 1997 . Thermal shocks might also occurbriefly on the rockface in Hosozawa Cirque, al-though short interval measurements have yet to beaccomplished. However, it is doubtful that such abrief thermal shock produces a crack reaching sev-eral centimetres or deeper and eventually releasesvolumetrically significant rock debris. Furthermore,thermal shocks must occur over the snow-free periodand are unlikely to be concentrated in a certainperiod after the meltout of rockwall. These condi-tions do not support the idea that thermal shocks
( )N. Matsuoka, H. SakairGeomorphology 28 1999 309–328 323
induced the maximum rockfall activity during thaw-ing periods.
Another important weathering process may befrost weathering. Examination of the data in Figs.5–7 suggests that the contribution of diurnal freeze–thaw action to rockfall activity changed from year toyear according to the interaction between snow andbedrock thermal regimes. Temperature oscillations atthe AR rockwall site suggest that a number of diur-nal freeze–thaw cycles occurred on the rockfaceexposed before late May in 1993, but these diurnalcycles rarely contributed to rockfall activity over the
Ž .cirque wall Fig. 5 . The inactivity seems to haveresulted from the small exposed area and insufficientmoisture supply. In early thawing periods, only spurson the cirque wall are exposed. Diurnal freeze–thawaction is considered to be ineffective on these spursthat rarely receive meltwater from nearby snowpatches. In contrast, the instrument at AR siterecorded only two or three diurnal freeze–thaw cy-cles in early June 1993 when rockwall activityreached a maximum. Diurnal cycles are unlikely tohave occurred frequently during this period even onthe uppermost part of the cirque wall, where theminimum daily temperatures are assumed, on the
basis of the elevation difference, to be 28C lowerthan those at AR site. A similar situation happened
Ž .during the thawing period in 1994 Fig. 6 . Theabsence of correlation between the rockfall volumeand the number of freeze–thaw cycles in both 1993and 1994 is also displayed quantitatively in Fig. 10d,where a freeze–thaw cycle is simply defined by atemperature oscillation across 08C using the rocksurface temperature data at AR site.
The 1995 thawing period involved a differentsituation. Temperature records at both H2 and ARsites indicate that frequent diurnal freeze–thaw cy-cles took place over the cirque wall during themaximum rockfall activity from late May to early
Ž .July Figs. 7 and 10d . This coincidence implies thatdiurnal cycles considerably contributed to the debrisproduction during this period. Rockwalls exposed inthe later thawing period are located largely in couloirswhere copious rain and snowmelt water may perco-late into rock so that intense frost weathering can
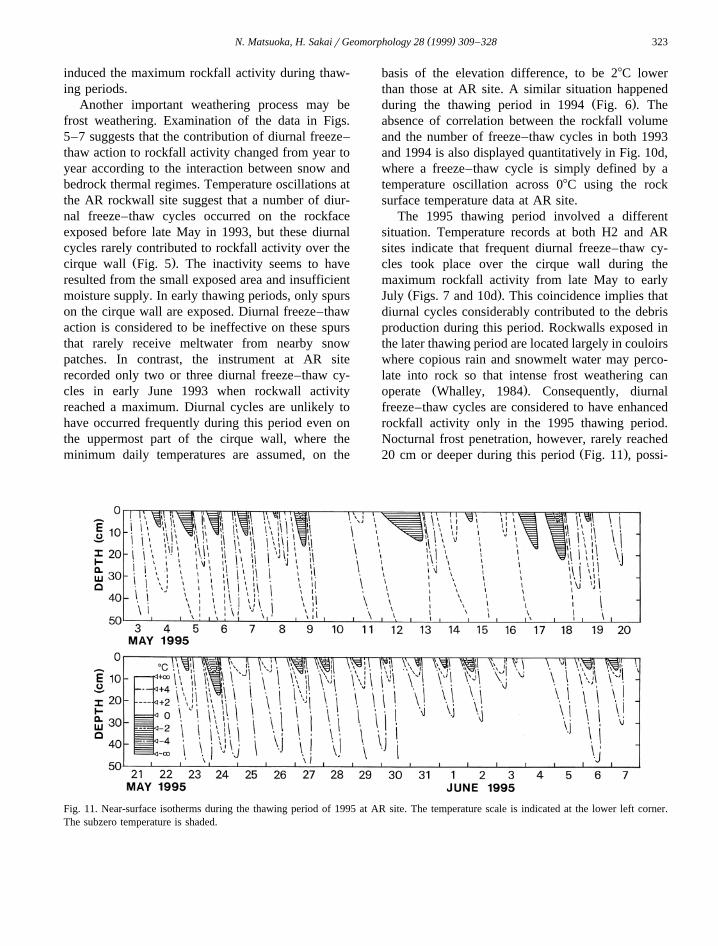
Ž .operate Whalley, 1984 . Consequently, diurnalfreeze–thaw cycles are considered to have enhancedrockfall activity only in the 1995 thawing period.Nocturnal frost penetration, however, rarely reached
Ž .20 cm or deeper during this period Fig. 11 , possi-
Fig. 11. Near-surface isotherms during the thawing period of 1995 at AR site. The temperature scale is indicated at the lower left corner.The subzero temperature is shaded.

( )N. Matsuoka, H. SakairGeomorphology 28 1999 309–328324
bly having produced mainly pebble falls that do notcontribute very much to the volume of rockfall de-bris.
5.3. Seasonal freezing and thawing
The exposure of rockwall is followed by thawpenetration that continues until the melting of sea-sonal frost is completed. Such a long-term thawpenetration may induce the timelag between the
Žrockwall exposure and rockfall generation e.g.,.Rapp, 1960 . Freeze–thaw penetration in bedrock
can be dealt with as a problem of thermal conductionŽaccompanied by latent heat exchange e.g., Weg-
.mann et al., 1998 . The modified Berggren equationŽ .Aldrich, 1956 , a solution of this problem, yieldsreasonable freeze–thaw depths in rockwalls around
Ž .Mt. Ainodake Matsuoka, 1994 . This model as-sumed that the rock surface is suddenly cooled froman above freezing temperature T , which is initially0
uniform in the rock, to a subzero temperature T ,s
then maintained at T for t h. The modified Berggrens
equation is written by the form:
2 K Af fD sl , 2Ž .f ( Lwrd
Ž .where D is the frost depth m , K is the thermalf fŽ y1 y1 y1.conductivity of frozen rock J m h K , A isfŽ . Ž .the surface freezing index sT t K h , L is thes
Ž 5 y1.latent heat of fusion s3.34=10 J kg , w is thewater content of rock, r is the dry unit weight ofd
Ž y3 .rock kg m , and l is the dimensionless correctionfactor that depends on T , T , w and the heat capac-0 s
ity of frozen rock. The correction factor is smallerthan unity, and in a special case that T equals the0
freezing point, it becomes unity. The details of thederivation of the parameters w and l are described
Ž .in Matsuoka 1994 . The thermal conductivity wasfixed to be 4.69 W my1 Ky1, which was determined
Žusing rock temperature data at AR site Matsuoka,.1994 .
The above model assumes that a rockwall subjectto a negative mean annual surface temperature is
Žunderlain by permafrost. For such a rockwall H2.site , the thaw depth D was calculated by substitut-t
ing the thermal conductivity of unfrozen rock K t
and the surface thawing index A for K and A int f fŽ .Eq. 2 , respectively.
ŽTable 2 lists the calculated maximum frost or.thaw depth for each year: note that the temperature
and time units are given, respectively, by centigradeand day scales, instead of Kelvin and hour scales.Although there are some spatial and temporal varia-
Ž .tions, the seasonal frost or thaw depth in the cirquewall is 5"2 m. This value implies the maximumsize of detachable rock mass by contemporary frostaction, which is equivalent to 102–103 m3 in vol-ume.
The modified Berggren equation also allows theevaluation of the thaw penetration depth at whichrockfall activity reached a maximum. Calculationwas made for each thawing period to simulate theaverage thaw penetration after 50% of the rockwallhad been exposed. Assumptions include that thenear-surface rock temperature lay at y1.08C beforeexposure, and that the exposed rockwall experiencedthe same variation in surface temperature as at ARsite. Since this condition represents thawing at asunny location, calculation yields the upper bound ofthaw depth.
The simulation shows that the thawing frontreaches at 1.0"0.5 m depth when rockfalls were
Ž .most active Fig. 10b . Although more precise simu-lation requires data on the timing at which the mostunstable part of the rockwall is exposed, comparisonof Figs. 5, 7 and 10b roughly indicates that a boulderup to about 1 m thick can be released 5–15 daysafter the rockwall exposure. The release of a bouldermay destabilize many surrounding fragments, andaccordingly, a number of smaller rockfalls accom-pany andror follow. The boulder falls generated inthe thawing periods of 1994 and 1998, both of whichwere followed by the release of many smaller frag-ments, are thought to be the examples of large eventsinduced by seasonal thawing. Other examples in
Žalpine environments include a big boulder fall about3.100 m generated on the north-facing rockwall be-
Ž .hind the Murtel rock glacier Swiss Alps , which´followed snowmelt with a timelag of 2 weeksŽ .Matsuoka, 1998 .
Although the simulation predicts that further thawpenetration can produce larger boulder falls, the fielddata suggest a decline in rockfall activity when the
( )N. Matsuoka, H. SakairGeomorphology 28 1999 309–328 325
Žthawing front has reached 1.5 m or deeper Fig..10b . The lack of such a large event in Hosozawa
ŽCirque may result from the long recurrence perhaps.many decades, cf. Gardner, 1980 , because a large
Ž .rock block )3 m in diameter remains stable unlessthe surrounding smaller blocks have been removed.
Ž 3 3 .In fact, a large rockfall 10 m in volume waswitnessed in early July 1993 in Karasawa Cirque,
Ž .northern Japanese Alps. Iwafune 1996 attributesthe trigger of this block detachment to the combina-tion of rainwater percolation and seasonal thaw pene-tration, and suggests that the recurrence interval ofsuch a large event is 10 years or more.
6. Factors controlling dimensions of rockfall de-bris
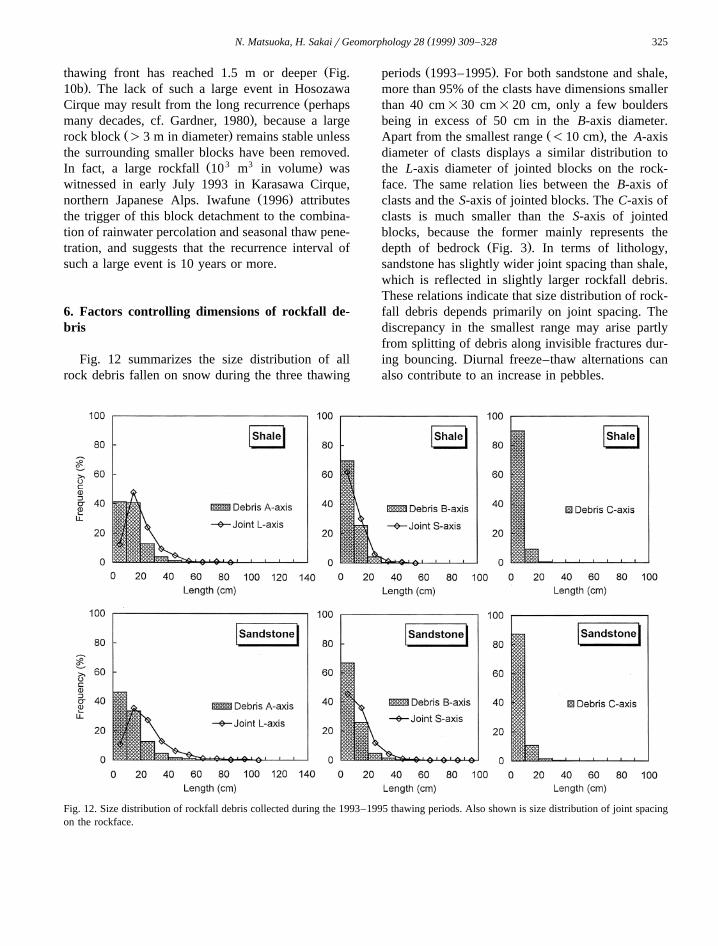
Fig. 12 summarizes the size distribution of allrock debris fallen on snow during the three thawing
Ž .periods 1993–1995 . For both sandstone and shale,more than 95% of the clasts have dimensions smallerthan 40 cm=30 cm=20 cm, only a few bouldersbeing in excess of 50 cm in the B-axis diameter.
Ž .Apart from the smallest range -10 cm , the A-axisdiameter of clasts displays a similar distribution tothe L-axis diameter of jointed blocks on the rock-face. The same relation lies between the B-axis ofclasts and the S-axis of jointed blocks. The C-axis ofclasts is much smaller than the S-axis of jointedblocks, because the former mainly represents the
Ž .depth of bedrock Fig. 3 . In terms of lithology,sandstone has slightly wider joint spacing than shale,which is reflected in slightly larger rockfall debris.These relations indicate that size distribution of rock-fall debris depends primarily on joint spacing. Thediscrepancy in the smallest range may arise partlyfrom splitting of debris along invisible fractures dur-ing bouncing. Diurnal freeze–thaw alternations canalso contribute to an increase in pebbles.
Fig. 12. Size distribution of rockfall debris collected during the 1993–1995 thawing periods. Also shown is size distribution of joint spacingon the rockface.

( )N. Matsuoka, H. SakairGeomorphology 28 1999 309–328326
The annual largest clasts have similar dimensionsŽ .120"40 cm=60"20 cm=50"10 cm , except
Ž .in 1998 Table 1 . The dimensions are close to themaximum joint spacing observed within the 5 m=1
Ž .m observation windows see Fig. 12 . Most of theseboulders fell during the maximum rockfall activity.
Ž .Some of the largest boulders in 1988 and 1994appear to have been detached from a larger rockmass during bouncing, because they are associatedwith a debris concentration on snow. Others with an
Žisolated trail on snow in 1984, 1987, 1990, 1993,.1995, 1996 and 1998 must have retained the origi-
nal volume.
7. Rate of rockwall retreat
Rates of rockwall retreat have been evaluated by avariety of methods. Many of the computations haveused the volume of sediments at the base of arockwall, thus, giving the long-term average ratesŽe.g., Barsch, 1977; Frich and Brandt, 1985; Ballan-
.tyne and Kirkbride, 1987 . Only a few values haveoriginated from direct observations of rockfall vol-
Ž .umes e.g., Rapp, 1960; Fahey and Lefebure, 1988 .The retreat rates obtained in periglacial conditionsshow a large spatial variation, but mainly lie between
y2 y1 y1 Ž .10 and 10 mm year French, 1996 . HighŽ y1 .retreat rates )1 mm year are associated with
Žfrost-susceptible limestones Pancza and Ozouf,.1988 , extremely high joint density or post-glacial
Ž .stress relaxation Andre, 1997 .´The methodology taken here permits only the
estimation of the rockwall retreat rate in seasonalthawing periods. Nevertheless, in normal years, sea-sonal thawing is likely to contribute to more thanhalf of the annual rockfalls from the cirque wall,because during our 20-year investigations in the Mt.Ainodake area, rockfalls have rarely been witnessedexcept in thawing periods. In contrast, occasionalearthquakes and high magnitude rainfall events,whose recurrence interval is in excess of 101 years,possibly trigger a large volume of rockfalls. Thepainted bedrock indeed showed considerable break-age during a summer with a high magnitude rainfall
Ž .event )300 mm , while it was stable during otherŽ .summers Matsuoka, 1990 . Cyclic seasonal thawing
may also produce a big boulder fall of the order of3 Ž .10 m or more once per decade like in 1998 , when
the removal of small fragments have eventuallydestabilized a large block. Such a high-magnitude,low-frequency rockfall would increase the long-termrockwall retreat rate significantly. Additionally, therockwall retreat can result partly from granularweathering of the rockwall. The calculation based onthe rockfall volume during thawing periods thusgives a minimum estimate of the retreat rate.
Except for 1998, the total volume of rockfalldebris during a thawing period ranged from 0.5 m3
3 3 Ž .to 4.2 m , averaging 2.0 m Table 1 . Since the totalarea of the rockface is 7.3=104 m2, the debrisvolume is equivalent to the average retreat of thecirque wall at 0.03 mm per thawing period. Themean annual retreat in normal years must have beenslightly larger but unlikely to be in excess of 0.1 mmyeary1. In contrast, the cirque wall retreated at about0.3 mm during the 1998 thawing period.
Ž .The estimated annual retreat in normal years israther low in comparison with the long-term ratesbased on talus morphology in other periglacial condi-tions, but comparable with the contemporary rates
Ž .from Scandinavian Mountains Rapp, 1960 and theŽ .Alps Becht, 1995 . The reason for the small rate
despite densely jointed bedrock is unclear, but atleast two factors should be taken into account. First,the cirque wall has been significantly stabilized afterdeglaciation 10–20 ka ago. In fact, the averagerockwall retreat in the southern Japanese Alps isbelieved to be considerably greater than the rate inHosozawa Cirque, because rockfall activity is high-est on the rockslide scars that are destabilized bycontemporary valley incision. Second, large rockfallswith recurrence of 101 years or more, which mayoriginate from any of cyclic seasonal freeze–thaw,earthquakes or high magnitude of rainfalls, increasethe long-term retreat rate significantly.
8. Conclusions
Rockfall activity in Hosozawa Cirque demon-strates a characteristic seasonal variation reaching amaximum 5–15 days after the meltout of the cirquewall. A few boulder falls, concentrated in this spe-

( )N. Matsuoka, H. SakairGeomorphology 28 1999 309–328 327
cific period, contribute to the rockfall volume signifi-cantly. The intense activity does not seem to reflectprecipitation events or diurnal freeze–thaw cycles onthe rockface. The thermal conduction model suggeststhat a lag of 5–15 days would represent thaw pene-tration to a depth of about 1 m. The primary factorcontrolling the retreat of the cirque wall is, thus,considered to be seasonal frost weathering, which isalso responsible for the delayed rockfall generationafter the exposure of the rockface. The long- andintermediate-axis diameters of rockfall debris displaya similar distribution to the long- and short-axisdiameters of jointed blocks on the rockface, respec-tively. These observations indicate that freeze–thawdepth controls the maximum dimensions of detach-able rock mass, while joint spacing determines thesize distribution of rockfall debris transported ontosnow.
The spring thaw rockfall volumes in 1984–1998usually amounts to 1–3 m3, which is equivalent tothe rockwall retreat rate of the order of 0.01 mmyeary1. However, these figures are probably a con-siderable underestimate because a big boulder fallthat occurs once per decade can result in a annualrockfall volume of the order of 10 m3 or more,raising the retreat rate significantly. In fact, a bigboulder fall having a volume about 10 m3 occurredonce in the observation period. This suggests that
Ž 1 .short-term -10 years monitoring tends to under-estimate the mean retreat rate and that attentionshould be paid when comparing the retreat ratederived from the talus volume with that from con-
Ž 1 .temporary rockfall volume. Long-term G10 yearsmonitoring will be required.
Acknowledgements
We would like to thank our field assistants, AkiraTanaka, Hiroshi Noda, Naoki Tani and Atsushi Ikeda,who helped the dangerous fieldwork. We are alsograteful to Tadashi Fukasawa, the owner of theMountain Hut Notori, who kindly permitted us to usethe hut during the off season. Our special thanks aregiven to Brian Luckman, who suggested many con-structive comments on the manuscript. This study
Žwas supported by grants-in-aid 06680157 and
.08680184 for Scientific Research from the Ministryof Education, Science and Culture, Japan.
References
Akerman, H.J., 1984. Notes on talus morphology and processes inSpitsbergen. Geogr. Ann. 66A, 267–284.
Aldrich, H.P., 1956. Frost penetration below highway and airfieldpavement. Highway Res. Board 135, 124–149.
Andre, M.-F., 1997. Holocene rockwall retreat in Svalbard: a´triple-rate evolution. Earth Surf. Process. Landforms 22, 423–440.
Ballantyne, C.K., Kirkbride, M.P., 1987. Rockfall activity inupland Britain during the Loch Lomond Stadial. Geogr. J. 153,86–92.
Barsch, D., 1977. Eine Abschatzung von Schuttproduction und¨Schutttransport im Bereich aktiver Blockgletscher derSchweizer Alpen. Z. Geomorphol. N. F. 28, 148–160, Suppl.
Becht, M., 1995. Slope erosion processes in the Alps. In: Slay-Ž .maker, O. Ed. , Steepland Geomorphology. Wiley, Chich-
ester, pp. 45–61.Church, M., Stock, R.F., Ryder, J.M., 1979. Contemporary sedi-
mentary environments on Baffin Island, N.W.T. Canada: de-bris slope accumulations. Arct. Alp. Res. 11, 371–402.
Coutard, J.P., Francou, B., 1989. Rock temperature measurementsin two alpine environments: implications for frost shattering.Arct. Alp. Res. 21, 399–416.
Douglas, G.R., 1980. Magnitude frequency study of rockfall inCo. Antrim, N. Ireland. Earth Surf. Process. 5, 123–129.
Fahey, B.D., Lefebure, T.H., 1988. The freeze–thaw weatheringregime at a section of the Niagara Escarpment on the BrucePeninsula Southern Ontario, Canada. Earth Surf. Process.Landforms 13, 293–304.
French, H.M., 1996. The Periglacial Environment, 2nd edn. Long-man, Essex, 341 pp.
Frich, P., Brandt, E., 1985. Holocene talus accumulation rates,and their influence on rock glacier growth: a case study fromIgpik Disko, West Greenland. Geogr. Tidsskr. 85, 32–44.
Gardner, J., 1970. Rockfall: a geomorphic process in high moun-tain terrain. Albertan Geogr. 6, 15–20.
Gardner, J.S., 1980. Frequency, magnitude, and spatial distribu-tion in the Highwood Pass area, Alberta, Canada. In: Coates,
Ž .D.R., Vitek, J.D. Eds. , Thresholds in Geomorphology. Allenand Unwin, New York, pp. 267–295.
Gardner, J.S., 1992. The zonation of freeze–thaw temperatures ata glacier headwall, Dome Glacier, Canadian Rockies. In:
Ž .Dixon, J.C., Abrahams, A.D. Eds. , Periglacial Geomorphol-ogy. Wiley, Chichester, pp. 89–102.
Glawe, U., Zika, P., Zvelebil, J., Moser, M., Rybar, J., 1993.Time prediction of a rock fall in the Carnic Alps. Q. J. Eng.Geol. 26, 185–192.
Gray, J.T., 1973. Geomorphic effects of avalanches and rock-fallson steep mountain slopes in the central Yukon Territory. In:
Ž .Fahey, B.D., Thompson, R.D. Eds. , Research in Polar andAlpine Geomorphology. Proc. 3rd Guelph Symp. Geomorphol.,Geoabstracts, Norwich, pp. 107–117.
( )N. Matsuoka, H. SakairGeomorphology 28 1999 309–328328
Hall, K., 1997. Rock temperature and implications for cold regionweathering: I. New data from Viking Valley, Alexander Is-land, Antarctica. Permafrost Periglac. Process. 8, 69–90.
Hencher, S.R., 1987. The implications of joints and structures forŽ .slope stability. In: Anderson, M.G., Richards, K.S. Eds. ,
Slope Stability. Wiley, Chichester, pp. 145–186.Hinchliffe, S., Ballantyne, C.K., Walden, J., 1998. The structure
and sedimentology of relict talus, Trotternish, northern Skye,Scotland. Earth Surf. Process. Landforms 23, 545–560.
Iwafune, M., 1996. Rock avalanches occurred in the snow-meltseason at the Karasawa Cirque in Mt. Hotaka-dake, theJapanese Alps. J. Geogr. 105, 569–589, in Japanese.
Kostak, B., Dobrev, N., Zika, P., Ivanov, P., 1998. Joint monitor-ˇ ´ing on a rock face bearing an historical bas-relief. Q. J. Eng.Geol. 31, 37–45.
Lautridou, J.-P., 1988. Recent advances in cryogenic weathering.Ž .In: Clark, M.J. Ed. , Advances in Periglacial Geomorphology.
Wiley, Chichester, pp. 33–47.Luckman, B.H., 1976. Rockfalls and rockfall inventory data: some
observations from Surprise Valley, Jasper National Park,Canada. Earth Surf. Process. 1, 287–298.
Luckman, B.H., 1988. Debris accumulation patterns on talusslopes in Surprise Valley, Alberta. Geogr. Phys. Quat. 42,´247–278.
Luckman, B.H., Fiske, C.J., 1995. Estimating long-term rockfallŽ .accretion rates by lichenometry. In: Slaymaker, O. Ed. ,
Steepland Geomorphology. Wiley, Chichester, pp. 233–255.Luckman, B.H., Fiske, C.J., 1997. Holocene development of
coarse-debris landforms in the Canadian Rocky Mountains.Palaoklimaforschung 19, 283–297.¨
Matsuoka, N., 1990. The rate of bedrock weathering by frostaction: field measurements and a predictive model. Earth Surf.Process. Landforms 15, 73–90.
Matsuoka, N., 1991. A model of the rate of frost shattering:application to field data from Japan, Svalbard and Antarctica.Permafrost Periglac. Process. 2, 271–281.
Matsuoka, N., 1994. Diurnal freeze–thaw depth in rockwalls: fieldmeasurements and theoretical considerations. Earth Surf. Pro-cess. Landforms 19, 423–435.
Matsuoka, N., 1998. Monitoring rockwall instability in theMurtel–Corvatsch region, Upper Engadin. In: Vonder Muhll,` ¨
Ž .D. Ed. , Beitrage aus der Gebirgs-Geomorphology, Vol. 158.¨Mitteilung der VAW-ETH Zurich, pp. 7–14.¨
Matsuoka, N., Hirakawa, K., Watanabe, T., Moriwaki, K., 1997.Monitoring of periglacial slope processes in the Swiss Alps:the first two years of frost shattering, heave and creep. Per-mafrost Periglac. Process. 8, 155–177.
McCaroll, D., Shakesby, R.A., Matthews, J.A., 1998. Spatial andtemporal patterns of Late Holocene rockfall activity on aNorwegian talus slope: a lichenometric and simulation-model-ing approach. Arct. Alp. Res. 30, 51–60.
Ono, Y., Watanabe, T., 1986. A protalus rampart related to alpinedebris flows in the Kuranosuke Cirque, Northern JapaneseAlps. Geogr. Ann. 68A, 213–223.
Pancza, A., Ozouf, J.C., 1988. Contemporary frost action ondifferent oriented rock walls: an example from the Swiss Jura
Ž .Mountains. In: Senneset, K. Ed. , Proc. 5th Int. Conf. Per-mafrost. Tapir, Trondheim, pp. 830–833.
Rapp, A., 1960. Recent development of mountain slopes inKarkevagge and surroundings, Northern Scandinavia. Geogr.¨Ann. 42A, 65–200.
Statham, I., 1976. A scree slope rockfall model. Earth Surf.Process. 1, 43–62.
Suwa, H., Okuda, S., 1988. Seasonal variation of erosional pro-cesses in the Kamikamihori Valley of Mt. Yakedake, northernJapan Alps. Catena 13, 64–77, Suppl.
Wegmann, M., Gudmundsson, G.H., Haeberli, W., 1998. Per-mafrost changes in rock walls and the retreat of Alpineglaciers: a thermal modelling approach. Permafrost Periglac.Process. 9, 23–33.
Whalley, W.B., 1984. Rockfalls. In: Brunsden, D., Prior, D.B.Ž .Eds. , Slope Instability. Wiley, Chichester, pp. 217–256.