matrix-assisted concentration and …
TRANSCRIPT

MATRIX-ASSISTED CONCENTRATION AND
MICROENCAPSULATION OF LIME JUICE
BY
LIA VANESSA GUARDIOLA
THESIS
Submitted in partial fulfillment of the requirements
for the degree of Master of Science in Food Science and Human Nutrition
with a concentration in Food Science
in the Graduate College of the
University of Illinois at Urbana-Champaign, 2011
Urbana, Illinois
Master‟s Committee:
Professor Susan Brewer, Chair
Research Professor Graciela Padua, Adviser
Professor Nicki Engeseth

ii
MATRIX-ASSISTED CONCENTRATION AND MICROENCAPSULATION OF LIME JUICE
Department of Food Science and Human Nutrition
University of Illinois at Urbana-Champaign, 2011
Graciela W. Padua, Adviser
Lime juice is widely used in American and international cuisine for its characteristic
flavor and high taste impact. It is mostly used as a flavoring agent but also as a preservative.
Lime juice is not stable upon storage. Flavor deterioration is readily apparent. Thus, developing
methods to preserve its flavor is an important goal. Dehydration is widely used as a food
preservation method. Spray drying is the most common method used in the food industry to dry
fruit juices and obtain powders. Spray drying yields free flowing powders; however, it does not
maintain the original flavor. Thus, the goal of this work was to develop a process to render lime
juice as a free flowing dry product with an authentic fruit flavor. The main objectives were (1) to
investigate the potential of a novel matrix-assisted process to obtain a free flowing dry product;
(2) to investigate the effectiveness of zein as an encapsulation matrix for citrus juice flavor
components; (3) to characterize the microstructure of resulting dried juices; (4) to evaluate the
sensory attributes of obtained dried juices. Results showed that the matrix-assisted process to
concentrate and encapsulate lime juice yielded a free flowing dry product. Zein was found useful
to effectively encapsulate lime juice components. The formation of encapsulated micro-clusters
was observed by SEM and bright field microscopy. Sensory attributes of the matrix-assisted
process were investigated by descriptive analysis and compared to commercially available
samples. Lime juice obtained through the matrix-assisted process showed a higher intensity of
fresh lime flavor compared to commercial samples. The matrix-assisted process was considered

iii
to produce a lime juice powder with better flavor characteristics than other dehydration
processes.

iv
DEDICATION
To my parents, Gloria del Carmen Ponce and Virgilio Guardiola …
…for their commitment, trust, friendship and love.

v
ACKNOWLEDGEMENTS
I give thanks to my God for being the support and guidance in my life.
I also wish to express my gratitude to all the people who helped me in making this research
project a reality.
I want to express my sincere gratitude to my advisor, Dr. Graciela W. Padua, for her
kindness, patience, and encouragement in these past two years. Thank you for this opportunity
and for helping me to improve my writing skills.
I will also like to thank to the members of my committee: Dr. Brewer and Dr. Engeseth,
for their valuable comments but most of all their teachings which I‟ve used intensively in my
research.
I want to thank the members of the Padua laboratory: Yi Wang, Panadda Nonthanum and
Chin-Ping Su, for all the help they gave me during the research and classes, but especially for
your friendship. I love you and I'm going to miss you all.
Thanks to Dr. Sivaguru at IGB core center, for all the advice provided in the use of
microscopes and image analysis.
To my family, for the love, support and strength you have gave me all my life.
To my friends: Janeth Moncada, Rosa Alfaro, Sindy Palma, Hillary Poff, Jose Diaz, Jenn
Kcloc, Paulina Sunyanto, Eliana Rosales, Judith Ordones, Claudia Vallejo and Alexandra
Manueles for all the good moments we have shared.
To Oscar Rojas, for your love, friendship, and support in these past three years.

vi
Table of contents
CHAPTER I. INTRODUCTION ................................................................................................ 1
CHAPTER II. LITERATURE REVIEW .................................................................................... 4
2.1 Drying of foods ................................................................................................................................... 4
2.2 Drying methods ................................................................................................................................... 5
2.2.1 Air drying ..................................................................................................................................... 5
2.2.2 Spray drying ................................................................................................................................. 5
2.2.3 Freeze drying ............................................................................................................................... 7
2.3 Encapsulation ...................................................................................................................................... 8
2.3.1 Encapsulation agents .................................................................................................................. 10
2.3.2 Microencapsulation techniques .................................................................................................. 11
2.3.3 Release rates ............................................................................................................................... 14
2.3.4 Release mechanisms .................................................................................................................. 15
2.3.5 Structure design ......................................................................................................................... 16
2.4 Zein ................................................................................................................................................... 18
2.4.1 Industrial applications of zein .................................................................................................... 20
2.5 Figures .............................................................................................................................................. 22
CHAPTER III. MATRIX-ASSISTED CONCENTRATION PROCESS................................. 24
3.1 Introduction ....................................................................................................................................... 24
3.2 Materials and methods ...................................................................................................................... 26
3.2.1 Materials .................................................................................................................................... 26
3.2.2 Matrix - assisted concentration process ..................................................................................... 26
3.2.3 Determination of optimum processing conditions ..................................................................... 27

vii
3.2.3.1 Freeze drying (slow freeze) ................................................................................................. 27
3.2.3.2 Freeze drying (quick freeze) ............................................................................................... 28
3.3 Results ............................................................................................................................................... 28
3.3.1 Sample selection ........................................................................................................................ 28
3.3.2 Process development. ................................................................................................................. 29
3.3.2.1 Slow freeze drying product ................................................................................................. 30
3.3.2.2 Fast freeze drying product ................................................................................................... 31
3.3.3 Concentration process extended to other foods. ........................................................................ 31
3.4 Conclusions ....................................................................................................................................... 32
3.5 Tables and figures ............................................................................................................................. 33
CHAPTER IV. MICROSTRUCTURE CHARACTERIZATION OF ENCAPSULATED
SYSTEMS ................................................................................................................................. 39
4.1 Introduction ....................................................................................................................................... 39
4.2 Materials and methods ...................................................................................................................... 40
4.2.1 Materials .................................................................................................................................... 40
4.2.2 Scanning Electron Microscope (SEM)....................................................................................... 41
4.2.3 Apotome (Bright field Microscope) ........................................................................................... 41
4.2.4 Zeis Confocal Microscope ......................................................................................................... 41
4.3 Results ............................................................................................................................................... 42
4.3.1 SEM ........................................................................................................................................... 42
4.3.2 Bright field Microscope ............................................................................................................. 43
4.3.3 Confocal Laser Scanning Microscope ....................................................................................... 44
4.4 Conclusions ....................................................................................................................................... 45
4.5 Figures .............................................................................................................................................. 46
CHAPTER V. SENSORY EVALUATION.............................................................................. 60

viii
5.1 Introduction ....................................................................................................................................... 60
5.2 Materials and Methods. ..................................................................................................................... 62
5.2.1 Materials .................................................................................................................................... 62
5.2.2 Methods ...................................................................................................................................... 63
5.2.2.1 Statistical analysis ............................................................................................................... 64
5.3 Results ............................................................................................................................................... 64
5.4 Conclusions ....................................................................................................................................... 65
5.5 Tables and figures ............................................................................................................................. 65
REFERENCES .......................................................................................................................... 68
APPENDIX A SENSORY CARD ............................................................................................ 82
APPENDIX B ADDITIONAL SEM IMAGES ........................................................................ 83
APPENDIX C ADDITIONAL APOTOME IMAGES ............................................................. 96
APPENDIX D ADDITIONAL CONFOCAL IMAGES ........................................................ 100
1
CHAPTER I
INTRODUCTION
Fruits are generally considered to have a positive impact on health and wellness. Fruit
consumption has been linked to lowering the risk of diseases such as cancer, heart disease and
obesity, among others. They are a major dietary source of vitamins, minerals and fiber. The
American diet has fruit juices as a major dietary contributor of ascorbic acid, folate and
potassium (Subar and others 1998). A study entitled „Fruit and Vegetables Intake in Young
Children‟ (Dennison and others 1998) reports that 6 fl oz of 100% natural fruit juice was
equivalent to one fruit serving. Furthermore, they may displace snack foods of high caloric
content and low nutritional value. Juices, especially citrus juices, play a major role in human
nutrition as excellent source of antioxidants, including ascorbic acid, carotenoids, tocopherols
and phenolic compounds.
Dehydrated fruit juices have economical and industrial potential. Dehydration prolongs
shelf life, preserves nutritional value, and reduces volume. Current methods to prepare
dehydrated fruit juices include spray drying, with or without added stabilizers, commonly
maltodextrins, glucose, soybean protein, and skim milk. However, such methods present several
drawbacks with respect to taste and texture properties. In general, the taste of dehydrated juices
lacks in comparison to that of the original fruit. A common texture problem is stickiness, which
makes utilization difficult. Dehydrated citric juices are important ingredients in the food
industry.

2
Encapsulation involves surrounding a core compound with a suitable shell material which
carries, protects and delivers the core, preferably in a controlled fashion. Microencapsulation is
used to trap liquid droplets, solid particles or gas bubbles, in the order of 0.2-500 microns, in a
thin film made of a suitable agent. It has the potential to meet the food industry challenges of
carrying and delivering ingredients and flavors compounds. Zein, the prolamine of corn, is a
protein recognized for its coating ability. It was proposed for the encapsulation of essential oils
(Parris Nicholas and others 2008), fish oil (Zhong and others 2009), and flax oil (Quispe-Condori
and others 2011). Traditional applications of zein include the coating of tablets in the
pharmaceutical industry and as a substitute for shellac in candy manufacture. Zein is insoluble in
water, but can be dispersed in mixtures of alcohol and water. It is an amphiphilic protein, it
contains hydrophobic and hydrophilic domains at its surface, which give zein self-assembly
properties. Zein formation of spheres and lamellar structures were detected after solvent
evaporation (Wang and Padua 2010). Such formations suggested the possibility of zein being
used as a microencapsulation polymer.
The goal of this project was the development of an effective process for juice
concentration with flavor encapsulation, using zein as encapsulation matrix. The intended final
product was a free flowing powder, as preferred in industrial operations, obtained by drying the
concentrate. Furthermore, the final product was intended to keep the authentic flavor of the
original fruit. Lime juice concentration with flavor encapsulation has not been reported in the
literature. The objectives of this work were to:
(1) Investigate the effectiveness of zein as an encapsulation matrix for lime juice non-water
components.

3
(2) Develop a process to obtain a dehydrated lime juice product.
(3) Characterize the microstructure of dried juices.
(4) Evaluate sensory attributes of obtained dried lime juice.

4
CHAPTER II
LITERATURE REVIEW
2.1 Drying of foods
Dehydration refers to the removal of water or moisture from a substance (Ratti 2001).
The objectives of food dehydration are manifold. Those include reduction of microbial
growth and limiting the occurrence of chemical and biochemical reactions (Vega-Mercado
and others 2001). Drying is a common process used in the food industry for food
preservation and to add extra value to the food. Dehydrated vegetables, green beans,
cabbage, celery, carrots, potatoes, spinach, sweet corn, turnips, and soup mixtures were
shipped from the US during World War I (Copley and Arsdel 1973).
Food dehydration results in many physical and biochemical changes that cause a
reduction in product quality. Those changes may affect the physical properties of foods
(texture, color) and the development of various biochemical reactions (degradation of
nutritional values, development of undesirable aromas) (Karel and Lund 2003; Stapelfeldt
and others 1997; Ratti 2001). In order to select the proper dehydration process, different
factors should be taken in consideration including production capacity, initial moisture
content of the products, particle size distribution, drying characteristics of the products,
moisture isotherms and physical data of the material (Vega-Mercado and others 2001).
Examples of dehydrated fruit juices available in the market are orange juice (Goula and
Adamopoulos 2010), cactus juice (Rodríguez-Hernández and others 2005), grape juice

5
(Maskan and others 2002), and lime juice (Roustapour and others 2006). A main advantage
of drying fruit juices is the reduction of volume, which facilitate transportation and storage
also it permits to have seasonal fruits available through the whole year.
Dehydration may prevent certain types of physical and biochemical degradation;
however, some quality changes may occur during drying such as browning reactions, oxidation,
color loss, shrinkage, changes in aroma and flavor, and vitamin loss (Heldman and Lund 2007).
2.2 Drying methods
2.2.1 Air drying
Air drying is the oldest method of food preservation. In this process, the solid to be dried
is exposed to flowing of air, usually hot; where moisture is evaporated (Ratti 2001).This process
extend the shelf life of foods to over a year. Unfortunately, the quality of these products is
altered in comparison to the original food. Current dehydration technologies include: kiln drying,
tray drying, tunnel drying, spray drying, drum drying, freeze dehydration, osmotic dehydration,
and the use of microwave, radio frequency (RF). In this chapter, three different processes will be
discussed: Air drying, spray drying and freeze drying.
2.2.2 Spray drying
Spray drying is one of the dehydration methods most frequently used in the food
industry. It is used for the dehydration of slurries and purees, giving as final products either
powders or flakes. It is one of the most effective methods to produce dried fruit juices (Cano-
Chauca and others 2004; Moßhammer and others 2006) because it develops a good texture in the
final product (Cano-Chauca and others 2004; Gharsallaoui and others 2007).
6
Spray drying comprises both, drying and particle formation. The process involves the
atomization of the liquid product in a hot gas, to obtain almost immediately, a powder product.
Depending on the initial feeding material and operating conditions very fine powders (10-50 µm)
or larger particles (2-3 mm) (Gharsallaoui and others 2007) may be obtained.
The spray drying process can be divided into four different stages: atomization, hot air
contact, evaporation of droplet water and dry-product humid air separation. The goal of the
atomization step is to generate a maximum heat transfer surface between the dry air and the
liquid. Depending on the characteristics desirable for the final product, different conditions can
be set in the spray dryer (Masters 1991; Gharsallaoui and others 2007). The hot air contact is a
step between the atomization and the initiation of the drying step. Depending on the direction of
the air, there are two types of drying: co-current and counter-current drying. In the former, the
hot air and the liquid product go on the same direction, and the evaporation occurs almost
instantaneously. Alternatively, in the counter-current drying method, the liquid product and the
hot air move on opposite directions (Gharsallaoui and others 2007). In the evaporation of water
droplets, a balance of temperature and vapor partial pressure are established between the liquid
product and gas phase; therefore, heat transfer is carried out from the air to the product due to the
differences in temperature, while water transfer is carried out in the opposite direction because of
the vapor pressure difference. The drying process is completed once the particle temperature
becomes equal to the temperature of the air (Gharsallaoui and others 2007). The process of the
dry product- humid air separation is usually done by a cyclone which separates particles based
on density: more dense particles are recovered at the base of the drying chamber while the fines
particles pass through the cyclone to be separated from the humid air (Bimbenet and others 2002;
Gharsallaoui and others 2007).

7
Some advantages of using spray drying are that it is a continuous and easy drying
operation. Also, a wide range of dryer designs are available depending on the type of liquid
product to dry (heat sensitive, corrosive, abrasive.) (Masters 1991). However, final product
properties are usually affected, for example, the dehydrated fruit juices need additives to prevent
thickness and most drying juices have problems at the rehydration process due to its reduction in
solubility (Bhandari and others 1997). In juices, dehydration problems are their high content of
low molecular weight sugars. Sugars have a negative effect on final product because of their
tendency to agglomerate. Amorphous sugars are transformed into crystals due to the adsorption
of small amounts of waters (Sebhatu and others 1994; Cano-Chauca and others 2004).
2.2.3 Freeze drying
Freeze drying was developed to overcome structural damage and minimize losses of
flavor and aroma compounds (Dalgleish 1990; Karel and Lund 2003). The process consists of
three steps: freezing, primary drying and secondary drying. Freezing occurs when the liquid in
suspension is cooled down and crystals of pure water are formed. Drying takes place when the
frozen water is sublimated (Konan and others 2002; Sameti and others 2003; Bozdag and others
2005; Abdelwahed and others 2006). The secondary drying step involves the removal of the
absorbed water which did not separate out as ice during the freezing (Franks 1998).This water is
usually present in the product in enough quantities to cause rapid decomposition of the final
product when stored at room temperature. For a completion of the freeze drying process, the
removal of 99% water from the initial diluted solution is required (Franks 1998).
Freeze drying involves four different operations, freezing, vacuum, sublimation and
condensation. Thus, energy consumption is high. However its use has increased in the food

8
industry due to the desirable properties of finish products. Because of the low processing
temperature and the absence of air, oxidation and chemical modifications of the product are
minimal (Tang and Pikal 2004). Freeze drying is suitable it is a suitable process for heat sensitive
products due to the vacuum conditions used in the process.
2.3 Encapsulation
Encapsulation can be defined as the process where a material coats or entraps another
material or mixture of materials. The encapsulated material can be solid particles, droplets of
liquid, or gas bubbles. Other terms used to refer to the entrapped material are core, payload, filler
or internal phase (Risch 1995). The capsule material is referred to as coating material, wall
material, membrane, carrier or shell (Gibbs and others 1999).
According to King (1995) the size of a particle formed by encapsulation can be classified
as macro- (if the particle size if larger than five hundred microns), micro- (if the particle size is
between two tenths and five hundred microns) and nanoparticles (if the size of the particle is less
than two tenths microns. Microencapsulation is the packaging of a material (solid, liquid or gas)
on a micro-scale size. The use of microencapsulation was developed by the pharmaceutical
industry in order to control the release of drugs (Kuang and others 2010). Initial versions of
microencapsulation required mechanical sources in order to release the encapsulate material.
They were mainly used for controlled release of flavors, aromas, fertilizers and drugs (Sliwka
1975). The use of microencapsulation was developed by the pharmaceutical industry in order to
control the release of drugs (Kuang and others 2010). Currently, it is a conventional technology
in the pharmaceutical, chemical, medical, agriculture, cosmetic, food and printing industries
(Shahidi and Han 1993; Heinzen 2002; Madene and others 2006; Augustin and Hemar 2009).

9
Depending on the process used to obtain the microcapsule, on the chemical and physical
characteristics of the wall material, and on the properties of the active ingredient or ingredients
used, several types of particles (Figure 2.1) can be obtained: simple spheres which are basically a
coating of uniform thickness surrounding a core, irregular particles, where a coating material will
cover a core of irregular forms, matrix particle where several core particles are embedded in a
continuous matrix of wall material, multi-core particles have several diverse cores in one
capsule, and multiwall particles, which is a microcapsule with multiwall (Versic 1988; Shahidi
and Han 1993; Gibbs and others 1999; Gharsallaoui and others 2007; Augustin and Hemar
2009).
The microencapsulation process involves three different steps: formation of the wall
around the core material; protection of the core material and preventing incorporation of the
entrance of undesirable material; and, finally, the release of the core material by a control-release
rate.
In the food industry, microencapsulation is considered a method by which solid, liquid or
gaseous materials are coated in a microencapsulated food grade agent (Gharsallaoui and others
2007). The primary reason for the food industry to use microencapsulation is because it protects
the core material from reacting with environmental factors that would cause degradation of the
product. Such factors can range from photooxidation of oils or to deliquesce of sweeteners due to
heat and humidity (protection of hygroscopic materials from moisture) (Augustin and Hemar
2009). Additionally, dehydration of fruit juices makes easier to handle the core material, both in
shipping and storage, by converting liquids in to a solid form, and promotes an easy mixing of
the core material. Added benefits include optimization of nutritional losses and regulated release

10
from core material (Ghosh 2006; Anal and Singh 2007). Industry also looks to use this
technology to mask core material taste / aroma and to promote the dilution of the core material, if
used in small amounts (Gharsallaoui and others 2007). Virtually, almost all food materials that
need protection, isolation or that require a controlled release can be encapsulated. According to
Risch (1995), food systems that can be encapsulated include but are not limited to: acids, lipids,
enzyme, microorganism, sweeteners, vitamin, minerals, flavors, water, colorants and salts.
Lately, microencapsulation of bioactive ingredients such as omega-3 oils (Sanguansri and
Augustin 2007), probiotic bacteria and phytonutrients has gained interest in the food industry
(Sabliov and Astete 2008; Augustin and Hemar 2009). The main use of these food systems when
encapsulated is as ingredients added to enhance flavor, modified texture, and add nutritional
value into the food (Augustin and Hemar 2009).
2.3.1 Encapsulation agents
For the selection of proper matrix-core combination, different aspects should be taken
into consideration: polarity, volatility, molecular weight, and how these chemical and physical
properties will interact with the wall material. Furthermore, the selection for the wall material
must be a food grade if it is intended to be used as a food ingredient. In general, in order to be
considered a good coating material, the coating should have good rheological properties that
allow it to disperse or emulsify the core material (Desai and Park 2005). Most common materials
used for food encapsulation are proteins, such as soy, casein, whey and egg proteins, sodium
caseinate, zein, or hydrolysates of these proteins. Their amphiphilic properties contribute to
proteins ability to self –assemble and form films. This allows them to be good coating materials,
but, most of them are not hydrophobic, which limits their potential applications (Augustin and

11
Hemar 2009). Carbohydrates, on the other hand, have an ability to retain volatiles in addition to
being extremely diverse and low in cost. This allows carbohydrates to play an important role as a
coating material for encapsulation, especially in flavor encapsulation (Shahidi and Han 1993;
Madene and others 2006). Sugars such as glucose, sucrose, cyclodextrins and non-starch
polysaccharides such as pectin, carragen, and cellulose derivatives and others (King 1995;
Augustin and Hemar 2009) are usual materials for encapsulation as wall materials. Finally, lipids
such as natural fats and oils, waxes, phospholipids, mono- and diglycerides may also be suitable
for encapsulation (Siepmann and others 2006; Augustin and Hemar 2009). Wax coatings have
been used to coat fresh fruits and vegetables to extend their storage life after harvest. Because
they are effective in blocking moisture, their colloidal stability and rheological properties make
lipids useful material for encapsulation (Shahidi and Han 1993; Augustin and Hemar 2009).
2.3.2 Microencapsulation techniques
Various techniques can be used to produce encapsulated ingredients. This section will
focus on those used for encapsulation of food ingredients:
Spray drying: Is the technique most utilized in food industry. In order to obtain an
encapsulated material using spray drying, three different stages have to take place. The first stage
involves the emulsion of the active material in the wall solution. This happens through dispersal
of the core material is into a solution of the coating material, which may then heated and
homogenized. The following step is the atomization, and, finally spraying of the mixture in a hot
chamber, where solvent is evaporated. Thus, formation of the microcapsules occurs (Watanabe
and others 2002; Gharsallaoui and others 2007). The formed microcapsules are then placed in a
cyclone separator for recovery. Since only aqueous-based dispersion is used in food production,

12
the matrix material must have good solubility in water. Typically, coating materials used in spray
drying are either carbohydrates (starch, maltodextrin, and guar gum) or proteins (such as soy
protein, and whey protein). It‟s important to note that protein use is limited due to their low
solubility in water (Desai and Park 2005; Ghosh 2006).
One main disadvantage of this process is that due to the high temperature used in the
process, low molecular weight volatiles can be lost. Also, the core material may also be attached
to the surface of the wall leading to oxidation and changes in the quality of the encapsulated
material (Desobry and others 1997). Because the spray drying process produces fine powders,
the encapsulated product obtained usually requires further processing, such as agglomeration, in
order to increase solubility (Risch 1995).
Spray cooling: Is comparable to spray drying, the main differences are the dispersion of
the core in the coating material during atomization is done under cooled or chilled temperatures
instead of being atomized into a hot environment. The cool air causes solidification of the wall
material around the core (Desai and Park 2005). Capsules produced by cool or chilled spray
drying are insoluble in water as a result of using high melted fats (vegetable oils or derivatives)
as a matrix material. This technique it is usually used for encapsulation of water soluble core
materials such as ferrous sulfate, vitamin, minerals, or acidulants. It can be also used for heat-
sensitive materials or frozen liquids (Gibbs and others 1999).
Fluidized bed coating: Is an efficient technique to apply a uniform layer of wall material
to a solid core. Due to its high drying capacity, it is an ideal technique for coating particles that
have the predisposition to agglomerate when wet (Williams III and Liu 2000). In this system, the
wall material is atomized in a temperature- and humidity- controlled chamber, where solid

13
particles are suspended (Risch 1995; Gouin 2004). There is a wide range of wall materials that
can be used in fluidized bed coating processes such as cellulose derivatives, starch derivatives,
dextrins, emulsifiers, lipids, proteins and proteins derivatives. It should be noted that this is a
suitable process for wall materials like oils and waxes where the aim of cool air is to harden the
carrier. This technique can also be applied for solvent-based coatings. For example, starches and
maltodextrin can be used because hot air will evaporate the solvent. The main advantage of
fluidized bed coating, is that it offers good gas particle contact which translates into an optimal
heat and mass transfer rate. Furthermore, it requires a low maintenance cost, is easy to control,
allows specific particle size distribution, and low porosity to be designed into the product
(Heinrich and Mörl 1999; Chua and Chou 2003; Madene and others 2006). In some cases,
fluidized bed coating is also used to provide a secondary protective coating to spray dried
powder holding sensitive cores (Augustin and Hemar 2009).
Freeze drying: also known as lyophilization, is a choice technique used to dehydrate heat
sensitive materials. Final products of freeze drying are generally of high quality in comparison to
other drying methods (Minemoto and others 1997; Buffo and Reineccius 2001). Freeze drying
process consist of two important operatings: the first is a freezing, which removes heat and
causes water to crystallize (Becker and Fricke 1999). The second is a drying system, in which
part of the process water is removed by sublimation, where mass and heat transfer process are
involved. The main step of freeze drying in encapsulation is the mixing of the core material in a
coating solution, and the freeze drying of this mixture. Since low temperature and vacuum are
applied during the freeze drying process, the process has a high retention of volatile compounds
(Shahidi and Han 1993). Some common coating materials used in freeze drying include
carbohydrates, such as starches, maltodextrins, sucrose and cyclodextrins and proteins such as

14
soy protein and casein. However, even with the advantage of obtaining a product of high quality,
freeze drying is less attractive than other process. Majors disadvantages of freeze drying are the
elevated cost of the process, and the time required to dry materials in comparison to other
processes.
2.3.3 Release rates
One of the aims of encapsulation is to have control on the release of the core material.
Controlled release can be defined as a technique in which one or more active materials are made
available at a specific location and time at a particular rate (Pothakamury and Barbosa-Cánovas
1995). The release can be controlled by matrix, in which the release is controlled by the capsule
wall; or controlled by membrane, where release is controlled by a membrane wrapping the wall
(Gibbs and others 1999). There are three types of rates that can be achieved by a single
microcapsule: Zero order, half order and first order. Zero order rate, occurs when the
encapsulated material is a pure material that will be release from the wall material as a pure
material. Half order release rate is when encapsulated material a matrix particles are released.
First order release rate take place when core material is a solution. As the solute material releases
from the capsule, a desired concentration of solute is achieved (Versic 1988; Shahidi and Han
1993). In order to obtain a release rate different than zero, half or one, a mixture of
microcapsules all with different sizes and wall thickness can be apply. Two factors control the
release rate of flavors from products, the volatility of the aroma compounds in the food matrix
and the resistance to mass transport from product to air. The mechanism of release for the shell
can be based on solvent effects, such as melting, diffusion, degradation, or particle rupture (De
Roos 2000).

15
2.3.4 Release mechanisms
Release by melting: in this mechanism the integrity of the wall material is destroyed,
either by appropriate dissolution or by thermal resources. Once the wall material is melted, the
active material is released. For fat capsules such as lipids, modified lipids and waxes, thermal
release is applied. Thermal release can be applied to encapsulates to be used in baking processes
(Shahidi and Han 1993; Sparks and Jacobs, J.C. and Mason, N.S. 1995; Madene and others
2006; Brownlie 2007).
Release by diffusion: this mechanism is controlled by the solubility of the core material
and the permeability of the compound through the matrix. This is the most common release
mechanism used in encapsulation matrices. The principal steps to release flavor by diffusion are:
First, a diffusion of the core material to the surface of the matrix. Then, the partition of the
volatile components between the matrix and the surrounding food, and the transportation of the
volatile components away from the matrix surface occurs in this second part. Thus, if the core
material is not soluble in the matrix it would not enter the matrix and no diffusion will occur
(Gibbs and others 1999; Madene and others 2006).
Release by degradation: erosion may be heterogeneous, where the erosion occurs once
degradation is limited to a thin layer at the exterior of the delivery system, and homogeneous
erosion, which is degradation occurring at a uniform rate throughout the polymer matrix
(Pothakamury and Barbosa-Cánovas 1995). Biodegradation of the coatings can help to release
core materials for example, lipases enzymes are used for degradation of lipid coatings (Shahidi
and Han 1993).

16
Release by particle rupture: is the release of the active material by breaking or fracturing
of the coating material by external or internal forces. Chewing is the most typically method used
to rupture a particle in order to release active material.
The main challenge is to recognize the proper microencapsulation technique and the
proper encapsulating material to enhance the quality of traditionally foods.
2.3.5 Structure design
There are different structural design principles that can be used in order to put together
novel structures, such as phase separation, spontaneous self-assembly, direct self-assembly,
direct assembly among others (McClements 2009).
Phase separation: This structural design occurs after two or more different materials are
mixed together. They can form a homogeneous solution, or they can be separated by different
phases, depending on the interaction of the different molecules in each material (e.g. Oil and
water interaction in food)
Spontaneous self-assembly: this is caused by hydrophobic effects, leading the system to
adopt a more organized structure. This system is controlled by environmental conditions.
Directed self-assembly: in this system, control of preparation conditions are needed such
as the order of mixing materials, and temperature. The driving force for direct self-assembly are
as mentioned before hydrogen bonds and hydrophobic interactions.
Evaporation-induced self-sssembly: Evaporation-Induced Self-Assembly (EISA) is a
simple route to produce organized polymers and nanoparticles, from a droplet to a solid film,

17
fiber, or powder (Brinker and others 1999). Due to flow fluctuations within the evaporating
droplet, the final product is usually an irregular structure (Kumar 2010). In order to obtain a
more regular and fully organized structure, different factors must be controlled both chemical
parameters such as evaporative rate, solution concentration, and the interaction between solute
and substrate (Byun and others 2009); and processing parameters like temperature, and vapor
pressure (Grosso and others 2004).
EISA consists of three important steps:
Preparation of initial solution: In order to have an EISA process a high volatile solvent
should be used, as well as the nature and density of the chemical groups used as an active
material. Consequently, if any chemical parameter needs to be adjusted, it will be easier to
identify the adequate component to adjust. Different structure can be obtained by varying the
initial concentration of the mother solution.
The evaporation step: This step is controlled more by the processing parameters. In this
step the micelles are formed, once the surfactant concentration has reached the equivalent of the
critical micelle concentration during the evaporation of the solvent.
Final structure: Once the water has evaporated the final structure is obtained.
During EISA (figure 2.2.) the solvent is evaporated, thus the system is concentrated in a
water solution. However no phase separation occurs at this point, rather, micelles are formed by
incorporation of hydrophobic components (Brinker and others 1999; Brinker 2004).

18
2.4 Zein
Corn, is considered one of the most important grains in the western hemisphere. Its
cultivation has been part of American culture for centuries. Its reach extends from great
civilizations such as the Mayans and Aztecs to staple grains of the Native Americans. Today,
corn represents an important part of the American diet, making it one of the most important
industrial crops in United States. Corn proteins are classified into four groups: albumins,
globulins, prolamins (zein), and glutelins.
Zein, is the prolamine of corn, mainly present in the endosperm, and along with other
endosperns proteins it is mostly found in the Corn Gluten Meal (CGM). It is recognized as the
principal storage protein of corn, containing between 44-79% of the endosperm protein (Zhang
2008). The amount of protein content in the endosperm will depend on the variety of corn used
and the separation technique used (Hamaker and others 1995; Landry and others 2000). It is
insoluble in pure water, but soluble in certain mixtures of alcohol and water, elevated
concentrations of urea, high concentrations of alkali or anionic detergents (Shukla and Cheryan
2001).
Zein comprises a protein fraction with peptides of different molecular weight and
solubility. Four different types of zein have been identified: α, β, γ, and δ (Zhang 2008). α zein is
usually extracted by using aqueous alcohols, it is also the most abundant protein with around 70
% of the total protein, the next most abundant is γ which provide around 20% of the total protein.
As opposed to α-zein, all the other zeins required the use of reducing agent in the solvent in order
to be extracted. The most abundant one in the market is α-zein. This is due to the fact that the
other types of zein (β, γ, and δ) have the tendency to form gels, which limits the

19
commercialization of zein (Lawton 2002). Zein hydrophobic properties are due to the large
amount of hydrophobic residues such as leucine, proline and alanine. On the other hand, zeins
also have polar residues, such as glutamine and asparagine. Consequently, zein does not dissolve
in pure water or pure alcohols (Wang 2004).
Argos and coworkers (1982) proposed a helical wheel model for zein, where nine
homologous repeating units are organized in an antiparallel arrangement supported by hydrogen
bonds. The heliptical content of zein in ethanol concentrations between 50 and 80% ethanol
varies from 33.6 and 60 % (Argos and others 1982; Matsushima and others 1997). Matsushima
and coworkers (1997), revised the model proposed by Argos and coworkers in 1982. By using a
small angles X-ray scattering, they suggested that reduced α-zein exist as asymmetric particles of
13 nm with and axial ratio of 6:1.
Due to color pigments such as carotenoids and xanthophylls, usually related to
hydrophobic proteins, such as zein in corn, various potential applications of zein have being
delayed. To obtain zein with minimum amount of impurities, meaning zein with a white color,
and a reduced amount of lipid materials, large amounts of organic solvents must be used.
Therefore, the high cost of zein (Shukla and Cheryan 2001).
Due to its amino acid composition, zein, has approximately equal quantity of both
hydrophilic and lipophilic residues (Gianazza and others 1977). Tertiary structure of zein has a
regular geometry, commonly considered to be a ribbon with 17 nm in length, 4.5 nm wide, and
1.2 nm in thickness with both hydrophobic and hydrophilic domains (Matsushima and others
1997). This is mainly due to the fact that the secondary structure of zein consists mostly of 50%
of α-helix arranged in nine segments spaced along the polypeptide chain. All of this α-helix has a

20
hydrophobic surface. Thus, when then chain bends upon itself, it forms a ribbon that has a
hydrophobic front and back and hydrophilic ends. It is the structure of zein that allows it to
function as a polymeric amphiphile.
Zein amphiphilicity is one of the main driving forces for its self-assembly properties.
Self-assembly is the natural formation of a structured phase from a disorderly phase, facilitated
by weak interactions such as hydrogen bonds and hydrophobic associations. Through self-
assembly different structures can be achieved, such as cubic, hexagonal, lamellar among others.
Zein, when self-assembled, forms nanoscale sphere and tubes (Wang 2004). These
nanotubes and microspheres formed by zein, may be useful as carriers for drugs in the
pharmaceutical industry (Wang and others 2005; Wang and others 2008).
According to Govor and others (2009), by altering the concentration of solutes, the type
of solvent and the percentage of solvents used, microstructure of encapsulates can be regulated
through the evaporation of binary solutions.
Wang and Padua (2010) found that zein concentration and the ratio water to ethanol of
the solvent affected the morphology of EISA microstructures. They observed the formation of
microspheres, packed spheres, and films by varying the mother solution.
2.4.1 Industrial applications of zein
Interest in zein is due to its capability to modify the properties of other materials such as
water resistance, grease resistance, microbial resistance, glossy, with either brittle or soft and
flexible texture.

21
One of the first industrial applications of zein was as a coating material. During War
World II as a coating for floor of steame engine rooms, due to its grease and moisture resistance
(Lawton 2002). More recently, zein-based coatings have been used in the coating of paper in
order to provide a glossy finish on magazine covers (Trezza and Vergano 1994). Zein coating
has also been used in the cosmetics industry in order to prevent direct contact between the skin
and the inorganic chemical used in some products (Avalle 1998).
In the 40‟s, the textile industry used zein to produce custom fibers for clothing purpose
and also for filling furniture (Lawton 2002). These fibers had excellent water resistance and wet
strength.
Biodegradable films, can be formed by adding plasticizers such as glycerol (Parris and
others 1997), fatty acids such as linoleic or oleic acid (Lai and others 1997) to zein to reduce the
brittleness. This allow the formation of a flexible and extendible polymer.
The most important application of zein in this research is applying it to control the release
of active materials. Zein has been used in the pharmaceutical industry as a coating for tablets and
as part of control release formulations in drug delivery (Liu and others 2005; Wang and others
2005 urtado- pez and Murdan 200 )
Some other industrial applications of zein are as adhesives, binders, and chewing gum
(McGowan and others 2005). It was also incorporated in three types of printing inks: heat set,
vapor set and flexographic (Lawton 2002).
Recently, zein has being used as a wall material for flax oil (Quispe-Condori, 2011), or
essential oils (Parris and others 2005), and heparin (Wang and others 2005).

22
2.5 Figures
Figure 2.1 Types of microcapsules.

23
Figure 2.2. Microstructure formation by EISA using zein as example.

24
CHAPTER III
MATRIX-ASSISTED CONCENTRATION PROCESS
3.1 Introduction
Lime juice is widely used in a variety of food preparations, mainly as a flavoring agent or
acidulant. It is used as an additive for salads and in the manufacturing of lemonade (Zvaigzne
and others 2009). In the food industry; it is used as an additive to prevent darkening of fresh
fruits (Carter 1993). Lime juice contains a variety of nutrients: vitamin C, vitamin B-complexes,
and minerals. The fruit peel contains 1-2 % essential oils. Lime juice chemicals have been
associated with preservation of cancer and unwanted damage to cell membranes (Zvaigzne and
others 2009).
Citrus juices suffer a number of deteriorative reactions up on storage. These reactions
cause the development of off-flavor and browning (Ziena 2000). Spray drying is the main
process used to produce dry lime juice, it produces a free flowing product. However, it does not
maintain the original flavor. Finding an alternative process to produce a free flowing dry lime
juice that retains the flavor characteristics of the fruit is an important goal in the food industry.
Current research looks at microencapsulation as a possible alternative to spray drying.
(Süheyla H. and Öner L 2000). The objective of microencapsulation is to coat active ingredients
and prevent their degradation. The active substance, referred to as the core, is surrounded by a
coating or wall material of various degrees of thickness. Microcapsules may contain liquids or
solids and can be used in mixtures or dispersions. Microencapsulation offers a number of

25
advantages: protection from the environment for sensitive materials; improved processability
(solubility and dispensability) of the active materials; prevention of degradative reactions leading
to enhanced shelf life; masking odors and taste; timed release of the active ingredient.
Microencapsulation was originally developed in the pharmaceutical industry, but has now gained
acceptance in other industries. In the food industry, its main use is to encapsulate ingredients or
additives used in prepared or fortified foods, nutritional mixes, seasoning fillings, desserts, dry
mix puddings, teas, dry mix beverages, and dairy mixes. Since they are constituents of complex
food systems, they should be able to function within that system (Ribeiro 2009).
Today‟s consumers are becoming increasingly aware of nutrition concepts. They are
looking for healthy diets and demanding more natural products. However, many natural
ingredients are unstable in food processing. In order to ensure the natural sensory and nutritional
quality of those ingredients, microencapsulation is a promising technology (Lakkis 2007).
Zein has being used in the food industry for its ability to form tough, hydrophobic,
greaseproof coatings. In the pharmaceutical and agro industry, zein has been used as an
encapsulating agent to carry and release drugs, pesticides, fertilizers and pheromones. The water-
insoluble character of zein facilitates its use in films and related products (Smith and others
2004).
The objective of this study was to investigate the application of novel matrix- assisted
concentration processes to concentrate and encapsulate lime juice in a zein matrix.

26
3.2 Materials and methods
3.2.1 Materials
Zein was obtained from Showa Sanyo Co. Ltd. (Tokyo, Japan). Ethanol (95% or 190 proof
technical grade was obtained from Decon Laboratories, Inc. (King of Prussia, PA)
Lime, lemon and orange were considered in this study because their juice is readily
extracted and also because dehydrated juices are available commercially and can be used for
comparisons. Fruits of those three kinds were purchased locally (Champaign, IL) and stored at
3oC until juice extraction.
3.2.2 Matrix - assisted concentration process
Zein powder (0.15g- 1.2g) was dissolved in 95 % aqueous ethanol (84 ml). The solution
was heated on a hotplate to 52oC ± 3
oC and stirred continuously with a magnet stirrer for two
minutes until zein was completely dissolved. The solution was then cooled down to 38oC before
adding fresh natural juices to prevent altering their natural flavor profile due to thermal
degradation. 30 ml of fresh lime juice was added to the solution and stirred for approximately
three minutes. Solution aliquots were placed on aluminum dishes in a chamber with constant air
flow to allow for the evaporation-induced self-assembly of encapsulation structures. Since
ethanol has a lower boiling point compared to water, thus, water is more difficult to evaporate
and stay in the pans for longer time.
27
3.2.3 Determination of optimum processing conditions
To determine the optimum level of zein in the final product, four different levels of zein
were used: 150, 300, 600 and 1,200 mg. A constant level of lime juice was maintained (30 ml
juice ~ 92.2 % water) with only zein concentration varied. Samples of lime mixed with zein were
allowed to dry in a chamber with air circulating continuously inside. Samples were placed in
aluminum dishes to allow for the evaporation of alcohol. Subsequently, dishes were placed
inside a chamber with air flowing constantly to completely dry the samples. The dry film formed
in the dish was collected by attrition. A post-treatment with liquid nitrogen was applied in order
to obtain a hard and brittle sample which facilitated the production of flakes in the final product.
Samples were collected and stored in desiccators containing „Dry-rite‟ (W.A. Hammond Drierite
Co., LTD, USA) to prevent water absorption and maintain sample stability. Samples were stored
until further analysis.
Two different freeze drying processes were performed in addition to air-drying process
described above: slow-freeze and quick-freeze. Fruit juices were concentrated and dehydrated
according to protocols described below.
3.2.3.1 Freeze drying (slow freeze)
Following ethanol evaporation, samples in aluminum dishes were placed in a cold room at
a temperature of – 30o C for 12 hours. Frozen samples were then placed in a vacuum dryer for 24
hours. During the slow-freeze drying, a thin film was formed in the aluminum dishes. After
being collected, the films were treated with liquid nitrogen and separated by sieving to reduce

28
particle size distribution. Samples were collected and stored in desiccators, as mentioned above,
to prevent water absorption.
3.2.3.2 Freeze drying (quick freeze)
Samples were held under a fume hood with constant air flowing over the samples until
most of the alcohol was evaporated. The color of the samples was used to indicate if samples
were ready for freeze-drying treatment. A change in sample color from a clear-yellow liquid to a
turbid white liquid, indicate removal of ethanol. Samples were then frozen with liquid nitrogen.
Frozen samples were immediately placed in the freeze-dryer for 24 hours. Dry material was then
collected and stored in desiccators.
3.3 Results
3.3.1 Sample selection
0.15g, 0.3g and 0.6 g of zein where used to encapsulate 30 ml of juice. The three different
juices used were lime, lemon and orange. An informal sensory evaluation (four panelis) was
conducted to describe the flavor and texture of concentrated-encapsulated juice samples. Flavor
was described as sharp and acidic in the three samples. Lemon juice texture was described as
gummy in all the concentrations with color varying from brown at the lowest concentration to
yellow to the highest. Orange samples texture varied from gummy in the low concentration to
flakes in the highest concentrations. The color always maintained an orange appearance and
flavor was described as sweet; however, the orange fruit flavor was not detected. Lime juice was
the only one selected for further study because of its original flavor.

29
3.3.2 Process development.
Table 3.1 shows the sensory properties of the final product obtained by room drying for
all four zein concentrations (0.15, 0.3, 0.6 and 1.2 g) where juice concentration was maintained
in each process (30 ml). Once samples were harvested and had undergone a post treatment using
liquid nitrogen, a small sensory panel was organized to evaluate the different properties of each
sample. At zein: juice concentration of 0.15 g : 30 ml, samples were described with a green
color, gummy texture comparable to food products such as honey or caramel, a sharp acid taste,
and flavors similar to tamarind sample present. As the concentration of zein increased the texture
became drier. At 0.30 g zein: 30 ml juice, sample took on a texture defined as glassy (with a
lollipop used as a reference), while the taste descriptor of acidic was noted to be similar to the
0.15 g: 30 ml concentration. At 0.60 g: 30 ml juice concentration, sample texture was described
as more flaky (similar to ground jalapeño). There was a notable color change from green to
yellow and taste was described as acidic without fruit flavors. At a 1.2 g of zein : 30 ml juice
concentration, the sample texture was accurately described as crystalline, similar to refined
sugar. The flavor profile was described as an authentic lime flavor, containing both acidity and
fruity sensation, as described by the panel. Color varied from white to a plain yellow. Based on
the sensory evaluation, the 1.2 g of zein was selected for further study due to certain key
attributes, a free flowing powder structure, good flavor authenticity, and bland color.
Figure 3.1 shows a flow diagram of the matrix-assisted concentration process. After
obtaining the desired g zein: ml juice concentration, samples were placed in aluminum dishes
and allowed to dry in a chamber with continuous air running for 24 h.
30
3.3.2.1 Slow freeze drying product
After two concentration levels (0.6 g zein: 30 ml lime juice and 1.2 g zein: 30 ml lime
juice concentrations) were chosen, two different drying techniques where applied in order to
improve product presentation, flavor and, most importantly, the flavor-release. The first process
was the slow-freeze drying technique. Characteristics of samples obtained from slow-freeze
drying are described in table 3.2. At 0.6 g of zein: 30 ml lime juice, samples varied in description
from gummy (with texture similar to a gummy bear) and as glassy, similar to a lollipop. The
color of the sample also varied from yellow when gummy to a pale yellow color when glassy. As
the concentration of zein increased to 1.2g zein: 30 ml lime juice, samples became drier. The
consistency in this concentration was flaky, presented an acidic taste that offered a slightly fruity
flavor, and a green color.
Figure 3.2 illustrate the method used to obtain matrix-assisted concentration by slow-
freeze drying. Samples from 0.6 g zein: 30 ml lime juice and 1.2 g zein: 30 ml lime juice
concentrations were placed in a closed chamber with constant air flow. Sample color was
measured and change from a yellow, transparent color to a white, opaque color. At this point,
samples were placed in a freezer at a temperature ~ -30 °C for approximately 12 h. Samples were
placed in a batch-operation freeze drying unit, Vacudyne (Chicago, Ill),using heating pads to
provide the heat necessary for sublimation. Vacuum pressure inside the chamber was noted as
0.1 Torr at -75°C. Samples were maintained in the freeze dryer for 24 h. After complete drying,
samples were placed in a desiccator containing Dry-rite to reduce the relative humidity and
prevent samples from absorbing water from environment.

31
3.3.2.2 Fast freeze drying product
The process of matrix-assisted concentration by quick freeze drying is shown on Figure 3.3.
After samples with desired concentration of zein-lime juice where obtained, they were placed in
the aluminum dishes in a chamber with air flowing constantly for 3 h. Once ethanol had
evaporated to a desirable concentration, the dishes were placed in a freeze dryer at -40o C and a
vacuum pressure of 200 mTorr. Depending on the amount of alcohol evaporated, the sample
texture, flavor and color varied as mentioned above. Texture change from gummy to a more
powdery sample, by increasing the amount of zein. An improvement in flavor also occurred
(Table 3.3), sample with higher amount of zein (1.2 g zein: 30 ml lime juice) had a more fruity
flavor. Color change was also recorded by increasing the concentration of zein (1.2 g zein: 30 ml
lime juice).
An informal sensory panel comparing both concentrations of zein (0.6 g zein : 30 ml
juice and 1.2 g zein : 30 ml juice) from both freezes drying process: Slow and quick freeze
drying, after they evaluate texture, color and flavor, the higher concentration was chosen to be
used in sensory descriptive evaluation due to its superior sensory attributes.
3.3.3 Concentration process extended to other foods.
In order to prove the efficiency of the matrix-assisted process in other types of liquid
foods, an experiment using cucumber extract was done. The objective of this experiment was to
investigate whether the matrix-assisted process was also applicable to vegetable water extracts.
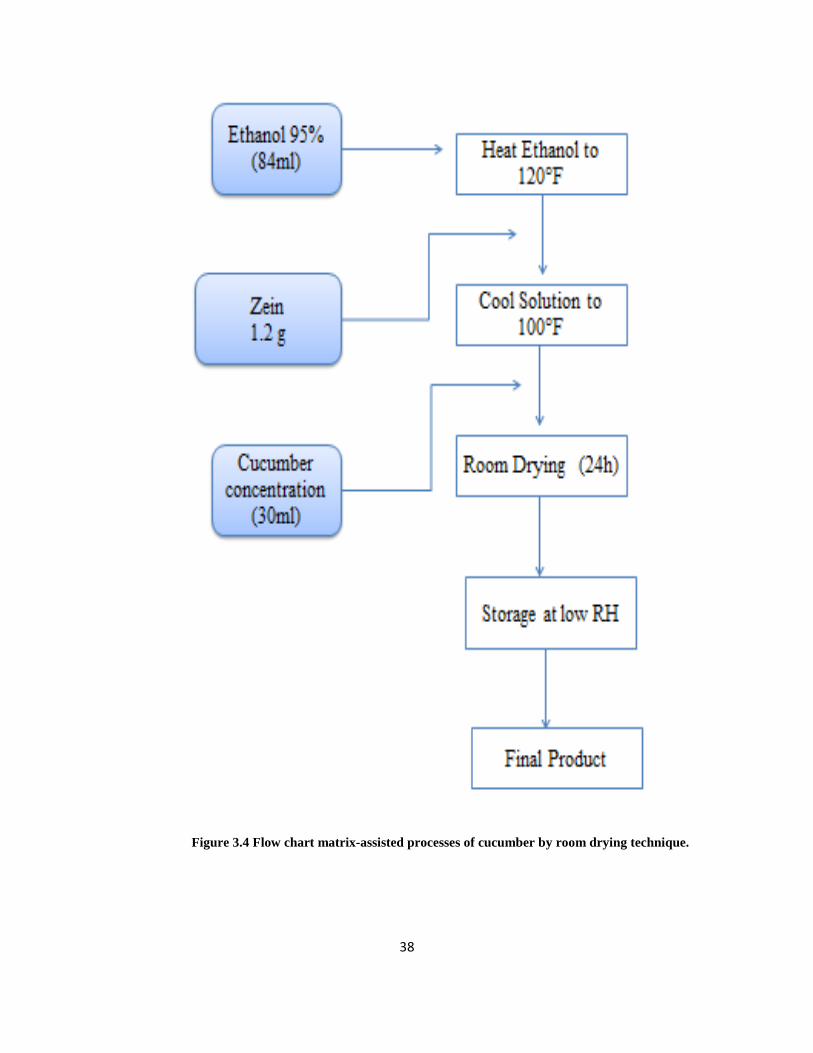
The concentration of cucumber extract used was 0.04 g zein: ml of cucumber extract.
Figure 3.4 outlines the process for matrix-assisted concentration of cucumber extract. 1.2 g of

32
zein was dissolved in 84 ml of 95% aqueous ethanol. The solution was heated at 52oC ± 3
oC
under constant stirring for 2 min to provide for the complete dissolution of zein. The solution
was cooled to 38oC and 30 ml of cucumber extract was added. This new solution was stirred
constantly for 3 min. Solution aliquots of 10 ml were placed on aluminum dishes in a chamber
with constant air flow to allow for the evaporation-induced self-assembly of encapsulated
structures.
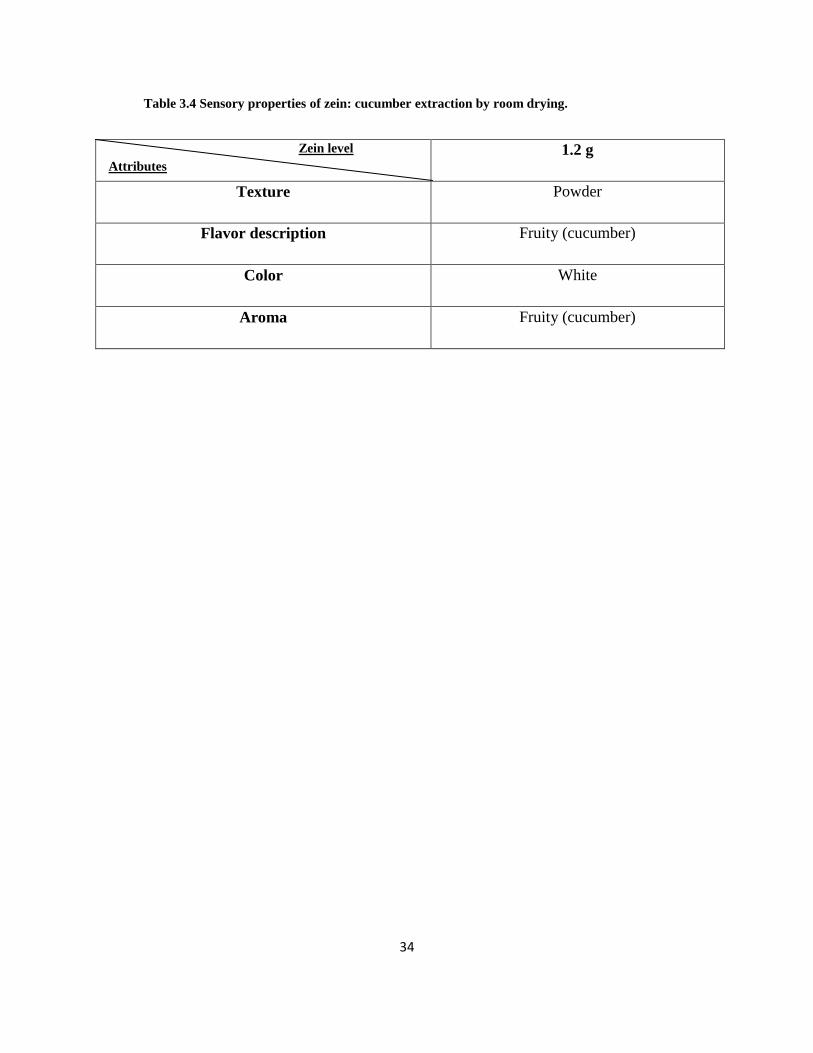
Sensory description of the zein: cucumber extract encapsulated product is shown on
Table 3.4 Sample texture was described as a free flowing powder (similar to wheat flour). The
powder color was white. The flavor and aroma resembled that of the cucumber fruit.
3.4 Conclusions
A matrix-assisted concentration and microencapsulation process was developed in this
work using zein as an encapsulating material.
As the ratio of zein to lime juice increased the texture of the lime juice powder changed
from a gummy and sticky sample to free flowing powder or flake. Lime juice retained more of
its fresh and authentic flavor as the ratio of zein to lime juice was increased. A ratio of 1.2 g
zein: 30 ml lime juice was selected for its better texture, color and flavor.
Two freeze drying methods were comparing in order to improve sample flavor and
texture. Slow freeze drying lime juice powders were less flowing as compared to lime juice
powders obtained by freeze drying. With respect to flavor fast freeze drying rendered a lime
juice powder with a more authentic sensory characteristics than lime juice powder obtained by
slow freeze drying.

33
3.5 Tables and figures
Table 3.1 - Sensory properties of four different concentrations of zein: lime juice by room drying.
Zein level 0.15 g 0.30 g 0.60 g 1.20 g
Texture Gummy Glass Flake Crystal
Flavor description Sharp Acid Acid Fruity
Color Green Green Yellow Yellow/white
Table 3.2- Sensory properties of two concentrations of zein: lime juice by slow freeze drying.
Zein level 0.6 g 1.2 g
Texture Gummy/ glass Flakes
Flavor description Sharp/Acid Acid/Fruity
Color Yellow Green
Table 3.3- Sensory properties of two concentrations of zein: lime juice by fast freeze drying.
Zein level 0.6 g 1.2 g
Texture Flake/Gummy Gummy/Powder/Foamy
Flavor description Acid/fruity Fruity
Color Green/Yellow Yellow/White
Attribute
s
Attribute
s
Attributes
34
Table 3.4 Sensory properties of zein: cucumber extraction by room drying.
Zein level 1.2 g
Texture Powder
Flavor description Fruity (cucumber)
Color White
Aroma Fruity (cucumber)
Attributes

35
Figure 3.1 Flow chart matrix- assisted process by room drying technique.

36
Figure 3.2 Flow chart matrix- assisted process by slow freeze drying technique.

37
Figure 3.3 Flow chart matrix-assisted processes by fast freeze drying technique.
38
Figure 3.4 Flow chart matrix-assisted processes of cucumber by room drying technique.

39
CHAPTER IV
MICROSTRUCTURE CHARACTERIZATION OF
ENCAPSULATED SYSTEMS
4.1 Introduction
In order to examine sample surface topography, this research required the use and
application of three different characterization methods.
The Scanning Electron Microscope (SEM) is a typical method used for characterization of
microstructure morphology. This microscope uses electrons to illuminate samples which allow it
to create magnified images. Electrons used by SEM interact with the atoms at the sample
surface. They create signals during these interactions which send information about the
morphology and composition of the sample to a reader. The quality and good resolution of the
SEM is mainly due to the Secondary Electron Imaging (SEI) which is a common detection SEM
mode. It is SEI that allows SEM to obtain small details from around 1-5 nm size (Wang 2008).
Metallic coatings are applied to the samples to increase surface conductivity and avoid charging
while SEM is operating and improve image resolution.
The apotome microscope is a bright field microscope and uses a spaced grid to work as a
mask in the aperture plane, in which the specimen is illuminated. The grid uses the epi-
illuminator lens system to project a shadow of the grid lines into the sharp focus. If samples are
thick, around 10 micrometers in size, the superimposed image on the focal plane gives composite

40
blurred images. This usually happens in the parts of the sample located in a remote place; with
respect to the focus point. In this case, three different images are taken and gathered; the final
image contains images from both the in focus plane and blurred planes. This final image is
available instantly (Gines and Davidso 2010).
The confocal microscope is used to analyze the topography of polymers surfaces, shapes
and dimensions of fibers and in biochemical research. Since it is a fluorescence microscope, it
can detect up to four color signals per frame. The microscope can then separate the fluorescence
signals by using the variable secondary dichroic (VSD) beam splitter. The fluorescence emission
passes through a pinhole and is reflected in a diffraction grating surface by using a dichromatic
mirror. The spectra are projected into a photomulplier (Gines and Davidson 2010) where they are
projected.
The objective of this experiment was to characterize the microstructure of the matrix-
assisted concentrated and microencapsulated lime juice.
4.2 Materials and methods
4.2.1 Materials
Rectangular cover glasses No. 1 with dimensions 22x30 mm and No. 1 24x50 mm were
purchased from Corning Incorporated (Corning, NY). Samples to be analyzed are described in
Chapter III. Alexa Fluor 555 hydazide dye was bought from Invitrogen Molecular ProbesTM
(Van Allen Way Carlsbad, CA).

41
4.2.2 Scanning Electron Microscope (SEM)
Powder samples were prepared by a matrix-assisted concentration and
microencapsulation process using three techniques (air drying, fast freeze drying and slow freeze
drying), as previously described in Chapter III. The samples were vacuum coated by evaporation
of gold (300 À) for increased conductivity using an Edward S 150 B sputter coater. Coated
samples were set in a sampler holder, which was placed in the vacuum chamber of the SEM. The
SEM was operated at an accelerating voltage between 15-20 kV. Cross sections of sample were
scanned and photographed by SEM (JEOL 6060LV, Tokyo, Japan). The SEM working distance
was of 8-20 mm for the observation to occur.
4.2.3 Apotome (Bright field Microscope)
A Zeiss Axiovert M200 (Carl Zeiss, Jana, Germany) was operated with a 20x
Planapochromat objective using dried films mounted between two cover glass slides. The black
and white images were acquired using an Axiocam (1388x1040 pixels).
4.2.4 Zeiss Confocal Microscope
Flakes from the matrix-assisted process sample of 1.2 g zein and 30 ml juice by freeze
drying were analyzed using Zeis Confocal Microscope (Zeiss LSM 700, Jana, Germany). In
order to identify if zein was encapsulating the active ingredient, Alexa Fluor 555 hydazide dye
was used to label zein and a second experiment was run by using the same dye to label the lime.
Both samples were examined and compared under the microscope. Flakes of samples
concentrated in aluminum dishes were placed in a 24x50 mm glass slide and protected using a

42
22x30 mm cover glass before being mounted in the microscope sample holder. Cross sections of
the sample were scanned and imaged using a 10x plan apochromat objective.
4.3 Results
4.3.1 SEM
The images in Figures 4.1-4.8 show the different morphology obtained from the matrix
assisted process by applying there different drying techniques. Samples in Figures 4.1-4.4 were
dried at room conditions. Zein and lime juice mass ratios used were from 0.15 - 1.2 g zein and 30
ml juice. The preparation process was described in Chapter III. In Figure 4.1, 0.15 g of zein and
30 ml of juice show a corrugated film surface. As mentioned in Chapter III, texture of this
sample was gummy and flavor description was sharp acid, which suggested that zein was not
properly encapsulating all compounds that characterize lime juice. From figure 4.2 to 4.4, images
show how structure is more defined as the concentration of zein increases. In figure 4.2, with 0.3
g zein and 30 ml juice, the surface of sample is smoother than the sample using 0.15 g zein,
which shows a sample fold as a big cluster. While flavor showed improvement, the sample did
not flow as expected. Samples with 0.6-1.2 g zein, did not shown differences, between the two
samples. They both had flaky and flowing sample as a final product. However, flavor from 1.2 g
zein resembled the flavor of fresh lime juice.
In order to improve the release ratio of the sample and to identify which of the two
samples ( 0.6 and 1.2 g zein) were better in comparison with commercially available samples
(Chapter V), these two concentrations where processed in two different freeze dryers: a slow
freeze dryer and fast freeze dryer. Figures 4.5 and 4.6 show how samples changed from flakes at

43
room temperature less sharp flakes by applying slow freeze drying. In images 4.7 and 4.8,
samples changed from flaky to more “crystal”-like, as expected. Release rate of slow freeze
drying is higher than fast freeze drying, due to the formation of higher pore size in slow freeze
drying than fast freeze drying (Kuang and others 2010). Since a slow and graduate release was
desirable, the slow freeze drying process was discarded as a potential process for matrix-assisted
concentration. The sample concentration of 1.2 g zein and 30 ml juice dried using the fast freeze
drying resulted in a sample with a flavor more similar to lime juice and a texture described as a
free flowing “crystal”. This formulation was chosen for further structure analysis, as well as
sensory analysis.
4.3.2 Bright field Microscope
Due to the structure characteristics of the powder sample, further examination was
performed to observe the structure of the surface of the sample. This allowed for characterization
of the final product chosen to use in the sensory analysis. In Figure 4.9, as the magnification of
the images increase, it was noted that dark “bubbles” had formed. The size of this “bubbles”
ranged from 2μm to ~10μm. These dark structures were uniformly dispersed across the entire
sample.
The same approach was used for the cucumber sample. In Figure 4.10, an increase in
magnification showed images of small dark “bubbles”. Agglomerations of dark “bubbles” are
uniformly present in the entire sample. Due to the fact that the composition of cucumber is less
complex than that of lime juice which contents oils, citric acid, sugars among other components.
Thus, the acquisition of a high quality and consistent images was difficult. Also, a concentrate
and not a cucumber juice was used.

44
In order to prove if flavor was encapsulated by zein, a fluorescent microscope was
applied. This process is explained later in this chapter.
4.3.3 Confocal Laser Scanning Microscope
In order to conclude than zein was encapsulating lime juice; Alexa Fluor 555 hydazide
dye was first applied to zein and analyzed using a Zeis confocal microscope. As mention before
the confocal microscope obtain three different images of the same sample: one image is the
fluorescence image, one is the bright field image and the last one is the combination of both. In
figure 4.11- 4.12, images show a change in structure. Compared to the structure obtained using
the apotome microscope, the black bubbles typically found earlier were no longer present in the
sample. Conversely, in Figures 4.13-4.14, when dye was added to the lime, before mixing zein
/alcohol solution, a structure similar to the structure previously obtained by apotome microscope
was seen. Alexa was used to label proteins due to its stability to photobleaching or conversion to
the triplet states (Panchuk-Voloshina and others 1999 ; Chen and others 2010). Therefore, in
images 4.11-4.12, since the dye is attached to the protein, we assume that zein did not
encapsulate the lime juice. Rather it seemed that the dye itself was encapsulated. This explains
why not only the structure but also the texture is different than previous samples without using
dyes. Alternatively, when the dye labeled the lime, once mixed with the zein, encapsulation of
both lime and dye may have occurred. Thus we can assume zein does encapsulate the
concentrated lime juice.
More studies, using two different dyes, and analysis not only of zein-lime encapsulation
but cucumber should be done in order to determine the morphology of encapsulated systems.

45
4.4 Conclusions
SEM was used to examine the structure of powdered samples. Images indicated that both
the ratio of zein to lime juice and the drying method affected the microstructure of lime juice
powders.
As the ratio of zein to lime juice increased a more defined structure was obtained. Lime
juice powders with low ratio of zein to lime juice tended to form aggregates. However as the
ratio of zein to lime juice increased lime juice tended to form flakes.
With respect to the drying process, fast freeze drying formed flakes as compared to slow
freeze drying lime juice which formed aggregates.
The brightfield microscope was also used to examine film samples with ratio of 1.2 g
zein: 30 ml lime juice and cucumber samples with ratio of 1.2 g zein: 30 ml cucumber extract.
Lime juice films showed formation of lime juice droplets uniformly dispersed across the sample.
With respect to the cucumber samples, images show aggregates of cucumber extract droplets
across the entire field.
The confocal microsocope was used to examine the surface of samples that formed films
as opposed to powders. Images revealed that when Alexa dye was used to label the zein, lime
juice structure produced the droplets as the previously observed by brightfield microscope. Thus,
it was assumed that zein does encapsulate the lime juice, but further studies using different
markers and encapsulating ingredients should be performed.

46
4.5 Figures
Fig. 4.1 SEM images showing structure for Matrix assisted sample (0.15 g zein and 30 ml lime juice)
prepared by room drying.

47
Fig. 4.2 SEM images showing structure of matrix assisted sample (0.3 g zein and 30 ml lime juice)
prepared by room drying.

48
Fig. 4.3 SEM images showing structure of matrix assisted sample (0.6 g zein and 30 ml lime juice)
prepared by room drying.

49
Fig. 4.4 SEM images showing structure of matrix assisted sample (1.2 g zein and 30 ml lime juice)
prepared by room drying.

50
Fig. 4.5 SEM images showing structure of matrix assisted sample (0.6 g zein and 30 ml lime juice)
prepared by slow freeze drying.

51
Fig. 4.6 SEM images showing structure of matrix assisted sample (1.2 g zein and 30 ml lime juice) by
slow freeze drying.

52
Fig. 4.7 SEM images showing structure of matrix assisted sample (0.6 g zein and 30 ml lime juice)
prepared by fast freeze drying.

53
Fig. 4.8 SEM images showing structure of matrix assisted sample (1.2 g zein and 30 ml lime juice)
prepared by fast freeze drying.

54
Fig. 4.9 Apotome images showing structure of matrix assisted sample (1.2 g zein and 30 ml lime juice)
prepared by fast freeze drying.

55
Fig. 4.10 Apotome images showing structure of matrix assisted sample (1.2 g zein and 30 ml
cucumber concentrate) prepared by fast freeze drying.
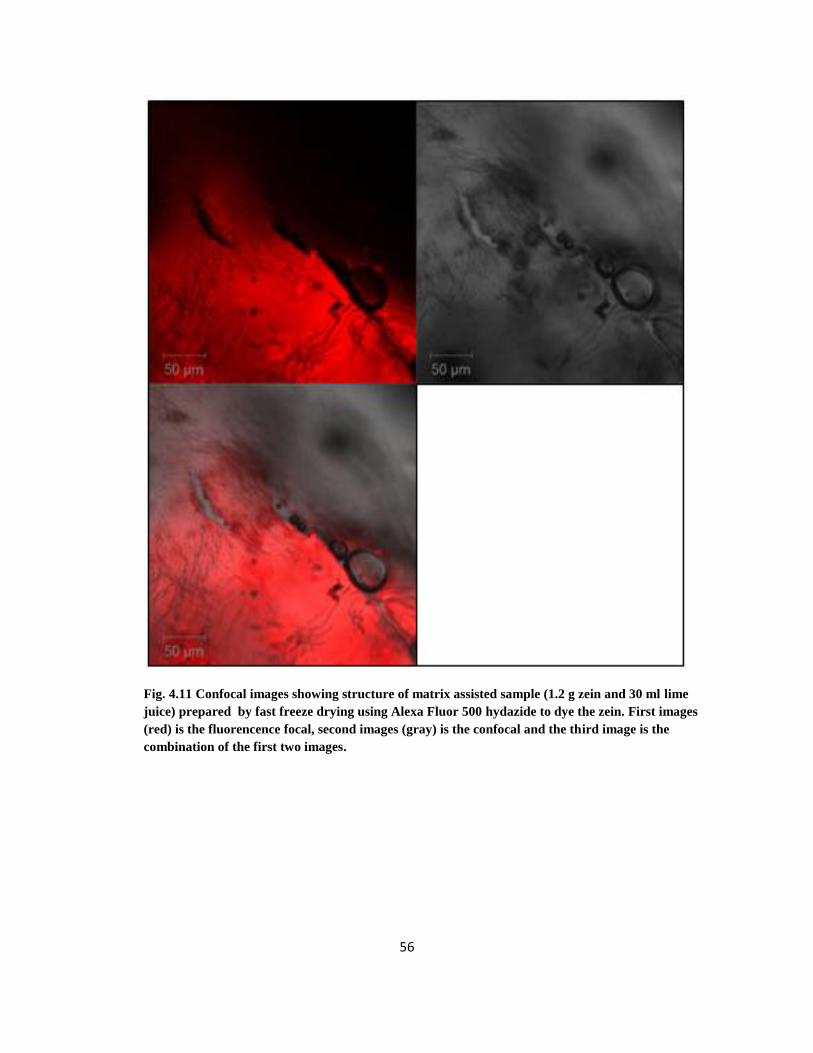
56
Fig. 4.11 Confocal images showing structure of matrix assisted sample (1.2 g zein and 30 ml lime
juice) prepared by fast freeze drying using Alexa Fluor 500 hydazide to dye the zein. First images
(red) is the fluorencence focal, second images (gray) is the confocal and the third image is the
combination of the first two images.

57
Fig. 4.12 Confocal images showing structure of matrix assisted sample (1.2 g zein and 30 ml lime
juice) prepared by fast freeze drying using Alexa Fluor 500 hydazide to dye the zein. First images
(red) is the fluorencence focal, second images (gray) is the confocal and the third image is the
combination of the first two images.
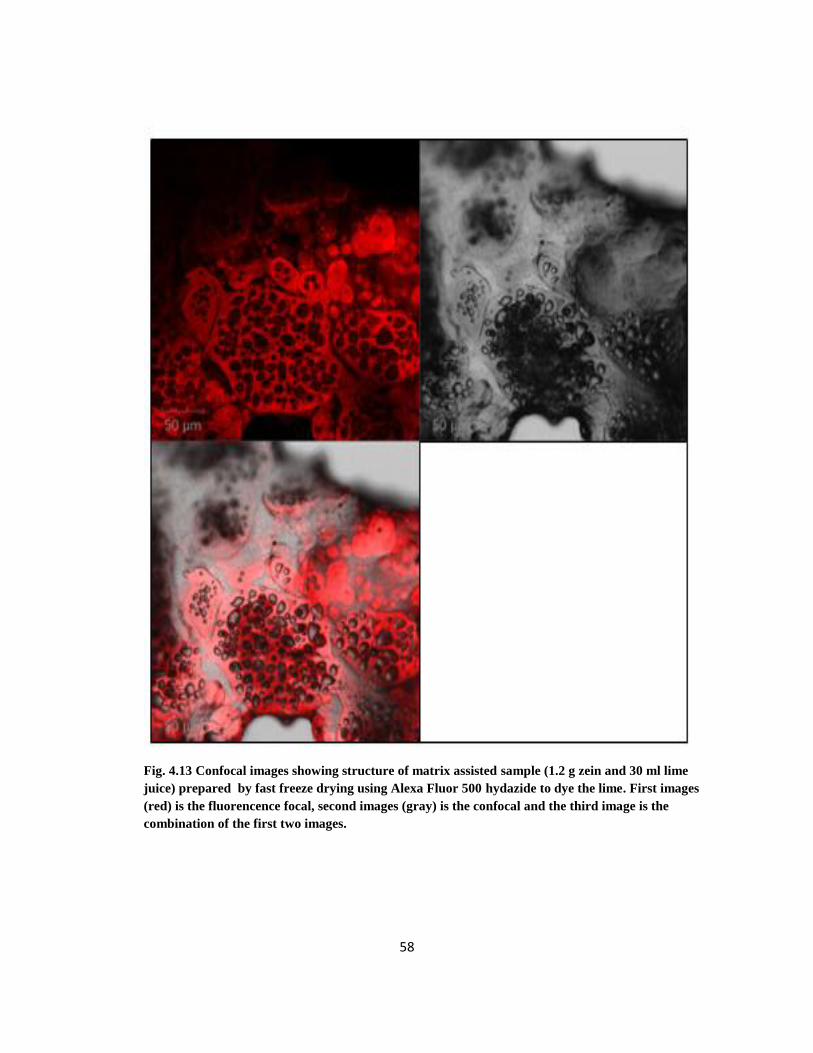
58
Fig. 4.13 Confocal images showing structure of matrix assisted sample (1.2 g zein and 30 ml lime
juice) prepared by fast freeze drying using Alexa Fluor 500 hydazide to dye the lime. First images
(red) is the fluorencence focal, second images (gray) is the confocal and the third image is the
combination of the first two images.

59
Fig. 4.14 Confocal images showing structure of matrix assisted sample (1.2 g zein and 30 ml lime
juice) prepared by fast freeze drying using Alexa Fluor 500 hydazide to dye the lime. First images
(red) is the fluorencence focal, second images (gray) is the confocal and the third image is the
combination of the first two images

60
CHAPTER V
SENSORY EVALUATION
5.1 Introduction
Sensory evaluation is described as a scientific method used to measure, evaluate, and
interpret those responses to products as perceived through the five basic senses (Stone and Sidel
2003). There are three methods of testing sensory evaluation: descriptive analysis, discriminatory
testing, and consumer tests. Descriptive analysis is one of the most useful tools in sensory
analysis. “Descriptive analysis is a sensory methodology that provides quantitative word
descriptions of products based on perceptions verbalized by a group of qualified subjects” (Stone
andd Sidel 2003). Panelists can evaluate a product on all perceived sensations: visual, auditory,
gustatory, and olfactory. Currently, descriptive analysis stands as the most comprehensive and
useful sensory methodology, providing detailed information on all sensory properties of the
product. Depending on the objectives of the analysis, panelists could be trained in order to focus
on a single modality while ignoring attributes of other modalities.
There are several different methods of descriptive analysis. However, the most
widespread and available ones are Quantitative Descriptive Analysis, and Spectrum (Stone and
Sidel 2003). As mentioned above, all descriptive analysis requires panelists with some degree of
training. In order to achieve success in descriptive analysis, it is important to account for the
commitment and motivation of the panelist. If a panelist is not able to attend every training
session, the panelist should be removed from the analysis. This is due to the fact that the training
61
will present the information necessary to understand the need and importance of the analysis. In
order to perform well, panelists are asked not to smoke or eat for at least an hour before each
training session or sample analysis, as the taste in their mouth can affect the panelists
discriminative ability.
The training step of descriptive sensory analysis starts with the development of common
vocabulary that will comprehensively and accurately describe the products attributes. It is
usually developed by the panelists with the guidance of a panel leader. In the end, the selection
of the descriptors is developed through consensus (Murray and others 2001). Several authors
recommended the use of reference standards to provide orientation to the sensory panel (Murray
and Delahunty 2000). A reference standard may be any chemical, ingredient, product, even
nonfood related material, which elicits a specific sensory stimulus. The training and the use of
reference standards improves the performance of the descriptive panel.
Once the panel is trained, their job is to provide an intensity rating for each attribute. This
is done in order to reflect the perceived intensity of that characteristic in the product (Lawless
1999). Statistical analysis is applied to detect the differences among various products for a
specific characteristic of interest, as well as determine variability among the panelists and
variability of the panelists among the sessions they attend. In order to evaluate the panel
performances, different statistical analyses can be applied: The Analysis of Variance (ANOVA),
Multivariate techniques as Principal Components Analysis, Procrustes Analysis, Clusters
Analysis or Partial Least Squares Regression are common among others.

62
Since its early application sensory descriptive analysis has been used in food research;
however, there is very little documentation available on citrus juices (Civille and Lyon 1996),
and even less literature available for lime (Kappes and others 2006).
Since the results of the sensory descriptive analysis are used to support product market
decisions, companies‟ interest and application of sensory tests is increasing. As a methodology, it
is one of the most sophisticated sources of product information due to its ability to provide a
complete and quantitative sensory description of a product. This information is equally, if not
more, important as the chemical, microbiological, nutritional and biological information of a
product (Stone and Sidel 2003).
The objective of this experiment was to analyze whether the matrix-assisted
concentration and encapsulation process to obtain dry lime juice represents an improvement over
commercially available dry lime juice products.
5.2 Materials and Methods.
5.2.1 Materials
Lime (Mexico) and ay‟s classic potato chips (El Plano, Texas) where purchase from a
local store. Two commercial dry lime juice products were obtained from Firmenich, Inc.
(Plainsboro NJ). A sample of matrix-assisted dry lime juice prepared in the laboratory as
described in chapter III. ime juice “crystals” were applied to potato chips which were then
ground using an electric coffee mill. The samples used for sensory testing were: 1) dry lime juice
from "matrix-assisted process" (6% wt/wt), 2) dry lime juice from conventional process (high

63
acid content) (6% wt/wt), 3) dry lime juice from conventional process (low acid content) (6%
wt/wt), 4) fresh lime juice applied to potato chips (10% wt/wt), then allowed to dry.
5.2.2 Methods
Twelve individuals (4 males and 8 females, with an age range between 19-24), all
University of Illinois students, were recruited from the Champaign-Urbana area to participate on
a descriptive analysis panel. Under the guidance of the panel leader, the panel characterized the
flavor of samples prepared by four different processes. Crushed chips were presented to the
panel under incandescent light at room temperature (20C) and 30% RH. The initial flavor
characteristics, as determined by the panel, were fresh lime flavor, sweet, sour, bitter and
astringent. The panel was then presented with substances which characterized those flavors. For
sweet, a sucrose solution was used; for sour, a citric acid solution; for bitter, a caffeine solution
was used, for astringent, a solution of tannin was used (Table 5.1.). A solution of fresh squeezed
lime juice was used as the control in order to evaluate how representative the matrix-assisted
product ranked in comparison to the lime fruit in terms of authenticity of flavor. Each reference
was prepared on a weight by volume basis, using distilled water. Panelists revised the flavor
characteristics deleting „sweet‟ and including „synthetic lime‟, as represented by citral from
Sigma Aldrich® (St. Louis, MO). Panelists then established concentrations for which the
standards could be used as anchors for the identified taste attributes (Table 5.1). They were
trained to evaluate products using these standards on a seven-point (7 inch) semi-structured line
scale to evaluate intensity (Appendix A). Panelists were trained during three 1-hr sessions.
Training was necessary to expose the panelists to the appropriate descriptors in order to
familiarize panelists with the specific attributes of interest in being analyzed. Training increased

64
the panelist ability to discriminate across various fields of flavor, increase flavor lexicon, and
have a better comprehension of the activities during the sample analysis.
For sample evaluation, crushed chip samples were coded with 3-digit random numbers,
randomized and presented at room temperature to panelists (Table 5.2). The panelists scored
each sample for each of five characteristics on the line scale relative to the reference for that
characteristic. Data was collected by measuring the distance from the 0 endpoint to the panelist‟s
mark in inches. In order to prevent fatigue, habituation or the halo effect (where one sample
attribute overshadow another), panelists were provided with distilled water and unsalted soda
crackers to cleanse the palate between samples. Sample evaluation was performed in one day,
where each panelist evaluated each sample three times with a 5 min rest period between sets.
5.2.2.1 Statistical analysis
Data were subjected to Analysis of Variance for panelists by treatment interactions.
Based on performance of each individual panelist, data from three panelists were deleted in their
entirety based on lack of internal consistency among these panelists. Least squares means and
standard deviations were calculated using the data from the nine remaining panelists. Means for
characteristics that differed due to treatment were separated using Fisher‟s Protected SD values.
5.3 Results
Means and standard deviations for the sensory characteristics of the four products
(matrix-assisted process, high-acid commercial process, low-acid commercial process, and
potato chips with fresh lime juice) are shown in Table 5.3 and Figure 5.1. The matrix-assisted
process had the most intense lime flavor of all the treatments. It was also the most similar to the

65
synthetic lime flavor (citral); however, the high- and low-acid commercial products were not
statistically different. The matrix-assisted product was significantly sourer than either of the
commercial treatments. It did not differ in bitter or astringent flavors from the high-acid
commercial product.
5.4 Conclusions
If we consider that both types of lime flavor (fresh on a potato chip and citral) and sour
flavor are the desirable flavor characteristics for a lime product and bitter and astringent are
undesirable characteristics, it appears from this data, that the matrix-assisted product is an
improvement over the high- and low-acid commercial products in terms of lime flavor, without
the often-associated bitterness and astringency.
5.5 Tables and figures
Table 5.1-Standards and scale values used for sensory evaluation.
Characteristic Standard Scale value
Fresh lime Fresh lime juice (30% v/v in water) 5.0
Sweet 10% sucrose Deleted
Synthetic lime 0.1% citral 3.3
Sour 0.1% citric acid solution 4.3
Bitter 0.02% caffeine solution 3.3
Astringent 0.02% tannin solution 3.3

66
Table 5.2- Samples codes used for sensory evaluation
Sample Codes
Fresh lime juice 856,542,892
Commercial dried lime juice (high acid content) 558,962,452
Commercial dried lime juice (low acid content) 658,746,345
Dry lime juice from matrix-assisted concentration process 241,686,212
Table 5.3 -Means and standard deviations for sensory characteristics of dry lime products on potato
chips
Treatment
Sensory characteristic
Fresh
Lime
Flavor
Synthetic
Lime Flavor
Sour
Flavor
Bitter
Flavor Astringent
Flavor
Matrix 7.8 ± 1.7 a 5.8 ± 1.0
a 8.9 ± 1.6
a 4.6 ± 1.6
a 4.7 ± 1.5
a
High Acid 6.4 ± 1.9 b 4.6 ± 1.3
b 6.8 ± 1.9
b 4.2 ± 1.7
a 4.5 ± 1.1
ab
Low Acid 4.6 ± 1.4 c 3.8 ± 1.1
b 4.3 ± 1.6
c 3.6 ± 1.4
a 3.7 ± 1.0
b
Fresh 2.0 ± 0.6 d 1.7 ± 0.6
c 1.9 ± 0.7
d 1.7 ± 0.6
b 2.3 ± 0.7
c
a,b,c,d
Means in a column with like superscript letters do not differ

67
Figure 5.1-Sensory characteristics of dry lime products on potato chips

68
REFERENCES
Abdelwahed W, Degobert G, Stainmesse S, Fessi H. 2006. Freeze-drying of nanoparticles:
Formulation, process and storage considerations. Adv.Drug Deliv.Rev. 58(15):1688-713.
Anal AK, Singh H. 2007. Recent advances in microencapsulation of probiotics for industrial
applications and targeted delivery. Trends in Food Science and Technology 18(5):240-51.
Argos P, Pedersen K, Marks MD, Larkins BA. 1982. A structural model for maize zein proteins.
J.Biol.Chem. 257(17):9984-90.
Augustin MA, Hemar Y. 2009. Nano- and micro-structured assemblies for encapsulation of food
ingredients. Chem.Soc.Rev. 38(4):902-12.
Avalle N, inventor; . Italiana Intercos, assignee. 1998 12/09/1998. Cosmetic powders coated with
natural ingredients. U.S. patent EP 882443.
Becker BR, Fricke BA. 1999. Freezing times of regularly shaped food items. Int.Commun.Heat
Mass Transfer 26(5):617-26.
Bhandari BR, Datta N, Howes T. 1997. Problems associated with spray drying of sugar-rich
foods. Drying Technol 15(2):671-84.
Bimbenet, J. J., Bonazzi, C., Dumoulin, E. 2002. Drying of foodstuffs. 64.
Bozdag S, Dillen K, Vandervoort J, Ludwig A. 2005. The effect of freeze-drying with different
cryoprotectants and gamma-irradiation sterilization on the characteristics of ciprofloxacin

69
HCl-loaded poly(D,L-lactide-glycolide) nanoparticles. J.Pharm.Pharmacol. 57(6):699-
707.
Brinker CJ, Lu Y, Sellinger A, Fan H. 1999. Evaporation-induced self-assembly: Nanostructures
made easy. Adv Mater 11(7):579-85.
Brinker CJ. 2004. Evaporation-induced self-assembly: Functional nanostructures made easy.
MRS Bull 29(9):631-40.
Brownlie K. 2007. Marketing perspective of encapsulation technologies in food applications. In:
J. M. Lakkis, editor. Encapsulation and controlled release technologies in food systems.
Illustrated ed. Ames,Iowa: John Wiley and Sons. p 213-4.
Buffo RA, Reineccius GA. 2001. Comparison of drying processes for the encapsulation of
flavors. Abstr.Pap.Am.Chem.Soc. 221129-AGFD.
Byun M, Laskowski RL, He M, Qiu F, Jeffries-El M, Lin Z. 2009. Controlled evaporative self-
assembly of hierarchically structured regioregular conjugated polymers. Soft Matter
5(8):1583-6.
Cano-Chauca M, Stringheta PC, Sardagna LD, and Cal-Vidal J. 2004. MANGO JUICE
DEHYDRATION SPRAY DRYING USING DIFFERENT CARRIERS AND
FUNCTIONAL CHARACTERIZATION. C2005.
Carter BA. 1993. Lemon and lime juices. In: Steven Nagy, Chin Shu Chen, Philip E. Shaw,
editor. Fruit juice processing technology. Illustrated ed. Agscience.

70
Chen H, Ahsan SS, Santiago-Berrios MB, Abruña HD, Webb WW. 2010. Mechanisms of
quenching of alexa fluorophores by natural amino acids. J.Am.Chem.Soc. 132(21):7244-
5.
Chua KJ, Chou SK. 2003. Low-cost drying methods for developing countries. Trends in Food
Science and Technology 14(12):519-28.
Civille GV, Lyon BG. 1996. Aroma and flavor lexicon for sensory evaluation: terms, definitions,
references, and examples, Volume 1. Illustrated ed. PA,USA: ASTM. 158 p.
Copley MJ, Arsdel WBV. 1973. Food dehydration: Practices and applications. 2nd ed. Westport,
Connecticut: AVI. 529 p.
Dalgleish JM. 1990. Freeze-drying for the food industries. Illustrated ed. London and New York
and New York, NY, USA: Elsevier Applied Science.
De Roos KB. 2000. Physicochemical models of flovor release from foods. In: D. D. Roberts, A.
J. Taylor, editors. Flavor release. braille, Illustrated ed. Washington,DC: American
Chemical Society. p 126-41.
Dennison BA, Rockwell HL, Baker SL. 1998. Fruit and vegetable intake in young children.
J.Am.Coll.Nutr. 17(4):371-8.
Desai KGH, Park HJ. 2005. Recent developments in microencapsulation of food ingredients.
Drying Technol 23(7):1361-94.

71
Desobry SA, Netto FM, Labuza TP. 1997. Comparison of spray-drying, drum-drying and freeze-
drying for β-carotene encapsulation and preservation. J.Food Sci. 62(6):1158-62.
Franks F. 1992. Freeze-drying: from empiricism to predictability. The significance of glass
transitions. Dev.Biol.Stand. 749,18; discussion 19.
Franks F. 1998. Freeze-drying of bioproducts: Putting principles into practice. European Journal
of Pharmaceutics and Biopharmaceutics 45(3):221-9.
Gharsallaoui A, Roudaut G, Chambin O, Voilley A, Saurel R. 2007. Applications of spray-
drying in microencapsulation of food ingredients: An overview. Food Res.Int.
40(9):1107-21.
Ghosh SK. 2006. Functional coatings: by polymer microencapsulation. Illustrated ed. Germany:
Wiley-VCH. 357 p.
Gianazza E, Viglienghi V, Righetti PG, Salamini F, Soave C. 1977. Amino acid composition of
zein molecular components. Phytochemistry 16(3):315-7.
Gibbs BF, Kermasha S, Alli I, Mulligan CN. 1999. Encapsulation in the food industry: A review.
Int.J.Food Sci.Nutr. 50(3):213-24.
Gines TB, Davidso MW. 2010. ApoTome Operation. 2011(04/18):1.
Gines TB, Davidson MW. 2010. LSM 700 Light Pathways in Spectral Imaging. 2011(13/18):1.

72
Gouin S. 2004. Microencapsulation: Industrial appraisal of existing technologies and trends.
Trends in Food Science and Technology 15(7-8):330-47.
Goula AM, Adamopoulos KG. 2010. A new technique for spray drying orange juice concentrate.
Innovative Food Science and Emerging Technologies 11(2):342-51.
Govor LV, Parisi J, Bauer GH, Reiter G. 2009. Self-assembled patterns from evaporating layered
fluids. Journal of Physics Condensed Matter 21(26):
Grosso D, Cagnol F, Soler-Illia GJDAA, Crepaldi EL, Amenitsch H, Brunet-Bruneau A,
Bourgeois A, Sanchez C. 2004. Fundamentals of mesostructuring through evaporation-
induced self-assembly. Advanced Functional Materials 14(4):309-22.
Hamaker BR, Mohamed AA, Habben JE, Huang CP, Larkins BA. 1995. Efficient procedure for
extracting maize and sorghum kernel proteins reveals higher prolamin contents than the
conventional method. Cereal Chem. 72(6):583-8.
Heinrich S, Mörl L. 1999. Description of the temperature, humidity and concentration
distribution in gas-liquid-solid fluidised beds. International Journal of Thermal Sciences
38(2):142-7.
Heinzen C. 2002. Microencapsulation solve time dependent problems for foodmakers. European
Food and Drink Review 327-30.
Heldman DR, Lund DB. 2007. Handbook of food engineering. 2, illustrated ed. New York,USA:
CRC Press. 1023 p.

73
Hurtado- pez P, Murdan S. 2006. Zein microspheres as drug/antigen carriers: A study of their
degradation and erosion, in the presence and absence of enzymes. J.Microencapsul.
23(3):303-14.
Kappes SM, Schmidt SJ, Lee S-. 2006. Descriptive analysis of cola and lemon/lime carbonated
beverages. J.Food Sci. 71(8):S583-9.
Karel M, Lund DB. 2003. Physical principles of food preservation. 2, Illustrated, revised ed.
New York,USA: CRC Press. 603 p.
King AH. 1995. Encapsulation of Food Ingredients: A Review of Available Technology,
Focusing on Hydrocolloids. In: S. J. Risch, G. Reineccius, American Chemical Society.
Division of Agricultural and Food Chemistry, editors. Encapsulation and controlled
release of food ingredients. Illustrated ed. Washington,DC: American Chemical Society.
p 26-39.
Konan YN, Gurny R, Allémann E. 2002. Preparation and characterization of sterile and freeze-
dried sub-200 nm nanoparticles. Int.J.Pharm. 233(1-2):239-52.
Kuang SS, Oliveira JC, Crean AM. 2010. Microencapsulation as a tool for incorporating
bioactive ingredients into food. Crit.Rev.Food Sci.Nutr. 50(10):951-68.
Kumar P. 2010. Directed self-assembly: Expectations and achievements. Nanoscale Research
Letters 5(9):1367-76.

74
Lai H-, Padua GW, Wei LS. 1997. Properties and microstructure of zein sheets plasticized with
palmitic and stearic acids. Cereal Chem. 74(1):83-90.
Lakkis JM. 2007. Encapsulation and controlled release technologies in food systems. Illustrated
ed. John Wiley and Sons. 239 p.
Landry J, Delhaye S, Damerval C. 2000. Improved method for isolating and quantitating α-
amino nitrogen as nonprotein, true protein, salt-soluble proteins, zeins, and true glutelins
in maize endosperm. Cereal Chem. 77(5):620-6.
Lawless HT, Heymann H. 2010. Descriptive Analysis. In: H. T. Lawless, H. Heymann, editors.
Sensory Evaluation of Food: Principles and Practices. 2, illustrated ed. New York,USA:
Springer. p 227-9.
Lawton JW. 2002. Zein: A history of processing and use. Cereal Chem. 79(1):1-18.
Liu X, Sun Q, Wang H, Zhang L, Wang J-. 2005. Microspheres of corn protein, zein, for an
ivermectin drug delivery system. Biomaterials 26(1):109-15.
Madene A, Jacquot M, Scher J, Desobry S. 2006. Flavour encapsulation and controlled release -
A review. International Journal of Food Science and Technology 41(1):1-21.
Maskan A, Kaya S, Maskan M. 2002. Hot air and sun drying of grape leather (pestil). J.Food
Eng. 54(1):81-8.
Masters K. 1991. Spray drying handbook. 5, illustrated ed. Longman Scientific & Technical. 725
p.

75
Matsushima N, Danno G-, Takezawa H, Izumi Y. 1997. Three-dimensional structure of maize α-
zein proteins studied by small-angle X-ray scattering. Biochimica et Biophysica Acta -
Protein Structure and Molecular Enzymology 1339(1):14-22.
McClements DJ. 2009. Structural Design Principles for Improved Food Performance:
Nanolaminated Biopolymer Structures in Foods. In: Q. Huang, P. Given, M. Qian,
editors. Micro/nanoencapsulation of active food ingredients. Illustrated ed.
Washington,DC: Oxford University Press. p 8-9.
McGowan BA, Padua GW, Lee S-. 2005. Formulation of corn zein chewing gum and evaluation
of sensory properties by the time-intensity method. J.Food Sci. 70(7):S475-81.
Minemoto Y, Adachi S, Matsuno R. 1997. Comparison of Oxidation of Methyl Linoleate
Encapsulated with Gum Arabic by Hot-Air-Drying and Freeze-Drying. J.Agric.Food
Chem. 45(12):4530-4.
Moßhammer MR, Stintzing FC, Carle R. 2006. Evaluation of different methods for the
production of juice concentrates and fruit powders from cactus pear. Innovative Food
Science and Emerging Technologies 7(4):275-87.
Murray JM, Delahunty CM, Baxter IA. 2001. Descriptive sensory analysis: Past, present and
future. Food Res.Int. 34(6):461-71.
Murray JM, Delahunty CM. 2000. Description of Cheddar cheese packaging attributes using an
agreed vocabulary. J.Sens.Stud. 15(2):201-18.

76
Panchuk-Voloshina N, Haugland RP, Bishop-Stewart J, Bhalgat MK, Millard PJ, Mao F, Leung
W-, Haugland RP. 1999. Alexa dyes, a series of new fluorescent dyes that yield
exceptionally bright, photostable conjugates. Journal of Histochemistry and
Cytochemistry 47(9):1179-88.
Parris N, Cooke PH, Hicks KB. 2005. Encapsulation of essential oils in zein nanospherical
particles. J.Agric.Food Chem. 53(12):4788-92.
Parris N, Dickey LC, Kurantz MJ, Moten RO, Craig JC. 1997. Water Vapor Permeability and
Solubility of Zein/Starch Hydrophilic Films Prepared from Dry Milled Corn Extract.
J.Food Eng. 32(2):199-207.
Parris Nicholas, Cooke Peter H., Moreau Robert A., Hicks Kevin B. 2008. Encapsulation of
Essential Oils in Zein Nanospherical Particles; New Delivery Systems for Controlled
Drug Release from Naturally Occurring Materials. 992
Pikal MJ, Shah S, Roy ML, Putman R. 1990. The secondary drying stage of freeze drying:
Drying kinetics as a function of temperature and chamber pressure. Int.J.Pharm.
60(3):203-17.
Pothakamury UR, Barbosa-Cánovas GV. 1995. Fundamental aspects of controlled release in
foods. Trends in Food Science and Technology 6(12):397-406.
Quispe-Condori S, Saldaña MDA, Temelli F. 2011. Microencapsulation of flax oil with zein
using spray and freeze drying. LWT - Food Science and Technology

77
Ratti C. 2001. Hot air and freeze-drying of high-value foods: A review. J.Food Eng. 49(4):311-9.
Ribeiro CPaPML. 2009. Innovation in Food Engineering: New Techniques and Products.
Illustrated ed. CRC Press. 721 p.
Risch SJ. 1995. Encapsulation: Overview of Uses and Techniques. In: S. J. Risch, G. Reineccius,
American Chemical Society. Division of Agricultural and Food Chemistry, editors.
Encapsulation and controlled release of food ingredients. Illustrated ed. Washington,DC:
American Chemical Society. p 2-7.
Rodríguez-Hernández GR, González-García R, Grajales-Lagunes A, Ruiz-Cabrera MA, Abud-
Archila M. 2005. Spray-drying of cactus pear juice (Opuntia streptacantha): Effect on the
physicochemical properties of powder and reconstituted product. Drying Technol
23(4):955-73.
Roustapour OR, Hosseinalipour M, Ghobadian B. 2006. An experimental investigation of lime
juice drying in a pilot plant spray dryer. Drying Technol 24(2):181-8.
Sabliov CM, Astete CE. 2008. Encapsulation and controlled release of antioxidants and vitamins.
In: N. Garti, editor. Delivery and controlled release of bioactives in foods and
nutraceuticals. Illustrated ed. New York,USA: CRC Press. p 297.
Sameti M, Bohr G, Ravi Kumar MNV, Kneuer C, Bakowsky U, Nacken M, Schmidt H, Lehr C-.
2003. Stabilisation by freeze-drying of cationically modified silica nanoparticles for gene
delivery. Int.J.Pharm. 266(1-2):51-60.

78
Sanguansri L, Augustin MA. 2007. Microencapsulation and delivery of omega-3 fatty acids. In:
J. Shi, editor. Functional food ingredients and nutraceuticals: processing technologies.
Illustrated ed. Boca Raton, FL, USA: CRC Press. p 297.
Sebhatu T, Angberg M, Ahlneck C. 1994. Assessment of the degree of disorder in crystalline
solids by isothermal microcalorimetry. Int.J.Pharm. 104(2):135-44.
Shahidi F, Han XQ. 1993. Encapsulation of food ingredients. Crit.Rev.Food Sci.Nutr. 33(6):501-
47.
Shukla R, Cheryan M. 2001. Zein: The industrial protein from corn. Industrial Crops and
Products 13(3):171-92.
Siepmann F, Muschert S, Flament MP, Leterme P, Gayot A, Siepmann J. 2006. Controlled drug
release from Gelucire-based matrix pellets: Experiment and theory. Int.J.Pharm.
317(2):136-43.
Sliwka W. 1975. Microencapsulation. Angewandte Chemie (International ed.in English)
14(8):539-50.
Smith CW, Betrán J, Runge EDC. 2004. Corn: origin, history, technology, and production.
Illustrated ed. John Wiley and Sons. 949 p.
Sparks RE, Jacobs, J.C. and Mason, N.S. 1995. Centrifugal suspension-separation for coating
food ingredients. In: S. J. Rish, G. A. Reineccius, editors. Encapsulation and controlled

79
release of food ingredients. Illustrated ed. Washington,DC: American Chemical Society.
p 87-9.
Stapelfeldt H, Meisen BR, Skibsted LH. 1997. Effect of heat treatment, water activity and
storage temperature on the oxidative stability of whole milk powder. Int.Dairy J.
7(5):331-9.
Stone H, Sidel JL. 2004. Descriptive Analysis. In: J. L. Sidel, editor. Sensory evaluation
practices. 3,illustrated ed. Redwood City, CA: Academic Press. p 202-4.
Subar AF, Krebs-Smith SM, Cook A, Kahle LL. 1998. Dietary sources of nutrients among US
1989 to 1991. J.Am.Diet.Assoc. 98(5):537-47.
Süheyla H. and Öner L. 2000. Microencapsulation using coacervation/Phase separation: An
overview of the technique and application. In: Donald Lee Wise, editor. Handbook of
pharmaceutical controlled release technology. Illustrated ed. CRC Press. p 301-4.
Tang X, Pikal MJ. 2004. Design of Freeze-Drying Processes for Pharmaceuticals: Practical
Advice. Pharm.Res. 21(2):191-200.
Trezza TA, Vergano PJ. 1994. Grease Resistance of Corn Zein Coated Paper. J.Food Sci.
59(4):912-5.
Vega-Mercado H, Marcela Góngora-Nieto M, Barbosa-Cánovas GV. 2001. Advances in
dehydration of foods. J.Food Eng. 49(4):271-89.

80
Versic RJ. 1988. Flavor encapsulation. In: S. J. Risch, G. Reineccius, American Chemical
Society. Division of Agricultural and Food Chemistry, editors. Flavor encapsulation.
Illustrated ed. Washington,DC: American Chemical Society. p 1.
Wang H-, Lin Z-, Liu X-, Sheng S-, Wang J-. 2005. Heparin-loaded zein microsphere film and
hemocompatibility. J.Controlled Release 105(1-2):120-31.
Wang Q, Yin L, Padua GW. 2008. Effect of hydrophilic and lipophilic compounds on zein
microstructures. Food Biophysics 3(2):174-81.
Wang Q. 2004. Investigation of protein-fatty acid interactions in zein films. [dissertation].
Urbana: University of Illinois at Urbana-Champaign. 7 p.
Wang Y, Padua GW. 2010. Formation of zein microphases in ethanol-water. Langmuir
26(15):12897-901.
Wang Y. 2008. DRYING OILS TREATED BY IRRADIATION AS COATINGS FOR
BIOBASED FILMS. [dissertation]. Urbana: University of Illinois at Urbana-Champaign.
13 p.
Watanabe Y, Fang X, Minemoto Y, Adachi S, Matsuno R. 2002. Suppressive effect of saturated
acyl L-ascorbate on the oxidation of linoleic acid encapsulated with maltodextrin or gum
arabic by spray-drying. J.Agric.Food Chem. 50(14):3984-7.
81
Williams Iii RO, Liu J. 2000. Influence of processing and curing conditions on beads coated with
an aqueous dispersion of cellulose acetate phthalate. European Journal of Pharmaceutics
and Biopharmaceutics 49(3):243-52.
Williams NA, Polli GP. 1984. The lyophilization of pharmaceuticals: A literature review. Journal
of Parenteral Science and Technology 38(2):48-60.
Zhang LaZ,M. 2008. Protein as Sources of Materials. In: M. N. Belgacem, A. Gandini, editors.
Monomers, polymers and composites from renewable resources. Illustrated ed.
Amsterdam: Elsevier. p 483.
Zhong Q, Tian H, Zivanovic S. 2009. Encapsulation of fish oil in solid zein particles by liquid-
liquid dispersion. J.Food Process.Preserv. 33(2):255-70.
Ziena HMS. 2000. Quality attributes of Bearss Seedless lime (Citrus latifolia Tan) juice during
storage. Food Chem. 71(2):167-72.
Zvaigzne G, Karklina D, Seglina D, Krasnova I. 2009. Antioxidants in various citrus fruit juices.
3(52):56-61.

82
APPENDIX A SENSORY CARD
Sample #_____________________ Panelist (initials) ________
Fresh lime flavor intensity
None Intense --+-----------------+-------------------+------------------↕-------------------+-------------------+-----------------+-- Lime (70% juice)
Synthetic lime flavor intensity
None Intense --+-----------------+-------------------+------------------↕-------------------+-------------------+-----------------+-- Citral
Sour flavor intensity
None Intense --+-----------------+-------------------+------------------↕-------------------+-------------------+-----------------+--
Standard Bitter flavor intensity
None Intense --+-----------------+-------------------+------------------↕-------------------+-------------------+-----------------+--
Standard
Astringent flavor intensity
None Intense --+-----------------+-------------------+------------------↕-------------------+-------------------+-----------------+--
Standard

83
APPENDIX B ADDITIONAL SEM IMAGES
Fig. B.1a. SEM images showing structure for Matrix assisted sample (0.15 g zein and 30 ml
lime juice) prepared by room drying.

84
Continuation- Appendix b.
Fig. B.1b. SEM images showing structure for Matrix assisted sample (0.15 g zein and 30 ml
lime juice) prepared by room drying.

85
Continuation- Appendix B.
Fig. B.1c. SEM images showing structure for Matrix assisted sample (0.15 g zein and 30 ml
lime juice) prepared by room drying.

86
Continuation- Appendix B.
Fig. B.1d. SEM images showing structure for Matrix assisted sample (0.15 g zein and 30 ml
lime juice) prepared by room drying.

87
Continuation- Appendix B.
Fig. B.1e. SEM images showing structure for Matrix assisted sample (0.15 g zein and 30 ml
lime juice) prepared by room drying.

88
Continuation- Appendix B.
Fig. B.1f. SEM images showing structure for Matrix assisted sample (0.30 g zein and 30 ml
lime juice) prepared by room drying.

89
Continuation- Appendix B.
Fig. B.1g. SEM images showing structure for Matrix assisted sample (0.30 g zein and 30 ml
lime juice) prepared by room drying.
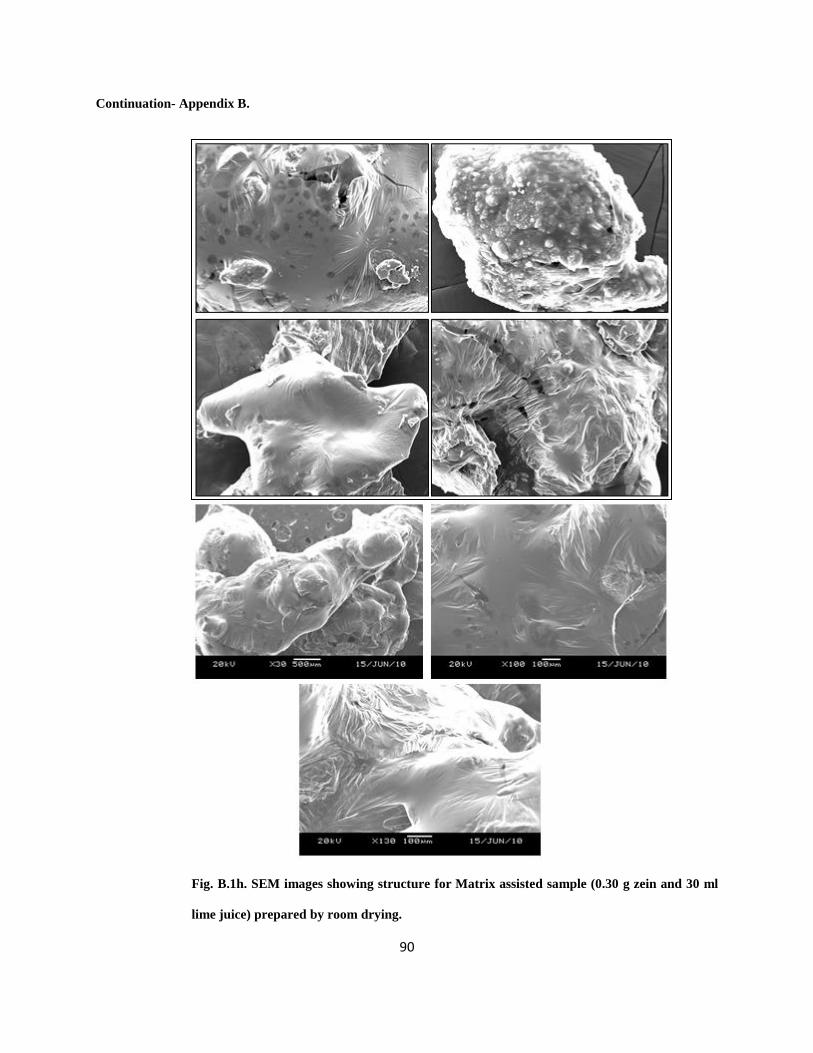
90
Continuation- Appendix B.
Fig. B.1h. SEM images showing structure for Matrix assisted sample (0.30 g zein and 30 ml
lime juice) prepared by room drying.
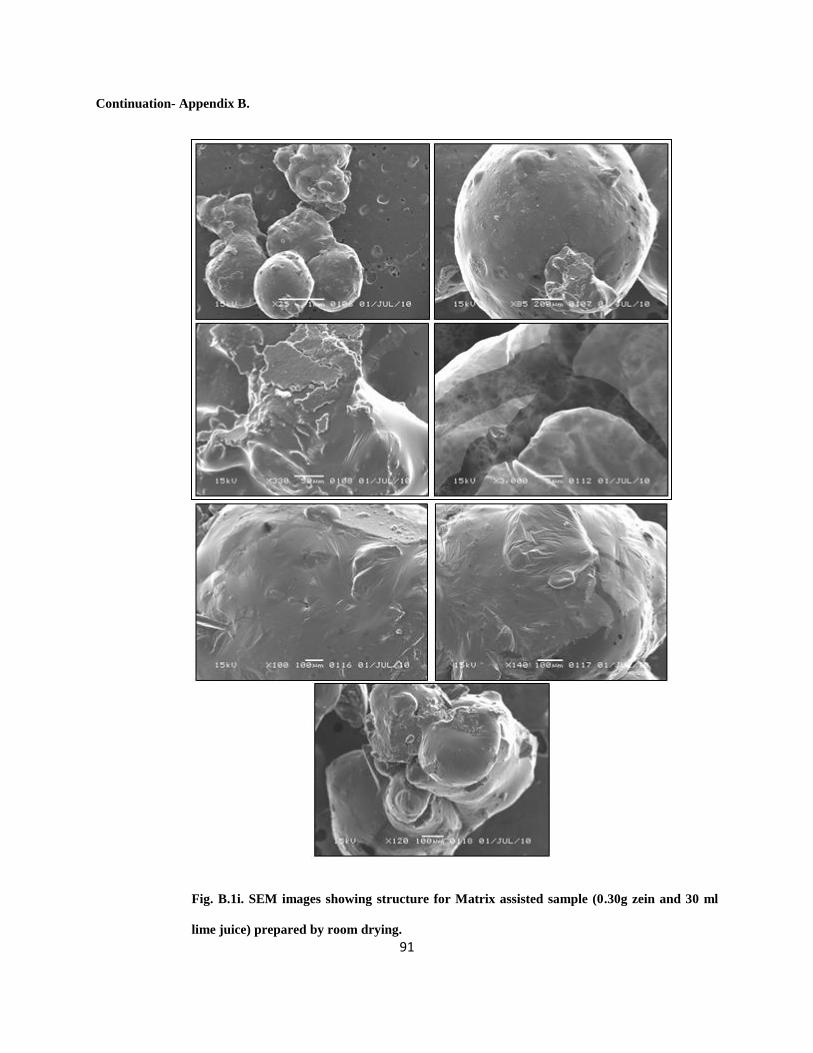
91
Continuation- Appendix B.
Fig. B.1i. SEM images showing structure for Matrix assisted sample (0.30g zein and 30 ml
lime juice) prepared by room drying.

92
Continuation- Appendix B.
Fig. B.1j. SEM images showing structure for Matrix assisted sample (0.60g zein and 30 ml
lime juice) prepared by room drying.
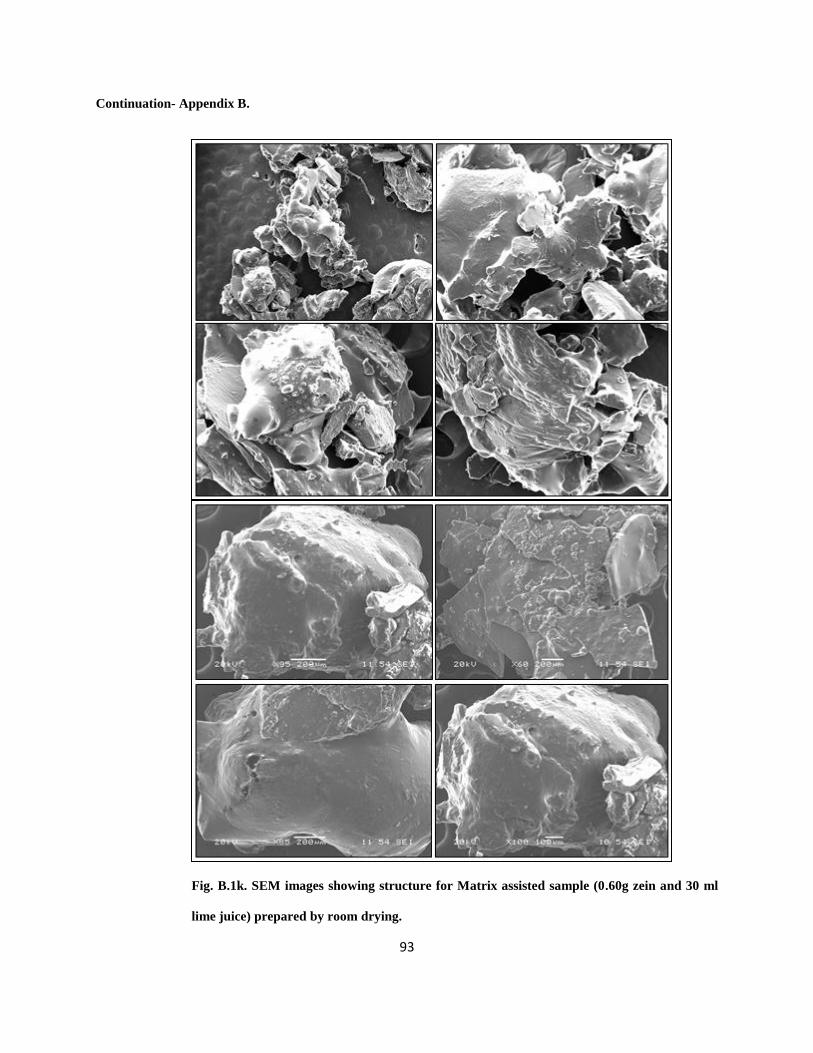
93
Continuation- Appendix B.
Fig. B.1k. SEM images showing structure for Matrix assisted sample (0.60g zein and 30 ml
lime juice) prepared by room drying.

94
Continuation- Appendix B.
Fig. B.1l. SEM images showing structure for Matrix assisted sample (0.60g zein and 30 ml
lime juice) prepared by room drying.

95
Continuation- Appendix B.
Fig. B.1m. SEM images showing structure for Matrix assisted sample (0.60g zein and 30 ml
lime juice) prepared by room drying.

96
APPENDIX C ADDITIONAL APOTOME IMAGES
Fig. C.1a. Apotome images showing structure of matrix assisted sample (1.2 g zein and 30 ml lime
juice) prepared by fast freeze drying.

97
Continuation- Appendix C.
Fig. C.1b. Apotome images showing structure of matrix assisted sample (1.2 g zein and 30 ml
lime juice) prepared by fast freeze drying.

98
Continuation- Appendix C.
Fig. C.1c. Apotome images showing structure of matrix assisted sample (1.2 g zein and 30 ml
lime juice) prepared by fast freeze drying.

99
Continuation- Appendix C.
Fig. C.1d. Apotome images showing structure of matrix assisted sample (1.2 g zein and 30 ml
cucumber concentration) Prepared by fast freeze drying.

100
APPENDIX D ADDITIONAL CONFOCAL IMAGES
Fig. D.1a. Confocal images showing structure of matrix assisted sample (1.2 g zein and 30 ml
lime juice) prepared by fast freeze drying using Alexa Fluor 500 hydazide to dye the zein.
First images (red) is the fluorencence focal, second images (gray) is the confocal and the third
image is the combination of the first two images.
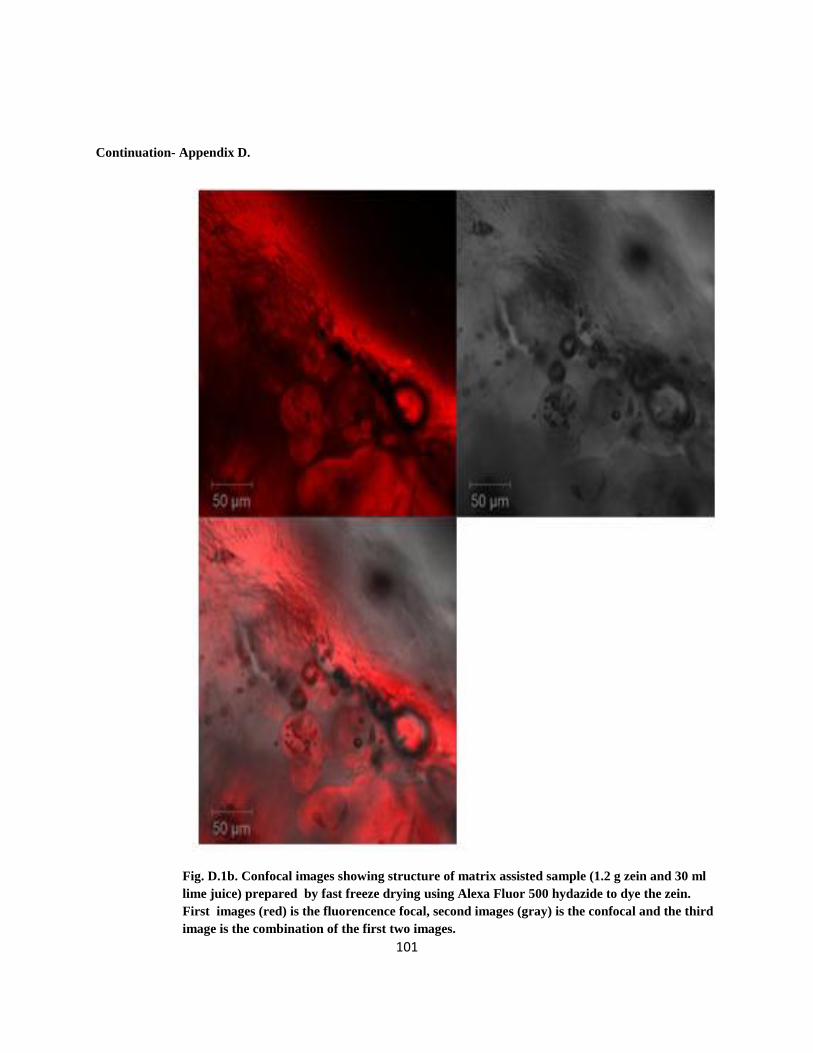
101
Continuation- Appendix D.
Fig. D.1b. Confocal images showing structure of matrix assisted sample (1.2 g zein and 30 ml
lime juice) prepared by fast freeze drying using Alexa Fluor 500 hydazide to dye the zein.
First images (red) is the fluorencence focal, second images (gray) is the confocal and the third
image is the combination of the first two images.

102
Continuation- Appendix D.
Fig. D.1c.Confocal images showing structure of matrix assisted sample (1.2 g zein and 30 ml
lime juice) prepared by fast freeze drying using Alexa Fluor 500 hydazide to dye the zein.
First images (red) is the fluorencence focal, second images (gray) is the confocal and the third
image is the combination of the first two images.

103
Continuation- Appendix D.
Fig. D.1d. Confocal images showing structure of matrix assisted sample (1.2 g zein and 30 ml
lime juice) prepared by fast freeze drying using Alexa Fluor 500 hydazide to dye the lime.
First images (red) is the fluorencence focal, second images (gray) is the confocal and the third
image is the combination of the first two images.

104
Continuation- Appendix D.
Fig. D.1e. Confocal images showing structure of matrix assisted sample (1.2 g zein and 30 ml
lime juice) prepared by fast freeze drying using Alexa Fluor 500 hydazide to dye the lime.
First images (red) is the fluorencence focal, second images (gray) is the confocal and the third
image is the combination of the first two images.

105
Continuation- Appendix D.
Fig. D.1e. Confocal images showing structure of matrix assisted sample (1.2 g zein and 30 ml
lime juice) prepared by fast freeze drying using Alexa Fluor 500 hydazide to dye the lime.
First images (red) is the fluorencence focal, second images (gray) is the confocal and the third
image is the combination of the first two images.