mathematics test—calculator - the sat suite of … · web viewsince 1 k m is equal to 1,000 m, it...
TRANSCRIPT

Mathematics Test—CalculatorTurn to Section 4 of your answer sheet to answer the questions in this section.
Directions
For questions 1 through 27, solve each problem, choose the best answer from the choices provided, and fill in the corresponding circle on your answer sheet. For questions 28 through 31, solve the problem and enter your answer in the grid on the answer sheet. Please refer to the directions before question 28 on how to enter your answers in the grid. You may use any available space in your test booklet for scratch work.
Notes
1. The use of a calculator is permitted.
2. All variables and expressions used represent real numbers unless otherwise indicated.
3. Figures provided in this test are drawn to scale unless otherwise indicated.
4. All figures lie in a plane unless otherwise indicated.
5. Unless otherwise indicated, the domain of a given function f is the set of all real
numbers x for which f of x is a real number.
The Redesigned P S A T/N M S Q T® Page Copyright 2015 by the College Board W F-5 K P T 0

Reference
Begin skippable figure descriptions.
The figure presents information for your reference in solving some of the problems.
The Redesigned P S A T/N M S Q T® Page Copyright 2015 by the College Board W F-5 K P T 0

Reference figure 1 is a circle with radius r. Two equations are presented below reference figure 1.
A equals pi times the square of r.
C equals 2 pi r.
Reference figure 2 is a rectangle with length ℓ and width w. An equation is presented below reference figure 2.
A equals ℓ w.
Reference figure 3 is a triangle with base b and height h. An equation is presented below reference figure 3.
A equals one-half b h.
Reference figure 4 is a right triangle. The two sides that form the right angle are labeled a and b, and the side opposite the right angle is labeled c. An equation is presented below reference figure 4.
c squared equals a squared plus b squared.
Special Right Triangles
Reference figure 5 is a right triangle with a 30-degree angle and a 60-degree angle. The side opposite the 30-degree angle is labeled x. The side opposite the 60-degree angle is labeled x times the square root of 3. The side opposite the right angle is labeled 2 x.
Reference figure 6 is a right triangle with two 45-degree angles. Two sides are each labeled s. The side opposite the right angle is labeled s times the square root
The Redesigned P S A T/N M S Q T® Page Copyright 2015 by the College Board W F-5 K P T 0

of 2.
The Redesigned P S A T/N M S Q T® Page Copyright 2015 by the College Board W F-5 K P T 0

Reference figure 7 is a rectangular solid whose base has length ℓ and width w and whose height is h. An equation is presented below reference figure 7.
V equals ℓ w h.
Reference figure 8 is a right circular cylinder whose base has radius r and whose height is h. An equation is presented below reference figure 8.
V equals pi times the square of r times h.
Reference figure 9 is a sphere with radius r. An equation is presented below reference figure 9.
V equals four-thirds pi times the cube of r.
Reference figure 10 is a cone whose base has radius r and whose height is h. An equation is presented below reference figure 10.
V equals one-third times pi times the square of r times h.
Reference figure 11 is an asymmetrical pyramid whose base has length ℓ and width w and whose height is h. An equation is presented below reference figure 11.
V equals one-third ℓ w h.
End skippable figure descriptions.
Additional Reference Information
The number of degrees of arc in a circle is 360.
The number of radians of arc in a circle is 2 pi.
The Redesigned P S A T/N M S Q T® Page Copyright 2015 by the College Board W F-5 K P T 0

The sum of the measures in degrees of the angles of a triangle is 180.
The Redesigned P S A T/N M S Q T® Page Copyright 2015 by the College Board W F-5 K P T 0

Question 1.Tyra subscribes to an online gaming service that charges a monthly fee of $5.00 and $0.25 per hour for time spent playing premium games. Which of the following functions gives Tyra’s cost, in dollars, for a month in which she spends x hours playing premium games?
A. C of x, equals 5.25 x.
B. C of x, equals 5 x plus 0.25.
C. C of x, equals 5 plus 0.25 x.
D. C of x, equals 5 plus 25 x.
Answer and Explanation. (Follow link to explanation of question 1.)
The Redesigned P S A T/N M S Q T® Page Copyright 2015 by the College Board W F-5 K P T 0

Question 2.A grocery store sells a brand of juice in individual bottles and in packs of 6 bottles. On a certain day, the store sold a total of 281 bottles of the brand of juice, of which 29 were sold as individual bottles. Which equation shows the number of packs of bottles, p, sold that day?
A. p equals, the fraction whose numerator is, 281 minus 29, and whose denominator is, 6.
B. p equals, the fraction whose numerator is, 281 plus 29, and whose denominator is, 6.
C. p equals, the fraction whose numerator is 281, and whose denominator is 6, minus 29.
D. p equals, the fraction whose numerator is 281, and whose denominator is 6, plus 29.
Answer and Explanation. (Follow link to explanation of question 2.)
The Redesigned P S A T/N M S Q T® Page Copyright 2015 by the College Board W F-5 K P T 0
Question 3 refers to the following figure.
Begin skippable figure description.
The figure presents a line graph titled “Monthly Rainfall in Chestnut City.” The horizontal axis is labeled “Month,” and months March through October are given. The vertical axis is labeled “Rainfall, in inches,” and ranges from 0 through 6. The data presented by the points on the graph are as follows:
March: 4 inches.
April: 3.5 inches.
May: 4.5 inches.
June: 4 inches.
July: 5.5 inches.
August: 6 inches.
September: 5 inches.
The Redesigned P S A T/N M S Q T® Page Copyright 2015 by the College Board W F-5 K P T 0

October: 2.5 inches.
End skippable figure description.
The Redesigned P S A T/N M S Q T® Page 10Copyright 2015 by the College Board W F-5 K P T 0

Question 3.
The preceding line graph shows the monthly rainfall from March to October last year in Chestnut City. According to the graph, what was the greatest change (in absolute value) in the monthly rainfall between two consecutive months?
A. 1.5 inches
B. 2.0 inches
C. 2.5 inches
D. 3.5 inches
Answer and Explanation. (Follow link to explanation of question 3.)
The Redesigned P S A T/N M S Q T® Page 11Copyright 2015 by the College Board W F-5 K P T 0

Question 4.
A rectangle has perimeter P, length ℓ and width w. Which of the following
represents ℓ in terms of P and w ?
A. l equals P minus w.
B. l equals, the fraction whose numerator is 2 P minus w, and whose denominator is, 2.
C. l equals, the fraction whose numerator is P minus 2 w, and whose denominator is, 2.
D. l equals 2 P minus 2 w.
Answer and Explanation. (Follow link to explanation of question 4.)
Question 5.
Which ordered pair x comma y, satisfies the following system of equations?
2 x minus y equals 6.
x plus 2 y equals negative 2.
A. negative 6 comma 2
B. negative 2 comma 2
C. 2 comma negative 2
D. 4 comma 2
The Redesigned P S A T/N M S Q T® Page 12Copyright 2015 by the College Board W F-5 K P T 0

Answer and Explanation. (Follow link to explanation of question 5.)
The Redesigned P S A T/N M S Q T® Page 13Copyright 2015 by the College Board W F-5 K P T 0

Question 6.
A soda company is filling bottles of soda from a tank that contains 500 gallons of soda. At most, how many 20-ounce bottles can be filled from the tank? (1 gallon = 128 ounces)
A. 25
B. 78
C. 2,560
D. 3,200
Answer and Explanation. (Follow link to explanation of question 6.)
Question 7.
A car traveled at an average speed of 80 miles per hour for 3 hours and consumed fuel at a rate of 34 miles per gallon. Approximately how many gallons of fuel did the car use for the entire 3-hour trip?
A. 2
B. 3
C. 6
D. 7
Answer and Explanation. (Follow link to explanation of question 7.)
The Redesigned P S A T/N M S Q T® Page 14Copyright 2015 by the College Board W F-5 K P T 0

Question 8.
What is the slope of the line in the x y-plane that passes through the points
negative five halves comma one, and negative one half comma 4 ?
A. negative 1
B. negative two thirds
C. 1
D. three halves
Answer and Explanation. (Follow link to explanation of question 8.)
The Redesigned P S A T/N M S Q T® Page 15Copyright 2015 by the College Board W F-5 K P T 0

Question 9 refers to the following figure.
Begin skippable figure description.
The figure presents a scatterplot in a coordinate plane. The scatterplot is titled “Dimensions of Envelopes.” The horizontal axis is labeled “Width, in inches,” and the vertical axis is labeled “Height, in inches.” There are 7 equally spaced tick marks on the horizontal axis, labeled 1, 2, 3, 4, 5, 6, and 7. There are equally spaced horizontal grid lines, labeled 2 through 14, in increments of 2. There are 12 data points in the scatterplot. Of the 12 data points, 11 are scattered over a band area that extends from the lower left corner, near the data point with coordinates 1.7 comma 2.8, upward and to the right to the upper right corner, near the data point with coordinates 6 comma 9, and only one of the 12 data points, with coordinates 7 comma 4, lies outside the band and far to the right. For more detailed information, the scatterplot can be described as follows.
First cluster, at the lower left corner, consists of 3 data points with coordinates in the neighborhood of 2 comma 3.
Second cluster, to the right of and higher than first cluster, consists of 3 data points with coordinates in the neighborhood of 3.3 comma 5.
The Redesigned P S A T/N M S Q T® Page 16Copyright 2015 by the College Board W F-5 K P T 0

Third cluster, to the right of and higher than second cluster, consists of 2 data points with coordinates in the neighborhood of 4.6 comma 6.
Fourth cluster, above third cluster, consists of 3 data points with horizontal coordinates 4, 5, and 6 and vertical coordinates around 9.
The last cluster, far to the right of all other clusters, consists of only one data point with coordinates 7 comma 4.
End skippable figure description.
Question 9.
The preceding scatterplot shows the widths and the heights of 12 types of rectangular envelopes. What is the width, in inches, of the envelope represented by the data point that is farthest from the line of best fit (not shown) ?
A. 2
B. 5
C. 7
D. 12
Answer and Explanation. (Follow link to explanation of question 9.)
The Redesigned P S A T/N M S Q T® Page 17Copyright 2015 by the College Board W F-5 K P T 0

Question 10.
A high school basketball team won exactly 65 percent of the games it played during last season. Which of the following could be the total number of games the team played last season?
A. 22
B. 20
C. 18
D. 14
Answer and Explanation. (Follow link to explanation of question 10.)
Question 11.
110 x plus y equals 1,210.
A coffee shop is running a promotion where a number of free coffee samples are given away each day. The preceding equation can be used to model the number of free coffee samples, y, that remain to be given away x days after the promotion began. What does it mean that 11 comma zero, is a solution to this equation?
A. During the promotion, 11 samples are given away each day.
B. It takes 11 days during the promotion to see 1,210 customers.
C. It takes 11 days during the promotion until none of the samples are remaining.
D. There are 11 samples available at the start of the promotion.
The Redesigned P S A T/N M S Q T® Page 18Copyright 2015 by the College Board W F-5 K P T 0

Answer and Explanation. (Follow link to explanation of question 11.)
The Redesigned P S A T/N M S Q T® Page 19Copyright 2015 by the College Board W F-5 K P T 0

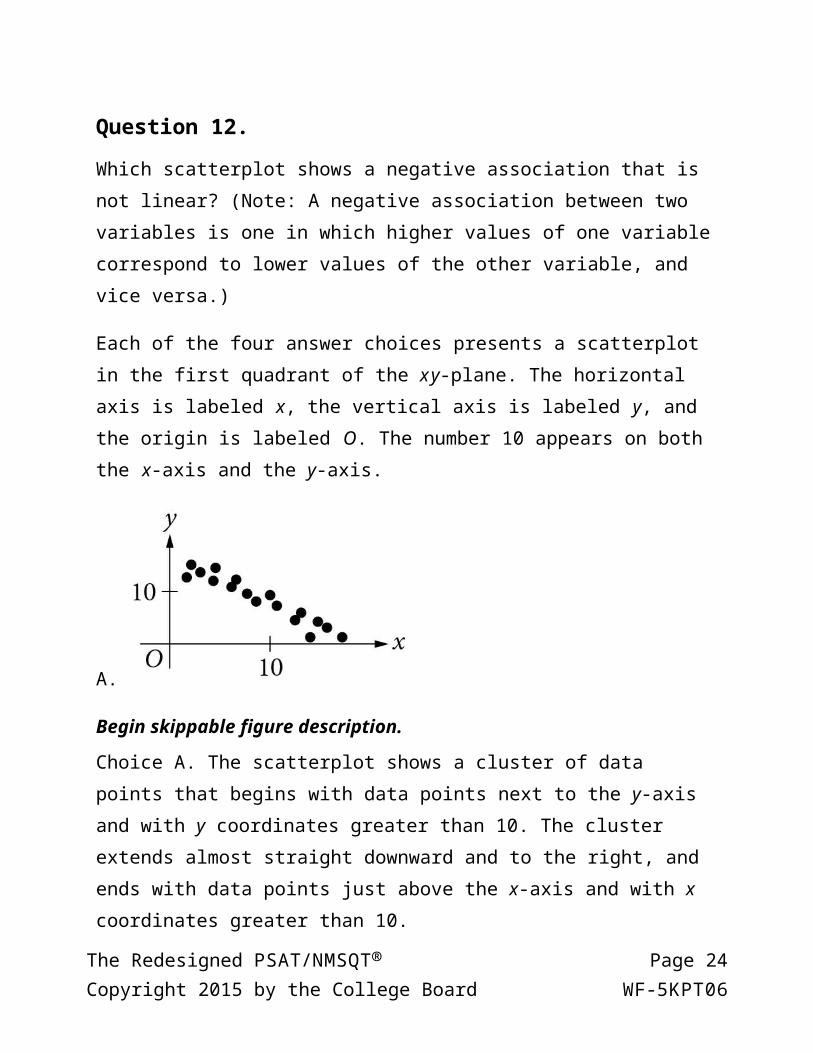
Question 12.
Which scatterplot shows a negative association that is not linear? (Note: A negative association between two variables is one in which higher values of one variable correspond to lower values of the other variable, and vice versa.)
Each of the four answer choices presents a scatterplot in the first quadrant of the x y-plane. The horizontal axis is labeled x, the vertical axis is labeled y, and the origin is labeled O. The number 10 appears on both the x-axis and the y-axis.
A.
Begin skippable figure description.
Choice A. The scatterplot shows a cluster of data points that begins with data points next to the y-axis and with y coordinates greater than 10. The cluster extends almost straight downward and to the right, and ends with data points just above the x-axis and with x coordinates greater than 10.
End skippable figure description.
The Redesigned P S A T/N M S Q T® Page 20Copyright 2015 by the College Board W F-5 K P T 0

B.
Begin skippable figure description.
Choice B. The scatterplot shows a cluster of data points that begins with data points next to the y-axis and with y coordinates greater than 10. The cluster extends almost vertically downward initially, and then gradually extends almost horizontally to the right. It ends with data points above the x-axis and with x coordinates greater than 10.
End skippable figure description.
C.
Begin skippable figure description.
Choice C. The scatterplot shows a symmetric cluster with respect to a vertical line with x coordinate 10. The left half of the cluster begins with data points next to the y-axis and with y coordinates greater than 10. It extends downward and to the right until data points just above the x-axis and with x coordinates about 10. The right half of the cluster begins where the left half ends and extends upward and to the right until a symmetric cluster is complete.
End skippable figure description.The Redesigned P S A T/N M S Q T® Page 21Copyright 2015 by the College Board W F-5 K P T 0
D.
Begin skippable figure description.
Choice D. The scatterplot shows a collection of data points that are scattered over a rectangular area whose vertical sides are the y-axis and a vertical line that is more than 10 units to the right of the y-axis, and whose horizontal sides are the x-axis and a horizontal line that is more than 10 units above the x-axis.
End skippable figure description.
Answer and Explanation. (Follow link to explanation of question 12.)
Question 13 refers to the following figure.
The Redesigned P S A T/N M S Q T® Page 22Copyright 2015 by the College Board W F-5 K P T 0
Begin skippable figure description.
The figure presents a histogram. The horizontal axis is labeled “Height of pyramid, in meters,” and ranges from 0 to 150 in increments of 15. The vertical axis is labeled “Frequency” and ranges from 0 to 14, in increments of 2. The data presented by the bars in the histogram are as follow:
Heights between 0 and 15: no frequency shown.
Heights between 15 and 30: frequency, 2.
Heights between 30 and 45: frequency, 3.
Heights between 45 and 60: frequency, 12.
Heights between 60 and 75: frequency, 4.
Heights between 75 and 90: frequency, 1.
Heights between 90 and 105: frequency, 2.
Heights between 105 and 120: no frequency shown.
Heights between 120 and 135: no frequency shown.
Heights between 135 and 150: frequency, 2.
End skippable figure description.
Question 13.
The preceding histogram shows the distribution of the heights, in meters, of 26 pyramids in Egypt. Which of the following could be the median height of the 26 pyramids represented in the histogram?
A. 44 meters
B. 48 meters
The Redesigned P S A T/N M S Q T® Page 23Copyright 2015 by the College Board W F-5 K P T 0
C. 63 meters
D. 77 meters
Answer and Explanation. (Follow link to explanation of question 13.)
Questions 14 through 16 refer to the following information.A survey of 170 randomly selected teenagers aged 14 through 17 in the United States was conducted to gather data on summer employment of teenagers. The data are shown in the following table.
Have a summer job
Do not have a summer job
Total
Ages 14 through 15 20 69 89
Ages 16 through 17 39 42 81
Total 59 111 170
Question 14.
Which of the following is closest to the percent of those surveyed who had a summer job?
A. 22%
B. 35%
C. 47%
D. 53%
The Redesigned P S A T/N M S Q T® Page 24Copyright 2015 by the College Board W F-5 K P T 0
Answer and Explanation. (Follow link to explanation of question 14.)
The Redesigned P S A T/N M S Q T® Page 25Copyright 2015 by the College Board W F-5 K P T 0

Question 15.
In 2012 the total population of individuals in the United States who were between 14 and 17 years old (inclusive) was about 17 million. If the survey results are used to estimate information about summer employment of teenagers across the country, which of the following is the best estimate of the total number of individuals between 16 and 17 years old in the United States who had a summer job in 2012 ?
A. 8,200,000
B. 3,900,000
C. 2,000,000
D. 390,000
Answer and Explanation. (Follow link to explanation of question 15.)
Question 16.
Based on the data, how many times more likely is it for a 14 year old or a 15 year old to NOT have a summer job than it is for a 16 year old or a 17 year old to NOT have a summer job? (Round the answer to the nearest hundredth.)
A. 0.52 times as likely
B. 0.65 times as likely
C. 1.50 times as likely
D. 1.64 times as likely
Answer and Explanation. (Follow link to explanation of question 16.)
The Redesigned P S A T/N M S Q T® Page 26Copyright 2015 by the College Board W F-5 K P T 0

Question 17 refers to the following figure.Percent Protein in Five Food Products
Begin skippable figure description.
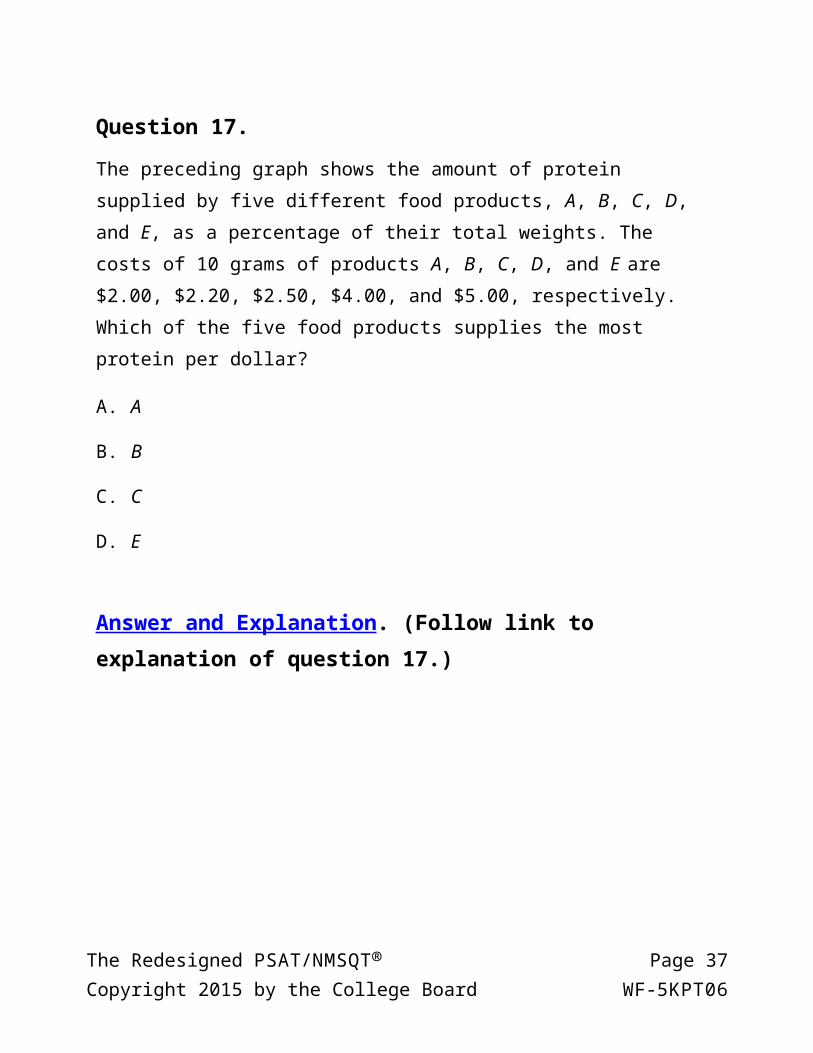
The figure presents a bar graph titled “Percent Protein in Five Food Products. The horizontal axis is labeled “Food products” and has 5 vertical bars that are labeled from left to right A through E. The vertical axis is labeled “Percent protein” and ranges from 0 to 35, in increments of 5. The data presented by the bars in the graph are as follow:
Food product A: 10%.Food product B: 15%.Food product C: 20%.Food product D: 25%.Food product E: 30%.
End skippable figure description.
The Redesigned P S A T/N M S Q T® Page 27Copyright 2015 by the College Board W F-5 K P T 0

Question 17.
The preceding graph shows the amount of protein supplied by five different food products, A, B, C, D, and E, as a percentage of their total weights. The costs of 10 grams of products A, B, C, D, and E are $2.00, $2.20, $2.50, $4.00, and $5.00, respectively. Which of the five food products supplies the most protein per dollar?
A. A
B. B
C. C
D. E
Answer and Explanation. (Follow link to explanation of question 17.)
The Redesigned P S A T/N M S Q T® Page 28Copyright 2015 by the College Board W F-5 K P T 0

Question 18 refers to the following figure.
Begin skippable figure description.
The figure presents quadrilateral A B C D, where vertex A is at the lower left corner, vertices A, B, C, and D are labeled clockwise, and sides B C and A D are horizontal. A vertical dashed line is drawn from vertex B to side A D and intersects side A D at point E, where a right angle symbol is shown.
End skippable figure description.
Question 18.
In quadrilateral A B C D above, side B C is parallel to side A D, and A B equals C D. If B C and A D were each doubled and B E was reduced
by 50 percent, how would the area of A B C D change?
A. The area of A B C D would be decreased by 50 percent.
B. The area of A B C D would be increased by 50 percent.
C. The area of A B C D would not change.
D. The area of A B C D would be multiplied by 2.
Answer and Explanation. (Follow link to explanation of question 18.)
The Redesigned P S A T/N M S Q T® Page 29Copyright 2015 by the College Board W F-5 K P T 0

The Redesigned P S A T/N M S Q T® Page 30Copyright 2015 by the College Board W F-5 K P T 0

Question 19.
Boyd grows only tomatoes and raspberries in his garden. Last year, he grew 140 pounds of tomatoes and 60 pounds of raspberries. This year, the production, by weight, of tomatoes declined by 20 percent, and the production, by weight, of raspberries declined by 50 percent. By what percentage did the total yield, by weight, of Boyd’s garden decline?
A. 29 percent
B. 30 percent
C. 35 percent
D. 70 percent
Answer and Explanation. (Follow link to explanation of question 19.)
The Redesigned P S A T/N M S Q T® Page 31Copyright 2015 by the College Board W F-5 K P T 0
Question 20 refers to the following figure.
Begin skippable figure description.
The figure shows a bar graph. The horizontal axis is labeled “Integers” and ranges from 0 to 10. The vertical axis labeled “Frequency” and ranges from 0 to 4. The data presented by the bars in the graph are as follow:
Number: zero; frequency: 1.
Number: 1; frequency: 1.
Number: 2; frequency: 1.
Number: 3; frequency: 3.
Number: 4; frequency: 2.
Number: 5; no frequency shown.
Number: 6; frequency: 1.
Number: 7; frequency: 1.
Number: 8; frequency: 1.
The Redesigned P S A T/N M S Q T® Page 32Copyright 2015 by the College Board W F-5 K P T 0

Number: 9; no frequency shown.
Number: 10; frequency: 1.
End skippable figure description.
The Redesigned P S A T/N M S Q T® Page 33Copyright 2015 by the College Board W F-5 K P T 0

Question 20.
The preceding graph shows the frequency distribution of a list of randomly generated integers between 0 and 10. What is the mean of the list of numbers?
A. 3.0
B. 3.5
C. 4.25
D. 12.0
Answer and Explanation. (Follow link to explanation of question 20.)
Question 21 refers to the following figure.
The Redesigned P S A T/N M S Q T® Page 34Copyright 2015 by the College Board W F-5 K P T 0

Begin skippable figure description.
The figure presents a smooth curve in the x y-plane with its origin labeled O. Numbers negative 4 to 6, in increments of 2, appear along the x-axis, and numbers negative 2 to 4, in increments of 2, appear along the y-axis. The curve begins below the x-axis and to the left of the y-axis at the point with coordinates negative 4 comma negative 2, moves upward and to the right, intersecting with the x-axis at negative 3, continues to move upward and to the right, reaching its highest point right after it crosses the y-axis at 4. The curve then curves down and to the right and ends at the point above the x-axis with coordinates 6 comma 2.
End skippable figure description.
Question 21.
What is the minimum value of the function graphed on the preceding x y-plane, for x that is greater than or equal to negative 4 and is less than or equal
to 6 ?
A. negative infinite
B. negative 4
C. negative 2
D. 1
Answer and Explanation. (Follow link to explanation of question 21.)
The Redesigned P S A T/N M S Q T® Page 35Copyright 2015 by the College Board W F-5 K P T 0

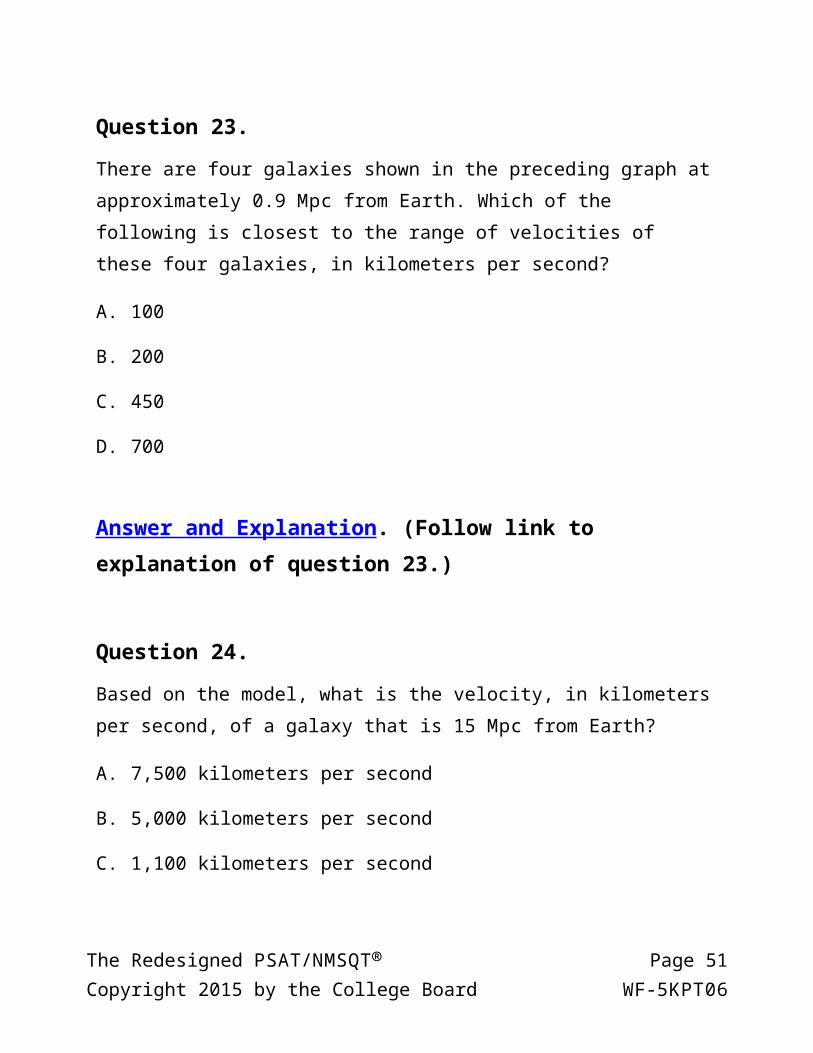
Questions 22 through 24 refer to the following information.In 1929, the astronomer Edwin Hubble published the data shown. The graph plots the velocity of galaxies relative to Earth against the distances of galaxies from Earth.
Begin skippable figure description.
The figure shows a scatterplot in a coordinate plane. The title of the scatterplot is “Velocity-Distance Relation among Galaxies.” The horizontal axis is labeled “Distance, in megaparsecs,” and the vertical axis is labeled “Velocity, in kilometers per second.” There are 7 equally spaced vertical grid lines on the horizontal axis, labeled negative 0.5 to 2.5, in increments of 0.5. There are 5 equally spaced horizontal grid lines on the vertical axis, labeled negative 500, 0, 500, 1,000, and 1,500. In the graph, the data points are scattered over a wide band area extending from the lower left corner to upper right corner of the graph. Of the data points, one with coordinates 2.0 comma 500 is labeled “Galaxy Q.” Note that some of the data points in the graph with the same horizontal coordinates have
The Redesigned P S A T/N M S Q T® Page 36Copyright 2015 by the College Board W F-5 K P T 0
different vertical coordinates. The information of those data points is as follows.
Two data points with horizontal coordinate 0.05 have vertical coordinates 200 and 300.
Three data points with horizontal coordinate 0.3 have vertical coordinates negative 200, negative 150, and negative 50.
Four data points with horizontal coordinate 0.9 have vertical coordinates negative 50, 200, 500, and 650.
Two data points with horizontal coordinate 1.1 have vertical coordinates 450 and 500.
Four data points with horizontal coordinate 2.0 have vertical coordinates 500, 800, 850, and 1,100.
End skippable figure description.
Hubble’s data can be modeled by the equation v equals 500 d, where v is the velocity, in kilometers per second, at which the galaxy is moving away from Earth and d is the distance, in megaparsecs, of the galaxy from Earth. Assume that the relationship is valid for larger distances than are shown in the graph. (A megaparsec (M p c) is 3.1 times 10 to the power of 19, kilometers.)
Question 22.
According to Hubble’s data, how fast, in meters per second, is Galaxy Q moving away from Earth?
A. 2 times 10 to the power of 6, meters per second
B. 5 times 10 to the power of 5, meters per second
C. 5 times 10 to the power of 2, meters per second
The Redesigned P S A T/N M S Q T® Page 37Copyright 2015 by the College Board W F-5 K P T 0

D. 2.5 times 10 to the power of 2, meters per second
Answer and Explanation. (Follow link to explanation of question 22.)
The Redesigned P S A T/N M S Q T® Page 38Copyright 2015 by the College Board W F-5 K P T 0

Question 23.
There are four galaxies shown in the preceding graph at approximately 0.9 M p c from Earth. Which of the following is closest to the range of velocities of these four galaxies, in kilometers per second?
A. 100
B. 200
C. 450
D. 700
Answer and Explanation. (Follow link to explanation of question 23.)
Question 24.
Based on the model, what is the velocity, in kilometers per second, of a galaxy that is 15 M p c from Earth?
A. 7,500 kilometers per second
B. 5,000 kilometers per second
C. 1,100 kilometers per second
D. 750 kilometers per second
Answer and Explanation. (Follow link to explanation of question 24.)
The Redesigned P S A T/N M S Q T® Page 39Copyright 2015 by the College Board W F-5 K P T 0

Question 25.
Janice puts a fence around her rectangular garden. The garden has a length that is 9 feet less than 3 times its width. What is the perimeter of Janice’s fence if the area of her garden is 5,670 square feet?
A. 342 feet
B. 318 feet
C. 300 feet
D. 270 feet
Answer and Explanation. (Follow link to explanation of question 25.)
The Redesigned P S A T/N M S Q T® Page 40Copyright 2015 by the College Board W F-5 K P T 0

Question 26 refers to the following figure.
Begin skippable figure description.
The figure presents triangle A B C, where side A C is horizontal, side B C is vertical, and there is a right angle symbol at vertex C. The length of side A C is labeled lowercase b, and the length of side B C is labeled lowercase a.
End skippable figure description.
Question 26.
Given the preceding right triangle ABC, which of the following is equal to lowercase b over lowercase a ?
A. sine A
B. sine B
C. tangent A
D. tangent B
Answer and Explanation. (Follow link to explanation of question 26.)
The Redesigned P S A T/N M S Q T® Page 41Copyright 2015 by the College Board W F-5 K P T 0

The Redesigned P S A T/N M S Q T® Page 42Copyright 2015 by the College Board W F-5 K P T 0

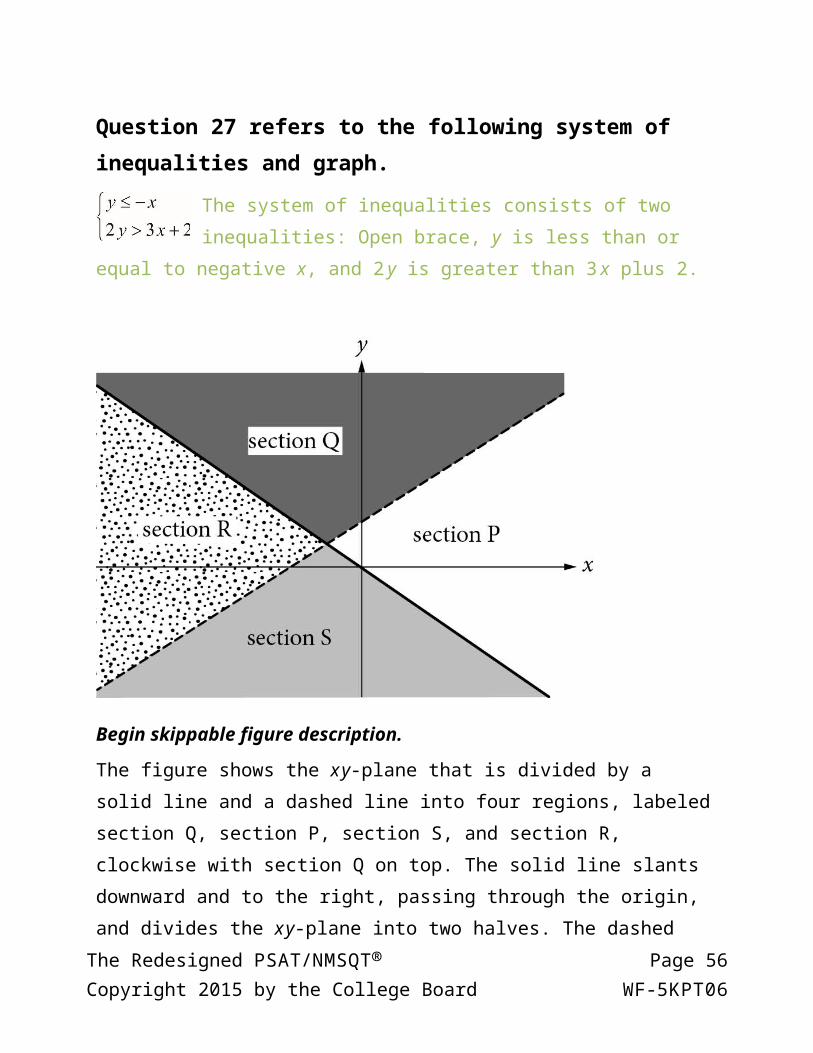
Question 27 refers to the following system of inequalities and graph.
The system of inequalities consists of two inequalities: Open brace, y is less than or equal to negative x, and 2 y is greater than 3 x plus 2.
Begin skippable figure description.
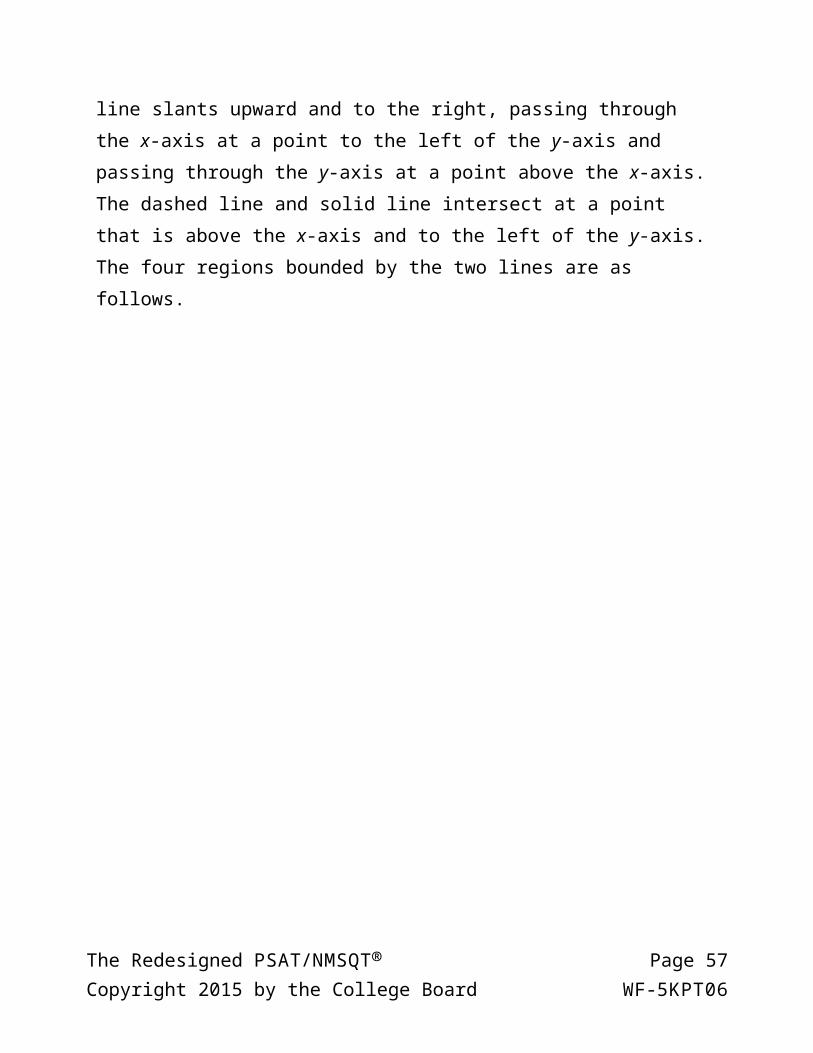
The figure shows the x y-plane that is divided by a solid line and a dashed line into four regions, labeled section Q, section P, section S, and section R, clockwise with section Q on top. The solid line slants downward and to the right, passing through the origin, and divides the x y-plane into two halves. The dashed line slants upward and to the right, passing through the x-axis at a point to the left of the y-axis and passing through the y-axis at a point above the x-axis. The dashed line and solid line intersect at a point that is above the x-axis and to the left of the y-axis. The four regions bounded by the two lines are as follows.
The Redesigned P S A T/N M S Q T® Page 43Copyright 2015 by the College Board W F-5 K P T 0

Above the solid line, the region above the dashed line is labeled section Q, and the region below the dashed line is labeled section P.
Below the solid line, the region above the dashed line is labeled section R, and the region below the dashed line is labeled section S.
End skippable figure description.
Question 27.
Which section or sections of the preceding graph could represent all of the solutions to the system?
A. Section R
B. Sections Q and S
C. Sections Q and P
D. Sections Q, R, and S
Answer and Explanation. (Follow link to explanation of question 27.)
The Redesigned P S A T/N M S Q T® Page 44Copyright 2015 by the College Board W F-5 K P T 0

Directions
For questions 28 through 31, solve the problem and enter your answer in the grid, as described below, on the answer sheet.
1. Although not required, it is suggested that you write your answer in the boxes at the top of the columns to help you fill in the circles accurately. You will receive credit only if the circles are filled in correctly.
2. Mark no more than one circle in any column.
3. No question has a negative answer.
4. Some problems may have more than one correct answer. In such cases, grid only one answer.
5. Mixed numbers such as three and one half must be gridded as 3.5 or
seven slash two. (If three, one, slash, two, is entered into the grid, it
will be interpreted as thirty one halves, not three and one half.)
6. Decimal answers: If you obtain a decimal answer with more digits than the grid can accommodate, it may be either rounded or truncated, but it must fill the entire grid.
The Redesigned P S A T/N M S Q T® Page 45Copyright 2015 by the College Board W F-5 K P T 0

The following are four examples of how to record your answer in the spaces provided. Keep in mind that there are four spaces provided to record each answer.
Examples 1 and 2
Begin skippable figure description.
Example 1: If your answer is a fraction such as seven-twelfths, it should be recorded as follows. Enter 7 in the first space, the fraction bar (a slash) in the second space, 1 in the third space, and 2 in the fourth space. All four spaces would be used in this example.
Example 2: If your answer is a decimal value such as 2.5, it could be recorded as follows. Enter 2 in the second space, the decimal point in the third space, and 5 in the fourth space. Only three spaces would be used in this example.
End skippable figure description.
The Redesigned P S A T/N M S Q T® Page 46Copyright 2015 by the College Board W F-5 K P T 0

Example 3
Begin skippable figure description.
Example 3: Acceptable ways to record two-thirds are: 2 slash 3, .666, and .667.
End skippable figure description.
The Redesigned P S A T/N M S Q T® Page 47Copyright 2015 by the College Board W F-5 K P T 0

Example 4
Note: You may start your answers in any column, space permitting. Columns you don’t need to use should be left blank.
Begin skippable figure description.
Example 4: It is not necessary to begin recording answers in the first space unless all four spaces are needed. For example, if your answer is 201, you may record 2 in the second space, 0 in the third space, and 1 in the fourth space. Alternatively, you may record 2 in the first space, 0 in the second space, and 1 in the third space. Spaces not needed should be left blank.
End skippable figure description.
The Redesigned P S A T/N M S Q T® Page 48Copyright 2015 by the College Board W F-5 K P T 0

Question 28 refers to the following figure.
Begin skippable figure description.
The figure presents a curve and a line in the x y-plane. The horizontal axis is labeled x and the vertical axis is labeled y. The curve is symmetric; it opens down with its highest point above the x-axis and to the right of the y-axis. The coordinates of the highest point on the curve are 4 comma 19. The curve passes through the point with coordinates, 0 comma 3. The line slants upward and to the right, passes through the point with coordinates 0 comma negative 9 and the point with coordinates 2 comma negative 1. The line and the curve intersect at a point above the x-axis and to the right of the y-axis, and the coordinates of the point of intersection are labeled v comma w.
End skippable figure description.
Question 28.The preceding x y-plane shows one of the two points of intersection of the graphs of a linear function and a quadratic function. The shown point of intersection has coordinates v comma w. If the vertex of the graph of the quadratic function is at 4 comma 19, what is the value of v ?
The Redesigned P S A T/N M S Q T® Page 49Copyright 2015 by the College Board W F-5 K P T 0

Answer and Explanation. (Follow link to explanation of question 28.)
Question 29.In a college archaeology class, 78 students are going to a dig site to find and study artifacts. The dig site has been divided into 24 sections, and each section will be studied by a group of either 2 or 4 students. How many of the sections will be studied by a group of 2 students?
Answer and Explanation. (Follow link to explanation of question 29.)
Questions 30 and 31 refer to the following information.
v equals, v subscript zero minus g t. Open parenthesis speed time close parenthesis.
h equals v subscript zero, times t minus one half, g t squared. Open parenthesis position time close parenthesis
v squared equals, v subscript zero, squared, minus 2 g h. Open parenthesis position speed close parenthesis.
An arrow is launched upward with an initial speed of 100 meters per second (m/s). The equations above describe the constant-acceleration motion of the arrow, where
v subscript zero is the initial speed of the arrow, v is the speed of the arrow as it is moving up in the air, h is the height of the arrow above the ground, t is the time elapsed since the arrow was projected upward, and g is the acceleration due
The Redesigned P S A T/N M S Q T® Page 50Copyright 2015 by the College Board W F-5 K P T 0
to gravity (9.8 meters per second squared).
Question 30.What is the maximum height from the ground the arrow will rise to the nearest meter?
Answer and Explanation. (Follow link to explanation of question 30.)
Question 31.How long will it take for the arrow to reach its maximum height to the nearest tenth of a second?
Answer and Explanation. (Follow link to explanation of question 31.)
Stop
If you finish before time is called, you may check your work on this section only. Do not turn to any other section.
Answers and explanations for questions 1 through 31 are provided in the next section of this document (pages 42 through 69).
The Redesigned P S A T/N M S Q T® Page 51Copyright 2015 by the College Board W F-5 K P T 0

Answers and Explanations for Questions 1 through 31The following are explanations of answers to questions 1 through 31 of the Mathematics Test. The heading of each explanation is hyperlinked to the actual question. In addition, each explanation is followed by two hyperlinks: one to the question explained and one to the next question.
There are two ways to follow a link. One is to move the flashing text cursor, or caret, into the hyperlinked text and press the Enter key; the other is to place the mouse cursor, or pointer, over the hyperlinked text and press Ctrl+left-click (that is, press and release the left button on the mouse while holding down the Ctrl key on the keyboard). After following a link in Microsoft Word, you can return to your previous location (for example, the answer explanation) by pressing Alt+left arrow.
The Redesigned P S A T/N M S Q T® Page 52Copyright 2015 by the College Board W F-5 K P T 0

Explanation for question 1. (Follow link back to original question.)Choice C is correct. Tara pays $0.25 per hour for time spent playing premium games, so for the month in which she spends x hours playing premium games, she pays 0.25x dollars for playing the premium games. She also pays an additional $5 monthly fee. Therefore, Tyra’s cost, in dollars, for the month in which she spends
x hours playing premium games is given by the function C of x equals 5 plus 0.25 x.
Choice A is incorrect because Tyra is not charged $5.25 per hour for time playing premium games. Choice B is incorrect because the charge per hour has been interchanged with the monthly fee. Choice D is incorrect because 25 x is the charge for playing premium games in cents, not in dollars.
Link back to question 1.
Link back to question 2.
The Redesigned P S A T/N M S Q T® Page 53Copyright 2015 by the College Board W F-5 K P T 0

Explanation for question 2. (Follow link back to original question.)Choice A is correct. Since the store sold a total of 281 bottles, 29 of which were sold individually, it follows that 281 minus 29 bottles were sold in packs of 6 bottles. Therefore, the number of packs of bottles, p, sold that day in the store
is p equals, the fraction whose numerator is 281 minus 29, and whose denominator is 6.
Choice B is incorrect. Adding the number of bottles sold individually, 29, to the total number of bottles sold, 281, does not give the number of bottles that were sold in packs of 6. Choices C and D are incorrect and could result from dividing all of the bottles into groups of 6 (incorrectly assuming that all 281 bottles of juice were sold in packs of 6), and either subtracting the 29 bottles sold individually from that result, as in choice C, or adding the 29 bottles to that result, as in choice D.
Link back to question 2.
Link back to question 3.
The Redesigned P S A T/N M S Q T® Page 54Copyright 2015 by the College Board W F-5 K P T 0
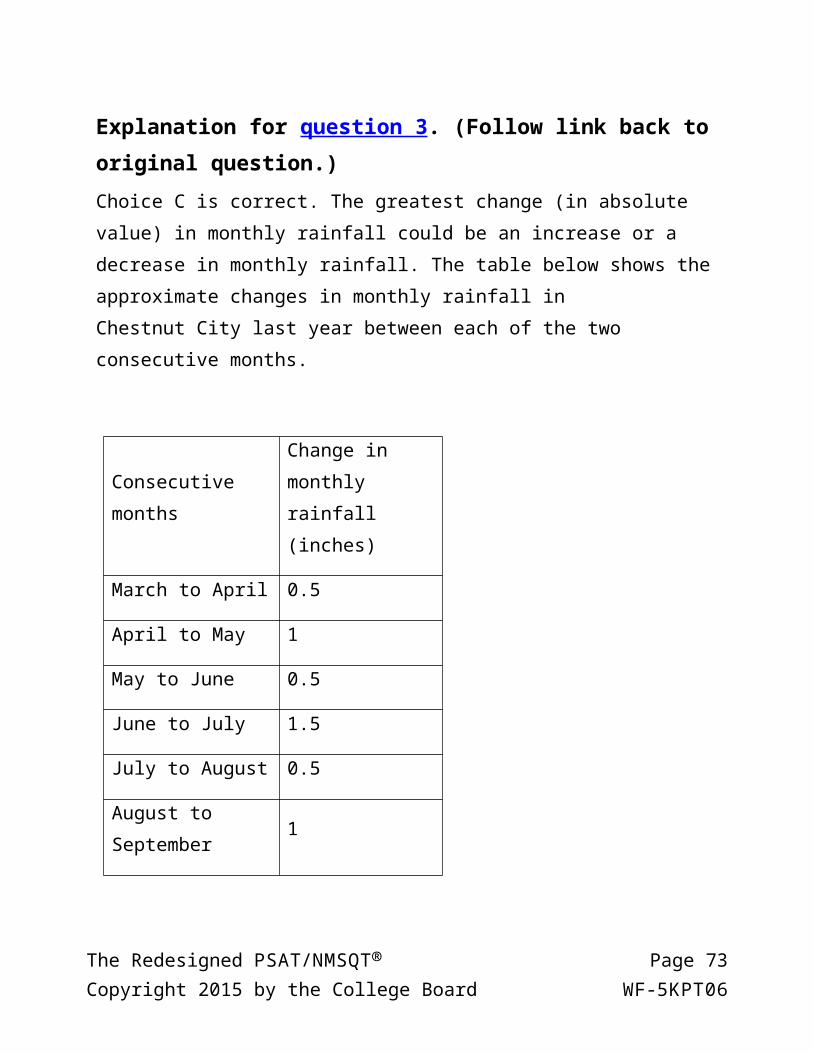
Explanation for question 3. (Follow link back to original question.)Choice C is correct. The greatest change (in absolute value) in monthly rainfall could be an increase or a decrease in monthly rainfall. The table below shows the approximate changes in monthly rainfall in Chestnut City last year between each of the two consecutive months.
Consecutive monthsChange in monthly rainfall (inches)
March to April 0.5
April to May 1
May to June 0.5
June to July 1.5
July to August 0.5
August to September 1
September to October
2.5
Of the values on the right column, the greatest is from September to October, which is a change of 2.5 inches.
Choices A, B, and D contain values that either do not represent any of the changes in monthly rainfall between two consecutive months or that are not the greatest change.
The Redesigned P S A T/N M S Q T® Page 55Copyright 2015 by the College Board W F-5 K P T 0
Link back to question 3.
Link back to question 4.
The Redesigned P S A T/N M S Q T® Page 56Copyright 2015 by the College Board W F-5 K P T 0
Explanation for question 4. (Follow link back to original question.)Choice C is correct. The perimeter of a rectangle is the sum of the four sides and can be calculated using the formula P equals 2 l plus 2 w, where l is the length and w is the width of the rectangle. Subtracting 2 w from both sides of the equation gives P minus 2 w equals 2 l, and then dividing by 2
yields l equals the fraction whose numerator is P minus 2 w, and whose denominator is 2.
Choice A is incorrect. This choice does not use the fact that the perimeter of a rectangle is the sum of two lengths and two widths. Choices B and D are incorrect. In each of these choices, the equation incorrectly doubles the perimeter.
Link back to question 4.
Link back to question 5.
The Redesigned P S A T/N M S Q T® Page 57Copyright 2015 by the College Board W F-5 K P T 0

Explanation for question 5. (Follow link back to original question.)Choice C is correct. To eliminate y, the first equation in the system can be multiplied by 2 and then the equations can be added side by side as shown below.
Equation 1: 4 x minus 2 y equals 12, plus,
Equation 2: x plus 2 y equals negative 2, yields,
Equation 3: 5 x plus 0 equals 10.
Since the result is 5 x equals 10, it follows that x equals 2.
Substituting 2 for x into the equation x plus 2 y equals negative 2 gives
2 plus 2 y equals negative 2, and so y equals negative 2. Therefore, 2 comma negative 2, is the solution to the system given.
Alternatively: Use the substitution method to solve the system. For example, the first equation can be rewritten as y equals 2 x minus 6. Substituting
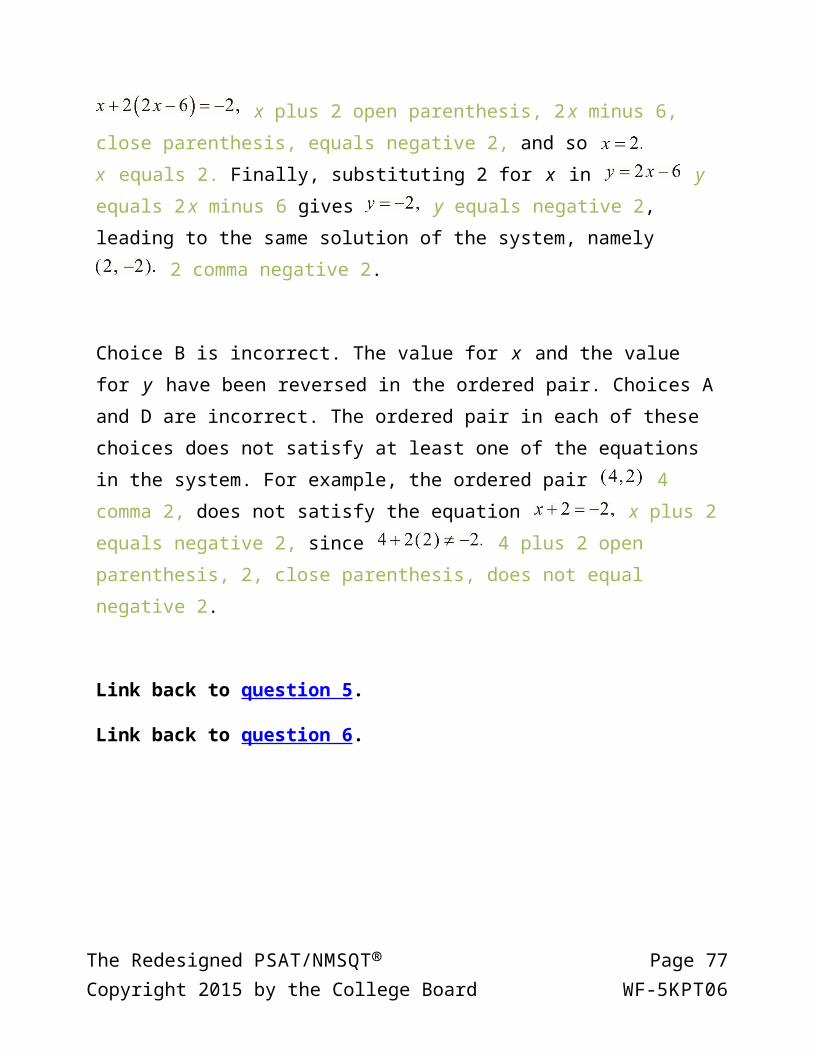
2 x minus 6 for y in the second equation gives x plus 2 open parenthesis, 2 x minus 6, close parenthesis, equals negative 2, and so x equals 2. Finally, substituting 2 for x in y equals 2 x minus 6 gives
y equals negative 2, leading to the same solution of the system, namely 2 comma negative 2.
Choice B is incorrect. The value for x and the value for y have been reversed in the ordered pair. Choices A and D are incorrect. The ordered pair in each of these choices does not satisfy at least one of the equations in the system. For example,
The Redesigned P S A T/N M S Q T® Page 58Copyright 2015 by the College Board W F-5 K P T 0

the ordered pair 4 comma 2, does not satisfy the equation x plus 2 equals negative 2, since 4 plus 2 open parenthesis, 2, close parenthesis, does not equal negative 2.
Link back to question 5.
Link back to question 6.
The Redesigned P S A T/N M S Q T® Page 59Copyright 2015 by the College Board W F-5 K P T 0

Explanation for question 6. (Follow link back to original question.)Choice D is correct. Since 1 gallon equals 128 ounces, 500 gallons equal
500 times 128, which equals 64,000 ounces. Therefore, the maximum number of 20-ounce bottles that can be filled with the
soda from the tank is the fraction 64,000 over 20, which equals 3,200.
Choice A is incorrect and could result from dividing 500 (the number of gallons contained in the tank) by 20 (the capacity of one bottle, in ounces). The gallons need to be converted into ounces first, and then the result can be divided by 20. Choices B and C are incorrect because they do not give the maximum number of 20-ounce bottles that can be filled from the soda in the tank.
Link back to question 6.
Link back to question 7.
Explanation for question 7. (Follow link back to original question.)Choice D is correct. Since the car traveled at an average speed of 80 miles per
hour, the distance the car traveled during 3 hours is open parenthesis, 80, close parenthesis, open parenthesis 3, close parentheses, equals
240. The car consumed fuel at a rate of 34 miles per gallon, so the car used the fraction 240 over 34 gallons of fuel, which is approximately 7 gallons of fuel.
Choices A, B, and D are incorrect. For each of these choices, the amount of fuel is not enough to travel the entire 240 miles.
The Redesigned P S A T/N M S Q T® Page 60Copyright 2015 by the College Board W F-5 K P T 0

Link back to question 7.
Link back to question 8.
The Redesigned P S A T/N M S Q T® Page 61Copyright 2015 by the College Board W F-5 K P T 0

Explanation for question 8. (Follow link back to original question.)Choice D is correct. In the x y-plane, the slope m of a line that passes through the points x 1 comma y 1 and x 2 comma y 2, is the change in y over the change in x (rise over run), which is expressed by the formula
m equals the fraction whose numerator is y 2 minus y 1, and whose denominator is x 2 minus x 1. Thus, the slope of the line through the points
the fraction negative 5 over 2 comma 1, and the negative fraction
one half comma 4, is the fraction whose numerator is 4 minus 1, and whose denominator is the negative one half minus open parenthesis,
negative five halves, close parenthesis, which simplifies to the fraction 3 over 2.
Choices A and C are incorrect because the change in y and the change in x do not
have the same magnitude. Choice B is incorrect; the fraction negative 2 over 3
is the negative reciprocal of the slope of the line through the points
negative five halves comma 1, and negative one half comma 4.
Link back to question 8.
Link back to question 9.
The Redesigned P S A T/N M S Q T® Page 62Copyright 2015 by the College Board W F-5 K P T 0

Explanation for question 9. (Follow link back to original question.)Choice C is correct. The data point that is farthest from the line of best fit is
located at 7 comma 4, which means that this point represents a type of envelope that is 7 inches wide and 4 inches high.
Choices A and B are incorrect because none of the data points with width 2 or 5 is the farthest from the line of best fit. Choice D is incorrect because the scatterplot does not contain any points with width 12 inches.
Link back to question 9.
Link back to question 10.
Explanation for question 10. (Follow link back to original question.)Choice B is correct. The number of games won by the basketball team must be a
whole number. Since 65% is equivalent to the fraction 13 over 20, it follows that, of the choices given, the total number of games the team played last season
can only be 20. Multiplying the fraction 13 over 20 by each of the other answer choices does not result in a whole number.
Choices A, C, and D are incorrect because 65% of each of the numbers in the choices results in non-whole numbers.
Link back to question 10.
Link back to question 11.
The Redesigned P S A T/N M S Q T® Page 63Copyright 2015 by the College Board W F-5 K P T 0

Explanation for question 11. (Follow link back to original question.)Choice C is correct. Since x represents the number of days after the promotion began and y represents the remaining number of coffee samples, the fact that the
ordered pair 11 comma 0, is a solution to the given equation means that it takes 11 days during the promotion until none of the samples are remaining.
Choice A is incorrect; if 11 samples were given away each day, then the coefficient of x in the equation would be 11. Therefore, this is not the correct interpretation of
11 comma 0, as a solution to the equation. Choice B is incorrect; the total number of free coffee samples given away during 11 days of the promotion was 1,210. But the number of customers who were in the store during those days need not be 1,210. Choice D is incorrect; according to the given equation, there were 1,210, not 11, samples available at the start of the promotion.
Link back to question 11.
Link back to question 12.
Explanation for question 12. (Follow link back to original question.)Choice B is correct. Of the choices given, only the scatterplots in A and B show a negative association between variables x and y, and of these two associations, the one depicted in choice B is not linear.
Choice A is incorrect. The association depicted in this scatterplot is negative, but it can also be linear. Choice C is incorrect. The association depicted in this scatterplot is not linear. However, for x greater than 10, the association between x and y is positive. Choice D is incorrect. There is no clear association between x and y in this scatterplot.
The Redesigned P S A T/N M S Q T® Page 64Copyright 2015 by the College Board W F-5 K P T 0

Link back to question 12.
Link back to question 13.
The Redesigned P S A T/N M S Q T® Page 65Copyright 2015 by the College Board W F-5 K P T 0
Explanation for question 13. (Follow link back to original question.)Choice B is correct. The median of a data set is the middle value when the data points are sorted in either ascending or descending order. When the number of the data points is even, then the median is the mean of the two middle values of the sorted data. Hence, the median height of the 26 pyramids is the mean of the 13th and 14th tallest pyramids. Since the number of pyramids that are less than 30 meters high is 5 and the number of pyramids that are less than 60 meters high is 17, the median height of the 26 pyramids must be between 45 and 60 meters. Therefore, of the choices given, only 48 meters could be the median height of the 26 pyramids.
Choices A, C, and D are incorrect because the median height of the 26 pyramids cannot be less than 45 meters or greater than 60 meters.
Link back to question 13.
Link back to question 14.
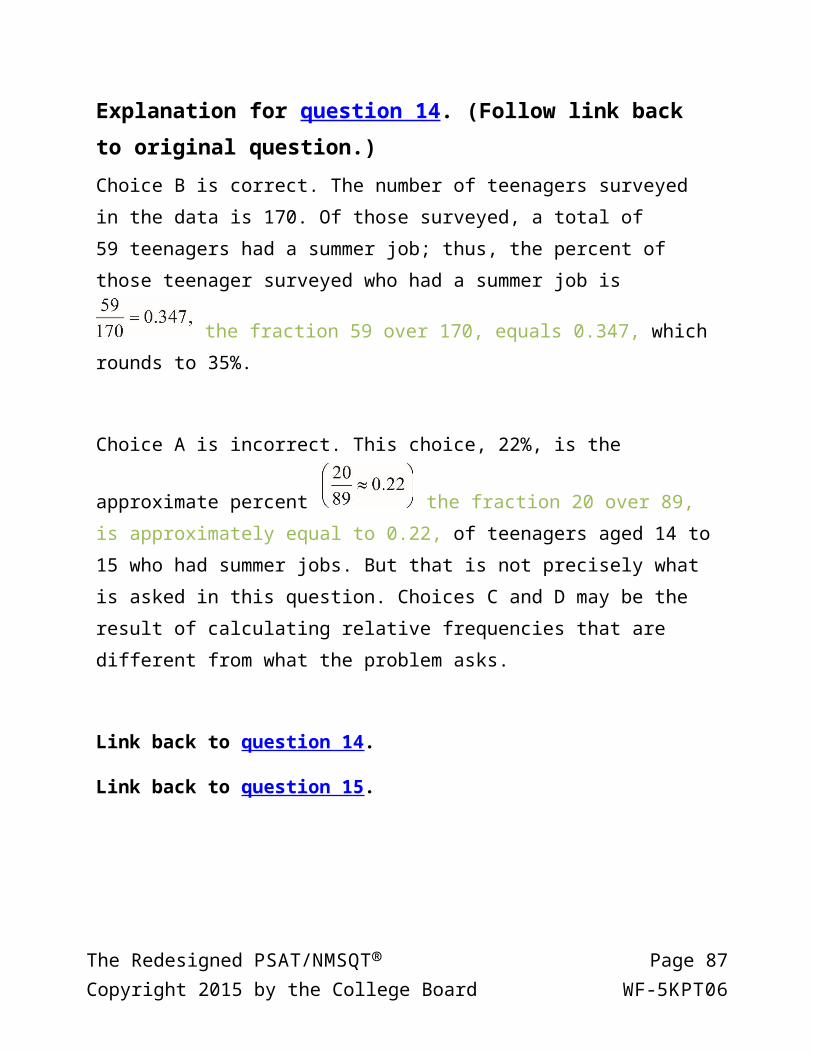
Explanation for question 14. (Follow link back to original question.)Choice B is correct. The number of teenagers surveyed in the data is 170. Of those surveyed, a total of 59 teenagers had a summer job; thus, the percent of those
teenager surveyed who had a summer job is the fraction 59 over 170, equals 0.347, which rounds to 35%.
Choice A is incorrect. This choice, 22%, is the approximate percent the fraction 20 over 89, is approximately equal to 0.22, of teenagers aged 14 to 15 who had summer jobs. But that is not precisely what is asked in this question.
The Redesigned P S A T/N M S Q T® Page 66Copyright 2015 by the College Board W F-5 K P T 0

Choices C and D may be the result of calculating relative frequencies that are different from what the problem asks.
Link back to question 14.
Link back to question 15.
The Redesigned P S A T/N M S Q T® Page 67Copyright 2015 by the College Board W F-5 K P T 0

Explanation for question 15. (Follow link back to original question.)Choice B is correct. In 2012, the total population of individuals in the United States who were between 14 and 17 years old (inclusive) was about 17 million, which is 10 to the power 5 times the size of the survey sample, 170. Since of those surveyed, 39 teenagers aged 16 to 17 had a summer job, it follows that the best estimate of the total number of individuals aged 16 to 17 in
the United States who had a summer job in 2012 was 39 times 10 to the power 5 equals 3,900,000.
Choices A, C, and D are incorrect and are likely the result of either conceptual or calculation errors made.
Link back to question 15.
Link back to question 16.
The Redesigned P S A T/N M S Q T® Page 68Copyright 2015 by the College Board W F-5 K P T 0

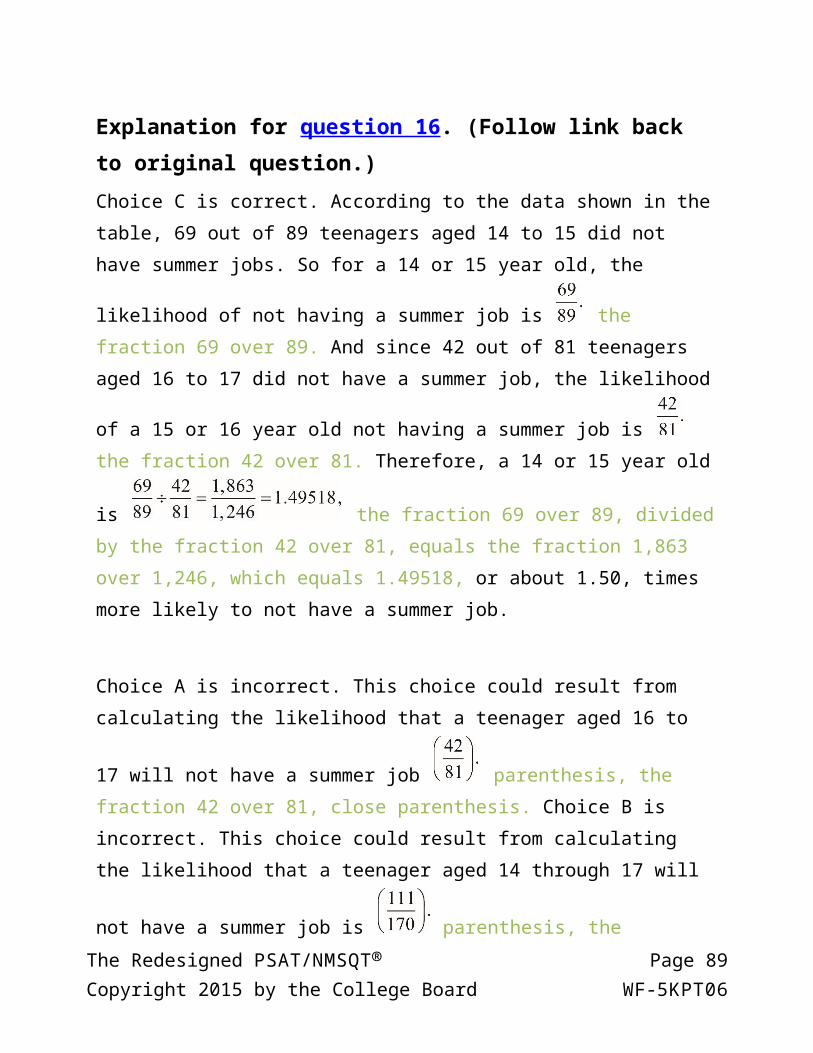
Explanation for question 16. (Follow link back to original question.)Choice C is correct. According to the data shown in the table, 69 out of 89 teenagers aged 14 to 15 did not have summer jobs. So for a 14 or 15 year old,
the likelihood of not having a summer job is the fraction 69 over 89. And since 42 out of 81 teenagers aged 16 to 17 did not have a summer job, the
likelihood of a 15 or 16 year old not having a summer job is the fraction
42 over 81. Therefore, a 14 or 15 year old is the fraction 69 over 89, divided by the fraction 42 over 81, equals the fraction 1,863 over 1,246, which equals 1.49518, or about 1.50, times more likely to not have a summer job.
Choice A is incorrect. This choice could result from calculating the likelihood that
a teenager aged 16 to 17 will not have a summer job parenthesis, the fraction 42 over 81, close parenthesis. Choice B is incorrect. This choice could result from calculating the likelihood that a teenager aged 14 through 17 will not
have a summer job is parenthesis, the fraction 111 over 170, close parenthesis. Choice D is incorrect. This choice could result from calculating the ratio of the number of teenagers aged 14 to 15 who do not have a summer job (69) to the number of teenagers aged 16 to 17 who do not have a summer job (42). If the total number of those surveyed in the two different groups were the same, this result would be correct. But the sizes of the two groups are different; therefore, the result obtained is incorrect.
Link back to question 16.
The Redesigned P S A T/N M S Q T® Page 69Copyright 2015 by the College Board W F-5 K P T 0

Link back to question 17.
The Redesigned P S A T/N M S Q T® Page 70Copyright 2015 by the College Board W F-5 K P T 0

Explanation for question 17. (Follow link back to original question.)Choice C is correct. The table below organizes the information in the graph and the additional data needed to answer the question.
Food product
Cost of 10 grams of product
Amount of product (in grams)
Percent protein
Amount of protein (in grams)
Protein per dollar (in grams/dollar)
A $2.00 10 10%
0.1, times 10, equals 1
the fraction whose numerator is 10 times 0.1, and whose denominator is 2, equals 0.5
B $2.20 10 15%
0.15 times 10, equals 1.5
the fraction whose numerator is 10 times 0.15, and whose denominator is 2.2, equals 0.68
The Redesigned P S A T/N M S Q T® Page 71Copyright 2015 by the College Board W F-5 K P T 0

C $2.50 10 20%
0.2, times 10, equals 2
the fraction whose numerator is 10 times 0.2, and whose denominator is 2.5, equals 0.8
D $4.00 10 25%
0.25 times 10, equals 2.5
the fraction whose numerator is 10 times
0.25, and whose denominator is 4, equals 0.625
E $5.00 10 30%
0.3 times 10, equals 3
the fraction whose numerator is 10 times 0.3, and whose denominator is 5, equals 0.6
According to the table, food product C provides the most protein per dollar (0.8).
Choices A, B, and D are incorrect. For each choice, the protein per dollar for each of the food products is less than 0.8 grams of protein per dollar.
Link back to question 17.
The Redesigned P S A T/N M S Q T® Page 72Copyright 2015 by the College Board W F-5 K P T 0
Link back to question 18.
The Redesigned P S A T/N M S Q T® Page 73Copyright 2015 by the College Board W F-5 K P T 0

Explanation for question 18. (Follow link back to original question.)Choice C is correct. Quadrilateral ABCD is a trapezoid, and the formula for the
area of a trapezoid is A equals one half, h, open parenthesis, b 1 plus b 2, close parenthesis, where b 1 and b 2 are the bases of the trapezoid (BC and A D) and h is the height (B E). If the bases (B C and A D) are each doubled and the height (B E) is reduced by 50%, then the area of the new trapezoid A B C D
would be one half, times the fraction h over 2, open parenthesis, 2 b 1, plus 2 b 2, close parenthesis, which after multiplying out
becomes one half, h, open parenthesis, b 1 plus b 2, close parenthesis, the same as the area of the original trapezoid. Therefore, the area of the trapezoid would not change.
Choice A is incorrect. This choice does not take into account the changes to the bases, B C and A D. Choice B is incorrect. This choice could result from incorrectly interpreting the impact of doubling the bases on the area of A B C D as a 100% increase and the impact of reducing the height by 50% as a 50% decrease, resulting in a combined 100 percent minus 50 percent equals 50 percent increase of the area. Choice D is incorrect. This choice does not take into account the change to height, B E.
Link back to question 18.
Link back to question 19.
The Redesigned P S A T/N M S Q T® Page 74Copyright 2015 by the College Board W F-5 K P T 0

Explanation for question 19. (Follow link back to original question.)Choice A is correct. Since Boyd’s production of tomatoes declined by 20% and the production of raspberries declined by 50% from the previous year, this year, his
tomato production was 140 minus 0.2 times 140 equals 112
pounds and his raspberry production was 60 minus 0.5 times 60 equals 30 pounds. The percent decline in the total yield is the decline in the number of pounds of tomatoes and raspberries divided by the original number of
pounds of tomatoes and raspberries, which is the fraction whose numerator is 28 plus 30, and whose denominator is 140 plus 60, equals 0.29, which equals 29 percent.
Choice B is incorrect. This choice is close to the answer, but rounding may have erroneously led to this answer. Choice C is incorrect. This choice, 35%, may be a result of calculating the mean of 20% and 50%. Choice D is incorrect. This choice is the approximate percent weight of the tomatoes and raspberries produced this year compared to the last year, but that’s not what the problem asks for.
Link back to question 19.
Link back to question 20.
The Redesigned P S A T/N M S Q T® Page 75Copyright 2015 by the College Board W F-5 K P T 0

Explanation for question 20. (Follow link back to original question.)Choice C is correct. There are 12 integers in the list, and some of them are repeated at the frequencies shown in the graph. So the mean of the list of numbers is the sum of the numbers (repeats included) divided by 12. That is
the fraction whose numerator is 0 plus 1 plus 2 plus 3 open parenthesis, 3, close parenthesis, plus 2 open parenthesis, 4, close parenthesis, plus 6, plus 7, plus 8, plus 10, and whose denominator is 12, equals 4.25.
Choice A is incorrect; 3 is the mode, not the mean, of the list of numbers. Choice B is incorrect; 3.5 is the median, not the mean, of the list of numbers. Choice D is incorrect; 12 is the total number of the integers in the list.
Link back to question 20.Link back to question 21.
The Redesigned P S A T/N M S Q T® Page 76Copyright 2015 by the College Board W F-5 K P T 0
Explanation for question 21. (Follow link back to original question.)Choice C is correct. The minimum value of a graphed function is the minimum y-value of all the points on the graph. For the graph shown, the minimum is at the left endpoint of the graph, the y-value of which is negative 2.
Choice A is incorrect. If the graph would continue indefinitely downward, then the minimum value of the function would be negative infinity. However, the domain
of the function is restricted x is greater than or equal to negative 4 and less than or equal to 6, and the minimum value of the graph occurs at point
negative 4 comma negative 2. Choice B is incorrect; negative 4 is the x-value of the point on the graph where the minimum value of the function occurs. Choice D is incorrect because there are points of the graph below the x-axis; therefore, the minimum value of the function cannot be positive.
Link back to question 21.Link back to question 22.
The Redesigned P S A T/N M S Q T® Page 77Copyright 2015 by the College Board W F-5 K P T 0

Explanation for question 22. (Follow link back to original question.)Choice B is correct. The coordinates of the data point that represent Galaxy Q on
the scatterplot are 2.4 comma 500, which means that Galaxy Q is at a distance of about 2.0 M p c from Earth and moves away from Earth at a velocity of approximately 500 kilometers per second. The question asks for the velocity in meters per second; therefore, kilometers (k m) need to be converted into meters (m). Since 1 k m is equal to 1,000 m, it follows that Galaxy Q is moving away from Earth at a velocity of 500 times 1,000 meters per second, or 5 times 10 to the power 5 meters per second.
Choices A, C, and D may result from an incorrect interpretation of the coordinates of the point that represents Galaxy Q on the scatterplot or an incorrect conversion of the units.
Link back to question 22.
Link back to question 23.
Explanation for question 23. (Follow link back to original question.)Choice D is correct. The velocities, in k m/s, of the four galaxies shown in the graph at approximately 0.9 M p c from Earth are about negative 50, +200, +500, and +650. Thus, the range of the four velocities is approximately
650 minus open parenthesis, negative 50, close parenthesis, equals 700 kilometers per second.
Choices A, B, and C are incorrect. The range of velocities is the difference between the largest and smallest velocity. Each of the answer choices A, B, and C are too small compared to the real value of the range.
The Redesigned P S A T/N M S Q T® Page 78Copyright 2015 by the College Board W F-5 K P T 0

Link back to question 23.
Link back to question 24.
The Redesigned P S A T/N M S Q T® Page 79Copyright 2015 by the College Board W F-5 K P T 0

Explanation for question 24. (Follow link back to original question.)Choice A is correct. The model indicates that the relationship between the velocities of the galaxies, in kilometers per second, and their distance from Earth, in M p c, is v equals 500 d. Therefore, the velocity of a galaxy that
is 15 M p c from Earth is v equals 500 times 15 kilometers per second, or 7,500 kilometers per second.
Based on the model, the other choices are incorrect: Choice B is the speed of a galaxy that is 10 M p c from Earth. Choice C is the speed of a galaxy that is 2.2 M p c from Earth. Choice D is the speed of a galaxy that is 1.5 M p c from Earth.
Link back to question 24.
Link back to question 25.
The Redesigned P S A T/N M S Q T® Page 80Copyright 2015 by the College Board W F-5 K P T 0

Explanation for question 25. (Follow link back to original question.)Choice A is correct. Let w represent the width of Janice’s garden and 3 w minus 9 represent the length of Janice’s garden. Since the area of Janice’s garden is
5,670 square feet, it follows that w open parenthesis, 3 w minus 9, close parenthesis, equals 5,670, which after dividing by 3 on both sides
simplifies to w open parenthesis, w minus 3, close parenthesis, equals 1,890.
From this point on, different ways could be used to solve this equation. One could rewrite this quadratic equation in the standard form and use the quadratic formula to solve it. Another approach would be to look among integer factors of 1,890 and try to find two that differ from each other by 3 and whose product is 1,890. The
prime factorization of 1,890 open parenthesis, 2 times 3 to the power 3, times 5, times 7, close parenthesis can help with this. Two factors that satisfy the conditions above are 42 and 45 (note that 42 equals 2 times 3 times 7 and 45 equals 3 squared times 5). The numbers
negative 45 and negative 42 also satisfy the above conditions open parenthesis, w equals negative 42, close parenthesis, but since w represents the width of Janice’s garden, the negative values of w can be rejected. Thus
w equals 45 feet, and so the length of the garden must be
3 times 45 minus 9 equals 126 feet. Therefore, the perimeter
of Janice’s garden is 2 open parenthesis, 45 plus 126, close parenthesis, equals 2 open parenthesis, 171, close parenthesis, equals, 342 feet.
Choice B is incorrect. This answer choice could result from incorrectly identifying the width of the garden as 42 feet instead of 45 feet. Choices C and D are incorrect;
The Redesigned P S A T/N M S Q T® Page 81Copyright 2015 by the College Board W F-5 K P T 0

both answers would result in an area of the garden that is significantly smaller than 5,670 square feet. For example, if the perimeter of the garden were 270 feet, as in choice D, then w plus l equals 135 feet, where w represents the width and l represents the length of the garden. So l equals 135 minus w. It is also given that l equals 3 w minus 9, which implies that
135 minus w equals 3 w minus 9. Solving this for w gives w equals 36, and so l equals 99. The area of the garden would then
be 36 times 99 square feet, which is clearly less than 5,600 square feet.
Link back to question 25.Link back to question 26.
Explanation for question 26. (Follow link back to original question.)
Choice D is correct. Since the ratio of lowercase b to lowercase a, involves only the legs of the right triangle, it follows that, of the given choices, the ratio can be equal to the tangent of one of the angles. In a right triangle, the tangent of an acute angle is defined as the ratio of the opposite side to the adjacent side of the angle. Side b is opposite to angle B and side a is adjacent to angle B. Therefore,
tangent B equals the fraction of lowercase b over lowercase a.
Choices A and B cannot be correct; the sine of an acute angle in a right triangle is defined as the ratio of the opposite side to the hypotenuse, and the ratio shown involves only the legs of the triangle. Choice C is incorrect. In the triangle ABC
shown, tangent A equals the fraction of lowercase a over lowercase b,
not the fraction of lowercase b over lowercase a.
The Redesigned P S A T/N M S Q T® Page 82Copyright 2015 by the College Board W F-5 K P T 0

Link back to question 26.Link back to question 27.
The Redesigned P S A T/N M S Q T® Page 83Copyright 2015 by the College Board W F-5 K P T 0

Explanation for question 27. (Follow link back to original question.)Choice A is correct. The solution set of the inequality y is less than or equal to negative x is the union of sections R and S of the graph. The solution set of the inequality 2 y is greater than 3 x plus 2 is the union of sections R and Q of the graph. The solutions of the system consist of the coordinates of all the points that satisfy both inequalities, and therefore, section R represents all the solutions to the system since it is common to the solutions of both inequalities.
Choices B, C, and D are incorrect because they contain ordered pairs that do not satisfy both of the inequalities.
Link back to question 27.Link back to question 28.
The Redesigned P S A T/N M S Q T® Page 84Copyright 2015 by the College Board W F-5 K P T 0

Explanation for question 28. (Follow link back to original question.)The correct answer is 6. Since the vertex of the graph of the quadratic function is at
4 comma 19, the equation of the parabola is of the form
y equals a, open parenthesis, x minus 4, close parenthesis,
squared, plus 19. It is also given that the parabola passes through point 0
comma 3. This means that 3 equals, a, open parenthesis, 0 minus 4, close parenthesis, squared, plus 19, and so a equals negative 1. So
the graph of the parabola is y equals negative open parenthesis, x minus 4, close parenthesis, squared, plus 19.
Since the line passes through the points 0 comma negative 9 and
2 comma negative 1, one can calculate the slope of the line open parenthesis, the fraction whose numerator is negative 1 minus, negative 9, and whose denominator is 2 minus 0, equals 4, close parenthesis that passes through these points and write the equation of the line in the slope-intercept form as
y equals 4 x minus 9.
The coordinates of the intersection points of the line and the parabola satisfy both the equation of the parabola and the equation of the line. Therefore, these coordinates are the solutions to the system of equations below:
y equals 4 x minus 9
y equals negative open parenthesis, x minus 4, close parenthesis, squared, plus 19
The Redesigned P S A T/N M S Q T® Page 85Copyright 2015 by the College Board W F-5 K P T 0

Substituting 4 x minus 9 for y into the second equation gives
4 x minus 9 equals negative open parenthesis, x minus 4, close parenthesis, squared, plus 19, which is equivalent to x squared minus 4 x minus 12 equals 0. After factoring, this equation can be
rewritten as open parenthesis, x minus 6, close parenthesis, open parenthesis, x plus 2, close parenthesis, equals 0, and so x equals 6 or
x equals negative 2. Since point v comma w is on the right side of the y-axis, it follows that v cannot be negative 2. Therefore, v equals 6.
Link back to question 28.Link back to question 29.
Explanation for question 29. (Follow link back to original question.)The correct answer is 9. Let x be the number of sections that will be studied by 2 students and y be the number of sections that will be studied by 4 students. Since there are 24 sections that will be studied by 78 students, it follows that x plus y equals 24 and 2 x plus 4 y equals 78. Solving this system gives
x equals 9 and y equals 15. Therefore, 9 of the sections will be studied by a group of 2 students.
Alternatively, if all 24 sections were studied by a group of 4 students, then the total number of students required would be 24 times 4 equals 96. Since the actual number of students is 78, the difference 96 minus 78 equals 18 represents the number of “missing” students, and each pair of these “missing” students represents one of the sections that will be studied by 2 students. Hence, the number of sections that will be studied by 2 students is equal to the number of
The Redesigned P S A T/N M S Q T® Page 86Copyright 2015 by the College Board W F-5 K P T 0
pairs that 18 students can form, which is the fraction 18 over 2, equals 9.
Link back to question 29.Link back to question 30.
The Redesigned P S A T/N M S Q T® Page 87Copyright 2015 by the College Board W F-5 K P T 0

Explanation for question 30. (Follow link back to original question.)The correct answer is 510. As the arrow moves upward, its speed decreases continuously and it becomes 0 when the arrow reaches its maximum height. Using the position-speed equation and the fact that v equals 0 when h is maximum gives
0 equals 100 squared, minus 2 g h. Solving for h gives h equals the fraction whose numerator is 100 squared, and whose denominator is 2 times 9.8 meters, which to the nearest meter is 510.
Alternatively, the maximum height can be found using the position-time equation. Substituting 100 for v sub 0 and 9.8 for g into this equation gives
h equals 100 t, minus one half parenthesis, 9.8, close parenthesis, t squared. Completing the square gives the equivalent equation
h equals negative 4.9 open parenthesis, t minus the fraction 100 over 9.8, close parenthesis, squared, plus 4.9 open parenthesis, the fraction 100 over 9.8, close parenthesis, squared. Therefore, the maximum height
from the ground the arrow will rise is 4.9 open parenthesis, the fraction 100 over 9.8, close parenthesis, squared meters, which to the nearest meter is 510.
Link back to question 30.
Link back to question 31.
The Redesigned P S A T/N M S Q T® Page 88Copyright 2015 by the College Board W F-5 K P T 0
Explanation for question 31. (Follow link back to original question.)The correct answer is 10.2 seconds. As the arrow moves upward, its speed decreases continuously, and it becomes 0 when the arrow reaches its maximum height. Using the speed-time equation and the fact that v equals 0 when h is maximum, we get 0 equals 100 minus 9.8 t.
Solving this equation for t gives t equals the fraction 100 over 9.8, which equals 10.2041 seconds, which to the nearest tenth of a second is 10.2.
Link back to question 31.
Stop. This is the end of the answers and explanations for questions 1 through 31.
The Redesigned P S A T/N M S Q T® Page 89Copyright 2015 by the College Board W F-5 K P T 0