mathematics taught at a fast pace: alongitudinal
TRANSCRIPT

Mathematics Taught at aFast Pace: A LongitudinalEvaluation of SMPY°s FirstClassCAMILLA PERSSON BENBOW,SUSAN PERKINS, andJULIAN CGC. STANLEY
Abstract
Fast-paced classes have been advocated in SMPY’s pro-
posals for curricular flexibility. To evaluate the long-term
effects of such a class, the responses to two questionnaires
completed nine years later by both the participants and
the nonparticipants of SMPY’s first two mathematics
classes were analyzed. The participants scored significantly
higher in high school on the SAT-M, expressed greater
interest in mathematics and science, and accelerated their
education much more than the nonparticipants. Gaps in
knowledge of mathematics by the participants were not
found. All groups attended selective colleges, but the
students who completed the fast-paced class chose the
most academically difficult. It is concluded that when
highly able youths are presented the opportunity, many of
them will accumulate educational advantage.
L, chapter 11 of this volume Feldhusen arguesthat “eclec-tic” educational programming is necessary to meet the needs of giftedstudents. To meet the special needs of the highly gifted, Feldhusen advo-cates acceleration. To meet the special needs of highly mathematicallyprecocious students, the Study of Mathematically Precocious Youthdevised a “fast-paced” mathematics class (Fox 1974; George & Denham1976; Stanley 1976; Bartkovich & George 1980). As the name indicates,
51

52 Camilla Persson Benbow, Susan Perkins, and Julian C. Stanley
mathematics in it was taught at a rapid pace geared to the ablest members
of the class. The content was the regular precalculus curriculum taught in
junior high and senior high school (algebra I and II, geometry, college
algebra, trigonometry, and analytic geometry). The first class, designated
Wolfson I in honorofits splendid teacher, Joseph R. Wolfson, met from
June 24, 1972, until August 11, 1973.
The program was designed primarily for students in Baltimore County
public schools who hadfinished thesixth grade. In orderto beeligible, the
students had to have scored on the Academic Promise Test (APT) (Psy-
chological Corporation 1959) at the ninety-ninth percentile of sixth-grade
norms on the number(arithmetic) subtest and at the ninety-ninth percen-
tile of sixth-grade norms oneither the abstract reasoning or the verbal
subtest. In addition to the twenty-five students so identified there were six
highly recommended, able students known by SMPY. Thus thirty-one
students (nineteen boys and twelvegirls) were invited to attend the class;
fourteen boys and sevengirls accepted. One boy ' dropped out ofthe class
during the first week and a second onedid so withinthe first few weeks.
Oneboy and twogirls were added to the class in September. As a result,
thirty-four students had the opportunity to attend SMPY’sfirst fast-paced
mathematics class; twenty-two stayed long enough to reap some benefits
from it.
The initial success and progress of this class have been discussed
previously (Fox 1974; Stanley 1976, pp. 156-59). Thus only a brief sum-
mary is supplied here. As noted, nineteen students stayed in the program
and studied algebra I for nine weeks on Saturday mornings, two hours
each week during the summerof 1972. Of those nineteen, fourteen scored
high enough on the Educational Testing Service’s (ETS) Cooperative
Mathematics Tests: Algebra I (ETS 1962) to be able to continuein the pro-
gram and study algebra II. The other five students were advised to take
algebra I as seventh-graders the next year in school. At this time one other
student chose to dropthe class because hergirlfriend did, but three others
(two ex-seventh-graders and one ex-sixth-grader) were added. Thus in the
fall of 1972 sixteen students (nine boys and sevengirls) began the study of
algebra II for two hours on Saturday mornings. This group waslater split
into a “fast” class or group and a “slow” class or group. The members of
the slow group (two boys and fourgirls) had had trouble keeping up with
the pace of theclass or had scored low on the standardized AlgebraII test.
The goal of the slow group wasto finish algebra II by June, 1973, when
most of them would be completing the seventh grade. The goal of the fast
group was to complete algebra II, college algebra, geometry, trigonom-
etry, and analytic geometry by August, 1973. Of the ten personsin the fast
group, twogirls decided not to study plane geometry with the class during
the summer of 1973.

53 Mathematics Taught at a Fast Pace
Althoughthe goals for this pioneering group were impressive, they were
met successfully (see Fox 1974). The original Wolfson I class surpassedSMPY’s expectations. In twelve to fourteen months, eight students com-pleted 41% years of mathematics, two completed 3% years, and six com-pleted 2 years.
More than nine years had passedsince the inception of this class whenthis evaluation of its fairly long-term effects took place.
Longitudinal Follow-Up Procedure
In May 1980 two questionnaires were mailed to each ofthe thirty-fourstudents who hadbeen given the opportunity to attend the WolfsonI class.One of the questionnaires was an eight-page follow-up survey that hadbeen sent to SMPYstudents in the fall when the students would have beengraduated from high school (see Appendix 2.1). Most of the students hadbeen mailed this questionnaire as part of the general follow-up conductedby SMPY.For information on how the follow-up wascarried out and thegeneral results for the whole SMPYgroup, see Benbow,chapter 2 ofthisvolume. The students who were not in this follow-up or who had notresponded were sent another follow-up questionnaire with a $5 induce-ment for completion, along with the second questionnaire, in May, 1980(see Appendix 4.1). The additional three-page questionnaire brought eachstudent’s educational progress up to date as of the summer of 1980. Anautographed copy of one of SMPY’s volumesin the Studiesin IntellectualPrecocity series was offered as a compensation for completing that ques-tionnaire. The response rates for the two questionnaires were 100 percentfor the follow-up questionnaire and 94 percent for the additional WolfsonI questionnaire.
ANALYSIS
The resulting data were coded and keypunchedonto the computer byuse of the Filgen and Qgen systems (The Johns Hopkins University Com-puting Center). The students in the study wereclassified into four groupsupon which the data analysis was performed using the SPSS program (Nieet al. 1975). The composition of the four groups can be seen in table 4.1.The student who had attended only onesession of Wolfson I was excludedfrom all analyses. The following year he had attended the second fast-paced mathematics class conducted by SMPY (Wolfson II). It was felt thathis inclusion for Wolfson I would bias the results.

54 Camilla Persson Benbow, Susan Perkins, and Julian C. Stanley
TABLE4.1. Classification of the Students Included in the Analysis Who Were Giventhe
Opportunity to Attend Wolfson I (by Their Course of Action)
Group A
Finished Wolfson I in the Fast Class4
Group B
Finished Wolfson I in the Slow Class
Number Number
Boys 7 Boys 2
Girls 3 Girls 4
Total 10 Total 6
Group C
Dropped Out or Were Asked to Leave
Wolfson I
Group D
Did Not Attend Wolfson I
Number Number
Boys 5 Boys 5
Girls 2 Girls 5
Total 7 Total 10
NOTE: To reduce bias, one boy was excluded from the analysis because he attended only one
meeting of Wolfson I and later completed Wolfson II.
aTwogirls in this group did not complete the whole sequence, because they did not attend
the class meetings during the summer of 1973.
Results
SAT SCORES
Most of the students who were extended the opportunity to join
Wolfson I participated in one of SMPY’s talent searches, where they took
the College Board’s Scholastic Aptitude Test-Mathematics and -Verbal in
January or February of 1973. Three were in SMPY’s March, 1972, search.
Their performance on the SATin the talent search as either seventh- or
eighth-graders and thenlater in high schoolis contrasted by groupin table
4.2. Every group’s mean SAT-Mscorein the talent search surpassed the
meanscore obtained in any of SMPY’stalent searches (Benbow & Stanley
1980). Furthermore, the mean scores on the SAT of the groups in high
school were much superior to the mean scores obtained in high school by
the participants in the first three talent searches (Benbow,chapter 2 ofthis
volume) and by college-bound seniors.
Although there were certain biases between the groups with respect to
taking the SATin
a
talent search (e.g., all ten members of Group A took
the SAT, whereasonly four of six — 67 percent — of Group B did), it seems
that at the timeofthe talent search the members of Group A (the ones who
completed Wolfson I in the fast class) received the highest SAT scores,
followed by Group B (the ones who completed Wolfson I in the slow
class). Groups C (who droppedout of or were asked to leave Wolfson I)
and D (whodid not attend Wolfson I) scored similarly on SAT-M (scoring

55 Mathematics Taught at a Fast Pace
TABLE 4.2. SAT Scores at the Time of Talent-Search Participation andas Reported in High School (by Group)
Mean Standard Mean Standard Mean ofGroup4 N SAT-M__ Deviation SAT-V_ Deviation Year Taken?
Talent Search
A 10 633 64 487 78 73
B 4 563 86 525 76 73
C 5 488 53 382 67 73D 5 492 85 420 46 73.4
High School
A 10 751 47 624 80 75.2
B 6 736 30 645 108 76.3
C 7 708 61 582 56 77.3
D 10 708 39 613 71 77.2
4For the meaning of A, B, C, and D here andin tables 4.2-4.8, see table 4.1.61973 talent-search SAT scores wereused if available.
approximately 140 points lower than Group A or 70 points lower than
Group B). The differences between the groups were significant by an
Analysis of Variance (ANOVA) (F = 6.9, p< .01). The talent search SAT-
V scores were also significantly different between groups by an ANOVA
(F = 3.8, p< .05). Group B, followed by A, had the highest scores.
In high school there is a complicating factor when comparing perfor-
mance on the SAT —the groups did not take the SAT at the sametime.
Group A took their SATsin high school oneyearearlier, on the average,
than Group B, whotook the SAT oneyear earlier than Groups C and D.
Yet on SAT-M GroupsA andB scoredessentially the same and superior to
Groups C and D, who scored similarly. The differences between the
groupsweresignificant by an ANCOVA(analysis of covariance) control-
ling for year taken (F = 3.7, p< .05). On the SAT-V, however, Group B
scored better than the other three groups, but the mean difference between
groups wasnotsignificant.
MATHEMATICS COURSE-TAKING
IN HIGH SCHOOL
The mathematics course-taking in high school by the students in the
various groupsis shown andcontrasted in table 4.3. Because of the format
of Wolfson I, 80 percent of the fast group would havefinished the 41%
years of precalculus mathematics, while 100 percent of the students in the
slow group should have finished algebra II. Later in high schoolall but one
(83 percent) of the students in the slow groupfinished the precalculus
sequence, and everyonein the fast group did. This percentage of studentsreporting a completion of precalculus was muchhigher than for the othergroups.

56 Camilla Persson Benbow, Susan Perkins, and Julian C. Stanley
TABLE4.3. Reported High-School Mathematics Course-Taking (by Group)
Course Grade
Numberof Years of
Precalculus Courses
Taking Standard Standard
Group Course/Total Mean Deviation Mean Deviation
A 10/10 — — 4.5 0
B 6/6 3.4 0.6 4.3 0.3
Cc 7/7 3.6 0.6 4.0 0.5D 10/10 3.6 0.6 3.9 0.6
Course Grade# School Grade®
Standard Standard
Mean Deviation Mean Deviation
Calculus I (Differential)
A 9/10¢ 3.4 0.5 10.1 1.1B 4/6 3.8 0.5 11.3 1.0
C 5/7 3.2 1.3 11.8 0.4
D 8/10 3.6 0.5 11.3 0.9
Calculus II (Integral)
A 9/10¢ 3.6 0.7 10.4 0.9B 4/6 3.8 0.5 11.3 1.0
C 2/7 4.0 0 12.0 0
D 5/10 3.8 0.5 11.2 0.8
Note: Noneof the group differences in course grades and school grades wassignificant by
an ANOVA.
af = AS3 =B2=C1=D;0=F.
b&§ = eighth grade,etc.¢ Whilestill in high school the missing person took calculus at a college.
With regard to the next level of mathematics in high school, 100 percent
of Group A completed one year of calculus (one person did so at a com-
munity college as a high-school student), whereas 67 percent, 29 percent,
and 50 percent of GroupsB, C, and D,respectively, did so (table 4.3). Not
shown in Table 4.3 is that high-school mathematics enrichment courses
were taken mostly by Group B.
The grades earned by the students in the mathematics classes were
uniformly high. As expected, Group A students took their mathematics at
an earlier age than did students in all the other groups. Group B students
took precalculus mathematics, but not calculus or enrichment courses,
earlier than either Group C or Group D students (table 4.3).
AP MATHEMATICS EXAMINATIONS
Of the mathematics courses taken in high school, the most advanced
and difficult are those that have as their goal the taking of the Advanced
Placement Program examinations. Students are offered their choice of two
AP mathematics examinations, Level AB and the more advanced Level
BC. A high score on the Level AB examination can yield credit for a one-

57 Mathematics Taught at a Fast Pace
TABLE4.4. Performance of the Groups on the Advanced Placement ProgramMathematics Examinations (by Group)
Taking Exam/ Mean Standard Mean ofGroup Total Score4 Deviation Year Taken
Calculus AB
A 3/10 3.7 0.6 75.3B 2/6 4.0 1.4 76.5C 2/7 3.5 0.7 78.0D 1/10 4.0 — 78.0
Calculus BC
A 6/10 4.2 0.8 75.6D 2/10 3.5 0.7 77.0
4Grades on the APP exams can range from 1 (the lowest possible) to 5 (the highestpossible).
semester college course in calculus, while two semestersofcredit in collegecalculus can be gained from success on the BC examination. Grades onthese examinations range from 1 to 5, where3, 4, or 5 are considered high.Ninety percent of the students in Group A took these exams, whichis ahigher percentage than for the other groups(see table 4.4). Group A tookmostly the BC exam. This wasnottrue for the other three groups. Further-more, Group A took these examsearlier, on the average, than the othergroups.
COLLEGE COURSES AS A
HIGH-SCHOOL STUDENT
Some of the students took college courses on a part-time basis for col-lege credit while they werestill in high school. With respect to collegecourses, Group A, with a mean number of 4.8 taken, was much moreactive than Groups B, C, and D, which took a mean of 0, .14, and .3,respectively. Group A had taken at least sixteen times as manycollegecourses as the other groups. College courses taken by the students inGroups C and D were mainly in the field of mathematics. Especially disap-pointing, however, is Group B’s lack of use of this educational alternative,coupled with the fact that not one memberof the group had taken the APCalculus BC exam. They had been the poorerachievers in SMPY’sfirstfast-paced mathematics class and continued to be so thereafter.
COLLEGE BOARD ACHIEVEMENTTESTS
The performance of the four groups on nineofthe fifteen achievementtests of the College Board can be seen in table 4.5. These tests measure thestudents’ achievementin a high-school subject, usually during the eleventhor twelfth grade.

58 Camilla Persson Benbow, Susan Perkins, and Julian C. Stanley
TABLE4.5. Reported Performance on the College Board’s Achievement Tests Taken byat
Least One Person (by Group)
National Sample of
1978 College-Bound
Students Taking
the Test
Mean of Percentile Rank
Mean Standard Year Standard of SMPY Students’
Group N Score’ Deviation Taken Mean Deviation Scores
Math Level I
A 1 800 — 76.0 99 +
B 3 697 95 74.5 541 99 93
C 2 745 49 77.0 97
Math LevelII
A 7 778 37 75.8 87
B 3 710 28 76.0 665 95 62
C 1 800 — 75.0 91
D 6 760 48 77.5 81
English Composition
A 6 683 102 75.8 94
B 4 655 41 76.3 90
C 4 589 169 76.5 512 105 74
D 4 727 17 77.5 98
Biology
A 710 — 77.0 92
B 555 78 75.0 544 111 50
Chemistry
A 4 630 99 75.5 67
B 1 540 — 77.0 40
C 2 620 71 76.5 577 102 63
D 3 727 47 77.7 91
Physics
A 2 670 85 77.0 72
B 2 545 92 75.5 591 106 35
French
C 2 615 35 76.5 72
D 2 640 28 77.5 552 109 75
Spanish
C 1 540 — 78.0 544 120 53
Russian
A 2 580 99 76.5 587 148 51
aThe differences between groupswerenotsignificant.

59 Mathematics Taught at a Fast Pace
Of special interest is the groups’ performance on the mathematics
achievement tests, Level I and the more difficult Level II. In table 4.5 it
can be seen thatall the groups scored extremely high. The meanscores are
not far from the maximum score of 800, except for Group B’s perfor-
mance on Mathematics Level I, which they took at an early age. The
percentile ranks of the mean scores were also high. Furthermore, the
groups’ mean score on Mathematics Level I was 189 points superior to the
mean of a national sample of college-bound seniors, and on Mathematics
Level II 96 points, also more than a standard deviation. Thusthe perfor-
mance of all the groups wasexcellent. Learning mathematics at a rapid
pace is seen not to be detrimental to longer-term retention or achievement
in mathematics, because if this were the case, we would expect Groups A
and B to receive lower scores than the other two groups.
Several interpretations of the data can be made from the performanceon the remaining achievementtests (see table 4.5). A high percentage ofthe students took the English Composition examination in high school.Group D madethe best scores, but the members of Group D werealsomuch older than the other groups’ members whenthe test was taken. Themean difference between groups wassignificant by an ANCOVAcontrol-ling for year taken (F = 3.6, p< .05).
Anothertrend in the data of table 4.5 is that of the science examina-tions; Chemistry (with ten takers) was most popular. Performanceonallthe examinations was excellent and for the most part was above the meansfor a college-bound sample of high-school students (CEEB 1979).
AWARDS AND HONORS
In the two questionnaires the students were asked to report any awardsand honors won,including National Merit Scholarship Corporation andmathematics contest participation. The National Merit competition isjudged on the basis of high scores on the Preliminary Scholastic AptitudeTest.? All the groups, except perhaps C, did well in this competition(i.e.,100 percent of Group A, 66 percent of Group B, 75 percent of Group D,and 14 percent of Group
C
received at least a Letter of Commendation).Two members of Groups A and D did not take the PSAT.
With respect to scholastic awards and honors won in high school, 40percent, 67 percent, 43 percent, and 80 percent of Groups A,B, C, and D,respectively, reported receiving at least one. In college the percentage ofthe groups’ members reporting having received at least one award or honorranged between 29 and 60 percent.
With regard to participation in mathematics contests (not includingSMPY’s talent searches), 60 percent of Group A reported having par-ticipated in at least one, while no one in GroupB did and only 43 percentand 10 percent of Groups C and D,respectively, did.

60 Camilla Persson Benbow, Susan Perkins, and Julian C. Stanley
COLLEGE ENTRANCE AND STATUS
Every student except one in Group C had entered a college or university
on a full-time basis (see table 4.6). The students’ ages at college entrance
varied greatly, however. Group A wason the average two years ahead of
GroupB andat least three years ahead of Groups C and D in date ofcol-
lege entrance. Furthermore, the difference between groups in percentage
of students entering college early is large (see column 10 of table 4.6). Of
GroupA,90 percent entered early, while only 33 percent and 10 percent of
GroupsB and D,respectively, did so, and no one in Group C did. Totest
for significant differences between groups on date of college entrance, an
ANOVA was performed. The difference was significant (F = 9.7, p
« ,001).3 In addition, Group A students had on the average at least six
times as many advanced-standing credits as students in the other groups
when they began college. Appendix 4.2 updates where in college or
graduate school each student in the four groups was as of the summerof
1980; clearly the students in the fast group are much ahead of membersof
the other groups.
COLLEGE INTELLECTUALISM AND
STATUS SCORES
The colleges attended by the students were given, where available, an
intellectualism and a status score obtained from the Astin (1965) scale.
Astin (1965, p. 54) defines a four-year college with a high intellectualism
score as having a student body that “would be expected to be high in
academic aptitude (especially mathematical aptitude) and to have a high
percentage of students pursuing careers in science and planning to go on
for Ph.D. degrees.” A four-year college with a high status score is defined
as having a student body that “would be expected to have a high percent-
age of students who come from high socioeconomic backgrounds and who
themselves aspire to careers in enterprising fields (lawyers, business execu-
tives, politicians)” (ibid.). The scores are T-scores having a mean of 50 and
a standard deviation of 10.
The meansofthe college ratings by group were all above 50, but they
were notsignificantly different from each other by group. The mean intel-
lectualism scores ranged between 57 for Group C and 67 for Group A.
Group A attended the most academically difficult colleges or universities, *
followed by B, D, and C,in that order. In terms of the status scores,
Group D cameout highest, with a mean of 59, followed by A, B, and C,
all with mean scores of 55. Clearly, the four groups attendedintellectually
and socially elite schools. Appendix 4.2 lists the colleges attended by the
students.

19
TABLE 4.6. Year of Reported College Entrance and Comparison of Reported College Status at Time of Entrance and Degree of Educational
Acceleration (by Group)
Year of College Entranc Percentage Mean Number
— oreo Standard Entering of Advanced Standard
Group 1974 1975 1976 1977 19784 1979 Entrance Year> Deviation Early Standing Credits® Deviation
A 2 1 4 1 2 0 1.4 90 24.7 11.9
B 0 0 2 0 4 0 1.0 33 2.0 3.1
C 0 0 0 0 6 0 0 0 3.4 3.8
D 0 0 0 l 6 3 0.5 10 4.1 7.7
Degree of Acceleration
(Percentage of Group)
Some, But At Least One
Less than Year, But Fewer ears StandardGroup N None One Year than Three Years Mean4, ¢ Deviation
A 10 0 10 20 2.6 0.7
B 6 50 17 33 0.8 1.0
C 7 29 43 29 1.0 0.8
D 10 30 50 20 0.9 0.7
aExpected year for most of these students.
bThe difference between group meanswassignificant (F = 9.
©The difference between group means wassignificant (F = 5
d Acceleration was coded asfollows:0
1
2
3
©The difference between group meanswassignificant (F = 13.7, p «.001).
None
Less than 1 year
One year or more but fewer than 3Three years or more

62 Camilla Persson Benbow, Susan Perkins, and Julian C. Stanley
TABLE4.7. Reported Use of Accelerative Options
Mean Number of
Mean Number College Credits
of Grades Standard Received from
Group N Skipped Deviation APP Exams
A 10 2.0 1.2 8.0
B 6 0.7 1.0 2.0
C 7 0.4 0.8 3.4
D 10 0.1 0.3 3.3
ACCELERATION
Each student was rated on the degree to which his or her educational
progress had become accelerated eight years after the beginning of the
Wolfson I class (see table 4.6). Members of Group A were much more
accelerated than membersof the other groups. In Group A 70 percent were
accelerated by three or more years, while not one person in the other
groups was. Membersofall the other groups were, however, somewhat
accelerated on the average, but no big differences can be seen between
Groups B, C, and D. The differences between groupsin acceleration were
statistically significant (F = 13.7, p< .001).
The way the students’ acceleration was achieved is shown and con-
trasted by groupin table 4.7. Group A madeuseofall the options and toa
muchgreater extent that did the other groups, which used the accelerative
options to about the same degree. Not includedin table 4.7 is the fact that
Groups A and B had beeninitially accelerated in mathematics as part of
the Wolfson I class. Appendix 4.2, where the status of each student’s
educational progress as of June, 1980, is shown, highlights the results of
tables 4.6 and 4.7.
ACCELERANTS’ VIEW OF ACCELERATION
The accelerated students in all groups were asked to rate howtheyfelt
their educational acceleration had affected their social and/or emotional
development. They were also asked to reconsider their decision to acceler-
ate. Overall, the students felt positive about their acceleration.
With regard to social and/or emotional development, only one (in
GroupC) of the twenty-two accelerants felt that acceleration had affected
him much to the worse. This same person, however, would accelerate his
educational progress again if he had a chanceto reconsider the decision. In
contrast, 18 percent of the accelerants felt acceleration had affected
him/her muchfor the better. On the average,all the groups felt that accel-
eration had slightly benefited their social and/or emotional development
and certainly had not hindered it. There were group differences, but they

63 Mathematics Taught at a Fast Pace
Mean Numberof Percentage
Credits Received Percentage Receiving
for College Work Completing Master’s Degree
Standard Completed in Standard College in Fewer Concurrently
Deviation High School Deviation Than Four Years with Bachelor’s
6.0 11.0 8.9 50 10
3.1 0 0 0 0
3.8 3.8 3.8 0 0
7.8 3.2 0 10 0
were not found to be significant by an ANOVA.It must be noted that
Group A was much moreaccelerated than the other groupsandstill held
overall positive feelings.
How did the accelerants reconsider their decision to accelerate? Moststudents would accelerate at least as much asthey had already done. Only
one student, who had skipped three grades and received a high numberofcollege credits for AP work, wouldin retrospect accelerate somewhatless.Thus in conclusion it can be said that accelerated students tend to viewacceleration as being beneficial.
COLLEGE MAJORS: SCIENCE
VERSUS MATHEMATICAL SCIENCES
Atleast 50 percent of students are majoring in either science (includingengineering) or mathematical sciences in college (ranging from 50 percentfor Group B to 80 percent for Group A). Mathematical sciences are mostpopular for Group A, with 50 percent majoring in them, while scienceis atleast equally as popular for the other groups (ranging between 30 and 40percent majoring in science for all four groups). For Group A, computerscience is by far the most popular field. Each student’s major is shown inAppendix 4.2.
COLLEGE COURSE-TAKING
The number of undergraduate courses taken in mathematics, science,and engineering by the summerof 1980 and the mean gradesreceived bygroup can be seen in table 4.8. Even though they had the most advancedstanding in mathematics, members of Group A had taken the greatestnumber(6.9) of mathematics courses by summer, 1980. This was also truefor science and engineering. But of course Group A had beenin collegemuch longer. The differences between the groups in grades received werenot significant, but the differences in number of courses taken inmathematics and engineering were (F = 5.1, p< .01 for mathematics and F= 4.6, p< .01 for engineering). Their mean grades were for the most part

v9
TABLE4.8. Reported Mathematics, Science, and Engineering Course-Taking in College (Full-Time Students, by Group)
Mean Number Mean Grade Mean Number Mean Grade
of Mathematics Standard in Standard of Science Standard in Standard
Group N Courses? Deviation Mathematics Deviation Courses Deviation Science Deviation
A 9 6.9 4.1 3.0 0.7 6.6 3.7 3.3 0.4
(N = 8) (N = 8)
B 6 4.0 2.9 3.0 0.6 4.3 1.6 3.1 0.7
(N = 5) (N = 6)
C 6 3.2 1.2 3.3 0.5 3.8 3.9 3.4 0.5
(N = 6) (N = 5)
D 9 1.9 1.5 3.1 1.3 4.1 3.2 3.2 0.6
(N = 7) (N = 9)
Mean Number
of Engineering Standard Mean Grade Standard
Courses? Deviation in Engineering Deviation
A 10 5.7 5.5 3.2 0.7
(N = 7)B 6 1.3 2.4 3.8 0.2
(N = 2)C 6 1.0 2.5 2.5 0
(N = 1)D 9 0.1 0.3 2.0 0
(N = 1)
aThe differences between the groups weresignificant by an ANOVA (F = 5.1, p<.0l).
bThe differences between the groups were significant by an ANOVA (F = 4.6, p<.01).

65 Mathematics Taught at a Fast Pace
above a B, and many courses were taken, except for in engineering for
Groups B through D.
USE OF EDUCATIONAL OPPORTUNITIES
The students were asked to rate how well they had madeuseofall their
available educational opportunities. For the students in all groups, the
mean response was “above average.” No significant differences emerged
between the groups, although it would objectively seem that Group A had
madethe best use of all available educational opportunities.
EDUCATIONAL AND
OCCUPATIONAL ASPIRATIONS
The educationalaspirationsforall students were for the most part high.
The meansfor all groups were to obtain more than a master’s degree. Not
one student aspired to obtain less than a bachelor’s degree. Only 51 percent
of students in the general population aspire to obtain a bachelor’s degree
or more (Charles Kettering Foundation 1980).
The occupational status of each student’s career goal was rated by the
Reiss (1961) scale. The average status occupation for the norm group on
this scale was 70, which is a score assigned to a nurse. Onthis scale the
highest score given to an occupation wasa dentist, with 93 points, and the
lowest was to a tobacco laborer, with 20 points. For the students in the
four groups the means of the occupational status of their career goal
ranged from 81.5 (Group B) to 84.2 (Group C). Occupations falling into
that range on the scale include engineers and college professors. Thus the
students in all groups have high educational and occupational aspirations,
with no significant group differences.
SMPY’S INFLUENCE
The final item of interest is how the students felt their association with
SMPY had helped them educationally. Not unexpectedly, the students
who had remained in Wolfson I felt that SMPY had helped them educa-
tionally more than did the students in the other groups (t = 2.9, p< .01).
The students in Groups A and B felt that SMPY had helped them con-
siderably, while Groups C and D felt that SMPY hadhelped themslightly
more than notatall.
Summary
Participation in a fast-paced mathematics class for highly mathemat-
ically precocious junior-high-school students appears to have many long-
term benefits, not only in time needed to complete the study of mathe-

66 Camilla Persson Benbow, Susan Perkins, and Julian C. Stanley
matics but also in time needed to complete a student’s education. This has
been demonstrated by this study and by the evaluation of the secondfast-
paced mathematicsclass, called Wolfson II (see Appendix 4.3). Because of
the small number of students, however, most differences between the
students participating at various levels were not foundto be significant.
Most of the students who were extended the invitation to join the
Wolfson I class participated in at least one of SMPY’s talent searches. At
the time of the talent search the students completing Wolfson I in the fast
group received the highest SAT-M scores, followed by the students
finishing in the slow group. The difference between groups wassignificant
(p< .01). On SAT-Vat talent-search participation the slow group, followed
by the fast group, had the highest scores. Again, the difference between
groups wassignificant (p < .05). In high school, when the SAT was taken
again, no significant difference was found between the groups on SAT-V,
but a significant difference was found on SAT-M (p< .05). Groups A and
B received the higher scores. We do not know whetherthe students in the
Wolfson I class earned significantly higher SAT-M scores in the talent
search and in high school than the students who dropped out or did not
participate because of their participation in the class or because they were
initially abler. Mostlikely it is a combination of the two,since the students
in Wolfson I also earned higher SAT-V scores,* but their superiority on
SAT-V was not as great as that on SAT-M. Furthermore,all the students
had met the sameability criteria before the class was begun. Therefore, the
fast-math class itself may serve to boost the students’ aptitudes for
mathematics.
The mathematics course-taking in high school was obviously affected
by Wolfson I. Many more of the students who stayed in the program
finished calculus in high school. Furthermore, many moreofthe students
who finished in the fast group took the AP mathematics examinations,
especially Level BC, and took many more college mathematics courses
(and other college courses) while still in high school. When the College
Board’s mathematics achievement tests were taken in high school, the
students in all groups who took them tended to make quite high scores.
Because Groups A and B did not score less well than Groups C and D
(whose members did not participate in the fast-paced mathematics pro-
gram), we conclude that having covered the content of the high-school
mathematics curriculum in an accelerated manner did not hinder long-
term retention or achievement or leave holes and gaps in students’
knowledge. The scores on the other, nonmathematics, achievementtests
were mostly above the meanscore for college-bound high-schoolstudents.
The students who completed Wolfson I in the fast group became much
more accelerated in their educational progress than the other students. The
amount was more than could be accounted for by just the fact that the
students were in Wolfson I. The difference between groupswassignificant
67 Mathematics Taught at a Fast Pace
(p «.001). On the average the accelerated students had positive feelingstoward their acceleration. Most would do it over again, perhaps to an evengreater extent.
All the students except one are attending or have attended college fulltime at, on the average, academically and socially elite schools. Most ofthe students majored in science or mathematically related fields. More ofthe students in the fast group majored in mathematically related fieldsthan did those in the other groups. Furthermore,so far in college they hadalso taken more courses in science, mathematics, and engineering thanstudents in the other groups. No significant differences were foundbetween the groupsin terms of educational aspirations and status oftheircareer goals.
The most successful students in WolfsonI (i.e., the ten finishing in thefast group) had achieved much more by summer, 1980, than the sixstudents whofinished in the slow group. Since the slow group was com-prised mostlyof girls (4:2) and the fast group mostly of boys (7:3), this dif-ference in achievement could perhapsbe due partly to the unwillingness ofgirls to accelerate their educational progress, especially in mathematics(Fox 1976; Daggett, chapter 9 of this volume).
Thus a fast-paced mathematics class offered to mathematicallyprecocious students does have educational benefits eight years after the
class was conducted. The especially successful students in that class have
achieved much morein high school and college than the students who did
not participate but who had beenessentially equally able (see Appendix4.2).
Conclusions
How muchdid the actual procedures and content of the Wolfson I class
help the members of Group A, who obviously have done extremely well
academically thus far? As is inevitable in a study involving highly mean-
ingful, demanding activities with human beings, one cannot fully disen-
tangle the influences of general and special abilities, motivation, and
facilitation by the student’s family and teachers. Comparisons of the four
Wolfson I groups help, especially because (as shownin table 4.2) ability
differences in high school were notlarge.The five boys andfive girls who chose not to attend Wolfson I (Group
D) seem to have done so mainly because they had competing activities inthe summer of 1972. Not much time elapsed between the invitation to
enroll and the June 24 starting date, so some youths — likely, those fromthe most affluent families — had madeotherplans. This inference receivessome support from inspection in Appendix 4.2 of the colleges they laterattended. As already noted, Group D students attended higher-status col-

68 Camilla Persson Benbow, Susan Perkins, and Julian C. Stanley
leges than did students in GroupsA,B, or C. As of the 1980-81 academic
year not a single member of Group D was accelerated in college placement
by age, and three of the ten were less than age-in-grade. In contrast, only
one of the Group A students wasnotaccelerated. All but one of the seven
males were more than oneyear ahead oftheir age-mates. One earned his
master’s degree at age 19, another at age 20, and a third at age 21. Oneis
the fourth youngest person to receive a bachelor’s degree from Johns
Hopkins in its 105-year history; until 1981 he was the youngest graduate
since 1887 (Stanley & Benbow 1982).
Therefore, even though it is possible that superior motivation alone
accounts for the splendid showing of Group A, we consider such an inter-
pretation most implausible. What has been demonstrated clearly is that
when highly able youths are offered the opportunity to forge ahead far
faster and morerigorously in precalculus, many will accept the offer, and
a considerable percentage of those will make mighty educational and pro-
fessional strides, probably for the rest of their lives. This observation,
based on the Wolfson
I
class, is amply supported by SMPY’s manyreplica-
tions of and extensions of the fast-paced mathematics model in a wide
variety of curricular situations (e.g., Keating, Wiegand, & Fox 1974;
George & Denham 1976; Stanley 1976; Mezynski & Stanley 1980; Bart-
kovich & George 1980; Bartkovich & Mezynski 1981; Mezynski, McCoart,
& Stanley, chapter 6 of this volume). It demonstrates the multiplicative
effect of the accumulative advantage (here, participation in the special
mathematics class) that Zuckerman (1977) describes as characterizing
Nobel Laureates.
Ofthe three girls in Group A, two are accelerated one year each, both
by finishing high school one year early. Onegirl in Group B finished col-
lege two years younger than average, as did one boy. One boy in Group C
is accelerated one year in college — actually, by high-school entering rules
in his state, by just two days, because he was born on January 2. As noted
earlier, no one in Group D was accelerated. In agreement with these
results, SMPY’s researchers have usually found only a few girls accelerated
even a single year by the time the baccalaureate is awarded; an appreciable
percentage of the boys proceed far faster (see Daggett, chapter 9 of this
volume).
There are somesigns that this gender differential is changing, however.
Twenty-five of the Johns Hopkins 632 fall of 1980 entrants wereat least
two years accelerated in grade placementrelative to chronological age; 9 of
them (36 percent) were female. This is slightly greater than the percentage
of Johns Hopkins students who are female. One of these girls entered at
age 13 with sophomorestanding, having already completed one year each
of college inorganic and organic chemistry, calculus, and biology, and one
semester of physics.
Paradoxically, however, whereas seven of the twenty males in Groups

69 Mathematics Taught at a Fast Pace
A through D attended Johns Hopkins, not a single one of the thirteenfemales did. The chi-square for this difference was 3.87, p «.05. Thatunintentional, unexpected side (or main?) effect of the Wolfson I recruit-mentandinstruction suggests that ingratiating effects for an institution ofhaving youngsters studyat it may be related to gender.It will be interestingto compare the mathematics course results with those found for fast-pacedverbal courses conducted by Johns Hopkinsto see whethera similar pat-tern holds for them.
Notes
1. He later joined SMPY’s second fast-paced mathematics class, Wolfson II (seeAppendix 4.3).
2. The formula for qualifying as a semi-finalist is 20PSAT-V score) + 1(PSAT-
M score). The minimum composite score varies from state to state andis greatest in
those states where the highest-scoring students reside.
3. Acceleration by the groups is discussed further later in this chapter.
4. Six of the ten students in Group A attended Johns Hopkins.
5. High verbal ability was found to be important for success in a fast-paced
mathematics class (Fox 1974; George & Denham 1976).
References
Admissions Testing Program of the College Board. 1979. ATP guide for high
schools and colleges (1979-81). Princeton, N.J.: Educational Testing Service.
Astin, A. W. 1965. Who goes where to college? Chicago: Science Research Asso-
clates.
Bartkovich, K. G., and George, W. C. 1980. Teaching the gifted and talented in
the mathematics classroom. Washington, D.C.: National Education Associa-
tion.
Bartkovich, K. G., and Mezynski, K. 1981. Fast-paced precalculus mathematics
for talented junior-high students: Two recent SMPY programs. Gifted Child
Quarterly 25 (2, Spring): 73-80.
Benbow, C. P., and Stanley, J. C. 1980. Sex differences in mathematical ability:
Fact or artifact? Science 210:1262-64.
Charles Kettering Foundation. 1980. New Ways. Spring-Summer,p.8.
Educational Testing Service. 1962. Cooperative Mathematics Tests: Algebra I.
Princeton, N.J.

70 Camilla Persson Benbow, Susan Perkins, and Julian C. Stanley
Fox, L. H. 1974. Facilitating educational development of mathematically preco-
cious youth. In Mathematical talent: Discovery, description, and development,
ed. J. C. Stanley, D. P. Keating, and L. H. Fox, 47-69. Baltimore: Johns
Hopkins University Press.
____, 1976. Sex differences in mathematical precocity: Bridging the gap. In
Intellectual talent: Research and development, ed. D. P. Keating, 183-214.
Baltimore: Johns Hopkins University Press.
George, W. C., and Denham, S. A. 1976. Curriculum experimentation for the
mathematically talented. In Intellectual talent: Research and development, ed.
D. P. Keating, 103-31. Baltimore: Johns Hopkins University Press.
Keating, D. P.; Wiegand, S. J.; and Fox, L. H. 1974. Behavior of mathematically
precocious boys in a college classroom. In Mathematical talent: Discovery,
description, and development, ed. J. C. Stanley, D. P. Keating, and L. H.Fox,
176-85. Baltimore: Johns Hopkins University Press.
Mezynski, K., and Stanley, J. C. 1980. Advanced placementoriented calculus for
high school students. Journal for Research in Mathematics Education 11(5):
347-55.
Nie, N. H.; Hull, C. H.; Jenkins, J. G.; Steinbrenner, K.; and Bent, D. H. 1975.
SPSS: Statistical package for the social sciences. 2d ed. New York: McGraw-
Hill.
Psychological Corporation. 1959. Academic Promise Test. New York.
Reiss, A. J. 1961. Occupations and social status. New York: Free Press.
Stanley, J. C. 1976. Special fast-mathematics classes taught by college professors
to fourth- through twelfth-graders. In Intellectual talent: Research and develop-
ment, ed. D. P. Keating, 132-59. Baltimore: Johns Hopkins University Press.
Stanley, J. C., and Benbow, C. P. 1982. Using the SAT to find intellectually
talented seventh graders. College Board Review 122:2-7, 26-27.
Zuckerman, H. 1977. Scientific elite: Nobel laureates in the United States. New
York: Free Press.

APPENDIX 4.1: Supplementary
Questionnaire Used to Update theEducational Progress of All the StudentsEligible for the Wolfson I Class
THE JOHNS HOPKINS UNIVERSITY ¢ BALTIMORE, MARYLAND21218
STUDY OF MATHEMATICALLY PRECOCIOUS YOUTH (SMPY)
Please reply care of: DEPARTMENT OF PSYCHOLOGY
PROFESSOR JULIAN C. STANLEY, Director ofSMPY Mr. WILLIAM C. GEORGE, Ed.M., Associate Director
Ms. LOIS S. SANDHOFER, B.A., Administrative Assistant 125 Ames Hall, (301) 338-8144
127 Ames Hall, (301) 338-7087 Ms. CAMILLA P. BENBOW. M.A., Assistant Director126 Ames Hall, (301) 338-7086
QUESTIONNAIRE FOR EVALUATING SMPY'S FAST-PACED MATHEMATICS PROGRAM
Please fill out carefully and completely all of the questionnaire below that applies
to you. Please print or type all answers and send the fully completed questionnaire
as soon as possible to the address on the letterhead. All information will be kept
strictly confidential; you will not be publicly identified with the information
herein in any way.
NAME:
First Middle Last (Maiden if applicable)
Permanent Address: Telephone:
Street City State Zip (Area Code)
Temporary Address if different from above:
Street
Telephone (__)City State Zip YArea Code)
1. Are you currently employed full-time? (Circle one.) Yes No
If yes, please supply the following information about your present and past
post-high school occupations in chronological order.
Dates of
Type of Occupation Duties Involved Employer Employment
1)
2)
3) If you need more space, please continue on a separate sheet.
2. Please check the box that applies to you with regard to your attendance at an
institution of higher education (including technical school).
I am currently a full-time undergraduate student.
I have graduated from college and am not furthering my education at the
present time.
I have graduated from college and am furthering my education on a part-time
basis.
I have graduated from college and am (or will be this fall) furthering my
education on a full-time basis.
71

I am currently a part-time undergraduate student after having attended
full-time.
I am a part-time undergraduate student.
I am not currently enrolled as a student but was previously.
I am not and have not been enrolled as a student in an institution of
higher education. (Go to question 3.)
a. Which school are you currently, will you, or were you attending? (Do not
list schools from which you have transferred.)
b. Dates of attendance:
c. If you have graduated, please indicate the date of graduation:
From which school if different from above? Month/Year
d. What is or was your undergraduate major?
e. If you have switched majors in college, please list the previous one(s) in
chronological order.
f. If you are furthering your education beyond college, please name the planned
field.
g. Please list the titles of the mathematics course(s) you have already taken
as an undergraduate (including your grade in this course(s) and the
semester(s) of attendance. ) If you prefer, send us a copy of your transcript.
Semester(s) of
Final Course{ Attendance (Include
Mathematics Course Grade Semester and date)
1.
2.
3.
4.
5.
6. If you have taken more mathematics, please continue on a separate sheet.
h. Please list the title(s) of the science course(s) (including engineering andcomputer science) you have already taken as an undergraduate in college,
your final grade in these courses, and the semester(s) of attendance. Ifyou prefer, send us a copy of your transcript
Semester(s) ofFinal Course| Attendance (Include
Science Course Grade Semester and Date)
Rn
WwW
&F&
WwW
KY
FF
If you have taken more science, pleage Continue on a separate sheet.
72

i. Please list any awards, honors, or scholarships you may have won as anundergraduate or graduate of college (Phi Beta Kappa, etc.).
Please list the college-level mathematics courses (if any) that you are planningto take in the future.
Please describe your career goal (i.e., professor of mathematics or a prac-ticing pediatrician).
Have you been accelerated in your educational progress (circle one)? Yes No
a. If no, do you wish you would have been? Yes No (Circle one.)
b. If yes to Question 5, please circle the letter of the sentences that areapplicable to you and then complete then.
1) I skipped the following grades:
2) I took Advanced Placement Program (APP) examinations for which I
(Number)
received credits of advanced placement in college.
(Number )
3) I was accelerated in subject matter placement in _ different subjects.
(Number)4) I took college courses on a part-time basis as a secondary school stu-
dent, for which I received credits of advanced standing in college.
5) I finished college in years, rather than 4.
6) I received my master's degree concurrently with my bachelor's.(Circle one.) Yes No
7) Other (Departmental examination, etc. Please specify.):
c. If you were to reconsider your decision to accelerate, which one of the
following would best describe your thoughts (check the most appropriate box)?
[--| I would not accelerate my education at all.
[--] I would accelerate my education somewhat but not as much as I have done.
Cc] I would accelerate my education to the degree which I have already done.
(-] I would accelerate my education somewhat more than what I have already done.
| I would accelerate my education much more.
How important do you feel mathematics will be or is in your career? (Circle one.)
Very Fairly Slightly Not very Not at all
If you have taken the Graduate Record Examinations (GRE), please supply thefollowing: GRE Quantitative Score GRE Verbal Score
Advanced test score in area.
I hereby certify that I have read over my responses carefully and thoroughly.
They are as complete and accurate as I can make them.
Please return this questionnaire to:
Ms. Camilla Benbow
SMPY, Dept. of Psychology
The Johns Hopkins University
Baltimore, Maryland 21218
Signature
73

BL
APPENDIX 4.2: Educational and Occupational Status of the Students Eligible for
the Wolfson I Class as of June, 1980
Student (Sex) Undergraduate Year Graduate Field or
(Date of Birth) Institution Graduated Major Institution Degree Employer
Fast Group (N = 10)
M Johns Hopkins Senior Mathematical
4/10/63 University Sciences
M Johns Hopkins B.Engr.S., Mechanics and Part-time, Master’s in Electrical/Mechanical
8/9/60 University 79 Material Sciences Carnegie-Mellon Mech. Eng. Engineer, Westinghouse
F Princeton Junior Architecture
8/6/60 University
M Johns Hopkins B.A., 79 Electrical Engi- Drexel Master’s, Elec. Electrical Engineer,
5/5/60 University neering, Biomedical Institute Engr., 12/81 AAI Corporation
Engineering
F University of Senior Russian
5/2/60 Virginia
M Johns Hopkins B.A., 78 Mathematical University of Computer Science, Westinghouse
4/12/60 University Sciences California, Master’s, 81
Santa Barbara
M Johns Hopkins B.A., 1/77 Quantitative University of M.B.A., 1979
12/4/59 University Studies Chicago, Business Ph.D. in Finance,
12/81
M Johns Hopkins B.A., 80 Mathematical Carnegie-Mellon Computer Science
10/29/59 University M.S.Engr., 80 Sciences
F University of B.S.Engr., 80 Computer Assoc. Engineer, JHU
2/1/59 Michigan Engineering Applied Physics Lab.
M University of B.A., 79 Mathematics Computer Programmer,
9/18/58 SteubenvilleMellon Bank NA

SL
Student (Sex) Undergraduate Year Graduate Field or(Date of Birth) Institution Graduated Major Institution Degree Employer
Slow Group (N = 6)
F Virginia Poly- Withdrew, Forestry Paid by CETAto take11/12/60 technic Institute 5/794 accounting and office skillcourses
M Johns Hopkins B.A., 80 Economics University of Law9/20/60 University Pennsylvania
F College of B.A., 80 Religion Yale Social Work5/30/60 Wooster University
F University of Junior ComputerScience,5/20/60 Pennsylvania Engineering
M University of Junior Civil5/6/60 Delaware Engineering
F Virginia Poly- Junior Civil1/5/60 technic Institute Engineering
‘Later entered The Bryant Institute, Tulsa, Oklahoma; graduated in data processing, 9/82.
M
10/5/61
M1/2/61
M
10/12/60
M
9/20/60
M
4/11/60
F
2/29/60
F
1/30/60
Did not attend@
University of Junior
Maryland, College Park
University of JuniorDelaware
University of JuniorVirginia
University of JuniorDelaware
James Madison JuniorUniversity
University of JuniorRichmond
Group That Dropped Wolfson I (N = 7)
Electrical
Engineering
Chemistry
Economics
Accounting
English
Political Science,
Sociology
“Later entered and then withdrew from the University of Tampa, Florida.
92
Student (Sex) Undergraduate Year Graduate Field or
(Date of Birth) Institution Graduated Major Institution Degree Employer
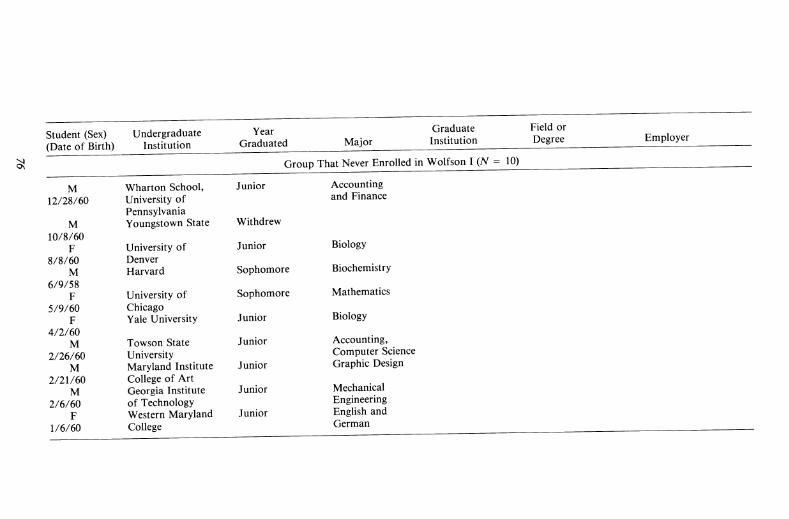
Group That Never Enrolled in Wolfson I (NV = 10)
M Wharton School, Junior Accounting
12/28/60 University of and Finance
Pennsylvania
M Youngstown State Withdrew
10/8/60
F University of Junior Biology
8/8/60 Denver
M Harvard Sophomore Biochemistry
6/9/58
F University of Sophomore Mathematics
5/9/60 Chicago
F Yale University Junior Biology
4/2/60
M Towson State Junior Accounting,
2/26/60 University Computer Science
M Maryland Institute Junior Graphic Design
2/21/60 College of Art
M Georgia Institute Junior Mechanical
2/6/60 of Technology Engineering
F Western Maryland Junior English and
1/6/60 College German
APPENDIX 4.3: Evaluation of theWolfson II Class
In evaluating the long-term effects of SMPY’s fast-paced mathematics classes,we followed up the students who wereeligible for and participated in WolfsonI, theresults of which were discussed in this chapter, and also the students eligible for andparticipating in the second class ofthis kind conducted by SMPY (Wolfson II). Theinitial selection procedures and results for this class can be found in George andDenham (1976). The students in the Wolfson II class were somewhat older (mainlyend-of-year eighth-graders) than those in Wolfson I. Furthermore, to be eligible forthe class the students had to have scored at least 500 on SAT-M, 400 on SAT-V,and above a combinedscore criterion on two standardizedtests of knowledge ofalgebra I. Of the ninety-two students eligible for the class, thirty-three participated.All but two students began to study algebra II in June, 1973.
George and Denham (1976) discussed the success of this class. In summary,twenty-three students of the thirty-three (the fast group) mastered algebraII andIIIand plane geometry. Among the twenty-three, fifteen students also masteredtrigonometry, and fourteen analytic geometry. As a result, twelve students were
able to enter a calculusclass in the fall of 1974, 120 class hours after the start of
algebra II. An additional five students in Wolfson II (but in its slow group) suc-
cessfully mastered algebra II and plane geometry. One person among them also
completed algebra III. Five youths droppedthe class before completing the study of
algebra II.
The longitudinal evaluation of Wolfson I and II resulted in quite similar find-
ings. The most successful students in both classes (i.e., the fast groups) achieved
much more in high school and became more accelerated than the other students
eligible for or participating in the classes. Furthermore, the students completing the
program in the slow groups were more successful than the students who dropped
the classes or never enrolled.
It was found that the students in the fast group were somewhat abler than the
other students on the SAT in high school but not on the College Board’s achieve-
ment tests. It was of special interest to take note of the students’ performance on the
College Board’s Math Level I and the more difficult Math Level II achievement
tests. On both tests most of the students earned nearly the top score possible. Thus
we can conclude with confidence that learning mathematics at a rapid and acceler-
ative pace is not detrimental to long-term achievementor learning. The opposite
seems to be true, because many more of the successful students in the Wolfson
classes than students not in the classes took calculus in high school, took the AP
examinationsin calculus, and in college took more courses in mathematics. In addi-
tion, those students showed moreinterest in mathematics.
There was one major difference between the Wolfson I and II classes. This was
in terms of acceleration. The successful students in Wolfson I were much further
ahead educationally (course-work and acceleration) than the successful students in
Wolfson II, although both fast groups were much further ahead of the other
groups. This difference might be related to the age difference between the two
classes. Members of Wolfson II were older than members of Wolfson I when they
began the class. Perhaps by the time a bright student reaches the end ofthe eighth
77

78 Camilla Persson Benbow, Susan Perkins, and Julian C. Stanley
grade he or she has lost some motivation because of the extra time spent in a
classroom notgeared tohisor herintellectual level. Thus it seems more beneficial or
necessary to find and educationally stimulate studentsearlier than the eighth grade.
Finally, members of bothclasses felt that their association with SMPY had been
of considerable help to them, and they viewed their acceleration as benefiting them
positively.
The fast-paced mathematics classes did have long-term educational benefits.
Since the students involved also had positive feelings toward their experiences in
class and with SMPY,we concludethat this is one excellent way of catering to the
differential needs of the intellectually talented.