mathematical modelling and experimental … · of dehumidifier drying of radiata pine timber ......
TRANSCRIPT

Maderas. Ciencia y tecnología 7(2): 87-98, 2005
87
ISSN 0717-3644ISSN online 0718-221X
MATHEMATICAL MODELLING AND EXPERIMENTAL INVESTIGATIONOF DEHUMIDIFIER DRYING OF RADIATA PINE TIMBER♣♣♣♣
Z. F. Sun1, C. G. Carrington1, C. Davis1, Q. Sun1, S. Pang2
ABSTRACT
A dynamic kiln-wide wood drying model was developed previously to solve the integral form ofthe unsteady-state mass, momentum and energy balance equations in the air side. For the wood side,an empirical model, characteristic drying curve, for the internal moisture movement is used, whichwas obtained for low and medium temperature drying of Pinus radiata, with a medium velocity of 1.4-4.1 m s–1. As part of the research programme to improve the design and control of dehumidifier wooddrying kilns, the wood drying model has been assessed using the experimental data measured underdrying conditions similar to those in dehumidifier kiln. It is noted that close agreement between themodelled results and the experimental data can be obtained for Pinus radiata drying processes with amedium air velocity (< 5 m s–1). However, larger discrepancy between the modelled results and themeasured data has been observed with a higher velocity (8 m s–1). To solve this problem a newcharacteristic drying curve, based on a two-zone diffusion model, has been used in the kiln-wide wooddrying model and more accurate results have been obtained.
Keywords: characteristic drying curve; dehumidifier drying, kiln stack, mathematical model, Pinusradaiata, sapwood timber
INTRODUCTION
Modelling of the kiln-wide drying processes is essential for improving the design and analysis ofwood drying equipment. A dynamic wood drying model has been developed, which solves the mass,momentum and energy balance equations for both the air flow and wood boards in drying three typesof stack: normal stack, aligned stack and staggered stack (Sun and Carrington, 1999a; Sun andCarrington, 1999b; Sun, Carrington and Bannister, 2000). For the airflow inside a stack, the modelsolves the integral form of the unsteady-state mass, momentum and energy balance equations. For thewood side, the characteristic drying curve method (Keey, 1992) is adopted for the description of theinternal moisture transfer processes inside the wood boards.
Models for detailed internal moisture transfer and heat transfer within wood boards have beenestablished by Stanish et al. (1986) and Perré (1996). However, it is difficult to use these models formodeling kiln-wide wood drying processes, since very large computational time and computer storageare required. On the basis of the moisture movement mechanisms, a characteristic drying curvecorrelation was used by Pang (1994) for high-temperature drying and was obtained by Sun et al.(1996) for low and medium temperature drying of Pinus radiata sapwood with a medium velocity of1.4-4.1 m s–1. These correlations relate the normalized drying rate to the conventional normalized
1 Physics Department, University of Otago,PO Box 56, Dunedin, New Zealand.2 Department of Chemical and Process Engineering, University of Canterbury, Christchurch, New Zealand
Corresponding author: [email protected]: 21.06.2005. Accepted: 03.08.2005.

Maderas. Ciencia y tecnología 7(2): 87-98, 2005
88
Universidad del Bío - Bío
moisture content using the equilibrium moisture content, the critical moisture content and the normalizedmoisture content defined in terms of the fibre saturation point (FSP) and the critical moisture content.In particular, two constant parameters were used in the correlation, which were noted previously to bedependent on board geometry and wood structure properties (Sun et al., 1996). However, the effect ofdrying conditions, such as air velocity, temperature, and humidity on the two parameters has not beenconsidered. Consequently, the application of this characteristic drying curve may be restricted.
In this paper, the kiln-wide drying model and the characteristic drying curve have been furtherassessed by comparison of calculated results with the measured data obtained by Pang (1999) and byDavis (2001). In order to overcome the difficulty that the present drying curve relation is not accuratefor cases where the air velocity is high, a new characteristic drying curve, based on the two-zonediffusion model developed by Davis (2001), has been established and tested.
WOOD DRYING MODEL
The dynamic model used in modelling kiln-wide wood drying processes has been described indetail in previous papers (Sun and Carrington, 1999a; Sun and Carrington, 1999b; Sun et al., 2000).For simplicity, the air flow model is one-dimensional, but two parallel air streams for the central stackand side stack are used.
The characteristic drying curve method (Keey, 1992) was adopted for the description of the internalmoisture transfer processes inside wood boards. When the surface of the moist-wood is no longersaturated with moisture, the characteristic drying-curve concept can be used to relate the unhindereddrying rate from saturated surface to the diminished drying rate (Ashworth, 1977; Keey, 1992; Pang,1994). Thus, from the Fick’s first law of diffusion, the real drying rate can be written as
)1(
)(
)1( )(,
)(,
)(
)()()(
msatv
vmsatvc
mv
ma
mvm
v
Afkmm
ω
ωω
ωω ω
−
−+
−= (1)
where f is the normalized drying rate, which is defined as the ratio of the diminished drying rate to theunhindered drying rate and k
ω is the mass transfer coefficient, on the basis of the vapour mass fraction
difference between the surface of wood boards and the bulk air stream.
An empirical characteristic drying curve relation for the internal moisture movement was proposed fordrying of Pinus radiata sapwood (Sun et al., 1996). For the constant rate period (X≥ X
c)
0.1=f (2)
For the falling rate period (X < Xc),
fspBAf Φ−Φ= (3)
where
ec
e
XXXX
−
−=Φ
(4)
and
fspc
fspfsp XX
XX
−
−=Φ (5)
Maderas. Ciencia y tecnología 7(2): 87-98, 2005
89
Mathematical Modelling...: Sun et al.
In the equations above, Xc is the critical moisture content; X
e is the equilibrium moisture content;
Xfsp
is the fibre saturation point. The two constant parameters, A and B, in Eq.(3) were noted previouslyto be dependent on board geometry and wood structure properties, of which fitted values were obtainedfor Pinus radiata sapwood at low and medium temperatures, with a velocity range of 1.4-4.1 m s–1
(Sun et al., 1996).
In the wood drying model, the external mass-transfer and heat-transfer coefficients are evaluatedby using empirical correlations. Due to the boundary layer separation, reattachment, and redevelopmentof flow, measured mass and heat transfer data over blunt-edged flat plates show a common characteristicthat the transfer rate is maximum at the point of reattachment and passes through a minimum at a pointbetween the leading edge and the reattachment point (Sørensen, 1969; Kho, 1993). The correlationsfor mass and heat transfer j-factors over blunt boards have been established by Sun (2002) and used inthe kiln-wide wood drying model, which are given by
( ) ( )βγβα−−−−−= x
xxj Re2.0ReRe0288.0 (6)
where α, β, and γ are positive parameters. Using the mass transfer data over blunt boards in a boardstack measured by Kho (1993), the fitted correlations for the parameters α, β, and γ are obtained asfollows:
6501.01106.16 ReRe101513.2 SD−×=α (7)
0437.01410.0 ReRe1542.0 SD=β (8)
and5240.01172.15 ReRe105197.8 SD
−×=γ (9)
where ReD (=4400~22,000) and Re
S (=4400~10,300) are the Reynolds numbers based on the board
thickness and the space size between two board layers. For the region from the leading edge to theminimum point, the conventional power law relation for a turbulent boundary layer is used, with α = 0,β = 0, and γ = 0 in Eq.(6) (Sun, 2002).
COMPARISON OF MODELLED RESULTS WITH THE MEASURED DATA
Simulation runs have been carried out under the experimental conditions of the five experimentsperformed by Pang (1999) and the experiments conducted by Davis (2001). Here, only the simulationresults of the five experimental runs of Pang are presented. The simulation results of the experimentalruns of Davis are presented elsewhere (Davis, 2001), which are consistent with the results shownbelow.
The material for the five experimental runs of Pang was Pinus radiata sapwood and all the runswere conducted in a tunnel dryer, using varying air temperature, humidity and air velocity (Pang,1999). The measured data of green moisture content and wood density for each run have been used inthe calculation as initial conditions. The total drying time for each run is based on the experimentalvalues. The measured stack-on air velocity, dry-bulb temperature, and wet-bulb temperature were usedas the boundary conditions for the calculation.
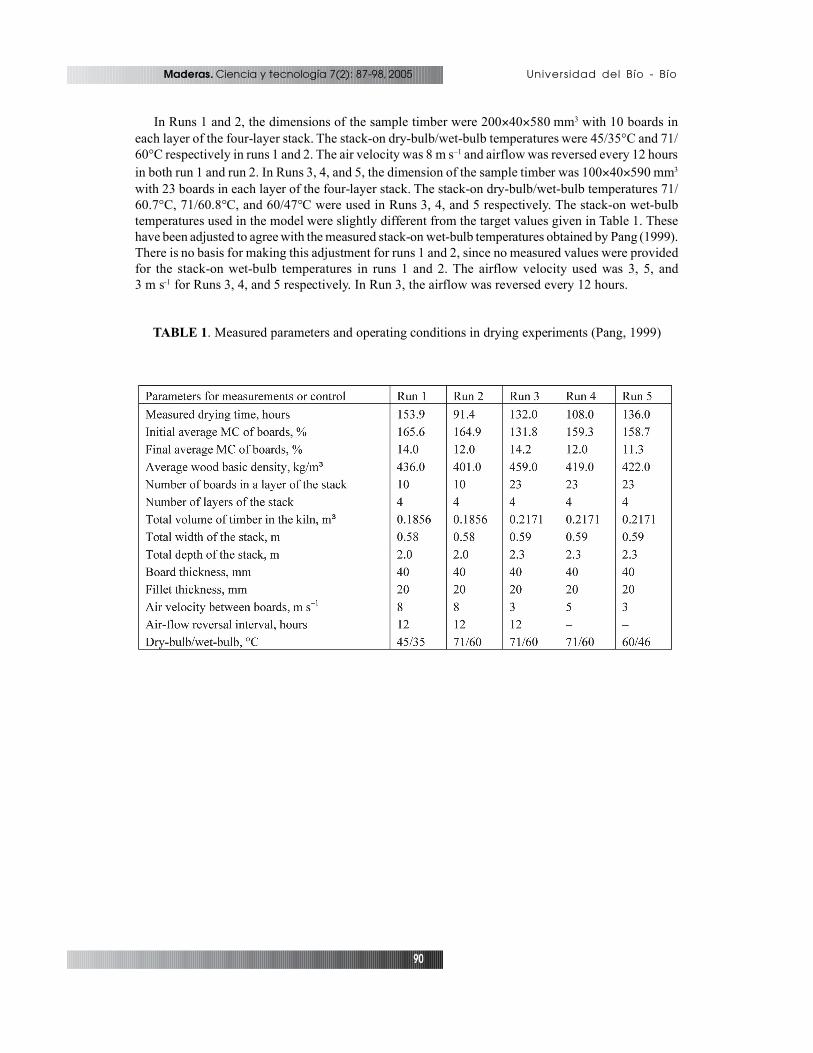
Table 1 lists the measured parameters and operating conditions in the experiment. The number ofcontrol volumes used in each of the simulation runs is the same as the number of the boards in a boardlayer in the experimental stacks.
Maderas. Ciencia y tecnología 7(2): 87-98, 2005
90
Universidad del Bío - Bío
In Runs 1 and 2, the dimensions of the sample timber were 200×40×580 mm3 with 10 boards ineach layer of the four-layer stack. The stack-on dry-bulb/wet-bulb temperatures were 45/35°C and 71/60°C respectively in runs 1 and 2. The air velocity was 8 m s–1 and airflow was reversed every 12 hoursin both run 1 and run 2. In Runs 3, 4, and 5, the dimension of the sample timber was 100×40×590 mm3
with 23 boards in each layer of the four-layer stack. The stack-on dry-bulb/wet-bulb temperatures 71/60.7°C, 71/60.8°C, and 60/47°C were used in Runs 3, 4, and 5 respectively. The stack-on wet-bulbtemperatures used in the model were slightly different from the target values given in Table 1. Thesehave been adjusted to agree with the measured stack-on wet-bulb temperatures obtained by Pang (1999).There is no basis for making this adjustment for runs 1 and 2, since no measured values were providedfor the stack-on wet-bulb temperatures in runs 1 and 2. The airflow velocity used was 3, 5, and3 m s-1 for Runs 3, 4, and 5 respectively. In Run 3, the airflow was reversed every 12 hours.
TABLE 1. Measured parameters and operating conditions in drying experiments (Pang, 1999)

Maderas. Ciencia y tecnología 7(2): 87-98, 2005
91
Mathematical Modelling...: Sun et al.
0
20
40
60
80
100
120
140
160
180
0 20 40 60 80 100 120 140 160Time (hour)
Mo
istu
re c
on
ten
t (%
) Measurements by Pang (1999)
Drying curve of Sun et al. (1996)
Drying curve of Davis (2001)
Fig. 1. Variation of the average moisture content in Run 1.
0
20
40
60
80
100
120
140
160
0 20 40 60 80 100
Time (hour)
Mo
istu
re c
on
ten
t (%
) Measurements by Pang (1999)
Drying curve of Sun et al. (1996)
Drying curve of Davis (2001)
Fig 2. Variation of the average moisture content in Run 2.
Figures 1 and 2 show the modelled and measured average moisture content profiles. In these figuresand Figures 3 to 7 below, the dashed lines represent the simulated results obtained using the characteristicdrying curve of Sun et al. (1996) and the points denote the measured values of Pang (1999). The dot-dashed lines represent the results obtained using a separate characteristic drying curve based on thetwo-zone diffusion model developed by Davis (2001), which is described below. Referring just to thesimulated drying curve of Sun et al. (1996), these figures indicate that there are large discrepanciesbetween the modelled moisture contents and the measured moisture contents in the early period of thewood drying processes. The drying rate is overestimated by the model. One of the possible reasons forthe calculation errors is that the characteristic drying curve used in the model was obtained based onthe measured data obtained in a lower velocity range of 1.4-4 m s–1 (Sun et al., 1996), which is muchlower than the air velocity of 8 m s–1 in both Run 1 and Run 2. For a drying process with a high airvelocity (>5 m s–1), this drying curve may not be applicable.
Figures 3, 4, and 5 show the modelled and measured average moisture content profiles for Runs 3to 5. It is seen that the discrepancies between the results obtained using the drying curve of Sun et al.(1996) and the measured values are much smaller than those shown in Figures 1 and 2 for Runs 1 and2. It is noted that the airflow velocity, 3 m s–1, in Runs 3 and 5 is in the velocity range of 1.4-4 m s–1, atwhich the characteristic drying curve was obtained (Sun et al., 1996). The air velocity, 5 m s–1, in Run4 is close to the velocity range. This suggests that the kiln-wide wood drying model and the characteristicdrying curve of Sun et al. (1996) can only be used for modeling drying processes with an air velocityless than 5 m s–1.

Maderas. Ciencia y tecnología 7(2): 87-98, 2005
92
Universidad del Bío - Bío
0
20
40
60
80
100
120
140
0 20 40 60 80 100 120 140
Time (hour)
Mo
istu
re c
on
ten
t (%
) Measurements by Pang (1999)
Drying curve of Sun et al. (1996)
Drying curve of Davis (2001)
Fig. 3. Variation of the average moisture content in Run 3.
0
40
80
120
160
0 20 40 60 80 100
Drying time (hours)
Mo
istu
re c
on
ten
t (%
) Measurements by Pang (1999)
Drying curve of Sun et al. (1996)
Drying curve of Davis (2001)
Fig. 4. Variation of the average moisture content in Run 4.
Figures 6 and 7 show the modelled and measured moisture content distributions along the stack inRun 3 and Run 4 respectively. In these figures, the dashed lines represent the results obtained using thecharacteristic drying curve of Sun et al. (1996) and the points denote the values measured by Pang(1999). These figures also indicate that the drying process of Pinus radiata sapwood with a lowervelocity (< 5 m s–1) can be described by the kiln-wide wood drying model and the characteristic dryingcurve expressed by Eqns.(2)-(5), with reasonable accuracy.

Maderas. Ciencia y tecnología 7(2): 87-98, 2005
93
Mathematical Modelling...: Sun et al.
0
40
80
120
160
0 20 40 60 80 100 120 140
Drying time (hours)
Mo
istu
re c
on
ten
t (%
)
Measurements by Pang (1999)
Drying curve of Sun et al. (1996)
Drying curve of Davis (2001)
Fig. 5. Variation of the average moisture content in Run 5.
0
20
40
60
80
100
120
140
160
1 3 5 7 9 11 13 15 17 19 21 23Board positions from stack-on
Mo
istu
re c
on
ten
t (%
)
t = 0 hr
t = 36.4 hr
t = 60 hr
t = 85.4 hr
t = 132 hr
Fig. 6. Moisture content distribution along the stack in Run 3.
0
40
80
120
160
200
1 3 5 7 9 11 13 15 17 19 21 23Board positions from stack-on
Mo
istu
re c
on
ten
t (%
)
t = 0 hr
t = 24 hr
t = 48 hr
t = 72 hr
t = 108 hr
Fig 7. Moisture content distribution along the stack in Run 4.
It is seen from Figure 6 that due to the airflow reversal in Run 3, the moisture contents at the stack-on and stack-off positions of the stack are lower than that at the middle of the stack. Since the air
Maderas. Ciencia y tecnología 7(2): 87-98, 2005
94
Universidad del Bío - Bío
stream is not reversed in Run 4, Figure 7 shows that the moisture content at the stack-on is significantlylower than that at the stack-off.
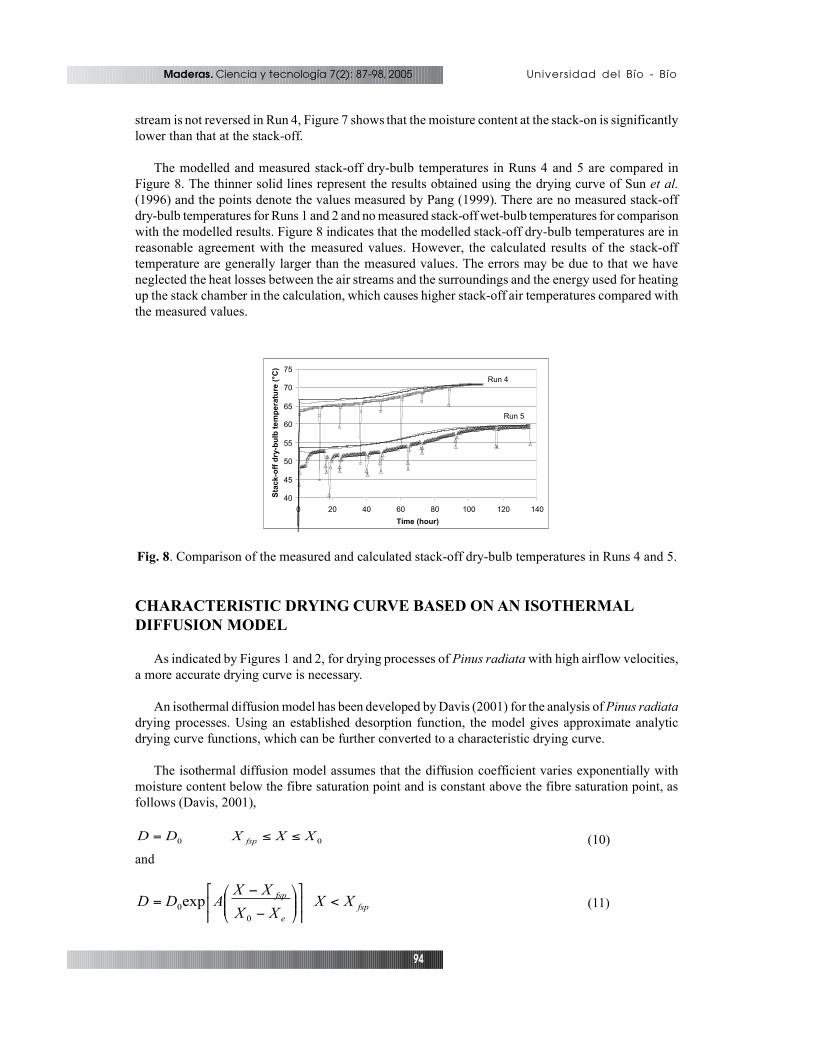
The modelled and measured stack-off dry-bulb temperatures in Runs 4 and 5 are compared inFigure 8. The thinner solid lines represent the results obtained using the drying curve of Sun et al.(1996) and the points denote the values measured by Pang (1999). There are no measured stack-offdry-bulb temperatures for Runs 1 and 2 and no measured stack-off wet-bulb temperatures for comparisonwith the modelled results. Figure 8 indicates that the modelled stack-off dry-bulb temperatures are inreasonable agreement with the measured values. However, the calculated results of the stack-offtemperature are generally larger than the measured values. The errors may be due to that we haveneglected the heat losses between the air streams and the surroundings and the energy used for heatingup the stack chamber in the calculation, which causes higher stack-off air temperatures compared withthe measured values.
40
45
50
55
60
65
70
75
0 20 40 60 80 100 120 140
Time (hour)
Sta
ck-o
ff d
ry-b
ulb
tem
per
atu
re (
°C)
Run 4
Run 5
Fig. 8. Comparison of the measured and calculated stack-off dry-bulb temperatures in Runs 4 and 5.
CHARACTERISTIC DRYING CURVE BASED ON AN ISOTHERMALDIFFUSION MODEL
As indicated by Figures 1 and 2, for drying processes of Pinus radiata with high airflow velocities,a more accurate drying curve is necessary.
An isothermal diffusion model has been developed by Davis (2001) for the analysis of Pinus radiatadrying processes. Using an established desorption function, the model gives approximate analyticdrying curve functions, which can be further converted to a characteristic drying curve.
The isothermal diffusion model assumes that the diffusion coefficient varies exponentially withmoisture content below the fibre saturation point and is constant above the fibre saturation point, asfollows (Davis, 2001),
00 XXXDD fsp ≤≤= (10)
and
fspe
fsp XXXX
XXADD <
−
−= exp
00 (11)

Maderas. Ciencia y tecnología 7(2): 87-98, 2005
95
Mathematical Modelling...: Sun et al.
where A is a constant parameter, D0 is the local diffusion coefficient above FSP, and X
0 is the initial
moisture content. The parameters A and D0 are dependent on the properties of the material being dried
and the operating conditions (Davis, 2001).
The boundary condition at the surfaces of wood boards utilises an apparent mass transfer coefficient,
mh′ , which accounts for the effect of an initial thin dry layer around the drying surfaces of the board (Pang,1994). An empirical relationship was established between the apparent mass transfer coefficient, mh′ , andthe mass transfer coefficient of boundary layer theory, , as given by (Davis, 2001),
(12)
where T∞ is the temperature of the bulk airflow in Kelvin. This relation, along with the relations (10)
and (11), allows straightforward prediction of drying curves for different types of Pinus radiata indifferent drying conditions and board dimensions. The resulting approximate drying curves arecomputationally inexpensive, and therefore suitable for kiln-wide models.
The conversion of the analytic drying curves to the characteristic drying curves is made by thetransformation (Davis, 2001),
(13)
where F is the dimensionless drying rate, and Bi1 is the mass transfer Biot number which represents theratio of internal mass transfer resistance to external mass transfer resistance.
TABLE 2. Reference parameters in the drying curve of Davis
Run A D0 ×109 (m2 s–1)
1 0.001 2.632 0.001 2.633 0.001 1.704 0.001 2.505 0.001 1.70
The fitted values of A and D0 used in modelling the experimental Runs 1-5 of Pang (1999) are listed
in Table 2. Sensitivity analyses indicate that the kiln-wide wood drying model is much less sensitive tothe parameter A than the parameter D
0.
The new characteristic drying curve, which is based on the isothermal diffusion model, has beenincorporated into the kiln-wide wood drying model. The modeled average moisture content profilesfor Runs 1-5 are shown in Figures 1 to 5 as the dot-dashed lines. The modelled moisture contentdistributions along the stacks for Runs 3 and 4 are shown in Figures 6 and 7 as the dot-dashed lines.The modelled dry-bulb temperatures for Runs 4 and 5 are shown in Figure 8 as the thicker solid lines.

Maderas. Ciencia y tecnología 7(2): 87-98, 2005
96
Universidad del Bío - Bío
All these figures show that the modelled results using the new characteristic drying curve are in closeagreement with the measured data. In particular, the large discrepancies between the modelled results,obtained using the drying curve of Sun et al. (1996), and the measured data for Runs 1 and 2 with ahigh air velocity have been reduced significantly.
CONCLUSION
The kiln-wide wood drying model of Sun and Carrington (1999a, 199b) and their colleagues (Sunet al., 2000) using the characteristic drying curve of Sun et al. (1996) have been assessed using theexperimental data obtained by Pang (1999) under dehumidifier drying conditions with low to mediumtemperatures.
It has been found that at a medium velocity (< 5m s–1), the kiln-wide wood drying model togetherwith the characteristic drying curve can give reasonably accurate descriptions of kiln performances.However, at a high air velocity (8m s–1), large discrepancies between the results obtained using thecharacteristic drying curve of Sun et al. (1996) and the measurements have been noticed.
To solve this problem, a new characteristic drying curve, based on an isothermal diffusion modeldeveloped by Davis (2001), has been established and incorporated into the kiln-wide wood dryingmodel. This new characteristic drying curve considers evaporation from a surface below a thin layersaturated at some temperature between the wet- and dry-bulb temperatures (Pang, 1994) and takesaccount of the effect of an initial dry thin surface layer on mass transfer. The results obtained using thenew characteristic drying curve are in close agreement with the measured data. In particular, the largediscrepancies between the modelled results and measured data in the cases of high air velocities havebeen reduced significantly. This suggests that the new characteristic drying curve can be successfullyused for a wider range of velocities up to 8 m s–1.
NOTA
♣This paper was first presented at the 8th IUFRO International Wood Drying Conference, Brasov,Romania and up-dated for MADERAS: Ciencia y Tecnología journal.
REFERENCES
Ashworth, J. C. 1977. The Mathematical Simulation of Batch-Drying of Softwood Timber. Ph.D.Thesis, Department of Chemical Engineering, University of Canterbury, New Zealand.
Davis, C. 2001. Dehumidifier Drying of P. Radiata Boards. Ph.D. Thesis, Physics Department,Otago University, New Zealand.
Keey, R. B. 1992. Drying of Loose and Particulate Materials. Hemisphere Publishing Corporation,New York.
Kho, P. C. S. 1993. Mass Transfer from In-Line Slabs. Ph.D. Thesis, Department of Chemical andProcess Engineering, University of Canterbury, New Zealand.
Pang, S. 1994. High-Temperature Drying of Pinus radiata Boards in a Batch Kiln. PhD Thesis.University of Canterbury, New Zealand.

Maderas. Ciencia y tecnología 7(2): 87-98, 2005
97
Mathematical Modelling...: Sun et al.
Pang, S. 1999.Drying of Radiata Pine Lumber under Dehumidifier Conditions: Experiments and Model Simulation.Research Report, Forest Research, Rotorua, New Zealand.
Perré, P. 1996. The numerical modelling of physical and mechanical phenomena involved in wooddrying: an excellent tool for assisting with the study of new processes. pp11-38. In: Cloutier, A., Fortin,Y. and Gosselin, R. (Ed.). Proceedings of the 5th IUFRO International Wood Drying Conference. August13-17. Quebec City, Canada.
Sørensen, A. 1969. Mass transfer coefficients on truncated slabs. Chemical Engineering Science24: 1445-1460.
Stanish, M. A.; Schajer, G. S.; Kayihan, F. 1986. A mathematical model of drying for hygroscopicporous Media. AIChE Journal 32 (8): 1301-1311.
Sun, Z. F.; Carrington, C. G.; McKenzie, C.; Bannister, P.; Bansal B. 1996. Determination andapplication of characteristic drying-rate curves in dehumidifier wood drying. pp495-503. In: Cloutier,A., Fortin, Y. and Gosselin, R. (Ed.). Proceedings of the 5th IUFRO International Wood DryingConference. August 13-17. Quebec City, Canada.
Sun, Z. F.; Carrington, C. G. 1999a. Dynamic modelling of a dehumidifier wood drying kiln.Drying Technology 17 (4 & 5): 711-729.
Sun, Z. F.; Carrington, C. G. 1999b. Effect of Stack Configuration on Wood Drying Processes.pp89-98. In: Vermaas, H. and Steinmann, D. (Ed.). Proceedings of the 6th IUFRO International WoodDrying Conference. January 25-28. Stellenbosch, South Africa.
Sun, Z. F.; Carrington, C. G.; Bannister, P. 2000. Dynamic modelling of the wood stack in awood drying kiln. Trans Ichem E 78, Part A: 107-117.
Sun, Z. F. 2002. Correlations for mass transfer coefficients over blunt boards based on modifiedboundary layer theories. Chemical Engineering Science 57 (11): 2029-2033.
NOTATION
Ac contact area between air and wood board (m2)
Bi’ mass transfer Biot number
D wood board thickness (m)
D0
local diffusion coefficient (m2 s–1)
f friction factor or normalised drying rate
F dimensionless drying rate
j Chilton-Colburn j-factor for mass and heat transfer
k mass transfer coefficient (kg m–2 s–1)
hm
mass transfer coefficient (kg m–2 s–1)
mass transfer rate of dry air (kg s–1)
mass transfer rate of moisture (kg s–1)
Aω
)(mam
)(mvm

Maderas. Ciencia y tecnología 7(2): 87-98, 2005
98
Universidad del Bío - Bío
ReD
Reynolds number (=u D/v)
ReS
Reynolds number (=u S/v)
Rex
local Reynolds number (=u x/v)
S space between board layers (m)
T∞
temperature of the bulk air flow (K)
u∞
velocity of the bulk air flow (m s–1)
x coordinate (m)\\
X moisture content (kg kg–1)
X0
initial moisture content (kg kg–1)
Greek symbols
normalized moisture content
v kinematic viscosity (m2 s–1)
mass fraction
Subscripts
a air
c critical point
e equilibrium point
fsp fibre saturation point
sat at saturation
v vapour
Superscripts
(m) quantity crossing board surface
fΦ
Akω
kω
kω
kω