mathematical modeling of solar chimney power plants - …phoenics/em974/projetos/temas...
TRANSCRIPT
at SciVerse ScienceDirect
Energy 51 (2013) 314e322
Contents lists available
Energy
journal homepage: www.elsevier .com/locate/energy
Mathematical modeling of solar chimney power plants
Atit Koonsrisuk*, Tawit Chitsomboon 1
School of Mechanical Engineering, Institute of Engineering, Suranaree University of Technology, Muang District, Nakhon Ratchasima 30000, Thailand
a r t i c l e i n f o
Article history:Received 27 August 2012Received in revised form9 October 2012Accepted 10 October 2012Available online 13 November 2012
Keywords:Solar chimney power plantMathematical modelSolar energyNatural convectionDimensional analysis
* Corresponding author. Tel.: þ66 44 224515; fax:E-mail addresses: [email protected] (A. Ko
(T. Chitsomboon).1 Tel.: þ66 44 224515; fax: þ66 44 224613.
0360-5442/$ e see front matter � 2012 Elsevier Ltd.http://dx.doi.org/10.1016/j.energy.2012.10.038
a b s t r a c t
The solar chimney power plant is a system with promise to generate electrical power from free solarenergy. In this study, a solar collector, chimney and turbine are modeled together theoretically, and theiteration techniques are carried out to solve the resulting mathematical model. Results are validated bymeasurements from an actual physical plant. Moreover, the model is employed to predict the perfor-mance characteristics of large-scale commercial solar chimneys, indicating that the plant size, the factorof pressure drop at the turbine, and solar heat flux are important parameters for performanceenhancement. In addition, the study proposes that the most suitable plant, affordable by local govern-ment standards to respond to the electricity demand of a typical village in Thailand, is the one witha collector radius and chimney height of 200 m and 400 m, respectively. Furthermore, it is shown thatthe optimum ratio between the turbine extraction pressure and the available driving pressure for theproposed plant is approximately 0.84. A simple method to evaluate the turbine power output for solarchimney systems is also proposed in the study using dimensional analysis.
� 2012 Elsevier Ltd. All rights reserved.
1. Introduction
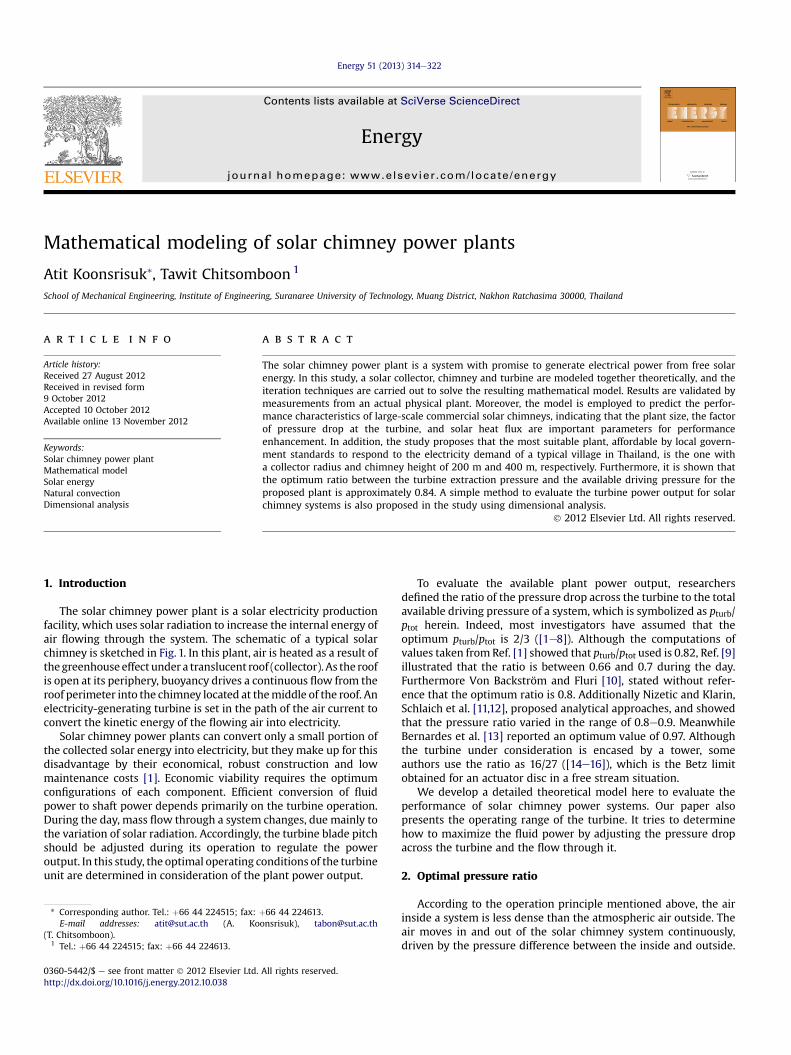
The solar chimney power plant is a solar electricity productionfacility, which uses solar radiation to increase the internal energy ofair flowing through the system. The schematic of a typical solarchimney is sketched in Fig. 1. In this plant, air is heated as a result ofthegreenhouse effect under a translucent roof (collector). As the roofis open at its periphery, buoyancy drives a continuous flow from theroof perimeter into the chimney located at themiddle of the roof. Anelectricity-generating turbine is set in the path of the air current toconvert the kinetic energy of the flowing air into electricity.
Solar chimney power plants can convert only a small portion ofthe collected solar energy into electricity, but they make up for thisdisadvantage by their economical, robust construction and lowmaintenance costs [1]. Economic viability requires the optimumconfigurations of each component. Efficient conversion of fluidpower to shaft power depends primarily on the turbine operation.During the day, mass flow through a system changes, due mainly tothe variation of solar radiation. Accordingly, the turbine blade pitchshould be adjusted during its operation to regulate the poweroutput. In this study, the optimal operating conditions of the turbineunit are determined in consideration of the plant power output.
þ66 44 224613.onsrisuk), [email protected]
All rights reserved.
To evaluate the available plant power output, researchersdefined the ratio of the pressure drop across the turbine to the totalavailable driving pressure of a system, which is symbolized as pturb/ptot herein. Indeed, most investigators have assumed that theoptimum pturb/ptot is 2/3 ([1e8]). Although the computations ofvalues taken from Ref. [1] showed that pturb/ptot used is 0.82, Ref. [9]illustrated that the ratio is between 0.66 and 0.7 during the day.Furthermore Von Backström and Fluri [10], stated without refer-ence that the optimum ratio is 0.8. Additionally Nizetic and Klarin,Schlaich et al. [11,12], proposed analytical approaches, and showedthat the pressure ratio varied in the range of 0.8e0.9. MeanwhileBernardes et al. [13] reported an optimum value of 0.97. Althoughthe turbine under consideration is encased by a tower, someauthors use the ratio as 16/27 ([14e16]), which is the Betz limitobtained for an actuator disc in a free stream situation.
We develop a detailed theoretical model here to evaluate theperformance of solar chimney power systems. Our paper alsopresents the operating range of the turbine. It tries to determinehow to maximize the fluid power by adjusting the pressure dropacross the turbine and the flow through it.
2. Optimal pressure ratio
According to the operation principle mentioned above, the airinside a system is less dense than the atmospheric air outside. Theair moves in and out of the solar chimney system continuously,driven by the pressure difference between the inside and outside.
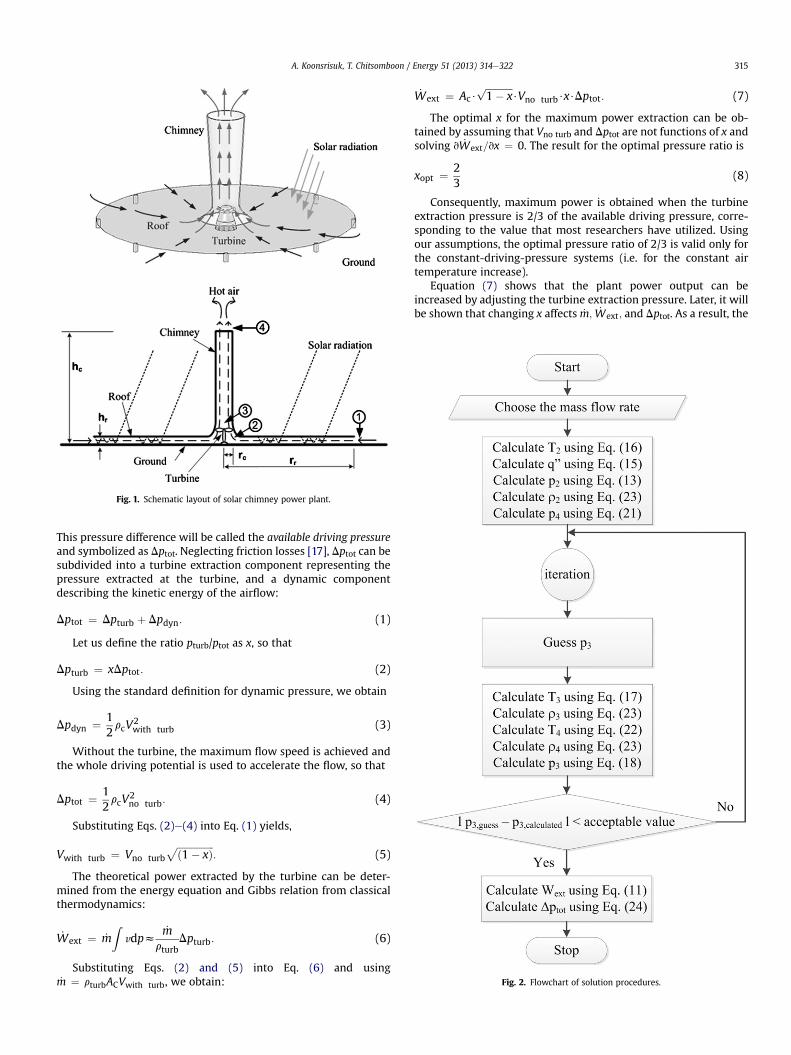
Fig. 1. Schematic layout of solar chimney power plant.
Fig. 2. Flowchart of solution procedures.
A. Koonsrisuk, T. Chitsomboon / Energy 51 (2013) 314e322 315
This pressure difference will be called the available driving pressureand symbolized as Dptot. Neglecting friction losses [17], Dptot can besubdivided into a turbine extraction component representing thepressure extracted at the turbine, and a dynamic componentdescribing the kinetic energy of the airflow:
Dptot ¼ Dpturb þ Dpdyn: (1)
Let us define the ratio pturb/ptot as x, so that
Dpturb ¼ xDptot: (2)
Using the standard definition for dynamic pressure, we obtain
Dpdyn ¼ 12rcV
2with turb (3)
Without the turbine, the maximum flow speed is achieved andthe whole driving potential is used to accelerate the flow, so that
Dptot ¼ 12rcV
2no turb: (4)
Substituting Eqs. (2)e(4) into Eq. (1) yields,
Vwith turb ¼ Vno turbffiffiffiffiffiffiffiffiffiffiffiffiffiffiffið1� xÞ
p: (5)
The theoretical power extracted by the turbine can be deter-mined from the energy equation and Gibbs relation from classicalthermodynamics:
_Wext ¼ _mZ
vdpz_m
rturbDpturb: (6)
Substituting Eqs. (2) and (5) into Eq. (6) and using_m ¼ rturbACVwith turb, we obtain:
_Wext ¼ Ac$ffiffiffiffiffiffiffiffiffiffiffi1� x
p$Vno turb$x$Dptot: (7)
The optimal x for the maximum power extraction can be ob-tained by assuming that Vno turb and Dptot are not functions of x andsolving v _Wext=vx ¼ 0. The result for the optimal pressure ratio is
xopt ¼ 23
(8)
Consequently, maximum power is obtained when the turbineextraction pressure is 2/3 of the available driving pressure, corre-sponding to the value that most researchers have utilized. Usingour assumptions, the optimal pressure ratio of 2/3 is valid only forthe constant-driving-pressure systems (i.e. for the constant airtemperature increase).
Equation (7) shows that the plant power output can beincreased by adjusting the turbine extraction pressure. Later, it willbe shown that changing x affects _m; _Wext; and Dptot. As a result, the
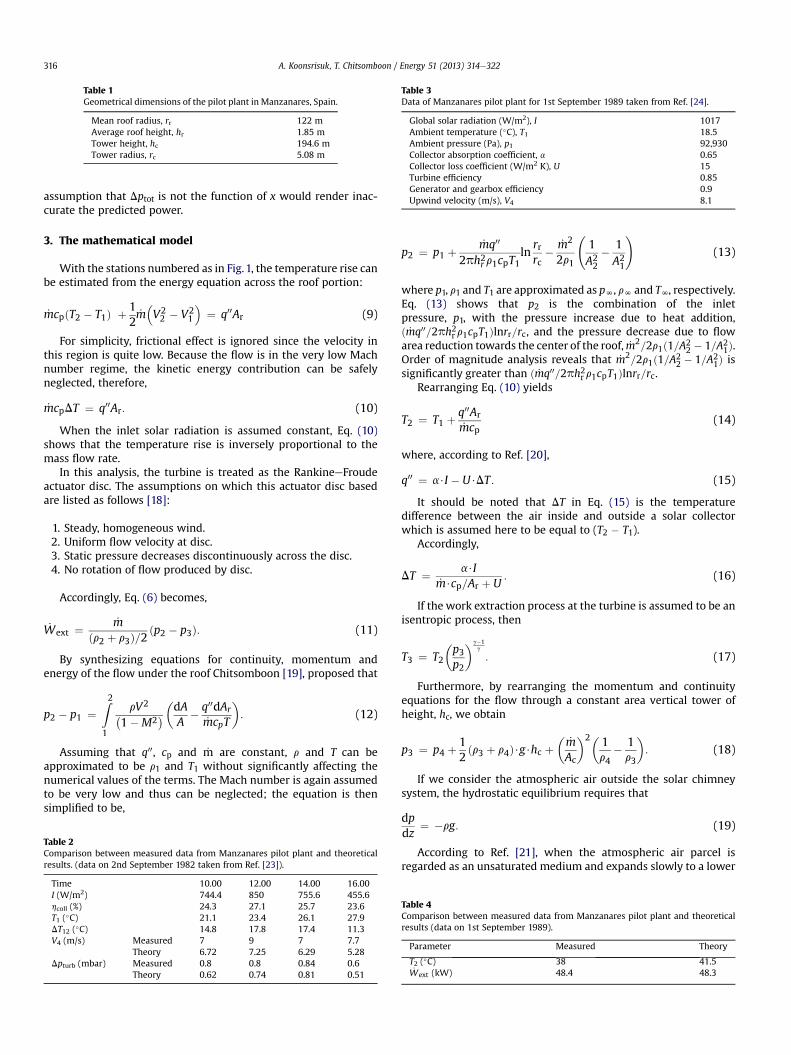
Table 1Geometrical dimensions of the pilot plant in Manzanares, Spain.
Mean roof radius, rr 122 mAverage roof height, hr 1.85 mTower height, hc 194.6 mTower radius, rc 5.08 m
Table 3Data of Manzanares pilot plant for 1st September 1989 taken from Ref. [24].
Global solar radiation (W/m2), I 1017Ambient temperature (�C), T1 18.5Ambient pressure (Pa), p1 92,930Collector absorption coefficient, a 0.65Collector loss coefficient (W/m2 K), U 15Turbine efficiency 0.85Generator and gearbox efficiency 0.9Upwind velocity (m/s), V4 8.1
A. Koonsrisuk, T. Chitsomboon / Energy 51 (2013) 314e322316
assumption that Dptot is not the function of x would render inac-curate the predicted power.
3. The mathematical model
With the stations numbered as in Fig.1, the temperature rise canbe estimated from the energy equation across the roof portion:
_mcpðT2 � T1Þ þ 12_m�V22 � V2
1
�¼ q00Ar (9)
For simplicity, frictional effect is ignored since the velocity inthis region is quite low. Because the flow is in the very low Machnumber regime, the kinetic energy contribution can be safelyneglected, therefore,
_mcpDT ¼ q00Ar: (10)
When the inlet solar radiation is assumed constant, Eq. (10)shows that the temperature rise is inversely proportional to themass flow rate.
In this analysis, the turbine is treated as the RankineeFroudeactuator disc. The assumptions on which this actuator disc basedare listed as follows [18]:
1. Steady, homogeneous wind.2. Uniform flow velocity at disc.3. Static pressure decreases discontinuously across the disc.4. No rotation of flow produced by disc.
Accordingly, Eq. (6) becomes,
_Wext ¼ _mðr2 þ r3Þ=2
ðp2 � p3Þ: (11)
By synthesizing equations for continuity, momentum andenergy of the flow under the roof Chitsomboon [19], proposed that
p2 � p1 ¼Z21
rV2�1�M2
��dAA
� q00dAr_mcpT
�: (12)
Assuming that q00, cp and _m are constant, r and T can beapproximated to be r1 and T1 without significantly affecting thenumerical values of the terms. The Mach number is again assumedto be very low and thus can be neglected; the equation is thensimplified to be,
Table 2Comparison between measured data from Manzanares pilot plant and theoreticalresults. (data on 2nd September 1982 taken from Ref. [23]).
Time 10.00 12.00 14.00 16.00I (W/m2) 744.4 850 755.6 455.6hcoll (%) 24.3 27.1 25.7 23.6T1 (�C) 21.1 23.4 26.1 27.9DT12 (�C) 14.8 17.8 17.4 11.3V4 (m/s) Measured 7 9 7 7.7
Theory 6.72 7.25 6.29 5.28Dpturb (mbar) Measured 0.8 0.8 0.84 0.6
Theory 0.62 0.74 0.81 0.51
p2 ¼ p1 þ_mq002 ln
rrr
� _m2
2r12 �
12 (13)
2phr r1cpT1 c 1
A2 A1
!
where p1, r1 and T1 are approximated as pN, rN and TN, respectively.Eq. (13) shows that p2 is the combination of the inletpressure, p1, with the pressure increase due to heat addition,ð _mq00=2ph2r r1cpT1Þlnrr=rc, and the pressure decrease due to flowarea reduction towards the center of the roof, _m2=2r1ð1=A2
2 � 1=A21Þ.
Order of magnitude analysis reveals that _m2=2r1ð1=A22 � 1=A2
1Þ issignificantly greater than ð _mq00=2ph2r r1cpT1Þlnrr=rc.
Rearranging Eq. (10) yields
T2 ¼ T1 þq00Ar_mcp
(14)
where, according to Ref. [20],
q00 ¼ a$I � U$DT : (15)
It should be noted that DT in Eq. (15) is the temperaturedifference between the air inside and outside a solar collectorwhich is assumed here to be equal to (T2 � T1).
Accordingly,
DT ¼ a$I_m$cp=Ar þ U
: (16)
If the work extraction process at the turbine is assumed to be anisentropic process, then
T3 ¼ T2
�p3p2
�g�1g
: (17)
Furthermore, by rearranging the momentum and continuityequations for the flow through a constant area vertical tower ofheight, hc, we obtain
p3 ¼ p4 þ12ðr3 þ r4Þ$g$hc þ
�_mAc
�2� 1r4
� 1r3
�: (18)
If we consider the atmospheric air outside the solar chimneysystem, the hydrostatic equilibrium requires that
dpdz
¼ �rg: (19)
According to Ref. [21], when the atmospheric air parcel isregarded as an unsaturated medium and expands slowly to a lower
Table 4Comparison between measured data from Manzanares pilot plant and theoreticalresults (data on 1st September 1989).
Parameter Measured Theory
T2 (�C) 38 41.5_Wext (kW) 48.4 48.3
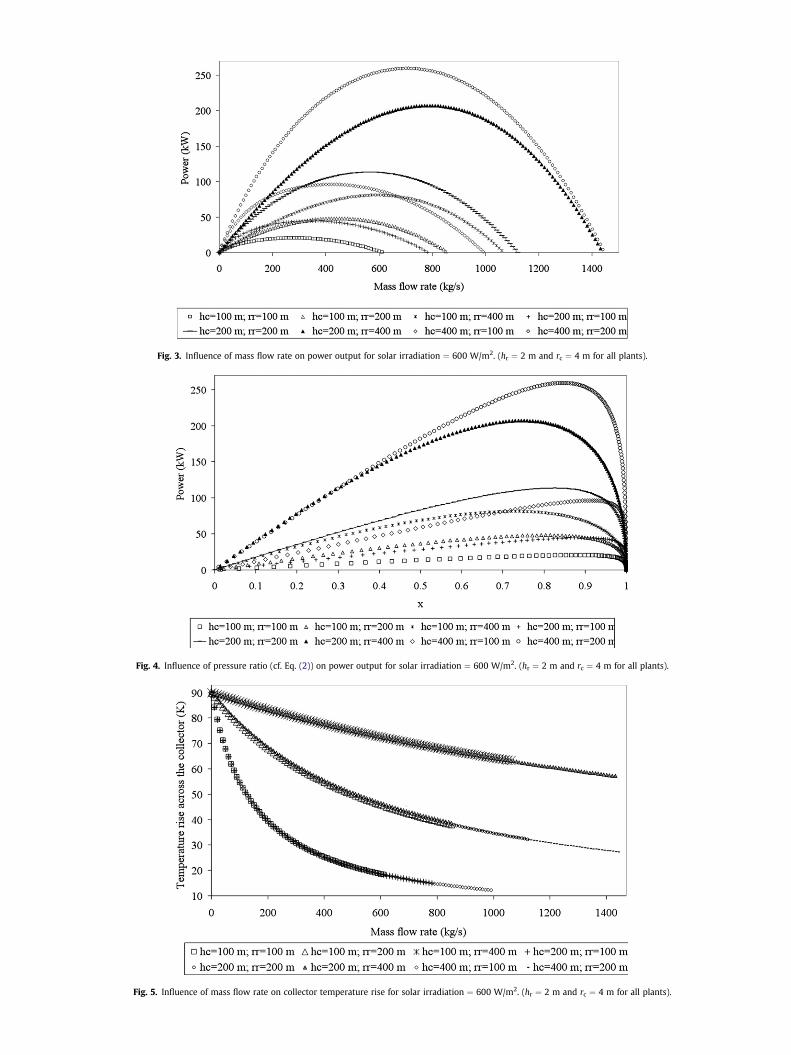
Fig. 3. Influence of mass flow rate on power output for solar irradiation ¼ 600 W/m2. (hr ¼ 2 m and rc ¼ 4 m for all plants).
Fig. 4. Influence of pressure ratio (cf. Eq. (2)) on power output for solar irradiation ¼ 600 W/m2. (hr ¼ 2 m and rc ¼ 4 m for all plants).
Fig. 5. Influence of mass flow rate on collector temperature rise for solar irradiation ¼ 600 W/m2. (hr ¼ 2 m and rc ¼ 4 m for all plants).

Fig. 6. Influence of mass flow rate on power output along lines of constant solar irradiation. (hr ¼ 2 m, rr ¼ 200 m, hc ¼ 400 m and rc ¼ 4 m for all cases).
A. Koonsrisuk, T. Chitsomboon / Energy 51 (2013) 314e322318
atmospheric pressure without exchange of heat, the dry adiabatictemperature lapse rate equation can be written as
T ¼ TN � gcpz: (20)
Assuming that the air obeys the ideal gas equation of state,Eq. (20) can be substituted into Eq. (19) to give p4 for the outsideair as
p4 ¼ pN
�1� g
cpTNhc
�cpR
: (21)
Consider that a dry adiabatic lapse rate can be applied to theflow in a tower. In accordance with Eq. (20),
Fig. 7. Influence of pressure ratio on power output along lines of constant solar
T4 ¼ T3 �gcp
hc: (22)
For an ideal gas,
r2 ¼ p2RT2
; r3 ¼ p3RT3
; r4 ¼ p4RT4
: (23)
Theoretically the driving pressure of the solar chimney (Dptot) isthe difference between pressure potentials caused by the column ofcold air outside the chimney and the corresponding column ofwarm air inside the chimney [22]. Consider that the pressure at thechimney exit and the pressure outside the chimney but at the sameheight as the chimney exit are approximately equal. Consequently,in this analysis we propose
Dptot ¼ p1 � p3: (24)
irradiation. (hr ¼ 2 m, rr ¼ 200 m, hc ¼ 400 m and rc ¼ 4 m for all cases).
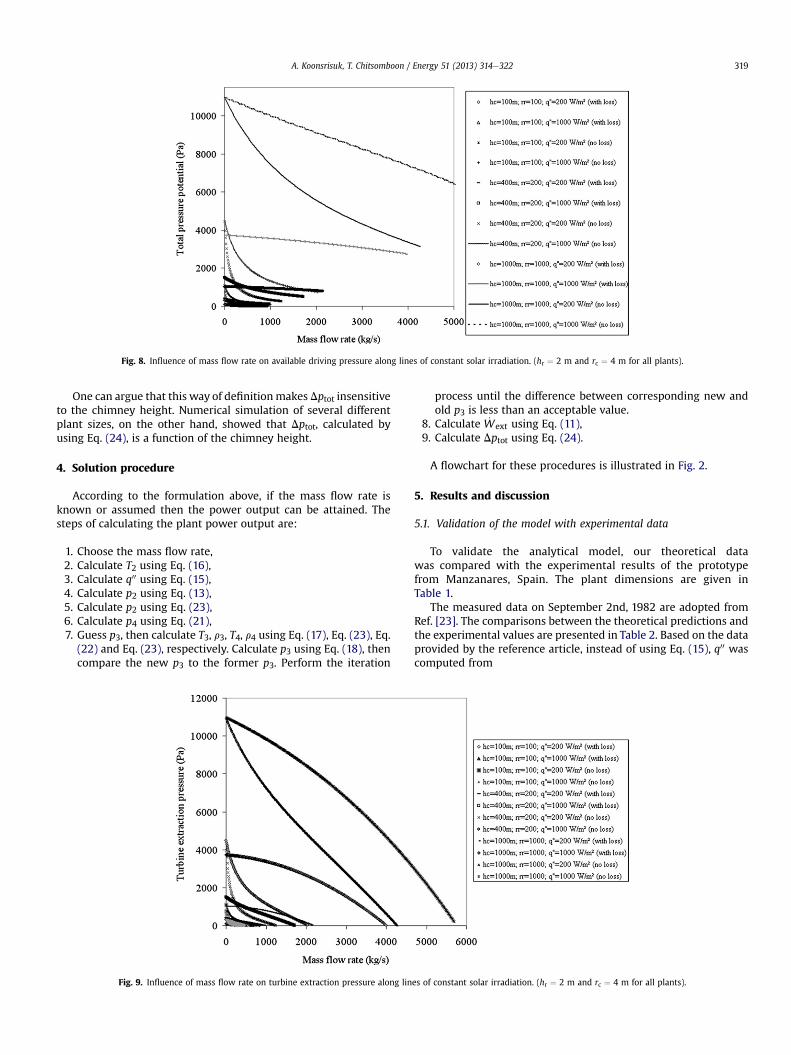
Fig. 8. Influence of mass flow rate on available driving pressure along lines of constant solar irradiation. (hr ¼ 2 m and rc ¼ 4 m for all plants).
A. Koonsrisuk, T. Chitsomboon / Energy 51 (2013) 314e322 319
One can argue that this way of definitionmakes Dptot insensitiveto the chimney height. Numerical simulation of several differentplant sizes, on the other hand, showed that Dptot, calculated byusing Eq. (24), is a function of the chimney height.
4. Solution procedure
According to the formulation above, if the mass flow rate isknown or assumed then the power output can be attained. Thesteps of calculating the plant power output are:
1. Choose the mass flow rate,2. Calculate T2 using Eq. (16),3. Calculate q00 using Eq. (15),4. Calculate p2 using Eq. (13),5. Calculate p2 using Eq. (23),6. Calculate p4 using Eq. (21),7. Guess p3, then calculate T3, r3, T4, r4 using Eq. (17), Eq. (23), Eq.
(22) and Eq. (23), respectively. Calculate p3 using Eq. (18), thencompare the new p3 to the former p3. Perform the iteration
Fig. 9. Influence of mass flow rate on turbine extraction pressure along lin
process until the difference between corresponding new andold p3 is less than an acceptable value.
8. Calculate _Wext using Eq. (11),9. Calculate Dptot using Eq. (24).
A flowchart for these procedures is illustrated in Fig. 2.
5. Results and discussion
5.1. Validation of the model with experimental data
To validate the analytical model, our theoretical datawas compared with the experimental results of the prototypefrom Manzanares, Spain. The plant dimensions are given inTable 1.
The measured data on September 2nd, 1982 are adopted fromRef. [23]. The comparisons between the theoretical predictions andthe experimental values are presented in Table 2. Based on the dataprovided by the reference article, instead of using Eq. (15), q00 wascomputed from
es of constant solar irradiation. (hr ¼ 2 m and rc ¼ 4 m for all plants).
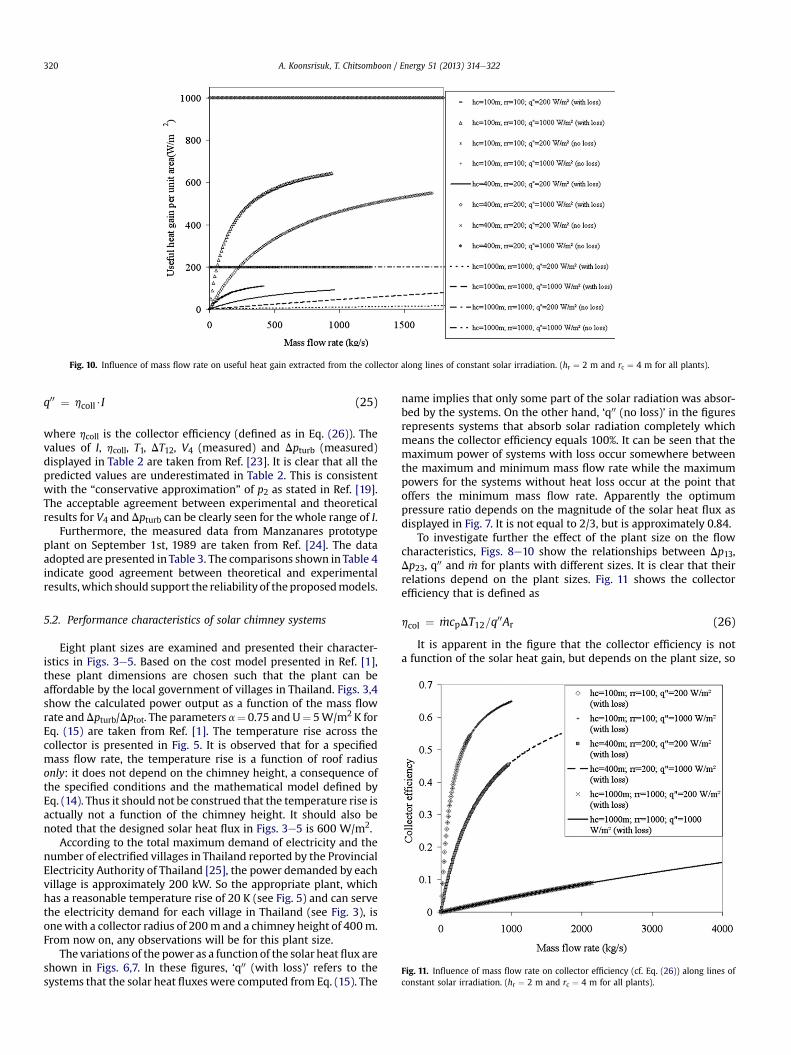
Fig. 10. Influence of mass flow rate on useful heat gain extracted from the collector along lines of constant solar irradiation. (hr ¼ 2 m and rc ¼ 4 m for all plants).
A. Koonsrisuk, T. Chitsomboon / Energy 51 (2013) 314e322320
q00 ¼ hcoll$I (25)
where hcoll is the collector efficiency (defined as in Eq. (26)). Thevalues of I, hcoll, T1, DT12, V4 (measured) and Dpturb (measured)displayed in Table 2 are taken from Ref. [23]. It is clear that all thepredicted values are underestimated in Table 2. This is consistentwith the “conservative approximation” of p2 as stated in Ref. [19].The acceptable agreement between experimental and theoreticalresults for V4 and Dpturb can be clearly seen for the whole range of I.
Furthermore, the measured data from Manzanares prototypeplant on September 1st, 1989 are taken from Ref. [24]. The dataadopted are presented in Table 3. The comparisons shown in Table 4indicate good agreement between theoretical and experimentalresults, which should support the reliability of the proposedmodels.
Fig. 11. Influence of mass flow rate on collector efficiency (cf. Eq. (26)) along lines ofconstant solar irradiation. (hr ¼ 2 m and rc ¼ 4 m for all plants).
5.2. Performance characteristics of solar chimney systems
Eight plant sizes are examined and presented their character-istics in Figs. 3e5. Based on the cost model presented in Ref. [1],these plant dimensions are chosen such that the plant can beaffordable by the local government of villages in Thailand. Figs. 3,4show the calculated power output as a function of the mass flowrate andDpturb/Dptot. The parameters a¼ 0.75 and U¼ 5W/m2 K forEq. (15) are taken from Ref. [1]. The temperature rise across thecollector is presented in Fig. 5. It is observed that for a specifiedmass flow rate, the temperature rise is a function of roof radiusonly: it does not depend on the chimney height, a consequence ofthe specified conditions and the mathematical model defined byEq. (14). Thus it should not be construed that the temperature rise isactually not a function of the chimney height. It should also benoted that the designed solar heat flux in Figs. 3e5 is 600 W/m2.
According to the total maximum demand of electricity and thenumber of electrified villages in Thailand reported by the ProvincialElectricity Authority of Thailand [25], the power demanded by eachvillage is approximately 200 kW. So the appropriate plant, whichhas a reasonable temperature rise of 20 K (see Fig. 5) and can servethe electricity demand for each village in Thailand (see Fig. 3), isonewith a collector radius of 200m and a chimney height of 400m.From now on, any observations will be for this plant size.
The variations of the power as a function of the solar heat flux areshown in Figs. 6,7. In these figures, ‘q00 (with loss)’ refers to thesystems that the solar heat fluxes were computed from Eq. (15). The
name implies that only some part of the solar radiation was absor-bed by the systems. On the other hand, ‘q00 (no loss)’ in the figuresrepresents systems that absorb solar radiation completely whichmeans the collector efficiency equals 100%. It can be seen that themaximum power of systems with loss occur somewhere betweenthe maximum and minimum mass flow rate while the maximumpowers for the systems without heat loss occur at the point thatoffers the minimum mass flow rate. Apparently the optimumpressure ratio depends on the magnitude of the solar heat flux asdisplayed in Fig. 7. It is not equal to 2/3, but is approximately 0.84.
To investigate further the effect of the plant size on the flowcharacteristics, Figs. 8e10 show the relationships between Dp13,Dp23, q00 and _m for plants with different sizes. It is clear that theirrelations depend on the plant sizes. Fig. 11 shows the collectorefficiency that is defined as
hcol ¼ _mcpDT12=q00Ar (26)
It is apparent in the figure that the collector efficiency is nota function of the solar heat gain, but depends on the plant size, so
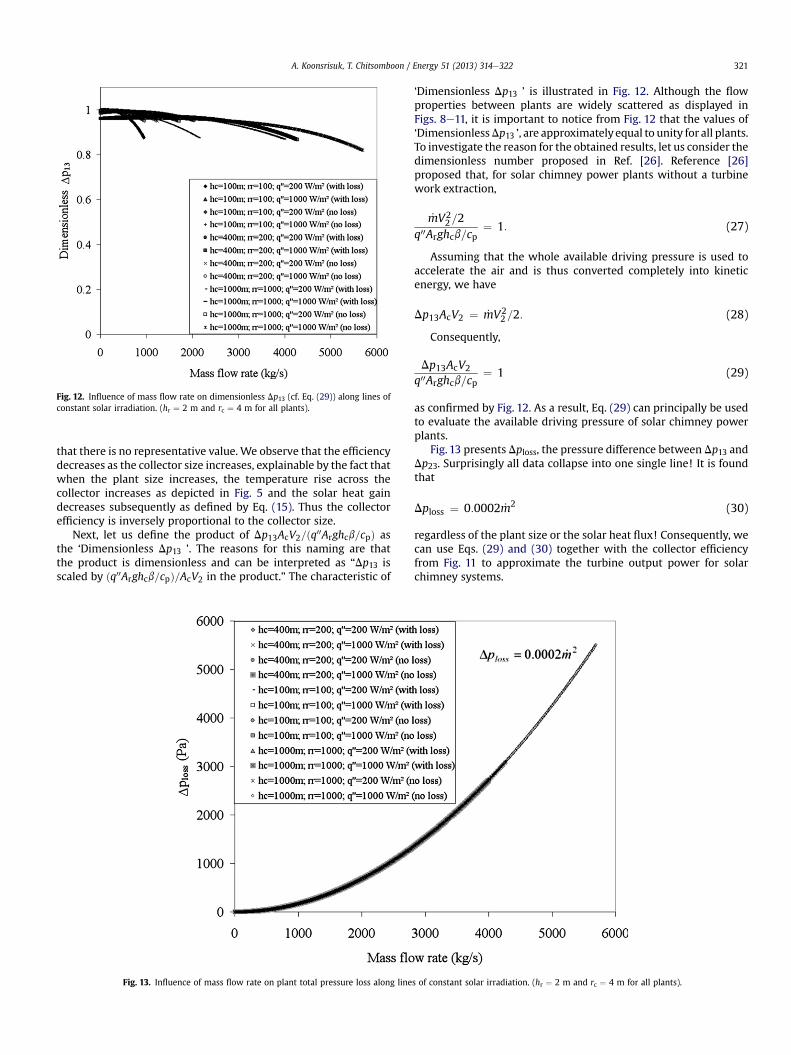
Fig. 12. Influence of mass flow rate on dimensionless Dp13 (cf. Eq. (29)) along lines ofconstant solar irradiation. (hr ¼ 2 m and rc ¼ 4 m for all plants).
A. Koonsrisuk, T. Chitsomboon / Energy 51 (2013) 314e322 321
that there is no representative value. We observe that the efficiencydecreases as the collector size increases, explainable by the fact thatwhen the plant size increases, the temperature rise across thecollector increases as depicted in Fig. 5 and the solar heat gaindecreases subsequently as defined by Eq. (15). Thus the collectorefficiency is inversely proportional to the collector size.
Next, let us define the product of Dp13AcV2=ðq00Arghcb=cpÞ asthe ‘Dimensionless Dp13 ’. The reasons for this naming are thatthe product is dimensionless and can be interpreted as “Dp13 isscaled by ðq00Arghcb=cpÞ=AcV2 in the product.” The characteristic of
Fig. 13. Influence of mass flow rate on plant total pressure loss along line
‘Dimensionless Dp13 ’ is illustrated in Fig. 12. Although the flowproperties between plants are widely scattered as displayed inFigs. 8e11, it is important to notice from Fig. 12 that the values of‘DimensionlessDp13 ’, are approximatelyequal to unity for all plants.To investigate the reason for the obtained results, let us consider thedimensionless number proposed in Ref. [26]. Reference [26]proposed that, for solar chimney power plants without a turbinework extraction,
_mV22=2
q00Arghcb=cp¼ 1: (27)
Assuming that the whole available driving pressure is used toaccelerate the air and is thus converted completely into kineticenergy, we have
Dp13AcV2 ¼ _mV22 =2: (28)
Consequently,
Dp13AcV2
q00Arghcb=cp¼ 1 (29)
as confirmed by Fig. 12. As a result, Eq. (29) can principally be usedto evaluate the available driving pressure of solar chimney powerplants.
Fig. 13 presents Dploss, the pressure difference between Dp13 andDp23. Surprisingly all data collapse into one single line! It is foundthat
Dploss ¼ 0:0002 _m2 (30)
regardless of the plant size or the solar heat flux! Consequently, wecan use Eqs. (29) and (30) together with the collector efficiencyfrom Fig. 11 to approximate the turbine output power for solarchimney systems.
s of constant solar irradiation. (hr ¼ 2 m and rc ¼ 4 m for all plants).
A. Koonsrisuk, T. Chitsomboon / Energy 51 (2013) 314e322322
6. Conclusion
Theoretical simulations were conducted in order to evaluate theperformance of solar chimney power plants. The relationshipsbetween the pressure ratio and the mass flow rate and between thetemperature rise across the collector and the power output werepresented. It was found that, for the systemwith a constant drivingpressure (available system pressure difference), the optimum ratioof the turbine extraction pressure to the driving pressure is 2/3. Forthe system with the non-constant driving pressure, it is obviousthat this optimum ratio is a function of the plant size and solar heatflux. This observation would be helpful in the preliminary plantdesign. In addition, it was shown that the appropriate plant, whichcan serve the electricity demand for each village in Thailand andthe investment cost would be affordable by the local government, isthe one with a collector radius of 200 m and a chimney height of400 m. The optimum pressure ratio for the proposed plant is equalto 0.84 approximately. The paper also proposes the simple methodto primarily evaluate the turbine power output for solar chimneysystems.
Economic viability requires the optimum configurations of eachcomponent. To develop amathematical statement for optimization,we need a simple-but-accurate mathematical model of solarchimney power plants. Even though the solar chimney power plantconcept has been proposed and intensively studied before byseveral different researchers. The mathematical models proposedin the literature are mathematically so complex and some of themdo not in the form that suitable for us to optimize. The mathe-matical model presented here is relatively simple while providesa very accurate result as shown in Table 4. So we will use thepresent mathematical model to find the optimum operatingconditions for the whole system in our next study.
Acknowledgments
This research was sponsored by the SUT Research and Devel-opment fund of Suranaree University of Technology (SUT), Thailand.
References
[1] Schlaich J. The solar chimney. Stuttgart, Germany: Edition Axel Menges; 1995.[2] Haaf W, Friedrich K, Mayr G, Schlaich J. Solar chimneys: part I: principle and
construction of the pilot plant in Manzanares. Int J Sol Energ 1983;2:3e20.[3] Mullett LB. The solar chimney e overall efficiency, design and performance.
Int J Ambient Energ 1987;8(1):35e40.[4] Lodhi MAK. Application of helio-aero-gravity concept in producing energy and
suppressing pollution. Energ Convers Manage 1999;40:407e21.[5] Von Backström TW, Gannon AJ. The solar chimney air standard thermody-
namic cycle. SAIMechE R&D J 2000;16(1):16e24.[6] Dai YJ, Huang HB, Wang RZ. Case study of solar chimney power plants in
northwestern regions of China. Renew Energ 2003;28:1295e304.[7] Nizetic S, Ninic N, Klarin B. Analysis and feasibility of implementing solar
chimney power plants in the Mediterranean region. Energy 2008;33(11):1680e90.
[8] Kashiwa BA, Kashiwa CB. The solar cyclone: a solar chimney for harvestingatmospheric water. Energy 2008;33(2):331e9.
[9] Hedderwick RA. Performance evaluation of a solar chimney power plant. M.Sc.Eng.-thesis: University of Stellenbosch, Stellenbosch, South Africa, 2001.
[10] Von Backström TW, Fluri TP. Maximum fluid power condition insolar chimney power plants e an analytical approach. Sol Energy 2006;80:1417e23.
[11] Nizetic S, Klarin B. A simplified analytical approach for evaluation of theoptimal ratio of pressure drop across the turbine in solar chimney powerplants. Appl Energy 2010;87(2):587e91.
[12] Schlaich J, Bergermann R, Schiel W, Weinrebe G. Design of commercial solarupdraft tower systems utilization of solar induced convective flows for powergeneration. J Sol Energ-T ASME 2005;127:117e24.
[13] Bernardes MA, Dos S, Voß A, Weinrebe G. Thermal and technical analyses ofsolar chimneys. Sol Energy 2003;75(6):511e24.
[14] Pasumarthi N, Sherif SA. Experimental and theoretical performance ofa demonstration solar chimney model e part I: mathematical modeldevelopment. Int J Energ Res 1998;22:277e88.
[15] Pastohr H, Kornadt O, Gürlebeck K. Numerical and analytical calculations ofthe temperature and flow field in the upwind power plant. Int J Energ Res2004;28:495e510.
[16] Onyango FN, Ochieng RM. The potential of solar chimney for application inrural areas of developing countries. Fuel 2006;85:2561e6.
[17] Koonsrisuk A, Lorente S, Bejan A. Constructal solar chimney configuration. IntJ Heat Mass Tran 2010;53(1e3):327e33.
[18] Koonsrisuk A. Mathematical modeling of sloped solar chimney power plants.Energy, http://dx.doi.org/10.1016/j.energy.2012.09.039; 2012.
[19] Chitsomboon T. A validated analytical model for flow in solar chimney.Int J Renew Energ Eng 2001;3(2):339e46.
[20] Duffie J, Beckman WA. Solar engineering of thermal processes. 2nd ed. USA:John Wiley & Sons, Inc; 1991.
[21] Calvert JG. Glossary of atmospheric chemistry terms (Recommendations1990). Pure Appl Chem 1990;62(11):2167e219.
[22] Zhou XP, Bernardes MA dos S, Ochieng RM. Influence of atmospheric crossflow on solar updraft tower inflow. Energy 2012;42(1):393e400.
[23] Haaf W. Solar chimneys: part II: preliminary test results from the Manzanaresplant. Int J Sol Energ 1984;2:141e61.
[24] Weinrebe G, Schiel W. Up-draught solar tower and down-draught energytower e a comparison. Proceedings of the ISES solar World Congress 2001:Adelaide, Australia, 2001.
[25] Provincial Electricity Authority of Thailand. 2007. Annual report [On-line].Available from: http://www.pea.co.th/annualreport/2007/PEA.swf.
[26] Koonsrisuk A, Chitsomboon T. A single dimensionless variable for solar towerplant modeling. Sol Energy 2009;83(12):2136e43.
Nomenclature
A: flow area, m2
Ar: roof area, m2
cp: specific heat capacity at constant pressure, J/(kg K)g: gravitational acceleration, m/s2
hc: chimney height, mhr: roof height above the ground, mI: solar irradiation, W/m2
M: Mach number_m: mass flow rate, kg/sp: pressure, Paq00: insolation, W/m2
R: ideal gas constant, J/kg Krc: chimney radius, mrr: roof radius, mT: absolute temperature, KU: collector loss coefficient, W/m2 KV: flow velocity, m/sx: pressure ratio, Eq. (2)v: specific volume, m3/kg_W: power, Wz: cartesian coordinate in vertical direction
Greek symbolsa: collector absorption coefficientb: coefficient of volumetric thermal expansion, 1/KDp: pressure drop, PaDT: temperature rise between ambient and collector outlet, Kg: specific heat ratiohcol: collector efficiencyr: density, kg/m3
Subscripts1,2,3,4: position along chimney (as depicted in Fig. 1)c: chimneydyn: dynamic pressure componentext: extraction by the turbineloss: difference between the available driving pressure and the turbine extraction
pressureno turb: without turbineopt: optimumr: rooftot: total pressure componentturb: turbinewith turb: with turbineN: free stream