math: question 1 - rhs instructional dashboard -...
TRANSCRIPT
12/16/2016 about:blank
https://k12reports.collegeboard.org/reports?orgId=115389 1/1
Math: Question 1
Abigail can read 200 words in one minute. If she were to read at this rate for 30 minutes eachday, how many days would Abigail take to read 30,000 words of a book?
A. 4B. 5C. 6D. 7
Choice B is correct. Abigail can read 200 words in one minute. If she were to read at this ratefor 30 minutes each day, in 1 day she would read (200)(30) = 6,000 words. Therefore, at thisrate she can read 30,000 words of a book in days.
Choice A is incorrect. At the rate described, in 4 days Abigail would read (200)(30)(4) = 24,000words. Choice C is incorrect. At the rate described, in 6 days Abigail would read (200)(30)(6) =36,000 words. Choice D is incorrect. At the rate described, in 7 days Abigail would read (200)(30)(7) = 42,000 words.
Question Difficulty: Easy
12/16/2016 about:blank
https://k12reports.collegeboard.org/reports?orgId=115389 1/2
Math: Question 2
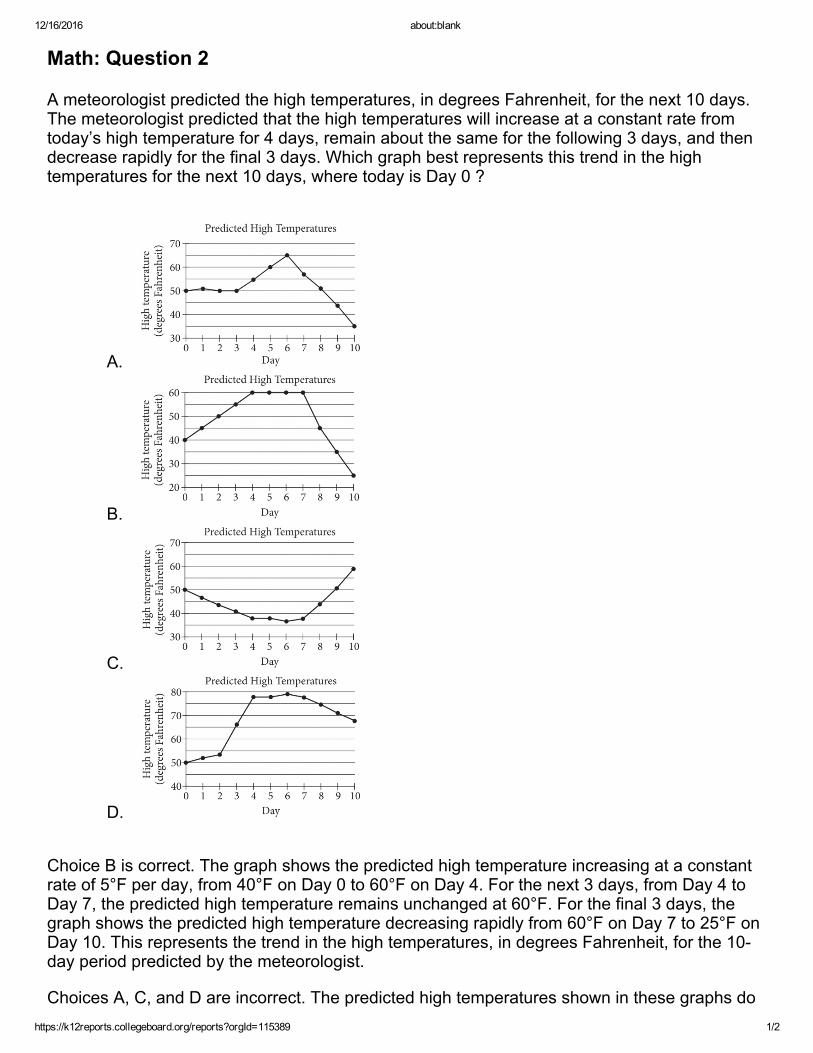
A meteorologist predicted the high temperatures, in degrees Fahrenheit, for the next 10 days.The meteorologist predicted that the high temperatures will increase at a constant rate fromtoday’s high temperature for 4 days, remain about the same for the following 3 days, and thendecrease rapidly for the final 3 days. Which graph best represents this trend in the hightemperatures for the next 10 days, where today is Day 0 ?
A.
B.
C.
D.
Choice B is correct. The graph shows the predicted high temperature increasing at a constantrate of 5°F per day, from 40°F on Day 0 to 60°F on Day 4. For the next 3 days, from Day 4 toDay 7, the predicted high temperature remains unchanged at 60°F. For the final 3 days, thegraph shows the predicted high temperature decreasing rapidly from 60°F on Day 7 to 25°F onDay 10. This represents the trend in the high temperatures, in degrees Fahrenheit, for the 10day period predicted by the meteorologist.
Choices A, C, and D are incorrect. The predicted high temperatures shown in these graphs do
12/16/2016 about:blank
https://k12reports.collegeboard.org/reports?orgId=115389 2/2
not correspond to the trend predicted by the meteorologist. For example, the graphs given inchoices A, C, and D do not show the predicted high temperature increasing at a constant ratefrom Day 0 to Day 4.
Question Difficulty: Easy

12/16/2016 about:blank
https://k12reports.collegeboard.org/reports?orgId=115389 1/1
Math: Question 3
A journalist earns $50 for an article that appears in an online publication, plus $0.08 per word inthe article. If the journalist earned a total of $70 for the article, how many words were in thearticle?
A. 250B. 625C. 875D. 925
Choice A is correct. For an article that appears in the publication, the journalist earns $50 plus$0.08 per word in the article. Therefore, for an article that has x words, the journalist will earn0.08x + 50 dollars. If the journalist earned a total of $70 for an article, it follows that 70 = 0.08x+ 50. Solving for x by first subtracting 50 from both sides of the equation and then dividing bothsides of the equation by 0.08 yields x = 250. Therefore, there were 250 words in the article.
Choice B is incorrect and results from solving the equation 50 = 0.08x, where x is the number ofwords in the article. However, this equation represents a situation where the journalist earned$0.08 per word for a total of $50. Choice C is incorrect and results from solving the equation 70= 0.08x, where x is the number of words in the article. However, this equation does not accountfor the $50 the journalist earned for the article in addition to the $0.08 per word in the article.Choice D is incorrect and results from errors made when representing the situationalgebraically or solving the equation for the variable that represents the number of words in thearticle.
Question Difficulty: Easy

12/16/2016 about:blank
https://k12reports.collegeboard.org/reports?orgId=115389 1/2
Math: Question 4
A coffee shop has a customer loyalty program. For every 4 drinks a customer orders for $2each, the next drink the customer orders is free. Which of the following graphs represents therelationship between x, the number of drinks a customer orders, and y, the total cost, in dollars,of the drinks, for ?
A.
B.
C.
D.
Choice B is correct. For every 4 drinks a customer orders for $2, the next drink is free.Therefore, when the number of drinks ordered is between 0 and 4, the total cost, in dollars,increases at a constant rate of $2 per drink, as this graph shows. The total cost of 5 drinks isthe same as the total cost of 4 drinks because the fifth drink ordered is free. This trend repeatsfor the next 5 drinks ordered and so on.

12/16/2016 about:blank
https://k12reports.collegeboard.org/reports?orgId=115389 2/2
Choice A is incorrect. This graph represents a situation where each drink ordered is $2 and nodrinks are free. Choice C is incorrect. This graph represents a situation where for every 3 drinksa customer orders for $2, the next drink is free. Choice D is incorrect. This graph represents asituation where a customer orders 4 drinks for $2 each and the next 2 drinks are free; then thecustomer orders 3 more drinks for $2 each and the next drink is free.
Question Difficulty: Medium
12/16/2016 about:blank
https://k12reports.collegeboard.org/reports?orgId=115389 1/1
Math: Question 5
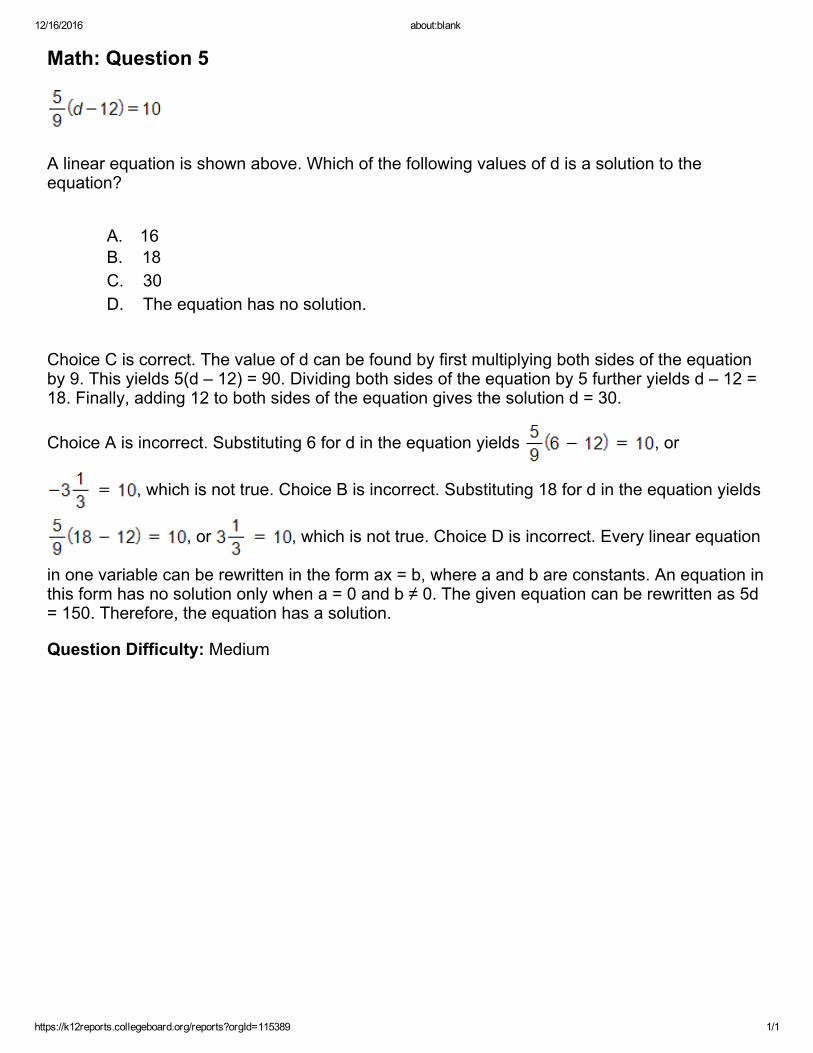
A linear equation is shown above. Which of the following values of d is a solution to theequation?
A. 16B. 18C. 30D. The equation has no solution.
Choice C is correct. The value of d can be found by first multiplying both sides of the equationby 9. This yields 5(d – 12) = 90. Dividing both sides of the equation by 5 further yields d – 12 =18. Finally, adding 12 to both sides of the equation gives the solution d = 30.
Choice A is incorrect. Substituting 6 for d in the equation yields , or
, which is not true. Choice B is incorrect. Substituting 18 for d in the equation yields
, or , which is not true. Choice D is incorrect. Every linear equation
in one variable can be rewritten in the form ax = b, where a and b are constants. An equation inthis form has no solution only when a = 0 and b ≠ 0. The given equation can be rewritten as 5d= 150. Therefore, the equation has a solution.
Question Difficulty: Medium
12/16/2016 about:blank
https://k12reports.collegeboard.org/reports?orgId=115389 1/1
Math: Question 6
Which of the following situations exhibits exponential growth over time?
A.The amount of money in a retirement account that is decreasing in value by4% each year
B.The salary of an employee who receives a $2,000 increase in salary at the end ofeach year
C.The amount of rent for an apartment when the landlord raises the rent by $125 every12 months
D.The amount of money in a savings account that earns 1% annual interestcompounded monthly
Choice D is correct. When a quantity grows exponentially over time, the amount added isproportional to the amount already present. As the quantity gets larger, the amount of increasegets proportionally larger. For example, when the amount of money in a savings account grows
by 1% annual interest that is compounded monthly, each month of the amount in the
account is added to the account. Each subsequent month the amount added is larger, since thetotal amount in the account grows each month and the amount added is proportional to theamount already present.
Choices A, B, and C are incorrect because none of these situations exhibits exponential growthover time. The situation in choice A describes an amount that is decreasing exponentially overtime. For the situations described in choices B and C, the amount added is fixed and notproportional to the amount already present. Therefore, these situations do not exhibitexponential growth.
Question Difficulty: Medium
12/16/2016 about:blank
https://k12reports.collegeboard.org/reports?orgId=115389 1/1
Math: Question 7
At a factory, there were 60 defective items produced in 2012. From 2012 to 2013, this numberdecreased by 10 percent. How many defective items were produced at the factory in 2013 ?
A. 50B. 54C. 55D. 66
Choice B is correct. The number of defective items produced at the factory decreased by 10%from 2012 to 2013. This means that the number of defective items produced at the factory in2013 was 90% of the number of defective items produced at the factory in 2012. Since 60defective items were produced in 2012, the number of defective items produced in 2013 was(0.90)(60), or 54.
Choice A is incorrect and may result from decreasing the number of defective items producedat the factory in 2012 by 10 items. However, in the given situation, a decrease by 10% is notequivalent to a decrease by 10 items. Choice C is incorrect and may result from thinking thatthe number of defective items in 2012 was a 10% increase from the number of defective itemsin 2013. Choice D is incorrect and may result from increasing the number of defective itemsproduced at the factory in 2012 by 10%.
Question Difficulty: Medium
12/16/2016 about:blank
https://k12reports.collegeboard.org/reports?orgId=115389 1/1
Math: Question 8
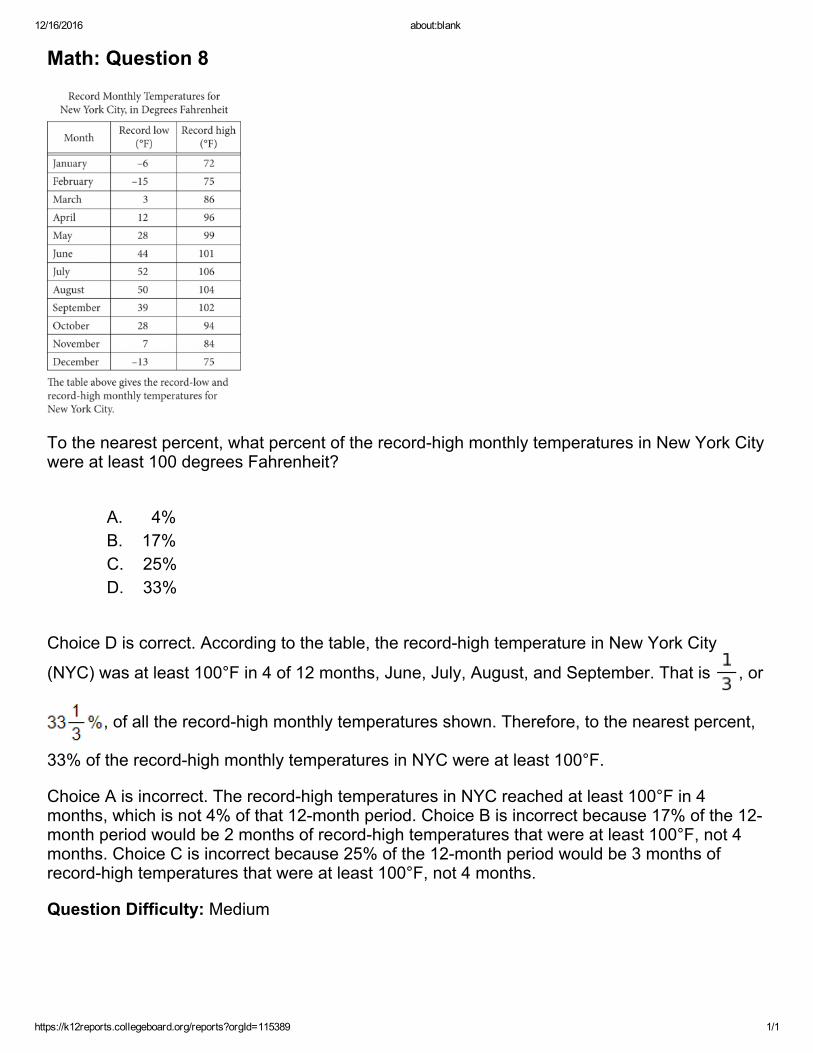
To the nearest percent, what percent of the recordhigh monthly temperatures in New York Citywere at least 100 degrees Fahrenheit?
A. 4%B. 17%C. 25%D. 33%
Choice D is correct. According to the table, the recordhigh temperature in New York City
(NYC) was at least 100°F in 4 of 12 months, June, July, August, and September. That is , or
, of all the recordhigh monthly temperatures shown. Therefore, to the nearest percent,
33% of the recordhigh monthly temperatures in NYC were at least 100°F.
Choice A is incorrect. The recordhigh temperatures in NYC reached at least 100°F in 4months, which is not 4% of that 12month period. Choice B is incorrect because 17% of the 12month period would be 2 months of recordhigh temperatures that were at least 100°F, not 4months. Choice C is incorrect because 25% of the 12month period would be 3 months ofrecordhigh temperatures that were at least 100°F, not 4 months.
Question Difficulty: Medium
12/16/2016 about:blank
https://k12reports.collegeboard.org/reports?orgId=115389 1/1
Math: Question 9
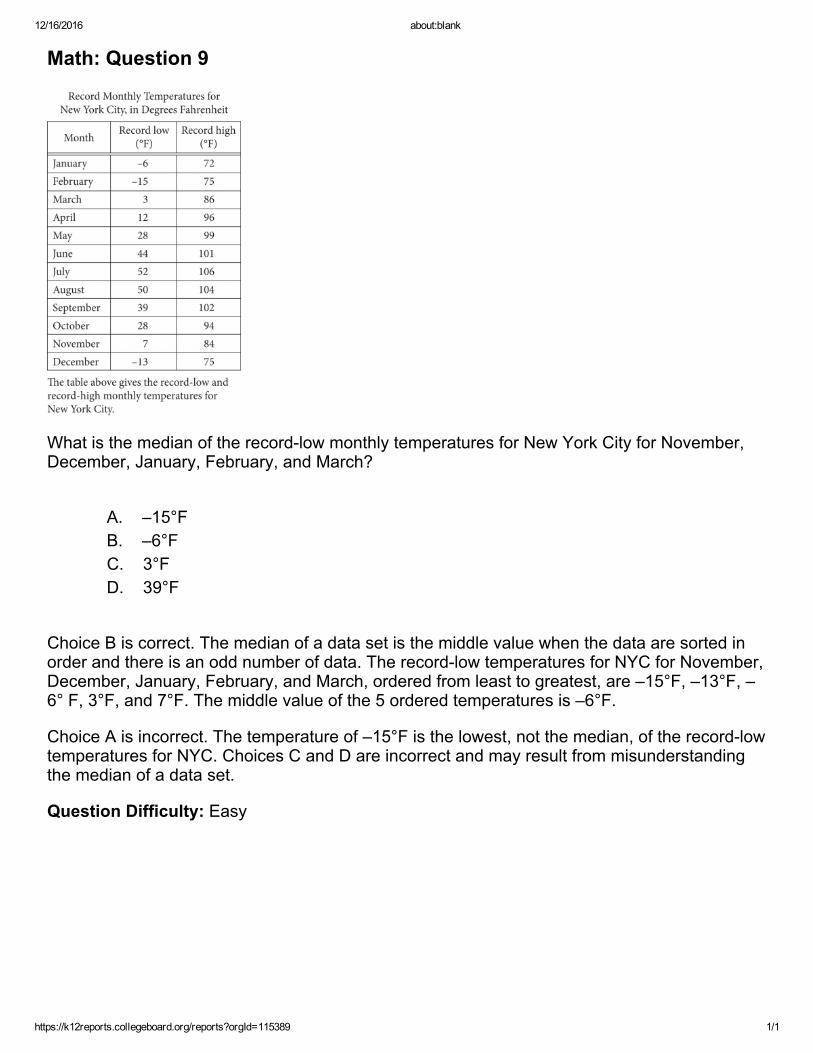
What is the median of the recordlow monthly temperatures for New York City for November,December, January, February, and March?
A. –15°FB. –6°FC. 3°FD. 39°F
Choice B is correct. The median of a data set is the middle value when the data are sorted inorder and there is an odd number of data. The recordlow temperatures for NYC for November,December, January, February, and March, ordered from least to greatest, are –15°F, –13°F, –6° F, 3°F, and 7°F. The middle value of the 5 ordered temperatures is –6°F.
Choice A is incorrect. The temperature of –15°F is the lowest, not the median, of the recordlowtemperatures for NYC. Choices C and D are incorrect and may result from misunderstandingthe median of a data set.
Question Difficulty: Easy
12/16/2016 about:blank
https://k12reports.collegeboard.org/reports?orgId=115389 1/1
Math: Question 10
A company surveyed 73 employees selected at random to determine if they opposed additionalsecurity at the office entrance. The survey showed that 64 were opposed to the additionalsecurity. Based on the results of the survey, how many of the 657 employees who work in theoffice would be estimated to not be opposed to the additional security?
A. 244B. 178C. 81D. 75
Choice C is correct. It is given that 64 of the 73 employees selected at random were opposed toadditional security. So the remaining 9 employees of those surveyed were not opposed toadditional security. Since the 73 employees were selected at random from all the employeeswho work in the office, the proportion of all 657 employees who are not opposed to additionalsecurity is expected to be the same as the proportion of those 73 employees surveyed whowere not opposed to additional security. So if x is the estimated number of employees whowork in the office and are expected to not be opposed to additional security, then .
Solving this proportion for x gives , or x = 81.
Choices A, B, and D are incorrect and may be the result of calculation errors or incorrect setupof the proportion.
Question Difficulty: Medium
12/16/2016 about:blank
https://k12reports.collegeboard.org/reports?orgId=115389 1/1
Math: Question 11
A farmer will plant 120 acres of land, some with corn and some with soybeans. This year, cornis estimated to yield 158.8 bushels per acre planted and soybeans are estimated to yield43.3 bushels per acre planted. The farmer expects to harvest 12,126 bushels of corn andsoybeans. Which of the following systems of equations describes this situation, where C is thenumber of acres of corn planted and S is the number of acres of soybeans planted?
A.
B.
C.
D.
Choice A is correct. The farmer will plant C acres with corn and S acres with soybeans. Sincehe will plant a total of 120 acres, C + S = 120. Corn is estimated to yield 158.8 bushels per acreplanted, and soybeans are estimated to yield 43.3 bushels per acre planted. So the expression158.8C + 43.3S gives the estimated number of bushels of corn and soybeans expected to beharvested from the 120 acres of land. Since the farmer expects to harvest 12,126 bushels ofcorn and soybeans, it follows that 158.8C + 43.3S = 12,126.
Choice B is incorrect. The total number of acres planted and the total number of bushelsexpected to be harvested in this system of equations are transposed. Choice C is incorrect andmay result from an incorrect interpretation of the bushels per acre harvested. Choice D isincorrect. The second equation of the system incorrectly assumes that the numbers of bushelsharvested per acre planted are the same for both corn and soybeans.
Question Difficulty: Medium

12/16/2016 about:blank
https://k12reports.collegeboard.org/reports?orgId=115389 1/1
Math: Question 12
Marco randomly sampled 100 students from his high school to determine whether they were infavor of a new school dress code. Of the 100 students surveyed, 65% were not in favor of thepolicy, 28% were in favor of the policy, and the rest did not respond. Marco estimated that 210students in the school were in favor of the new dress code. What additional information didMarco need to reach this conclusion?
A. The number of teachers in the high schoolB. The number of students in the high schoolC. The ages of the 100 students in his sampleD. The number of students who did not respond
Choice B is correct. To estimate the number of students in the school who were in favor of thenew dress code, Marco used the data from the survey. Since students surveyed were randomlysampled, it can be assumed that the proportion of students who were in favor of the new dresscode in the school is the same as the proportion of students who were in favor of the new dresscode in the sample of students surveyed. Therefore, Marco needed the number of students inthe high school to estimate that 210 students in the school were in favor of the new dress code.
Choices A, C, and D are incorrect because the information in each of these choices does nothelp to estimate the number of students in the school who were in favor of the new dress code.
Question Difficulty: Medium
12/16/2016 about:blank
https://k12reports.collegeboard.org/reports?orgId=115389 1/1
Math: Question 13
A certain county has a population of 83,952 residents and a land area of 954 square miles. Ademographer determines that there is one housing unit for every 2.75 residents of the county.On average, how many housing units per square mile does the county have?
A. 32B. 88C. 242D. 347
Choice A is correct. Since the county has a population of 83,952 residents and there is onehousing unit for every 2.75 residents in the county, there are a total of
housing units in the county. It is given that the county has a land area of 954 square miles. Itfollows that the county has, on average, housing units per square mile.
Choice B is incorrect. It gives the average number of residents, not housing units, per square
mile . Choices C and D are incorrect and may be the result of errors when
calculating the number of housing units per square mile in the county.
Question Difficulty: Medium
12/16/2016 about:blank
https://k12reports.collegeboard.org/reports?orgId=115389 1/1
Math: Question 14
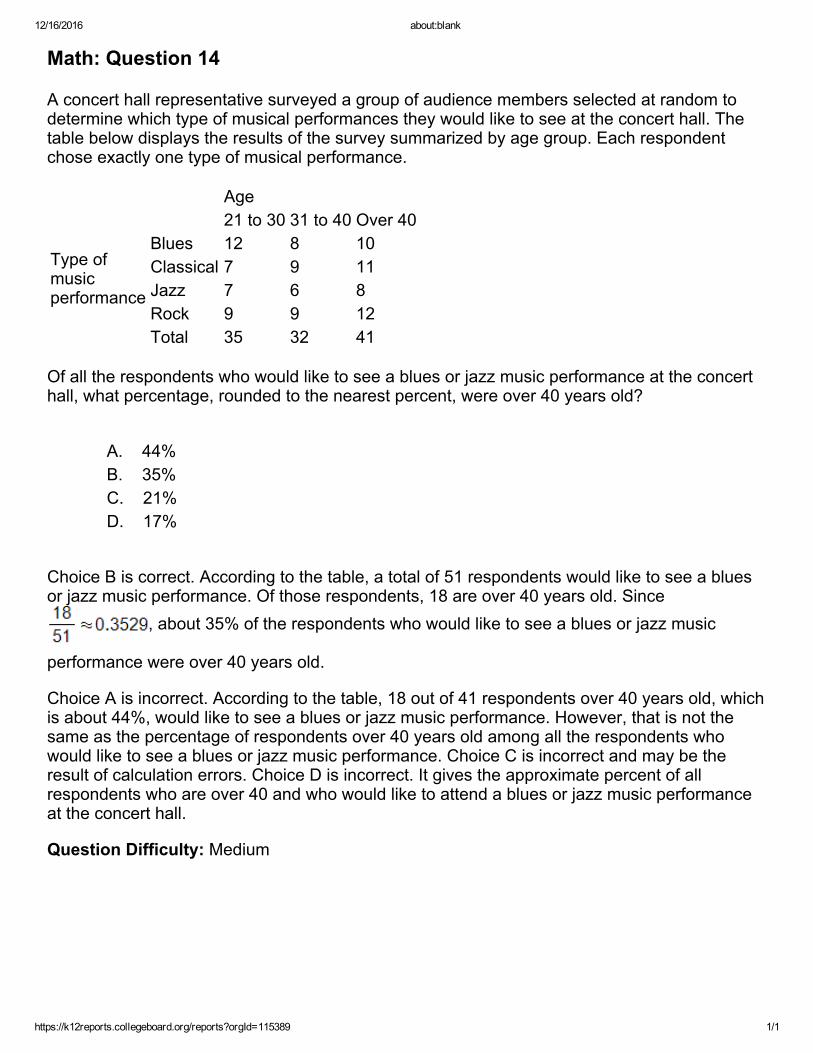
A concert hall representative surveyed a group of audience members selected at random todetermine which type of musical performances they would like to see at the concert hall. Thetable below displays the results of the survey summarized by age group. Each respondentchose exactly one type of musical performance.
Age21 to 30 31 to 40 Over 40
Type ofmusicperformance
Blues 12 8 10Classical 7 9 11Jazz 7 6 8Rock 9 9 12Total 35 32 41
Of all the respondents who would like to see a blues or jazz music performance at the concerthall, what percentage, rounded to the nearest percent, were over 40 years old?
A. 44%B. 35%C. 21%D. 17%
Choice B is correct. According to the table, a total of 51 respondents would like to see a bluesor jazz music performance. Of those respondents, 18 are over 40 years old. Since
, about 35% of the respondents who would like to see a blues or jazz music
performance were over 40 years old.
Choice A is incorrect. According to the table, 18 out of 41 respondents over 40 years old, whichis about 44%, would like to see a blues or jazz music performance. However, that is not thesame as the percentage of respondents over 40 years old among all the respondents whowould like to see a blues or jazz music performance. Choice C is incorrect and may be theresult of calculation errors. Choice D is incorrect. It gives the approximate percent of allrespondents who are over 40 and who would like to attend a blues or jazz music performanceat the concert hall.
Question Difficulty: Medium

12/16/2016 about:blank
https://k12reports.collegeboard.org/reports?orgId=115389 1/1
Math: Question 15
In the expression below, a is an integer.
For which of the following values of a could this trinomial be rewritten in the form ,
where b and c are integers?
A. –9B. –6C. 2D. 10
Choice C is correct. If the trinomial x2 – 3x + a can be rewritten in the form (x + b)(x + c), then b+ c = –3 and bc = a. Of the choices given, only for a = 2 are there two factors of a, namely –1and –2, whose sum is –3 and whose product is 2.
Choices A, B, and D are incorrect. For each of these choices there are no two integers whosesum equals –3 and whose product is equal to the respective choice.
Question Difficulty: Medium

12/16/2016 about:blank
https://k12reports.collegeboard.org/reports?orgId=115389 1/1
Math: Question 16
The scatterplot above shows the length y, in feet, of a bungee cord when a weight of x poundsis attached to it. Which of the following best approximates an equation for the line of best fit forthe data?
A.
B.
C.
D.
Choice D is correct. The data in the scatterplot show a linear trend. Furthermore, it appears thatthe yintercept of the line of best fit is approximately 30. The slope of the line of best fit can beestimated by using the points in the scatterplot with approximate coordinates (0, 30) and (100,55). The slope is the difference of the yvalues divided by the difference of the xvalues, or
. Simplifying this ratio gives that the slope is . Therefore, of the choices given,
best approximates an equation of the line of best fit.
Choice A is incorrect because 30 is the approximate yintercept of the line of best fit, not theslope of the line. Choices B and C are incorrect because 4 is the reciprocal of the slope of theline of best fit.
Question Difficulty: Medium

12/16/2016 about:blank
https://k12reports.collegeboard.org/reports?orgId=115389 1/1
Math: Question 17
The relationship between the density, D, in grams per cubic centimeter (g/cm3) of liquidmercury and the temperature, T, of the liquid, in degrees Celsius, is modeled by the equation
.
If the equation above is graphed on a coordinate plane with T on the horizontal axis and D onthe vertical axis, what is the slope of the line?
A.B.C.D.
Choice C is correct. An equation graphed in the coordinate plane with T on the horizontal axisand D on the vertical axis can be written in slopeintercept form as D = mT + b, where m and bare constants, m is the slope of the line, and b is the Dcoordinate of the Dintercept of the line.The given equation is D = 13.628 – 0.002T, which can be rewritten in slopeintercept form as D= –0.002T + 13.628. Since m is the slope of the line, the slope of the line is –0.002.
Choice A is incorrect because –13.628 is the negative of the Dintercept of the line, not theslope. Choice B is incorrect because 13.628 is the Dintercept of the line, not the slope. ChoiceD is incorrect because 0.002 is the negative of the slope of the line.
Question Difficulty: Medium

12/16/2016 about:blank
https://k12reports.collegeboard.org/reports?orgId=115389 1/1
Math: Question 18
The relationship between the density, D, in grams per cubic centimeter (g/cm3) of liquidmercury and the temperature, T, of the liquid, in degrees Celsius, is modeled by the equation
.
Which of the following could be a correct interpretation of 13.628 in the context of the model?
A. The average density of liquid mercury in g/cm3
B.The density, in g/cm3, of a sample of liquid mercury at temperature 0 degreesCelsius
C. The temperature, in degrees Celsius, of a sample of liquid mercury with density 0D.The rate of change of the density of liquid mercury with respect to temperature indegrees Celsius
Choice B is correct. When the temperature is 0 degrees Celsius, the density is D = 13.628 –0.002(0) = 13.628. Therefore, 13.628 represents the density, in g/cm3, of liquid mercury whenthe temperature is 0 degrees Celsius.
Choice A is incorrect and may be the result of not understanding the information the equationgives about the context. Choice C is incorrect and is the result of switching the meaning of theDvalues and Tvalues. Choice D is incorrect and is the interpretation of the value –0.002 in thecontext of the model.
Question Difficulty: Hard
12/16/2016 about:blank
https://k12reports.collegeboard.org/reports?orgId=115389 1/1
Math: Question 19
In the equation above, which of the following is equivalent to ?
A.
B.
C.
D.
Choice A is correct. To solve for ak, first distribute 3 over the binomial ak – 1, which gives T =3ak – 3 + 4. Combining like terms gives T = 3ak + 1. Subtracting 1 from each side of theequation gives T – 1 = 3ak. Dividing each side of this equation by 3 gives .
Choice B is incorrect and may be the result of not applying the distributive property correctly,adding –1 to 4 to get 3 and then subtracting 3 from both sides of the equation. Choice C isincorrect and may be the result of finding 3 – 4 rather than –3 + 4 after applying the distributiveproperty on the righthand side of the equation. Choice D is incorrect and may be the result ofadding 3 + 4 rather than –3 + 4 after applying the distributive property on the righthand side ofthe equation.
Question Difficulty: Medium

12/16/2016 about:blank
https://k12reports.collegeboard.org/reports?orgId=115389 1/1
Math: Question 20
A student has an average (arithmetic mean) score of 88 for the first 3 tests in a class. What isthe lowest score that the student can earn on the fourth test to have an average score of atleast 90 for the 4 tests?
A. 92B. 93C. 94D. 96
Choice D is correct. The average score on the 4 tests would be equal to the sum of the scoreson the 4 tests divided by 4. Since the student has an average score of 88 on 3 tests, the sum ofthe student’s scores on the 3 tests is 88 × 3, or 264. Therefore, the inequality ,
where x is the score on the fourth test, can be used to determine the score needed on thefourth test to have an average score of at least 90 for all 4 tests. To solve for x, multiply eachside of the inequality by 4, which yields 264 + x ≥ 360. Subtracting 264 from each side of theinequality yields x ≥ 96. Therefore, the student needs to earn a score of at least 96 on the fourthtest.
Choice A is incorrect and may be the result of mistakenly thinking that because the average of88 and 92 is 90, the average of the first three test scores and 92 must be 90. Choices B and Care incorrect and may be the result of computation errors.
Question Difficulty: Hard
12/16/2016 about:blank
https://k12reports.collegeboard.org/reports?orgId=115389 1/1
Math: Question 21
A circle in the xy‑plane has equation . What is the radius of the circle?
A. 3B. 5C. 6D. 18
Choice C is correct. The given equation for the circle is in the standard form (x – h)2 + (y – k)2 =r2, where h and k are constants, (h, k) is the center of the circle, r is a positive constant and theradius of the circle. In the given equation, r2 = 36, so , or 6.
Choices A, B, and D are incorrect and may be the result of misunderstanding the equation of acircle.
Question Difficulty: Medium
12/16/2016 about:blank
https://k12reports.collegeboard.org/reports?orgId=115389 1/1
Math: Question 22
The average annual housing costs, in dollars, for US families for the years 1990 through 2009can be modeled by the function , where x represents the number of years
since 1990. Based on the model, the average housing costs in 1993 were how many times asgreat as the average housing costs in 1992 ?
A.
B.
C.
D.
Choice A is correct. Since x represents the number of years since 1990, the value of xrepresenting the year 1993 can be found by subtracting x = 1993 – 1990, or x = 3. Similarly, thevalue of x representing 1992 is x = 1992 – 1990, or x = 2. To find how many times as great theaverage housing costs in 1993 were compared to those in 1992, evaluate the function for x = 3
and x = 2 and divide the resulting values, which gives . Since there are
common nonzero factors in the numerator and denominator of the righthand side of the
equation, the fraction can be simplified as follows: .
Alternately, in an exponential function in the form f(x) = a • bx, the value of f(x + 1) = f(x) • b.Since 1993 is one year greater than 1992, it follows that the average housing costs in 1993 are1.038 times as great as the average housing costs in 1992 because the value of b in thisfunction is 1.038.
Choices B, C, and D are incorrect and are the result of incorrectly simplifying the righthandside of the equation or using incorrect values of x.
Question Difficulty: Hard
12/16/2016 about:blank
https://k12reports.collegeboard.org/reports?orgId=115389 1/2
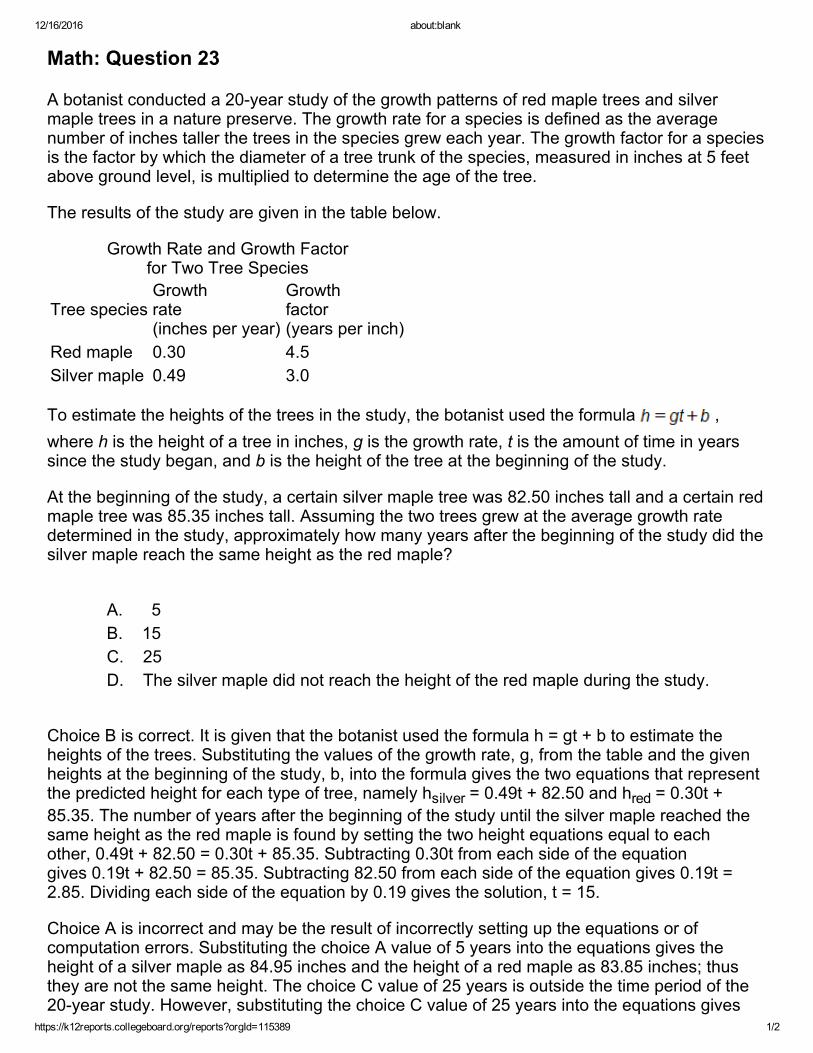
Math: Question 23
A botanist conducted a 20year study of the growth patterns of red maple trees and silvermaple trees in a nature preserve. The growth rate for a species is defined as the averagenumber of inches taller the trees in the species grew each year. The growth factor for a speciesis the factor by which the diameter of a tree trunk of the species, measured in inches at 5 feetabove ground level, is multiplied to determine the age of the tree.
The results of the study are given in the table below.
Growth Rate and Growth Factorfor Two Tree Species
Tree speciesGrowthrate(inches per year)
Growthfactor(years per inch)
Red maple 0.30 4.5Silver maple 0.49 3.0
To estimate the heights of the trees in the study, the botanist used the formula ,where h is the height of a tree in inches, g is the growth rate, t is the amount of time in yearssince the study began, and b is the height of the tree at the beginning of the study.
At the beginning of the study, a certain silver maple tree was 82.50 inches tall and a certain redmaple tree was 85.35 inches tall. Assuming the two trees grew at the average growth ratedetermined in the study, approximately how many years after the beginning of the study did thesilver maple reach the same height as the red maple?
A. 5B. 15C. 25D. The silver maple did not reach the height of the red maple during the study.
Choice B is correct. It is given that the botanist used the formula h = gt + b to estimate theheights of the trees. Substituting the values of the growth rate, g, from the table and the givenheights at the beginning of the study, b, into the formula gives the two equations that representthe predicted height for each type of tree, namely hsilver = 0.49t + 82.50 and hred = 0.30t +85.35. The number of years after the beginning of the study until the silver maple reached thesame height as the red maple is found by setting the two height equations equal to eachother, 0.49t + 82.50 = 0.30t + 85.35. Subtracting 0.30t from each side of the equationgives 0.19t + 82.50 = 85.35. Subtracting 82.50 from each side of the equation gives 0.19t =2.85. Dividing each side of the equation by 0.19 gives the solution, t = 15.
Choice A is incorrect and may be the result of incorrectly setting up the equations or ofcomputation errors. Substituting the choice A value of 5 years into the equations gives theheight of a silver maple as 84.95 inches and the height of a red maple as 83.85 inches; thusthey are not the same height. The choice C value of 25 years is outside the time period of the20year study. However, substituting the choice C value of 25 years into the equations gives

12/16/2016 about:blank
https://k12reports.collegeboard.org/reports?orgId=115389 2/2
the height of a silver maple as 94.75 inches and the height of a red maple as 89.85 inches; thusthey are not the same height. Choice D is incorrect because the two trees did reach the sameheight during the 20year study.
Question Difficulty: Hard

12/16/2016 about:blank
https://k12reports.collegeboard.org/reports?orgId=115389 1/1
Math: Question 24
A botanist conducted a 20year study of the growth patterns of red maple trees and silvermaple trees in a nature preserve. The growth rate for a species is defined as the averagenumber of inches taller the trees in the species grew each year. The growth factor for a speciesis the factor by which the diameter of a tree trunk of the species, measured in inches at 5 feetabove ground level, is multiplied to determine the age of the tree.
The results of the study are given in the table below.
Growth Rate and Growth Factorfor Two Tree Species
Tree speciesGrowthrate(inches per year)
Growthfactor(years per inch)
Red maple 0.30 4.5Silver maple 0.49 3.0
To estimate the heights of the trees in the study, the botanist used the formula ,where h is the height of a tree in inches, g is the growth rate, t is the amount of time in yearssince the study began, and b is the height of the tree at the beginning of the study.
Which formula gives the growth rate of the trees in terms of the other variables?
A.
B.
C.
D.
Choice C is correct. The formula for estimating the heights of the trees in the study is given as h= gt + b. To solve this equation for the growth rate, g, subtract b from both sides of theequation, which gives h – b = gt. Dividing both sides of the equation by t gives .
Choices A, B, and D are incorrect and may be the result of incorrect steps when solving for g.Choice A may be the result of subtracting h from both sides of the equation and then incorrectlysimplifying. Choice B may be the result of incorrectly simplifying the equation after subtracting band then dividing by t. Choice D may be the result of incorrectly subtracting h rather than b.
Question Difficulty: Medium
12/16/2016 about:blank
https://k12reports.collegeboard.org/reports?orgId=115389 1/1
Math: Question 25
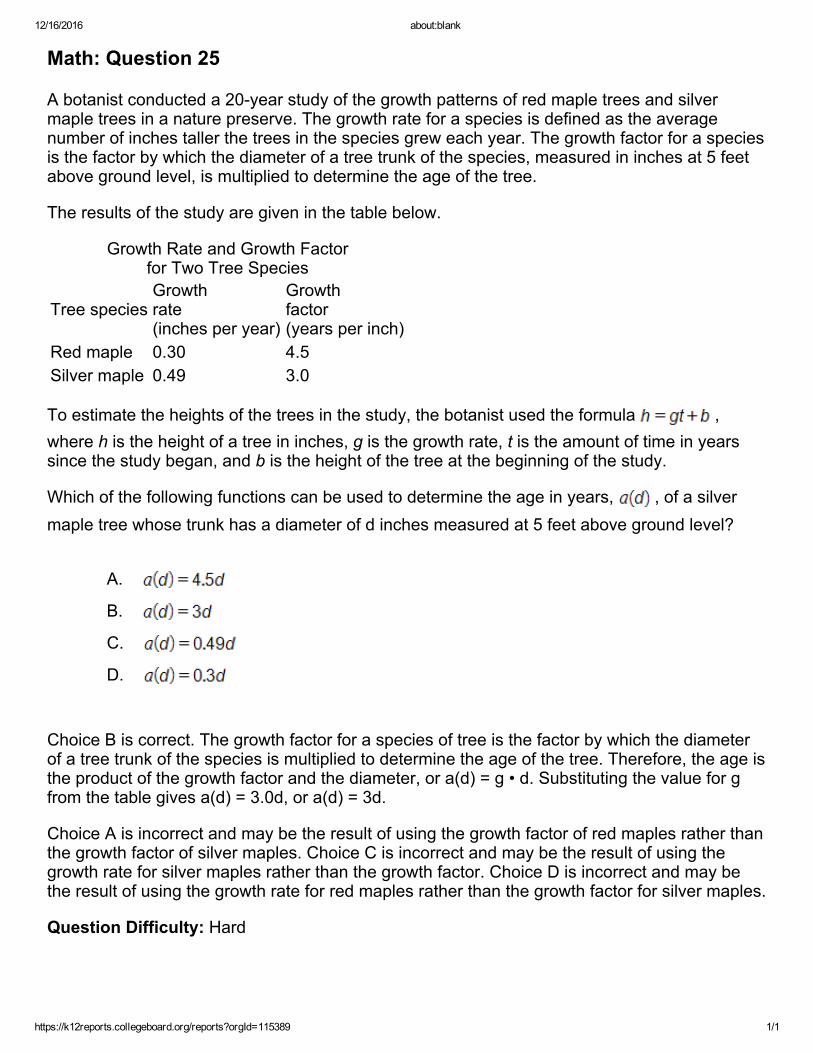
A botanist conducted a 20year study of the growth patterns of red maple trees and silvermaple trees in a nature preserve. The growth rate for a species is defined as the averagenumber of inches taller the trees in the species grew each year. The growth factor for a speciesis the factor by which the diameter of a tree trunk of the species, measured in inches at 5 feetabove ground level, is multiplied to determine the age of the tree.
The results of the study are given in the table below.
Growth Rate and Growth Factorfor Two Tree Species
Tree speciesGrowthrate(inches per year)
Growthfactor(years per inch)
Red maple 0.30 4.5Silver maple 0.49 3.0
To estimate the heights of the trees in the study, the botanist used the formula ,where h is the height of a tree in inches, g is the growth rate, t is the amount of time in yearssince the study began, and b is the height of the tree at the beginning of the study.
Which of the following functions can be used to determine the age in years, , of a silvermaple tree whose trunk has a diameter of d inches measured at 5 feet above ground level?
A.
B.
C.
D.
Choice B is correct. The growth factor for a species of tree is the factor by which the diameterof a tree trunk of the species is multiplied to determine the age of the tree. Therefore, the age isthe product of the growth factor and the diameter, or a(d) = g • d. Substituting the value for gfrom the table gives a(d) = 3.0d, or a(d) = 3d.
Choice A is incorrect and may be the result of using the growth factor of red maples rather thanthe growth factor of silver maples. Choice C is incorrect and may be the result of using thegrowth rate for silver maples rather than the growth factor. Choice D is incorrect and may bethe result of using the growth rate for red maples rather than the growth factor for silver maples.
Question Difficulty: Hard
12/16/2016 about:blank
https://k12reports.collegeboard.org/reports?orgId=115389 1/1
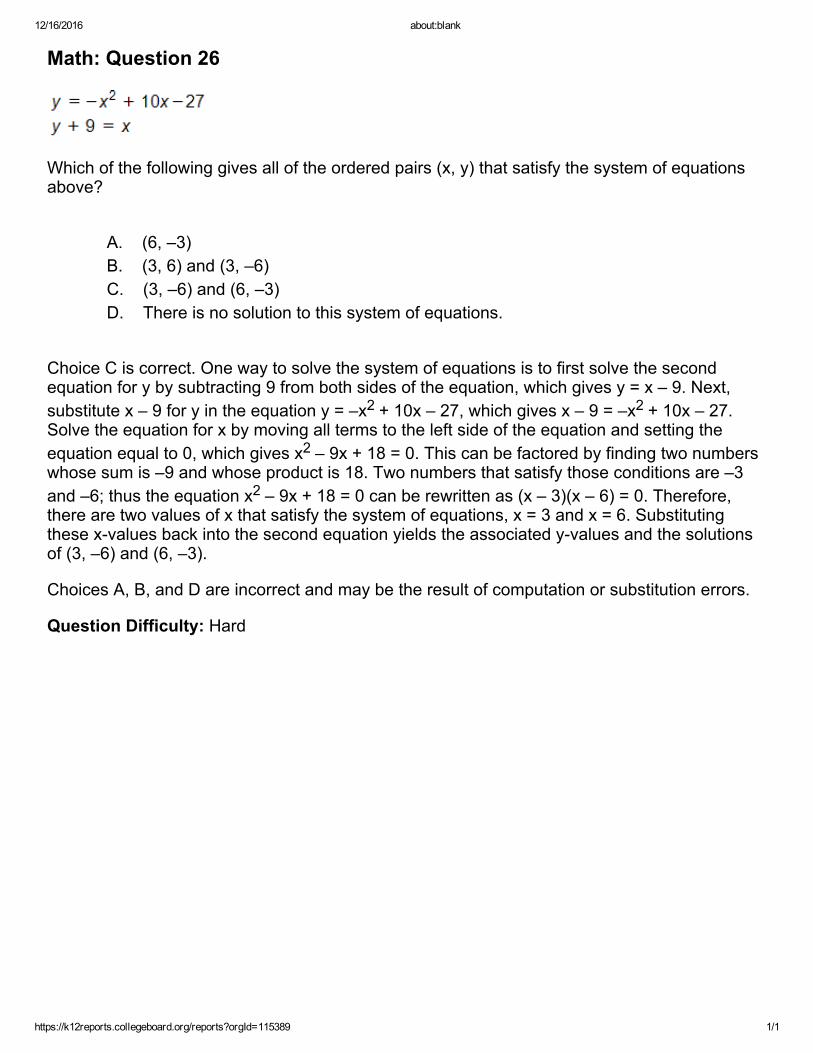
Math: Question 26
Which of the following gives all of the ordered pairs (x, y) that satisfy the system of equationsabove?
A. (6, –3)B. (3, 6) and (3, –6)C. (3, –6) and (6, –3)D. There is no solution to this system of equations.
Choice C is correct. One way to solve the system of equations is to first solve the secondequation for y by subtracting 9 from both sides of the equation, which gives y = x – 9. Next,substitute x – 9 for y in the equation y = –x2 + 10x – 27, which gives x – 9 = –x2 + 10x – 27.Solve the equation for x by moving all terms to the left side of the equation and setting theequation equal to 0, which gives x2 – 9x + 18 = 0. This can be factored by finding two numberswhose sum is –9 and whose product is 18. Two numbers that satisfy those conditions are –3and –6; thus the equation x2 – 9x + 18 = 0 can be rewritten as (x – 3)(x – 6) = 0. Therefore,there are two values of x that satisfy the system of equations, x = 3 and x = 6. Substitutingthese xvalues back into the second equation yields the associated yvalues and the solutionsof (3, –6) and (6, –3).
Choices A, B, and D are incorrect and may be the result of computation or substitution errors.
Question Difficulty: Hard
12/16/2016 about:blank
https://k12reports.collegeboard.org/reports?orgId=115389 1/1
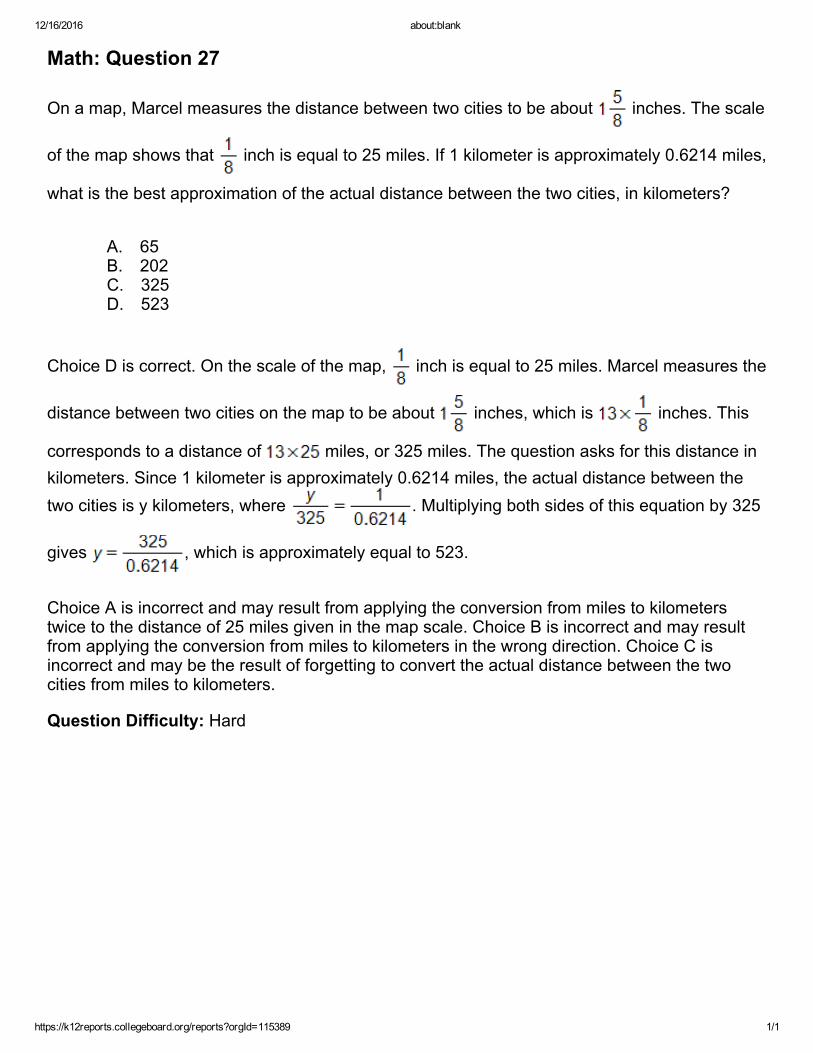
Math: Question 27
On a map, Marcel measures the distance between two cities to be about inches. The scale
of the map shows that inch is equal to 25 miles. If 1 kilometer is approximately 0.6214 miles,
what is the best approximation of the actual distance between the two cities, in kilometers?
A. 65B. 202C. 325D. 523
Choice D is correct. On the scale of the map, inch is equal to 25 miles. Marcel measures the
distance between two cities on the map to be about inches, which is inches. This
corresponds to a distance of miles, or 325 miles. The question asks for this distance inkilometers. Since 1 kilometer is approximately 0.6214 miles, the actual distance between thetwo cities is y kilometers, where . Multiplying both sides of this equation by 325
gives , which is approximately equal to 523.
Choice A is incorrect and may result from applying the conversion from miles to kilometerstwice to the distance of 25 miles given in the map scale. Choice B is incorrect and may resultfrom applying the conversion from miles to kilometers in the wrong direction. Choice C isincorrect and may be the result of forgetting to convert the actual distance between the twocities from miles to kilometers.
Question Difficulty: Hard
12/16/2016 about:blank
https://k12reports.collegeboard.org/reports?orgId=115389 1/1
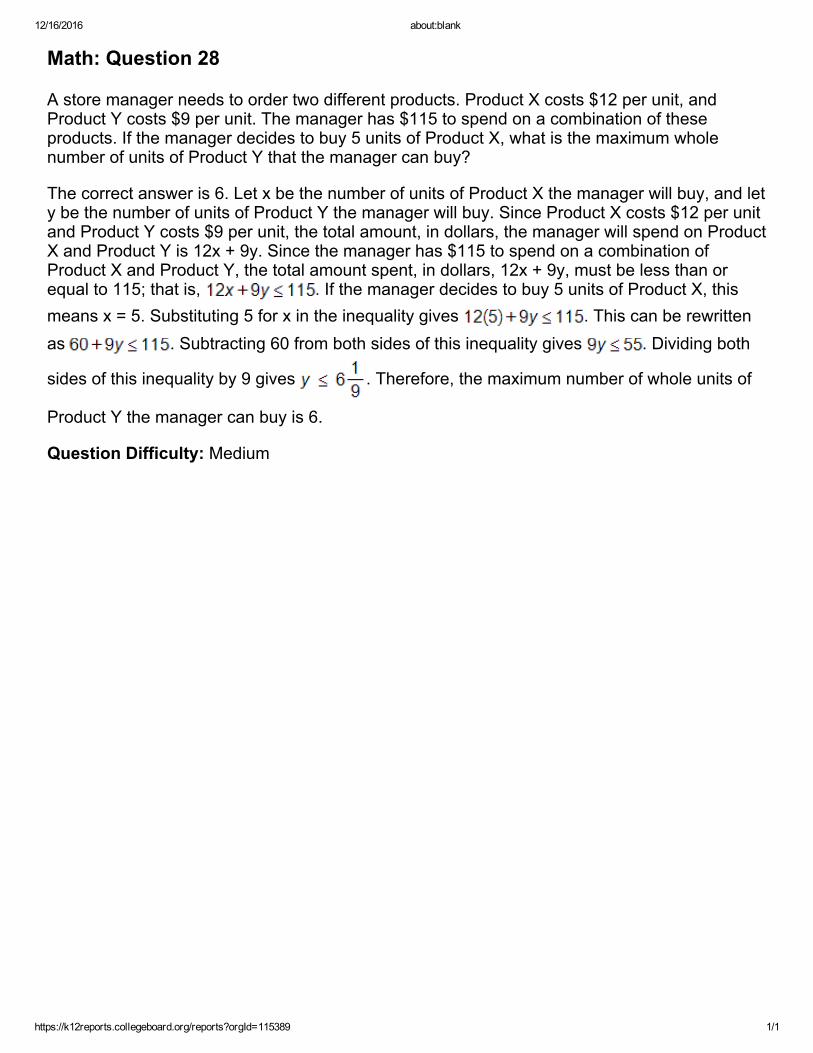
Math: Question 28
A store manager needs to order two different products. Product X costs $12 per unit, andProduct Y costs $9 per unit. The manager has $115 to spend on a combination of theseproducts. If the manager decides to buy 5 units of Product X, what is the maximum wholenumber of units of Product Y that the manager can buy?
The correct answer is 6. Let x be the number of units of Product X the manager will buy, and lety be the number of units of Product Y the manager will buy. Since Product X costs $12 per unitand Product Y costs $9 per unit, the total amount, in dollars, the manager will spend on ProductX and Product Y is 12x + 9y. Since the manager has $115 to spend on a combination ofProduct X and Product Y, the total amount spent, in dollars, 12x + 9y, must be less than orequal to 115; that is, . If the manager decides to buy 5 units of Product X, thismeans x = 5. Substituting 5 for x in the inequality gives . This can be rewrittenas . Subtracting 60 from both sides of this inequality gives . Dividing both
sides of this inequality by 9 gives . Therefore, the maximum number of whole units of
Product Y the manager can buy is 6.
Question Difficulty: Medium
12/16/2016 about:blank
https://k12reports.collegeboard.org/reports?orgId=115389 1/1
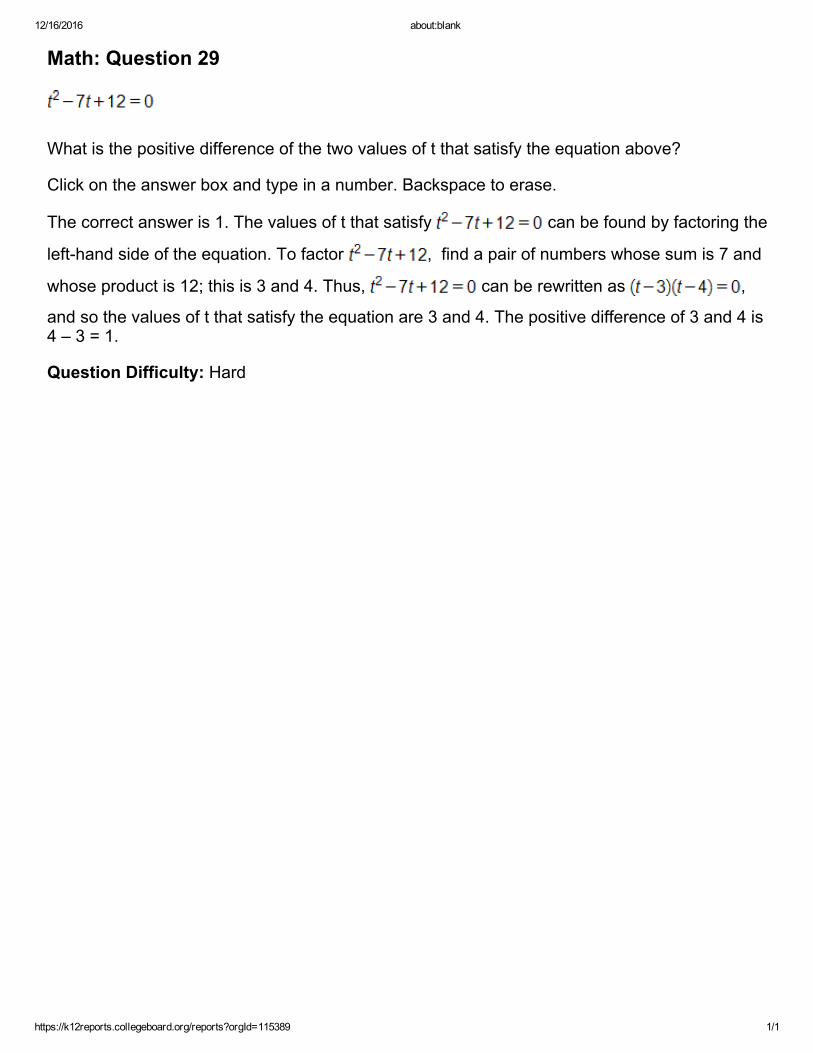
Math: Question 29
What is the positive difference of the two values of t that satisfy the equation above?
Click on the answer box and type in a number. Backspace to erase.
The correct answer is 1. The values of t that satisfy can be found by factoring the
lefthand side of the equation. To factor , find a pair of numbers whose sum is 7 and
whose product is 12; this is 3 and 4. Thus, can be rewritten as ,
and so the values of t that satisfy the equation are 3 and 4. The positive difference of 3 and 4 is4 – 3 = 1.
Question Difficulty: Hard
12/16/2016 about:blank
https://k12reports.collegeboard.org/reports?orgId=115389 1/1
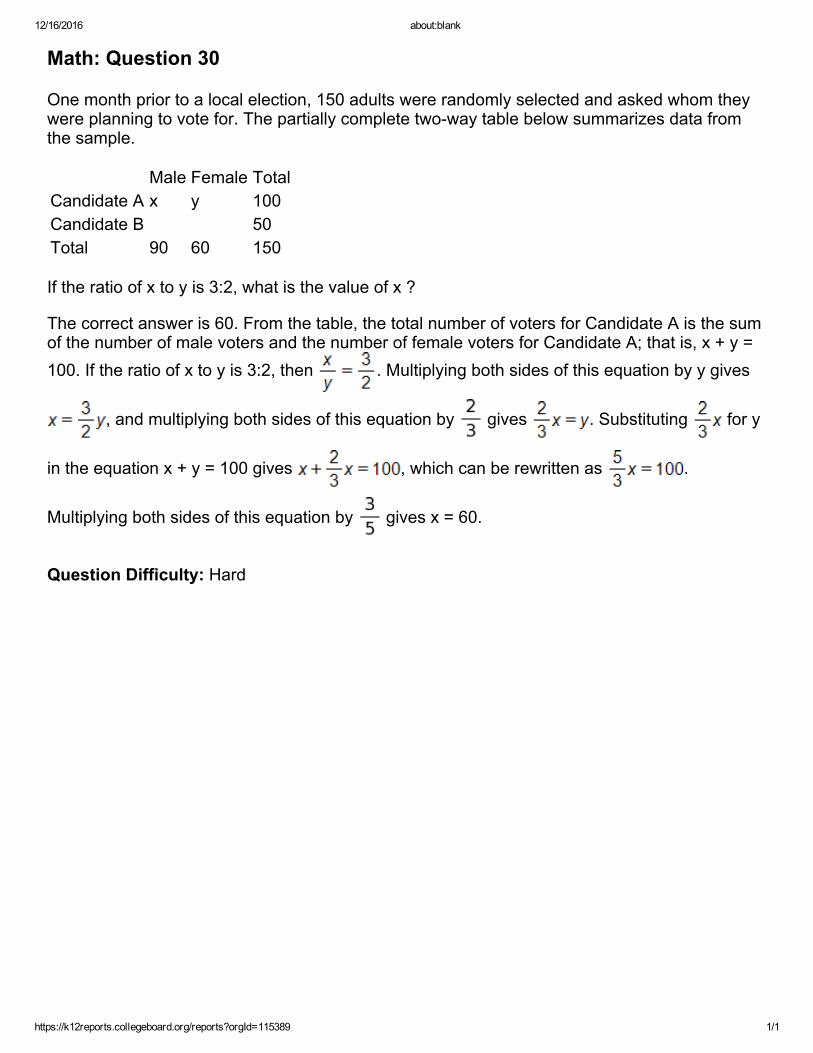
Math: Question 30
One month prior to a local election, 150 adults were randomly selected and asked whom theywere planning to vote for. The partially complete twoway table below summarizes data fromthe sample.
Male Female TotalCandidate A x y 100Candidate B 50Total 90 60 150
If the ratio of x to y is 3:2, what is the value of x ?
The correct answer is 60. From the table, the total number of voters for Candidate A is the sumof the number of male voters and the number of female voters for Candidate A; that is, x + y =100. If the ratio of x to y is 3:2, then . Multiplying both sides of this equation by y gives
, and multiplying both sides of this equation by gives . Substituting for y
in the equation x + y = 100 gives , which can be rewritten as .
Multiplying both sides of this equation by gives x = 60.
Question Difficulty: Hard
12/16/2016 about:blank
https://k12reports.collegeboard.org/reports?orgId=115389 1/1
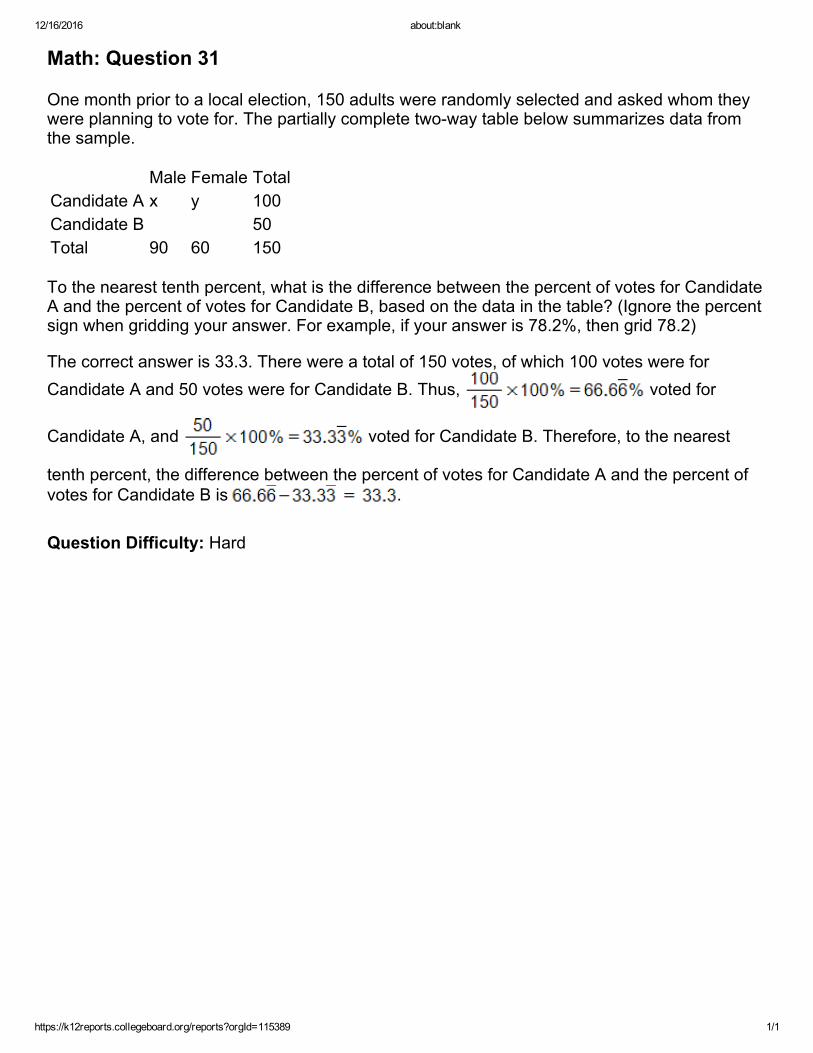
Math: Question 31
One month prior to a local election, 150 adults were randomly selected and asked whom theywere planning to vote for. The partially complete twoway table below summarizes data fromthe sample.
Male Female TotalCandidate A x y 100Candidate B 50Total 90 60 150
To the nearest tenth percent, what is the difference between the percent of votes for CandidateA and the percent of votes for Candidate B, based on the data in the table? (Ignore the percentsign when gridding your answer. For example, if your answer is 78.2%, then grid 78.2)
The correct answer is 33.3. There were a total of 150 votes, of which 100 votes were forCandidate A and 50 votes were for Candidate B. Thus, voted for
Candidate A, and voted for Candidate B. Therefore, to the nearest
tenth percent, the difference between the percent of votes for Candidate A and the percent ofvotes for Candidate B is .
Question Difficulty: Hard