math 7 review. chapter 1 the cartesian plane (or coordinate grid) is made up of two number lines...
TRANSCRIPT

Math 7 Review

Chapter 1

• The Cartesian Plane (or coordinate grid) is made up of two number lines that intersect perpendicularly at their respective zero points.
Cartesian PlaneStudent Outcome: Identify and plot points in the 4 quadrants of the Cartesian plan
using ordered pairs
ORIGINThe point where the x-axis and the y-axis cross(0,0)

• The horizontal axis is called the x-axis.
• The vertical axis is called the y-axis.
Parts of a Cartesian PlaneStudent Outcome: Identify and plot points in the 4 quadrants of the Cartesian plan
using ordered pairs

• The Coordinate Grid is made up of 4 Quadrants.
QuadrantsStudent Outcome: Identify and plot points in the 4 quadrants of the Cartesian
plan using ordered pairs
QUADRANT IQUADRANT II
QUADRANT III QUADRANT IV

1.1 The Cartesian PlaneStudent Outcome: Identify and plot points in the 4 quadrants of the Cartesian plan
using ordered pairs
• Identify Points on a Coordinate GridA: (x, y)
B: (x, y)
C: (x, y)
D: (x, y)
• Translations are SLIDES!!!
Translation
Let's examine some translations related to coordinate geometry.

1.3 TransformationsStudent Outcome: I can perform and describe transformations of a 2-D
shape in all 4 quadrants of a Cartesian plane.
• Translation:– A slide along a straight line
Count the number of horizontal units and vertical units represented by the translation arrow.
The horizontal distance is 8 units to the right, and the vertical distance is 2 units down (+8 -2)

1.3 TransformationsStudent Outcome: I can perform and describe transformations of a 2-D
shape in all 4 quadrants of a Cartesian plane.
• Translation:– Count the number of horizontal units the image has
shifted.– Count the number of vertical units the image has
shifted.
We would say the Transformation is:
1 unit left,6 units up or
(-1+,6)

A reflection is often called a flip. Under a reflection, the figure does not change size. It is simply flipped over the line of reflection.
Reflecting over the x-axis:
When you reflect a point across the x-axis, the x-coordinate remains the same, but the y-coordinate is transformed into its opposite.

1.3 TransformationsStudent Outcome: I can perform and describe transformations of a 2-D
shape in all 4 quadrants of a Cartesian plane.
• Rotation:– A turn about a fixed point called “the center of rotation”– The rotation can be clockwise or counterclockwise.

Chapter 2

Place Value
Thousands Hundreds Tens Ones Decimal Point
Tenths Hundredths
1 2 4 7 . 6 3
The place value chart below shows 1247.63
The number 1248.63 is one more than 1247.63
The number 1147.63 is one hundred less than 1247.63
The number 1247.83 is two tenths more than 1247.63

Review – Adding and Subtracting Decimals
What do you need to do?
1. Line up the decimals2. Add zeros into place values that are empty (if you wish)
3. Ex: 12.3 + 2. 4 = 12.3 12.3 + 2.4 + 02.4
14.7 14.7

2.1 Add and Subtract DecimalsStudent Outcome: I can use different strategies to estimate decimals.
• Pg 44 Vocabulary:– Estimate:
• to approximate an answer
– Overestimate:• Estimate that is larger than the actual answer
– Underestimate:• Estimate that is smaller than the actual answer

Multiplying DecimalsStudent Outcome: I can estimate by +,-,x,÷ decimals.
• Use front-end estimation and relative size to estimate:– 2.65 x 3.72
• Front-End Estimation:
• Relative Size: (are there easier #’s to use)
• Compensation:

Dividing Decimal NumbersStudent Outcome: I can estimate by +,-,x,÷ decimals.
• Example 1:– A) 15.4 ÷ 3.6 = 4.27778
Front-End Estimation:– Things I know: 15 ÷ 3 = 5
• The answer closest to 5 is 4.27778

Use Estimation to Place the Decimal Point.Student Outcome: I can problem solve using decimals.
• Example #2:Four friends buy 1.36L of pure orange juice and
divide it equally.– A) Estimate each person’s share.– B) Calculate each person’s share.

Use Estimation to Place the Decimal Point.
Solution:A) To estimate, round 1.36L to a number that is
easier to work with.Try 1.2
1.2 ÷ 4 = 0.3 UnderestimateTry 1.
1.6 ÷ 4 = 0.4 Overestimate
• Things I know
12 ÷ 4 = 3 So 1.2 ÷ 4 = 0.3
16 ÷ 4 = 4 So1.6 ÷ 4 = 0.4

BEDMASStudent Outcome: I can solve problems using order of operations.
• Remember the order by the phrase• B - BRACKETS• E - EXPONENTS• D/M – DIVIDE OR MULTIPLY• A/S – ADD OR SUBTRACT

The “B” and “E”Student Outcome: I can solve problems using order of operations.
• The “B” stands for items in brackets• Do all items in the brackets first
The “E” stands for ExponentsDo anything that has a exponent
(power)82
(2 + 3)

The “DM”Student Outcome: I can solve problems using order of operations.
• Represents divide and multiply• Do which ever one of these comes first in
the problem
Work these two operationsfrom left to right

The “AS”Student Outcome: I can solve problems using order of operations..
• Represents Add and Subtract• Do which ever one of these comes first• Work left to right• You can only work with 2 numbers at a time.

Chapter 3

What You Will Learn To draw a line segment parallel to another line segment To draw a line segment perpendicular to another line segment To draw a line that divides a line segment in half and is
perpendicular to it To divide an angle in half To develop and use formulas to calculate the area of triangles
and parallelograms.
CHALLENGE Try to draw what you think the first 5 bullets may look like.

What Are Line Segments? Parallel Line Segments
Describes lines in the same plane that never cross, or intersect
They are marked using arrows The perpendicular distance between
line segments must be the same at each end of the segment.
To create, use a ruler and a right triangle, or paper folding

Student Outcome: I will be able to describe different shapes
Learn Albertahttp://www.learnalberta.ca/content/memg/index.html?term=Division02/Parallel/index.html
Parallel: two lines or two sides that are the same distance apart and never meet.
Arrows: show parallel sides
Vertex: the point where sides meet or intersect

What Are Line Segments?
Perpendicular Line Segments Describes lines that intersect at right angles (90°) They are marked using a small square To create use a ruler and a protractor,
or paper folding.

Student Outcome: I will be able to describe different shapes
Perpendicular: where a horizontal edge and vertical edge intersect to form a right angleOR
when two sides of any shape intersect to make a right angle
Right Angle: 90’ symbol is a box in the corner
Vertical
Horizontal
Learn Alberta - Perpendicularhttp://www.learnalberta.ca/content/memg/index.html?term=Division02/Perpendicular/index.html
Vertical side
Perpendicular side
Perpendicular side
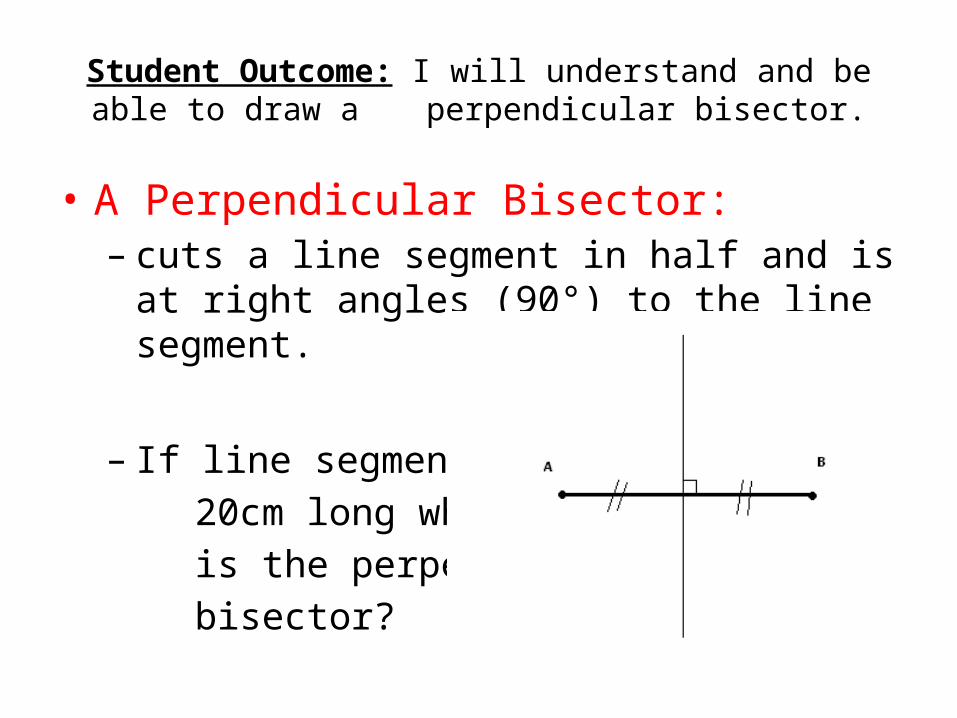
Student Outcome: I will understand and be able to draw a perpendicular bisector.
• A Perpendicular Bisector:– cuts a line segment in half and is at right angles
(90°) to the line segment.
– If line segment AB is 2 20cm long where is the perpendicular bisector?

Student Outcome: I will understand and be able to draw an angle bisector.
An angle bisector is a line that divides the angle evenly in terms of degrees.
45’
D<ABD = 45’ What is<DAC =

Student Outcome: I will understand and be able to draw an angle bisector.
To draw a line that divides a line segment in half and is perpendicular to it
To divide an angle in half

ReviewStudent Outcome: I will be able to understand perimeter.
Perimeter: the distance around a shape
or
the sum of all the sides

ReviewStudent Outcome I will be able to understand area.
Area: the amount of surface a shape covers : it is 2-dimensional - length (l) and width (w)
: measured in square units (cm ²) or (m²)

Area of a rectangle or square
Area = length x width
A = l x w
Area of a parallelogram
Area = base x height
A = b x h

Practical Quiz #3On a piece of paper
1. Draw a parallelogram with a height of 3cm and a base of 8cm. Solve the
area.(on the front)
2. Draw a triangle with a base of 6cm and a height of 5cm. Solve the area.(on the back)

Chapter 4
Student Objective:
• After this lesson, I will be able to…– Estimate percents as fractions or as decimals– Compare and order fractions decimals, and
percents– Estimate and solve problems involving percent

PercentStudent Objective: I will be able to problem solve using percents from 1%-100%
What does it mean?? “out of 100” Ex: 20 out of 100 or 20% or 20 or 0.20
100
“of” means x

Percent Student Objective: I will be able to problem solve using percents from 1%-100%
Ex: 64% = 64 = 0.64
100
• Ex: 91% = =
• Ex: 37% = =
Bonus• Ex: 107% = =

“Friendly” Percents
Discuss with your partner
What are FRIENDLY percent numbers “percentages” to work with? and why?

“Friendly” Percents
25% 50% 75% 100%

Friendly Percent Numbers Student Objective: I will be able to problem solve using percents from 1%-100%
• What is 25% of $10.00? = • What is 50% of $10.00? = • What is 75% of $10.00? =• What is 100% of $10.00? =
What strategy did you use to solve this problem?

“UnFriendly” Percents
17%, 93%, 77%, 33%, 54%.......
So how do you work with these percents?
You must convert the percent to a decimal then multiple

Show What You Know…Student Outcome: I will be able convert %’s, decimals and fractions
• A) 56%, 0.48, ½ (place in ascending order)
• B) 35%, 39/100, 0.36 (place in descending order)

Using Your Table
• Goalies can be rated on “save percentages.” This statistic is the ratio of saves to shots on goal.
– Save Percentage = Number of Saves
Shots on Goal

Extending Your Thinking!!
• Using our chart, decide which goalie is having the best season.
• Is it better to have a higher or lower save percentage?
• How are the decimal and fraction forms of the save percentage related?
• Which form is more useful? Why?

Convert Fractions to Decimals and Percents
Team Wins Losses Winning %(Decimal)
Winning %
Miami 59 23
New Jersey 42 40
Los Angeles 34 48
Team Percentage = Number of wins Total game played

4.2 Estimate PercentsStudent Outcome: I will be able to make estimations using %’s
• Ex: Paige has answered 94 questions correctly out of 140 questions.
• Estimate her mark as a percent.

SolutionStudent Outcome: I will be able to make estimations using %’s
• Think: What is 50% of 140?– Half of 140 is 70
• Think: what is 10% of 140?– 140 ÷ 10 = 14
• 50% + 10% = 60% of 140– 70 + 14 = 84
• 50% + 10% + 10% = 70% of 140– 70 + 14 + 14 = 98
• The answer is between 60% and 70%, but closer to 70%
TOO LOW
TOO HIGH


Key Ideas
• To change a fraction to a decimal number, divide the numerator by the denominator.– Ex: 3/8 = 3 ÷ 8 = 0.375
• Repeating decimal numbers can be written using a bar notion– Ex: 1/3 = 0.333… = 0.3
• To express a terminating decimal number as a fraction, use place value to determine the denominator– 0.9 = 9/10 0.59 = 59/100 1.463 = 1463/1000

Chapter 5

Probability Student Outcome: I will be able to write probabilities as ratios, fractions and percents.
• Probability: is the likelihood or chance of an event occurring.• Outcome: any possible result of a probability event.• Favourable Outcome: a successful result in a probability event.
(ex: rolling the #1 on a die)• Possible Outcome: all the results that could occur during a probability
event (ex: rolling a die - - #1, #2, #3, #4, #5, #6)
• P = Favourable Outcomes Possible OutcomesWhat is the probability of rolling the number 2 on a dice?• What is the favourable outcome?• How many possible outcomes?

How to express probability
Student Outcome: I will be able to write probabilities as ratios, fractions and percents.
• Probability can be written in 3 ways...
• As a fraction = 1/6• As a decimal = 0.16
• As a percent
0.16 x 100% = 17%
How often will thenumber 2 show upwhen rolled?

Determine the probabilityStudent Outcome: I will be able to write probabilities as ratios, fractions and percents.
First you must find the possible outcomes (all possibilities)and then the favourable outcomes (what you’re looking for). Then place them into the probability equation.
1. Rolling an even number on a die?2. Pulling a red card out from a deck of cards?3. Using a four colored spinner to find green?4. Selecting a girl from your class?
P = Favourable Outcomes Possible Outcomes

Determine the probabilityStudent Outcome: I will be able to write probabilities as ratios, fractions and percents.
A cookie jar contains 3 chocolate chip, 5 raisin, 11 Oreos,and 6 almond cookies. Find the probability if you were toreach inside the cookie jar for each of the cookies above.
Type of Cookie
Chocolate Chip
Raisin Oreo Almond
Fraction
Decimal
Percent
Ratio

Organized OutcomesStudent Outcome: I will be able to create a sample space involving 2 independent
events.
Independent Events:• The outcome of one event has no effect on the
outcome of another event
• Example: ROCK
PAPER
SCISSORTails Head

Organized OutcomesStudent Outcome: I will be able to create a sample space involving 2 independent
events.
You can find the sample space of two independentevents in many ways.1. Chart2. Tree Diagram3. Spider Diagram
Your choice, but showing one of the aboveillustrates that you can find the favourable andpossible outcomes for probability.

ChartStudent Outcome: I will be able to create a sample space involving 2 independent
events.
Sample Space:• All possible outcomes of an event/experiment
(all the combinations) coin
hand
• What is the probability of Paper/Head?• What is the probability of tails showing up?
Sample Space
Head Tail
RockPaperScissor

“Tree Diagram” to represent Outcomes
Student Outcome: I will be able to create a sample space involving 2 independent events.
H T
R P S R P S
Coin Flip
Rock, Paper, Scissor
H, Rock T, Rock H, Paper T, Paper
H, Scissor T, Scissor
Outcomes

“Spider Diagram” to represent Outcomes
Student Outcome: I will be able to create a sample space involving 2 independent events.
RockRock
Paper Paper
Scissor Scissor

Probabilities of Simple Independent Events
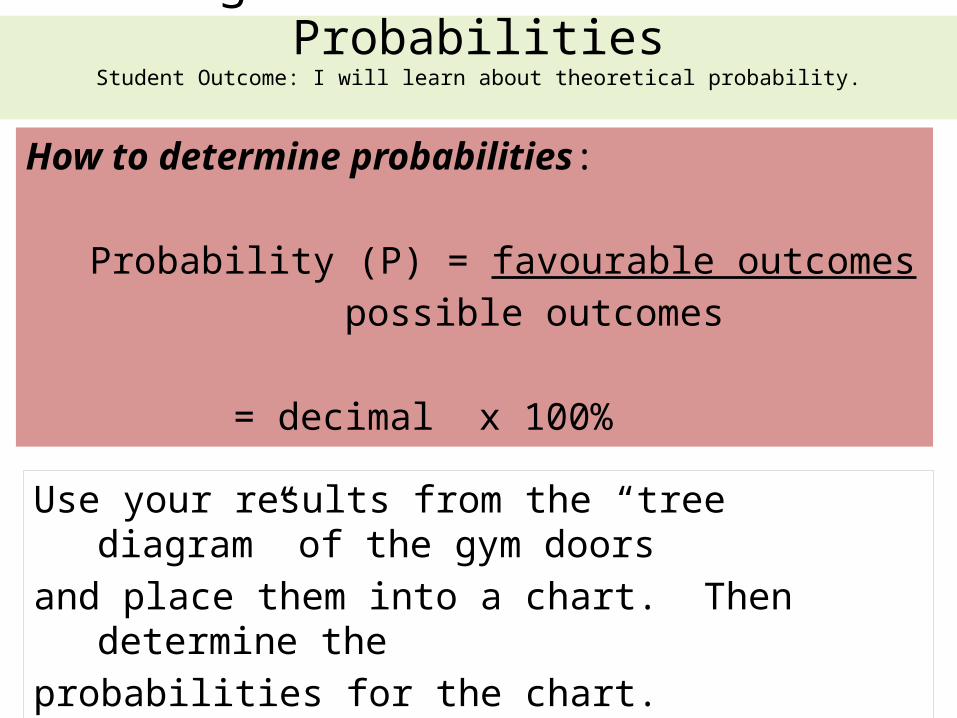
Student Outcome: I will learn about theoretical probability.
Random: an event in which every outcome has an equal chance ofoccurring.
A school gym has three doors on the stage and two backdoors. During a school play, each character enters throughone of the five doors. The next character to enter can beeither a boy or a girl. Use a “Tree Diagram” to determineto show the sample space. Then answer the questions onthe next slide!
Problem:
Using a Table to DETERMINE Probabilities
Student Outcome: I will learn about theoretical probability.
How to determine probabilities:
Probability (P) = favourable outcomes possible outcomes
= decimal x 100%
Use your results from the “tree diagram” of the gym doorsand place them into a chart. Then determine theprobabilities for the chart.

Practical Quiz #2On the front of the paper:Draw a sample space using a chart for the following events.On the back of the paper:Draw a sample space using a tree diagram for the following events.
Rolling a 4 sided die and flipping a quarter.

Chapter 6

Patterns in Multiplication and Division
Factors: numbers you multiply to get a product.
Example: 6 x 4 = 24
Factors Product
Product: the result of multiplication (answer).

Patterns in Multiplication and Division
Opposites: using multiplication to solve division
42 ÷ 7 = 6
Dividend Divisor Quotient
What multiplication equations can I create from above1.
quotient: is the result of a division.
Introduction to Fraction Operations
Student Outcome: I will learn why a number is divisible by 2, 3, 4, 5, 6, 8, 9, 10 and NOT 0
Divisibility: how can you determine if a number is divisible by 2,3,4,5,6,7,8,9 or 10?With a partner….
• Complete the chart on the next slides and circle all the numbers divisible by 2,3,4,5,6,7,8,9, and 10.
• Then find a pattern with the numbers to figure out divisibility rules.
• Reflect on your findings with your class.

Student Outcome: Use Divisibility Rules to SORT Numbers
Carroll Diagram
Divisibility by 9
Not Divisible
by 9
Divisibility by 6
1623996
3031 974
Not Divisible
by 623 517 79
Venn Diagram
Divisible by 6 6
Divisible by 9 6
30
31 9746
162
39966 23 5176
Shows how numbers are thesame and different!
Shows relationships betweengroups of numbers.
Discuss with you partner why each number belongs where is does.
79

Student Outcome: Use Divisibility Rules to SORT Numbers
Venn Diagram
Divisible by 2 6
Fill in the Venn diagram with 7 other numbers. There must be a minimum 2 numbers in each section.
Divisible By 5 6
Share your number with the group beside you. Do their numbers work?

Student Outcome: I will be able to use Divisibility Rules to Determine Factors
Common Factors: a number that two or more numbers are divisible byOR
numbers you multiply together to get a product
Example: 4 is a common factor of 8 & 12 HOW?
1 x 8 = 8 1 x 12 = 122 x 4 = 8 2 x 6 = 12
3 x 4 = 12
What is the greatest common factor (GCF) for 8 and 12?
How would you describe in your own words (GCF)? Then discuss with your partner

Student Outcome: I will be able to use Divisibility Rules to place fractions in lowest terms.
Lowest Terms: when the numerator and denominator of the fraction have no common factors than 1.
Example: 12 = 6 42 21
÷ 2
÷ 2
Ask Yourself?
What are things you know that will help with the factoring?
What number can I factor out of the numerator and denominator?
Can I use other numbers to make factoring quicker?

Student Outcome: I will learn how to add fractions with Like denominators
1. Name the fractions above…2. What if I were to ADD the same fraction to the one above…how
many parts would need to be colored in?3. What is the name of our new fraction?4. Using other pattern blocks can it be reduced to simplest form?
___ + ___ = ____ + ____ =

Chapter 7

Common DenominatorsStudent Outcome: I will learn about multiples and how it relates to common
denominators
What is a common denominator?
Definition Fraction Fraction
-a common multiple of the fractions denominators
Or
-Making equivalent fractions with the same denominator (common)
1/3 1/2
Multiples of 3 Multiples of 2

• Which of the models below are examples of common denominators?
Determine the “Equivalent Fraction”
Student Outcome: I will be able to model and explain equivalent fractions

Adding Fractions of Different Denominators
Student Outcome: I will understand adding fractions with different (unlike) denominators.
• You will be able to model and understand how to add fractions of different denominators
1 + 12 3
How can you add the two fractions together if they are NOT equalsections (denominators)? Hint…find the lowest common multiple!
New Addition Fraction Statement
3 + 2 6 6

Mixed NumbersStudent Outcome: I will learn the relationship between mixed numbers and improper
fractions.
What is a mixed number?: contains a whole number with a fraction.: is the cousin of the improper fraction.
361 = 9
6
Use pattern blocks to try and prove!!! How did you show this?
How?

Add Mixed NumbersStudent Outcome: I will be able to add mixed numbers.
1 + 1
Steps:1. Add the whole #’s 2. Find Lowest Common Denominators3. Add the numerators4. Place the fraction into lowest terms
38
48
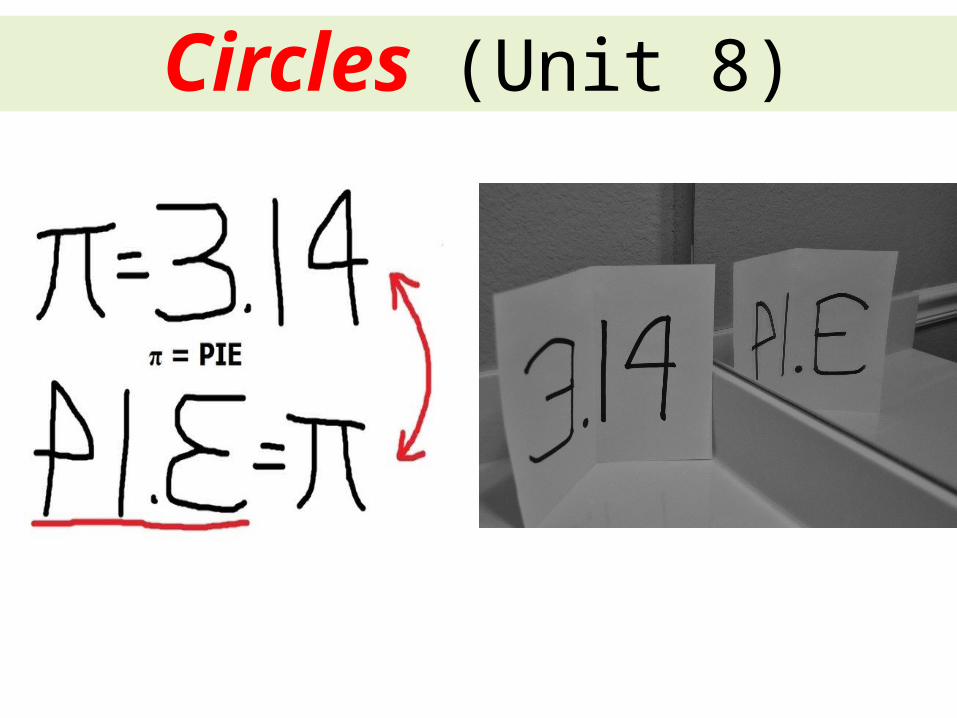
Circles (Unit 8)

Construct Circles (Unit 8)Student outcome: I will be able to describe the relationship of radius, diameter and
circumferenceUse your compass to draw a circle…Use a ruler to find your radius first!
RadiusDistance from the centre of the circle to the outside edge…represented by “r”
DiameterDistance across a circle through its centre…represented by “d”

Circumference of a CircleStudent outcome: I will understand radius, diameter, circumference relationships.
Circumference: is the distance (perimeter) around a circle.
C = 3 x d (estimated)
C = ∏ x d (actual)
What is the relationship between the diameter and circumference of a circle?
∏ is very close to 3 (friendly number)
http://www.learnalberta.ca/content/memg/index.html?term=Division03/Circumference/index.html
The “∏” is known as pi and is known as 3.14

Circumference of a CircleStudent outcome: I will understand radius, diameter, circumference relationships
Circumference: is the distance (perimeter) around a circle.
The “∏” is known as pi and is known as 3.14
DiameterEstimated
CircumferenceC= 3 x d
Actual Circumference
C= ∏ x d
5127

Radius Estimate Area A = 3 x r x r or A = 3r²
Actual AreaA = ∏r² or A = ∏ x r x r
6 cm
8 cm
14 cm
Area of a CircleStudent outcome: I will be able to solve the area of a circle.

What is a “Circle Graph”Student outcome: I will be able to read a circle graph.
Sector:
a section of a circleformed by two radiiand the arc of theedge of a circle, whichconnect the radii
Circle Graph: a graph thatrepresents data using sections of a circle
Who Runs The Show?
WifeKidsMe
http://www.learnalberta.ca/content/memg/index.html?term=Division03/Circle_Graph/index.html
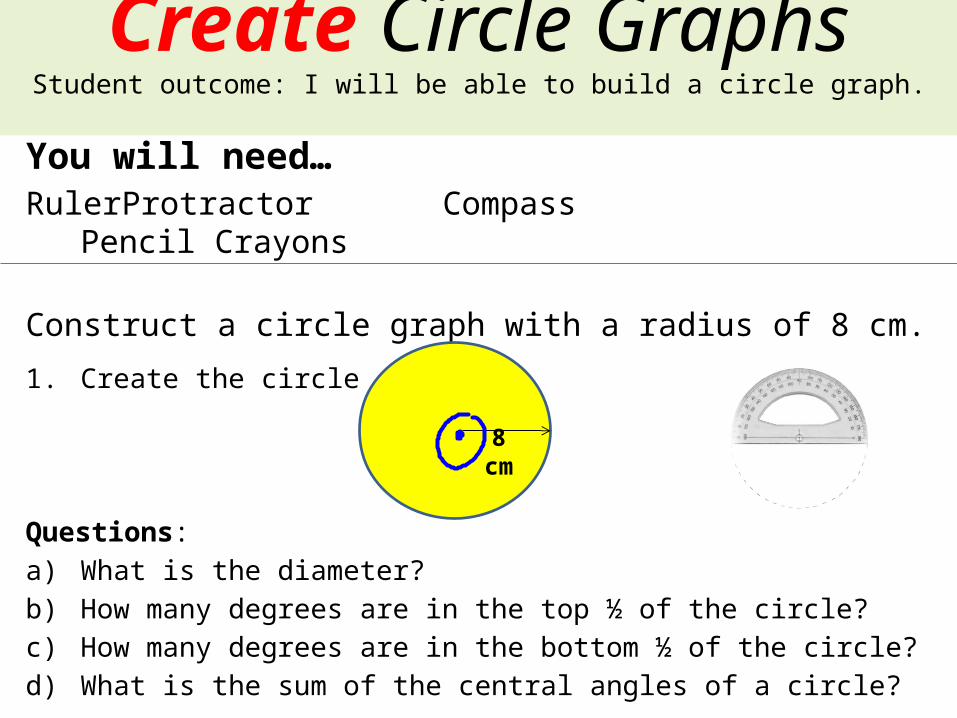
Create Circle GraphsStudent outcome: I will be able to build a circle graph.
You will need…Ruler Protractor Compass Pencil Crayons
Construct a circle graph with a radius of 8 cm.
1. Create the circle
Questions:a) What is the diameter?b) How many degrees are in the top ½ of the circle?c) How many degrees are in the bottom ½ of the circle?d) What is the sum of the central angles of a circle?
8 cm

Create Circle GraphsStudent outcome: I will be able to build a circle graph.
How do we find the “degrees” of something?
% of 360° decimal x 360°
Example: 45% x 360° 0.45 x 360° = 162°

http://www.learnalberta.ca/content/mesg/html/math6web/index.html?page=lessons&lesson=m6lessonshell06.swf
Learn Alberta
Let’s Review Integers (Unit 9)

1. Combine 2 red chips and 2 blue chips…what is their sum?
2. Make the above into an addition statement …use brackets.
Add & Subtract Integers (Unit 9)
Red Chips = +1 Blue Chips = -1

Zero Pair: combining (+1) with (-1) (+1) + (-1) = 0
Zero PairsStudent Outcome: I learn about zero pairs.
We can combine numerous zero pairs to solve problems:
For example: a. (+1) + (-1) =b. (-3) + (+3) =c. (+11) + (-11) =

Grouping: combining “positives with positives” “positives with negatives” or “negatives with negatives” to allow us to solve
Adding IntegersStudent Outcome: I will be able to add integers using integer chips.
Addition Statements:
(+1) + (+2) = ______ (+5) + (- 4) = ______
Your turn…apply “integer addition”
1. Draw the model for (-3) + (+ 4)
2. Draw the model for (+11) + (-3)

What is the “addition statement?”
Student Outcome: I will be able to add integers using a number line.
The addition statement below is…
(+4) + (+3)
1. What do the colors of the arrows represent?2. What do the length of the arrows represent?3. What is the total?

Explore Integer SubtractionStudent Outcome: I will be able to subtract integers using integer
chips.
Subtract integers using integer chips…
1.What is the subtraction expression for the model above?
2.Take away 4 red chips from the original 6 red chips…what do you have left?

Model it… SubtractionStudent Outcome: I will be able to subtract integers using integer
chips.
Model the equations below…
(-5) – (-2) (+8) – (+3)
What do you notice about each equation?

Model it… SubtractionStudent Outcome: I will learn different strategies to use addition to
subtract integers..
STRATEGY #1
“Move in – Move out”

What if the Integer #’s are different?
Student Outcome: I will learn different strategies to use addition to subtract integers..
(+ 2) – (+5)
Steps to follow:1. Model the first integer2. Move in enough to model the second integer
3. Remove the chips asked in the subtraction statement4. What is left
Step 1 Step 2 Step 3 Step 4

Model it… SubtractionStudent Outcome: I will learn different strategies to use addition to
subtract integers..
STRATEGY #2
“Zero Pairs”

What if the Integer #’s are different?
Student Outcome: I will learn different strategies to use addition to subtract integers..
(+ 2) – (- 4)
Steps to follow:1. Model what the question is asking2. ZERO PAIRS: 2nd integer reversing the (+) or (-) of number…
3. Remove the chips asked in the subtraction statement4. Then group the chips left over!
Step 1 Step 2 Step 3 Step 4

Model it… SubtractionStudent Outcome: I will learn different strategies to use addition to
subtract integers..
STRATEGY #3
“Sub to Add”

Subtracting IntegersUse integer chips to find the answer to the subtraction statement below…
(+4) – (+ 2)
What happens when we change the subtraction statement to an addition statement?
(+4) + (- 2)
1.The answers are ____________________.
2.Which of the two methods above are easier?
Zero Pair Remove Group
Zero Pair Remove Group
NOT needed! NOT needed!

Use the “Wind Chill Chart” on page 337 to answer the question below.
1.If the air temperature is – 20ºC and the wind speed is
10 km/h…then what is the “wind chill” temperature?
2.If the air temperature is - 25ºC…and the wind speed is
50 km/h…then what is the “wind chill” temperature?
3. What are the differences between the air temperature and the “wind chill” temperatures above? (Hint…colder!)
Applying Integer OperationsStudent Outcome: I will decide when to add and subtract integers.

Learn Alberta - video
http://www.learnalberta.ca/content/mesg/html/math6web/index.html?page=lessons&lesson=m6lessonshell08.swf
(Unit 10) ReviewExpressions/Equations/
Variables

Patterns can be made of shapes, colours, number, letters,words and more. Some patterns are quite easy todescribe. Others can be more difficult.Find the PatternHow many cubes are in the 4th and 7th shape? How will you do this?
Describe Patterns (Unit 10)
Student Outcome: Describe patterns using words, tables and diagrams.

Find the pattern of “ninths” changed to decimals.
Example: 1/9 = 0.111111111 repeated __
This can be changed to 0.1 called a repeating decimal
Describe a Number Pattern…
Student Outcome: Describe patterns with repeating decimals.
Change the ninths below to repeating decimals!
2/9 = 5/9 = 8/9 = 3/9 =

Write the “expression” to represent the pattern…
Exploring Variables & Expressions…
Student Outcome: I can write an expression to represent a pattern.
Use your data to find expressions for patterns…Picture #
1 2 3 4 5 9
White Tiles
4 8 12
Red Tiles 2 4 6
Red Tiles = W ÷ 2 or W/2
White Tiles =

Variable: a letter that represents an unknown number (x, a, b, etc…)
Expression: a number or variable combined with an operation (+, -, x…)
Value: a known or calculated amountEquation: a mathematical statement with 2 expressions ( = )
Constant: a number that does NOT change. It increases or decreases the value.
Numerical Coefficient: a number that multiplies the variable.
Describing patterns using EXPRESSIONS
Student Outcome: Identify constant, numerical coefficient and variable.
Label the “terms” above to the arrows in the example below…Learn Alberta
http://www.learnalberta.ca/content/memg/index.html?term=Division02/Variable/index.html
3c x 4 = 36

1. Find the pattern(s)…put into words2. Create a T-chart3. Find an expression for the diagrams and number of toothpicks.4. Predict the number of toothpicks for diagrams 10, 22 and 35.5. Do you see another pattern? HINT “use the base” Can we create
an expression based on the base and total number of toothpicks?
Describing patterns using EXPRESSIONS
Student Outcome: I can write an expression to represent a pattern.

Complete #4 on page 361 (squares made from toothpicks)…youmay work with a partner and discuss.
1. Find the pattern(s)…put into words2. Create a T-chart3. Find the expressions comparing the “base” and the “total
number of toothpicks”4. Predict the total number of toothpicks (perimeter) if the
base is 10, 22 and 35?5. Predict the # of toothpicks on the base if the perimeter is 40, 60, and 120?
Describing patterns using EXPRESSIONS
Student Outcome: I can write an expression to represent a pattern.

Evaluate Expressions…Student Outcome: I will be able to model an expression.
Model an expression: draw a picture for an expression
Let “c” represent the unknown number of pennies in the cup(s)…then add 4 more pennies. If you where to Place 6 pennies in the cup. Write the expression, draw a model for the expression, what is the value of “c” and find the value of the expression?

Evaluate Expressions…Student Outcome: I will be able to model an expression.
Student Outcome I can make and solve equations with adding and subtracting
Expression Value of “c”
Value of Expression
c + 4 c = 6 10
Let “c” represent the unknown number of pennies in the cup(s)…then add 4 more pennies. If you place 6 more pennies in the cup. Write the expression, what is the value of “c” and find the value of the expression?
+

Evaluate Expressions…Student Outcome: I will be able to model an expression.
Student Outcome I can make and solve equations with adding and subtracting
Expression Value of “c”
Value of Expression
c + 4 c = 6 10
Let “c” represent the unknown number of pennies in the cup…then add 4 more pennies. Place 6 more pennies in the cup. Write the expression, what is the value of “c” and find the value of the expression?
+

Linear Relation: a pattern made by two sets of numbers that results in pointsalong a straight line (pattern) on a coordinate grid.
Graph Linear Relations …
Student Outcome: I will be able to graph a linear relation.
1. What can we do to make the data on the grid make more sense?
2. What is the pattern? 3. What is the “expression?”

Plot Points From a Given Data…
Number of Pups,
“p”
Number of Fish,
“f”
Ordered Pair (p, f)
1 3 (1, 3)
2 6 (2, 6)
3 9 (3, 9)
7 21 (7, 21)
10 30 (10, 30)
1. What is the pattern?
2. What is the expression to find “p”
3. What is the expression to find “f”