math 30 intermediate algebra unit 3 quadratic, rational ... · practice: 1. marketing research by a...
TRANSCRIPT
Math 30 Intermediate Algebra
Unit 3
Quadratic, Rational, and Power Functions
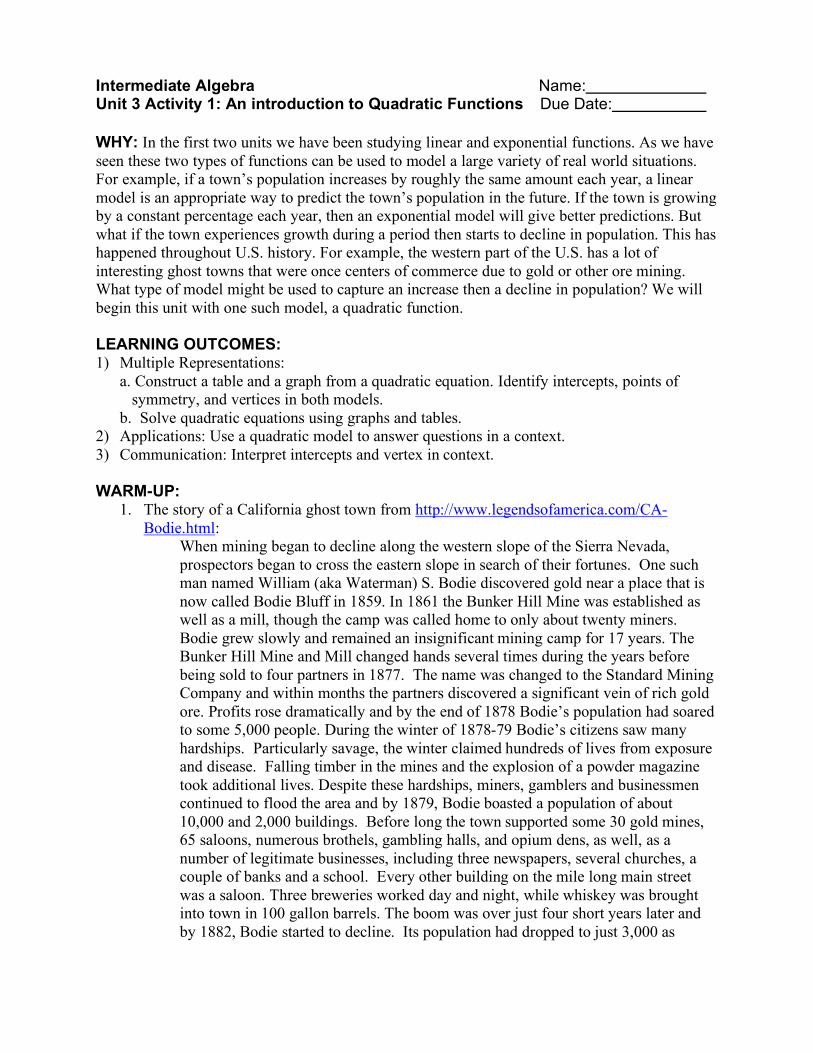
Intermediate Algebra Name: Unit 3 Activity 1: An introduction to Quadratic Functions Due Date: WHY: In the first two units we have been studying linear and exponential functions. As we have seen these two types of functions can be used to model a large variety of real world situations. For example, if a town’s population increases by roughly the same amount each year, a linear model is an appropriate way to predict the town’s population in the future. If the town is growing by a constant percentage each year, then an exponential model will give better predictions. But what if the town experiences growth during a period then starts to decline in population. This has happened throughout U.S. history. For example, the western part of the U.S. has a lot of interesting ghost towns that were once centers of commerce due to gold or other ore mining. What type of model might be used to capture an increase then a decline in population? We will begin this unit with one such model, a quadratic function. LEARNING OUTCOMES: 1) Multiple Representations:
a. Construct a table and a graph from a quadratic equation. Identify intercepts, points of symmetry, and vertices in both models.
b. Solve quadratic equations using graphs and tables. 2) Applications: Use a quadratic model to answer questions in a context. 3) Communication: Interpret intercepts and vertex in context. WARM-UP:
1. The story of a California ghost town from http://www.legendsofamerica.com/CA-Bodie.html:
When mining began to decline along the western slope of the Sierra Nevada, prospectors began to cross the eastern slope in search of their fortunes. One such man named William (aka Waterman) S. Bodie discovered gold near a place that is now called Bodie Bluff in 1859. In 1861 the Bunker Hill Mine was established as well as a mill, though the camp was called home to only about twenty miners. Bodie grew slowly and remained an insignificant mining camp for 17 years. The Bunker Hill Mine and Mill changed hands several times during the years before being sold to four partners in 1877. The name was changed to the Standard Mining Company and within months the partners discovered a significant vein of rich gold ore. Profits rose dramatically and by the end of 1878 Bodie’s population had soared to some 5,000 people. During the winter of 1878-79 Bodie’s citizens saw many hardships. Particularly savage, the winter claimed hundreds of lives from exposure and disease. Falling timber in the mines and the explosion of a powder magazine took additional lives. Despite these hardships, miners, gamblers and businessmen continued to flood the area and by 1879, Bodie boasted a population of about 10,000 and 2,000 buildings. Before long the town supported some 30 gold mines, 65 saloons, numerous brothels, gambling halls, and opium dens, as well, as a number of legitimate businesses, including three newspapers, several churches, a couple of banks and a school. Every other building on the mile long main street was a saloon. Three breweries worked day and night, while whiskey was brought into town in 100 gallon barrels. The boom was over just four short years later and by 1882, Bodie started to decline. Its population had dropped to just 3,000 as
several smaller mining companies went bankrupt and people began to leave the area in search of better opportunities.
Quadratic functions have the form
!
y = f (x) = ax2
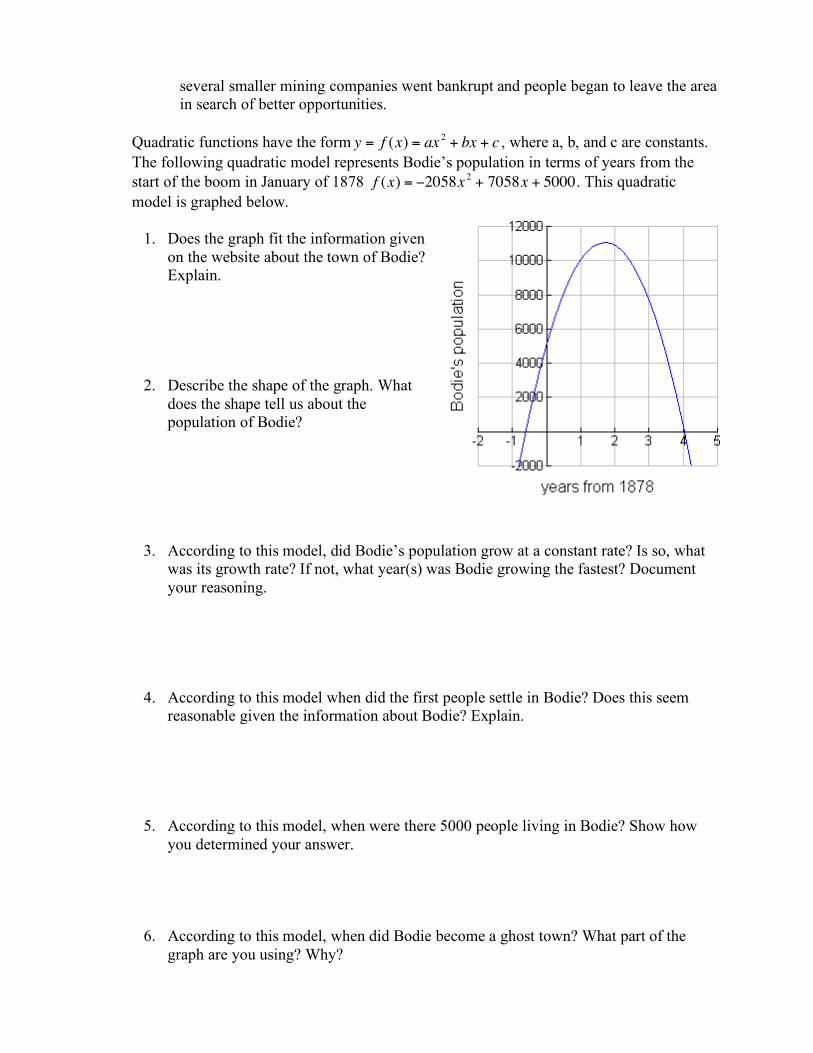
+ bx + c , where a, b, and c are constants. The following quadratic model represents Bodie’s population in terms of years from the start of the boom in January of 1878
!
f (x) = "2058x2
+ 7058x + 5000. This quadratic model is graphed below.
1. Does the graph fit the information given
on the website about the town of Bodie? Explain.
2. Describe the shape of the graph. What does the shape tell us about the population of Bodie?
3. According to this model, did Bodie’s population grow at a constant rate? Is so, what was its growth rate? If not, what year(s) was Bodie growing the fastest? Document your reasoning.
4. According to this model when did the first people settle in Bodie? Does this seem reasonable given the information about Bodie? Explain.
5. According to this model, when were there 5000 people living in Bodie? Show how you determined your answer.
6. According to this model, when did Bodie become a ghost town? What part of the graph are you using? Why?
Group Exercises:
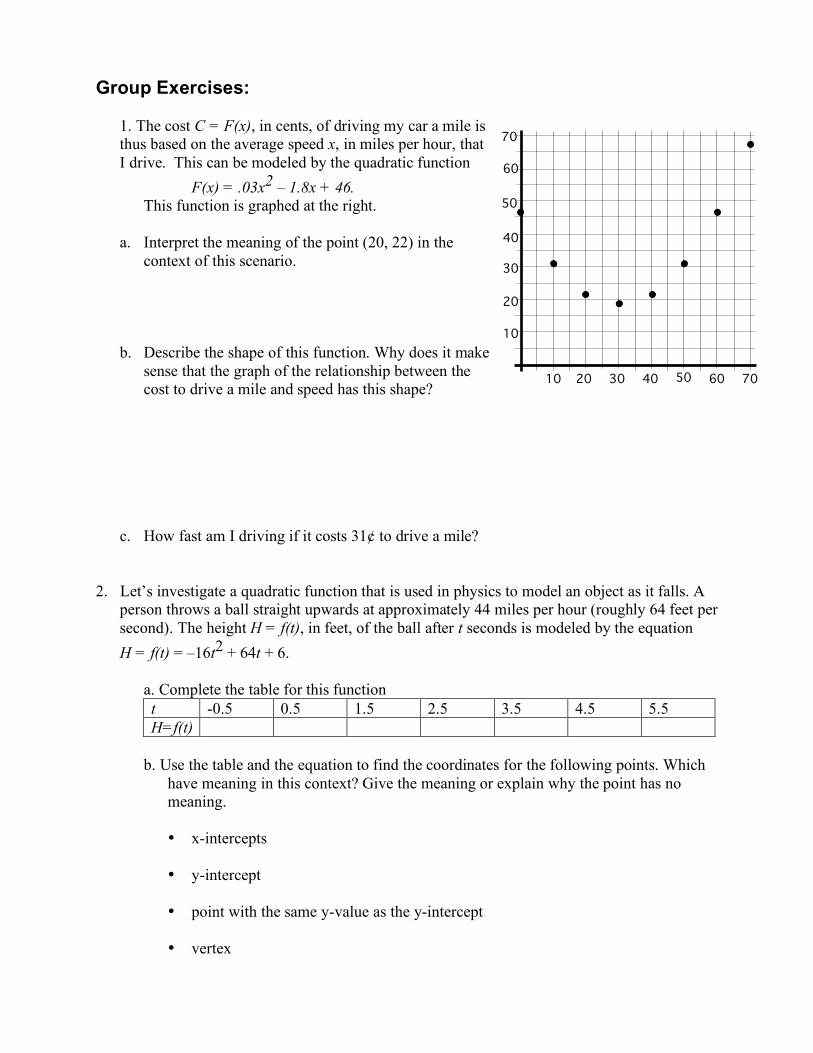
1. The cost C = F(x), in cents, of driving my car a mile is thus based on the average speed x, in miles per hour, that I drive. This can be modeled by the quadratic function
F(x) = .03x2 – 1.8x + 46. This function is graphed at the right.
a. Interpret the meaning of the point (20, 22) in the context of this scenario.
b. Describe the shape of this function. Why does it make sense that the graph of the relationship between the cost to drive a mile and speed has this shape?
c. How fast am I driving if it costs 31¢ to drive a mile? 2. Let’s investigate a quadratic function that is used in physics to model an object as it falls. A
person throws a ball straight upwards at approximately 44 miles per hour (roughly 64 feet per second). The height H = f(t), in feet, of the ball after t seconds is modeled by the equation H = f(t) = –16t2 + 64t + 6.
a. Complete the table for this function t -0.5 0.5 1.5 2.5 3.5 4.5 5.5 H=f(t)
b. Use the table and the equation to find the coordinates for the following points. Which
have meaning in this context? Give the meaning or explain why the point has no meaning.
• x-intercepts • y-intercept
• point with the same y-value as the y-intercept
• vertex
10 20 30 40 50 60 70
10
20
30
40
50
60
70
c. Graph this quadratic function showing each of the points in part (b). Clearly label and scale the grid.
d. Which part of the graph gives meaningful
information about the falling ball? For what values of t does f(t) realistically model the height of a ball?
e. Is the ball moving at a constant velocity? If so,
what is the velocity? If not, when is it’s velocity the greatest?
3. Tom has a taste for adventure. He decides that he wants to bungee jump off the Missouri River bridge when he visits his cousin this summer. His cousin, who is an engineering major, uses the height of the bridge, the length of the bungee cord and its elasticity to model the height from the water of the first bounce of Tom’s bungee jump using a quadratic function
!
h(t) = 20.5t2"123t +190.5 where t is in seconds. Tom will come
closest to water on the first bounce. How close will he get to the water? Show your work and document your reasoning.
Practice: 1. Marketing research by a company has shown that the profit, P in thousands of dollars, is related to the amount spent on advertising, x in thousands of dollars, by the quadratic function
!
P = f (x) = 230 + 20x " 0.5x2 .
a. Complete the table for this function x -20 -10 0 10 20 30 40 50 P=f(x)
b. What are the coordinates of the following points? Which have meaning in this context? Give the meaning or explain why the point has no meaning.
• x-intercepts • y-intercept
• point with the same y-value as the y-intercept
• vertex
c. Graph this quadratic function showing each of the points in part (b). Clearly label and scale the grid.
d. Show on the graph the parts that provide a
good model of this company’s profits. For what values of x does f(x) realistically model the company’s profits? Explain.
e. What advice do you have for this company as it considers its advertising budget?
2. A diver jumps upward from a platform that is 40 m above the water at an initial speed of 10 m/sec. The height h = f(t), in meters, of the diver above the water at time t (in seconds) is modeled by f(t) = –5t2 + 10t + 40.
a. Complete the table
t -1
0 1 2 3 4 5
f(t) b. Sketch the graph of the diver’s height. Label graph. c. Does the diver reach a height of 50 meters? If so,
when? Show or explain how you determined your answer.
c. How long does it take for the diver to hit the water? Briefly document your process.
Label your solution(s) on the graph. d. Find the value(s) of t for which f(t) = 25. Briefly document your process. Explain its
meaning in the context of the problem. Label your solution(s) on the graph.
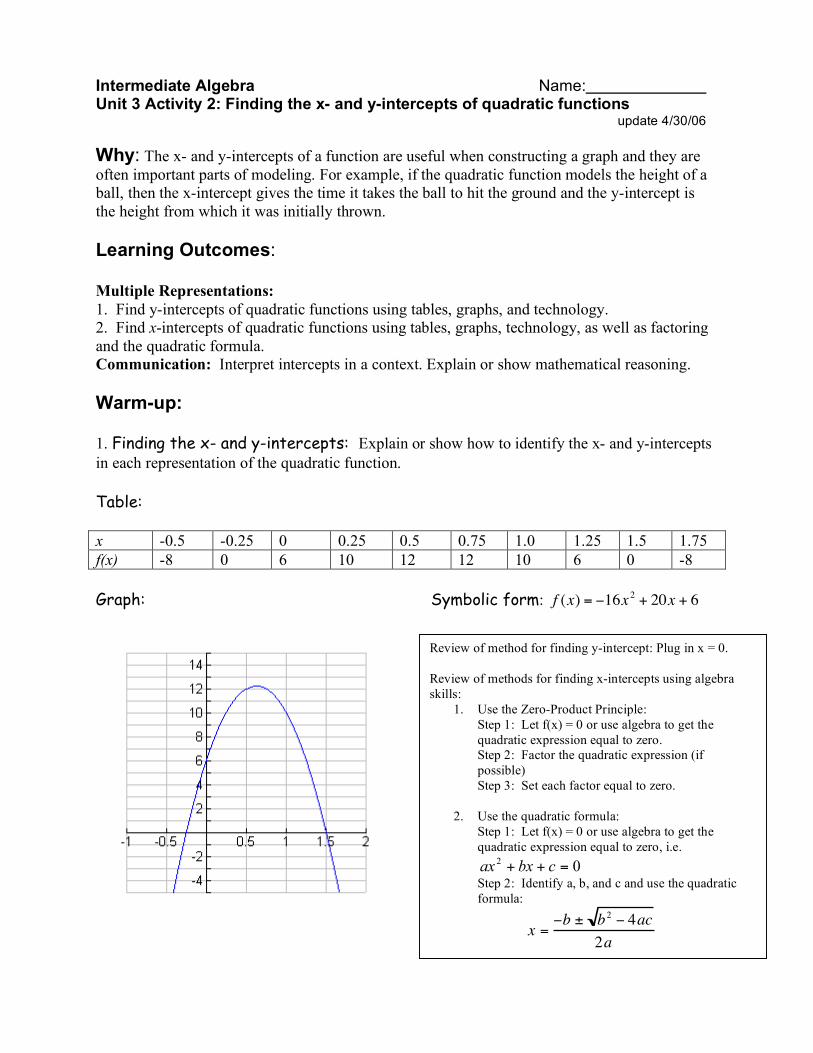
Intermediate Algebra Name: Unit 3 Activity 2: Finding the x- and y-intercepts of quadratic functions update 4/30/06 Why: The x- and y-intercepts of a function are useful when constructing a graph and they are often important parts of modeling. For example, if the quadratic function models the height of a ball, then the x-intercept gives the time it takes the ball to hit the ground and the y-intercept is the height from which it was initially thrown. Learning Outcomes: Multiple Representations: 1. Find y-intercepts of quadratic functions using tables, graphs, and technology. 2. Find x-intercepts of quadratic functions using tables, graphs, technology, as well as factoring and the quadratic formula. Communication: Interpret intercepts in a context. Explain or show mathematical reasoning. Warm-up: 1. Finding the x- and y-intercepts: Explain or show how to identify the x- and y-intercepts in each representation of the quadratic function. Table: x -0.5 -0.25 0 0.25 0.5 0.75 1.0 1.25 1.5 1.75 f(x) -8 0 6 10 12 12 10 6 0 -8 Graph: Symbolic form:
!
f (x) = "16x2
+ 20x + 6
Review of method for finding y-intercept: Plug in x = 0. Review of methods for finding x-intercepts using algebra skills:
1. Use the Zero-Product Principle: Step 1: Let f(x) = 0 or use algebra to get the quadratic expression equal to zero. Step 2: Factor the quadratic expression (if possible) Step 3: Set each factor equal to zero.
2. Use the quadratic formula: Step 1: Let f(x) = 0 or use algebra to get the quadratic expression equal to zero, i.e.
02
=++ cbxax Step 2: Identify a, b, and c and use the quadratic formula:
x =!b ± b
2 ! 4ac
2a
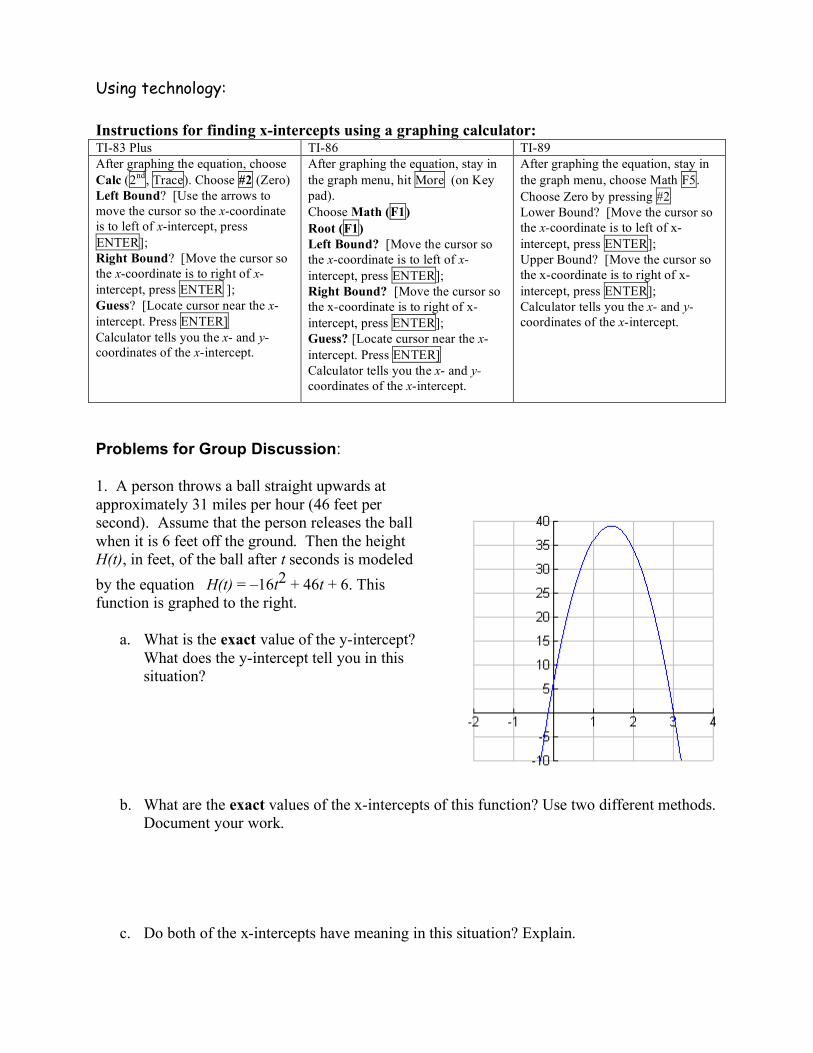
Using technology: Instructions for finding x-intercepts using a graphing calculator: TI-83 Plus TI-86 TI-89 After graphing the equation, choose Calc (2nd, Trace). Choose #2 (Zero) Left Bound? [Use the arrows to move the cursor so the x-coordinate is to left of x-intercept, press ENTER]; Right Bound? [Move the cursor so the x-coordinate is to right of x-intercept, press ENTER ]; Guess? [Locate cursor near the x-intercept. Press ENTER] Calculator tells you the x- and y-coordinates of the x-intercept.
After graphing the equation, stay in the graph menu, hit More (on Key pad). Choose Math (F1) Root (F1) Left Bound? [Move the cursor so the x-coordinate is to left of x-intercept, press ENTER]; Right Bound? [Move the cursor so the x-coordinate is to right of x-intercept, press ENTER]; Guess? [Locate cursor near the x-intercept. Press ENTER] Calculator tells you the x- and y-coordinates of the x-intercept.
After graphing the equation, stay in the graph menu, choose Math F5. Choose Zero by pressing #2 Lower Bound? [Move the cursor so the x-coordinate is to left of x-intercept, press ENTER]; Upper Bound? [Move the cursor so the x-coordinate is to right of x-intercept, press ENTER]; Calculator tells you the x- and y-coordinates of the x-intercept.
Problems for Group Discussion: 1. A person throws a ball straight upwards at approximately 31 miles per hour (46 feet per second). Assume that the person releases the ball when it is 6 feet off the ground. Then the height H(t), in feet, of the ball after t seconds is modeled by the equation H(t) = –16t2 + 46t + 6. This function is graphed to the right.
a. What is the exact value of the y-intercept? What does the y-intercept tell you in this situation?
b. What are the exact values of the x-intercepts of this function? Use two different methods. Document your work.
c. Do both of the x-intercepts have meaning in this situation? Explain.
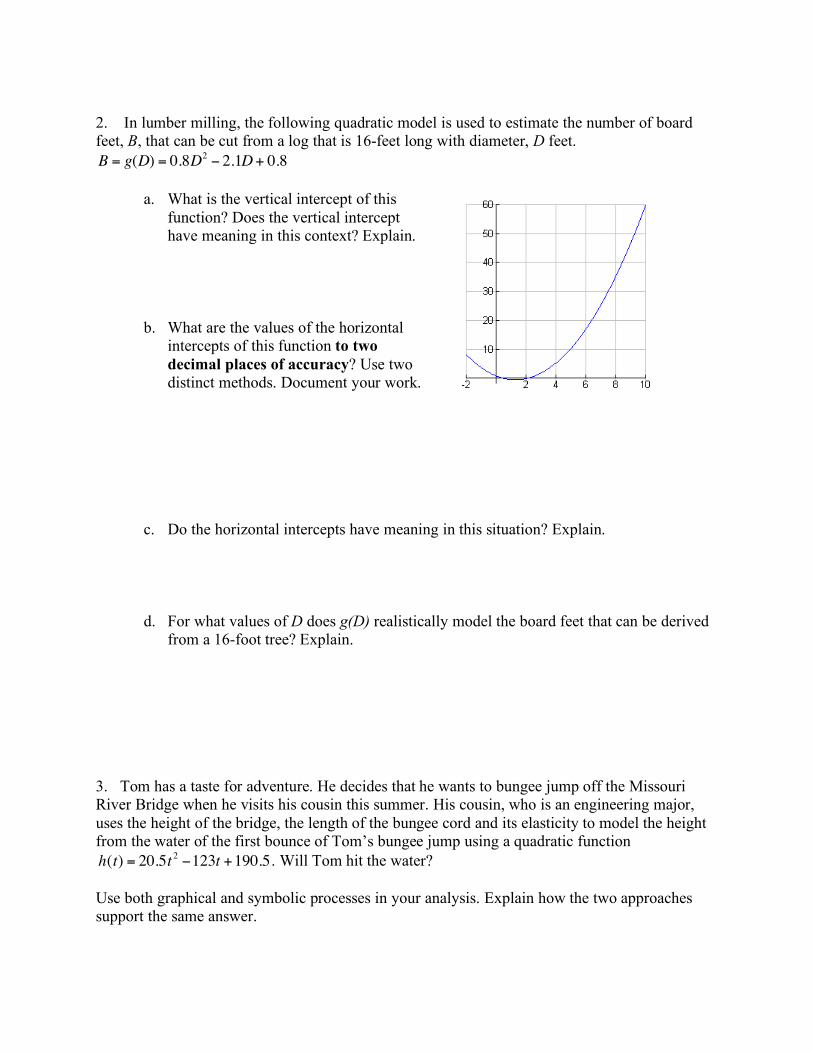
2. In lumber milling, the following quadratic model is used to estimate the number of board feet, B, that can be cut from a log that is 16-feet long with diameter, D feet.
!
B = g(D) = 0.8D2" 2.1D+ 0.8
a. What is the vertical intercept of this
function? Does the vertical intercept have meaning in this context? Explain.
b. What are the values of the horizontal intercepts of this function to two decimal places of accuracy? Use two distinct methods. Document your work.
c. Do the horizontal intercepts have meaning in this situation? Explain.
d. For what values of D does g(D) realistically model the board feet that can be derived from a 16-foot tree? Explain.
3. Tom has a taste for adventure. He decides that he wants to bungee jump off the Missouri River Bridge when he visits his cousin this summer. His cousin, who is an engineering major, uses the height of the bridge, the length of the bungee cord and its elasticity to model the height from the water of the first bounce of Tom’s bungee jump using a quadratic function
!
h(t) = 20.5t2"123t +190.5. Will Tom hit the water?
Use both graphical and symbolic processes in your analysis. Explain how the two approaches support the same answer.
Practice: You are hired as a business analyst for a large toy company named Charlie-CO. Charlie-CO is interested in selling franchises. Your business partner models Charlie-CO’s profit, P in billions, based on the number of franchises sold, x in thousands.
!
P = f (x) = "10 +10x " x2
1. You are responsible for the presentation to Charlie-CO. Since a picture is worth a
thousand words, make a graph that shows how profits are affected by franchise sales. Write a few brief captions on the graph that highlight the important features you want the CEO of Charlie-CO to see.
2. What is the smallest number of franchises Charlie-CO could sell and still make a profit?
What is the largest number of franchises Charlie-CO could sell and still make a profit? Show your work or document your reasoning.
3. What is your advice to Charlie-CO about selling franchises? Support your advice with a clearly worded rationale so that the CEO understands WHY he should follow your advice.
Intermediate Algebra Name: _____________________ Unit 3 Activity 3: Maximums and Minimums of Quadratic Functions update 4/30/06
Why: When using a quadratic model, the high point or low point is often of interest. This point is called the vertex. For example, if the quadratic model is used to represent the relationship between a ball’s height and the time the ball has been in the air, the y-coordinate of the vertex gives the maximum height of the ball and the x-coordinate tells us how long it takes the ball to reach its maximum height. Learning Outcomes 1) Communication: Explain connections between mathematical concepts by relating x-
intercepts to the vertex. 2) Problem-solving: Demonstrate the use of a general problem-solving process. 3) Multiple Representations: Identify the vertex for quadratic functions given as graphs, tables,
technology, and symbolic methods. 4) Applications and skills: Find maximums and minimums for quadratic functions in applied
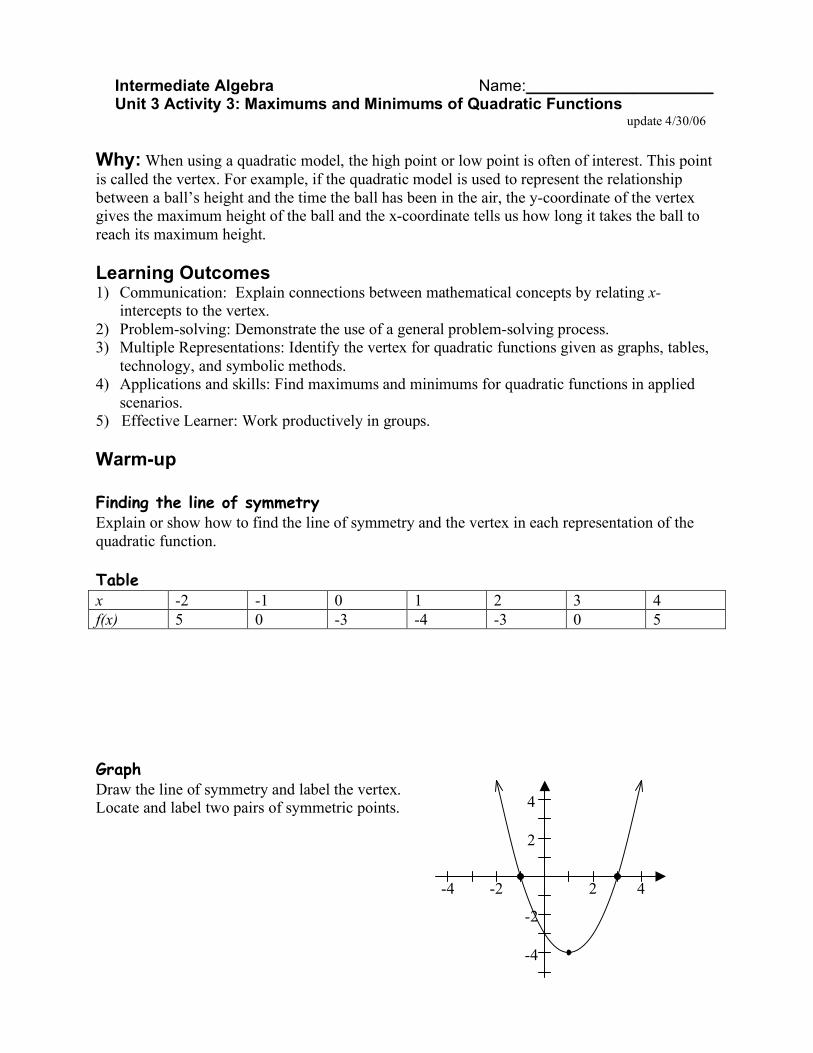
scenarios. 5) Effective Learner: Work productively in groups. Warm-up Finding the line of symmetry Explain or show how to find the line of symmetry and the vertex in each representation of the quadratic function. Table x -2 -1 0 1 2 3 4 f(x) 5 0 -3 -4 -3 0 5 Graph Draw the line of symmetry and label the vertex. Locate and label two pairs of symmetric points.
-4 -2 2 4
2
4
-2
-4
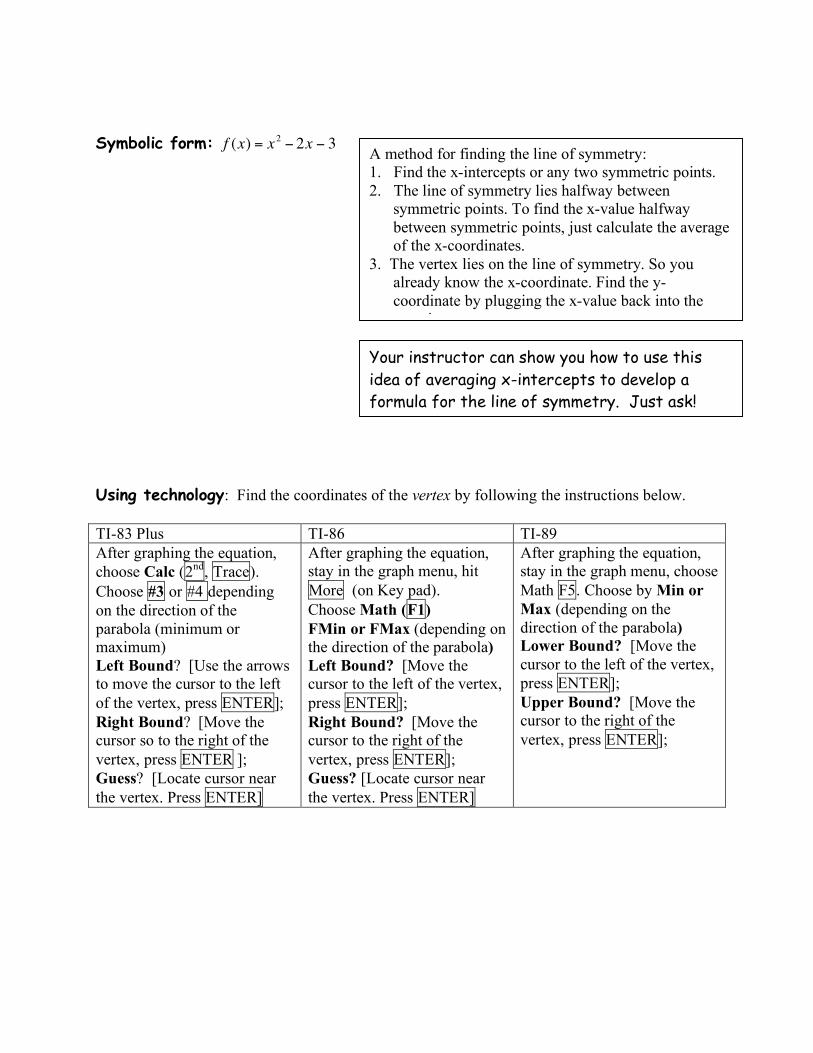
Symbolic form:
!
f (x) = x2" 2x " 3
Using technology: Find the coordinates of the vertex by following the instructions below. TI-83 Plus TI-86 TI-89 After graphing the equation, choose Calc (2nd, Trace). Choose #3 or #4 depending on the direction of the parabola (minimum or maximum) Left Bound? [Use the arrows to move the cursor to the left of the vertex, press ENTER]; Right Bound? [Move the cursor so to the right of the vertex, press ENTER ]; Guess? [Locate cursor near the vertex. Press ENTER]
After graphing the equation, stay in the graph menu, hit More (on Key pad). Choose Math (F1) FMin or FMax (depending on the direction of the parabola) Left Bound? [Move the cursor to the left of the vertex, press ENTER]; Right Bound? [Move the cursor to the right of the vertex, press ENTER]; Guess? [Locate cursor near the vertex. Press ENTER]
After graphing the equation, stay in the graph menu, choose Math F5. Choose by Min or Max (depending on the direction of the parabola) Lower Bound? [Move the cursor to the left of the vertex, press ENTER]; Upper Bound? [Move the cursor to the right of the vertex, press ENTER];
A method for finding the line of symmetry: 1. Find the x-intercepts or any two symmetric points. 2. The line of symmetry lies halfway between
symmetric points. To find the x-value halfway between symmetric points, just calculate the average of the x-coordinates.
3. The vertex lies on the line of symmetry. So you already know the x-coordinate. Find the y-coordinate by plugging the x-value back into the equation.
Your instructor can show you how to use this idea of averaging x-intercepts to develop a formula for the line of symmetry. Just ask!

Group Exercises: 1. A person throws a ball straight upwards at approximately 31 miles per hour (46 feet per second). Assume that the person releases the ball when it is 6 feet off the ground. Then the height H(t), in feet, of the ball after t seconds is modeled by the equation H(t) = –16t2 + 46t + 6. This function is graphed to the right. How long does it take the ball to reach its maximum height? What is the maximum height reached by the ball? Use two methods to answer these questions. 2. The number of w of wristwatches that consumers will buy per month depends on the price p
at which they are offered: w = 375 – 5p. [In economics, this is called the demand. Demand is always a function of price.] Revenue, the amount made on the sale of an item, is the price of the item times the quantity sold. How much should wristwatches cost if the goal is to maximize the revenue?
Demonstrate the steps in a general problem-solving process (identify given info, paraphrase the task, state your assumptions, make an estimate, solve the problem, interpret your answer in context, check your answer using another method or explain why your answer is reasonable.)
3. A farmer wants to enclose three sides of a rectangular area that borders a creek. He has 2400 meters of fencing material. What is the maximum area that can be enclosed by the fence?
Demonstrate the steps in a general problem-solving process (identify given info, paraphrase the task, state your assumptions, make an estimate, solve the problem, interpret your answer in context, check your answer using another method.
4. The Golden Ratio was used by the Greeks in the design of the Pantheon and repeatedly by Leonardo deVinci in his paintings. In this problem you will find a decimal approximation for the Golden Ratio. Take a line segment and label its two endpoints A and C. Now put a point B between A and C so that the ratio of the short part of the segment (AB) to the long part (BC) equals the ratio of the long part (BC) to the entire segment (AC). Now let AB = 1 and BC = x. Find x, which is the golden ratio. Demonstrate the steps in a general problem-solving process (identify given info, paraphrase the task, state your assumptions, make an estimate, solve the problem, interpret your answer in context, check your answer using another method.)
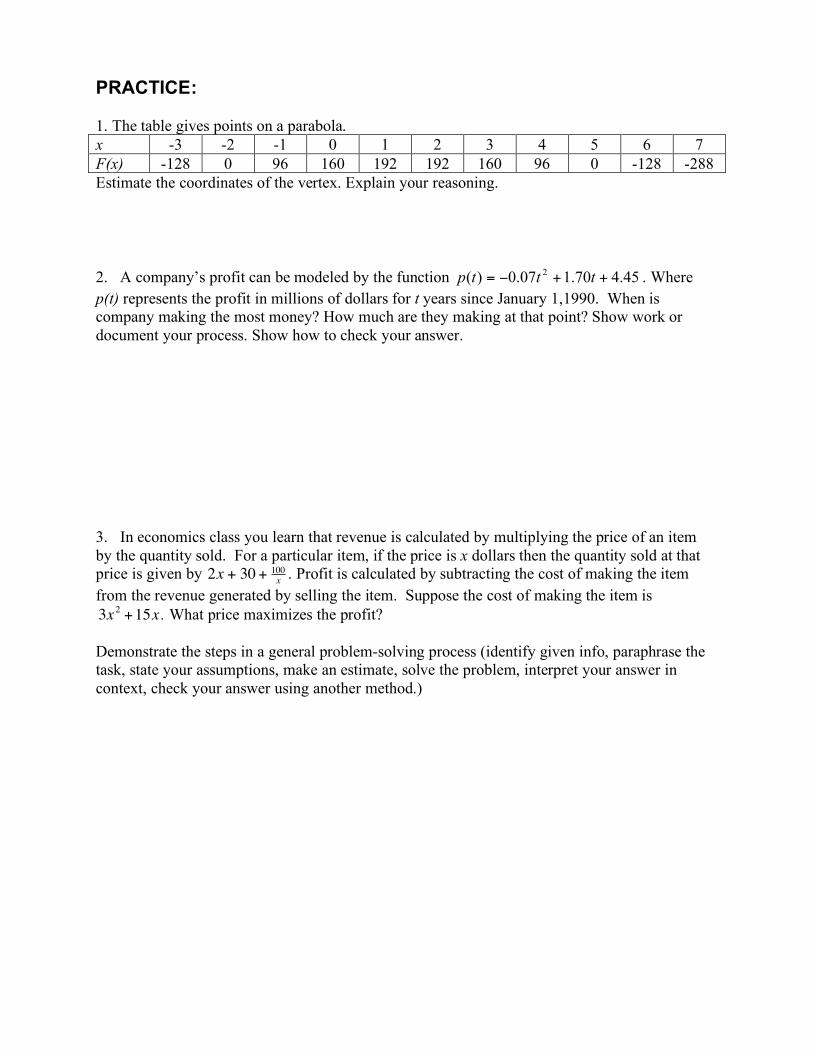
PRACTICE: 1. The table gives points on a parabola. x -3 -2 -1 0 1 2 3 4 5 6 7 F(x) -128 0 96 160 192 192 160 96 0 -128 -288 Estimate the coordinates of the vertex. Explain your reasoning. 2. A company’s profit can be modeled by the function 45.470.107.0)( 2
++!= tttp . Where p(t) represents the profit in millions of dollars for t years since January 1,1990. When is company making the most money? How much are they making at that point? Show work or document your process. Show how to check your answer. 3. In economics class you learn that revenue is calculated by multiplying the price of an item by the quantity sold. For a particular item, if the price is x dollars then the quantity sold at that price is given by
!
2x + 30 + 100
x. Profit is calculated by subtracting the cost of making the item
from the revenue generated by selling the item. Suppose the cost of making the item is
!
3x2
+15x . What price maximizes the profit? Demonstrate the steps in a general problem-solving process (identify given info, paraphrase the task, state your assumptions, make an estimate, solve the problem, interpret your answer in context, check your answer using another method.)
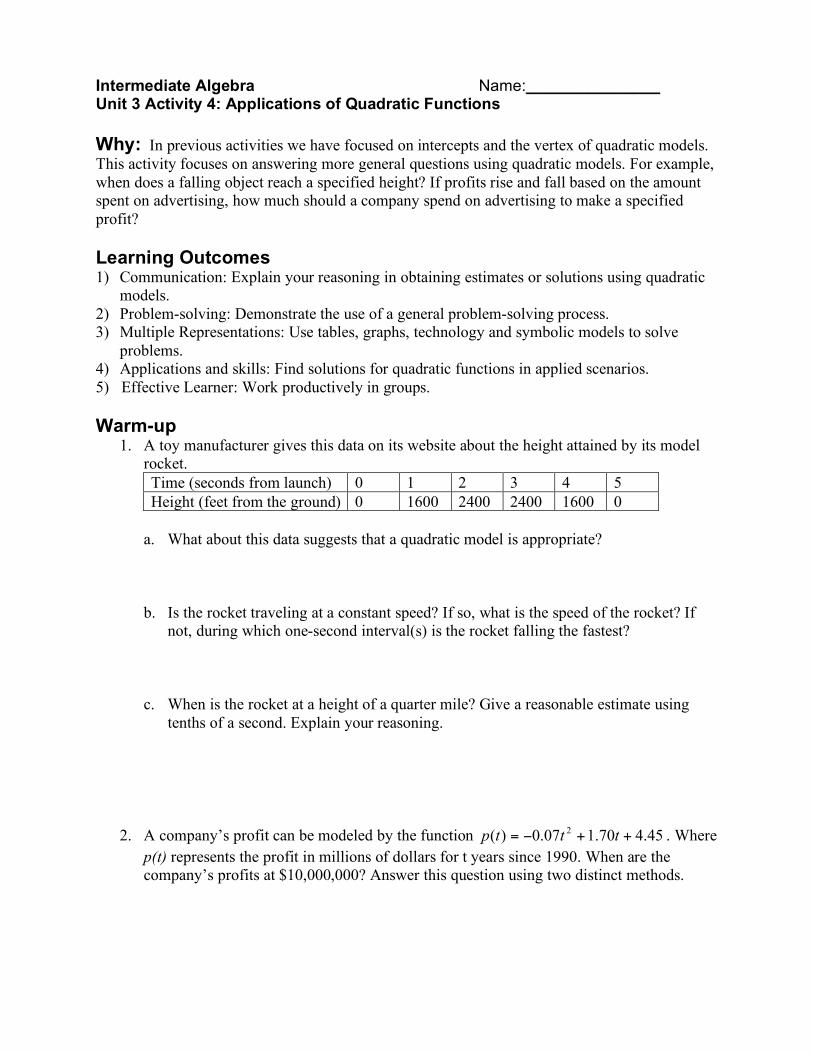
Intermediate Algebra Name: _______________ Unit 3 Activity 4: Applications of Quadratic Functions
Why: In previous activities we have focused on intercepts and the vertex of quadratic models. This activity focuses on answering more general questions using quadratic models. For example, when does a falling object reach a specified height? If profits rise and fall based on the amount spent on advertising, how much should a company spend on advertising to make a specified profit? Learning Outcomes 1) Communication: Explain your reasoning in obtaining estimates or solutions using quadratic
models. 2) Problem-solving: Demonstrate the use of a general problem-solving process. 3) Multiple Representations: Use tables, graphs, technology and symbolic models to solve
problems. 4) Applications and skills: Find solutions for quadratic functions in applied scenarios. 5) Effective Learner: Work productively in groups. Warm-up
1. A toy manufacturer gives this data on its website about the height attained by its model rocket. Time (seconds from launch) 0 1 2 3 4 5 Height (feet from the ground) 0 1600 2400 2400 1600 0
a. What about this data suggests that a quadratic model is appropriate?
b. Is the rocket traveling at a constant speed? If so, what is the speed of the rocket? If
not, during which one-second interval(s) is the rocket falling the fastest?
c. When is the rocket at a height of a quarter mile? Give a reasonable estimate using
tenths of a second. Explain your reasoning.
2. A company’s profit can be modeled by the function 45.470.107.0)( 2++!= tttp . Where
p(t) represents the profit in millions of dollars for t years since 1990. When are the company’s profits at $10,000,000? Answer this question using two distinct methods.
Group Exercises:
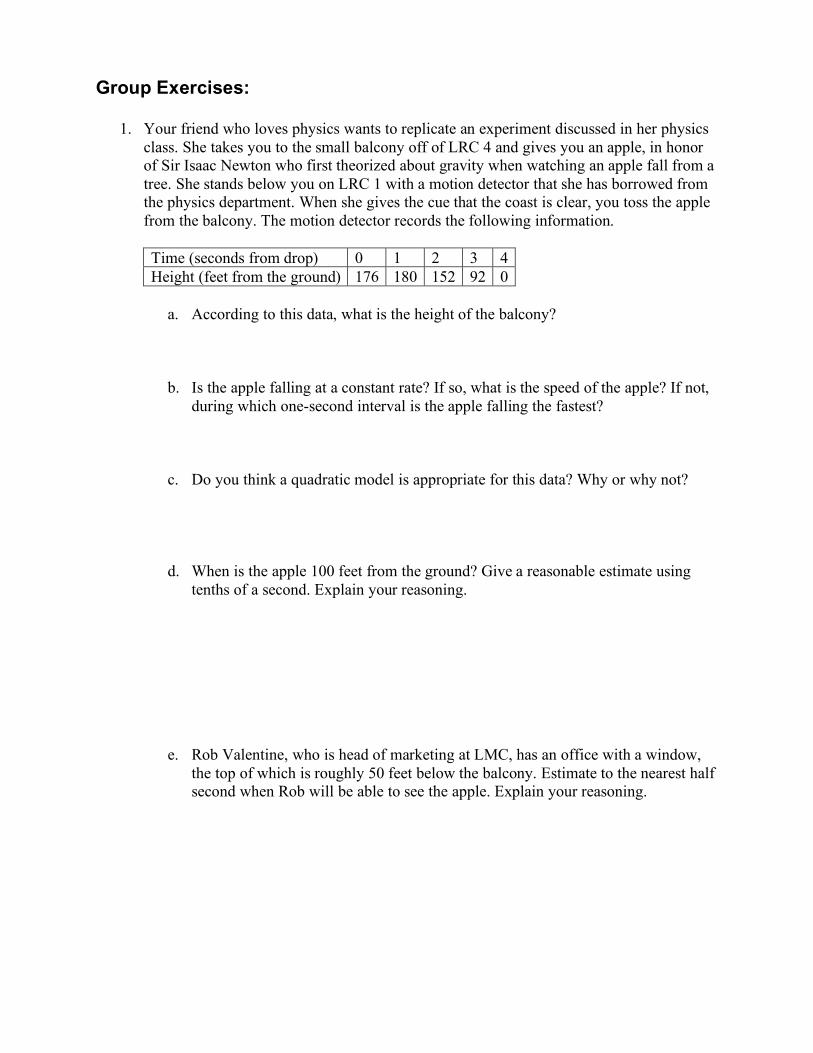
1. Your friend who loves physics wants to replicate an experiment discussed in her physics class. She takes you to the small balcony off of LRC 4 and gives you an apple, in honor of Sir Isaac Newton who first theorized about gravity when watching an apple fall from a tree. She stands below you on LRC 1 with a motion detector that she has borrowed from the physics department. When she gives the cue that the coast is clear, you toss the apple from the balcony. The motion detector records the following information.
Time (seconds from drop) 0 1 2 3 4 Height (feet from the ground) 176 180 152 92 0
a. According to this data, what is the height of the balcony? b. Is the apple falling at a constant rate? If so, what is the speed of the apple? If not,
during which one-second interval is the apple falling the fastest? c. Do you think a quadratic model is appropriate for this data? Why or why not? d. When is the apple 100 feet from the ground? Give a reasonable estimate using
tenths of a second. Explain your reasoning. e. Rob Valentine, who is head of marketing at LMC, has an office with a window,
the top of which is roughly 50 feet below the balcony. Estimate to the nearest half second when Rob will be able to see the apple. Explain your reasoning.

2. Pictured below is a sketch of a f(x) = ax2 + bx + c. Use the graph to estimate the following:
a. The value of f(2) b. The value(s) of x when f(x) = 3
c. Solve ax2 + bx + c = –4
d. Solve ax2 + bx + c = 0
e. Solve ax2 + bx + c = –5
3. A diver jumps upward from a platform that is 40 m above the water at an initial speed of 10 m/sec. The height h = f(t), in meters, of the diver above the water at time t (in seconds) is modeled by f(t) = –5t2 + 10t + 40.
a. Find the exact value(s) of f(3). Verify
that your answer makes sense by looking at the graph. Explain the meaning of f(3) in the context of the problem.
b. Find the exact value(s) of t for which f(t) = 3. Explain the meaning of the
solution(s) in the context of the problem.
c. Does the diver reach a height of 45 feet? Support your answer.
-4 -2 2 4
2
4
-2
-4 y = ax2 + bx + c
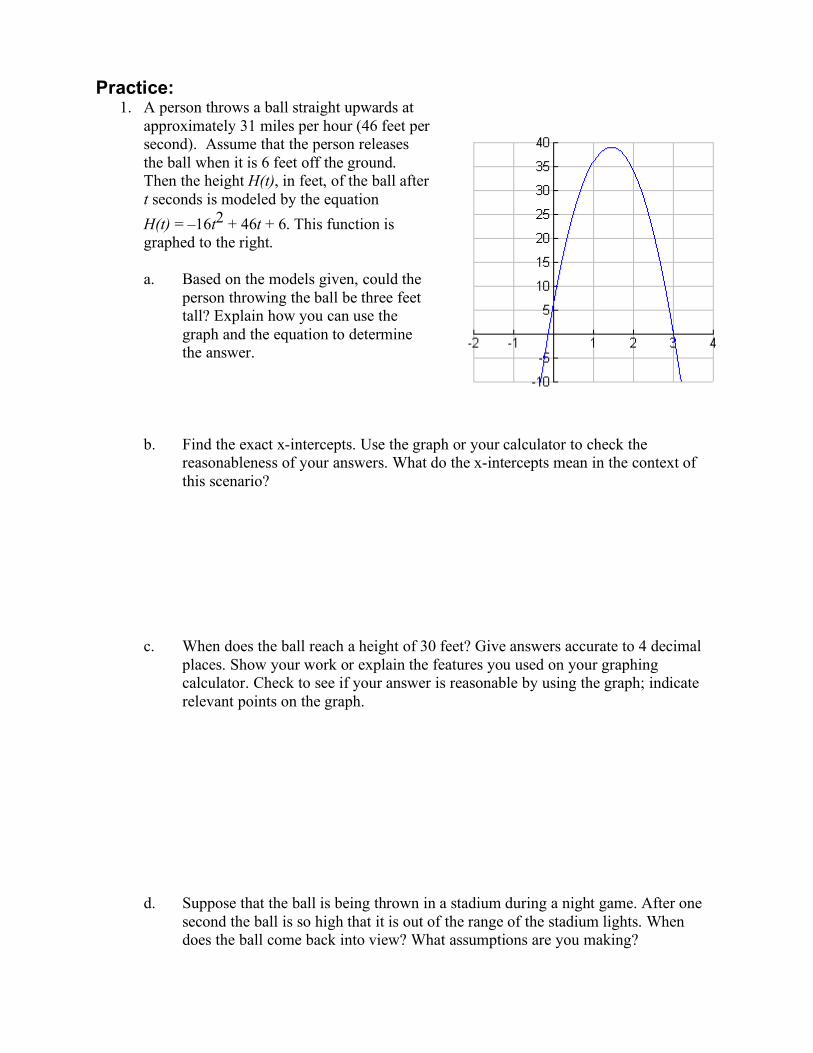
Practice: 1. A person throws a ball straight upwards at
approximately 31 miles per hour (46 feet per second). Assume that the person releases the ball when it is 6 feet off the ground. Then the height H(t), in feet, of the ball after t seconds is modeled by the equation H(t) = –16t2 + 46t + 6. This function is graphed to the right.
a. Based on the models given, could the
person throwing the ball be three feet tall? Explain how you can use the graph and the equation to determine the answer.
b. Find the exact x-intercepts. Use the graph or your calculator to check the
reasonableness of your answers. What do the x-intercepts mean in the context of this scenario?
c. When does the ball reach a height of 30 feet? Give answers accurate to 4 decimal places. Show your work or explain the features you used on your graphing calculator. Check to see if your answer is reasonable by using the graph; indicate relevant points on the graph.
d. Suppose that the ball is being thrown in a stadium during a night game. After one second the ball is so high that it is out of the range of the stadium lights. When does the ball come back into view? What assumptions are you making?

2. You are the head of the marketing division of a large company. Marketing research has shown that the company’s annual profit, P in thousands of dollars, is related to the amount spent on advertising, x in hundreds of thousands of dollars, by the quadratic function
!
P = f (x) = 230 + 20x " 0.5x2 . The CEO of the company is willing to spend up
to four million dollars on advertising this year. What advice do you have for the CEO? This CEO likes very precise information. He always wants very succinct advice, but he is also interested in the “whole picture”. While he may not be interested in the details of your analysis, he insists on full documentation in case he later wants to review the facts. Write a report that gives clear advice for the CEO and fits the above specifications.
Intermediate Algebra Name: _______________________ Unit 3 Activity 5: Quadratic Regression Why: In this activity we will use technology to find linear, exponential and quadratic models that best fit data. We will focus on how to choose the type of model and how to use the models to answer questions and make predictions. Learning Outcomes 1) Communication: Explain your reasoning in choosing a regression model. You’re your
problem-solving strategy in a neat and organized manner. 2) Problem-solving: Choose the best regression model. 3) Multiple Representations: Use technology to find regression models. Use intersection points
to solve systems of equations. 4) Applications and skills: Use regression models to make predictions. Find intersection points
to answer questions. 5) Effective Learner: Work productively in groups. Warm-up
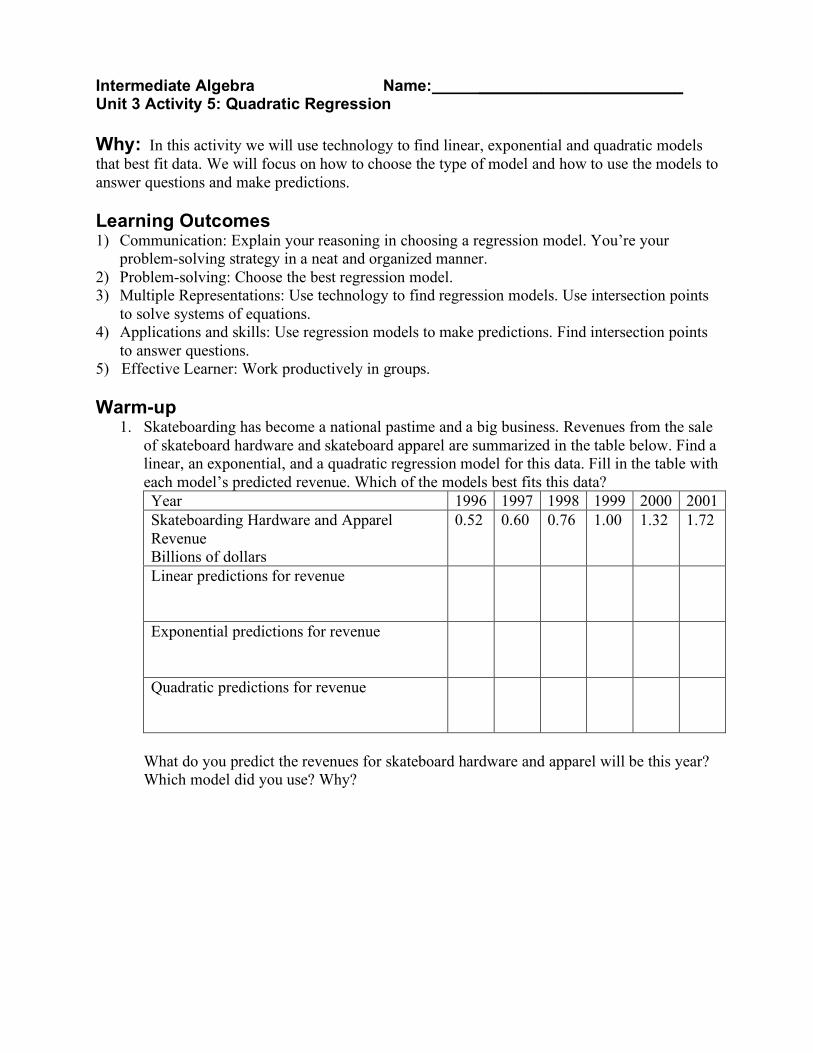
1. Skateboarding has become a national pastime and a big business. Revenues from the sale of skateboard hardware and skateboard apparel are summarized in the table below. Find a linear, an exponential, and a quadratic regression model for this data. Fill in the table with each model’s predicted revenue. Which of the models best fits this data? Year 1996 1997 1998 1999 2000 2001 Skateboarding Hardware and Apparel Revenue Billions of dollars
0.52 0.60 0.76 1.00 1.32 1.72
Linear predictions for revenue
Exponential predictions for revenue
Quadratic predictions for revenue
What do you predict the revenues for skateboard hardware and apparel will be this year? Which model did you use? Why?

Group Exercises: World population growth is monitored by the United Nations Population Division. The following data was gathered from www.undp.org/popin. This data is graphed below with both a quadratic and an exponential regression model.
year 1800 1850 1900 1950 1970 1980 1990 2000 Population in millions
980 1260 1650 2520 3700 4440 5270 6060
1. Should the UN use a quadratic or an
exponential function to model the world’s population? Support your answer.
2. What does each model predict the population will be in 2010?
3. When do the models give the same population estimates? What are the populations in those years? Document your process.
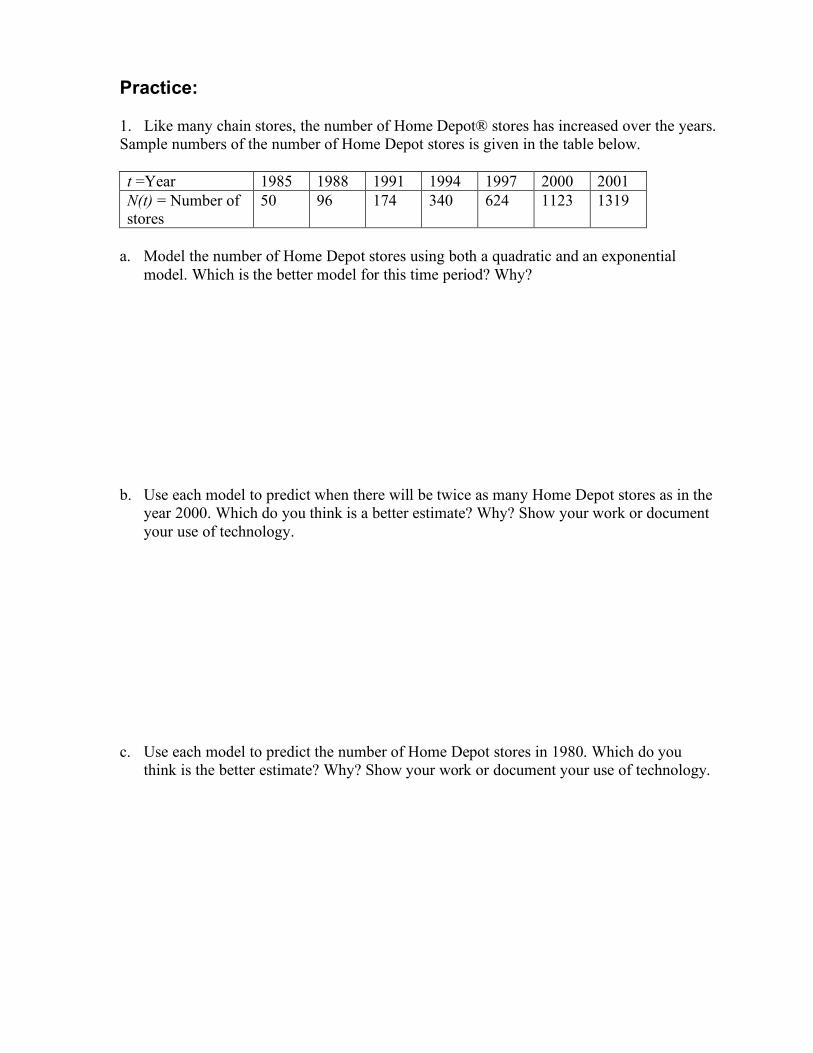
Practice: 1. Like many chain stores, the number of Home Depot® stores has increased over the years. Sample numbers of the number of Home Depot stores is given in the table below. t =Year 1985 1988 1991 1994 1997 2000 2001 N(t) = Number of stores
50 96 174 340 624 1123 1319
a. Model the number of Home Depot stores using both a quadratic and an exponential
model. Which is the better model for this time period? Why?
b. Use each model to predict when there will be twice as many Home Depot stores as in the year 2000. Which do you think is a better estimate? Why? Show your work or document your use of technology.
c. Use each model to predict the number of Home Depot stores in 1980. Which do you think is the better estimate? Why? Show your work or document your use of technology.
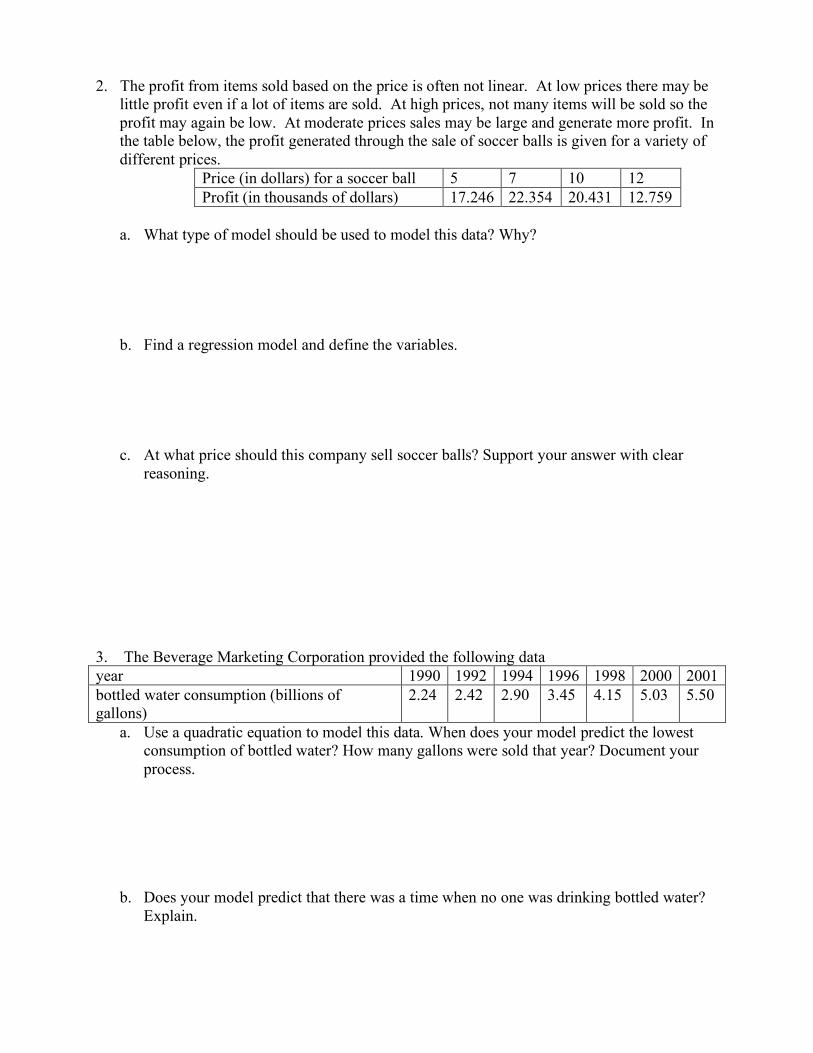
2. The profit from items sold based on the price is often not linear. At low prices there may be little profit even if a lot of items are sold. At high prices, not many items will be sold so the profit may again be low. At moderate prices sales may be large and generate more profit. In the table below, the profit generated through the sale of soccer balls is given for a variety of different prices.
Price (in dollars) for a soccer ball 5 7 10 12 Profit (in thousands of dollars) 17.246 22.354 20.431 12.759
a. What type of model should be used to model this data? Why?
b. Find a regression model and define the variables.
c. At what price should this company sell soccer balls? Support your answer with clear reasoning.
3. The Beverage Marketing Corporation provided the following data year 1990 1992 1994 1996 1998 2000 2001 bottled water consumption (billions of gallons)
2.24 2.42 2.90 3.45 4.15 5.03 5.50
a. Use a quadratic equation to model this data. When does your model predict the lowest consumption of bottled water? How many gallons were sold that year? Document your process.
b. Does your model predict that there was a time when no one was drinking bottled water? Explain.
5 10 15 20 25 30
-5
5
10
15
20
25
30
35
40
Number of Days
Ave
rage
Num
ber o
f W
ords
the
Gro
up
Rem
embe
rs
Intermediate Algebra Name: Unit 3 Activity 6: Rational Equations Due Date:
Draft 1/16/05
Why: This activity focuses on rational functions, which are fractions with variables in the denominator. We will not study rational functions in depth. Instead this will be an opportunity for you to apply the skills you have obtained this semester in problem-solving, communicating, applying mathematical reasoning to new settings, and using tables, graphs, and equations to answer questions. Obviously, we cannot cover every type of function that you are likely to encounter when using mathematics in your other courses or on the job. So it is important for you to leave Math 30 with the ability to think through new scenarios. Learning Outcomes: 1. Communication: Write clear, organized, and logical solutions with correct notation. Interpret
the meaning of solutions in the context of problem situations. 2. Problem-solving: apply the problem-solving process to problems that differ from those
studied in class. 3. Multiple Representations: Use info given in tabular, graphical, symbolic, and verbal form to
solve problems. 4. Applications and skills: Solve applications of rational equations. Use rational models in
applied contexts to make predictions and decisions. 5. Effective Learner: Actively participate in class activities. Group Exercises: 1. Psychologists study memory and learning. In an experiment on memory, students in a
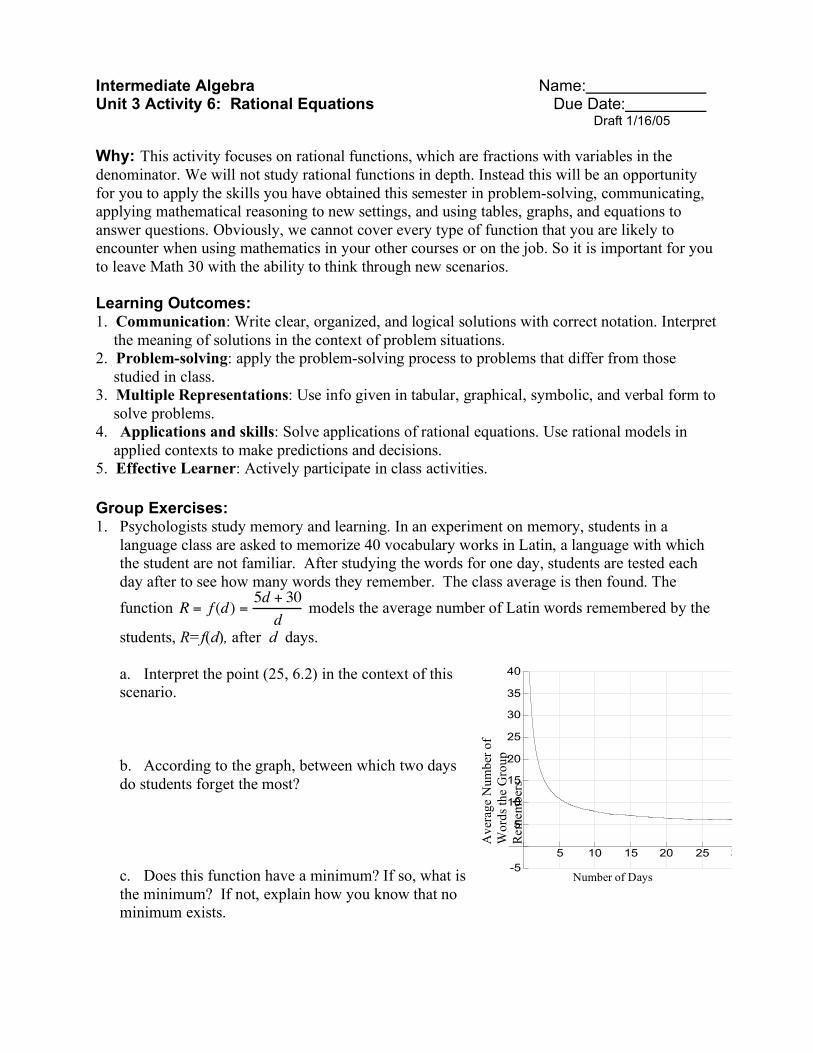
language class are asked to memorize 40 vocabulary works in Latin, a language with which the student are not familiar. After studying the words for one day, students are tested each day after to see how many words they remember. The class average is then found. The function R = f (d) =
5d + 30
d models the average number of Latin words remembered by the
students, R=f(d), after d days.
a. Interpret the point (25, 6.2) in the context of this scenario.
b. According to the graph, between which two days do students forget the most?
c. Does this function have a minimum? If so, what is the minimum? If not, explain how you know that no minimum exists.
d. What does this graph tell psychologists about memory? Be specific.
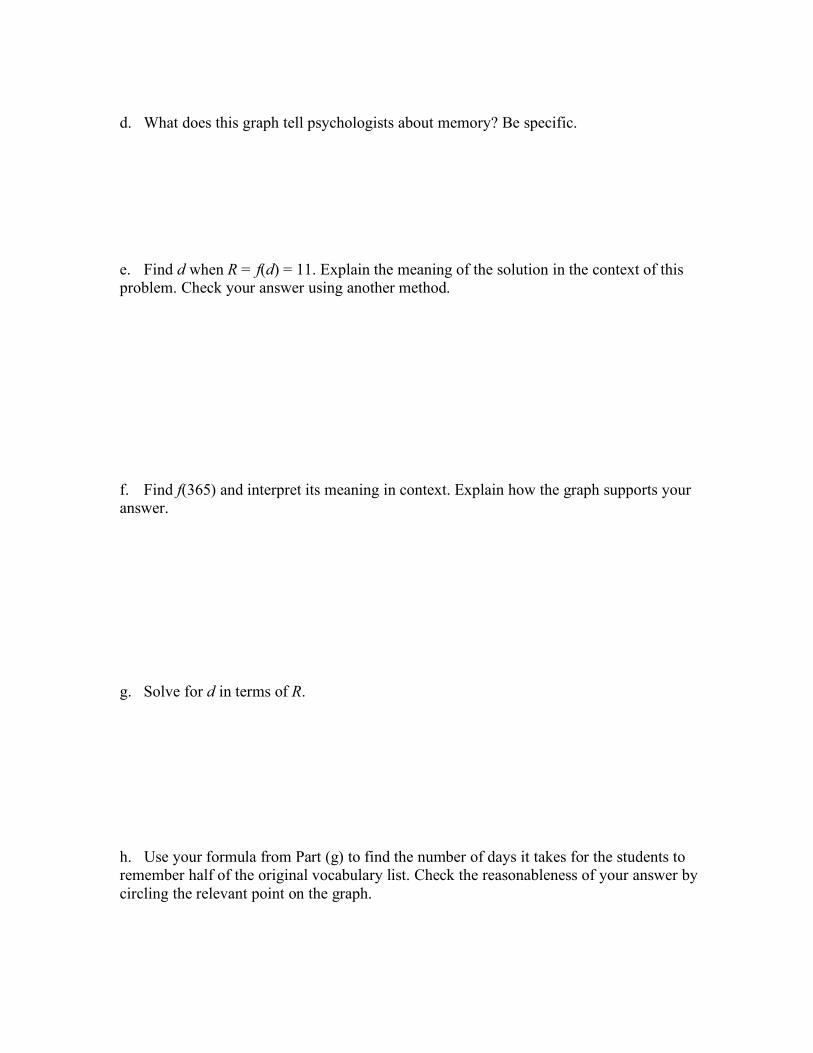
e. Find d when R = f(d) = 11. Explain the meaning of the solution in the context of this problem. Check your answer using another method.
f. Find f(365) and interpret its meaning in context. Explain how the graph supports your answer.
g. Solve for d in terms of R.
h. Use your formula from Part (g) to find the number of days it takes for the students to remember half of the original vocabulary list. Check the reasonableness of your answer by circling the relevant point on the graph.
50 100 150 200 250 300 350 400
500
1000
1500
2000
Yea
rly In
vent
ory
Cos
t
Cases of Soup Ordered
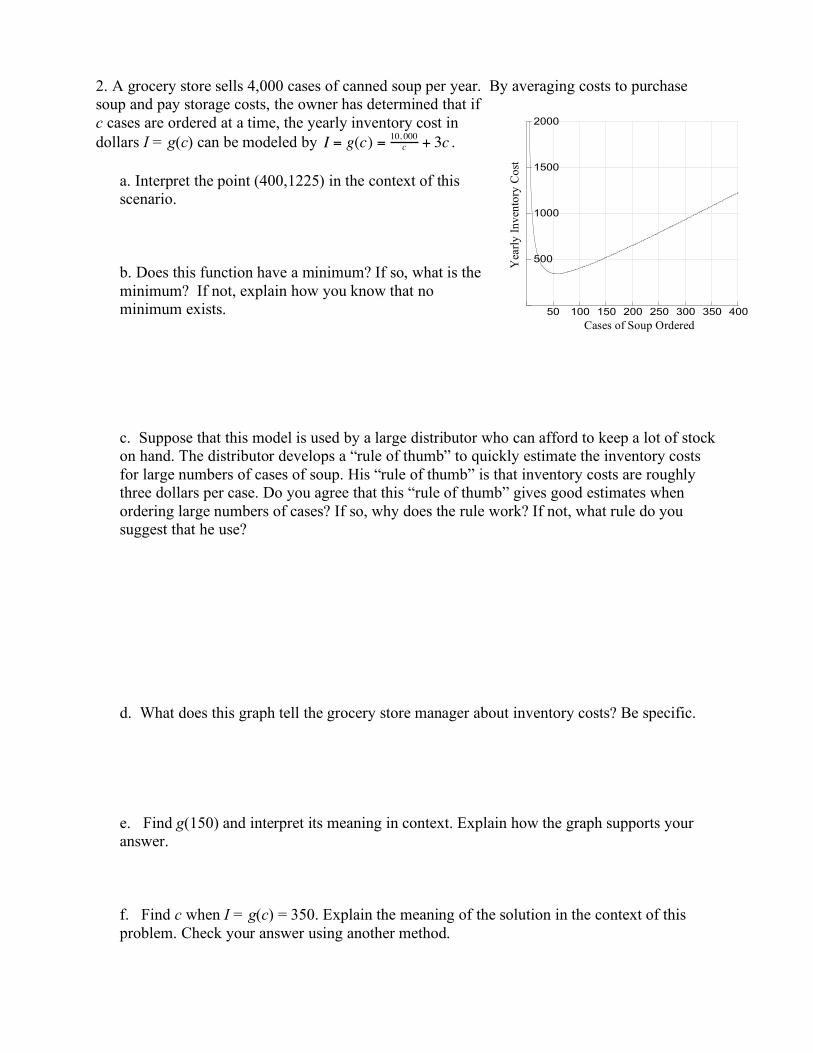
2. A grocery store sells 4,000 cases of canned soup per year. By averaging costs to purchase soup and pay storage costs, the owner has determined that if c cases are ordered at a time, the yearly inventory cost in dollars I = g(c) can be modeled by I = g(c) = 10, 000
c + 3c .
a. Interpret the point (400,1225) in the context of this scenario. b. Does this function have a minimum? If so, what is the minimum? If not, explain how you know that no minimum exists. c. Suppose that this model is used by a large distributor who can afford to keep a lot of stock on hand. The distributor develops a “rule of thumb” to quickly estimate the inventory costs for large numbers of cases of soup. His “rule of thumb” is that inventory costs are roughly three dollars per case. Do you agree that this “rule of thumb” gives good estimates when ordering large numbers of cases? If so, why does the rule work? If not, what rule do you suggest that he use? d. What does this graph tell the grocery store manager about inventory costs? Be specific. e. Find g(150) and interpret its meaning in context. Explain how the graph supports your answer. f. Find c when I = g(c) = 350. Explain the meaning of the solution in the context of this problem. Check your answer using another method.
3. The function C = h(x) =120x
100 ! x models the cost, C(x), in thousands of dollars, to remove x%
of a lake’s pollutants. a. The only values of x that have meaning in this scenario are [0,100]. (In other words, the only values of x that have meaning in this scenario are 0 ≤ x ≤ 100) Explain why this is true. b. Draw a graph of this function. Clearly label and scale your axes. c. An EPA official argues that it is cost effective to remove the first 75% of the pollutants. After that, she claims, there is less “bang for the buck”. Does the graph support this analysis? Explain. d. Does this function have a maximum? If so, what is the maximum? If not, explain how you know that no maximum exists.
e. Find C = h(15). Explain the meaning in the context of this problem. Indicate this point on your graph. f. Find the value of x for which h(x) = 80. Explain the meaning of the solution in the
context of this problem.
Practice: 1. When taking a trip, the connection between “distance,” “rate” and “time” is given by the
equation D = R*T. It is also understood that the total time for the trip is the sum of the times for the different parts or segments of the trip. Mathematically, the equation D = R*T can
be solved for time: DT
R
= , and so for a trip that has two parts or segments, the function for
the total time for the trip,T, would be 1 2
1 2
D DT
R R
= + where subscript “1” and “2” represent the
first and second part or segment of the trip.
For example, a trip from Pittsburg, CA, to Salem, Oregon, may be broken up into two parts because the maximum speed limit in California is different than in Oregon. The distance from Pittsburg to the Oregon border is 320 miles, and from the border to Salem is 260 miles. This would give a function for the total time in terms of the speed in Oregon as
T rR R
( ) = +320 260
1 2
.
a. Find the time for the whole trip if our average speed in California was 70 mph and our average speed in Oregon was 60 mph.
b. If we drove 70 mph in California, how fast would we have to drive in Oregon for the trip
to take a total of 10 hours?
c. If we drove 70 mph in California, how fast would we have to drive in Oregon for the trip to take a total of 9 hours?
d. Verify your answers in at least one additional representation.
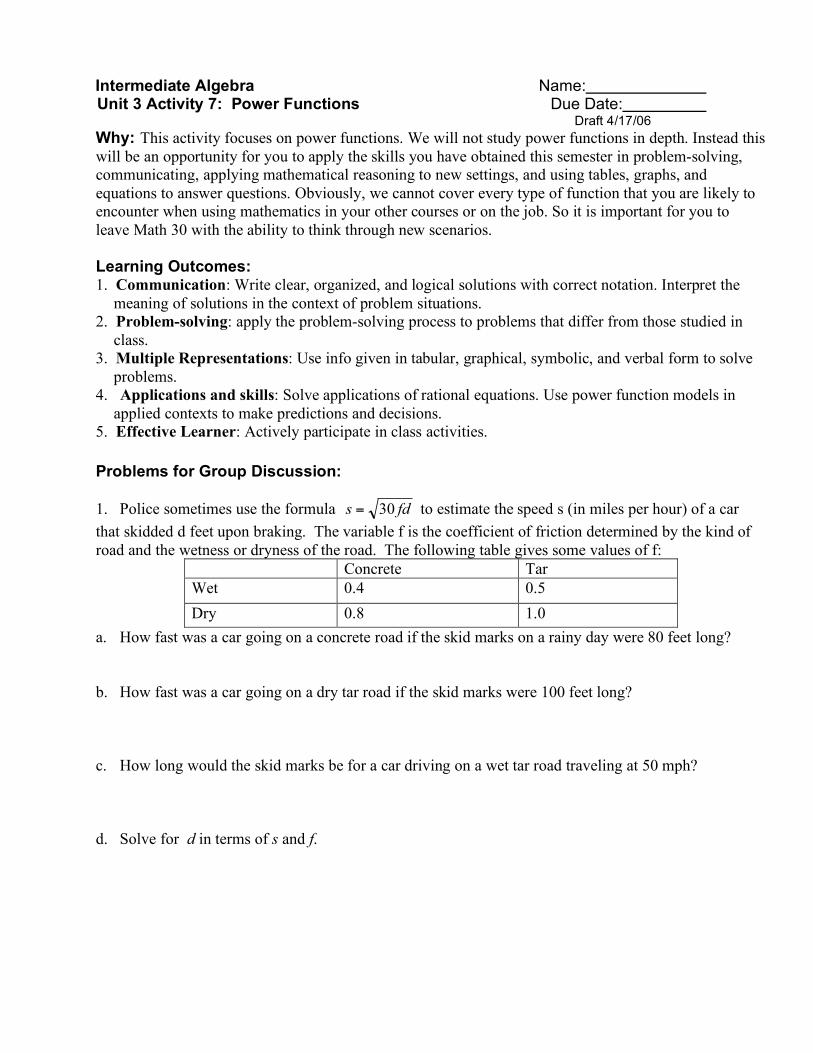
Intermediate Algebra Name: Unit 3 Activity 7: Power Functions Due Date:
Draft 4/17/06 Why: This activity focuses on power functions. We will not study power functions in depth. Instead this will be an opportunity for you to apply the skills you have obtained this semester in problem-solving, communicating, applying mathematical reasoning to new settings, and using tables, graphs, and equations to answer questions. Obviously, we cannot cover every type of function that you are likely to encounter when using mathematics in your other courses or on the job. So it is important for you to leave Math 30 with the ability to think through new scenarios. Learning Outcomes: 1. Communication: Write clear, organized, and logical solutions with correct notation. Interpret the
meaning of solutions in the context of problem situations. 2. Problem-solving: apply the problem-solving process to problems that differ from those studied in
class. 3. Multiple Representations: Use info given in tabular, graphical, symbolic, and verbal form to solve
problems. 4. Applications and skills: Solve applications of rational equations. Use power function models in
applied contexts to make predictions and decisions. 5. Effective Learner: Actively participate in class activities. Problems for Group Discussion:
1. Police sometimes use the formula s fd= 30 to estimate the speed s (in miles per hour) of a car that skidded d feet upon braking. The variable f is the coefficient of friction determined by the kind of road and the wetness or dryness of the road. The following table gives some values of f:
Concrete Tar Wet 0.4 0.5 Dry 0.8 1.0
a. How fast was a car going on a concrete road if the skid marks on a rainy day were 80 feet long? b. How fast was a car going on a dry tar road if the skid marks were 100 feet long? c. How long would the skid marks be for a car driving on a wet tar road traveling at 50 mph? d. Solve for d in terms of s and f.
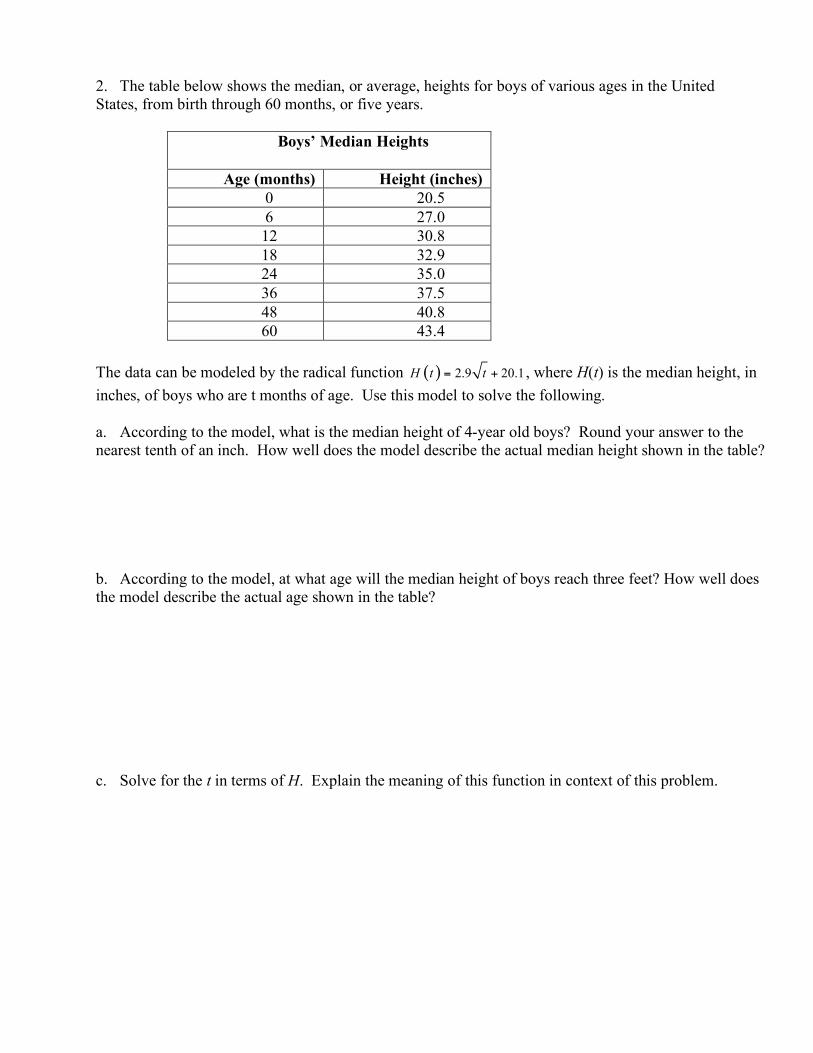
2. The table below shows the median, or average, heights for boys of various ages in the United States, from birth through 60 months, or five years.
Boys’ Median Heights
Age (months) Height (inches) 0 20.5 6 27.0 12 30.8 18 32.9 24 35.0 36 37.5 48 40.8 60 43.4
The data can be modeled by the radical function ( ) 2.9 20.1H t t= + , where H(t) is the median height, in inches, of boys who are t months of age. Use this model to solve the following. a. According to the model, what is the median height of 4-year old boys? Round your answer to the nearest tenth of an inch. How well does the model describe the actual median height shown in the table? b. According to the model, at what age will the median height of boys reach three feet? How well does the model describe the actual age shown in the table? c. Solve for the t in terms of H. Explain the meaning of this function in context of this problem.
Num
ber o
f Sur
vivo
rs
Age
Number of Survivors, by Age, from a Group of 50,000 Births.
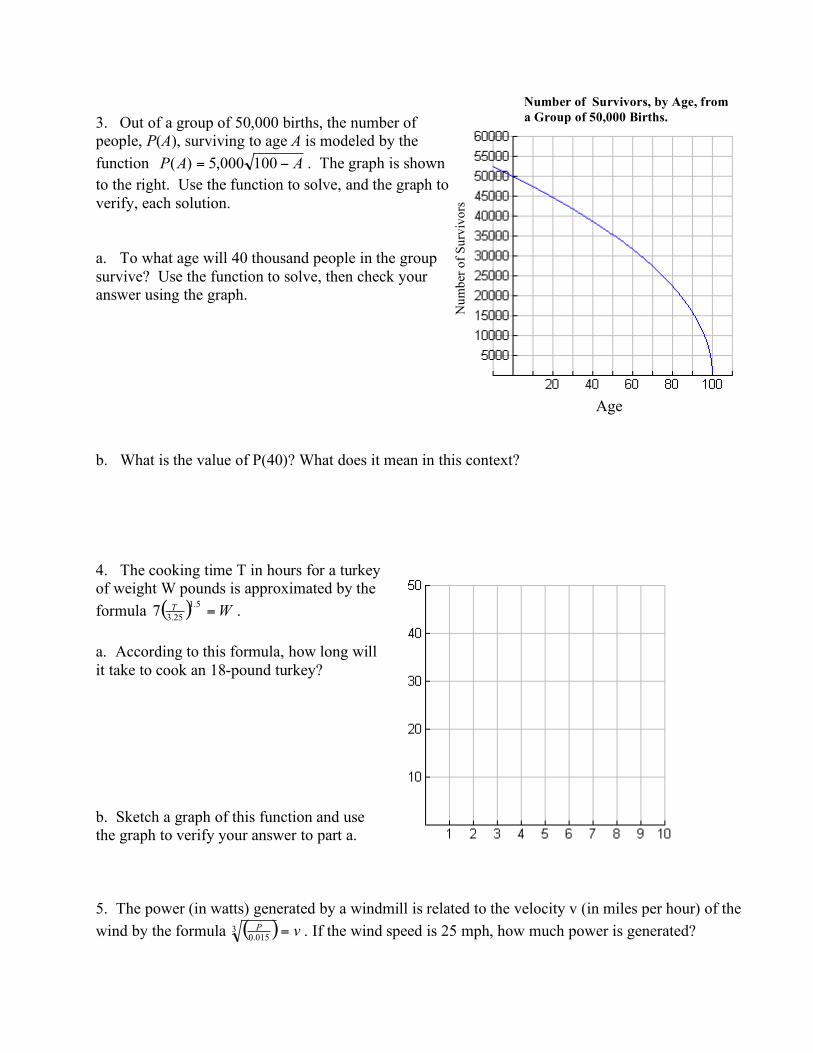
3. Out of a group of 50,000 births, the number of people, P(A), surviving to age A is modeled by the function AAP != 100000,5)( . The graph is shown to the right. Use the function to solve, and the graph to verify, each solution. a. To what age will 40 thousand people in the group survive? Use the function to solve, then check your answer using the graph. b. What is the value of P(40)? What does it mean in this context?
4. The cooking time T in hours for a turkey of weight W pounds is approximated by the formula ( ) W
T =5.1
25.37 .
a. According to this formula, how long will it take to cook an 18-pound turkey? b. Sketch a graph of this function and use the graph to verify your answer to part a. 5. The power (in watts) generated by a windmill is related to the velocity v (in miles per hour) of the wind by the formula ( ) v
P =3
015.0. If the wind speed is 25 mph, how much power is generated?