maternal deaths averted by contraceptive use: results from a
TRANSCRIPT

Maternal Deaths Averted by Contraceptive Use: Results from a Global Analysis of 172 countries
Saifuddin Ahmed, Qingfeng Li, Li Liu, Amy Tsui Population, Family and Reproductive Health Department
Johns Hopkins University Bloomberg School of Public Health
Corresponding author: Saifuddin Ahmed, MBBS, PhD Department of Population, Family and Reproductive Health Bloomberg School of Public Health Johns Hopkins University 615 North Wolfe Street #E4642 Baltimore, MD 21205 Tel:(410) 614-4952 e-mail: [email protected]

Abstract
Family planning is considered as one of the four pillars of safe motherhood program for reducing
high maternal mortality in developing countries. Early attempts to estimate the effect of family
planning on maternal mortality were fraught with gross data paucity. With the recent availability
of maternal mortality data from several countries and time-series data on contraceptive use, we
aim to reliably estimate the effect of contraceptive use on maternal mortality reduction at the
global level. We apply an innovative, counterfactual modeling approach replicating the WHO’s
maternal mortality estimation method, and estimate maternal deaths averted by contraceptive use
in 172 countries. We further examine the sensitivity of the results using a simpler births averted
approach by exploiting the relationship between contraceptive use and fertility decline in directly
estimating the number of maternal deaths averted. We use several data sources for this analysis:
WHO’s database for maternal mortality estimation; survey data on contraceptive use; and
information on births, female population size aged-15 to 49 years, and general fertility rates from
the United Nations World Population Prospects database, 2010. We estimate that in the absence
of contraceptive use the number of maternal deaths would be almost 266,000 higher than the
current level. In terms of maternal mortality reduction, this is equivalent of stating that
contraceptive use reduced maternal mortality by almost 44%. The percent reduction in maternal
deaths attributable to contraceptive use across the countries ranges between 7% and 60%. We
estimate a maternal deaths averted ratio (MDAR) of 27 per 100,000 women using contraceptive
methods per year. Increase in contraceptive prevalence rate in low performing countries could
further decline maternal deaths by 25% and reduce the burden on maternal health system for
serving more women effectively and efficiently in resource poor settings as skilled birth
attendance is likely increase in near future.

Introduction
Recent studies suggest that contraceptive use reduces almost 230 million births every
year and family planning remains as the major primary prevention strategy for unwanted
pregnancies (Liu, Becker et al. 2008; Singh, Darroch et al. 2009). The rapid reduction of global
fertility level in recent years from a total fertility rate (TFR) of 4.7 in early 1970s to 2.6 in late
2000s is predominately credited to increased contraceptive use rate. Although organized family
planning programs were introduced in early 1950s in developing countries primarily with a
demographic target to reduce population growth, soon the program emerges as a major public
health intervention in improving women’s health and survival of their children (Seltzer 2002).
Several studies examined the non-contraceptive health benefits of family planning
methods on women. Oral contraceptive is shown to reduce at least eight serious diseases and
other gynecological morbidities (Ory 1982; Jensen and Speroff 2000; Dayal and Barnhart 2001).
Contraceptive use is also shown to improve child survival through optimal child spacing,
lengthening birth intervals, and reducing sibling competition for scarce family and maternal
resources (Potts 1990; Rutstein 2005; DaVanzo, Hale et al. 2007; DaVanzo, Hale et al. 2008;
Yeakey, Muntifering et al. 2009)
The Safe Motherhood Initiative, launched in 1987 as a vertical program, proposed family
planning as one of the four pillars besides antenatal care, safe delivery, and postnatal care as a
strategic public health intervention to reduce maternal mortality in developing countries where
99% of global maternal deaths occur. The 1994 Cairo International Conference on Population
and Development (ICPD) reiterated the importance of family planning for improving women
health and directly linked the value of family planning to the reproductive health of individual

women (AbouZahr 1999). It is now widely acknowledged that family planning reduces maternal
mortality – both directly and indirectly (Stover and Ross 2010).
There are at least four causal mechanisms through which family planning can directly
reduce maternal deaths: reduce exposure to incidence of pregnancy, reduce vulnerability to
abortion risks, postpone pregnancies during prematurity of pelvis development by delaying the
first birth, and reduce the hazards of frailty from high parity pregnancies. Firstly contraceptive
use reduces the incidence of pregnancies and thus exposure to any risk of life threatening
pregnancy complications (exposure reduction). Second, contraceptive use reduces the risks of
abortions due to the reduction in the number of unwanted/unplanned pregnancies (vulnerability
reduction). Every year 50 million of the 190 million women who become pregnant resort to
abortions for terminating unwanted pregnancies and about 13% of maternal deaths are due to
abortion complications. These two reasons are the main causes attributable to family planning
contribution for reducing maternal mortality rate (MMRate), which measures the maternal
mortality risk per woman.
Contraceptive use also lowers the risk-per-birth, measured by maternal mortality ratio
(MMR), through modifying the excessive hazards associated with pregnancies “too early, too
late, too many, too close” (O'Loughlin 1997). Maternal mortality risk is higher at younger age
(below 18) when pelvic development may not have completed yet, and at older ages, and women
with high parity experience elevated risk. Empirical data in Matlab, Bangladesh show that
eliminating all births below 19 years and above 40 years would reduce maternal mortality by
34% and eliminating births above parity 5 would reduce the number of maternal deaths by
another 26 percent(Fortney 1987). An early estimation by Population Council shows that by
eliminating births during the “ages of reproductive inefficiency” and limiting births between ages

18-35 in the developing countries, it would be possible to reduce maternal mortality by 20%
(Berelson 1972). Some earlier studies, however, raised concern that the effect of family planning
on maternal mortality could be not substantial through theses mechanisms (Trussell and Pebley
1984; Winikoff and Sullivan 1987).
There are at least three other indirect mechanisms through which contraceptive use may
reduce maternal mortality: promote enabling in accessing maternity care; preserve healthy status;
and improve economic wellbeing of the family. Studies have shown that contraceptive users
are more likely to use antenatal care and safe delivery care from health professions (Jamieson
and Buescher 1992; Ahmed and Mosley 2002). A large number of studies in the past 20 years
have documented positive impact of family planning on women's physical health and well-being.
Women with high parity are more likely to experience anemia during pregnancy (Al-Farsi,
Brooks et al. 2011) and carry higher risks of dying from postpartum hemorrhage. A study in
India found that the contraceptive adopters had better standard of living (Avasarala 2009).
Improved economic status of family means less economic competition for family expenditures
on children (education, medical care, food, and clothing) and in case of need for emergency
obstetric care their family may be in a better position to meeting catastrophic out-of-pocket
expenses and willing to seek care.
Although significant progress has been made in reducing global maternal mortality from 546,000
in 1990 to 358,000 in 2008, in many countries Millennium Development Goal (MDG) 5 - reducing
maternal mortality three-quarters by 2015 - may not be achieved in many countries (World Health
Organization, UNICEF et al. 2010). Of the 358,000 maternal deaths, only 1700 deaths occur in developed
countries where contraceptive use rate is very high (72.4%).

In this paper we estimate the effect of family planning on reducing maternal mortality in
172 countries. We estimate the numbers of maternal deaths averted by contraceptive use (family
planning) at each country and globally for a recent year 2008 for which WHO published
maternal mortality estimates. We also present the results of a simulation analysis to show the
expected changes in maternal mortality reduction from the current level if we could increase
contraceptive prevalence rate (CPR) to a certain target level in countries with low prevalence.
Methods
Data sources
The data set for this analysis was compiled from three sources. We use WHO’s maternal
mortality estimation database which was used in reporting of the “Trends in Maternal Mortality:
1990 to 2008: Estimates developed by WHO, UNICEF, UNFPA and The World Bank” (World
Health Organization, UNICEF et al. 2010). The database was compiled by the Maternal
Mortality Estimation Inter-Agency Group (MMEIG). Based on the original sources of maternal
death information, the countries are divided in to three groups. Group A countries have complete
civil registration with good attribution of cause of death information. There were 63 countries,
mostly developed, belonged to this category. There were 85 countries in Group B which had
incomplete vital registration data, and maternal death data were mostly from surveys. Twenty
four countries had no maternal deaths data, and were categorized in to Group C.
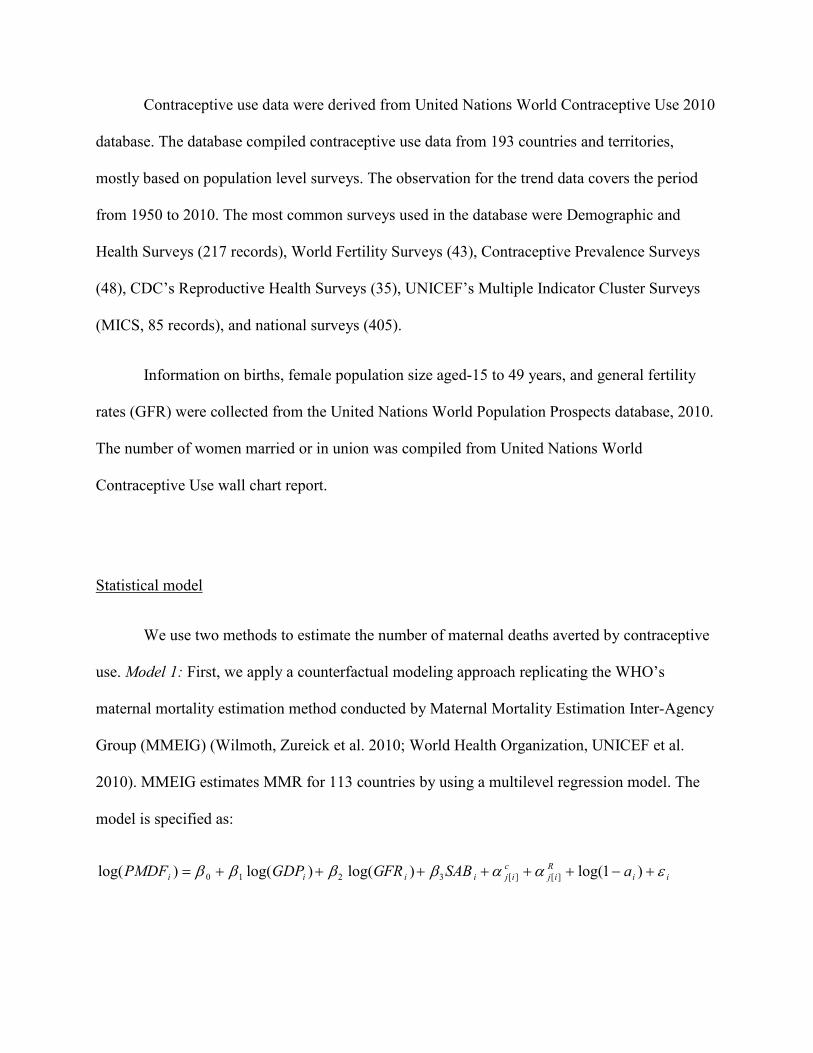
Contraceptive use data were derived from United Nations World Contraceptive Use 2010
database. The database compiled contraceptive use data from 193 countries and territories,
mostly based on population level surveys. The observation for the trend data covers the period
from 1950 to 2010. The most common surveys used in the database were Demographic and
Health Surveys (217 records), World Fertility Surveys (43), Contraceptive Prevalence Surveys
(48), CDC’s Reproductive Health Surveys (35), UNICEF’s Multiple Indicator Cluster Surveys
(MICS, 85 records), and national surveys (405).
Information on births, female population size aged-15 to 49 years, and general fertility
rates (GFR) were collected from the United Nations World Population Prospects database, 2010.
The number of women married or in union was compiled from United Nations World
Contraceptive Use wall chart report.
Statistical model
We use two methods to estimate the number of maternal deaths averted by contraceptive
use. Model 1: First, we apply a counterfactual modeling approach replicating the WHO’s
maternal mortality estimation method conducted by Maternal Mortality Estimation Inter-Agency
Group (MMEIG) (Wilmoth, Zureick et al. 2010; World Health Organization, UNICEF et al.
2010). MMEIG estimates MMR for 113 countries by using a multilevel regression model. The
model is specified as:
iiRij
cijiiii aSABFRGGDPPMDF εααββββ +−++++++= )1log()log()log()log( ][][3210

Where, PMDF is the proportion of maternal deaths among all female deaths of reproductive age,
GDP is the gross domestic product per capita in 2005 PPP dollars, SAB is proportion of women
received skilled attendance at birth, and α terms are random intercepts for the country and
geographical regions, respectively, and ai is the proportion of AIDS deaths among total deaths to
women aged 15-49.
We have respecified this model and included a term for contraceptive use (CU) as:
iiRij
cijiiiii aCUSABFRGGDPPMDF εααβββββ +−+++++++= )1log()log()log()log( ][][33210
Our preliminary examination of data suggests a non-linear relationship between CU and
PMDF (Fig. 1), and as a result, we also included a quadratic term of CU in the model. Note that
a similar approach was adopted by IHME in estimating maternal mortality published in the
Lancet where a term for AIDS prevalence was used to examine the impact of HIV on maternal
mortality (Hogan, Foreman et al. 2010). Because the number of categories in the region was
small, which is likely to violate the normality assumption of random-term variance, we used the
regions as fixed-effects.
WHO prefers to use PMDF, rather than directly modeling maternal deaths or maternal
mortality ratio in the equation. It is considered that PMDF is more reliable and stable than
MMR. The maternal mortality ratio (MMR) is estimated by the multiplying the PMDF with D/B,
where D is the number of female deaths at ages 15-49 and B is the number of live births from
UN population estimates.

MMEIG estimates MMR for countries which lack reliable maternal mortality data from
the above prediction model, but use the observed MMR estimates with a correction factor (for
correcting underestimation in VR) for countries with good civil registration system (Group A),
with minor exceptions. Because of our respecification of the original model, we need to use
results from prediction model for all the countries because our interest is to examine the
counterfactual effect of contraceptive use on maternal mortality. As a result, our MMR
estimation differs slightly from the original reported MMR in the WHO report.
Data on contraceptive use were available only for the survey years and to match with the
years for maternal mortality data availability, we extrapolated CPR for the corresponding years
using demographic projection method with a random-effects model with splines. The
corresponding observed and predicted CPRs are shown in Fig. 2. The correlation between
observed and predicted CPR was 0.993.
Model-II: Our second approach is based on the early work of Liu, Becker, Tsui and
Ahmed (2008) for births averted estimation. In this simpler approach we first estimated births
averted by contraceptive use and then directly estimated the number of maternal deaths averted
by applying the MMR estimated reported by WHO. In this method, we exploit the relationship
between population level fertility and contraceptive use. Figure 3 shows the inverse relationship
between general fertility rate (GFR), number of births per 1,000 women of reproductive age, and
contraceptive use.
Liu et al. (2008) used a linear quadratic model to quantify the extent of the relationship
by using the following equation:

ii CPRCPRGFR εβββ +++= 2310
and estimated potential GFR as:
)( 2310 CPRCPRGFRGFR Observed
iPotentiali βββ ++−= .
However, we recognize that the relationship between GFR and contraceptive use is contextual
dependent.GFR in a county is also affected the extent of sexual union, fecundity, and the
availability of abortion services. Moreover, contraceptive use effectiveness varies significantly
across the countries, depending on the use rates of more effective methods like sterilization and
IUD. In many countries the use sterilization is very low or almost absent. To address
heterogeneity, we fitted a random-coefficient model as follows:
tiiiititit CPRCPRCPRGFR ενυβββ +++++= 2310
The numbers of births averted (BAi) were estimated by:
4915*1000/)[( −−= WGFRGFRBA Observedli
Potentialii
And the numbers of maternal deaths averted (MDA) were estimated by:
000,100/* ii MMRBAMDAi
=
All statistical analyses were performed with Stata (version 11).

Results
Table 1 shows the Model-I estimation of MMR, current numbers of maternal deaths,
expected (hypothetical) numbers of maternal deaths in the absence of contraceptive use, and the
numbers of maternal deaths averted for each country, including the input data on contraceptive
prevalence rate (CPR). Our estimated number of maternal deaths (342,545) based on the revised
model specification are slightly lower than the WHO’s reported number of global maternal
deaths (358,000).The maternal mortality estimation for the corresponding period by IHME was
342,900 maternal deaths.
We estimate that in the absence of contraceptive use the number of maternal deaths
would be 608,534, almost 78% higher than the current level. In terms of maternal mortality
reduction, this is equivalent of stating that contraceptive use reduced maternal mortality by
almost (1-342,545/608,534)= 44%. The percent reduction attributable to contraceptive use
across the countries ranges between 7% to 60%. Interesting, an examination of the relationship
between CPR and percent reduction, shown in Fig. 4, suggests that the gain in maternal mortality
reduction plateau after CPR of 60%. This graph further suggests that the countries with low CPR
will achieve most gains in the improvement of maternal mortality reduction with improved CPR.
Most of these countries are located in sub-Saharan Africa.
Approximately 1,016 million women of reproductive age use contraceptive methods
worldwide, and we estimate that approximately 27 maternal deaths are prevented by every
100,000 women using a contraceptive method during a year.

Table 2 presents the results from Model-II analyses. The results are similar to the results
from Model-I, with slight lower effect on mortality reduction (42%).
We additionally examine the hypothetical effect of improving contraceptive prevalence
rates in low prevalence countries. Table 3 shows that 46 of the 167 countries for which data were
available, 46 countries have CPR 70% or more. In contrast, there are still several countries in
which CPR levels are below 10%. In 25 countries, contraceptive use rate is still below 20, and a
total of 51 countries have CPR less than 40%. Many developing countries, even with limited
socioeconomic development, such as Bangladesh, significantly improved CPR. We next examine
the potential effect of improving CPR in low prevalence countries on maternal mortality
reduction.
Fig. 5 shows the expected reduction in global maternal deaths if low level countries
attain at least a specified CPR target (with the countries with higher CPR levels kept constant).
The graph suggests that attaining contraceptive prevalence rate at least 40% by countries with
lower levels would reduce the number of maternal deaths to below 300,000 from the estimated
current level. About 25% maternal mortality reduction is anticipated with the achievement of
50% CPR.
Conclusion
The difference in the reproductive health status of women in developed and developing countries
is vast. Worldwide about 358,000 women and 3 million newborn babies die every year because
of complications related to pregnancy and childbirth. Almost all these deaths (99%) occur in
developing countries and are potentially preventable.

In this paper we examine the effect of family on reducing maternal mortality and our
results suggest that family planning potentially reduced over almost 44% of maternal death
globally. In the absence of family planning program and contraceptive use, maternal mortality
would be 77% higher.
The leading causes of maternal mortality are hemorrhage, hypertensive disorders, sepsis,
obstructed labor and complications from unsafe abortion, and all of these conditions need
emergency medical care to prevent deaths. It is now recognized that the life threatening
complications during pregnancy may not be anticipated in advance and screening during
antenatal period is ineffective in predicting or preventing maternal complications. Providing
universal access to quality maternal health services and ensuring skilled attendance at delivery
are the key action strategies for safe motherhood initiative. More than two-thirds of women,
however, still deliver at home, and progress in improving delivery care by skilled birth attendants
(SBA) remains very slow. To reduce maternal mortality ratio, we must improve access to quality
of maternal health care, skilled birth attendance at birth, and access to emergency obstetric care.
But, let’s not forget that in many countries fertility level is still high and women are repeatedly
exposed to the risks of life threatening maternal complications and are vulnerable to higher risk.
It is possible to reduce such shocks with effective contraceptive use. In the countries where
maternal mortality ratios are highest, contraceptive prevalence rates are also low.
The paper provides evidence of using contraceptives in tackling maternal mortality
problems in developing countries. As rightfully family planning has been included in the Safe
Motherhood Initiative as one of the four pillars, we consider that promoting contraceptive use,
especially in low prevalence countries, should be major tenet in targeting overall improvement in
women’s wellbeing as a public health agenda.

Figures
Figure 1: The relationship between contraceptive prevalence rate (CPR) and log of PMDF (proportion Maternal among Female Deaths aged 15-49)
-8-6
-4-2
0log PMDF
0 20 40 60 80 100Contraceptive prevalence rate

4
Figure 2: The relationship between observed contraceptive prevalence rate (CPR) and predicted CPR
020
4060
80100
Predicted CPR
0 20 40 60 80 100Observed CPR

Figure 3: The relationship between contraceptive prevalence rate (CPR) and general fertility rate (GFR)
050
100
150
200
250
General fertility rate (GFR)
Births per 1000 women [15-49]
0 20 40 60 80 100Contraceptive prevalence rate

Figure 4: The relationship between contraceptive prevalence rate (CPR) and the rate of maternal mortality reduction
Chad
AngolaMaliGuinea
Guinea-Bissau
BurundiEquatorial Guinea
Cote d'Ivo ireNigeriaDj iboutiGambia
BeninTogo
Centra l African Repub lic
Democratic Republ ic of the Congo
Saudi Arabia
ComorosCameroon
TanzaniaHai ti
Uni ted Arab EmiratesSo lomon IslandsPapua New Gu ineaBel izeGuyanaLaoCambodia
MyanmarTrinidad and TobagoKenyaCongo
Nepa lGeorgiaQatarSwazi land
Sie rra Leone
SudanEritreaMauri tania
L iberiaNigerSenegal
Eth iopiaSomal ia
MozambiqueBurkina Faso
Timor-Leste
Afghanis tan
GhanaUganda
YemenRwandaPakistan
Bhutan
OmanGabonMadagascarMa ldivesTaj ikis tanBosnia and Herzegov inaMalawiZambia
MontenegroLeso thoSerbiaGuatemalaSuriname
Bots wanaIraq
020
4060
80Percent reduction in maternal deaths
0 20 40 60 80 100Contraceptive prevalence rate (CPR)

Figure 5: Expected reduction in global maternal deaths if low level countries attain at least a specified CPR target (countries with higher CPR levels kept constant)
Current: 352,361
0 5 1015
20
25
30
35
40
45
50
55
60
65
70
05
1015
2025
3035
4045
50% reduction in MMR with countries
at least the specified CPR
100000
200000
300000
400000
Annual number of maternal deaths
0 5 10 15 20 25 30 35 40 45 50 55 60 65 70Contraceptive Prevalence Rate

Tables Table 1: Maternal deaths averted by contraceptive use in 172 countries estimated by Model-I. Country CPR MMR Observed
Maternal Deaths
Expected Deaths without
contraceptive Use
Maternal deaths averted
Expected % of maternal deaths averted
Afghanistan 20.5 1364 17332 25887 8555 33.0
Albania 68.0 31 14 35 21 59.1
Algeria 61.5 130 929 2199 1270 57.8
Angola 7.8 609 4725 5577 852 15.3
Argentina 68.1 49 336 820 485 59.1
Armenia 55.5 29 14 31 18 56.1
Australia 73.5 8 20 51 30 59.8
Austria 59.8 5 4 9 5 57.3
Azerbaijan 53.2 39 63 142 79 55.3
Bahamas 75.4 36 2 5 3 59.9
Bahrain 70.2 19 3 6 4 59.4
Bangladesh 57.6 319 10974 25354 14380 56.7
Barbados 69.9 65 2 5 3 59.3
Belarus 72.9 23 22 55 33 59.7
Belgium 76.5 5 6 15 9 60.0
Belize 38.0 72 5 10 5 48.0
Benin 18.0 409 1395 1998 603 30.2
Bhutan 31.7 235 35 62 27 43.5
Bolivia 60.4 162 426 1002 576 57.5
Bosnia and Herzegovina 38.4 10 3 6 3 48.2
Botswana 48.7 77 36 78 42 53.6
Brazil 81.0 74 2303 5786 3483 60.2
Brunei Darussalam 52.3 22 2 4 2 55.0
Bulgaria 77.8 19 13 34 20 60.1
Burkina Faso 17.1 493 3530 4970 1440 29.0
Burundi 11.7 863 2394 3052 658 21.6
Cambodia 39.4 256 924 1804 881 48.8
Cameroon 29.2 727 5108 8736 3628 41.5
Canada 77.5 7 23 58 35 60.1
Cape Verde 62.2 44 5 13 7 57.9
Central African Republic 20.5 1052 1620 2421 801 33.1
Chad 3.3 1468 7313 7863 550 7.0

Chile 64.8 27 68 163 95 58.5
China 85.7 36 6450 16189 9739 60.2
Colombia 79.4 76 702 1762 1060 60.2
Comoros 28.0 206 44 74 30 40.5
Congo 45.4 509 636 1327 691 52.1
Costa Rica 83.0 35 26 66 40 60.2
Cote d'Ivoire 13.8 531 3835 5091 1255 24.7
Croatia 86.0 8 4 9 5 60.1
Cuba 73.8 43 51 127 76 59.8
Cyprus 54.5 13 1 3 2 55.7
Czech Republic 75.3 7 7 18 11 59.9
Democratic People's Republic of Korea
71.3 121 396 979 583 59.5
Democratic Republic of the Congo
22.9 539 15560 24166 8606 35.6
Denmark 87.1 5 3 8 5 60.1
Djibouti 16.1 336 81 112 31 27.7
Dominican Republic 68.8 86 192 470 278 59.2
Ecuador 73.8 131 367 913 546 59.8
Egypt 60.8 60 1210 2852 1642 57.6
El Salvador 71.5 119 148 365 218 59.6
Equatorial Guinea 11.8 323 81 103 22 21.7
Eritrea 9.1 385 698 846 148 17.5
Estonia 78.1 21 3 8 5 60.1
Ethiopia 14.2 410 12660 16923 4262 25.2
Fiji 71.3 22 4 10 6 59.5
Finland 86.6 5 3 7 4 60.1
France 78.5 8 62 155 93 60.1
Gabon 35.5 392 155 289 134 46.3
Gambia 16.4 325 198 276 78 28.2
Georgia 48.4 46 24 52 28 53.4
Germany 80.1 7 43 109 66 60.2
Ghana 22.3 376 2839 4366 1527 35.0
Greece 75.3 3 4 9 5 59.9
Guatemala 45.4 83 374 781 407 52.1
Guinea 9.2 710 2784 3382 598 17.7
Guinea-Bissau 10.4 841 546 679 133 19.6
Guyana 38.4 225 31 59 29 48.2
Haiti 32.9 311 849 1528 680 44.5
Honduras 66.3 87 175 425 249 58.8
Hungary 87.0 10 10 26 16 60.1
Iceland 78.0 5 0 1 0 60.1
India 57.6 240 64531 149086 84555 56.7

Indonesia 60.2 277 11686 27460 15774 57.4
Iran 76.6 39 537 1342 806 60.0
Iraq 49.8 59 553 1203 650 54.0
Ireland 69.1 4 3 6 4 59.2
Israel 81.0 7 10 25 15 60.2
Italy 70.4 4 22 55 33 59.4
Jamaica 71.5 80 42 103 62 59.6
Japan 54.1 8 83 188 104 55.6
Jordan 58.4 58 91 211 120 56.9
Kazakhstan 54.0 77 231 520 289 55.6
Kenya 44.4 377 5654 11670 6015 51.5
Kuwait 58.4 7 4 8 5 57.0
Kyrgyzstan 50.6 80 96 211 115 54.3
Lao 38.7 294 500 968 468 48.4
Latvia 75.2 29 7 17 10 59.9
Lebanon 60.6 25 16 39 22 57.5
Lesotho 43.9 742 441 906 465 51.3
Liberia 11.6 983 1429 1819 390 21.4
Libyan Arab Jamahiriya 54.5 73 107 241 134 55.7
Lithuania 60.7 18 5 13 7 57.6
Luxembourg 78.0 8 0 1 1 60.1
Madagascar 36.0 342 2348 4403 2055 46.7
Malawi 39.3 594 3558 6947 3389 48.8
Malaysia 64.4 27 151 362 211 58.4
Maldives 37.2 41 2 5 2 47.4
Mali 8.6 872 4721 5664 943 16.6
Malta 90.5 8 0 1 0 59.9
Mauritania 9.3 621 669 815 145 17.8
Mauritius 78.3 35 6 16 9 60.1
Mexico 73.1 62 1268 3149 1881 59.7
Mongolia 68.7 83 41 101 60 59.2
Montenegro 42.3 16 1 2 1 50.5
Morocco 65.0 125 804 1939 1135 58.5
Mozambique 16.4 709 6215 8639 2425 28.1
Myanmar 41.1 231 2350 4684 2334 49.8
Namibia 54.8 184 108 244 137 55.9
Nepal 46.7 393 2883 6094 3211 52.7
Netherlands 69.3 9 16 39 23 59.3
New Zealand 81.1 11 6 16 10 60.2
Nicaragua 72.8 102 142 353 211 59.7
Niger 11.7 772 6090 7767 1677 21.6
Nigeria 14.6 815 49053 65986 16933 25.7
Norway 89.0 6 3 9 5 60.0

Oman 34.1 25 15 28 13 45.3
Pakistan 29.3 258 13778 23602 9824 41.6
Panama 73.0 69 48 120 71 59.7
Papua New Guinea 36.2 227 469 882 413 46.8
Paraguay 77.4 110 169 423 254 60.1
Peru 72.8 90 547 1356 810 59.7
Philippines 50.7 100 2242 4911 2670 54.4
Poland 82.6 8 28 70 42 60.2
Portugal 87.1 7 8 19 12 60.1
Puerto Rico 85.3 16 8 21 13 60.2
Qatar 49.0 13 2 4 2 53.7
Republic of Korea 80.8 12 56 140 85 60.2
Republic of Moldova 69.3 39 17 43 25 59.3
Romania 71.5 38 81 201 120 59.6
Russian Federation 81.8 54 837 2103 1266 60.2
Rwanda 28.2 331 1333 2247 914 40.7
Saudi Arabia 24.9 24 142 228 86 37.6
Senegal 12.5 420 1969 2550 580 22.8
Serbia 44.5 12 14 28 14 51.6
Sierra Leone 7.0 963 2146 2491 344 13.8
Singapore 68.6 8 3 7 4 59.2
Slovakia 83.9 8 4 11 7 60.2
Slovenia 84.9 8 1 4 2 60.2
Solomon Islands 35.7 93 15 27 13 46.4
Somalia 14.7 798 3154 4254 1100 25.9
South Africa 62.1 220 2401 5704 3303 57.9
Spain 68.4 4 20 49 29 59.1
Sri Lanka 69.4 35 129 317 188 59.3
Sudan 8.0 672 8706 10324 1618 15.7
Suriname 46.8 117 11 24 13 52.7
Swaziland 49.9 200 70 153 83 54.1
Sweden 80.6 4 5 11 7 60.2
Switzerland 87.3 5 4 9 6 60.1
Syrian Arab Republic 57.7 42 246 569 323 56.8
TFYR Macedonia 57.1 15 3 8 4 56.6
Tajikistan 38.2 40 77 149 72 48.1
Tanzania 31.4 674 11929 21040 9110 43.3
Thailand 76.7 22 217 543 326 60.0
Timor-Leste 18.5 359 158 227 70 30.7
Togo 18.6 501 1067 1543 476 30.9
Trinidad and Tobago 43.6 51 10 21 11 51.2
Tunisia 62.0 65 107 254 147 57.9
Turkey 72.8 23 310 769 459 59.7

Turkmenistan 64.3 52 57 138 81 58.4
Uganda 22.9 275 4025 6255 2230 35.7
Ukraine 67.0 42 194 471 277 58.9
United Arab Emirates 35.3 14 9 16 7 46.2
United Kingdom 83.6 7 55 138 83 60.2
United States of America 78.2 13 575 1443 867 60.1
Uruguay 78.8 31 15 39 23 60.1
Uzbekistan 66.8 30 169 410 241 58.9
Venezuela 73.7 61 366 910 544 59.8
Viet Nam 79.2 44 662 1661 999 60.2
Yemen 27.4 212 1793 2986 1193 39.9
Zambia 39.9 286 1552 3050 1498 49.1
Zimbabwe 61.2 827 3128 7394 4266 57.7
Total 342,545 608,534 265,989 43.7

Table 2: Maternal deaths averted by contraceptive use in 167 countries estimated by Model-II.
Country MMR Current maternal deaths
Maternal deaths averted
Expected % of maternal deaths
averted Afghanistan 1400 18643 4033 17.79 Albania 31 13 43 77.26 Algeria 120 854 1570 64.78 Angola 610 4549 295 6.08 Argentina 70 476 927 66.07 Armenia 29 14 35 72.18 Australia 8 20 63 75.75 Austria 5 4 15 78.44 Azerbaijan 38 66 141 68.11 Bahamas 49 3 4 58.48 Bahrain 19 3 3 53.44 Bangladesh 340 10565 13702 56.46 Barbados 64 3 7 71.74 Belarus 15 16 75 82.69 Belgium 5 6 19 77.16 Belize 94 7 5 40.80 Benin 410 1377 302 17.99 Bhutan 200 31 23 42.35 Bolivia 180 470 409 46.53 Bosnia and Herzegovina 9 3 10 77.19 Botswana 190 88 87 49.74 Brazil 58 1806 4391 70.85 Bulgaria 13 9 36 80.10 Burkina Faso 560 3766 782 17.19 Burundi 970 2602 411 13.65 Cambodia 290 930 1247 57.29 Cameroon 600 4147 1699 29.06 Canada 12 40 158 79.80 Cape Verde 94 10 14 58.03 Central African Republic 850 1273 368 22.44 Chad 1200 5147 156 2.95 Chile 26 64 184 74.19 China 38 6351 21047 76.82 Colombia 85 773 1233 61.46 Comoros 340 82 29 26.00 Congo 580 791 424 34.92 Costa Rica 44 35 47 57.59 Cote d'Ivoire 470 3104 608 16.39 Croatia 14 9 23 72.38 Cuba 53 62 262 80.72 Czech Republic 8 7 31 81.16 DR Congo 670 18573 3332 15.21 Denmark 5 3 11 79.79 Djibouti 300 75 28 27.01 Dominican Republic 100 218 308 58.61 Ecuador 140 425 551 56.43 Egypt 82 1522 1922 55.81

El Salvador 110 139 221 61.31 Equatorial Guinea 280 61 9 12.39 Eritrea 280 438 51 10.47 Estonia 12 2 7 78.25 Ethiopia 470 12310 2951 19.34 Fiji 26 5 3 38.30 Finland 8 5 16 76.37 France 8 62 181 74.58 Gabon 260 101 63 38.37 Gambia 400 238 54 18.56 Georgia 48 26 87 77.18 Germany 7 56 219 79.70 Ghana 350 2628 1166 30.74 Greece 2 2 10 81.97 Guatemala 110 471 210 30.78 Guinea 680 2582 308 10.65 Guinea-Bissau 1000 567 80 12.43 Guyana 270 38 73 65.71 Haiti 300 800 620 43.67 Honduras 110 221 166 42.93 Hungary 13 16 57 78.22 India 230 62723 82119 56.70 Indonesia 240 10714 22980 68.20 Iran (Islamic Republic of) 30 364 684 65.28 Iraq 75 809 362 30.93 Ireland 3 2 4 70.49 Israel 7 7 9 56.36 Italy 5 26 101 79.30 Jamaica 89 49 75 60.46 Japan 6 65 255 79.67 Jordan 59 90 82 47.90 Kazakhstan 45 150 243 61.75 Kenya 530 7668 2849 27.09 Korea DPR 250 948 2185 69.75 Kuwait 9 4 5 55.00 Kyrgyzstan 81 101 125 55.37 Lao PDR 580 835 890 51.59 Latvia 20 4 21 84.15 Lebanon 26 18 31 63.37 Lesotho 530 320 311 49.24 Liberia 990 1440 218 13.15 Libyan Arab Jamahiriya 64 74 94 56.17 Lithuania 13 6 17 72.23 Madagascar 440 3070 1371 30.88 Malawi 510 3109 690 18.16 Malaysia 31 166 168 50.30 Maldives 37 2 3 61.85 Mali 830 5644 502 8.17 Malta 8 0 1 73.18 Mauritania 550 623 95 13.18 Mauritius 36 7 18 71.63 Mexico 85 1926 3149 62.05

Mongolia 65 40 71 63.62 Montenegro 15 1 3 70.43 Morocco 110 681 1275 65.19 Mozambique 550 4641 972 17.32 Myanmar 240 2030 4436 68.61 Namibia 180 108 101 48.47 Nepal 380 2782 3037 52.19 Netherlands 9 17 54 76.20 New Zealand 14 8 21 72.83 Nicaragua 100 139 160 53.47 Niger 820 5784 632 9.85 Nigeria 840 50616 9550 15.87 Norway 7 4 13 75.82 Oman 20 10 9 47.64 Pakistan 260 12132 8045 39.87 Panama 71 42 31 42.31 Papua New Guinea 250 510 325 38.95 Paraguay 95 146 157 51.93 Peru 98 590 930 61.17 Philippines 94 2179 2174 49.95 Poland 6 31 89 74.34 Portugal 7 7 31 81.06 Puerto Rico 18 10 27 73.95 Qatar 8 1 1 50.67 Republic of Korea 18 86 400 82.36 Republic of Moldova 32 14 52 78.41 Romania 27 59 279 82.53 Russian Federation 39 637 2899 81.99 Rwanda 540 2180 932 29.95 Saudi Arabia 24 136 89 39.40 Senegal 410 1845 312 14.48 Serbia 8 9 22 70.21 Sierra Leone 970 2171 250 10.34 Singapore 9 5 14 74.07 Slovakia 6 4 15 80.63 Slovenia 18 4 15 81.07 Solomon Islands 100 17 9 35.25 Somalia 1200 4694 811 14.73 South Africa 410 4556 6200 57.64 Spain 6 29 109 78.81 Sri Lanka 39 150 302 66.77 Sudan 750 10388 1289 11.04 Suriname 100 10 17 63.28 Swaziland 420 145 126 46.50 Sweden 5 5 16 78.19 Switzerland 10 8 31 78.87 Syrian Arab Republic 46 214 245 53.38 Tajikistan 64 120 107 47.31 Thailand 48 419 1516 78.34 Timor-Leste 370 156 36 18.71 Togo 350 664 176 20.97 Trinidad and Tobago 55 11 22 66.88

Tunisia 60 107 231 68.43 Turkey 23 303 561 64.93 Turkmenistan 77 83 125 60.02 Uganda 430 6164 1220 16.52 Ukraine 26 125 542 81.20 United Arab Emirates 10 5 3 41.38 United Kingdom 12 89 296 76.81 United Republic of Tanzania 790 13757 4168 23.25 United States of America 24 1018 2874 73.84 Uruguay 27 14 30 67.84 Uzbekistan 30 174 293 62.71 Venezuela 68 386 443 53.45 Viet Nam 56 824 2163 72.41 Yemen 210 1814 599 24.82 Zambia 470 2570 547 17.56 Zimbabwe 790 2923 1814 38.30 Total maternal deaths averted 352,361 251,624 41.7%

Reference: AbouZahr, C. (1999). "Some thoughts on ICPD+5." Bull World Health Organ 77(9): 767-770. Ahmed, S. and W. H. Mosley (2002). "Simultaneity in the use of maternal-child health care and
contraceptives: evidence from developing countries." Demography 39(1): 75-93. Al-Farsi, Y. M., D. R. Brooks, et al. (2011). "Effect of high parity on occurrence of anemia in pregnancy: a
cohort study." BMC Pregnancy Childbirth 11: 7. Avasarala, K. (2009). "Quality-of-life Assessment of Family Planning Adopters through User Perspectives
in the District of Karimnagar." Indian J Community Med 34(1): 24-28. Berelson, B. (1972). 18-35 in place of 15-45? Population Council Annual Report 1971. New York,
Population Council: 19-27. DaVanzo, J., L. Hale, et al. (2007). "Effects of interpregnancy interval and outcome of the preceding
pregnancy on pregnancy outcomes in Matlab, Bangladesh." BJOG 114(9): 1079-1087. DaVanzo, J., L. Hale, et al. (2008). "The effects of pregnancy spacing on infant and child mortality in
Matlab, Bangladesh: how they vary by the type of pregnancy outcome that began the interval." Popul Stud (Camb) 62(2): 131-154.
Dayal, M. and K. T. Barnhart (2001). "Noncontraceptive benefits and therapeutic uses of the oral contraceptive pill." Semin Reprod Med 19(4): 295-303.
Fortney, J. A. (1987). "The Importance of Family-Planning in Reducing Maternal Mortality." Studies in Family Planning 18(2): 109-114.
Hogan, M. C., K. J. Foreman, et al. (2010). "Maternal mortality for 181 countries, 1980-2008: a systematic analysis of progress towards Millennium Development Goal 5." Lancet 375(9726): 1609-1623.
Jamieson, D. J. and P. A. Buescher (1992). "The effect of family planning participation on prenatal care use and low birth weight." Family Planning Perspectives 24(5): 214-218.
Jensen, J. T. and L. Speroff (2000). "Health benefits of oral contraceptives." Obstetrics and gynecology clinics of North America 27(4): 705-721.
Liu, L., S. Becker, et al. (2008). "Three methods of estimating births averted nationally by contraception." Popul Stud (Camb) 62(2): 191-210.
O'Loughlin, J. (1997). "Safe motherhood: impossible dream or achievable reality?" Med J Aust 167(11-12): 622-625.
Ory, H. W. (1982). "The noncontraceptive health benefits from oral contraceptive use." Family Planning Perspectives 14(4): 182-184.
Potts, M. (1990). "Family planning is crucial to child survival." Network 11(4): 2. Rutstein, S. O. (2005). "Effects of preceding birth intervals on neonatal, infant and under-five years
mortality and nutritional status in developing countries: evidence from the demographic and health surveys." Int J Gynaecol Obstet 89 Suppl 1: S7-24.
Seltzer, J. R. (2002). The Origins and Evolution of Family Planning Programs in Developing Countries. Santa Monica, CA, RAND Corporation.
Singh, S., J. E. Darroch, et al. (2009). Adding It Up: The Costs and Benefits of Investing in Family Planning and Maternal and Newborn Health
New York, Guttmacher Institute
United Nations Population Fund. Stover, J. and J. Ross (2010). "How increased contraceptive use has reduced maternal mortality." Matern
Child Health J 14(5): 687-695.

Trussell, J. and A. R. Pebley (1984). "The potential impact of changes in fertility on infant, child, and maternal mortality." Stud Fam Plann 15(6 Pt 1): 267-280.
Wilmoth, J., S. Zureick, et al. (2010). Levels and Trends of Maternal Mortality in the World: The Development of New Estimates by United Nations. Geneva, World Health Organization.
Winikoff, B. and M. Sullivan (1987). "Assessing the Role of Family-Planning in Reducing Maternal Mortality." Studies in Family Planning 18(3): 128-143.
World Health Organization, UNICEF, et al. (2010). Trends in maternal mortality: 1990 to 2008. Estimates developed by WHO, UNICEF, UNFPA and The World Bank. Geneva, WHO.
Yeakey, M. P., C. J. Muntifering, et al. (2009). "How contraceptive use affects birth intervals: results of a literature review." Stud Fam Plann 40(3): 205-214.