materials selection and processing techniques for small
TRANSCRIPT

University of Kentucky University of Kentucky
UKnowledge UKnowledge
Theses and Dissertations--Electrical and Computer Engineering Electrical and Computer Engineering
2013
Materials Selection and Processing Techniques for Small Materials Selection and Processing Techniques for Small
Spacecraft Solar Cell Arrays Spacecraft Solar Cell Arrays
Naseem M. Torabi University of Kentucky, [email protected]
Right click to open a feedback form in a new tab to let us know how this document benefits you. Right click to open a feedback form in a new tab to let us know how this document benefits you.
Recommended Citation Recommended Citation Torabi, Naseem M., "Materials Selection and Processing Techniques for Small Spacecraft Solar Cell Arrays" (2013). Theses and Dissertations--Electrical and Computer Engineering. 22. https://uknowledge.uky.edu/ece_etds/22
This Master's Thesis is brought to you for free and open access by the Electrical and Computer Engineering at UKnowledge. It has been accepted for inclusion in Theses and Dissertations--Electrical and Computer Engineering by an authorized administrator of UKnowledge. For more information, please contact [email protected].

STUDENT AGREEMENT: STUDENT AGREEMENT:
I represent that my thesis or dissertation and abstract are my original work. Proper attribution
has been given to all outside sources. I understand that I am solely responsible for obtaining
any needed copyright permissions. I have obtained and attached hereto needed written
permission statements(s) from the owner(s) of each third-party copyrighted matter to be
included in my work, allowing electronic distribution (if such use is not permitted by the fair use
doctrine).
I hereby grant to The University of Kentucky and its agents the non-exclusive license to archive
and make accessible my work in whole or in part in all forms of media, now or hereafter known.
I agree that the document mentioned above may be made available immediately for worldwide
access unless a preapproved embargo applies.
I retain all other ownership rights to the copyright of my work. I also retain the right to use in
future works (such as articles or books) all or part of my work. I understand that I am free to
register the copyright to my work.
REVIEW, APPROVAL AND ACCEPTANCE REVIEW, APPROVAL AND ACCEPTANCE
The document mentioned above has been reviewed and accepted by the student’s advisor, on
behalf of the advisory committee, and by the Director of Graduate Studies (DGS), on behalf of
the program; we verify that this is the final, approved version of the student’s dissertation
including all changes required by the advisory committee. The undersigned agree to abide by
the statements above.
Naseem M. Torabi, Student
Dr. Janet K. Lumpp, Major Professor
Dr. Zhi David Chen, Director of Graduate Studies

MATERIALS SELECTION AND PROCESSING TECHNIQUES FOR SMALL SPACECRAFT SOLAR CELL ARRAYS
THESIS
A thesis submitted in partial fulfillment of the
requirements for the degree of Master of Science in Electrical Engineering
in the College of Engineering at the University of Kentucky
By
Naseem Meetra Torabi
Lexington, KY
Director: Janet K. Lumpp, Ph.D., Professor of Electrical Engineering
Lexington, Kentucky
2013

ABSTRACT OF THESIS
MATERIALS SELECTION AND PROCESSING TECHNIQUES OF SMALL SPACECRAFT SOLAR CELL ARRAYS
Body mounted germanium substrate solar cell arrays form the faces of many small satellite designs to provide the primary power source on orbit. High efficiency solar cells are made affordable for university satellite programs as triangular devices trimmed from wafer scale solar cells. The smaller cells allow array designs to pack tightly around antenna mounts and payload instruments, giving the board design flexibility. One objective of this work is to investigate the reliability of solar cells attached to FR‐4 printed circuit boards. FR‐4 circuit boards have significantly higher thermal expansion coefficients and lower thermal conductivities than germanium. This thermal expansion coefficient mismatch between the FR‐4 board and the components causes concern for the power system in terms of failures seen by the solar cells. These failures are most likely to occur with a longer orbital lifetime and an extended exposure to harsh environments. This work compares various methods of attaching solar cells to printed circuit boards, using solder paste alone and with a silicone adhesive, and considering the application of these adhesives by comparing the solder joints when printed by screen versus a stencil. An environmental test plan was used to compare the survivability and performance of the solar arrays.
KEYWORDS: Solar Cells, Solar Cell Arrays, Circuit Board Assembly,
Material Testing, Small Satellites
Naseem M Torabi
May 3, 2013

MATERIALS SELECTIONS AND PROCESSING TECHNIQUES FOR SMALL SPACECRAFT SOLAR CELL ARRAYS
By
Naseem Meetra Torabi
Janet K. Lumpp
Director of Thesis
Zhi David Chen
Director of Graduate Studies
May 3, 2013

iii
ACKNOWLEDGMENTS
I would first like to thank my mentor and thesis advisor Dr. Janet K. Lumpp, for her endless encouragement and guidance throughout this work as well as my entire graduate school experience. I greatly appreciate all of the time and effort she put into ensuring my educational progress and advancement. Additionally, I would like to thank Dr. James E Lumpp, Jr. for his support in making my research possible and for all of the invaluable opportunities he provided for me and my fellow lab colleagues. I also wish to thank my friends at Kentucky Space and Space Systems Laboratory for their technical assistance throughout my experimentation.
Next, I wish to thank my family for helping me get through the challenges I have faced throughout college and graduate school. Their continual support has given me the confidence to pursue and accomplish my educational goals.
Finally, a very special thanks to all three of my committee members: Dr. Janet Lummp, Dr. James Lumpp, Jr., and Dr. Todd Hastings for their time and challenging comments and questions during my thesis defense.

iv
TABLE OF CONTENTS
Acknowledgments. . . . . . . . . . . . . . . . . . . . . . . . . . . . . . . . . . . . . . . . . . . . . . . . . . . . . . . . . . . . . . . . iii
List of Tables. . . . . . . . . . . . . . . . . . . . . . . . . . . . . . . . . . . . . . . . . . . . . . . . . . . . . . . . . . . . . . . . . . . . . vi
List of Figures. . . . . . . . . . . . . . . . . . . . . . . . . . . . . . . . . . . . . . . . . . . . . . . . . . . . . . . . . . . . . . . . . . . viii
List of Images. . . . . . . . . . . . . . . . . . . . . . . . . . . . . . . . . . . . . . . . . . . . . . . . . . . . . . . . . . . . . . . . . . . . .ix
Chapter One: Introduction. . . . . . . . . . . . . . . . . . . . . . . . . . . . . . . . . . . . . . . . . . . . . . . . . . . . . . . . .1
Kentucky Space. . . . . . . . . . . . . . . . . . . . . . . . . . . . . . . . . . . . . . . . . . . . . . . . . . . . . . . . . . . .1
Cube Satellite Standard. . . . . . . . . . . . . . . . . . . . . . . . . . . . . . . . . . . . . . . . . . . . . . . . . . . . 1
Kentucky Satellite‐1: Research Background. . . . . . . . . . . . . . . . . . . . . . . . . . . . . . . . .4
Chapter Two: Experimental. . . . . . . . . . . . . . . . . . . . . . . . . . . . . . . . . . . . . . . . . . . . . . . . . . . . . . 10
Screens and Stencils. . . . . . . . . . . . . . . . . . . . . . . . . . . . . . . . . . . . . . . . . . . . . . . . . . . . . . .10
Materials. . . . . . . . . . . . . . . . . . . . . . . . . . . . . . . . . . . . . . . . . . . . . . . . . . . . . . . . . . . . . . . . . .13
Board Fabrication. . . . . . . . . . . . . . . . . . . . . . . . . . . . . . . . . . . . . . . . . . . . . . . . . . . . . . . . .13
Testing Equipment. . . . . . . . . . . . . . . . . . . . . . . . . . . . . . . . . . . . . . . . . . . . . . . . . . . . . . . .16
Testing Cycles. . . . . . . . . . . . . . . . . . . . . . . . . . . . . . . . . . . . . . . . . . . . . . . . . . . . . . . . . . . . .17
Board X‐Ray Analysis. . . . . . . . . . . . . . . . . . . . . . . . . . . . . . . . . . . . . . . . . . . . . . 17
Thermal Aging. . . . . . . . . . . . . . . . . . . . . . . . . . . . . . . . . . . . . . . . . . . . . . . . . . . . . 18
Vacuum Exposure. . . . . . . . . . . . . . . . . . . . . . . . . . . . . . . . . . . . . . . . . . . . . . . . . .18
Thermal Cycling. . . . . . . . . . . . . . . . . . . . . . . . . . . . . . . . . . . . . . . . . . . . . . . . . . . .18
Vibration Testing. . . . . . . . . . . . . . . . . . . . . . . . . . . . . . . . . . . . . . . . . . . . . . . . . . 19
Validation. . . . . . . . . . . . . . . . . . . . . . . . . . . . . . . . . . . . . . . . . . . . . . . . . . . . . . . . . .20
Chapter Three: Results. . . . . . . . . . . . . . . . . . . . . . . . . . . . . . . . . . . . . . . . . . . . . . . . . . . . . . . . . . . 21
Discussion. . . . . . . . . . . . . . . . . . . . . . . . . . . . . . . . . . . . . . . . . . . . . . . . . . . . . . . . . . . . . . . . 21
v
Board 1a/b: Stencil Printed Silicone Adhesive, Manually Dispensed Solder Paste. . . . . . . . . . . . . . . . . . . . . . . . . . . . . . . . . . . . . . . . . . . . . . . . . . . . . . . .21
Board 2a/b: Stencil Printed Solder Paste Only. . . . . . . . . . . . . . . . . . . . . . 29
Board 3a/b: Manually Dispensed Silicone Adhesive, Stencil Printed Solder Paste. . . . . . . . . . . . . . . . . . . . . . . . . . . . . . . . . . . . . . . . . . . . . . . . . . . . . . . .37
Board 4a/b: Screen Printed Solder Paste Only. . . . . . . . . . . . . . . . . . . . . . 45
Chapter Four: Conclusions. . . . . . . . . . . . . . . . . . . . . . . . . . . . . . . . . . . . . . . . . . . . . . . . . . . . . . . .53
General Observations. . . . . . . . . . . . . . . . . . . . . . . . . . . . . . . . . . . . . . . . . . . . . . . . . . . . . 53
Future Work. . . . . . . . . . . . . . . . . . . . . . . . . . . . . . . . . . . . . . . . . . . . . . . . . . . . . . . . . . . . . . 55
References. . . . . . . . . . . . . . . . . . . . . . . . . . . . . . . . . . . . . . . . . . . . . . . . . . . . . . . . . . . . . . . . . . . . . . .56
Vita. . . . . . . . . . . . . . . . . . . . . . . . . . . . . . . . . . . . . . . . . . . . . . . . . . . . . . . . . . . . . . . . . . . . . . . . . . . . . . 58

vi
LIST OF TABLES
1.1, Common solder metal alloys and their application. . . . . . . . . . . . . . . . . . . . . . . . . . . . . 6
1.2, Common flux types. . . . . . . . . . . . . . . . . . . . . . . . . . . . . . . . . . . . . . . . . . . . . . . . . . . . . . . . . . . .6
2.1, Durometer ratings for polyurethane squeegees. . . . . . . . . . . . . . . . . . . . . . . . . . . . . . .12
2.2, The solar board adhesive materials and application combinations tested in this experiment. . . . . . . . . . . . . . . . . . . . . . . . . . . . . . . . . . . . . . . . . . . . . . . . . . . . . . . . . . . . . . . . . . . . . . 14
2.3, Kester solder paste suggested reflow profile. . . . . . . . . . . . . . . . . . . . . . . . . . . . . . . . . .15
2.4, NASA GEVS random vibration. . . . . . . . . . . . . . . . . . . . . . . . . . . . . . . . . . . . . . . . . . . . . . . . 20
3.1, Initial functional test results‐board A. . . . . . . . . . . . . . . . . . . . . . . . . . . . . . . . . . . . . . . . .24
3.2, Functional test results post vacuum chamber‐board A. . . . . . . . . . . . . . . . . . . . . . . . 24
3.3, Functional test results post thermal cycling‐board A. . . . . . . . . . . . . . . . . . . . . . . . . .25
3.4, Functional test results post vibration testing‐board A. . . . . . . . . . . . . . . . . . . . . . . . .25
3.5, Initial functional test results‐board B. . . . . . . . . . . . . . . . . . . . . . . . . . . . . . . . . . . . . . . . .26
3.6, Functional test results post extreme thermal cycling‐board B. . . . . . . . . . . . . . . . . 27
3.7, Functional test results post vacuum chamber‐board B. . . . . . . . . . . . . . . . . . . . . . . . 27
3.8, Functional test results post thermal cycling‐board B. . . . . . . . . . . . . . . . . . . . . . . . . . 28
3.9, Functional test results post vibration testing‐board B. . . . . . . . . . . . . . . . . . . . . . . . .28
3.10, Initial functional test results‐board A. . . . . . . . . . . . . . . . . . . . . . . . . . . . . . . . . . . . . . . .31
3.11, Functional test results post vacuum chamber‐board A. . . . . . . . . . . . . . . . . . . . . . .32
3.12, Functional test results post thermal cycling‐board A. . . . . . . . . . . . . . . . . . . . . . . . .32
3.13, Functional test results post vibration testing‐board A. . . . . . . . . . . . . . . . . . . . . . . .33
3.14, Initial functional test results‐board B. . . . . . . . . . . . . . . . . . . . . . . . . . . . . . . . . . . . . . . .34
3.15, Functional test results post extreme thermal cycling‐board B. . . . . . . . . . . . . . . .35
3.16, Functional test results post vacuum chamber‐board B. . . . . . . . . . . . . . . . . . . . . . .35

vii
3.17, Functional test results post thermal cycling‐board B. . . . . . . . . . . . . . . . . . . . . . . . .36
3.18, Functional test results post vibration testing‐board B. . . . . . . . . . . . . . . . . . . . . . . .36
3.19, Initial functional test results‐board A. . . . . . . . . . . . . . . . . . . . . . . . . . . . . . . . . . . . . . . .39
3.20, Functional test results post vacuum chamber‐board A. . . . . . . . . . . . . . . . . . . . . . .40
3.21, Functional test results post thermal cycling‐board A. . . . . . . . . . . . . . . . . . . . . . . . .40
3.22, Functional test results post vibration testing‐board A. . . . . . . . . . . . . . . . . . . . . . . .41
3.23, Initial functional test results‐board B. . . . . . . . . . . . . . . . . . . . . . . . . . . . . . . . . . . . . . . .42
3.24, Functional test results post extreme thermal cycling‐board B. . . . . . . . . . . . . . . .43
3.25, Functional test results post vacuum chamber‐board B. . . . . . . . . . . . . . . . . . . . . . .43
3.26, Functional test results post thermal cycling‐board B. . . . . . . . . . . . . . . . . . . . . . . . .44
3.27, Functional test results post vibration testing‐board B. . . . . . . . . . . . . . . . . . . . . . . .44
3.28, Initial functional test results‐board A. . . . . . . . . . . . . . . . . . . . . . . . . . . . . . . . . . . . . . . .47
3.29, Functional test results post vacuum chamber‐board A. . . . . . . . . . . . . . . . . . . . . . .48
3.30, Functional test results post thermal cycling‐board A. . . . . . . . . . . . . . . . . . . . . . . . .48
3.31, Functional test results post vibration testing‐board A. . . . . . . . . . . . . . . . . . . . . . . .49
3.32, Initial functional test results‐board B. . . . . . . . . . . . . . . . . . . . . . . . . . . . . . . . . . . . . . . .50
3.33, Functional test results post extreme thermal cycling‐board B. . . . . . . . . . . . . . . .51
3.34, Functional test results post vacuum chamber‐board B. . . . . . . . . . . . . . . . . . . . . . .51
3.35, Functional test results post thermal cycling‐board B. . . . . . . . . . . . . . . . . . . . . . . . .52
3.36, Functional test results post vibration testing‐board B. . . . . . . . . . . . . . . . . . . . . . . .52

viii
LIST OF FIGURES
2.1, Pattern design used for the steel stencil. . . . . . . . . . . . . . . . . . . . . . . . . . . . . . . . . . . . . . .11
2.2, Actual reflow profile used for the solder paste. . . . . . . . . . . . . . . . . . . . . . . . . . . . . . . . 16
2.3, Thermal cycle profile used for testing and thermal aging. . . . . . . . . . . . . . . . . . . . . .19
3.1, Composite graph of functional test results for stencil printed silicone adhesive, hand dispensed solder paste, board A. . . . . . . . . . . . . . . . . . . . . . . . . . . . . . . . . . . . . . . . . . . . .23
3.2, Composite graph of functional test results for stencil printed silicone adhesive, hand dispensed solder paste, board B. . . . . . . . . . . . . . . . . . . . . . . . . . . . . . . . . . . . . . . . . . . . .26
3.3, Composite graph of functional test results for stencil printed solder paste, board A. . . . . . . . . . . . . . . . . . . . . . . . . . . . . . . . . . . . . . . . . . . . . . . . . . . . . . . . . . . . . . . . . . . . . . . . . . . . . . . . .31
3.4, Composite graph of functional test results for stencil printed solder paste, board B. . . . . . . . . . . . . . . . . . . . . . . . . . . . . . . . . . . . . . . . . . . . . . . . . . . . . . . . . . . . . . . . . . . . . . . . . . . . . . . . .34
3.5, Composite graph of functional test results for manually dispensed silicone adhesive, screen printed solder paste, board A. . . . . . . . . . . . . . . . . . . . . . . . . . . . . . . . . . . .39
3.6, Composite graph of functional test results for manually dispensed silicone adhesive, screen printed solder paste, board B. . . . . . . . . . . . . . . . . . . . . . . . . . . . . . . . . . . .42
3.7, Composite graph of functional test results for screen printed solder paste, board A. . . . . . . . . . . . . . . . . . . . . . . . . . . . . . . . . . . . . . . . . . . . . . . . . . . . . . . . . . . . . . . . . . . . . . . . . . . . . . . . .47
3.8, Composite graph of functional test results for screen printed solder paste, board B. . . . . . . . . . . . . . . . . . . . . . . . . . . . . . . . . . . . . . . . . . . . . . . . . . . . . . . . . . . . . . . . . . . . . . . . . . . . . . . . .50

ix
LIST OF IMAGES
1.1, P‐POD with labeled components. . . . . . . . . . . . . . . . . . . . . . . . . . . . . . . . . . . . . . . . . . . . . . .3
1.2, Solar cell pad on the solar array circuit board. . . . . . . . . . . . . . . . . . . . . . . . . . . . . . . . . . 7
2.1, Pattern designs on transparency mask used for transferring to mesh screen. . 10
3.1, Board 1a/b after adhesive and solder paste application. . . . . . . . . . . . . . . . . . . . . . .21
3.2, Board 1a‐initial x‐ray (left) and final x‐ray (right) . . . . . . . . . . . . . . . . . . . . . . . . . . . . 22
3.3, Board 1b‐initial x‐ray (left) and final x‐ray (right) . . . . . . . . . . . . . . . . . . . . . . . . . . . . 22
3.4, Board 2a/b after stencil printed solder paste application. . . . . . . . . . . . . . . . . . . . . .29
3.5, Board 2a‐initial x‐ray (left) and final x‐ray (right) . . . . . . . . . . . . . . . . . . . . . . . . . . . . 30
3.6, Board 2b‐initial x‐ray (left) and final x‐ray (right) . . . . . . . . . . . . . . . . . . . . . . . . . . . . 30
3.7, Board 3a/b after stencil printed solder paste application. . . . . . . . . . . . . . . . . . . . . .37
3.8, Board 3a‐initial x‐ray (left) and final x‐ray (right) . . . . . . . . . . . . . . . . . . . . . . . . . . . . 38
3.9, Board 3b‐initial x‐ray (left) and final x‐ray (right) . . . . . . . . . . . . . . . . . . . . . . . . . . . . 38
3.10, Board 4a/b after screen printed solder paste application. . . . . . . . . . . . . . . . . . . . 45
3.11, Board 3a‐initial x‐ray (left) and final x‐ray (right) . . . . . . . . . . . . . . . . . . . . . . . . . . .46
3.12, Board 3b‐initial x‐ray (left) and final x‐ray (right) . . . . . . . . . . . . . . . . . . . . . . . . . . .46
4.1, Thermally aged, stencil printed solder paste‐board 2a‐with visible crack seen under x‐ray. . . . . . . . . . . . . . . . . . . . . . . . . . . . . . . . . . . . . . . . . . . . . . . . . . . . . . . . . . . . . . . . . . . . . . 54
4.2, Board 3b‐manually dispensed silicone adhesive, stencil printed solder paste‐ irregularity seen under x‐ray. . . . . . . . . . . . . . . . . . . . . . . . . . . . . . . . . . . . . . . . . . . . . . . . . . . . . 54

1
Chapter One: Introduction
Kentucky Space
Kentucky Space started as a non‐profit consortium consisting of state‐wide universities and businesses including University of Kentucky, Morehead State University, University of Louisville, Western Kentucky University, Murray State University, Kentucky Community and Technical College System, Kentucky Space Grant Consortium, Belcan, and Kentucky Science and Technology Corporation. This state‐wide partnership has enabled a network of knowledge and expertise which, inturn, has been used to develop a series of small spacecraft for high altitude, suborbital and orbital missions. While the primary goals of the program are education and outreach, the technical goals are to develop reproducible systems and infrastructures to support the Small Satellite community as well as to act as a pipeline creating experienced individuals to help stimulate interest and jobs within the state and the region.
Cube Satellite Standard
The small spacecraft developed by Kentucky Space are based on the Cube Satellite standard, which was first developed in 1999 by Dr. JordiPuig‐Suari from California Polytechnic State University and Professor Bob Twiggs from Stanford University. This nano‐satellite standard refers to a 10 cm cube (10 cm x 10 cm x 10 cm) with the weight of no more than 1.33 kilograms, for a one unit (1U) cube. The Cube Satellite, or CubeSat, form factor can be scaled for larger satellites to include a two unit, or 2U, as well as a three unit, 3U, cube satellite for the increased dimensions of 20 cm x 10 cm x 10 cm and 30 cm x 10 cm x 10 cm, respectively [15]. This small scale platform was developed to allow university based space research to be performed with a limited budget in mind. From design phases through testing and launch, a 1U cube satellite’s cost is estimated at $50,000 ‐ $80,000 which is significantly less than the cost of the development and launch of most small satellites [12]. Launch costs are minimized by having the cube satellites act as the secondary payload when excess space is available on launch vehicles. This initiative started with hopes of developing competitive aerospace research affordable and more easily accessible to university and academic programs; however, companies have also taken advantage of this lower cost research platform.
Along with the size and weight standard, CubeSats require necessary operational subsystems including, but not limited to, an electrical power system (EPS), command and data handling (C&DH), and a communications system. The

2
complexity of these and other necessary subsystems is determined by the payload’s requirements. The EPS is the payload’s lifeline, which relies on an external source to recharge the batteries for longer missions, or batteries alone for shorter missions. CubeSats that require a longer orbital lifetime most commonly use arrays of photovoltaic cells covering the exterior walls of the spacecraft to achieve battery recharge. For this method, which directly converts solar radiation to electrical power, it is desirable to have large, high efficiency, multi‐junction cells to maximize utilization of the UV spectrum. However, these types of cells are very expensive and not always feasible for student built spacecraft. Alternative and more cost effective solar cell solutions are available and will be discussed in more detail later.
Other methods for powering a CubeSat can be classified as static power and dynamic power. Static power sources use a temperature gradient to convert thermal energy to electrical energy. One example of this is using a Peltier module as a solar generator by attaching it between two heat sinks. The heat sink exposed to the sun will warm up creating a thermal gradient on either side of the Peltier module, which is then converted to electrical energy. Although this is an efficient way to generate power, heat sinks are generally bulky and not feasible for spacecraft with an already limited mass budget. Dynamic power sources are similar to static sources in that it uses a heat source to generate electrical energy, but also requires an exchanger to drive an engine in a thermodynamic power cycle. Along with the added mass, these types of systems are also very expensive and generally not used for small spacecraft, such as CubeSats [9].
Another aspect of the Cube Satellite standard is the deployer that enables the satellites to successfully eject from the launch vehicle once in orbit. The Poly Picosatellite Orbital Deployer, P‐POD, was developed by students and advisors from CaliforniaPolytechnicStateUniversity to seamlessly interface with both the launch vehicle and cube satellites. The rectangular deployer is made of 7075‐T6 aluminum and weighs approximately 1.5 kg. The exterior door where the cube satellites exit the launcher is spring loaded and the interior of the deployer contains rails built into all four corners of the interior walls, to allow the cube satellites to slide along during installation and deployment, as well as a spring that ejects the cube satellites with a linear velocity of 0.3 m/s. Along with acting as the ejection mechanism for cube satellites, the P‐POD serves to protect the launch vehicle and primary payload from disturbances such as electrical and mechanical failures as well as electromagnetic interference seen by the cube satellites once integrated in the launch vehicle [7]. The P‐POD must also minimize the spin of the cube satellites upon ejection to reduce the possibility of collisions with the launch vehicle or

3
primary payload. One P‐POD can hold up to three 1U cube satellites or any combination equal in size to a 3U cube satellite. Image 1 below shows an image of a P‐POD along with labeled components.
Image 1.1: P‐POD with labeled components
Once the cube satellite has been safely ejected from the launch vehicle into the orbital environment, the spacecraft’s orbital lifetime becomes a major focus for developers. Due to the escalated interest in small spacecraft microgravity research, coupled with the growing availability of launch opportunities, Low Earth Orbit (LEO) specifically has become increasingly more populated. Low Earth Orbit is a popular orbit for small spacecraft because it has a longer orbital decay than lower altitudes and its closer proximity to Earth allows for better instrument performance. LEO is defined as the area 1,000‐5,000 km above the Earth’s surface [8]. For light weight spacecraft, like CubeSats, it can still take many years before it decays and burns in the atmosphere. This causes concern because the operational lifetime is generally much shorter than the orbital lifetime. Once the batteries have completely
Spring Loaded Door
Internal Spring
Internal Built‐in Rails

4
depleted or if critical failures occur causing the satellite to no longer function, it will continue to orbit potentially causing obstacles for functional satellites in that orbit which, in turn, can increase the risk for collisions. A critical failure can be define as any event that prevents the satellite from functioning as it is intended. A few examples of this include solar cell failure preventing the batteries to charge properly, antenna deployment failure preventing successful data transmission and receiving, and payload interface failures preventing portions of the payload to correctly operate. To ensure collision risk is minimized, CubeSats have the design requirement to deorbit no later than 25 years after launch.
Kentucky Satellite‐1: Research Background
Kentucky Satellite‐1 (KySat‐1), the first orbital mission from Kentucky Space, was a 1‐Unit cube satellite that included camera and S‐band radio payloads interconnected to a communications bus, UHF/VHF radios and power system. KySat‐1, along with two other university built cube satellites by University of Colorado at Boulder and Montana State University, were part of the first NASA Educational Launch of Nanosatellites (ELaNa) mission[1]. This program has enabled student built satellites to ride aboard NASA rockets and act as the rocket’s secondary payload. Prior to launch, these student built satellites are required to undergo and pass a series of environmental tests determined by NASA to ensure the security of the primary payload, launch vehicle, and other student built satellites on board the rocket. The testing path, severity, and length of each of these tests developed by NASA are dependent on the launch vehicle and primary payload. KySat‐1 rode on a Taurus XL rocket and was one of the secondary payloads to NASA’s Glory Mission. This mission, which launched on March 4, 2011 from Vandenberg Air Force Base, did not reach orbit due to a fairing separation failure located atop the rocket [14].
The materials tested onKySat‐1’s solar panel design including solar cells, solder paste, and adhesives play an important role in the success of the EPS. Before specifically discussing the type of solar cells used for KySat‐1 and why they were chosen, it is important to understand the different cells available and the advantages and disadvantages offered with each.
Three notable cell types used for small spacecraft are silicon, gallium arsenide, and multi‐junction gallium indium phosphide/gallium arsenide. Silicon based solar cells offer a lower production cost, but have only achieved an efficiency of around 20% [10]. Research on this substrate is being performed to continue to lower the cost of crystal growth; however, the inherent challenge of silicon having

5
an indirect band gap continues to hinder light absorption therefore limiting cell efficiency. Gallium arsenide solar cells offer a higher tested efficiency, around 26‐29%, but the much higher production costs make them unreasonable for university built spacecraft with a limited budget.
Finally, the use of multiple materials in multi‐junction solar cells delivers the largest range of UV light absorption and ultimately the highest efficiency. A monolithic multiple junction cell is achieved by growing the different materials directly on top of the initial substrate. In order for these materials to bond correctly, it is important that they have closely matched lattice constants, which are defined as the distance between unit cells within the crystal structure of a material. If the lattice constant is largely mismatched, electrical defects can form at the surface of the junction between two materials decreasing the efficiency of the cell as well as the lifetime. Multi‐junction cells can also be made by connecting two or more separate cells together using an external connection, such as a wire, but this method is less common. The cost of this type of cell varies on the materials used; however the specific combination of gallium indium phosphide with gallium arsenide ranges around three times the cost of silicon solar cell production.
As previously mentioned, it is desirable to not only use solar cells that are highly efficient, but large in size as well. The larger the cell, the more power generated and the fewer number of solar cells needed. Larger cells, and the lesser number needed, also aid in risk reduction because it minimizes the number of possible joint failures better fortifying the EPS. For KySat‐1, it was important to use solar cells that were highly efficient as well as affordable. These needs were met by using Triangular Advanced Solar Cells (TASC) which are improved triple junction gallium arsenide cells. While these cells are very costly as large rectangular cells, using the triangular remains of the trimmed wafer decreases costs making them a popular, viable solution for small spacecraft power systems. These cells have an efficiency of 27%, but only have an area of 2.277 cm². Fortunately, the small area translates to a tight packing ability, allowing a high number of cells to fit on each individual face of the spacecraft.
Once the appropriate solar cell was chosen, soldering them to the solar board became the next challenge approached. Choosing a suitable solder paste to fit the needs of the satellite design first required an understanding of the discrepancies seen in previous iterations of the KySat‐1 engineering model. Solder paste, when broken down, consists of metal powder mixed with flux. Flux is a compound that aids in adhesion by removing oxides from the metal surfaces and preventing oxidation to the surface that is being heated. The metal alloys and fluxes in

6
soldering paste can vary, and these variations determine the application ranges. Listed below in Tables 1 and 2 are common solder metal alloys and flux types, respectively.
Table 1.1: Common solder metal alloys and their applications [2].
Metal Alloy Applications
Lead‐Silver High temperature applications
Tin‐Silver High temperature applications – medical instruments
Tin‐Lead General purpose
Tin‐Antimony‐Lead General purpose – for better conductivity and strength
Table 1.2: Common flux types [4].
Flux Type Characteristics
Good insulator at room temperature; encapsulates flux residue,which aids in preventing long term corrosion. Rosin
Cleaning method: Semi aqueous terpenes
Long active work period for soldering; shown to produce lower number of soldering defects. Water Soluble
Cleaning method: In line spray system with water
Flux residue easily removed; shown to produce lower number of soldering defects. Synthetic
Activated Cleaning method: In line spray system with terpenes or chlorofluorocarbons (CFCs)
Low flux residue present after soldering; lower viscosity allowing better surface wetting for soldering.
Low Solids
(No Clean) Cleaning method: Ethanol based spray.
7
One major difficulty from previous board samples arose from the flux residue remaining on the boards after solder reflow. The residue, if not properly removed, causes chipping of the conformal coating layer leaving the solar panel’s electrical components and wiring exposed to the debris and harsh orbital environment the satellite will experience. Furthermore, having flux residue on the board runs the risks of initiating a chemical reaction at high temperatures, out gassing, and potentially causing damage or failure of the solar cells [5]. Flux may be classified by its many characteristics, including residue cleaning method. This property is important specifically when addressing the effect it has on the conformal coating.
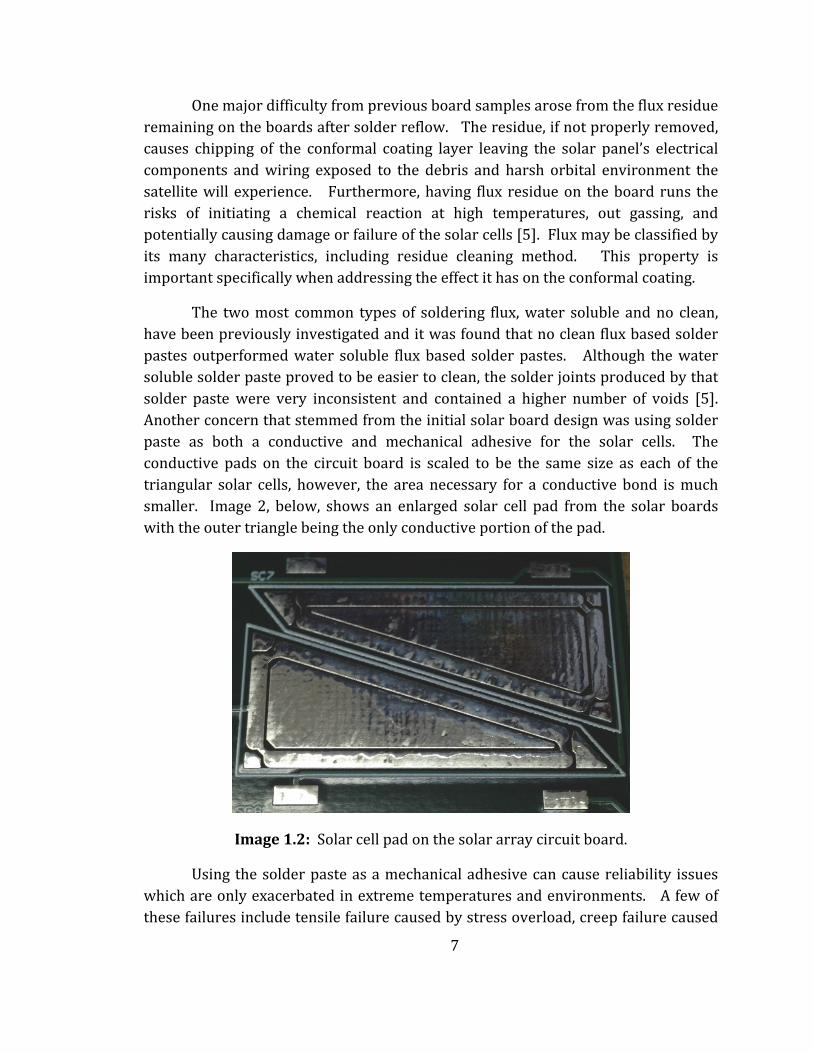
The two most common types of soldering flux, water soluble and no clean, have been previously investigated and it was found that no clean flux based solder pastes outperformed water soluble flux based solder pastes. Although the water soluble solder paste proved to be easier to clean, the solder joints produced by that solder paste were very inconsistent and contained a higher number of voids [5]. Another concern that stemmed from the initial solar board design was using solder paste as both a conductive and mechanical adhesive for the solar cells. The conductive pads on the circuit board is scaled to be the same size as each of the triangular solar cells, however, the area necessary for a conductive bond is much smaller. Image 2, below, shows an enlarged solar cell pad from the solar boards with the outer triangle being the only conductive portion of the pad.
Image 1.2: Solar cell pad on the solar array circuit board.
Using the solder paste as a mechanical adhesive can cause reliability issues which are only exacerbated in extreme temperatures and environments. A few of these failures include tensile failure caused by stress overload, creep failure caused

8
by long term mechanical loading, and fatigue failure caused by extreme temperature cycling and a mismatched coefficient of thermal expansion between the board and components.
In an attempt to mitigate the negative effect solder paste can have on the solar array when being used as the mechanical joint between the components and the circuit board, other adhesives can be used to lessen the mechanical and thermal strain. The different types of adhesives primarily used for aerospace applications can be categorized as thermally conductive, electrically conductive, and mechanical attachment and support. The use of thermal adhesives is an important consideration for electronics on spacecraft because of the extreme orbital temperature range. Furthermore, understanding heat transfer between two materials and how materials expand and contract while undergoing extreme temperature cyclingis critical for a successful mission. Thermal adhesives aid in heat transfer between two objects, and more importantly, can act as a buffer allowing each of the two objects to expand and contract more freely without causing as much strain on one another.
Silicone adhesives have become an increasingly popular thermal adhesive due to theirdesirable innate properties, like flexibility and the ability to withstand a wide temperature range, although thermal glues and potting compounds can also be used for this purpose. An electrically conductive adhesive is a metal filled polymer used to create a contact between two objects allowing electrical current to flow. Due to the amount of metal present in the composition, the range of flexibility decreases dramatically once cured. Therefore, when exposed to extreme temperatures electrically conductive adhesives can become brittle and begin to crack over time. Mechanical adhesives differ from electrically conductive and thermally conductive by strictly acting as a bonding mechanism between objects. Since the solar boards for KySat‐1 have large apertures for the solar cells themselves, with only a small portion of the pads being conductive, it was imperative to explore the option of using a thermal adhesive for the majority of the solar cell pad and only a small amount of solder paste on the conductive portion of the pad. As previously mentioned, experimenting with a thermal adhesive combined with solder paste was done in an effort to decrease the negative effect the rigid solder paste had on each solar cell joint as a whole.
The final design consideration examined compared applying the solder paste by hand to a more standard alternative, a screen printer using a custom screen and stencil. Applying the solder paste by hand, as previously done for the solar panels of the CubeSat, allowed many new variables to arise. A few issues stemming from

9
this method included applying too much solder paste to the pads, applying too little solder paste, and varying the pattern in which the solder paste was applied to the board making it an unrepeatable process. By using a screen or stencil with the pattern already incorporated, as seen in Figure 2, the process became much more controlled and allowed comparison of various solder printing patterns as well as printing methods. It was important to compare printing the adhesives on by screen and stencil because while both are a more standard method of application, each has its set of pros and cons.

10
Chapter Two: Experimental
Screens and Stencils:
The specific screen used for this experimentation, manufactured by RIV, Inc, has inner dimensions of 5” x 5”, outer dimensions of 7” x 7”, came coated with a photosensitive emulsion, and has a mesh count of 80. The lower mesh count allowed for more adhesive to be applied through the screen, which was preferred for the large aperture that needed to be coated. Since the screen came pre‐coated with emulsion, the desired patterns for testing weretransferred using a transparency and light box. When the photosensitive emulsion is exposed to UV light it hardens, while any portion of the emulsion that is masked off will remain water soluble. Specific to the solar boards and the desired patterns, the dark portion of the transparency represented the areas on the screen that would allow the adhesive to pass through, while the clear portion of the transparency represented the area of emulsion that would be hardened after exposure to ultra violet light. The transparency used to transfer the patterns on the screen can be seen in Image 3, below.
Image 2.1: Pattern designs on transparency mask used for transferring to mesh screen.
4.1875 in
3.25 in

11
The stencil used for this experimentation, also manufactured by RIV, Inc., has inner dimensions of 10” x 10”, outer dimensions of 12” x 12”, and has a steel stencil inlaid and sealed within the mesh. Unlike the screen, the stencil was completely fabricated by RIV, Inc. and only used one pattern throughout the stencil. The design can be seen in Figure 1 below.
Figure 2.1: Pattern design used for the steel stencil.
Due to the diversity of the materials used in the screen and stencil, metal mesh and steel respectively, different squeegees were necessary to accommodate the flex and rigidity of the two materials during the printing process. Squeegees used for adhesive printing are generally a rubber polymer or metal, depending on the application. Polymer based squeegees are rated by their durometer, which is the measurement of a material’s hardness, and the higher the durometer number represents a harder material. For this specific application, a color is associated with a durometer rating and a list of this color rating system for squeegees can be seen in Table 3 below.

12
Table 2.1: Durometer ratings for polyurethane squeegees [6].
Durometer Color Material Application
50 Black Polyurethane Printing Inks
60 Brown Polyurethane Printing Inks
70 Yellow Polyurethane Thick Film, Stepped Stencil, Epoxies
80 Red Polyurethane Thick Film, SMT, Solder Paste, Epoxies
90 Green Polyurethane SMT, Solder Paste, Epoxies
100 Blue Polyurethane Fine Pitch, Solder Paste, Epoxies
110 Orange Polyurethane Ultra Fine Pitch, Solder Paste, Epoxies
120 Lime Polyurethane Ultra Fine Pitch, Solder Paste, Epoxies
For the screen printed solar boards, using a polyurethane squeegee with a durometer rating of 90 was sufficient for solder paste application. Any squeegee with a higher durometer ran the risk of stretching out the metal mesh which would prevent reuse. For the stencil printed solar boards, a steel squeegee was necessary for solder paste and adhesive application. The polyurethane squeegees, even of the highest durometer, were still too flexible and scraped the solder paste or adhesive out of the apertures of the stencil during printing.
As previously mentioned, the screen used for this experimentation came from the manufacturer with the photosensitive emulsion applied. This method of printing was compared with printing using a stencil mainly because the ease of fabrication and the lower cost. Transferring the patterns for printing was a quick process that was done in house, which cut costs significantly. When properly cleaned, the screen was also able to withstand multiple uses making it an even more cost efficient option. However, when compared to the stencil, it does not have the same lifetime because the metal mesh in the screen eventually stretches after significant usage. Even with the metal mesh stretching over time, the frame of the screen can be sent back to the manufacturer to be restrung and have a new coat of emulsion applied.

13
The stencil was manufactured with the desired patterns already incorporated, which more than doubled the cost when compared to the screen that was used for experimentation. Further, the steel stencil is preferred over the metal mesh because it is much easier to clean regardless of the type of adhesive used for printing. This was a useful property during experimentation because it allowed for both the silicone adhesive and solder paste to be dispensed in a more standard manner, as opposed to being applied manually by hand.
Once the boards had the solder paste and adhesive applied, they required heat to cure the silicone adhesive and reflow the solder paste. In the original process, after the solder paste was applied by hand the solar board was put on a conveyor belt hot plate to reflow. This method was later replaced with a temperature controlled reflow oven, model number AR350N5 made by Manncorp, because the hot plate belt produced variable temperatures which led to hot spots causing the circuit boards to warp [5]. A standard hot plate was used to cure the silicone adhesive, but the calibrated reflow oven was used after adhesive cure to reflow the solder paste.
Materials:
A no‐clean Sn63/Pb37 solder paste was purchased from Nordson EFD, along with the recommended cleaning agent for the no‐clean solder paste. The two part controlled volatility silicone adhesive, CV1‐2289‐1, was purchased from NuSil Silicone Technology. The two‐layer, FR‐4, 0.062", 1 oz Cu boards with a lead‐free Hot Air Solder Leveling (HASL) board finish were fabricated by Advanced Circuits. The Triangular Advanced Solar Cells (TASC) were purchased from Sensormetrix. The board components, consisting of diodes and temperature sensors, were provided by NXP and National Semiconductor, respectively. The screens and the stencil were bought from Riv, Inc. The conformal coating, type 1B73, was obtained from HumiSeal and applied by Creation Technologies.
Board Fabrication:
Based on the process variables that were chosen for experimentation, four boards were assembled. In addition, an identical set of those four boards were assembled and thermally aged before going through the testing profile. These eight boards consisted of the combinations listed in Table 4, below.

14
Table 2.2: The solar board adhesive materials and application combinations tested in this experiment.
Board Number
Adhesive Combination
Solar Cell Shape
Method of Applying Adhesive
1a SA/NC T St/M
1b SA/NC T St/M
2a NC T St
2b NC T St
3a SA/NC T M/St
3b SA/NC T M/St
4a NC T Sc
4b NC T Sc
Where,
SA‐Silicone Adhesive
NC‐No‐Clean flux solder paste
T‐Triangular solar cells
Sc‐Screen Printed
M‐Manually Dispensed
St‐Stencil Printed
The fabrication process began by populating the eight boards with solar cells, diodes, and temperature sensors. Solder paste was manually dispensed, using the time controlled operation mode, onto Board 1a and 1b in the form of small dots along the conductive strip of the solar cell pad while the silicone adhesive was stencil printed onto the remainder of the solar cell pads. Boards 2a and 2b were stencil printed using solder paste alone. The silicone adhesive was again paired

15
with solder paste for boards 3a and 3b, but in this combination the adhesive was applied by hand using a small paint brush and the solder paste was stencil printed on the boards. The final configuration for boards 4a and 4b used solder paste alone and was screen printed. The screen printer used is model type Accu‐Coat 3230 made by Aremco Products, Inc. Once population was completed, boards 1a/b and 3a/b were placed on a hot plate for 15 minutes at 150° C to cure the silicone adhesive then were immediately placed in the reflow oven with the suggested reflow profile given by the manufacturer to allow the solder paste to reflow. The other four boards, 2a/b and 4a/b, were immediately placed in the reflow oven after population. The five heat zoned reflow oven used is model number AR350N5 made by Manncorp. A thermocouple was used to properly calibrate the oven to accommodate the solder paste reflow profile. The five heating zone temperatures used for this testing were as follows: zone one‐140° C, zone two‐235° C, zone three‐235° C, zone four‐235° C, zone five‐175° C. Although this profile did not match that of the suggested profile for the solder paste, adjustments were needed to reach the necessary reflow temperature of the solder paste. The two profiles, the suggested reflow profile of the solder paste and the actual profile seen by the reflow oven can be seen below in Table 5 and Figure 2, respectively.
Table 2.3: Kester solder paste suggested reflow profile [11].
Heating Zone Time
(Seconds)
Temperature Range
(Degrees Celsius)
Notes
Pre‐Heating Zone 0 – 180 25 – 180 Four minute max. for pre‐heat
Soaking Zone 90 – 180 150 – 180 Two minute max. for soaking
Reflow Zone – 1 180 ‐ 210 180 – 225
Reflow Zone – 2 210 ‐ 240 225 – 200
Ninety second max. for reflow

16
Figure 2.2: Actual reflow profile used for the solder paste.
The boards moved along the 150 cm belt of the reflow oven at a rate of 15 cm/min, taking approximately 10 minutes per board, or two minutes per each 30 cm heating zone. After allowing the boards to cool down, the flux residue cleaning process began.
All eight boards used a no‐clean solder paste which required a specific cleaning solution. Using the recommended solution, the flux residue on the remaining two boards was removed by gently agitating the residue with the solution until it was completely stripped. The excess silicone adhesive did not require a specific cleaning process and could easily be peeled off once the curing process was completed.
The boards, once assembled and cleaned, were sprayed with a layer of conformal coating, type 1B73, to protect the diodes, sensors, wires, and external connections from moisture, extreme temperature, and debris. Upon completion, the boards were ready to undergo the testing cycle.
Testing Equipment:
The x‐ray machine used at Creation Technologies is a PCBA|Inspector 100, which features an automated focus to examine solder joints 2‐dimenionally. The thermal chamber used, model type SD‐302, is manufactured by Associated Environmental Systems. This chamber has a working volume of 2 ft³ and temperature ranges of ‐65° C to 200° C and ‐35° C to 392° C. It can reach the upper temperature limit from ambient in 30 minutes. The vacuum chamber used was a previous design project

17
made by students at the University of Kentucky. The shaker table used for the vibration testing, located in Morehead State University’s Space Science Center, is an Unholtz Dickie Electro‐Mechanical Shaker and Slip Table running Unholtz Dickie VinW II data acquisition and controlling software. The solar simulator used for solar cell functional testing was made by a University of Kentucky studentusing a quartz halogen light bulb along with a metal‐halide bulb to simulate a solar standard air mass coefficient (AM) of 1.5.
Testing Cycles:
Each of the board sets assembled, eight boards in total, were put through a rigorous testing cycle that consisted first of x‐raying the boards to examine the solder joints, exposure to a vacuum environment, thermal cycling, vibration testing to determine mechanical stability and workmanship of the solar panels, and finally a second x‐ray to examine any change in the solder joints between the solar cells and the PCB. The second set of boards underwent thermal aging prior to starting the environmental testing plan. This was done in an attempt to better understand how degradation of the joints due to the extreme environment would affect the boards over time. Before and after each test, all eight boards underwent a standard electrical test, comparing the measured power output generated by the panel with the expected power output, to determine whether or not damage had occurred during the test process.
Board X‐Ray Analysis:
The eight boards were taken to Creation Technologies, Lexington, KY, where they were x‐rayed to inspect the solder joints formed between the solar cells and the PCBs. This validation process helped determine which of the three application types, screen printing the solder paste on the boards using a rubber squeegee, applying the solder paste using a controlled dispenser, or stencil printing, was amore effective process. Furthermore, it served as a visual aid in comparing the mechanical connections and coverage pattern of silicone adhesive and solder paste for the solar cells. It also provided key insight into which pattern, of the five on the screen and one on the stencil, created the best joint. In later work, the screen like the stencil will only contain the pattern that formed the best solder joint for a more consistent process.

18
Thermal Aging:
The second set of solar boards was placed in the thermal chamber for two full cycles, giving them a soak time of approximately 168 hours. For each cycle, and initially starting at room temperature, the chamber decreased to ‐20° C, soaked at that temperature for 30 minutes then increased to 40° C for a time of 60 minutes. Thermal aging the boards was a consideration that was made to better understand how the solar panels and their critical joints would function further along the orbital lifetime and to test the workmanship of the board assembly process. KySat‐1 was expected to operate in orbit for five years, but the tests to validate this expectation were done through computer simulations. Although these simulations can provide very useful information, fabrication variables can be overlooked which can make the data somewhat misleading. Thermal aging does not make up for all of the simulation’s discrepancies, but it will provide better insight into how the materials will react to the exposure of an extreme environment over time.
Vacuum Exposure:
Exposing the eight boards to a vacuum environment helped simulate the airless conditions of space once launched and the possible effect it may have on the solar panels. When preparing the solar panels for the flight model of a satellite, vacuum testing combined with thermal cycling become important aspects of environmental testing because it reduces outgas contamination when exposed to low pressures. This test, performed in a thermal vacuum chamber with a turbo pump running, lasted for two hours and pressure measurements were documented every ten minutes. The lowest documented pressure during this testing cycle reached 6.4 x 10⁻⁶ torr.
Thermal Cycling:
Thermal cycling for each board lasted approximately three and a half days in the temperature range of ‐20° C to 40° C. The cycle switching lasted 30 minutes and 60 minutes, respectively [5]. The thermal profile can be seen in Figure 3. A thermocouple, connected to a data logger, was placed inside the thermal chamber to monitor the thermal cycling to ensure proper temperatures were met. This test is a valuable portion of the environmental testing profile because it accelerates the rate at which the materials outgas, minimizing the potential of chemical reactions in a vacuum environment or release and transfer of contaminants. Thermal cycling the solar panels will also determine the workmanship quality of the board assembly process. Examples of failures during this test would include cracked solar cells or

19
cracked and/or broken solder joints, which can be inspected visually, using the x‐ray machine.
Figure 2.3: Thermal cycle profile used for testing and thermal aging.
Vibration Test:
The stability and workmanship of each of the eight boards were tested by means of vibrations using an Unholtz Dickie Electro‐Mechanical Shaker and Slip Table with Unholtz Dickie VinW II data acquisition and controlling software. The test consistedof random vibration tests in both the x‐ and y‐axis, and followed NASAs General Environmental Verification Standard (GEVS) Qualification requirements. The random vibration test lasted two minutes for each board and ranged in frequency from 20 Hz up to 2000 Hz. Table 6, below, shows the frequency range and their corresponding acceleration spectral densities.

20
Table 2.4: NASA GEVS random vibration range [3].
Frequency (Hz) ASD Level (g²/Hz) for Qualification
20
20‐50
50‐800
800‐2000
2000
0.026
+6 dB/oct
0.16
‐6 dB/oct
0.026
Overall 14.1
Validation:
The boards were validated by measuring the power curve of individual cells before and after each step of the process: manufacture, exposure to a vacuum environment, thermal cycling, and vibration testing. The power was measured using a constant external light source. This light source was modeled after a solar simulator discussed in a paper written by M.G. Guvench [13] which is built to simulate a solar standard air mass coefficient (AM) of 1.5. This is achieved by using a quartz halogen light bulb along with a metal‐halide bulb. The maximum power generated was then compared to the initial power to determine the effects of each test in the process. Any inconsistencies were interpreted as a failure in the structural integrity of a solder joint.
A second method of validation occurs through x‐raying the solar boards allowing a visual comparison of the solder joints before the environmental testing profile and after all of the tests have been completed. These images will provide critical insight into how the orbital environment will affect the materials chosen for the solar panels of KySat‐1.

21
Chapter Three: Results
Discussion:
For each of the two sets of board combinations, changes in power output was compared before and after exposure to vacuum, thermal cycling, and vibration testing.
Board 1a/b: Stencil Printed Silicone Adhesive, Manually
Dispensed Solder Paste
Assembly of boards 1a and 1b started with stencil printing silicone adhesive to the solar cell pads on the PCB followed by dispensing solder paste in small dots along the conductive strip of the same pad. This was accomplished by masking off identical areas on the stencil using masking tape before stencil printing the adhesive. The initialproduct of adhesive and solder paste application, prior to populating the board with components, can be seen in Image 4 below.
Image 3.1: Board 1a/b after adhesive and solder paste application.
Once the boards were fully populated with solar cells, diodes, and a temperature sensor, they were each placed on a hot plate for 15 minutes at 150° C to cure the silicone adhesive then placed in the reflow oven to reflow the solder paste. After the boards were cleaned and sprayed with conformal coating, the boards underwent the first x‐ray inspection. Another x‐ray inspection was
Silicone Adhesive
Solder Dots

22
performed after all other testing was completed. Images 5 and 6 show two x‐ray images, the before testing and after testing images for boards 1a and 1b. The dark grey portion of the solar cell is the solder paste, showing the electrical contact, and the light grey portion is the silicone adhesive under x‐ray. The solder paste was intended to be a continuous strip once reflowed. However, the images show a disruption within the solder joint where the silicone adhesive spread through the solder paste creating multiple small dots of solder instead of a continuous strip.
Image 3.2: Board 1a‐ initial x‐ray (left) and final x‐ray (right.)
Image 3.3: Board 1b‐ initial x‐ray (left) and final x‐ray (right.)
After the initial x‐ray was taken the boards were functionally tested in the solar simulator. A second, third, and fourth functional test were performed on board 1a after vacuum testing, thermal cycling, and vibration testing; a total of five functional tests were performed on board 1b, initial, post thermal aging, vacuum, thermal cycling, and vibration. The results of these four tests for board 1a and five tests for board 1b are shown in the P‐V curves of Figure 4 and Figure 5, respectively, as well as Tables 7‐10 for board A and Tables 11‐15 for board B. It should be noted that for board B a slight voltage was measured during the short‐circuit validation scenario, where a voltage of zero would typically be seen, making the power a non‐zero value for this case.

23
Figure 3.1: Composite graph of functional test results for stencil printed silicone adhesive, hand dispensed solder paste, board A.

24
Table 3.1: Initial Functional Test Results – Board A
Board Type Resistor Value (Ω)
Voltage (V)
Current (mA)
Power (mW)
Open Circuit 4.300 0.000 0.000
11000 4.190 0.038 0.160
1800 4.070 0.226 0.920
240 3.903 1.626 6.347
91 3.680 4.044 14.882
Stencil Printed Silicone Adhesive, Hand Dispensed Solder Paste (Board A) Short Circuit 0.000 60.00 0.000
Table 3.2: Functional Test Results Post Vacuum Chamber – Board A
Board Type Resistor Value (Ω)
Voltage (V)
Current (mA)
Power (mW)
Open Circuit 4.585 0.000 0.000
11000 4.420 0.040 0.178
1800 4.303 0.239 1.029
240 4.116 1.715 7.059
91 3.746 4.116 15.420
Stencil Printed Silicone Adhesive, Hand Dispensed Solder Paste (Board A) Short Circuit 0.000 74.00 0.000

25
Table 3.3: Functional Test Results Post Thermal Cycling – Board A
Board Type Resistor Value (Ω)
Voltage (V)
Current (mA)
Power (mW)
Open Circuit 4.030 0.000 0.000
11000 4.006 0.036 0.146
1800 3.966 0.220 0.874
240 3.790 1.579 5.985
91 3.563 3.915 13.951
Stencil Printed Silicone Adhesive, Hand Dispensed Solder Paste (Board A) Short Circuit 0.000 83.00 0.000
Table 3.4: Functional Test Results Post Vibration Testing – Board A
Board Type Resistor Value (Ω)
Voltage (V)
Current (mA)
Power (mW)
Open Circuit 4.002 0.000 0.000
11000 3.892 0.035 0.138
1800 3.765 0.209 0.788
240 3.549 1.479 5.248
91 3.318 3.646 12.098
Stencil Printed Silicone Adhesive, Hand Dispensed Solder Paste (Board A) Short Circuit 0.000 82.00 0.000

26
Figure 3.2: Composite graph of functional test results for stencil printed silicone adhesive, hand dispensed solder paste, board B.
Table 3.5: Initial Functional Test Results – Board B
Board Type Resistor Value (Ω)
Voltage (V)
Current (mA)
Power (mW)
Open Circuit 4.480 0.000 0.000
11000 4.420 0.040 0.178
1800 4.300 0.239 1.027
240 4.069 1.695 6.899
91 3.730 4.099 15.289
Stencil Printed Silicone Adhesive, Hand Dispensed Solder Paste (Board B) Short Circuit 0.000 62.00 0.000

27
Table 3.6: Functional Test Results Post Extreme Thermal Cycling – Board B
Board Type Resistor Value (Ω)
Voltage (V)
Current (mA)
Power (mW)
Open Circuit 4.535 0.000 0.000
11000 4.412 0.040 0.177
1800 4.308 0.239 1.031
240 4.125 1.719 7.090
91 3.860 4.242 16.373
Stencil Printed Silicone Adhesive, Hand Dispensed Solder Paste (Board B) Short Circuit 0.000 67.00 0.000
Table 3.7: Functional Test Results Post Vacuum Chamber – Board B
Board Type Resistor Value (Ω)
Voltage (V)
Current (mA)
Power (mW)
Open Circuit 4.387 0.000 0.000
11000 4.291 0.039 0.167
1800 4.272 0.237 1.014
240 4.043 1.685 6.811
91 3.767 4.140 15.594
Stencil Printed Silicone Adhesive, Hand Dispensed Solder Paste (Board B) Short Circuit 0.000 65.00 0.000

28
Table 3.8: Functional Test Results Post Thermal Cycling – Board B
Board Type Resistor Value (Ω)
Voltage (V)
Current (mA)
Power (mW)
Open Circuit 4.055 0.000 0.000
11000 4.041 0.037 0.148
1800 3.998 0.222 0.888
240 3.870 1.613 6.240
91 3.651 4.012 14.648
Stencil Printed Silicone Adhesive, Hand Dispensed Solder Paste (Board B) Short Circuit 0.020 71.00 1.420
Table 3.9: Functional Test Results Post Vibration Testing – Board B
Board Type Resistor Value (Ω)
Voltage (V)
Current (mA)
Power (mW)
Open Circuit 4.028 0.000 0.000
11000 4.008 0.036 0.146
1800 3.849 0.214 0.823
240 3.557 1.482 5.272
91 3.383 3.718 12.577
Stencil Printed Silicone Adhesive, Hand Dispensed Solder Paste (Board B) Short Circuit 0.024 71.00 1.704

29
Board 2a/b: Stencil Printed Solder Paste Only
Assembly of boards 2a and 2b began with stencil printing the solder paste across each of the solar cell pads on the PCBs. The finished product of the solder paste application prior to populating the board with components is shown in Image 7 below.
Image 3.4: Board 2a/b after stencil printed solder paste application.
Once the boards were fully populated with solar cells, diodes, and a temperature sensor they were placed in the reflow oven to reflow the solder paste. After the boards were cleaned and sprayed with conformal coating, the boards underwent the first x‐ray inspection. Another x‐ray inspection was performed after all other testing was completed. Images8 and 9 show two x‐ray images, the before testing and after testing image for boards 2a and 2b. The dark grey portion of the solar cell is the solder paste, showing the electrical contact, and the light grey irregularly shaped circles are voids in the joint under x‐ray. The solder paste was intended to be a large triangular contact once cured. However, the images show multiple air pockets within the solder joint where the cured solder paste stripes did not merge.
Solder Stripes

30
Image 3.5: Board 2a‐ initial x‐ray (left) and final x‐ray (right.)
Image 3.6: Board 2b‐ initial x‐ray (left) and final x‐ray (right.)
After the initial x‐ray was taken the boards were functionally tested in the solar simulator. A second, third, and fourth functional test were performed on board 2a after vacuum testing, thermal cycling, and vibration testing; a total of five functional tests were performed on board 2b, initial, then post thermal aging, vacuum, thermal cycling, and vibration. The results of these four tests for board 2a and five for board 2b can be seen in the P‐V curves of Figure 6 and Figure 7, respectively, as well as Tables 16‐19 for board A and Tables 20‐24 for board B. It should be noted that for both board A and board B a slight voltage was measured during the short‐circuit validation scenario, where a voltage of zero would typically be seen, making the power a non‐zero value for this case.

31
Figure 3.3: Composite graph of functional test results for stencil printed solder paste, board A.
Table 3.10: Initial Functional Test Results – Board A
Board Type Resistor Value (Ω)
Voltage (V)
Current (mA)
Power (mW)
Open Circuit 4.360 0.000 0.000
11000 4.220 0.038 0.162
1800 4.112 0.228 0.939
240 3.940 1.642 6.468
91 3.751 4.122 15.462
Stencil Printed Solder Paste (Board A) Short Circuit 0.000 85.00 0.000

32
Table 3.11: Functional Test Results Post Vacuum Chamber – Board A
Board Type Resistor Value (Ω)
Voltage (V)
Current (mA)
Power (mW)
Open Circuit 4.390 0.000 0.000
11000 4.226 0.038 0.162
1800 4.144 0.230 0.954
240 4.011 1.671 6.703
91 3.820 4.198 16.036
Stencil Printed Solder Paste (Board A) Short Circuit 0.000 86.00 0.000
Table 3.12: Functional Test Results Post Thermal Cycling – Board A
Board Type Resistor Value (Ω)
Voltage (V)
Current (mA)
Power (mW)
Open Circuit 4.019 0.000 0.000
11000 4.008 0.036 0.146
1800 3.977 0.221 0.879
240 3.864 1.610 6.221
91 3.700 4.066 15.044
Stencil Printed Solder Paste (Board A) Short Circuit 0.037 98.00 3.626

33
Table 3.13: Functional Test Results Post Vibration Testing – Board A
Board Type Resistor Value (Ω)
Voltage (V)
Current (mA)
Power (mW)
Open Circuit 3.849 0.000 0.000
11000 3.702 0.034 0.125
1800 3.652 0.203 0.741
240 3.411 1.421 4.848
91 3.208 3.525 11.309
Stencil Printed Solder Paste (Board A) Short Circuit 0.000 79.00 0.000

34
Figure 7: Composite graph of functional test results for stencil printed solder paste, board B.
Table 3.14: Initial Functional Test Results – Board B
Board Type Resistor Value (Ω)
Voltage (V)
Current (mA)
Power (mW)
Open Circuit 4.350 0.000 0.000
11000 4.200 0.038 0.160
1800 4.098 0.228 0.933
240 3.935 1.640 6.452
91 3.761 4.133 15.544
Stencil Printed Solder Paste (Board B) Short Circuit 0.000 86.00 0.000

35
Table 3.15: Functional Test Results Post Extreme Thermal Cycling – Board B
Board Type Resistor Value (Ω)
Voltage (V)
Current (mA)
Power (mW)
Open Circuit 4.448 0.000 0.000
11000 4.351 0.040 0.172
1800 4.273 0.237 1.014
240 4.131 1.721 7.110
91 3.826 4.204 16.086
Stencil Printed Solder Paste (Board B) Short Circuit 0.000 105.00 0.000
Table 3.16: Functional Test Results Post Vacuum Chamber – Board B
Board Type Resistor Value (Ω)
Voltage (V)
Current (mA)
Power (mW)
Open Circuit 4.366 0.000 0.000
11000 4.277 0.039 0.166
1800 4.211 0.234 0.985
240 4.086 1.703 6.956
91 3.818 4.196 16.019
Stencil Printed Solder Paste (Board B) Short Circuit 0.000 86.00 0.000

36
Table 3.17: Functional Test Results Post Thermal Cycling – Board B
Board Type Resistor Value (Ω)
Voltage (V)
Current (mA)
Power (mW)
Open Circuit 4.111 0.000 0.000
11000 4.096 0.037 0.153
1800 4.065 0.226 0.918
240 3.955 1.648 6.518
91 3.799 4.175 15.860
Stencil Printed Solder Paste (Board B) Short Circuit 0.027 93.00 2.511
Table 3.18: Functional Test Results Post Vibration Testing – Board B
Board Type Resistor Value (Ω)
Voltage (V)
Current (mA)
Power (mW)
Open Circuit 3.792 0.000 0.000
11000 3.673 0.033 0.123
1800 3.629 0.202 0.732
240 3.541 1.475 5.224
91 3.299 3.625 11.960
Stencil Printed Solder Paste (Board B) Short Circuit 0.012 70.00 0.840

37
Board 3a/b: Manually Dispensed Silicone Adhesive, Stencil
Printed Solder Paste
Assembly of boards 3a and 3b started by painting the silicone adhesive, using a small paint brush, on to the solar cell pads on the PCB followed by stencil printing the solder paste along the conductive strip of the same pad. This was accomplished by masking off identical areas on the stencil using masking tape before stencil printing the solder paste. The completed product of adhesive and solder paste application, prior to populating the board with components, is shown in Image10 below.
Image 3.7: Board 3a/b after stencil printed solder paste application.
Once the boards were fully populated with solar cells, diodes, and a temperature sensor they were each placed on a hot plate for 15 minutes at 150° C to cure the silicone adhesive then placed in the reflow oven to reflow the solder paste. After the boards were cleaned and sprayed with conformal coating, the boards underwent the first x‐ray inspection. Another x‐ray inspection was performed after all othertesting was completed. Images 11 and 12 show two x‐ray images, the before testing and after testing image for boards 3a and 3b. The dark grey portion of the solar cell is the solder paste, showing the electrical contact, and the light grey portion is the silicone adhesive under x‐ray. Once again, the solder paste was intended to stay as a continuous strip once reflowed. However, the images show a disruption within the solder joint where the silicone adhesive spread through the solder paste creating circles of various sizes.
Silicone Adhesive
Solder Paste

38
Image 3.8: Board 3a‐ initial x‐ray (left) and final x‐ray (right.)
Image 3.9: Board 3b‐ initial x‐ray (left) and final x‐ray (right.)
After the initial x‐ray was taken the boards were functionally tested in the solar simulator. A second, third and fourth functional test were performed on board 3a after vacuum testing, thermal cycling, and vibration testing; a total of five functional tests were performed on board 3b, initial, then post thermal aging, vacuum, thermal cycling, and vibration. The results of these four tests for board 3a and five tests for board 3b are shown in the P‐V curves of Figure 8 and Figure 9, respectively, as well as Tables 25‐28 for board A and Tables 29‐33 for board B. It should be noted that for both board A and board B a slight voltage was measured during the short‐circuit validation scenario, where a voltage of zero would typically be seen, making the power a non‐zero value for this case.

39
Figure 3.5: Composite graph of functional test results for manually dispensed silicone adhesive, screen printed solder paste, board A.
Table 3.19: Initial Functional Test Results – Board A
Board Type Resistor Value (Ω)
Voltage (V)
Current (mA)
Power (mW)
Open Circuit 4.325 0.000 0.000
11000 4.210 0.038 0.161
1800 4.108 0.228 0.938
240 3.900 1.625 6.338
91 3.694 4.059 14.995
Manually Dispensed Silicone Adhesive, Screen Printed Solder Paste (Board A) Short Circuit 0.000 76.00 0.000

40
Table 3.20: Functional Test Results Post Vacuum Chamber – Board A
Table 3.21: Functional Test Results Post Thermal Cycling – Board A
Board Type Resistor Value (Ω)
Voltage (V)
Current (mA)
Power (mW)
Open Circuit 4.391 0.000 0.000
11000 4.189 0.038 0.160
1800 4.109 0.228 0.938
240 3.936 1.640 6.455
91 3.684 4.048 14.914
Manually Dispensed Silicone Adhesive, Screen Printed Solder Paste (Board A) Short Circuit 0.000 81.00 0.000
Board Type Resistor Value (Ω)
Voltage (V)
Current (mA)
Power (mW)
Open Circuit 3.960 0.000 0.000
11000 3.937 0.036 0.141
1800 3.903 0.217 0.846
240 3.784 1.577 5.966
91 3.595 3.951 14.202
Manually Dispensed Silicone Adhesive, Screen Printed Solder Paste (Board A) Short Circuit 0.029 95.00 2.755

41
Table 3.22: Functional Test Results Post Vibration Testing – Board A
Board Type Resistor Value (Ω)
Voltage (V)
Current (mA)
Power (mW)
Open Circuit 3.991 0.000 0.000
11000 3.816 0.035 0.132
1800 3.702 0.206 0.761
240 3.473 1.447 5.026
91 3.225 3.544 11.429
Manually Dispensed Silicone Adhesive, Screen Printed Solder Paste (Board A) Short Circuit 0.000 77.00 0.000

42
Figure 3.6: Composite graph of functional test results for manually dispensed silicone adhesive, screen printed solder paste, board B.
Table 3.23: Initial Functional Test Results – Board B
Board Type Resistor Value (Ω)
Voltage (V)
Current (mA)
Power (mW)
Open Circuit 4.201 0.000 0.000
11000 4.085 0.037 0.152
1800 4.022 0.223 0.899
240 3.880 1.617 6.273
91 3.690 4.055 14.963
Manually Dispensed Silicone Adhesive, Screen Printed Solder Paste (Board B) Short Circuit 0.000 75.00 0.000

43
Table 3.24: Functional Test Results Post Extreme Thermal Cycling – Board B
Board Type Resistor Value (Ω)
Voltage (V)
Current (mA)
Power (mW)
Open Circuit 4.491 0.000 0.000
11000 4.290 0.039 0.167
1800 4.215 0.234 0.987
240 4.056 1.690 6.855
91 3.843 4.0223 15.458
Manually Dispensed Silicone Adhesive, Screen Printed Solder Paste (Board B) Short Circuit 0.000 95.00 0.000
Table 3.25: Functional Test Results Post Vacuum Chamber – Board B
Board Type Resistor Value (Ω)
Voltage (V)
Current (mA)
Power (mW)
Open Circuit 4.315 0.000 0.000
11000 4.252 0.039 0.164
1800 4.181 0.232 0.971
240 4.036 1.682 6.787
91 3.825 4.203 16.078
Manually Dispensed Silicone Adhesive, Screen Printed Solder Paste (Board B) Short Circuit 0.000 89.00 0.000

44
Table 3.26: Functional Test Results Post Thermal Cycling – Board B
Board Type Resistor Value (Ω)
Voltage (V)
Current (mA)
Power (mW)
Open Circuit 3.991 0.000 0.000
11000 3.972 0.036 0.143
1800 3.949 0.219 0.866
240 3.840 1.600 6.144
91 3.677 4.041 14.858
Manually Dispensed Silicone Adhesive, Screen Printed Solder Paste (Board B) Short Circuit 0.036 97.00 3.492
Table 3.27: Functional Test Results Post Vacuum Chamber – Board B
Board Type Resistor Value (Ω)
Voltage (V)
Current (mA)
Power (mW)
Open Circuit 4.011 0.000 0.000
11000 3.927 0.036 0.140
1800 3.910 0.217 0.849
240 3.673 1.530 5.621
91 3.290 3.615 11.895
Manually Dispensed Silicone Adhesive, Screen Printed Solder Paste (Board B) Short Circuit 0.019 68.00 1.292

45
Board 4a/b: Screen Printed Solder Paste Only
Assembly of boards 4a and 4b began with screen printing the solder paste across each of the solar cell pads on the PCBs. The screen was made with five different patterns to determine which would produce the most reliable solder joint. The completed product of solder paste application, prior to populating the board with components, can be seen in Image 13 below.
Image 3.10: Board 4a/b after screen printed solder paste application.
Once the boards were fully populated with solar cells, diodes, and a temperature sensor they were placed in the reflow oven to reflow the solder paste. After the boards were cleaned and sprayed with conformal coating, the boards underwent the first x‐ray inspection. Another x‐ray inspection was performed after all other testing was completed. Image14 and 15 show two x‐ray images, the before testing and after testing image for boards 4a and 4b. The dark grey portion of the solar cell is the solder paste, showing the electrical contact, and the light grey irregularly shaped circles are voids in the joint under x‐ray. Even with the assortment of patterns created, the solder paste was intended to merge together forming a continuous triangular electrical contact. However, the images show that this was not achieved and the cured solder paste was fragmented by the formation of trapped air.
Solder Paste

46
Image 3.11: Board 4a‐ initial x‐ray (left) and final x‐ray (right.)
Image 3.12: Board 4b‐ initial x‐ray (left) and final x‐ray (right.)
After the initial x‐ray was taken the boards were functionally tested in the solar simulator. A second, third, and fourth functional test were performed on board 4a after vacuum testing, thermal cycling, and vibration testing; a total of five functional tests were performed on board 4b, initial, then post thermal aging, vacuum, thermal cycling, and vibration. The results of these four tests for board 4a and five tests for board 4b are shown in the P‐V curves of Figure 10 and Figure 11, respectively, as well as Tables 34‐37 for board a and Tables 38‐42 for board b. It should be noted that for both board A and board B a slight voltage was measured during the short‐circuit validation scenario, where a voltage of zero would typically be seen, making the power a non‐zero value for this case.

47
Figure 10: Composite graph of functional test results for screen printed solder paste, board A.
Table 3.28: Initial Functional Test Results – Board A
Board Type Resistor Value (Ω)
Voltage (V)
Current (mA)
Power (mW)
Open Circuit 4.270 0.000 0.000
11000 4.154 0.038 0.157
1800 4.055 0.225 0.914
240 3.866 1.611 6.227
91 3.614 3.971 14.353
Screen Printed Solder Paste (Board A) Short Circuit 0.000 75.00 0.000

48
Table 3.29: Funtional Test Results Post Vacuum Chamber – Board A
Board Type Resistor Value (Ω)
Voltage (V)
Current (mA)
Power (mW)
Open Circuit 4.299 0.000 0.000
11000 4.227 0.038 0.162
1800 4.162 0.231 0.962
240 4.011 1.671 6.703
91 3.773 4.146 15.643
Screen Printed Solder Paste (Board A) Short Circuit 0.000 80.00 0.000
Table 3.30: Functional Test Results Post Thermal Cycling – Board A
Board Type Resistor Value (Ω)
Voltage (V)
Current (mA)
Power (mW)
Open Circuit 4.003 0.000 0.000
11000 3.990 0.036 0.145
1800 3.957 0.220 0.870
240 3.831 1.596 6.115
91 3.608 3.965 14.305
Screen Printed Solder Paste (Board A) Short Circuit 0.034 85.00 2.890

49
Table 3.31: Functional Test Results Post Vibration Testing – Board A
Board Type Resistor Value (Ω)
Voltage (V)
Current (mA)
Power (mW)
Open Circuit 3.749 0.000 0.000
11000 3.621 0.033 0.119
1800 3.598 0.200 0.719
240 3.413 1.422 4.854
91 3.192 3.508 11.197
Screen Printed Solder Paste (Board A) Short Circuit 0.000 78.00 0.000

50
Figure 11: Composite graph of functional test results for screen printed solder paste, board b.
Table 3.32: Initial Functional Test Results – Board B
Board Type Resistor Value (Ω)
Voltage (V)
Current (mA)
Power (mW)
Open Circuit 4.327 0.000 0.000
11000 4.040 0.037 0.148
1800 3.933 0.219 0.859
240 3.758 1.566 5.884
91 3.511 3.858 13.546
Screen Printed Solder Paste (Board B) Short Circuit 0.000 73.00 0.000

51
Table 3.33: Functional Test Results Post Extreme Thermal Cycling – Board B
Board Type Resistor Value (Ω)
Voltage (V)
Current (mA)
Power (mW)
Open Circuit 4.369 0.000 0.000
11000 4.254 0.039 0.165
1800 4.179 0.232 0.970
240 4.024 1.677 6.747
91 3.737 4.107 15.346
Screen Printed Solder Paste (Board B) Short Circuit 0.000 97.00 0.000
Table 3.34: Functional Test Results Post Vacuum Chamber – Board B
Board Type Resistor Value (Ω)
Voltage (V)
Current (mA)
Power (mW)
Open Circuit 4.243 0.000 0.000
11000 4.196 0.038 0.160
1800 4.125 0.229 0.945
240 3.950 1.646 6.501
91 3.667 4.030 14.777
Screen Printed Solder Paste (Board B) Short Circuit 0.000 92.00 0.000

52
Table 3.35: Functional Test Results Post Thermal Cycling – Board B
Board Type Resistor Value (Ω)
Voltage (V)
Current (mA)
Power (mW)
Open Circuit 4.031 0.000 0.000
11000 4.016 0.037 0.147
1800 3.982 0.221 0.881
240 3.841 1.600 6.147
91 3.580 3.934 14.084
Screen Printed Solder Paste (Board B) Short Circuit 0.029 95.00 2.755
Table 3.36: Functional Test Results Post Vibration Testing – Board B
Board Type Resistor Value (Ω)
Voltage (V)
Current (mA)
Power (mW)
Open Circuit 3.685 0.000 0.000
11000 3.611 0.033 0.119
1800 3.527 0.196 0.691
240 3.493 1.455 5.084
91 3.210 3.527 11.323
Screen Printed Solder Paste (Board B) Short Circuit 0.008 67.00 0.536

53
Chapter Four: Conclusions
General Observations
Upon completion of all testing and data collection, several observations based on the various configurations of materials and applications processes were noted. The first observation documented was that all eight boards survived the testing without any solar cell failure and produced nominal power values throughout the process. The P‐V curves for board sets 1, 2, and 3 all showed an increase in power from functional test #1 to post‐vacuum functional test #2 but board set 4 showed a slight decrease between tests #1 and #2. However, all boards showed a decrease in power output after vibration testing. The environmental testing excluding vibration, therefore, has shown to maintain or slightly improved the electrical performance of the solar cells. Although surviving the test profile confirmed the first level of success, it was not sufficient to be the sole method of validation.
Second, it was determined that screen printing solder paste alone, as implemented on boards 4a/b, is not a desirable solution for adhesive application. While the screen fabrication itself was both simple and inexpensive because it was made in house, the x‐rays showed that it produced an inconsistent solder joint that contained several voids. None of the patterns created a solder joint that could be repeated in multiple attempts.
Unlike the screen printed boards, the stencil printed solder paste on boards 2a/b produced a much less variable solder joint with fewer voids. Under x‐ray the solder joints of the individual solar cells on each of the two boards looked comparable showing a similar coverage pattern. However, board 2b‐thermally aged stencil printed solder paste‐ showed visible signs of cracking on both the electrically conductive and mechanical joint under x‐ray. Image 16 shows an enlarged image of the crack. Observing cracks under x‐ray after thermally aging the solar boards causes concern that using this design configuration may not be able to survive the expected and desired orbital lifetime.

54
Image 4.1: Thermally aged, stencil printed solder paste‐board 2a‐with visible crack seen under x‐ray.
A third observation came from inspecting boards 3a and 3b‐manually dispensed silicone adhesive, stencil printed solder paste. The silicone adhesive proved to be a better mechanical adhesive than solder paste alone because it did not suffer from cracking under extreme temperatures but the method of applying it by hand did cause problems. X‐ray inspection of the solder joints for this particular set of boards showed the silicone adhesive penetrating into the solder paste causing irregularities. An image of this irregularity is shown in Image 17. Due to the tackiness of the mixed silicone adhesive, application on the PCB using a paint brush was both difficult and not well regulated. After inspecting it using the x‐ray equipment it was observed that the unregulated application caused it to interact with the solder paste prior to curing causing the solder paste to reflow unevenly. Although this process produced one of the higher peak powers at 16.1 mW, the application of the silicone adhesive makes this a less desirable option.
Image 4.2: Board 3b‐manually dispensed silicone adhesive, stencil printed solder paste‐ irregularity seen under x‐ray.

55
The final board configuration 1a/b‐stencil printed silicone adhesive, manually dispensed solder paste‐had the most consistent solder joint under x‐ray with the added benefit of being the most standardized application process. Like boards 3a and 3b, using the silicone adhesive as the mechanical connection had the advantage of showing no signs of cracking after testing but also had a cleaner and easier application process than that of boards 3a/b. Of the four choices, this material and application process produced the most desirable result and a high measured peak power at 16.086 mW.
Future Work
Future board assembly will involve further investigation of additional application methods, larger solar cells, improved cleaning methods, and an extended test plan to further test workmanship with the ongoing effort to process and assemble solar panels in a repeatable and highly regulated method for small satellites. Once all design parameters are considered and validated, work will extend the fabrication process to carbon core laminate printed circuit boards with a thermal expansion coefficient more closely matched to the solar cells and other electrical components.

56
REFERENCES
[1] D. Erb, T. Clements, J. Lumpp, B. Malphrus, “Kentucky Space: A Multi‐University Small Satellite Enterprise”, 2009 Small Satellite Conference, August 2009.
[2] Engineering Fundamentals. Solder Types [Online]. Available: http://www.efunda.com/materials/solders/types.cfm
[3] GSFC‐STD‐7000; compiled by NASA Goddard Space Flight Center; issued April 2005; "GENERAL ENVIRONMENTALVERIFICATION STANDARD (GEVS) For GSFC Flight Programs and Projects."
[4] J. H. Lau. “Flux Materials and Associated Cleaning,” in Solder Joint Reliability Theory and Applications. London, Eng: International Thomas Publishing, 1991, ch. 5, sec. 5, pp. 156‐160.
[5] J. K. Lumpp, J. E. Lumpp, D. M. Erb, and M. N. Torabi."The Evaluation of Solder and Circuit Board Materials for Small Satellite Solar Cell Arrays."Aerospace Conference, 2010 IEEE (2010): 1‐6. Print.
[6] JNJ Industries. (2012) Durometer [Online]. Available: http://www.jnj‐industries.com/Polyurethane‐Squeegees.html
[7] J. Puig‐Suari, C. Turner, W. Ahlgren, “Development of the Standard CubeSat Deployer and a CubeSat Class PicoSatellite” in Aerospace Conference, 2001, IEE Proceedings. Big Sky, MT, 2001, pp 347‐353.
[8] J. R. Wertz, W. J. Larson.“Selecting Orbits for Earth‐Referenced Spacecraft”, in Space Mission Analysis and Design, Third Edition. Hawthorne, CA: Microcosm Press, 1999, ch. 7, sec. 4, pp. 179‐183.

57
[9] J. R. Wertz, W. J. Larson.“Power,” in Space Mission Analysis and Design, Third Edition.Hawthorne, CA: Microcosm Press, 1999, ch. 11, sec. 4, pp. 407‐410.
[10] J. R. Wertz, W. J. Larson.“Power,” in Space Mission Analysis and Design, Third Edition.Hawthorne, CA: Microcosm Press, 1999, ch. 11, sec. 4, pp. 413‐415.
[11] Kester. Standard Solder Paste Reflow Profile for Kester Paste Containing Alloys Sn63Pb37 or Sn62Pb36Ag02 [Online]. Available: http://www.digikey.com/Web%20Export/Supplier%20Content/Kester_117/pdf/kester‐pi‐standard‐reflow‐profile.pdf?redirected=1
[12] L. David. (2004, Sept. 08) “Cubesats: Tiny Spacecraft, Huge Payoffs” Available: http://www.space.com/308‐cubesats‐tiny‐spacecraft‐huge‐payoffs.html
[13] M. G. Guvench, C. Gurcan, K. Durgin, and D. MacDonald. "Solar Simulator and I‐V Measurement System For Large Area Solar Cell Testing." American Society for Engineering Education (2004). Print.
[14] S. Cole. (2011, Mar. 04) "NASA ‐ NASA's Glory Satellite Fails To Reach Orbit." NASA ‐ Home. Available: http://www.nasa.gov/home/hqnews/2011/mar/HQ_11‐050_N0_Glory.html
[15] The CubeSat Program, Cal Poly SLO. (2009, Aug. 01) “CubeSat Design Specification” Available: http://www.cubesat.org/images/developers/cds_rev12.pdf
58
VITA
Personal
Birth Place: Lexington, KY
Education
Bachelors of Science in Electrical Engineering, August 2008
Department of Electrical and Computer Engineering
University of Kentucky, Lexington, Kentucky
Work Experience
Research Assistant
08/2008 – 01/2009
Dr. Janet K. Lumpp, University of Kentucky, Lexington, Kentucky
Research Assistant
01/2009‐03/2012
Space Systems Laboratory, University of Kentucky, Lexington, Kentucky
Professional Honors
Best Session Paper – ‘Materials Selection and Processing Techniques for Small Spacecraft Solar Cell Arrays’
IMAPS 44th International Symposium on Microelectronics – October 2011
Best Student Paper ‐ ‘Materials Selection and Processing Techniques for Small Spacecraft Solar Cell Arrays’
IMAPS 44th International Symposium on Microelectronics – October 2011
Publications
J. K. Lumpp, J. E. Lumpp, D. M. Erb, and M. N. Torabi."The Evaluation of Solder and Circuit Board Materials for Small Satellite Solar Cell Arrays."Aerospace Conference, 2010 IEEE (2010): 1‐6. Print.
N.M. Torabi, J.K. Lumpp, J.E. Lumpp, “Materials Selection and Processing Techniques for Small Spacecraft Solar Cell Arrays,” Advancing Microelectronics 2012, Issue 1.