materials investigation and pavement design for upgrading gachororo road to bitumen standards
TRANSCRIPT

DEPARTMENT OF CIVIL, CONSTRUCTION AND ENVIRONMENTAL
ENGINEERING
Materials investigation and pavement design for upgrading
Gachororo road to bitumen standards.
By BYEBI BASEMA FABRICE
Reg. No. EN251-2193/2011
Supervised by Mr. Karimi
1/1/2016

i
DECLARATION
I, Byebi Basema Fabrice, do declare that this report is my original work and to the best
of my knowledge, it has not been submitted for any degree award in any University or
Institution.
Signed: ___________________________________ Date: _________________
BYEBI BASEMA FABRICE
EN251-2193/2011
CERTIFICATION
I have read this report and approve it for examination.
Signed: ______________________________________ Date: _________________
Mr. JOB KARIMI

ii
DEDICATION
First, I dedicate this research work to Almighty God who has brought me this far.
Second, I dedicate this research work to Eng. Basema Emmanuel and Rosette Chitera (my
loving parents) for the great sacrifice to make me who I am. May ‘God bless u’.
Finally, I dedicate this research work to my brothers and sister, who continuously gave me
moral and social support throughout my studies.

iii
ACKNOWLEDGEMENTS
I am indebted to a number of the personalities without whom my final year project would have
been a success. First and foremost, Almighty God for the abundant grace and care. Secondly,
My Supervisor Mr. Job Karimi for his expert guidance and assistance. Thirdly, to the
department of civil engineering for financing this research project.
Further appreciation goes to the laboratory team; Mr. Hinga, Mr. O. Juma and Ms. Lydia Ehaba
among other very able laboratory staff for their guidance and assistance during the testing phase
of this project.
I cannot forget my family, friends, and classmates for their support and motivation throughout
this project.

iv
ABBREVIATIONS
AASHTO American Association of State Highway and Transportation Officials
AADT Average Annual Daily Traffic
ADT Average Daily Traffic
ACV Aggregate Crushing Value
ASTM American Society for Testing and Materials
BS British Standard
CBR California Bearing Ratio
CR Crushing Ratio
DCP Dynamic Cone Penetrometer
ESA Equivalent Standard Axle
FI Flakiness Index
LAA Los Angeles Abrasion
LL Liquid Limit
MC Moisture Content
MDD Maximum Dry Density
OMC Optimum Moisture Content
PL Plastic Limit
PI Plasticity Index
PM Plasticity Modulus = (PI * % passing 0.425mm sieve)
DMBR Design Manual for Bridges and Roads (2009)
SG Specific Gravity
SS Standard Specification for Road Construction
SSS Sodium Sulphate Soundness
TS Tensile Strength
VH Vibrating Hammer

v
Table of Contents
DECLARATION.....................................................................................................................i
DEDICATION ...................................................................................................................... ii
ACKNOWLEDGEMENTS .................................................................................................. iii
ABBREVIATIONS ............................................................................................................... iv
Chapter 1: INTRODUCTION ................................................................................................. 1
1.1. Background information .............................................................................................. 1
1.2. Study justification ............................................................................................................ 2
1.2. Problem statement........................................................................................................ 3
1.3. Research objectives ...................................................................................................... 3
1.3.1. General objectives: ................................................................................................... 3
1.3.2. Specific objectives: ..................................................................................................... 3
1.4. Research hypothesis ..................................................................................................... 3
1.5. Research limitations ..................................................................................................... 4
Chapter 2. LITERATURE REVIEW ...................................................................................... 7
2.1 Introduction ...................................................................................................................... 7
2.2 Early Road Systems ......................................................................................................... 12
2.3 Pavement Design ............................................................................................................. 15
2.4 Flexible pavements. ......................................................................................................... 16
2.5 Load Distribution in flexible pavement. ........................................................................... 16
2.6. Traffic data and analysis. ................................................................................................. 17
2.6.1 Equivalent factors ................................................................................................. 18
2.6.4 Calculating the cumulative standard axles ............................................................. 19
2.6.5 Traffic class .......................................................................................................... 19
2.7 Basic Structural Elements of a road pavement .................................................................. 19
2.7.1 Sub grade .............................................................................................................. 20
2.7.2 Sub-base Course ................................................................................................... 20
2.7.3 Base Course .......................................................................................................... 21
2.7.4 Surface Course...................................................................................................... 21

vi
Chapter 3. RESEARCH METHODOLOGY ......................................................................... 23
3.1 Data collection ................................................................................................................. 23
3.1.1 Primary data ......................................................................................................... 23
3.1.2 Secondary data...................................................................................................... 24
3.2 Methods of pavement............................................................................................... 25
3.3 Data analysis .................................................................................................................... 25
3.4 Reporting ......................................................................................................................... 26
Chapter 4. DATA COLLECTION/ANALYSIS/RESULTS .................................................. 27
4.1 Traffic data collection and analysis .................................................................................. 27
Table 6 Three days’ traffic count data on Gachororo road ...................................................... 27
Table 7 Traffic data analysis .................................................................................................. 29
4.1.1. Annual growth rate of vehicles ..................................................................................... 31
Table 8 Number of registered vehicles from 2001 to 2015...................................................... 33
4.1.2. Annual growth rate of vehicles ..................................................................................... 35
4.1.3 Cumulative number of standard axles ............................................................................ 35
4.2. Materials investigation .................................................................................................... 35
4.2.1. Alignment soils ............................................................................................................ 35
Table 10 Sub grade Strength Class ......................................................................................... 39
4.2.2. Natural Materials for Base and Sub Base ...................................................................... 39
Table 11 Natural materials properties ..................................................................................... 40
4.2.3. Soft stone and quarry dust ............................................................................................ 40
Table 12 Soft stones and quarry waste ................................................................................... 41
4.2.4. Hard stones .................................................................................................................. 41
Table 13 Hard stones ............................................................................................................. 41
4.3. Rainfall data collection and analysis ................................................................................ 42
Table 14 Monthly total precipitation for Thika agro met station, Code 9137048 ..................... 43
Chapter 5. PAVEMENT DESIGN ......................................................................................... 45
5.1. General ........................................................................................................................... 45
5.2. Design Considerations..................................................................................................... 45

vii
5.2.1. Design Traffic Class ..................................................................................................... 45
5.2.2. Design Sub Grade Class ............................................................................................... 45
5.2.3. Internal Drainage of the Pavement Layers .................................................................... 45
5.2.4. Pockets of poor sub grade material ............................................................................... 45
5.3. Proposed Standard Pavement Structures .......................................................................... 46
Table 15 Proposed pavement structure ................................................................................... 47
5.4 Final Pavement Structure ................................................................................................. 48
5.4.1. Original Ground ........................................................................................................... 48
5.4.2. Sub Grade .................................................................................................................... 48
5.4.3. Sub base ....................................................................................................................... 48
5.4.4. Base ............................................................................................................................. 49
5.4.5. Surfacing AC ............................................................................................................... 49
5.4.6. Surfacing Wearing Course ............................................................................................ 49
5.4.7. Binder Selection ........................................................................................................... 49
5.4.8. Shoulders ..................................................................................................................... 50
5.4.9. Pavement Cross-Section ............................................................................................... 50
5.5. Mode of construction of pavement structure. ................................................................... 51
5.5.1 Subgrade construction. .................................................................................................. 51
5.5.2 Subbase construction ..................................................................................................... 51
5.5.3 Base construction .......................................................................................................... 51
5.5.4 Tact coat ....................................................................................................................... 52
5.5.5 Surface course construction ........................................................................................... 52
Chapter 6: CONCLUSION AND RECOMMENDATION ..................................................... 54
6.1. Conclusions .................................................................................................................... 54
6.2. Recommendations ........................................................................................................... 54
6.3. Further study. .................................................................................................................. 54
BIBLIOGRAPHY ................................................................................................................ 55
ANNEXES ........................................................................................................................... 56
ANNEX 1: MAP OF JUJA; GACHORORO ROAD............................................................. 56

viii
ANNEX 2: TIME PLAN ...................................................................................................... 57
ANNEX 3: PROPOSED BUDGET AND COSTING ........................................................... 58
ANNEX4: ............................................................................................................................ 59
ATTERBERG LIMITS SAMPLE 1 RUN 1 ......................................................................... 59
ATTERBERG LIMITS SAMPLE 1 RUN 2 ......................................................................... 60
ATTERBERG LIMITS SAMPLE 2 RUN 1 ......................................................................... 62
ATTERBERG LIMITS SAMPLE 2 RUN 2 ......................................................................... 63
ANNEX5: ............................................................................................................................ 65
COMPACTION TEST SAMPLE 1 RUN 1 .......................................................................... 65
COMPACTION TEST SAMPLE 1 RUN 2 .......................................................................... 66
COMPACTION TEST SAMPLE 2 RUN 1 .......................................................................... 68
COMPACTION TEST SAMPLE 2 RUN2 ........................................................................... 69
ANNEX4: ............................................................................................................................ 71
CBR SAMPLE 1 RUN 1 ...................................................................................................... 71
CBR SAMPLE 1 RUN 2 ...................................................................................................... 73
CBR SAMPLE 2 RUN 1 ...................................................................................................... 75
CBR SAMPLE 2 RUN 2 ...................................................................................................... 77

ix
List of tables
Table 1 Table 1 Kenya roads network coverage in kilometers (Kenya roads boards) ...............7
Table 2 Description of road classes in Kenya (old classification) ...........................................7
Table 3 Description of rural roads (new classification) ...........................................................9
Table 4 Description of urban road classification (new classification) ................................... 11
Table 5 Road design manual part111, material and pavement design .................................... 19
Table 6 Three days’ traffic count data on Gachororo road ..................................................... 27
Table 7 Traffic data analysis ................................................................................................. 29
Table 8 Number of registered vehicles from 2001 to 2015 .................................................... 33
Table 9 Fuel levy from 2001 to 2015 .......................................................................................
Table 11 Sub grade Strength Class........................................................................................ 39
Table 12 Natural materials properties ................................................................................... 40
Table 13 Soft stones and quarry waste .................................................................................. 41
Table 14 Hard stones ............................................................................................................ 41
Table 15 Monthly total precipitation for Thika agro met station, Code 9137048 ................... 43
Table 16 Proposed pavement structure .................................................................................. 47

x
List of figures
Figure 1 Map ..........................................................................................................................2
Figure 2 Lorry on Gachororo road ..........................................................................................5
Figure 3 Lorry carrying excavated soils from construction site ...............................................5
Figure 4 Ndarugu quarry.........................................................................................................6
Figure 5 One of the school along Gachororo road ...................................................................6
Figure 6 roman road structures (Kendrick, 2004) .................................................................. 14
Figure 7 Road pavement layers ............................................................................................. 15
Figure 8 Soil layers along the road (both samples) ................................................................ 36
Figure 9 Tins +soil ready to be oven dried ............................................................................ 37
Figure 10 compaction machine ............................................................................................. 37
Figure 11 soil after compaction............................................................................................. 38
Figure 12 CBR test ............................................................................................................... 38

xi
Abstract
Pavement design of a road enables engineers to come up with pavement structure that is socio-
economically efficient and long lasting with the least discomfort to the people using it during
its design life.
A road pavement consists of multiple layers made of materials that may be different in nature
and strength. These materials act together as one in order to achieve their purpose.
The pavement design depends primarily on the traffic (both present and anticipated) and on
materials beneath the proposed road route and the available materials in the neighborhood.
Hence the need of a thorough materials investigation.
This study came up with a traffic analysis which classified the traffic on this road as traffic class
T3, material lab testing whose resulting revealed the presence of materials of class S3, and the
materials investigation which provided information on type, location and engineering properties
of materials that can be used for the construction of this road.
Using the above information and considering all cost and field conditions, a pavement structure
was designed.
The study came up with various combination of pavement structure from which the best was
selected, depending on the conditions in the field and the cost of construction.

1
Chapter One
INTRODUCTION
1.1.Background information
Roads are vital for socio-economic development, but construction, operating and maintenance
cost can be very expensive in cases where they are constructed in a rainy area but also if road’s
surface performs poorly.
A good road should be all-weather, and thus movement along it should not be affected by the
weather condition. It should be able to accommodate a wide range of climatic and traffic
conditions that roads are expected to endure.
Gachororo road covers a distance of about 2.5kilometers; it is unpaved and in very bad
condition. This road is situated on the right-hand side of JKUAT. It not only serves students
from the best technological university in Kenya but also the families that live or have businesses
along it and the construction industry developing in the surrounding.
It starts from JKUAT main gate (also called gate A), passes by the entrance of KCB Bank
JKUAT branch, goes to gate B then passes by the university gate D and its right end corner.
This road continues in the same direction passing a community (i.e. both families and students)
that live alongside it, the facilities they use such as schools, shops, supermarkets and continues
to both the quarry and river Ndarugu. Along the road, there are many shops, a market, farms
and many households.
The road not being tarmacked brings up health problems due to dust being inhaled by the
residents, difficulties of mobility and accidents (especially when it rains) and also high
maintenance cost of the moving entities that use this road.
Therefore, a thorough materials investigation and the design of the pavement structure would
help enhance the condition this important road in the most effective way possible once the
design is implemented.

2
Figure 1 Map
1.2. Study justification
Gachororo road is an unpaved road and has not been maintained in a very long period even
though other roads that join it at some point have. This is the case of the road joining High point
to Gachororo road, next to Gachororo School. The use of the road by heavy commercial vehicles
(carrying stones from the quarry, farm products and soils from different construction sites),
public service vehicles, pick-ups and the long periods of non-maintenance of the road have led
to deterioration of the condition of the road making it impassable especially during the wet
periods of the year.
The population of traffic using the road has increased due to the construction of Thika road
which attracts people and investments along its environs. Thika road has led to increase in
population of the university and that of the surrounding of the road which encourages massive

3
construction and use of more stones from the quarry and also opening of businesses which in
their turn attract traffic to this area.
These new developments and lack of maintenance have worsened the condition of Gachororo
road which if upgraded and maintained will ease the transportation and socio-economic
development, improve the quality of air that residents breathe but also the image and prestige
of JKUAT which is a globally well-known institution hence the need to upgrading it to
bituminous standards.
1.2.Problem statement
The lack of a pavement of this road is continuously producing dust that affect the health of
residents and pollute the environments, causing accidents due to vehicle sliding when it rains,
wearing up vehicles increasing their maintenance cost, increase both cost and time of travel due
to the poor road surface and impair the image of university that is known to the world to be one
of the best in the country and the region. The condition of this road goes against the Sustainable
Development Goals and the vision 2030, hence the need of upgrading it to bituminous road that
is the most economical and efficient through materials investigation and pavement design.
1.3.Research objectives
1.3.1. General objectives:
To design a pavement that best accommodates current and predicted future traffic needs in a
safe, durable and cost effective manner.
1.3.2. Specific objectives:
1. To estimate the daily number of vehicles on the road and hence the cumulative
number of standard axles.
2. To determine the California Bearing Ratio and the Plasticity Index of soil and other
construction materials along Gachororo road.
3. To design and recommend a suitable pavement structure for the project road.
1.4.Research hypothesis
The poor conditions on this road are due to poor or non-existent drainage facility, lack of a
bituminous standard and maintenance of the road.

4
Materials investigation and design of Gachororo road, if implemented, would help improve
poor road conditions, health condition, and socio economic condition in the area.
1.5.Research limitations
The limitation of the study includes
Inadequate time: this is due to the fact that the project is to be carried out concurrently
with other courses.
Limitation of funds: the funds available for this work are very small
Missing data: some data such as traffic count or materials properties maybe missing
from government agencies.

5
Figure 2 Lorry on Gachororo road
Figure 3 Lorry carrying excavated soils from construction site

6
Figure 4 Ndarugu quarry
Figure 5 One of the school along Gachororo road

7
Chapter Two
LITERATURE REVIEW
2.1 Introduction
According to the Kenya roads board, the road network in Kenya is in total 160866km out of
which only 11189km are paved leaving the rest (149689km) as either gravel or earth roads.
(See table below)
Table 1 Table 1 Kenya roads network coverage in kilometers (Kenya roads boards)
Road class Paved(km) Unpaved(km) Total(km)
A 2,772 816 3,588
B 1,489 1,156 2,645
C 2,693 5,164 7,857
D 1,238 9,483 10,721
E 577 26,071 26,649
SPR 100 10,376 10,476
U 2,318 96,623 98,941
TOTAL 11,189 149,689 160,886
Table 2 Description of road classes in Kenya (old classification)
Class description Function
A International
Trunk Roads
Link centers of international importance and cross
international boundaries or terminate at international
ports or airports (e.g. Mombasa)
B National Trunk
Roads
Link nationally important centers (e.g. Provincial
headquarters)
C Primary Roads Link provincially important centers to each other or to
higher class roads (e.g. District headquarters)

8
Note that the above road classification is the old road classification of roads. It was developed
over 30 years ago and is defined by the functional criteria related to administrative level of
centers the road connects.
Below is the new classification of roads.
It consists of three broad groupings,
1. Arterial or trunk roads, comprising Superhighways (S roads), which are fully access
controlled motorways or toll roads, and the international (A roads), and the national
roads (B roads).
2. Collector roads, comprising the primary, inter-district C roads and the secondary, intra
district roads
3. Local, comprising the minor E, F, and G class roads.
D Secondary Roads Link locally important centers to each other, or to more
important centers or to a higher class road (e.g. divisional
headquarters)
E Minor Roads Any link to a minor centre
SPR G
L
R
S
T
W
Government Roads
Settlement Roads
Rural Access Roads
Sugar Roads
Tea Roads
Wheat Roads
U Unclassified All other public roads and streets

9
Table 3 Description of rural roads (new classification)
No. Road
class Class description
1 S
Highways connecting two nor more cities and designed to carry
safely large volumes of motor vehicles traffic at high speeds
through the use of grade separation using interchanges,
overpasses and underpasses. These roads would be
predominantly tolled.
Predominantly dual carriageways of at least two lanes in each
direction.
Having maximum access restrictions by imposing full control
access from adjacent properties and eliminating all cross traffic
with full grade separation
2 A
Road forming strategic routes and corridors, connecting
international boundaries and international terminals such as
international ports.
International routes should form a continuous connection with
strategic routes in adjoining countries; they include international
corridors recognized under the Tran-Africa Highway and East
African Road Networks.
A substantial part of the traffic carried will be long distance
movements including a high portion of heavy vehicles.
3 B
Roads forming important national routes, linking province
headquarters or other important centers to the capital to each
other or to Class A roads.
These roads usually cross province boundaries, but may link
several district towns within the same province.
A substantial part of the traffic is expected to comprise long
distance movements.
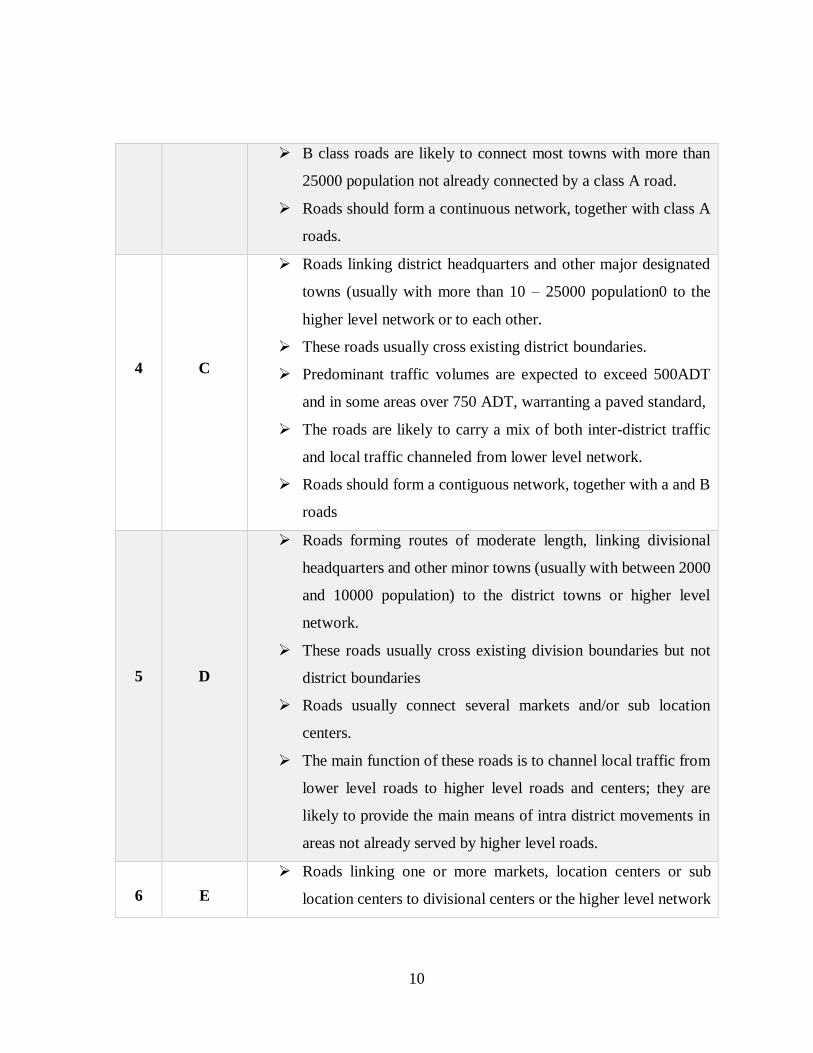
10
B class roads are likely to connect most towns with more than
25000 population not already connected by a class A road.
Roads should form a continuous network, together with class A
roads.
4 C
Roads linking district headquarters and other major designated
towns (usually with more than 10 – 25000 population0 to the
higher level network or to each other.
These roads usually cross existing district boundaries.
Predominant traffic volumes are expected to exceed 500ADT
and in some areas over 750 ADT, warranting a paved standard,
The roads are likely to carry a mix of both inter-district traffic
and local traffic channeled from lower level network.
Roads should form a contiguous network, together with a and B
roads
5 D
Roads forming routes of moderate length, linking divisional
headquarters and other minor towns (usually with between 2000
and 10000 population) to the district towns or higher level
network.
These roads usually cross existing division boundaries but not
district boundaries
Roads usually connect several markets and/or sub location
centers.
The main function of these roads is to channel local traffic from
lower level roads to higher level roads and centers; they are
likely to provide the main means of intra district movements in
areas not already served by higher level roads.
6 E
Roads linking one or more markets, location centers or sub
location centers to divisional centers or the higher level network

11
7 F
Roads serving groups of rural population of less than 4500 in
average density areas, without a market or a most one mirror
market, and usually will provide a connection to a sub location
centre, a more important market or the higher level network.
8 G Residual category for the large number of very local tracks and
access roads
Description of urban road classification (new classification)
Urban roads are all roads or sections of road captures in the road database that lie within a
municipal boundary. This definition applies to rural roads classes D, E, F and G and does not
apply to A, B, C class roads.
Classification of urban roads network adopts similar concept of functional hierarchical
grouping as used for rural roads, the urban road network consists of the following three
functional groupings which further provide the urban class hierarchy.
Table 4 Description of urban road classification (new classification)
Functional system Service provided
Arterial
Provides highest level of service at the
greatest speed for the longest uninterrupted
distance within a municipality, with access
control
Collector
Provides less highly developed level of
service at lower speed for shorter distances
by collecting traffic from local roads and
connecting them to arterials.
Local
Consists of all roads not defined as arterials
or collectors, primarily provides access to
residential, commercial or industrial areas
with tittles or no through movement.

12
The Kenyan Government has faced a various obstacles regarding the provision of adequate
transportation network; the leading one being inadequate financial resources for development
and maintenance of roads. This has led to poor road network especially in rural areas which
has caused high vehicle operating cost, high fares charged for public transport and unstable
delivery schedules. The inception of the Road Maintenance Levy Fund (RMLF) in 1993 and
the Local Authority Transfer Fund (LATF) was meant to address the financial constraints facing
the road infrastructure; however, the fund is still not adequate to meet the demand. To
strengthen the institutional framework for road maintenance, restore accountability,
transparency and professionalism the government established the Kenya Roads Board (KRB)
in 1999 to manage RMLF and coordinate the maintenance rehabilitation and development of
the entire road network in Kenya. The KRB works in conjunction with other stakeholders such
as:
Kenya national highway authority (KENHA), which manages all road class A, B and C
Kenya rural road authority(KERRA), deal with local roads at constituency level
Kenya urban Roads Authority (KURA), Deal with Roads in city, municipalities and
major towns.
So as to address most of the problems that road transport is currently facing such as increased
road traffic, increased economic and social demands and deterioration of existing road due to
poor maintenance, the government has to fund the concerned agencies in order to enable them
to be fully operational.
2.2 Early Road Systems
The first forms of road transport were horses, oxen or even humans carrying goods over tracks
that often followed game trails. In the Stone Age humans did not need constructed tracks in op
en country. The first improved trails would have been at fords, mountain passes and through s
wamps. The first improvements would have consisted largely of clearing trees and big stones
from the path.
As commerce increased, the tracks were often flattened or widened to accommodate human an
d animal traffic. Some of these dirt tracks were developed into fairly extensive networks, allo
wing communications, trade and governance over wide areas.

13
The first goods transport was on human backs and heads, but the use of pack animals, including
donkeys and horses, developed during the Stone Age. The first vehicle is believed to have been
the travois, a frame used to drag loads, which probably developed in Eurasia after the first use
of bullocks (castrated cattle) for pulling ploughs.
As time goes by, pack animals, ridden horses and bullocks dragging travois or sleds required w
ider paths and higher clearances than people on foot and improved tracks were required. As a r
esult, by about 5000 BC, roads including the Ridgeway developed along ridges in England to a
void crossing rivers and bogging. In central Germany, such ridgeways remained the predomin
ant form of long-distance road till the mid-18th century.
Below are some of the oldest civilizations’ road:
(a) Chinese Civilization
One of the earliest and best known roads was the Chinese Silk Route which dates back to 2600
BC. The Chinese discovered the secret of silk weaving and sent this precious material by road
to India and returned with ivory tusks (Rakeman, 1823).
(b) Persian Empire
This was a great trading organization. Silk imported from China was re-exported to Europe
along the roads they had built. They also sold Chinese porcelain and precious wood ware
(Rakeman, 1823).
(c) Britain 2500 BC
Log-raft type of road has been discovered; this crosses the Somerset peat bogs to Glastonbury
dating back to 2500 BC. The Berkshire Ridgeway was used to bring flint axes and weapons
from Grimes Graves in Norfolk over the Chiltern and Berkshire Downs and Salisbury Plain to
Stonehenge (Rakeman, 1823)
(d) Mesopotamia and Egypt
Moving to the Middle East and forward in time to about 1100 BC, Syrian troops constructed a
new road through the mountains of northern Mesopotamia. Streets paved in asphalt and brick
have been found in the Cities of Nineveh and Babylon. The Egyptians built roads to cart the
stone required to construct the pyramids (Rakeman, 1823)

14
(e) Roman Roads
The Roman era was undoubtedly the greatest road building age not only in Britain but
throughout Europe. Five thousand miles of their superb highways stretched from Cadiz on the
west coast of Spain through France, Germany, Italy, and the Adriatic coast to Turkey, through
Syria at the eastern end of the Mediterranean, back along the north coast of Africa via
Alexandria, Carthage and so on to Tangier to complete the loop (Rakeman, 1823). Their roads
were renowned for their straightness but they were only straight in most cases between one hill
top and another, i.e. as far as the eye could see. There is less chance of ambush on a straight
road and the use of four wheeled wagons was not causing any problem. Roman roads were
generally constructed well above the ground level, being in some cases on embankments up to
2 m high. The first operation was to cut deep ditches or fosses (hence Fosse way) and then build
up an embankment with layers of chalk, flint, sand and gravel topped off with huge stone slabs.
Any marauder would have to cross the ditches and scrambles up the embankment first. Three
classes of road structure were used by the Romans; these were:
Levelled earth
Graveled surface
Paved (figure 1below)
Figure 6 roman road structures (Kendrick, 2004)

15
This conforms roughly with current road structure (i.e. four layers). The carriageway width
seldom exceeded 4.25metres (Peter Kendrich, 2004). The carriageway had drainage ditches on
each side. After the withdrawal of the Romans from Britain at the start of the fifth century AD
(AD 407) their road system fell into decay and disuse. As states developed and became richer,
especially with the Renaissance, new roads and bridges began to be built, often based on Roman
designs. This resulted into roman roads being considered as the bases of modern highway
engineering technology in use today.
2.3 Pavement Design
The purpose of pavement design is to limit/reduce the stress induced on the sub grade by the
traffic safe level at which sub grade deformation is insignificant while at the same time ensure
that the road pavement does not deteriorate to any serious extent within the lifetime it is
designed for.
By the nature of the type of material used for construction, it is impossible to design a road
pavement which does not deteriorate in some way with time and traffic. Hence the aim of
structural design is to limit the level of pavement distress, measured primarily in terms of riding
quality, rut depth and cracking to predetermined values (Powell et al,1984).
A road pavement consists of a number of layers with sub grade at the bottom, sub base, base
and surfacing on top.
Figure 7 Road pavement layers

16
A concrete pavement consists of a concrete slab laid on a sub-base or base which rests on sub
grade.
Pavement design aims at providing a pavement structure that will serve traffic safely,
conveniently and economically during the design life of that pavement. There are various types
of bituminous premixes used for roads surfacing:
Flexible premix which is designed to resist high flexural deformations. This pavement
with a bitumen bonded surfacing and road base.
Flexible Composite: The surfacing and upper road base are bituminous on a lower road
base of cement bound material
Rigid: Pavements with a concrete surface slab which can be un-reinforced, joint
reinforced or continuously reinforced.
Rigid Composite: continuously reinforced concrete slab with a bituminous overlay.
Although there has been considerable advance in the theoretical design of pavements, the
current road design work is based on empirical methods and design charts (AASHTO, 1986).
A design is carried out for each of the alternatives and then the most economical is chosen.
However, if for environmental or technical reasons one is impractical then it may be omitted.
2.4 Flexible pavements.
Flexible pavements are so named because the total pavement structure deflects, or flexes, under
loading. A flexible pavement structure is typically composed of several layers of
material. Each layer receives the loads from the above layer, spreads them out, and then passes
on these loads to the next layer below. Thus, the further down in the pavement structure a
particular layer is, the lower loads (in terms of force per area) it must carry (NPTEL, 2007).
In order to take maximum advantage of this property, material layers are usually arranged in
order of descending load bearing capacity with the highest load bearing capacity material
(which is the most expensive) on the top and the lowest load bearing capacity material (which
is the least expensive) on the bottom.
2.5 Load Distribution in flexible pavement.
Stresses (loads per unit area) from the vehicles travelling on the road are greater nearer the
surface; stronger materials are needed in the surfacing than in the lower layers. In addition,

17
there are lateral deflective forces caused by the pounding effects of heavy traffic. This has led
to the development various road layers with different properties.
Another factor of great importance is the surface profile. An uneven surface will not only be
unsuitable for the safe road travel, but will also cause greater, and variable stresses in the
pavement, leading to fatigue of the structure and shortening its life.
These two factors have led to the development of layered construction, the lower layers of
which are thicker and of cheaper materials, in order to provide the necessary spread of the load.
Each layer must be shaped and compacted as accurately as possible, the surface layer thus being
shaped into an accurate and even surface.
2.6. Traffic data and analysis.
When designing a new highway, the estimation of traffic levels is of central importance to the
structural design of the upper layers of the road pavement. Of particular importance is the
estimation of commercial vehicle volumes. Commercial vehicles are defined as those with an
unlade weight of 15kN. The damage due to these vehicles as compared to private cars is
negligible, hence termed as primary cause of structural damage to the highway pavement.
Road pavement design depends on the cumulative number of equivalent standard axles in its
design period. In order to determine this value a number of operations must be carried out.
The axle load distribution of the traffic which will use the road must be assessed,
These axle loads must be converted to equivalent number of standard 80KN axles,
The initial daily number of standard axles must be calculated,
An annual growth rate and design period must be selected,
The accumulated number of equivalent standard axles can thus be calculated and the
traffic class determined.

18
2.6.1 Equivalent factors
Axle load equivalent factors: The relationship below converts all single axle loads to equivalent
standard axles
EF= (Ls/80) 4.5
Where: -EF is the equivalent factor of the single axle considered
-Ls is the load in KN on the singe axle considered
The relationship above was derived from Liddle formulae
2.6.2 Estimation of the initial Daily number of commercial of commercial vehicle
It is necessary as the first step to estimate the average daily number of each type of commercial
vehicle that will use the road, in both directions during the first year. Due to fact that private
cars and light good vehicles do not contribute significantly to the structural damage of pavement
they may be ignored but in the case of Gachororo road, they won’t be.
It is essential that the traffic count data differentiate between buses, medium goods and heavy
goods. In addition, on trucks the counting should indicate whether or not a heavy good vehicle
is an oil tanker and the number of axles.
2.6.3 Estimation of cumulative number of standard axles
To estimate the total number of standard axles to be catered of by the design, it is necessary to
forecast the annual growth rate of traffic and to decide what the design period will be.
a) Forecasting and annual growth rate: this is a difficult and uncertain task. It can be done
by studying the annual tread in traffic growth indicated by census regularly carried out in the
region concerned, also from study of the regional and national development plans. In regions
where data is not available, national trend of number of vehicles registered or the fuel
consumption or the gross national product (GNP) or rather the gross domestic product (GDP)
can a be used to estimate growth rate of traffic.
b) Choice of a design period: The concept of design period should not be confused with
pavement life. At the end of design period the pavement will not be completely worn out or
have deteriorated to the point that reconstruction is needed. During the design period, only
ordinary maintenance will be carried out i.e. shoulder and drainage system maintained,

19
vegetation control localized patching and periodic resealing. For roads designed according to
Kenya road dosing manual should have a design period of 15 years as stage construction is
preferred.
2.6.4 Calculating the cumulative standard axles
The cumulative number of standard axles, T over the chosen design period N (in years) is then
obtained by:
𝑻 = 𝟑𝟔𝟓𝑿𝐭𝟏 (𝟏+𝐢)𝑵−𝟏
𝒊
Where: 𝒕𝟏 is the average daily number of standard axles.
i is the annual growth rate expressed as a decimal fraction.
2.6.5 Traffic class
Traffic flow and axle-load survey have shown that the following class satisfactory account for
all the traffic categories likely to be carried by the bituminous loads in Kenya.
Table 5 Road design manual part111, material and pavement design
Class Cumulative number of standard axle
T1 25 million-60 million
T2 10 million-25 million
T3 3 million-10 million
T4 1 million-3 million
T5 0.25 million-1 million
2.7 Basic Structural Elements of a road pavement
A typical flexible pavement structure consists of the surface course and the underlying base and
sub-base courses. Each of these layers contributes to structural support and drainage. The
surface course is the stiffest and contributes the most to pavement strength. The underlying
layers are less stiff but are still important to pavement strength as well as drainage and frost
protection. A typical structural design results in a series of layers that gradually decrease in
material quality with depth. The layers include:

20
2.7.1 Sub grade
Also referred to as basement soil, the sub grade is that portion of the roadbed consisting of
native or treated soil on which surface course, base, sub base, or a layer of any other material
is placed.
It is the foundation of the road. In a cut-section, it is the layer 300mm below the finished sub-
grade level (formation) or if it is an embankment, it may also be the layer 300mm below the
finished level of the embankment. It has to be compacted at 95% MDD.
The sub-grade may be composed of either in-place material that is exposed from excavation, or
embankment material that is placed to elevate the roadway above the surrounding ground.
It carries the whole weight of the pavement plus the traffic loads. Therefore, the soil should be
of adequate strength.
The sub grade though not part of pavement is very important (quality wise) in any pavement
design as it effect the thickness of the various layers of the pavement and also determine the
rate at which some road distress like rutting occur.
The strength of the subgrade is determined using deflection modulus but due to complexity of
the procedure for obtaining it, a much simpler method called the California Bearing Ratio
(CBR) test is the most commonly used. The CBR depend on the type of soil, density and
moisture content (usually four-day soak) of the soil.
2.7.2 Sub-base Course
This is unbound or treated aggregate or granular material that is placed on the sub grade as a
foundation or working platform for the base. It is placed between the base course and the sub-
grade. It functions primarily as structural support but it can also:
Minimize the intrusion of fines from the sub-grade into the pavement structure.
Improve drainage.
Minimize frost action damage.
Provide a working platform for construction
Most of the time the sub-base is of lower quality materials than the base course but better than
the sub-grade soils. It can be ignored in some cases. For instance, a pavement constructed over
a high quality sub grade (CBR > 35) or where it is more cost effective to build a thicker base

21
layer. However, a pavement constructed over a low quality soil such as swelling clay may
require the additional load distribution characteristic that a sub-base course can offer. In this
scenario the sub-base course may consist of high quality fill used to replace poor quality sub-
grade (over excavation).
2.7.3 Base Course
Select, processed, and or treated aggregate material that is placed below the surface course. Its
functions include the following;
It provides additional load distribution
Contributes to drainage and frost resistance.
provide a good shaped and regular surface on which to lay the relatively thin wearing
course
Base may be one or multiple layers treated with cement, asphalt or other binder material, or
may consist of untreated aggregate. The type of material used for a base course is selected
according to the intensity of traffic loading expected, whilst the nominal size of the stone (20,
28 or 40 mm) depends on the thickness of the layer. The thicker the base course, the larger the
stone size.
In new construction, the thickness of the base course is usually between 45 mm and 105 mm.
Where a base course is laid as a regulating course, however, to strengthen an existing road
structure, the thickness may vary considerably.
2.7.4 Surface Course
The upper layer also called the wearing course, mostly made of asphalt and aggregate mixture
and some and other admixture like lime or fines. Its functions include;
provide a durable skid-resistant surface;
protect the pavement from the effects of the weather like rainfall and frost which may
penetrate and cause destruction to other pavement under laying layers like the sub base
and the sub base
withstand the effects of abrasion and stresses from the traffic;
Provide a good regular shaped running surface.

22
The surface course is the layer in contact with traffic loads and normally contains the highest
quality materials. A wide variety of bituminous materials is used for wearing courses, laid in
thicknesses ranging normally from 25-40 mm, important points in new construction are the
additional strength which the wearing course may add to the pavement and the extent to which
it forms an impervious layer over the construction
The surface course may be composed of a single layer, constructed in one or more lifts of the
same material, or multiple layers of different materials (NAPA, 2001). This top structural layer
of material is sometimes subdivided into two layers (NAPA, 2001):
a. Wearing Course. This is the layer in direct contact with traffic loads. It is meant to take
the major of traffic wear and can be removed and replaced as it becomes worn. A
properly designed preservation program should be able to identify pavement surface
distress while it is still confined to the wearing course. This way, the wearing course
can be rehabilitated before distress propagates into the underlying intermediate/binder
course.
b. Intermediate/Binder Course. This layer provides the bulk of the pavement
structure. Its chief purpose is to distribute load.
23
Chapter Three
RESEARCH METHODOLOGY
This work mainly consisted of two phases. The first phase was the collection of data and the
other the analysis and design depending on the analyzed data.
3.1 Data collection
The data collection was based on soil tests, field survey, and rainfall data from Kenya
meteorological department and traffic counts. Two types of data were collected:
3.1.1 Primary data
It was collected afresh and for the first time from the field, it will include;
a) Traffic count data; The data showing the annual average daily traffic data(AADT) of the
road and the axle road distribution of axle loading of the traffic using the road at the year of
design.
b) Samples testing; Samples of materials from several sections along the road as well as
potential borrow sites were collected, taken to material laboratory, prepared and then tested
according to the required standards. The various tests carried out are;
California bearing ratio (CBR) test. The test was conducted on the road reserve at
intervals of 1km.A portion of material that was obtained by riffling or quartering, and
large enough to provide 5.5kg of material passing a 20mm BS test sieve for each test.
The CBR of the sample being the relationships between the penetrations of cylindrical
plunger of cross-section area of 1935mm that penetrate the soil at a given rate. At any
rate the ratio of the force to the standard force was defined as the CBR. The force at
2.5mm penetration, after the necessary correction on the curve of load on the plunger
verses penetration of the plunger was expressed as a percentage of the standard force-
13.24KN and at 5mm penetration of 19.96KN. The greater of the two was reported as
the CBR of the specimen.
After the determination of the dry density and CBR at each level of compaction a graph
of CBR against dry density was plotted. Compaction at other points of 95% and 90%
24
were determined from this graph. The obtained CBR value was used together with the
traffic class to design the pavement.
Plastic limit test PL. This is the moisture content below which a soil ceases to behave in
a plastic manner. The test was carried out on soil obtained in its natural form. It was
dried to near its plastic limit by air-drying, molded into a ball and rolled between palms
of the hands. When the soil was near its plastic limit, a thread of about 6mm and 50mm
long was rolled over the surface of a smooth glass plate between the fingers of one hand
with backward and forward movement and just enough rolling pressure was applied to
reduce the thread to a diameter of 3mm. The test was repeated until the thread crumble
or shear both longitudinally and transversally at 3mm diameter.
Liquid limit test. This was carried out by use of definitive cone penetration method. The
test consists of a 300cylidrical cone with a sharp point and a smooth polished surface
and a total mass of 80 g that was allowed to fall freely into a cup of a very moist soil
which was near or just below its liquid limit. The liquid limit of the soil is taken as the
penetration of 20mm.The alternative method which can be used is the cassagrande
method, but this method is more prone to errors and gives less reproducible results when
compared with the cone penetration test.
3.1.2 Secondary data
This is data that have been collected and passed through the statistical process. This will
include;
a) Traffic data for the road from Kenya bureau of statistics. The fuel levy and the new
vehicle registration data for the past fifteen years.
b) Rainfall data; the rainfall data for the area on which the pavement is to be designed was
obtained from the meteorological department. It did include the maximum monthly 24 hours’
rain depth for a period of 29 years (1985 to 2014).
c) Borrow pit data: This data contained borrow pit information (type, engineering properties,
and source location of different materials) that are used by the Kiambu County for road
construction.
25
3.2 Methods of pavement.
The design was mainly based on the Kenya road design manual part III; materials and pavement
design for new roads which was supplemented with other design methods like various
international road note from Transport research laboratory based in United Kingdom and the
United States of America. The road notes included;
Road note 29 and 31 Guides for structural design of bituminous surface roads in the
tropical and sub-tropical countries
Road note 40 A guide to axle loading and traffic count for determining traffic loading
on the pavement.
Road note 19 A guide to the design of hot mix asphalt in tropical and sub-tropical
countries.
The American highway design manual in conjunction with the AASHTO design codes.
3.3 Data analysis
Various methods were used in data analysis during the design periods. Empirical formulas were
also used for traffic count data analysis, these included;
Liddle formula: EF= (Ls/80) 4.5
Where: -EF is the equivalent factor of the single axle considered
-Ls is the load in KN on the singe axle considered.
Cumulative standard axles: 𝑇 = 365𝑡1 {(1+𝑖)𝑁−1
𝑖} Where N is the design period in
years, t1 is initial average no. of Standard Axles, and i is annual growth Rate as a decimal
fraction.
The following are some of the assumptions made so as to use these formulae:
The personal car and light weight vehicles cause no damage to the pavement as only
heavy commercial and medium weight vehicles are used in computation of cumulative
standard axles.
No traffic will be diverted from another road to this road once it is constructed.
The analytical and empirical methods of data analysis and pavement design will not be used
due to the fact that the software to be used analysis and design is not available during the time
of the study due to the high cost.

26
3.4 Reporting
The reports for the test to be carried out were given in standard table form and the necessary
graphs were plotted. The report showed;
The method of testing adopted
The errors of the test if any and the source of such errors and how they would have been
collected.
The challenges encountered during the test.

27
Chapter Four
DATA COLLECTION/ANALYSIS/RESULTS
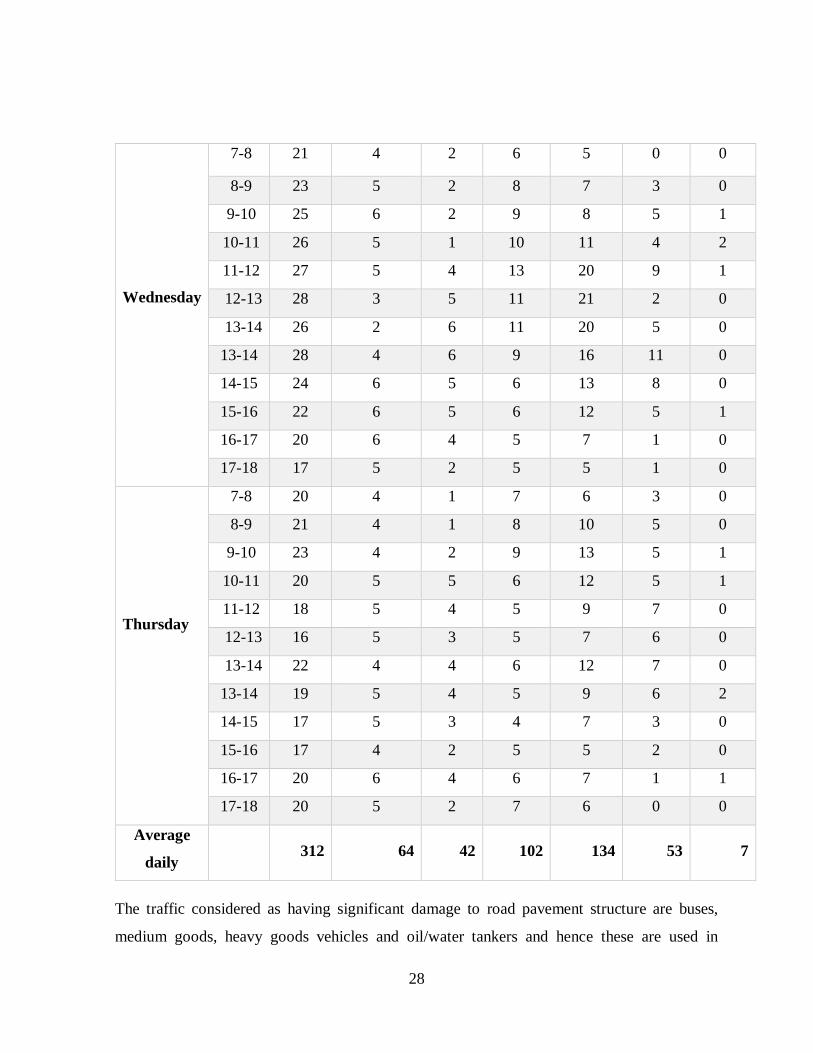
4.1 Traffic data collection and analysis
The traffic census data for this road was not available from the Ministry of Transport. Therefore,
specific traffic counts on Gachororo road was conducted so as to ascertain traffic intensity. The
count differentiated between cars and 4WDs, mini buses, buses, light good, medium goods, and
heavy goods vehicle and water tankers. Out of these categories of vehicles only the last four
were used for structural pavement design purposes. This is because they are the ones susceptible
to cause considerable damage to the road once constructed.
The data obtained in three-day traffic count for both directions of movement was as follows:
Table 6 Three days’ traffic count data on Gachororo road
Days Time
Cars
and
4WDS
Minibuses Buses Light
good
vehicles
Medium
good
vehicles
Heavy
good
vehicles
Oil
tankers
(8-
30seaters)
(>30) (2axles) (3-
4axles)
(2-
4axles)
Tuesday
7-8 19 3 6 4 1 0 0
8-9 33 6 3 7 6 1 0
9-10 26 6 1 11 9 1 1
10-11 43 8 1 8 8 9 0
11-12 29 9 3 16 17 6 2
12-13 48 11 1 13 13 5 1
13-14 30 1 0 19 21 8 3
13-14 50 3 6 23 21 9 0
14-15 34 1 11 8 20 8 1
15-16 34 6 5 12 21 5 1
16-17 41 13 7 8 11 2 0
17-18 29 11 2 5 4 0 2
28
Wednesday
7-8 21 4 2 6 5 0 0
8-9 23 5 2 8 7 3 0
9-10 25 6 2 9 8 5 1
10-11 26 5 1 10 11 4 2
11-12 27 5 4 13 20 9 1
12-13 28 3 5 11 21 2 0
13-14 26 2 6 11 20 5 0
13-14 28 4 6 9 16 11 0
14-15 24 6 5 6 13 8 0
15-16 22 6 5 6 12 5 1
16-17 20 6 4 5 7 1 0
17-18 17 5 2 5 5 1 0
Thursday
7-8 20 4 1 7 6 3 0
8-9 21 4 1 8 10 5 0
9-10 23 4 2 9 13 5 1
10-11 20 5 5 6 12 5 1
11-12 18 5 4 5 9 7 0
12-13 16 5 3 5 7 6 0
13-14 22 4 4 6 12 7 0
13-14 19 5 4 5 9 6 2
14-15 17 5 3 4 7 3 0
15-16 17 4 2 5 5 2 0
16-17 20 6 4 6 7 1 1
17-18 20 5 2 7 6 0 0
Average
daily
312 64 42 102 134 53 7
The traffic considered as having significant damage to road pavement structure are buses,
medium goods, heavy goods vehicles and oil/water tankers and hence these are used in

29
calculation of vehicle equivalent factors used in pavement design. Buses included all
passengers’ vehicles seating more than 9 persons while medium goods were two axle goods
vehicle of more than 15kN weight. Heavy goods vehicle included all goods vehicle having more
than two axles.
The table below shows the field data count data analysis for vehicles to be considered in the
pavement design.
Table 7 Traffic data analysis
Days Time Buses Medium
good vehicles
Heavy good
vehicles
Water
tankers
(>30) (2axles) (3-4axles) (2-4axles)
Tuesday 7-8 6 1 0 0
8-9 3 6 1 0
9-10 1 9 1 1
10-11 1 8 9 0
11-12 3 17 6 2
12-13 1 13 5 1
13-14 0 21 8 3
13-14 6 21 9 0
14-15 11 20 8 1
15-16 5 21 5 1
16-17 7 11 2 0
17-18 2 4 0 2
Wednesday 7-8 2 5 0 0
8-9 2 7 3 0
9-10 2 8 5 1
10-11 1 11 4 2
11-12 4 20 9 1
12-13 5 21 2 0

30
13-14 6 20 5 0
13-14 6 16 11 0
14-15 5 13 8 0
15-16 5 12 5 1
16-17 4 7 1 0
17-18 2 5 1 0
Thursday 7-8 1 6 3 0
8-9 1 10 5 0
9-10 2 13 5 1
10-11 5 12 5 1
11-12 4 9 7 0
12-13 3 7 6 0
13-14 4 12 7 0
13-14 4 9 6 2
14-15 3 7 3 0
15-16 2 5 2 0
16-17 4 7 1 1
17-18 2 6 0 0
Average daily
traffic
42 134 53 7
Equivalent
factor
1 1 4 4
Equivalent
standard axles
42 134 212 28
The average vehicle equivalent factor is obtained from table 2.3.1 of the road design manual
part III. In this case, it was found to be equal to 416.

31
4.1.1. Annual growth rate of vehicles
The annual average growth rate of the vehicle on the road was estimated by averaging the
growth rate of the number of vehicles registered and the fuel levy within the last fifteen years
(from 2001 to 2015).
From the table above it was observed that the average annual growth rate on vehicles
registration was 12.29% and 9.98% on fuel levy which come to an average of about 11.14%.
The data was obtained from the central bureau of statistics and is tabulated as per below:

33
Table 8 Number of registered vehicles from 2001 to 2015
Time(years) 2001 2002 2003 2004 2005* 2006 2007 2008 2009 2010* 2011 2012 2013 2014 2015*
Saloon Cars 8,258 10,534 9,709 12,628 14,216 14,829 17,893 18,686 16,930 16,165 11,026 12,985 16,343 15,902 14,369
Station
Wagons 4,733 6,746 8,032 8,863 10,158 12,631 24,115 24,747 27,599 37,553 31,199 39,862 48,662 53,542 54,120
Panel Vans,
Pick-ups, etc 4,747 5,834 6,819 7,042 6,308 6,721 9,470 8,983 7,120 6,975 7,442 7,945 9,819 12,568 13,878
Lorries/Trucks 1,283 1,919 2,069 2,461 3,113 3,610 6,329 6,691 6,037 4,924 5,247 7,821 9,570 10,681 13,785
Buses and
Coaches 490 407 667 872 885 856 2,006 1,243 1,057 1,264 1,662 1,638 2,062 2,210 2,342
Mini
Buses/Matatu 3,598 3,996 2,854 4,405 4,076 3,714 4,252 5,206 4,483 3,600 451 78 235 213 581
Trailers 603 503 861 1,112 1,351 1,706 2,193 2,100 2,883 2,379 2, 556 3,761 3,973 2,925 3,905
Wheeled
Tractors 575 678 663 829 856 920 1,213 1,262 1,115 1,161 1,179 1,386 1,902 2,032 2,259
Other vehicles 176 111 149 152 195 505 488 797 2,575 3,648 2,724 1,753 1,451 2,533 2,522
Total Motor
Vehicles
registered
24,463 30,728 31,823 38,364 41,158 45,492 67,959 69,715 69,799 77,669 60,930 77,229 94,017 102,606 107,761
% growth 25.61 3.56 20.55 7.28 10.53 49.39 2.58 0.12 11.28 -21.55 26.75 21.74 9.14 5.02

Table 9 Fuel levy from 2001 to 2015
Time(years) 2001 2002 2003 2004 2005* 2006 2007 2008 2009 2010* 2011 2012 2013 2014 2015*
Road Maintenance
Fund (Mksh) 7,836 7739 9045 8980 9160 14814 17999 19000 21180 22918 24100 24370 23,229 25792 26229
Average -1.24 16.88 -0.72 2 61.72 21.5 5.56 11.47 8.21 5.16 1.12 -4.68 11.03 1.69

35
4.1.2. Annual growth rate of vehicles
The design period for the road adopted is fifteen years as stage construction was anticipated.
This type of construction provides an opportunity to choose the structural characteristic of
second stage in the light of actual condition, which may differ substantially from those
originally foreseen.
4.1.3 Cumulative number of standard axles
Cumulative standard axles: 𝑇 = 365𝑡1 {(1+𝑖)𝑁−1
𝑖}
Where N is the design period in years,
t1 is initial average no. of Standard Axles, and
i is annual growth Rate as a decimal fraction?
𝑇 = 365x416x {(1+
11.14
100)
15−1
0.1114}= 5280817.878vehicles
The above number of vehicles,5.28million in 15 years, is within the range 3-10 million vehicles
which classifies the road as a T3 road class.
4.2. Materials investigation
4.2.1. Alignment soils
Trial pits were dug from the road shoulders and sampled at intervals of 900and 1800m along
the entire road length. The trial pits were dug to approximate depth of 1.0m below ground level.
A representative sample (after removal of top soils) was obtained from each trial pit and taken
for further laboratory testing. The main test carried on sub grade material was the California
Bearing Ratio (CBR) test. The actual CBR of a Sub grade material depends on the type of
material, its density and moisture content. Complete knowledge of the relationship between
density, moisture content and CBR was obtained by carrying test on representative samples of
the Sub grade material encountered. Before the CBR test is carried out on the subgrade the
compaction test on subgrade materials is carried out to ascertain that the pavement can be
carried out on sub grade CBR test only.

36
The other lab tests to which the samples were subjected are:
i) Atterberg Limits
ii) Linear Shrinkage
iii) Standard Compaction Test (AASHTO T99)
Below is the structure of the trial pits.
Figure 8 Soil layers along the road (both samples)

37
The collected samples were taken to the JKUAT soil and foundation lab where different tests
were carried.
Figure 10 compaction machine Figure 9 Tins +soil ready to be oven dried

38
Figure 11 soil after compaction
Figure 12 CBR test

39
The table below shows the engineering properties of the collected samples which constitute
the road the subgrade.
Table 10 Sub grade Strength Class
Performed test Sample 1 Sample 2
Atterberg limits Run 1- Run 2 Run 1- Run 2
Liquid limit (%) 34.6-36.2 31-33.4
Plastic limit (%) 21.28-21.49 19.33-22.31
Plastic index (%) 13.32-14.71 11.09-11.67
Shrinkage (%) 6.60-7.68 7.68-6.68
Compaction test Run 1- Run 2 Run 1- Run 2
Optimum moisture content (%) 1.39-1.60 1.53-1.65
Maximum dry density(Kg/𝒎𝟑) 22-24.6 20.1-20.4
California Bearing Ratio (%) 22.39-22.77 20.59-20.78
The average CBR of both (22.58 and 20.68) being within the range of 15 to 30%, then the soil
class is S5.
4.2.2. Natural Materials for Base and Sub Base
Natural gravel sources in the project area are nearly exhausted. The economically exploitable
lateritic gravels that existed in the area, (Bound by Ngewa, Ruiru and Gatundu in Kiambu and
Roysambu on Nairobi - Thika Road and even further to the east of that area) have been in use
in earlier road construction and maintenance in Kiambu County and Thika road.
There are a few places where these materials can still be found though (see table below)

40
Table 11 Natural materials properties
Ref.No Location Material PI PM CBR
(%) at
95%
MDD)
OMC
(%)
MDD
(kg/m3)
Distance
to the
site(Km)
6469/35/L/1
Tola quarry
Gatundu
Gravel
16 368 35 19 1790
6466/35/L/1 Ruiru
17 544 13 18 1690 9.1
M6133/35/L/1 Gatundu
north
Gravel 23 989 2 18 1570 24
M6468/35/L/1
Kango'ki
quarry in
Thika
Gravel
18 468 26 15 1770 24
00468/S/16 Ruiru Gravel 21 231 55 1765 9.1
4.2.3. Soft stone and quarry dust
The geology of the last half of project area and the area bound by Ngewa, Ruiru and Roysambu
on Nairobi - Thika Highway is comprised of Tuffs evidenced by various points of excavation
of building stone.
The tuffs are being excavated for building at Zimmerman, Kangaita Farm, Juja farm, Karweti
and Kanjai (the last two on the banks of Ruiru River) and other places.
Samples of quarry wastes were taken from MS1 at Zimmerman and Ngomongo, on left hand
side of Kamiti Road near Githurai 2Km from Roysambu on Road A2 and at Kangaita Farm
which is at Km 2 from Ruiru Town on, and to the left of the Ruiru - Ngewa Road C65. Samples
of soft stone were also taken at two locations on the banks of the Ruiru River.
The six soft stone locations which were investigated and sampled are listed below together with
their engineering properties such as plastic index(PI), Plasticity Modulus(PM), California
Bearing Ratio(CBR) but also the location distances to the road site.

41
Table 12 Soft stones and quarry waste
Quarry waste Neat Improvement (2.5%)
Borrow pits PI PM CBR (%) at
95% MDD)
CBR Distance to the
site(Km)
Zimmerman 19 675 47 22
Ngomongo 17 473 47 26
Kangaita 16 434 62 39
Kangaita 17 735 58 39
Karweti 12 420 25 152 34
Kanjai 14 504 19 75 30
Ngong quarry 16 336 45 56
4.2.4. Hard stones
Hard stone of sufficient quality for use in the construction of the project road can be found in
two locations: Juja farm quarry and in Mlolongo area east of Nairobi, where commercial
production of crushed stone for aggregates and for GCS.
The hard stones were sampled from both quarries and tested for the following:
i) Los Angeles Abrasion (LAA);
ii) Aggregate Crushing Value (ACV);
iii) Sodium Sulphate soundness (SSS);
iv) Bitumen Affinity (BA).
Table 13 Hard stones
Location Aristocrat quarry in Mlolongo Juja farm quarry
Distance to site(Km) 37 12
LAA 17.2 28.2
ACV 12.5 26.8
SSS(%) 8.8 3.6
Bitumen affinity Good

42
4.3. Rainfall data collection and analysis
The rainfall data for the area on which the road is to be designed was obtained from the Thika
Agromet station, code 9137048 through the Kenyan meteorological department.

43
Table 14 Monthly total precipitation for Thika agro met station, Code 9137048
YEAR JANUARY FEBRUARY MARCH APRIL MAY JUNE JULY AUGUST SEPT OCT NOV DEC TOTAL
1985 4.5 101.8 145.6 402.1 58.5 10.9 2 0 5.2 58.4 105.6 20.5 915.1
1986 15.9 0 122 346.1 125.2 12.1 1.2 1.1 1.5 44.5 244.3 73.1 987
1987 5.7 5.6 6.3 159.1 102.5 137 18.6 33.9 0 2.8 119.8 18.6 609.9
1988 42.1 19.1 174.7 271.3 119.1 48.4 14.1 8.6 35.2 46.4 136.2 189.8 1105
1989 165.6 34.1 56.7 275.1 80.9 0 29.7 23 49.6 109.3 155.2 127.7 1106.9
1990 68 79 318.5 268.9 97.3 3.6 3.3 4.1 61.4 72.2 178.2 172.4 1326.9
1991 67.7 6.2 98 195.2 141 17.8 2.7 7.4 0.3 40.8 157.5 61.2 795.8
1992 4.6 0.5 13.6 324.2 78.3 7.4 31.8 1.7 5.3 32.9 173.1 110.2 783.6
1993 162.8 129.7 11.6 78.3 86.5 0 4 1.6 3.8 40.7 193.2 87.7 799.9
1994 0 28 54.7 187.3 56.8 9.7 5.6 20.3 6.2 167.9 318.3 56.2 911
1995 11.4 49.2 129.9 153.7 40 10.7 6.2 31 3.6 171.2 137.3 162.5 906.7
1996 20.8 76.4 161.4 52.1 49.6 36.3 28.7 1.5 0.2 0 375.2 63.1 865.3
1997 0 0 59.3 487.2 91.8 9.8 1.8 63.6 0.9 238.8 416.6 229 1598.8
1998 344.7 236.1 181.4 176.4 356.5 131.9 61.7 8 2.7 10.5 92.5 13 1615.4
1999 9.7 2.6 0 264.3 10.3 2.3 21.8 11.1 2.6 29.1 318.8 221.6 894.2
2000 3.5 0 18.8 74.9 29.4 5 5.9 2.2 7.9 11.5 136.1 62.1 357.3

44
2001 358.4 32.7 170.2 106 66.5 4.6 0.8 16.1 1.7 48.7 233.2 20.7 1059.6
2002 16.3 22.1 227.5 313.4 250.5 3.7 2.2 5.5 80.2 83.1 137.7 243.1 1385.3
2003 14.2 3 93.5 215.9 254.3 1 3.6 17.3 0 83.3 180.9 44.2 911.2
2004 53.5 74.7 47.9 376.2 120.9 1.2 0 0 20.9 78.2 93.3 98.7 965.5
2005 21.4 25.1 52.3 0 259.2 0 7.5 0 5.5 38.1 154.3 2.1 565.5
2006 647.7
2007 30.8 102.9 24.1 239.3 85.2 3.3 14.7 13.7 20.2 55.9 114.2 25.6 729.9
2008 104.8 27.1 100.4 271.1 7.4 6.4 28.3 0 0 0 0 0 545.5
2009 49.3 19 51.5 173.7 91.1 10.1 1.1 1.7 0 134.5 119.2 94.2 745.4
2010 138.3 113.5 209.5 176.1 152.4 24.9 4.8 6.3 1.3 98.5 153 80.6 1159.2
2011 10.8 47.9 0 109.6 71.2 50.3 1 10.7 39.4 135.2 177.2 63.2 716.5
2012 0 20.9 0 248.5 179.4 38.1 7.9 41.4 19.9 49.9 177.1 0 783.1
2013 73.3 0 239.7 425.6 20.6 9.1 4 6.9 83.7 14 111.5 54.7 1043.1
2014 0 96.3 134 97.2 0 35.9 0 34.9 0 19.7 0 0 418
Average 908.4767

45
Chapter Five
PAVEMENT DESIGN
5.1. General
The pavement design has been carried out to obtain an optimal structure that would ensure
that the designed road, when operating, will be able to carry the expected traffic loading
over the design life of the road. This objective would be achieved by specifying locally
available materials for construction and observing standards that will ensure minimum
maintenance. The ToR stipulates pavement design horizon of 15 years.
Pavement design has been based on the recommendations stipulated in Road Design
Manuals Parts III (Materials and Pavement Design for New Roads), Standard Specifications
for Road and Bridge Construction as well as Overseas Road Note 19 and any other relevant
standards.
5.2. Design Considerations
5.2.1. Design Traffic Class
From traffic survey analysis, pavement traffic class T3 has been adopted for pavement
design exercise of Gachororo Road.
5.2.2. Design Sub Grade Class
Road Design Manual Part III provides guidelines for classification of sub grade soils for
pavement design based on CBR. From the performed laboratory tests, the soils in the project
area were found to belong soils class S5. These results tally with the expected soil
classification of lateritic gravel (Soil class S5 or S6) that compose the subgrade of this road.
5.2.3. Internal Drainage of the Pavement Layers
The particular materials in the sub base and base layers will extend across the shoulders to
the side slope to facilitate efficient internal drainage of the pavement.
5.2.4. Pockets of poor sub grade material
Where during the construction stage pockets of poor sub grade materials are encountered,
such material shall be replaced with suitable ones or may require individual design
considerations based on the existing site conditions to ensure adequate support for the
pavement.

46
5.3. Proposed Standard Pavement Structures
From the traffic class consideration of T3 for the entire design road, and a class S5 sub
grade, an S5-T3 pavement structure is hereby proposed. The locally available road
construction materials found within the project vicinity comprise mainly of gravels and hard
stones.
After considering sub grade soil & traffic classifications for the road section and availability
of construction materials, we came up with four possible Standard Pavement Structures in
the Road Design Manual Part III, which include Types 3, 6, 7 and 9. The details of each of
the proposed pavements are highlighted below:

47
Table 15 Proposed pavement structure
No. Layer Type 2 Type 6 Type 7 Type 9
1 Wearing
course
50mm thick AC type II extended to
shoulders.
Triple surface dressing Same as for type 2 Same as for type 2
2 Base
150mm thick, >2.5% cement improved
gravel compacted in a single layer to at
least 95% MDD T180.
200mm thick, 0/40mm GCS compacted in
single layer to 98% MDD (V.H) extended
to shoulders
150mm thick, 0/40mm GCS compacted in
single layer to 98% MDD (V.H) extended
to shoulders
150mm thick, 0/40mm GCS
compacted in single layer to 98%
MDD (V.H) extended to shoulders
3 Sub Base
150mm thick, lateritic gravel
compacted in a single layer to at least
95% MDD T180, PI max 15, Pm max
250
150mm thick, lateritic gravel compacted
in a single layer to at least 95% MDD
T180, PI max 15, Pm max 250.
150mm thick, 2% cement improved gravel
compacted to 95%MDD (T180) extended
to shoulders.
150mm thick, 0/40mm Neat GCS
compacted in single layer to 98%
MDD (V.H) extended to shoulders.
4 Sub Grade 300/450 mm thick, compacted in single
layers of 150mm to 100% MDD T99.
Same as for type 2 Same as for type 2 Same as for type 2
5 COM-
MENTS
Impervious, fairly economical but has
insufficient strength and poor
resistance to attrition of the base
material. Also require close control
during construction.
Impervious, fairly economical but has
insufficient strength and poor resistance to
attrition of the base material. Also require
close control during construction.
Superior pavement structure than type 3,
easy control.
Both the base and sub base highly
pervious, uneconomical relative to
locally available gravel.

48
With the above considerations, we opted to adopt Pavement Type 6 but with a modification
on the base layer.
Graded crushed stones are hard stones that have been crushed and graded i.e. getting
percentages of quantities of crushed stones that passed different sizes of stones. The
availability of this material is a problem since it can only be obtained from Mulolongo which
is far away from the road site(52km).
From the Road Design Manual for Bridges and Roads (2009), in its section 7.4.6.2., there
is a provision for use of hand packed stones as a base material.
Where the soaked CBR of the roadbed material is ≥ 5% (95% BS Light) the recommended
thickness of the stone packed surface is 150mm. If the CBR value is even lower a thickness
of 200mm is recommended. (DMBR,2009).
Due to its softness and low stability, experience have shown that surfacing of AC type II is
bound to fail by rutting under severe traffic loads and shall hence be replaced with a high
stability and more stable rut resistant AC type I.
In addition, it was recommending that a three seal surface dressing of 10/14mm pre-coated
chippings be used so as to improve on the skid resistance for the braking traffic based on
the expected operating traffic speeds and seal the voids in the open textured type I AC.
5.4 Final Pavement Structure
The following pavement details were therefore adopted for the construction of Gachororo
Road:
5.4.1. Original Ground
Since the onsite underlying material is of sufficient quality, it shall be used without any
improvement, as the road subgrade.
Note that the small layer of black cotton soil shall be scrapped off before compaction is
done.
5.4.2. Sub Grade
The existing gravel base material together with imported material shall compacted in two
layers of 150mm each. In widening and shoulders, the sub grade shall be 450 mm thick.
5.4.3. Sub base
The material for sub grade construction shall be imported lateritic gravel from the borrow
pit in Ruiru then compacted. The sub grade shall be compacted in layers each of 150 mm

49
thickness, to 100% AASHTO T99 MDD at OMC. This should be in conformity with the
criteria for natural material for sub base laid down in Chart SB1 of RDM III.
5.4.4. Base
The Base layer will consist of hand-packed stones compacted (with heavy machinery to
refusal density at a moisture content close to the optimum.
5.4.5. Surfacing AC
The surfacing layer will be 50 mm thick Asphalt Concrete Type 1 which will comply with
the criteria laid down in Chart S2a of RDM III and Tables 5.2 & 6.4 of ORN 19:
Stone Class B
Binder - Bitumen Grade
80/100 Primer - MC 70
Tack Coat - K160
5.4.6. Surfacing Wearing Course
To ensure adequate skid resistance by braking traffic and sealing off of surface water from
ingress into the pavement, we propose a Wearing Course consisting of a Triple Seal Surface
Dressing to the carriageway, to comply with the design criteria laid down in Charts S1a and
S1e of RDM III.
Chippings Size - 10/14mm
Chippings Class - 2 Binder - MC 3000
5.4.7. Binder Selection
Binder selection was undertaken as per recommendations of Overseas Road Note 3: A
Guide to Surface Dressing in Tropical and Sub-Tropical Countries as well as Road Design
Manual Part III- Pavement Design for New Roads.
The correct choice of bitumen for surface dressing work is critical. The bitumen must full
fill the following requirements:
a) Be capable of being sprayed
b) Wet the road surface in a continuous film
c) Not run off a cambered road or form pools of binder in local depressions
d) Wet and adhere to the chippings at road temperature
e) Be strong enough to resist traffic forces and hold the chippings at the highest
prevailing ambient temperatures.

50
f) Remain flexible at the lowest ambient temperature, neither cracking nor
becoming brittle enough to allow traffic to pick off the chippings
g) Resist premature weathering and hardening
The following factors must also be taken into account in selecting an appropriate binder:
a) The road surface temperature at the time the surface dressing is undertaken.
b) The nature of the chippings i.e. whether dusty or clean.
c) The characteristics of the road site.
d) The type of binder handling and spraying equipment.
e) Availability of binders.
The choice of MC 3000 as binder is in consideration of the prevailing low road temperatures
in the range of 10-25° C experienced in the project area. Chart S1b of RDM III recommends
K1-60 and MC 3000 as preferred and alternative binders respectively for a cool + wet
climate with a temperature range of 18-45°C. Temperatures experienced in the project area
are much lower than this, and ORN 19 recommends the use of cut back grades of bitumen
at lower road temperatures.
The viscosity of the binder is recommended to be in the range of 104 and 7x10⁵ centistokes.
MC 3000 grade cutback is normally the most fluid binder used for surface dressing and is
basically an 80/100 penetration grade bitumen blended with cutter (kerosene or diesel).
Trials for the road temperatures prevailing in Kenya in figure 3 of ORN 19 shows that
between 2 and 10 per cent of diesel oil was required to modify 80/100 pen bitumen to
produce binders with viscosities within the recommended range for use.
5.4.8. Shoulders
The Road Design Manual Part III provides for a shoulder surfacing of double surface
dressing on a GCS base. However, due to the wet climate in the project region, it would be
better to extend the carriageway surfacing into the shoulders. The shoulder pavement (in
this case hand packed stones) shall therefore be extended carriageway pavement layers.
5.4.9. Pavement Cross-Section
It was proposed that the road Cross Section Type C be used with the following parameters:
Carriageway width: 7.0m
Shoulders width: 1.5m
Cross fall: 2.5% and 4% slopes for carriage way and shoulders respectively.

51
5.5. Mode of construction of pavement structure.
5.5.1 Subgrade construction.
The Subgrade on site have a CBR value of between 15-30%. The material should be
scarified using a grader with ripper spread and compacted using a grader and compacted to
attain the CBR at 95% maximum dry density(MDD).
Field test should be carried out during the construction to certify that the density specified
is achieved. This will be carried out using field sand replacement test or nuclear density test.
5.5.2 Subbase construction
Subbase material will be made of natural lateritic gravel. The material which is to be
excavated from Ruiru quarry will be transported to the road using Lorries and dumped on
top of the subgrade. The material will then be spread using a grader, then compacted at
optimum moisture contact to achieve 95% MDD and a CBR of 30%.
The compaction will be carried out using the steel drum roller which can generate a
minimum force of 14 tones. Too large layer should be avoided so that the required MDD
may be achieved and too small layer should also be avoided as this may lead to lamination
of subbase material.
5.5.3 Base construction
The base will be made of hand packed stones from Juja farm and transported to the various
point on the road by use of tipper lorries. Hand-packed stones compacted with heavy
machinery (both double and single drum steel roller) to refusal density at a moisture content
close to the optimum. After setting out the finished road line and level, a 250mm wide by
200mm deep trench is excavated to accommodate kerbstones along each edge of the road.
The minimum triaxle dimensions of kerbstones should be 400, 200 and 100mm. The
smallest face of each kerbstone is dressed so that it is flat and approximately perpendicular
to the longest axis. The kerbstones, placed in the trench with their longest axis vertical and
smallest face uppermost, are firmly bedded and laid to the final road level. The trench is
backfilled with moist, well compacted excavated material to firmly anchor the kerbstones
in position. Supplementary drainage measures should be provided to prevent any ingress of
water through the surface from becoming trapped behind the kerbstone edge support where
it would otherwise penetrate the roadbed causing it to soften and loose strength and the
hand-packed stone surface to deform and ultimately fail.

52
Figure 13 Hard stones as base material
5.5.4 Tact coat
A tact coat of light bituminous binder of medium curing cut-back MC 3000 will be used as
binder; this is due to the fact that it will be applied on cemented road base surface.
The rate of spraying of the medium curing cut-back MC 3000 will be 0.5l/m2. The spraying
should be done on a clean surface 48 hours prior to lying of the asphalt concrete layer.
5.5.5 Surface course construction
The surface layer will be made of asphalt concrete layer. The thickness of the compacted
asphalt layer is more than 50mm which is the maximum thickness that can be effectively
compacted be plants available in Kenya. The surface layer mix design will be carried out
using Marshall Mix design method. The batching and mixing of asphalt concrete will be
done in the asphalt batching plant which is to be located near the aggregate crushing plant.
Transportation of the asphalt concrete from batching plant to the point of placement is to be
done using tippers. Bituminous materials must be transported in clean vehicles and must be
covered over when in transit or waiting tipping. The use of dust, coated dust, oil or water
on the interior of the vehicles to facilitate discharge of the mixed materials is permissible
but the amount shall be kept to a minimum, and any excess shall be removed by tipping and
brushing.
The mixed material must be supplied continuously to the paver and laid without delay. The
rate of delivery of material to the paver must be so regulated as to enable the paver to be
operated continuously. Wherever practicable, material must be spread, levelled and tamped
by approved self-propelled pavers.

53
Material must be uniformly compacted as soon as rolling can be effected without causing
undue displacement of the mixed material and must be completed while the temperature of
the mixed material is greater than the minimum rolling temperature. Rolling is continued
until all roller marks have been removed from the surface. Compaction must be carried out
using 8-10 tones deadweight smooth wheeled rollers having a width of roll not less than 450
mm, or by vibratory rollers or a combination of these. Wearing course materials are always
to be surface finished with a smooth wheeled non-vibrating roller. The material must be
rolled in a longitudinal direction with the driven rolls nearest the paver. The roller should
first compact the material adjacent to any joints and then work from the lower to the upper
side of the layer overlapping on successive passes by at least half the width of the rear roll.
Sample of asphalt concrete will be collected from the field to carry out various tests such as
marshal stability test, bituminous coating and stripping, maximum specific gravity,
quantitative extraction of bitumen.

54
Chapter Six
CONCLUSION AND RECOMMENDATION
6.1. Conclusions
A modified type 6 pavement structure was adopted for the construction of Gachororo road
with details comprising of the following:
a) Surfacing: 50mm AC type I with 10/14mm chippings to the carriage way.
b) Base Course: 150mm thick hand packed stones compacted in single layer, with
lateritic gravel filling the void between the hard stones and extended to
shoulders.
c) Sub-base: 150mm thick, lateritic gravel compacted in a single layer to at least
95% MDD T180, PI max 15, PM max 250.
d) Sub Grade: 300/450mm compacted to 100% MDD (T99) in layers of 150mm
each.
e) Earthworks: Remove any dumped materials, overburden, black cotton soil and
any unsuitable soil and replace with approved fill material. The earthworks shall
be compacted to 95% MDD (T99) in layers of 150 mm or as may be directed
by the Engineer.
6.2. Recommendations
1. The road should be maintained regularly for it to serve the intended purpose.
2. The road should never be over worked and stressed with heavy loaded tracks and a
weigh bridge should be put in place to check.
6.3. Further study.
The survey work on the road
Geometric design of the road
Material design for surface dressing

55
BIBLIOGRAPHY
1. Arthur Wignall and Peter S. Kendrick: Roadwork theory and practice 4th edition. Planta
Tree Ltd Great Britain.
2. Bent Thagesen, Highway and traffic engineering in developing countries, technical
university of Denmark, E and FN Spon London.
3. B.S.1377-4 1990, Methods of test for soil for civil Engineering purposes.
4. Chandola S.P (2001), A Textbook of Transportation Engineering, 1st Edition Rajendra
Ravindra Printers Ltd, New Delhi.
5. Gichaga, F.J. and Parker N.A (1988), Essentials of Highway Engineering. Macmillan
Publishers, Hong Kong.
6. G. N Smith and Ian G.N Smith, Element of soil mechanics. Blackwell publishing Ltd
London.
7. Kenya Bureau of Statistics
8. Martin Rogers, Highway engineering, Blackwell publishing ltd London
9. Overseas road notes 31 4th Edition, a guide to the structural design of bitumen –surface
roads in tropical and sub-tropical countries.
10. Overseas road note 40, a guide to axle load survey and traffic count for determining
traffic loading on pavement.
11. Overseas road note 29 4th Ed, a guide to the structural design of bitumen –surface roads
in tropical and sub-tropical countries.
12. Road design manual, part I Geometric design of rural road materials and pavement
design for new roads.
13. Design Manual for Roads and Bridges, 2009 edition
14. Road design manual, part III materials and pavement design for new roads
15. V.N.S Murthy, Geotechnical Engineering principles and practices of soil mechanics and
foundation engineering. Marcel Dekker Inc. Singapore

56
ANNEXES
ANNEX 1: MAP OF JUJA; GACHORORO ROAD.

57
ANNEX 2: TIME PLAN
JAN FEB MAR APRIL MAY JUNE JULY AUG
Briefing and allocation
of supervisors
Title Presentation
Literature Review
Project Proposal
Presentation
Research
Data Collection
Data Analysis and
Conclusion
Report writing
Final Project
Presentation

58
ANNEX 3: PROPOSED BUDGET AND COSTING
S/No. DESCRIPTION
QUANTITY TOTAL COSTING
(Ksh)
1. Travelling and transportation
costs
Costs per mileage 2130
2. Traffic count personnel 100 per hour 3days (12
hours /day)
3600
3. Labor material sampling 500 x 2trial pits 1000
4. Overall 1400 1400
5. Stationery material 2 notebooks @ 150 300
6. Printing costs 1200 1200
7. Spiral binding 3@100 each 300
8. Blank CD 1CD@30shs. 30
Total 9960

59
ANNEX 4:
ATTERBERG LIMITS SAMPLE 1 RUN 1
Cone Penetrometer Method
Specimen No sample
1
Run 1 Date
Type of Test Liquid Limit Plastic Limit
Test Run No 1 2 3 4 1 2
Intial Dial Gauge Reading,
mm
0 0 0 0
Final Dial Gauge Reading,
mm
21.4 15.7 23.9 17.3
Cone Penetration
mm
21.4 15.7 23.9 17.3 - -
Tin No 29 36 30 28 34 38
Wt of Tin + Wet Soil, ma (g) 28.03 36.25 24.57 36.82 21.88 26.89
Wt of Tin + Dry Soil, mb (g) 22.93 30.67 20.78 29.65 20.88 26.18
Wt of Tin only, mc (g) 9.52 16.2 9.4 9.42 16.22 22.88
Moisture Content, w (%) 38.03 38.56 33.30 35.44 21.46 21.52
36.2 21.49
Pen
(mm)
Moisture (%)
15.7 38.56
17.3 35.44
21.4 38.03
23.9 33.30

60
Linear Shrinkage SUMMERY
Mould No. 3 Liquid Limit (%)
=
36.2
Initial Length of Specimen,
mm
137.8 Plastic Limit (%)
=
21.49
Final Length of Specimen,
mm
128.7 Plasticity index 14.71
Change in Length, ∆L, mm 9.1 Linear Shrinkage
(%)=
6.60
Linear Shrinkage, % 6.604
ATTERBERG LIMITS SAMPLE 1 RUN 2
Cone Penetrometer Method
sample 1 Run 2 Date
Type of Test Liquid
Limit
Plastic Limit
Test Run No 1 2 3 4 1 2
Intial Dial Gauge Reading,
mm
0 0 0 0
Final Dial Gauge Reading,
mm
18.1 20.5 23.6 26.4
Cone Penetration mm 18.1 20.5 23.6 26.4 - -
33.00
34.00
35.00
36.00
37.00
38.00
39.00
15.0 16.0 17.0 18.0 19.0 20.0 21.0 22.0 23.0 24.0 25.0
mo
istu
re c
on
ten
t
Penetration(mm)
Moisture content vs penetration

61
Tin No 55 60A 9A 11 6 11
Wt of Tin + Wet Soil, ma (g) 26.37 28.09 19 32.89 20.37 25.15
Wt of Tin + Dry Soil, mb (g) 24.08 25.85 18.1 27.5 19.82 23.3
Wt of Tin only, mc (g) 16.25 19.86 15.88 12.15 17.39 14.02
Moisture Content, w (%) 29.25 37.40 40.54 35.11 22.63 19.94
34.6 21.28
Pen
(mm)
Moisture
(%)
18.1 29.25
20.5 37.40
23.6 40.54
26.4 35.11
Linear Shrinkage SUMMERY
Mould No. 4 Liquid Limit (%) = 34.6
Initial Length of Specimen,
mm
140.0 Plastic Limit (%) = 21.28
Final Length of Specimen,
mm
129.25 Plasticity index 13.32
Change in Length, ∆L, mm 10.75 Linear Shrinkage (%)= 7.68
Linear Shrinkage, % 7.679
25.00
27.00
29.00
31.00
33.00
35.00
37.00
39.00
41.00
43.00
16.0 18.0 20.0 22.0 24.0 26.0 28.0
mo
istu
re c
on
ten
t
Penetration(mm)
Moisture content vs penetration

62
ATTERBERG LIMITS SAMPLE 2 RUN 1
Cone Penetrometer Method
sample 2 Run 1 Date
Type of Test Liquid Limit Plastic Limit
Test Run No 1 2 3 4 1 2
Intial Dial Gauge Reading,
mm
0 0 0 0
Final Dial Gauge Reading,
mm
17.2 19.6 22.4 25.1
Cone Penetration mm 17.2 19.6 22.4 25.1 - -
Tin No 31 33 20 22 39 12
Wt of Tin + Wet Soil, ma (g) 24.89 29.42 22.72 32.37 21.82 23.07
Wt of Tin + Dry Soil, mb (g) 23.82 27.62 20.21 27.74 20.9 20.98
Wt of Tin only, mc (g) 18.47 21.6 14.2 13.4 15.27 13.59
Moisture Content, w (%) 20.00 29.90 41.76 32.29 16.34 28.28
33.4 22.31
Pen
(mm)
Moisture
(%)
17.2 20.00
19.6 29.90
22.4 41.76
25.1 32.29
25.00
27.00
29.00
31.00
33.00
35.00
37.00
39.00
41.00
43.00
16.0 18.0 20.0 22.0 24.0 26.0 28.0
mo
istu
re c
on
ten
t
Penetration(mm)
Moisture content vs penetration

63
Linear Shrinkage SUMMERY
Mould No. 4 Liquid Limit (%) = 33.4
Initial Length of Specimen,
mm
140.0 Plastic Limit (%) = 22.31
Final Length of Specimen,
mm
129.25 Plasticity index 11.09
Change in Length, ∆L,
mm
10.75 Linear Shrinkage (%)= 7.68
Linear Shrinkage, % 7.679
ATTERBERG LIMITS SAMPLE 2 RUN 2
Cone Penetrometer Method
sample
2
Run 2 Date
Type of Test Liquid Limit Plastic Limit
Test Run No 1 2 3 4 1 2
Intial Dial Gauge Reading, mm 0 0 0 0
Final Dial Gauge Reading, mm 16.8 18.5 21.5 23.9
Cone Penetration mm 16.8 18.5 21.5 23.9 - -
Tin No 8c 31 4A 10 41 62A
Wt of Tin + Wet Soil, ma (g) 24.97 27.6 19.57 31.9 21.22 23.07
Wt of Tin + Dry Soil, mb (g) 23.72 26.12 18.1 27.5 20.42 21.48
Wt of Tin only, mc (g) 16.26 19.37 12.44 12.88 14.39 15.22
Moisture Content, w (%) 16.76 21.93 25.97 30.10 13.27 25.40
31 19.33
Pen
(mm)
Moisture
(%)
16.8 16.76
18.5 21.93
21.5 25.97
23.9 30.10

64
Linear Shrinkage SUMMERY
Mould No. 4 Liquid Limit (%) = 31
Initial Length of Specimen, mm 140.0 Plastic Limit (%) = 19.33
Final Length of Specimen, mm 129.25 Plasticity index 11.67
Change in Length, ∆L, mm 10.75 Linear Shrinkage (%)= 7.68
Linear Shrinkage, % 7.679
25.00
27.00
29.00
31.00
33.00
35.00
37.00
39.00
41.00
43.00
16.0 18.0 20.0 22.0 24.0 26.0 28.0
mo
istu
re c
on
ten
t
Penetration(mm)
Moisture content vs penetration

65
ANNEX 5:
COMPACTION TEST SAMPLE 1 RUN 1
THE STANDARD COMPACTION TEST
Sample
1
Date:
Run 1
Diameter of Mould (cm) 10 Weight of Hammer (kg) 2.5
Height of Mould (cm) 12 Free Fall of Hammer (cm) 30
Volume of Mould (cm3) 942.86 Hammer Blows per Soil
Layer
25
Weight of Mould (g) 4165.6 Number of Layers in Mould 3
Test Run No. 1 2 3 4 5
Wt of Mould + Soil (g) 5647.9 5744.7 5818.9 5820.1 5804.7
Wet Density of Soil
(g/cm3)
1.57214 1.6748 1.7535 1.75477 1.73844
Moisture Content (%) 18.47 21.87 26.86 28.74 30.26
Dry Density of Soil
(g/cm3)
1.32706 1.37426 1.38226 1.363 1.33455
Moisture Determination
Tin No 30 9 28 34 36
Tin + Wet Soil ma, g 113.11 155.29 129.31 170.1 207.5
Tin + Dry Soil mb, g 96.94 129.11 103.93 135.76 163.06
Tin only mc, g 9.38 9.40 9.43 16.29 16.22
Moisture Content % 18.467 21.870 26.857 28.744 30.264
m.cont,
%
dry density
18.47 1.327
21.87 1.374
26.86 1.382
28.74 1.363
30.26 1.335

66
Maximum Dry
Density(g/cm3)=
1.39
Optimum Moisture Content
=
24.6 %
COMPACTION TEST SAMPLE 1 RUN 2
THE STANDARD COMPACTION TEST
sample
1
Date:
Run 2
Diameter of Mould (cm) 10 Weight of Hammer (kg) 2.5
Height of Mould (cm) 12 Free Fall of Hammer (cm) 30
Volume of Mould (cm3) 942.86 Hammer Blows per Soil
Layer
25
Weight of Mould (g) 4032.9 Number of Layers in Mould 3
Test Run No. 1 2 3 4 5
Wt of Mould + Soil (g) 5619.3 5736.1 5901.2 5854.2 5786.3
Wet Density of Soil
(g/cm3)
1.682545 1.80642 1.98153 1.93168 1.85967
Moisture Content (%) 15.42 17.03 22.05 26.06 31.63
Dry Density of Soil
(g/cm3)
1.457735 1.54352 1.623489 1.53241 1.41277
1.320
1.330
1.340
1.350
1.360
1.370
1.380
1.390
1.400
17.00 19.00 21.00 23.00 25.00 27.00 29.00 31.00
Dry
den
siti
es
Moisture conetent(%)
DD vs Mc

67
Moisture Determination
Tin No 11 23 6 4 3
Tin + Wet Soil ma, g 137.28 142.33 193.81 226.01 158.33
Tin + Dry Soil mb, g 120.72 123.16 160.35 181.049 124.42
Tin only mc, g 13.34 10.61 8.63 8.49 17.22
Moisture Content % 15.422 17.032 22.054 26.055 31.632
m.cont,
%
dry density
15.42 1.458
17.03 1.544
22.05 1.623
26.06 1.532
31.63 1.413
Maximum Dry
Density(g/cm3) =
1.6
Optimum Moisture Content = 22 %
1.350
1.400
1.450
1.500
1.550
1.600
1.650
12.00 17.00 22.00 27.00 32.00 37.00
Dry
den
siti
es
Moisture conetent(%)
DD vs Mc

68
COMPACTION TEST SAMPLE 2 RUN 1
THE STANDARD COMPACTION TEST
sample
2
Date:
Run 1
Diameter of Mould (cm) 10 Weight of Hammer (kg) 2.5
Height of Mould (cm) 12 Free Fall of Hammer (cm) 30
Volume of Mould (cm3) 942.86 Hammer Blows per Soil
Layer
25
Weight of Mould (g) 3887.2 Number of Layers in Mould 3
Test Run No. 1 2 3 4 5
Wt of Mould + Soil (g) 5647.9 5744.7 5818.9 5820.1 5804.7
Wet Density of Soil
(g/cm3)
1.86741 1.97008 2.04877 2.05005 2.03371
Moisture Content (%) 14.69 18.57 24.81 31.50 35.66
Dry Density of Soil
(g/cm3)
1.62826 1.6616 1.64152 1.55893 1.49916
Moisture Determination
Tin No 6A 12 19 22 5
Tin + Wet Soil ma, g 141.4 131.25 193.81 226.01 158.33
Tin + Dry Soil mb, g 125 112.36 157 173.9 121.24
Tin only mc, g 13.34 10.61 8.63 8.49 17.22
Moisture Content % 14.687 18.565 24.810 31.504 35.657
m.cont, % dry density
14.69 1.628
18.57 1.662
24.81 1.642
31.50 1.559
35.66 1.499

69
Maximum Dry
Density(g/cm3)=
1.65
Optimum Moisture Content = 20.1 %
COMPACTION TEST SAMPLE 2 RUN2
THE STANDARD COMPACTION TEST
sample
2
Date:
run 2
Diameter of Mould (cm) 10 Weight of Hammer (kg) 2.5
Height of Mould (cm) 12 Free Fall of Hammer (cm) 30
Volume of Mould (cm3) 942.86 Hammer Blows per Soil
Layer
25
Weight of Mould (g) 4103.8 Number of Layers in Mould 3
Test Run No. 1 2 3 4 5
Wt of Mould + Soil (g) 5670.8 5767.6 5841.8 5843 5827.6
Wet Density of Soil
(g/cm3)
1.66197 1.76464 1.84333 1.84461 1.82827
Moisture Content (%) 14.99 16.56 19.78 22.28 25.96
1.480
1.500
1.520
1.540
1.560
1.580
1.600
1.620
1.640
1.660
1.680
12.00 17.00 22.00 27.00 32.00 37.00
Dry
den
siti
es
Moisture conetent(%)
DD vs Mc

70
Dry Density of Soil
(g/cm3)
1.44535 1.51395 1.53893 1.50852 1.45141
Moisture Determination
Tin No 17 2 13 8 34
Tin + Wet Soil ma, g 188.92 229.36 127.43 147.22 123.75
Tin + Dry Soil mb, g 166.97 200.61 109.28 122.98 100.54
Tin only mc, g 20.51 26.98 17.52 14.18 11.15
Moisture Content % 14.987 16.558 19.780 22.279 25.965
m.cont,
%
dry density
14.99 1.445
16.56 1.514
19.78 1.539
22.28 1.509
25.96 1.451
Maximum Dry
Density(g/cm3)=
1.53
Optimum Moisture Content
=
20.4 %
1.440
1.460
1.480
1.500
1.520
1.540
1.560
14.00 16.00 18.00 20.00 22.00 24.00 26.00 28.00
Dry
den
siti
es
Moisture conetent(%)
DD vs Mc

71
ANNEX4:
CBR SAMPLE 1 RUN 1
THE STANDARD COMPACTION FOR CBR TEST
Sample 1 Date: Run 1
Type of Mould in Use CBR
Weight of Hammer (kg) 2.5 Diameter of Mould (cm) 15
Free Fall of Hammer (cm) 30 Height of Specimen (cm) 12.7
Number of Layers in Mould 3 Volume of Mould (cm3) 2245.18
Hammer Blows per Soil Layer 62 Weight of Mould (g) 6989.20
Initial moisture content
Tin No 38 29
Tin + Wet Soil ma, g 84.17 66.73
Tin + Dry Soil mb, g 78.08 60.89
Tin only mc, g 22.87 9.52
Moisture Content % 11.03 11.37
AVG MC 11.2 Initial MC(w1) 11.2%
Comparison with Standard Compaction Results:
MDD = 1.39
OMC = 24.6
water to be added to soil= (OMc-Initial Mc) xqty of soil/ (100+initial Mc)
=
662
Compaction
Wt of Mould + Soil (g) 10436.8
Wet Density of Soil (g/cm3) 1.535557146

72
0
5
10
15
20
25
30
0 2 4 6 8
Dia
l R
ea
din
g (
Div
)
Penetration (mm)
Penetration vs dial reading
Testing Stage
Penetration (mm) Dial
Reading
0 0
0.1 0
0.5 2.1
1.0 7
1.5 10
2.0 13
2.5 15
3.0 17
3.5 19
4.0 21
4.5 22.5
5.0 24
5.5 25.5
6.0 27
6.5
7.0 29
7.5 30
CBR VALUE
Ring Factor
(kg/Div) 19.2604
Test penetration
(mm)
2.5
Proving ring
reading (Div)
15
Test Load
(kg)
288.906
Standard Load
(kg)
1370
CBR Value
(%)
21.0880292

73
CBR SAMPLE 1 RUN 2
sample 1 Date:
Run 2
Type of Mould in Use CBR
Weight of Hammer (kg) 2.5 Diameter of Mould
(cm)
15
Free Fall of Hammer (cm) 30 Height of Specimen
(cm)
12.7
Number of Layers in Mould 3 Volume of Mould
(cm3)
2245.18
Hammer Blows per Soil Layer 62 Weight of Mould (g) 6989.20
Initial moisture content
Tin No 12 21
Tin + Wet Soil ma, g 61.47 98.53
Tin + Dry Soil mb, g 57.54 87.85
Tin only mc, g 22.21 9.14
Moisture Content % 11.12 13.56
AVG MC 12.34 Initial MC(w1) 12.34%
Comparison with Standard Compaction Results:
MDD = 1.6
OMC = 22
water to be added to soil= (OMc-Initial Mc)xqty of soil/(100+initial Mc)
=
472
Compaction
Wt of Mould + Soil (g) 10365.8
Wet Density of Soil (g/cm3) 1.50393

74
0
5
10
15
20
25
30
0 2 4 6 8
Dia
l R
ea
din
g (
Div
)
Penetration (mm)
Penetration vs dial reading
Testing Stage
Penetration
(mm)
Dial
Reading
0 0
0.1 0.4
0.5 2.5
1.0 4.8
1.5 7.1
2.0 9.6
2.5 12.7
3.0 14.9
3.5 16.8
4.0 18.4
4.5 20.3
5.0 23.6
5.5 25.2
6.0 26.7
6.5 27.9
7.0 29.4
7.5 31.7
CBR VALUE
Ring Factor
(kg/Div)
19.2604
Test
penetration
(mm)
2.5 5.0
Proving ring
reading
(Div)
12.7 23.6
Test Load
(kg)
244.60708 454.545
Standard Load
(kg)
1370 2030
CBR Value
(%)
17.85453139 22.3914
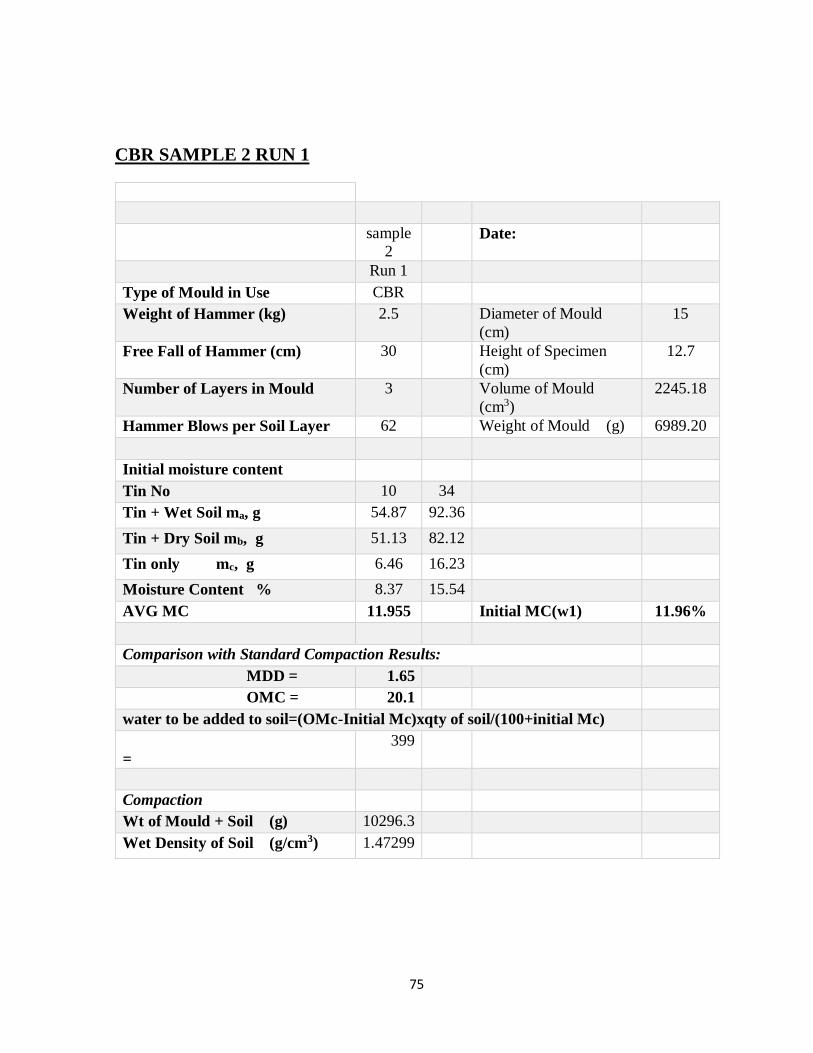
75
CBR SAMPLE 2 RUN 1
sample
2
Date:
Run 1
Type of Mould in Use CBR
Weight of Hammer (kg) 2.5 Diameter of Mould
(cm)
15
Free Fall of Hammer (cm) 30 Height of Specimen
(cm)
12.7
Number of Layers in Mould 3 Volume of Mould
(cm3)
2245.18
Hammer Blows per Soil Layer 62 Weight of Mould (g) 6989.20
Initial moisture content
Tin No 10 34
Tin + Wet Soil ma, g 54.87 92.36
Tin + Dry Soil mb, g 51.13 82.12
Tin only mc, g 6.46 16.23
Moisture Content % 8.37 15.54
AVG MC 11.955 Initial MC(w1) 11.96%
Comparison with Standard Compaction Results:
MDD = 1.65
OMC = 20.1
water to be added to soil=(OMc-Initial Mc)xqty of soil/(100+initial Mc)
=
399
Compaction
Wt of Mould + Soil (g) 10296.3
Wet Density of Soil (g/cm3) 1.47299

76
0
5
10
15
20
25
30
0 2 4 6 8
Dia
l R
ea
din
g (
Div
)
Penetration (mm)
Penetration vs dial reading
Testing Stage
Penetration
(mm)
Dial
Reading
0 0
0.1 0.5
0.5 3
1.0 6.5
1.5 8
2.0 10.7
2.5 13
3.0 14.6
3.5 16
4.0 17
4.5 18.5
5.0 21.9
5.5 24.9
6.0 26
6.5 27.1
7.0 28.1
7.5 29.1
CBR VALUE
Ring Factor
(kg/Div)
19.2604
Test
penetration
(mm)
2.5 5.0
Proving ring
reading
(Div)
13 21.9
Test Load
(kg)
250.3852 421.803
Standard
Load
(kg)
1370 2030
CBR Value
(%)
18.27629197 20.7785

77
CBR SAMPLE 2 RUN 2
sample
2
Date:
Run 2
Type of Mould in Use CBR
Weight of Hammer (kg) 2.5 Diameter of Mould
(cm)
15
Free Fall of Hammer (cm) 30 Height of Specimen
(cm)
12.7
Number of Layers in Mould 3 Volume of Mould
(cm3)
2245.18
Hammer Blows per Soil Layer 62 Weight of Mould (g) 6989.20
Initial moisture content
Tin No 22b 19d
Tin + Wet Soil ma, g 49.35 62.18
Tin + Dry Soil mb, g 46.22 56.26
Tin only mc, g 21.69 12.53
Moisture Content % 12.75 13.53
AVG MC 13.14 Initial MC(w1) 13.14
Comparison with Standard Compaction Results:
MDD = 1.53
OMC = 20.4
water to be added to soil=(OMc-Initial Mc)xqty of soil/(100+initial Mc)
=
352
Compaction
Wt of Mould + Soil (g) 10434.3
Wet Density of Soil (g/cm3) 1.53443

78
Testing Stage
Penetration
(mm)
Dial
Reading
0 0
0.1 0.7
0.5 2.8
1.0 5.1
1.5 7.6
2.0 10.2
2.5 12.9
3.0 14.6
3.5 16.4
4.0 17.8
4.5 19.3
5.0 21.7
5.5 23.5
6.0 26.1
6.5 28.3
7.0 29.6
7.5 31.4
CBR VALUE
Ring Factor
(kg/Div)
19.2604
Test
penetration
(mm)
2.5 5.0
Proving ring
reading
(Div)
12.9 21.7
Test Load
(kg)
248.45916 417.951
Standard
Load
(kg)
1370 2030
CBR Value
(%)
18.13570511 20.5887
0
5
10
15
20
25
30
0 2 4 6 8
Dia
l R
ea
din
g (
Div
)
Penetration (mm)
Penetration vs dial reading