materials characterization and analysis of the marquette...
TRANSCRIPT
MATERIALS CHARACTERIZATION AND ANALYSIS OF THE MARQUETTE INTERCHANGE HMA PERPETUAL PAVEMENT
Project 08-08 August 2008
Midwest Regional University Transportation Center College of Engineering Department of Civil and Environmental Engineering University of Wisconsin, Madison
Authors: James A. Crovetti, Hani Titi, Aaron Coenen, Mohammed Elias R. Christopher Williams & Xinjun Li; Marquette University, the University of Wisconsin-Milwaukee and Iowa State University Principal Investigator: James A. Crovetti Associate Professor, Marquette University Co-Principal Investigators: Hani Titi & R. Christopher Williams Associate Professors, University of Wisconsin–Milwaukee & Iowa State University

Technical Report Documentation Page 1. Report No. MRUTC 08-08
2. Government Accession No.AAaarroonn CCooeenneenn
3. Recipient’s Catalog No. CFDA 20.701 5. Report Date August, 2008
4. Title and Subtitle
Materials Characterization and Analysis of the Marquette Interchange HMA Perpetual Pavement
6. Performing Organization Code
7. Author/s James A. Crovetti, Hani Titi, R. Christopher Williams, Aaron Coenen, Mohammed Elias & Xinjun Li
8. Performing Organization Report No. MRUTC 08-08
10. Work Unit No. (TRAIS)
9. Performing Organization Name and Address Midwest Regional University Transportation Center University of Wisconsin-Madison 1415 Engineering Drive, Madison, WI 53706
11. Contract or Grant No. 0092-07-13 13. Type of Report and Period Covered
Final Report [05//01/07 – 08/31/08]
12. Sponsoring Organization Name and Address Wisconsin Department of Transportation Hill Farms State Transportation Building 4802 Sheboygan Avenue Madison, WI 53707
14. Sponsoring Agency Code
15. Supplementary Notes Project completed for the Midwest Regional University Transportation Center with support from the Wisconsin Department of Transportation. 16. Abstract This project focused on the characterization of materials used to construct the Hot Mix Asphalt (HMA) perpetual pavement within the Marquette Interchange and on the analysis of collected pavement response data to investigate the interactions between materials, environment, and traffic loadings. While these pavements are designed for a service life in excess of 50 years, to date there is insufficient field data to confirm this performance expectation. To help bridge this knowledge gap, this study included a mechanistic-empirical appraisal of the HMA perpetual pavement to provide predictions of key performance indicators over a fifty year service period. Laboratory testing was conducted following appropriate AASHTO testing protocols to provided valuable data to characterize the HMA, unbound aggregate and unbound soil pavement layers. This data was used to develop Level 1 HMA inputs to the current version 1.003 of the Mechanistic-Empirical Pavement Design Guide (MEPDG) and to better characterize the unbound aggregates and soils during Level 3 analysis. Weigh-In-Motion (WIM) data obtained as part of WHRP Project 0092-06-01 was analyzed to develop site-specific inputs characterizing the heavy axle loading spectra using this pavement facility. Pavement performance predictions were developed using the MEPDG v1.003 and stand-alone KENPAVE software. Consideration was given to both free flow (55 mph) and congested (15 mph) traffic conditions. Using a combined traffic approach, pavement distress at the 90% reliability level were projected to 50 years of trafficking. Only top-down fatigue cracking, which should be confined within the uppermost 0.5 inches of the pavement surface, is projected to exceed typical design limits. This projected distress will easily be corrected using the standard practice of mill and relay. Furthermore, after 50 years of service the 90% reliability level for bottom-up fatigue damage is expected over 15% of the total lane area, or 30% of the loaded wheel paths, which is well below typical design limits of 25% and 50%, respectively. All analysis results indicate the constructed HMA perpetual pavement should meet or exceed performance expectations. 17. Key Words HMA Perpetual Pavement, Pavement Instrumentation, Dynamic Modulus, Resilient Modulus, Mechanistic-Empirical Design, Fatigue Analysis, Weigh-In-Motion
18. Distribution Statement No restrictions. This report is available through the Transportation Research Information Services of the National Transportation Library.
19. Security Classification (of this report) Unclassified
20. Security Classification (of this page) Unclassified
21. No. Of Pages
22. Price -0-
Form DOT F 1700.7 (8-72) Reproduction of form and completed page is authorized.
ii
iii
DISCLAIMER This research was funded by the Midwest Regional University Transportation Center. The contents of this report reflect the views of the authors, who are responsible for the facts and the accuracy of the information presented herein. This document is disseminated under the sponsorship of the Department of Transportation, University Transportation Centers Program, in the interest of information exchange. The U.S. Government assumes no liability for the contents or use thereof. The contents do not necessarily reflect the official views of the Midwest Regional University Transportation Center, the University of Wisconsin, the Wisconsin Department of Transportation, or the USDOT’s RITA at the time of publication. The United States Government assumes no liability for its contents or use thereof. This report does not constitute a standard, specification, or regulation. The United States Government does not endorse products or manufacturers. Trade and manufacturers names appear in this report only because they are considered essential to the object of the document.

iv
ACKNOWLEDGEMENTS
This research was performed under MRUTC 08-08 by Marquette University Transportation Research Center (MU-TRC – prime contractor), in association with the University of Wisconsin-Milwaukee (UW-M) and Iowa State University (ISU). Dr. James Crovetti (MU-TRC) was the principal investigator and Dr. Hani Titi (UW-M) and Dr. R. Christopher Williams (ISU) were the co-principal investigators. The coauthors of this report were Mr. Aaron Coenen and Mohammed Elias (UW-M), and Mr. Xinjun Li (ISU). We are grateful to the Midwest Regional University Transportation Center (MRUTC) at the University of Wisconsin--Madison for generously taking the lead in providing funding for this project. The work would not have been possible without a grant from MRUTC. We would like to thank our project oversight committee who assisted us and gave us feedback: Wesley Shemwell, Federal Highway Administration Leonard Makowski, Wisconsin Department of Transportation Deborah Schwerman, Wisconsin Department of Transportation Judith Ryan, Wisconsin Department of Transportation Thomas Brokaw, Wisconsin Department of Transportation Irene Battaglia, Wisconsin Department of Transportation Signe Richelt, Payne & Dolan, Inc. Ervin Dukatz, Mathy Construction Ceci Pieroni, CH2M Hill, Inc. Scot Schwandt, Wisconsin Asphalt Pavement Association Robert Schmitt, University of Wisconsin-Platteville
v
EXECUTIVE SUMMARY
Project Summary This project focused on the characterization of materials used to construct the Hot Mix Asphalt (HMA) perpetual pavement within the Marquette Interchange and on the analysis of collected pavement response data to investigate the interactions between materials, environment, and traffic loadings. HMA perpetual pavements are relatively new in Wisconsin. While these pavements are designed for a service life in excess of 50 years, to date there is insufficient field data to confirm this performance expectation. To help bridge this knowledge gap, this study included a mechanistic-empirical appraisal of the HMA perpetual pavement to provide predictions of key performance indicators over a fifty year service period. Background The design and construction of long-life pavements is gaining momentum across the United States as limited owner/agency budgets are facilitating longer lasting highways systems. The HMA perpetual pavement design concept provides an improved opportunity for asset management as this design represents an enhanced life-cycle cost basis over traditional pavement designs. The Wisconsin Department of Transportation (WisDOT) recently constructed their first mainline HMA perpetual pavement in the highly urbanized area of Milwaukee. The HMA perpetual pavement is located along Interstate 43, commonly referenced as the North Leg of the Marquette Interchange reconstruction project. Concurrent with the construction of this HMA perpetual pavement was a highly advanced instrumentation of the pavement system collecting climatic, loading characteristics, and loading responses. The instrumentation, combined with laboratory characterization of materials used to construct this HMA perpetual pavement, represents a unique opportunity to evaluate the newly completed Mechanistic-Empirical Pavement Design Guide and provide insight for local calibration of the guide to Wisconsin conditions. This project serves as a supplement to Wisconsin Highway Research Program (WHRP) Study 0092-06-01 Perpetual Pavement Instrumentation for the Marquette Interchange Project. Process The objectives of this study are to characterize the materials used to construct the HMA perpetual pavement and to analyze the collected pavement response data to investigate the interactions between materials, environment, and traffic loadings. Dynamic and resilient modulus testing was conducted at Iowa State University and the University of Wisconsin-Milwaukee, respectively, using construction materials obtained during paving operations. Key personnel from WisDOT and Payne & Dolan, Inc. provided invaluable support during materials sampling and subsequent storage.

vi
The lab testing was conducted following appropriate AASHTO testing protocols and provided valuable data to characterize the HMA, unbound aggregate and unbound soil pavement layers. This data was used to develop Level 1 HMA inputs to the current version 1.003 of the Mechanistic-Empirical Pavement Design Guide (MEPDG) and to better characterize the unbound aggregates and soils during Level 3 analysis. Weigh-In-Motion (WIM) data obtained as part of WHRP Project 0092-06-01 was analyzed to develop site-specific inputs characterizing the heavy axle loading spectra using this pavement facility. Findings and Conclusions Pavement performance predictions were developed using the MEPDG v1.003 and stand-alone KENPAVE software. For both analyses, the baseline material properties determined via laboratory testing were used to estimate monthly variations in response to changes in environmental conditions (i.e., temperature, moisture). Critical pavement stresses and strains resulting from applied traffic loadings were used to develop estimates of accumulated cracking, rutting and roughness over time. Consideration was given to both free flow (55 mph) and congested (15 mph) traffic conditions. Using a combined traffic approach, pavement distress at the 90% reliability level were projected after 16 and 22 years of trafficking as follows:
Pavement Distress 90% Reliability Level
At End of Year 16
At End of Year 22
Design Limit
Heavy Truck Applications 26.4 million 36.8 million n.a. Top-Down Fatigue Cracking, ft/mi 1,058 1,199 1,000 Bottom-Up Fatigue Cracking, % Area 2.3 2.8 25 Thermal Cracking ft/mi 84.5 84.5 1,000 Total Rutting, in 0.45 0.48 0.50 IRI, in/mi 138 157 175 The predicted distress levels after 16 and 22 years of trafficking were selected to coincide with the typical initial service life expectations for HMA perpetual pavements in Wisconsin. As shown, only top-down fatigue cracking, which is confined within the uppermost 0.5 inches of the pavement surface, is projected to exceed typical design limits. This projected distress will easily be corrected using the standard practice of mill and relay. Furthermore, after 50 years of service the 90% reliability level for bottom-up fatigue damage is expected over 15% of the total lane area, or 30% of the loaded wheel paths, which is well below typical design limits of 25% and 50%, respectively. All analysis results indicate the constructed HMA perpetual pavement should meet or exceed performance expectations.
vii
Recommendations for Further Action The pavement analyses conducted for the Marquette Interchange HMA perpetual pavement, using the MEPDG v.1003 and KENPAVE programs, yielded acceptable long-term performance expectations. This pavement was constructed in September, 2006 and to date, there is insufficient field performance data available to confirm or deny these expectations (i.e., no pavement distress measured to date). To augment these results, it is recommended that the monitoring of pavement performance be continued through at least the first 10 years to provide comparative values of measured versus predicted pavement distress. This will provide valuable data for calibrating mechanistic-empirical performance models for local conditions. Furthermore, analyses of this type should be extended to existing aged HMA pavement structures in Wisconsin, preferably built using paving materials and construction practices which reflect current conditions. For practical applications, this will likely include pavements constructed from 1996 – 2002. Comparative analyses between the field performance data of these pavements to MEPDG predicted levels of distress will further validate the use of the MEPDG for designing HMA pavements in Wisconsin.

viii
This page intentionally left blank

ix
TABLE OF CONTENTS
Chapter 1.0 INTRODUCTION ...................................................... 1 1.1 Research Objectives .............................................................. 1 1.2 Report Organization ............................................................... 2 CHAPTER 2.0 LABORATORY TESTING.................................. 3 2.1 Introduction .......................................................................... 3 2.2 HMA Dynamic Modulus Testing..................................... 4 2.2.1. Sample Preparation ............................................... 4 2.2.2 Testing Equipment.................................................. 4 2.2.3 Testing Procedures ................................................ 5 2.2.4 Data Analysis and Discussion............................... 6 2.2.5 Dynamic Modulus Master Curves.......................... 17 2.2.6 HMA Dynamic Modulus Testing Summary ........... 18 2.3 Binder Characterization.................................................... 19 2.4 Characterization of Unbound Subgrade and
Aggregate Base Course Materials.......................... 21 2.4.1 Laboratory Testing of Subgrade Soils .................. 21 2.4.2 Repeated Load Triaxial Test .................................. 22 2.4.3 Subgrade Specimen Preparation........................... 24 2.4.4 Subgrade Specimen Testing.................................. 24 2.4.5 Results of Testing on Subgrade Soils .................. 28 2.4.6 Laboratory Testing of Aggregates ........................ 41 2.4.7 Results of Testing Program on Aggregates ......... 41 CHAPTER 3.0 PERFORMANCE ANALYSIS............................ 47 3.1 Introduction ...................................................................... 47 3.2 MEPDG v1.003 Input Data Generation ......................... 47 3.2.1. HMA Dynamic Modulus ......................................... 47 3.2.2. Binder Data ........................................................... 51 3.2.3. Unbound Aggregate Data...................................... 51 3.2.4. Soils Data ............................................................. 52 3.2.4. Traffic Data ........................................................... 53 3.2.5. Environmental Data ............................................... 58
x
TABLE OF CONTENTS (Cont.)
3.3 MEPDG v1.003 Performance Prediction...................... 62 3.3.1 – 55 mph Operational Speed.................................. 62 3.3.2 – 15 mph Operational Speed.................................. 66 3.4 KENLAYER Pavement Analysis .................................... 67
3.4.1 – HMA Material Properties ..................................... 68 3.4.2 – Aggregate Material Properties ............................ 68 3.4.3 – Soil Material Properties ....................................... 70 3.4.4 – Traffic Characteristics ......................................... 74 3.4.5 – KENLAYER Performance Prediction.................. 75
3.5 EVERSTRESS Pavement Analysis ............................... 78 3.5.1 – HMA Material Properties ..................................... 78 3.5.2 – Aggregate Material Properties ............................ 78 3.5.3 – Soil Material Properties ....................................... 79 3.5.4 – Traffic Characteristics ......................................... 79 3.5.5 – EVERSTRESS Critical Strain Comparison......... 80
CHAPTER 4.0 SUMMARY & RECOMMENDATIONS ............ 81 4.1 Summary ............................................................................. 81 4.2 Recommendations ........................................................... 82
xi
LIST OF FIGURES Figure 2.1 HMA Perpetual Pavement Structure............................................... 3 Figure 2.2 Dynamic Modulus Test Setup (NCHRP Report 547)...................... 5 Figure 2.3 Typical Stress, Strain vs. Time Plot at Lower Temperature (4°C) 7 Figure 2.4 Dynamic Modulus Data for the SMA Mixture................................13 Figure 2.5 Dynamic Modulus Data for the E30x Mixture ...............................13 Figure 2.6 Dynamic Modulus Data for the C2 Mixture ...................................14 Figure 2.7 Phase Angle Data for the SMA Mixture .........................................14 Figure 2.8 Phase Angle Data for the E30x Mixture.........................................15 Figure 2.9 Phase Angle Data for the C2 Mixture ............................................15 Figure 2.10 Dynamic Modulus Data for all Mixtures ......................................16 Figure 2.11 Dynamic Modulus Master Curves for the Three Mixtures .........18 Figure 2.12 Triaxial Test System .....................................................................23 Figure 2.13 Soil Specimen Preparation...........................................................25 Figure 2.14 Soil Specimen Preparation for Repeated Load Triaxial Testing ...26 Figure 2.15 Computer Program Used for Triaxial Testing.............................27 Figure 2.16 Particle Size Distribution of Soil 1(A) ..........................................31 Figure 2.17 Compaction Curve for Soil 1(A) ...................................................31 Figure 2.18 Particle Size Distribution of Soil 1(B) ..........................................32 Figure 2.19 Compaction Curve for Soil 1(B) ...................................................32 Figure 2.20 Particle Size Distribution of Soil 1 ...............................................33 Figure 2.21 Particle Size Distribution of Soil 2 ...............................................33 Figure 2.22 Compaction Curve for Soil 2........................................................34 Figure 2.23 Results of Repeated Load Triaxial Test on Soil 1A....................36 Figure 2.24 Results of Repeated Load Triaxial Test on Soil 1B....................39 Figure 2.25 Results of Repeated Load Triaxial Test on Soil 2 ......................40 Figure 2.26 Sample Preparation and Testing of Aggregates ........................42 Figure 2.27 Particle Size Distribution Curve - Open Graded Aggregate ......44 Figure 2.28 Particle Size Distribution Curve - Dense Graded Aggregate.....44 Figure 2.29 Triaxial Test Results - Dense Graded Aggregate Base..............46 Figure 2.30 Triaxial Test Results - Open Graded Aggregate Base ...............46 Figure 3.1 HMA Master Curves and Test E* Data ...........................................49 Figure 3.2 HMA Master Curves and Generated E* Data.................................49 Figure 3.3 Predicted Top-Down Fatigue Cracking - 55 mph Design Speed .....63 Figure 3.4 Predicted Bottom-Up Fatigue Cracking - 55 mph Design Speed ....63 Figure 3.5 Predicted Thermal Crack Depth - 55 mph Design Speed ............64 Figure 3.6 Predicted Thermal Crack Length - 55 mph Design Speed...........64 Figure 3.7 Predicted Pavement Rutting - 55 mph Design Speed..................65 Figure 3.8 Predicted Pavement Roughness - 55 mph Design Speed ...........65 Figure 3,9 KENLAYER Pavement Structure ...................................................68 Figure 3.10 E* Variations - 55 mph Traffic ......................................................69
xii
LIST OF FIGURES (Cont.) Figure 3.11 E* Variations for 15 mph Traffic...................................................69 Figure 3.12 Resilient Modulus Data - Open Graded Aggregate Layer..........70 Figure 3.13 Resilient Modulus Data - Dense Graded Aggregate Layer ........71 Figure 3.14 Typical Stress-Softening Material Behavior ...............................71 Figure 3.15 Upper Soil Layer as a Stress-Softening Material .......................72 Figure 3.16 Upper Soil Layer as a Stress-Stiffening Material .......................72 Figure 3.17 Lower Soil Layer as a Stress-Softening Material .......................73 Figure 3.18 Lower Soil Layer as a Stress-Stiffening Material .......................73 Figure 3.19 Single and Tandem Axle Loading Spectra..................................75 Figure 3.20 Monthly Damage Estimated Based on Traffic Speed.................76 Figure 3.21 Fatigue Life Estimates Based on Traffic Growth and Congestion77 Figure 3.22 Pavement Structure Used for EVERSTRESS Analysis ..............78 Figure 3.23 Critical Strain Comparison...........................................................80
xiii
LIST OF TABLES
Table 2.1 Sample Preparation Data .................................................................. 4 Table 2.2 Cycles for Test Sequence ................................................................. 6 Table 2.3 Average Dynamic Modulus and Phase Angle - SMA Mixture ...... 10 Table 2.4 Average Dynamic Modulus and Phase Angle - E30x Mixture.......11 Table 2.5 Average Dynamic Modulus and Phase Angle - C2 Mixture...........12 Table 2.6 Asphalt Binder Dynamic Shear Rheometer Test Results .............20 Table 2.7 Bending Beam Rheometer Test Results of PAV Aged Asphalt Binders ..............................................................................................................20 Table 2.8 Rotational Viscometer Test Results (10Hz) and A and VTS Parameters ........................................................................................................20 Table 2.9 Standard Tests Used in this Investigation .....................................22 Table 2.10 Properties of the Investigated Soils..............................................30 Table 2.11 Results of the Repeated Load Triaxial Test - Subgrade Soil 1A 35 Table 2.12 Results of the Repeated Load Triaxial Test - Subgrade Soil 1B.37 Table 2.13 Results of the Repeated Load Triaxial Test - Subgrade Soil 2 ...38 Table 2.14 Results of the Falling Head Permeability Tests on Subgrade Soils ...................................................................................................................41 Table 2.15 Properties of Aggregates...............................................................43 Table 2.16 Repeated Load Triaxial Test Results on Dense Graded Aggregate ..........................................................................................................45 Table 2.17 Repeated Load Triaxial Test Results - Open Graded Aggregate 45 Table 3.1 Master Curve Parameters for HMA Mixtures..................................48 Table 3.2 E* Input Values for SMA Surface Layer ..........................................50 Table 3.3 E* Input Values for E30x Middle Layer............................................50 Table 3.4 E* Input Values for C2 Bottom Layer ..............................................50 Table 3.5 G* and ! Input Values for PG 70-22 - SMA Surface Layer .............51 Table 3.6 G* and ! Input Values for PG 64-22 - E30x and C2 Layers ............51 Table 3.7 Input Data for Unbound Aggregates...............................................52 Table 3.8 Primary Input Data for Soil Layers..................................................52 Table 3.9 General Traffic Inputs Developed From Pavement Design Data ..53 Table 3.10 Truck Traffic Distribution by Class Developed From WIM Data .53 Table 3.11 Hourly Truck Traffic Distribution Developed From WIM Data ....54 Table 3.12 Average Axles per Truck Developed From WIM Data..................54 Table 3.13 Single Axle Load Spectra Developed From WIM Data.................55 Table 3.14 Tandem Axle Load Spectra Developed From WIM Data..............56 Table 3.15 Tridem Axle Load Spectra Developed From WIM Data ...............57 Table 3.16 Quad Axle Load Spectra Developed From WIM Data ..................57 Table 3.17 General Site Information for Project Analysis .............................58 Table 3.18 Rainfall Statistics for Project Analysis .........................................58 Table 3.19 Selected Monthly Data for 1997-1998............................................59 Table 3.20 Estimated Monthly Temperature Data - Pavement Surface ........60
xiv
LIST OF TABLES (Cont.)
Table 3.21 Estimated Monthly Temperatures - SMA Surface Layer .............60 Table 3.22 Estimated Monthly Temperatures - E30x Middle Layer...............61 Table 3.23 Estimated Monthly Temperatures - C2 Bottom Layer ...............61 Table 3.24 Predicted Pavement Distress at 90% Reliability-55 mph Traffic 66 Table 3.25 Predicted Pavement Distress at 90% Reliability-15 mph Traffic 66 Table 3.26 Predicted Pavement Distress at 90% Reliability-Combined Traffic 67 Table 3.27 Representative Weekly Axle Loadings from WIM Data ...............74 Table 3.28 KENLAYER Wheel Loadings Used for Analysis ..........................74
Materials Characterization and Analysis of the Marquette Interchange HMA Perpetual Pavement | 2008
Midwest Regional University Transportation Center (MRUTC) 1
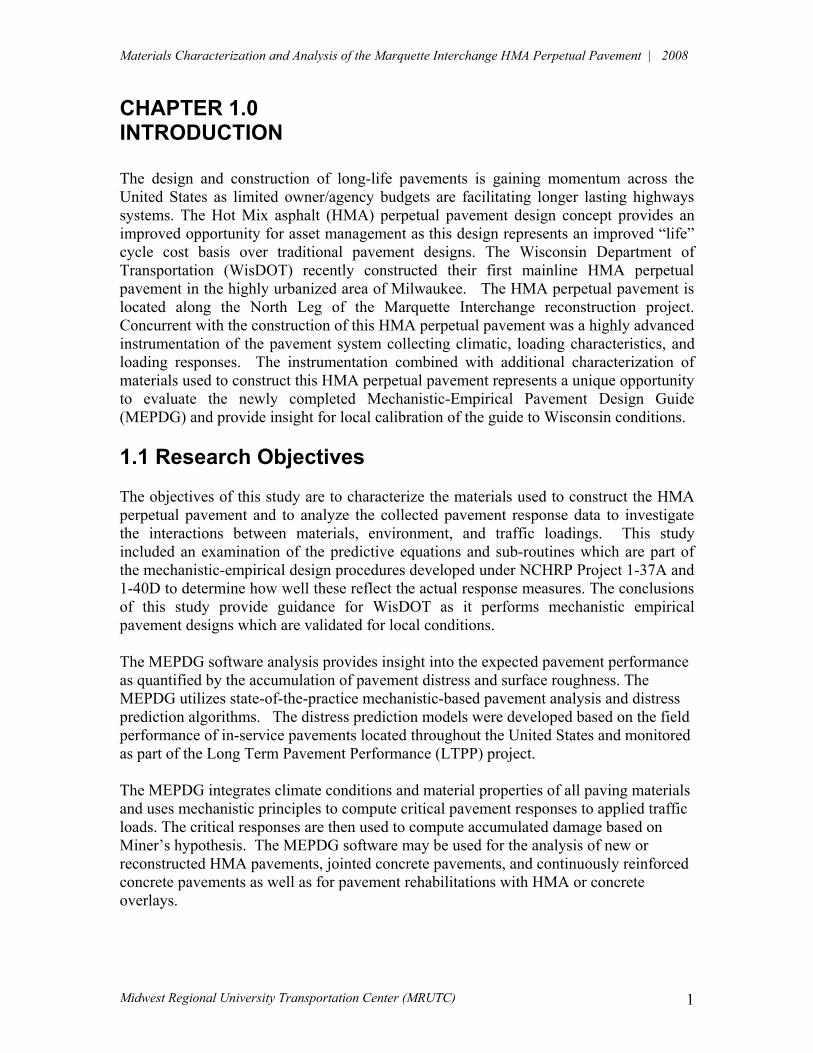
CHAPTER 1.0 INTRODUCTION The design and construction of long-life pavements is gaining momentum across the United States as limited owner/agency budgets are facilitating longer lasting highways systems. The Hot Mix asphalt (HMA) perpetual pavement design concept provides an improved opportunity for asset management as this design represents an improved “life” cycle cost basis over traditional pavement designs. The Wisconsin Department of Transportation (WisDOT) recently constructed their first mainline HMA perpetual pavement in the highly urbanized area of Milwaukee. The HMA perpetual pavement is located along the North Leg of the Marquette Interchange reconstruction project. Concurrent with the construction of this HMA perpetual pavement was a highly advanced instrumentation of the pavement system collecting climatic, loading characteristics, and loading responses. The instrumentation combined with additional characterization of materials used to construct this HMA perpetual pavement represents a unique opportunity to evaluate the newly completed Mechanistic-Empirical Pavement Design Guide (MEPDG) and provide insight for local calibration of the guide to Wisconsin conditions. 1.1 Research Objectives The objectives of this study are to characterize the materials used to construct the HMA perpetual pavement and to analyze the collected pavement response data to investigate the interactions between materials, environment, and traffic loadings. This study included an examination of the predictive equations and sub-routines which are part of the mechanistic-empirical design procedures developed under NCHRP Project 1-37A and 1-40D to determine how well these reflect the actual response measures. The conclusions of this study provide guidance for WisDOT as it performs mechanistic empirical pavement designs which are validated for local conditions. The MEPDG software analysis provides insight into the expected pavement performance as quantified by the accumulation of pavement distress and surface roughness. The MEPDG utilizes state-of-the-practice mechanistic-based pavement analysis and distress prediction algorithms. The distress prediction models were developed based on the field performance of in-service pavements located throughout the United States and monitored as part of the Long Term Pavement Performance (LTPP) project. The MEPDG integrates climate conditions and material properties of all paving materials and uses mechanistic principles to compute critical pavement responses to applied traffic loads. The critical responses are then used to compute accumulated damage based on Miner’s hypothesis. The MEPDG software may be used for the analysis of new or reconstructed HMA pavements, jointed concrete pavements, and continuously reinforced concrete pavements as well as for pavement rehabilitations with HMA or concrete overlays.

Materials Characterization and Analysis of the Marquette Interchange HMA Perpetual Pavement | 2008
Midwest Regional University Transportation Center (MRUTC) 2
This project focused on the analysis of one particular HMA perpetual pavement in Wisconsin. Research is also being conducted by WisDOT under Project # 1009-03-35 to develop a catalogue of inputs to MEPDG software which are specific to conditions, materials and construction practices used throughout the State of Wisconsin. 1.2 Report Organization This report is divided into four chapters. Following this introductory chapter is a presentation of the laboratory testing conducted at Iowa State University and the University of Wisconsin-Milwaukee in chapter 2. Chapter 3 presents an analysis of the HMA perpetual pavement using both the current version of the mechanistic-empirical pavement design guide and stand-alone software programs KENLAYER and EVERSTRESS. Chapter 4 presents a summary of the findings and recommendations for future work.
Materials Characterization and Analysis of the Marquette Interchange HMA Perpetual Pavement | 2008
Midwest Regional University Transportation Center (MRUTC) 3
CHAPTER 2.0 LABORATORY TESTING
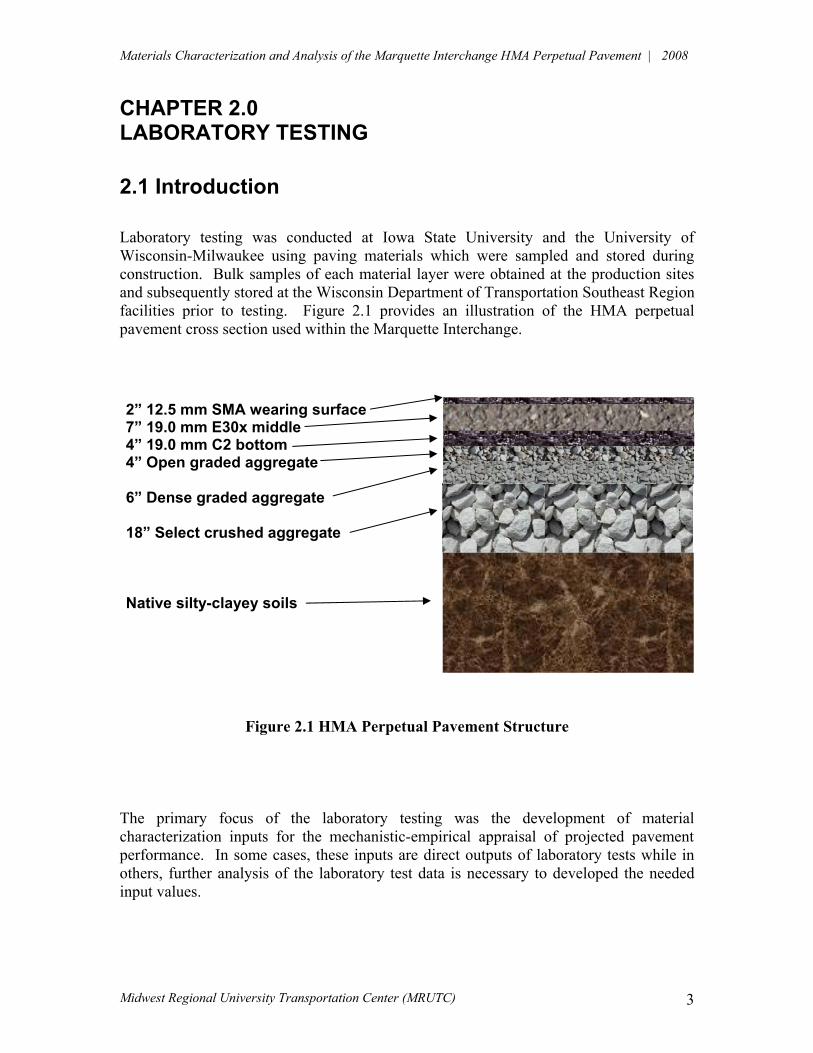
2.1 Introduction Laboratory testing was conducted at Iowa State University and the University of Wisconsin-Milwaukee using paving materials which were sampled and stored during construction. Bulk samples of each material layer were obtained at the production sites and subsequently stored at the Wisconsin Department of Transportation Southeast Region facilities prior to testing. Figure 2.1 provides an illustration of the HMA perpetual pavement cross section used within the Marquette Interchange.
Figure 2.1 HMA Perpetual Pavement Structure The primary focus of the laboratory testing was the development of material characterization inputs for the mechanistic-empirical appraisal of projected pavement performance. In some cases, these inputs are direct outputs of laboratory tests while in others, further analysis of the laboratory test data is necessary to developed the needed input values.
2” 12.5 mm SMA wearing surface 7” 19.0 mm E30x middle 4” 19.0 mm C2 bottom 4” Open graded aggregate 6” Dense graded aggregate 18” Select crushed aggregate Native silty-clayey soils
Materials Characterization and Analysis of the Marquette Interchange HMA Perpetual Pavement | 2008
Midwest Regional University Transportation Center (MRUTC) 4
2.2 HMA Dynamic Modulus Testing 2.2.1. Sample Preparation
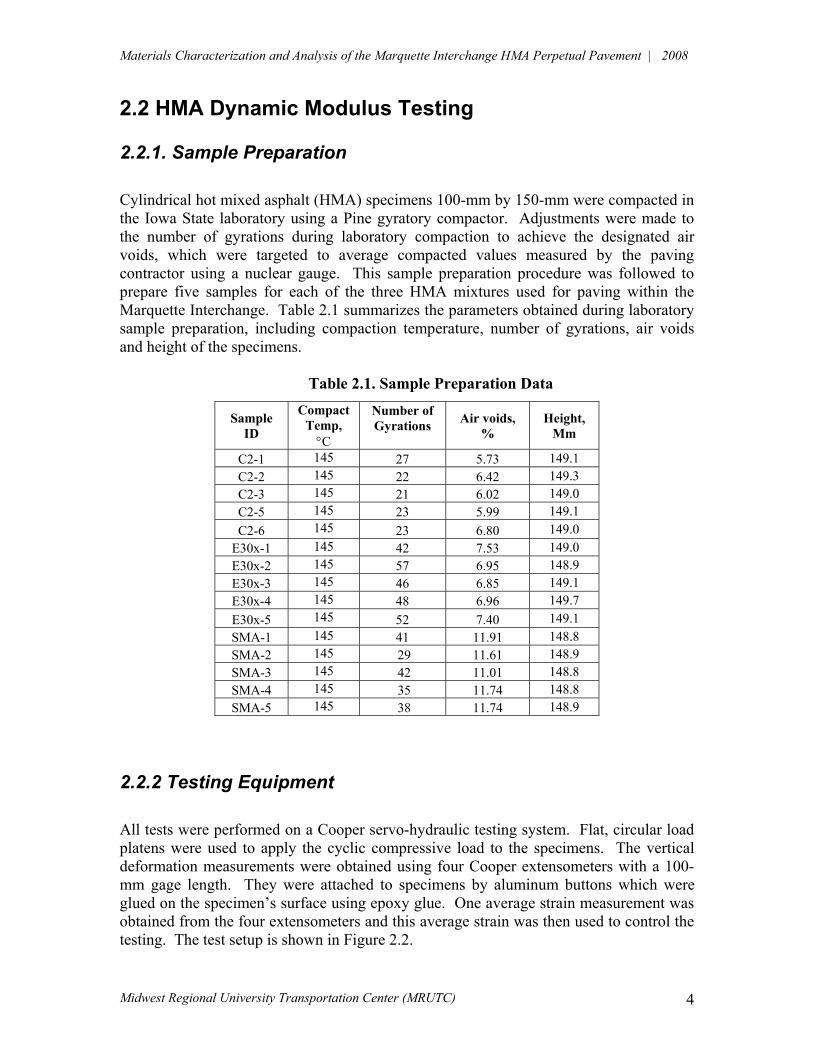
Cylindrical hot mixed asphalt (HMA) specimens 100-mm by 150-mm were compacted in the Iowa State laboratory using a Pine gyratory compactor. Adjustments were made to the number of gyrations during laboratory compaction to achieve the designated air voids, which were targeted to average compacted values measured by the paving contractor using a nuclear gauge. This sample preparation procedure was followed to prepare five samples for each of the three HMA mixtures used for paving within the Marquette Interchange. Table 2.1 summarizes the parameters obtained during laboratory sample preparation, including compaction temperature, number of gyrations, air voids and height of the specimens.
Table 2.1. Sample Preparation Data
Sample ID
Compact Temp, "C
Number of Gyrations
Air voids, %
Height, Mm
C2-1 145 27 5.73 149.1 C2-2 145 22 6.42 149.3 C2-3 145 21 6.02 149.0 C2-5 145 23 5.99 149.1 C2-6 145 23 6.80 149.0
E30x-1 145 42 7.53 149.0 E30x-2 145 57 6.95 148.9 E30x-3 145 46 6.85 149.1 E30x-4 145 48 6.96 149.7 E30x-5 145 52 7.40 149.1 SMA-1 145 41 11.91 148.8 SMA-2 145 29 11.61 148.9 SMA-3 145 42 11.01 148.8 SMA-4 145 35 11.74 148.8 SMA-5 145 38 11.74 148.9
2.2.2 Testing Equipment
All tests were performed on a Cooper servo-hydraulic testing system. Flat, circular load platens were used to apply the cyclic compressive load to the specimens. The vertical deformation measurements were obtained using four Cooper extensometers with a 100-mm gage length. They were attached to specimens by aluminum buttons which were glued on the specimen’s surface using epoxy glue. One average strain measurement was obtained from the four extensometers and this average strain was then used to control the testing. The test setup is shown in Figure 2.2.

Materials Characterization and Analysis of the Marquette Interchange HMA Perpetual Pavement | 2008
Midwest Regional University Transportation Center (MRUTC) 5
Figure 2.2 Dynamic Modulus Test Setup (NCHRP Report 547)
All tests were performed inside an environmental chamber. Mechanical cooling and heating was used for the test temperatures. The temperature was controlled by a temperature controller and verified using an independent platinum thermometer.
2.2.3 Testing Procedures
The testing procedure was based on AASHTO TP 62: Standard Method of Test for Determining Dynamic Modulus of Hot-Mix Asphalt Concrete Mixtures [1]. The procedure describes performing tests at several different temperatures and loading frequencies. Tests were performed at temperatures of 4, 21 and 37ºC and frequencies of 25, 15, 10, 5, 3, 1, 0.5, 0.3 and 0.1 Hz. Each specimen was tested for 27 combinations of temperature and frequency. Testing began with the lowest temperature and proceeded to the highest. At a given temperature, the testing began with the highest frequency of loading and proceeded to the lowest. On the morning of testing, specimen were placed in the environmental test chamber at the desired temperature and allowed to equilibrate for three hours. To begin testing, a minimal contact load was applied to the specimen. A sinusoidal axial compressive load was applied to the specimen without impact in a cyclic manner. The load was adjusted in each case to attempt to achieve an axial strain with an amplitude of 80 #$%with the aim to avoid accumulated damage to the specimen. It should be noted that the strain used for the testing control is an average strain from the four extensometers. The axial compressive load was adjusted in each test in an attempt to maintain the 80 #$%level of axial strain.
LVDT
Specimen
Loading
Materials Characterization and Analysis of the Marquette Interchange HMA Perpetual Pavement | 2008
Midwest Regional University Transportation Center (MRUTC) 6
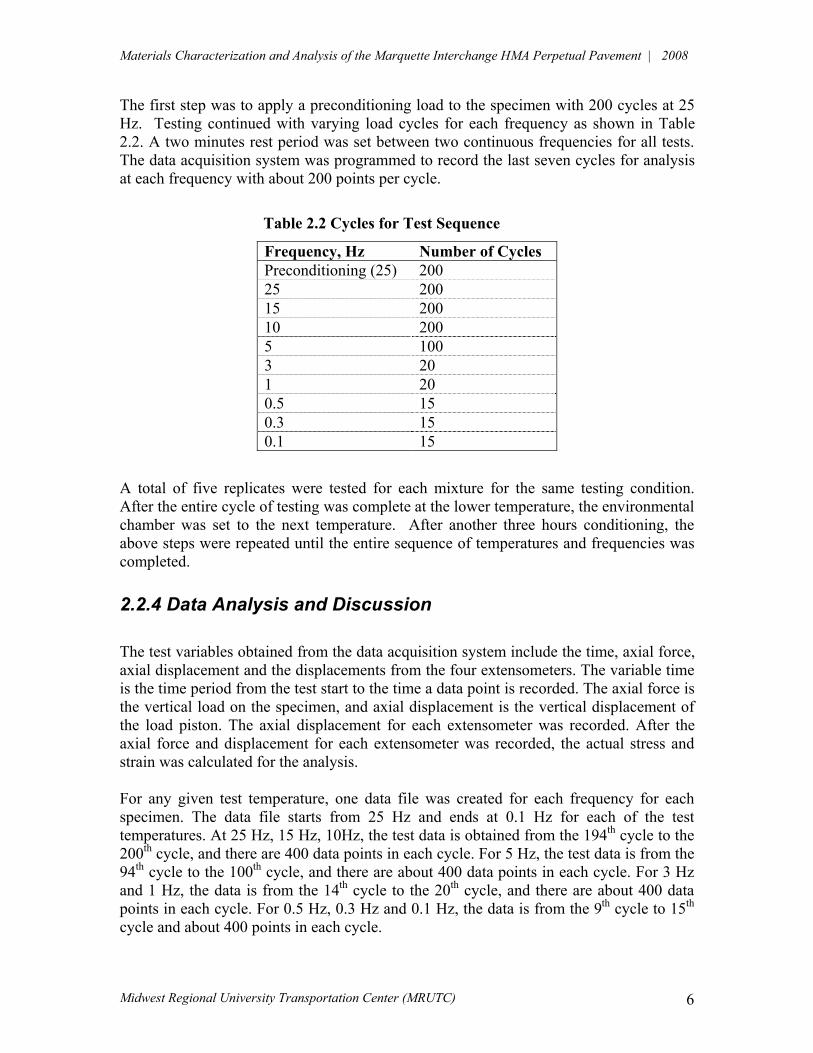
The first step was to apply a preconditioning load to the specimen with 200 cycles at 25 Hz. Testing continued with varying load cycles for each frequency as shown in Table 2.2. A two minutes rest period was set between two continuous frequencies for all tests. The data acquisition system was programmed to record the last seven cycles for analysis at each frequency with about 200 points per cycle.
Table 2.2 Cycles for Test Sequence
Frequency, Hz Number of Cycles Preconditioning (25) 200 25 200 15 200 10 200 5 100 3 20 1 20 0.5 15 0.3 15 0.1 15
A total of five replicates were tested for each mixture for the same testing condition. After the entire cycle of testing was complete at the lower temperature, the environmental chamber was set to the next temperature. After another three hours conditioning, the above steps were repeated until the entire sequence of temperatures and frequencies was completed.
2.2.4 Data Analysis and Discussion
The test variables obtained from the data acquisition system include the time, axial force, axial displacement and the displacements from the four extensometers. The variable time is the time period from the test start to the time a data point is recorded. The axial force is the vertical load on the specimen, and axial displacement is the vertical displacement of the load piston. The axial displacement for each extensometer was recorded. After the axial force and displacement for each extensometer was recorded, the actual stress and strain was calculated for the analysis. For any given test temperature, one data file was created for each frequency for each specimen. The data file starts from 25 Hz and ends at 0.1 Hz for each of the test temperatures. At 25 Hz, 15 Hz, 10Hz, the test data is obtained from the 194th cycle to the 200th cycle, and there are 400 data points in each cycle. For 5 Hz, the test data is from the 94th cycle to the 100th cycle, and there are about 400 data points in each cycle. For 3 Hz and 1 Hz, the data is from the 14th cycle to the 20th cycle, and there are about 400 data points in each cycle. For 0.5 Hz, 0.3 Hz and 0.1 Hz, the data is from the 9th cycle to 15th cycle and about 400 points in each cycle.

Materials Characterization and Analysis of the Marquette Interchange HMA Perpetual Pavement | 2008
Midwest Regional University Transportation Center (MRUTC) 7
For asphalt concrete, the complex dynamic modulus and phase angle change with temperature and load duration time or frequency of loading. At lower temperatures, the modulus for asphalt concrete is large, so it is easy to control the applied axial force in order to obtain small displacements. At higher temperatures, such as 37°C, the material becomes soft and it is more difficult to control the axial force to obtain small displacements. Figure 2.3 is a typical plot of the raw test data, in which the stress curve is sinusoidal shape whereas the curve for strain has an upward drift with time.
0
50
100
150
200
250
300
350
400
450
500
60 80 100 120 140 160
Time (s)
Stre
ss (K
Pa)
0.0002
0.00022
0.00024
0.00026
0.00028
0.0003
0.00032
0.00034
Stra
in (!
)
StressStrain
Figure 2.3 Typical Stress, Strain vs. Time Plot at Lower Temperature (4°C)
From the above plot, it can be seen that the displacement curves are not sinusoidal but increase with time, due to the drift in the displacement. This is especially obvious for higher temperatures. The following equations generally represent the load and displacement. )*2sin(*10 FFF tfCAF &' (() (2.1)
)*2sin(** 10 DDD tfCtAD &' (() (2.2)
where: F and D = load and displacement, respectively; A0F = mean value for the load; A0D = slope of the drift curve for the displacement; C1F and C1D = amplitude specifies the height of the oscillation for the load and displacement, respectively; f = frequency for the test; and !F and !D = phase angle for the load and displacement,!respectively.
One can invoke the trigonometric identity for equations (2.1) and (2.2): * +)sin()2cos()cos()2sin()2sin( 11 FFFFF ftftCftC &'&'&' ()( (2.3)

Materials Characterization and Analysis of the Marquette Interchange HMA Perpetual Pavement | 2008
Midwest Regional University Transportation Center (MRUTC) 8
)2sin()2cos()*2sin(* 11010 ftBftAAtfCAF FFFFFF ''&' (()(() (2.4) where )sin(11 FFF CA &) and )cos(11 FFF CB &) (2.5) The phase angle and amplitude for the load are obtained as follows [2]:
)arctan(1
1
F
FF B
A)& (2.6)
21
211 FFF BAC () (2.7)
Using the least-square fit of a sinusoid, the goal is to determine coefficient values that minimize [2]:
* +, -.)
((/)N
iiiir ftBftAAyS
1
2110 )2sin()2cos( '' (2.8)
The solutions for the equation (2.8) are [2]:
N
YA .)0 , .) )2cos(2
1 ftYN
A ' and .) )2sin(21 ftY
NB ' (2.9)
Here, Y is the centered load from the actual load value and N is the data point. The four parameters are used to characterize the sinusoidal function for the load. Maximum and minimum values were obtained for every cycle for the displacement. The slope was then calculated for the maximum and minimum values, respectively. The average of these two slopes was interpreted as the drift rate. Equation 2.9 could be used to calculate the parameters for the displacement. It should be noted that Y should be the corrected displacement. The method for this correction is given by the following equation: tREYYc *)( 0 //) (2.10) where: YC = Corrected displacement; Y0 = actual displacement; E = Average of all the actual displacements; (Y0-E) = centered displacement; R = displacement drift rate; and t = time.
Materials Characterization and Analysis of the Marquette Interchange HMA Perpetual Pavement | 2008
Midwest Regional University Transportation Center (MRUTC) 9
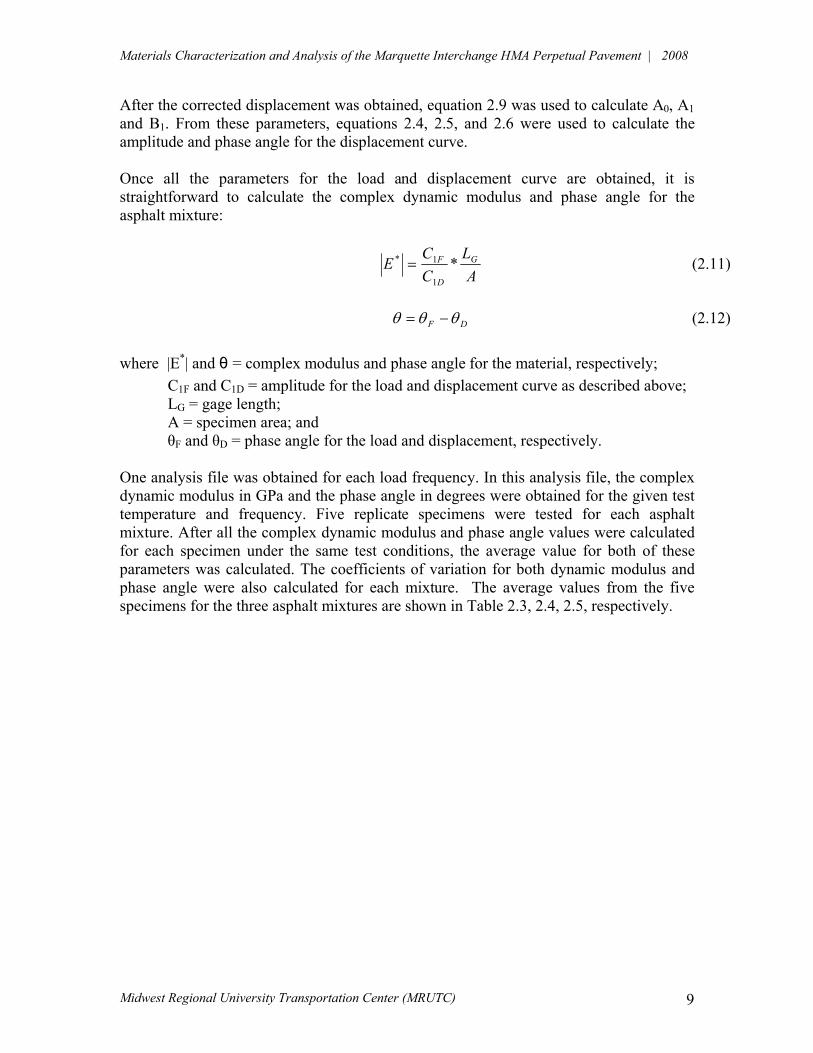
After the corrected displacement was obtained, equation 2.9 was used to calculate A0, A1 and B1. From these parameters, equations 2.4, 2.5, and 2.6 were used to calculate the amplitude and phase angle for the displacement curve. Once all the parameters for the load and displacement curve are obtained, it is straightforward to calculate the complex dynamic modulus and phase angle for the asphalt mixture:
A
LCCE G
D
F *1
1* ) (2.11)
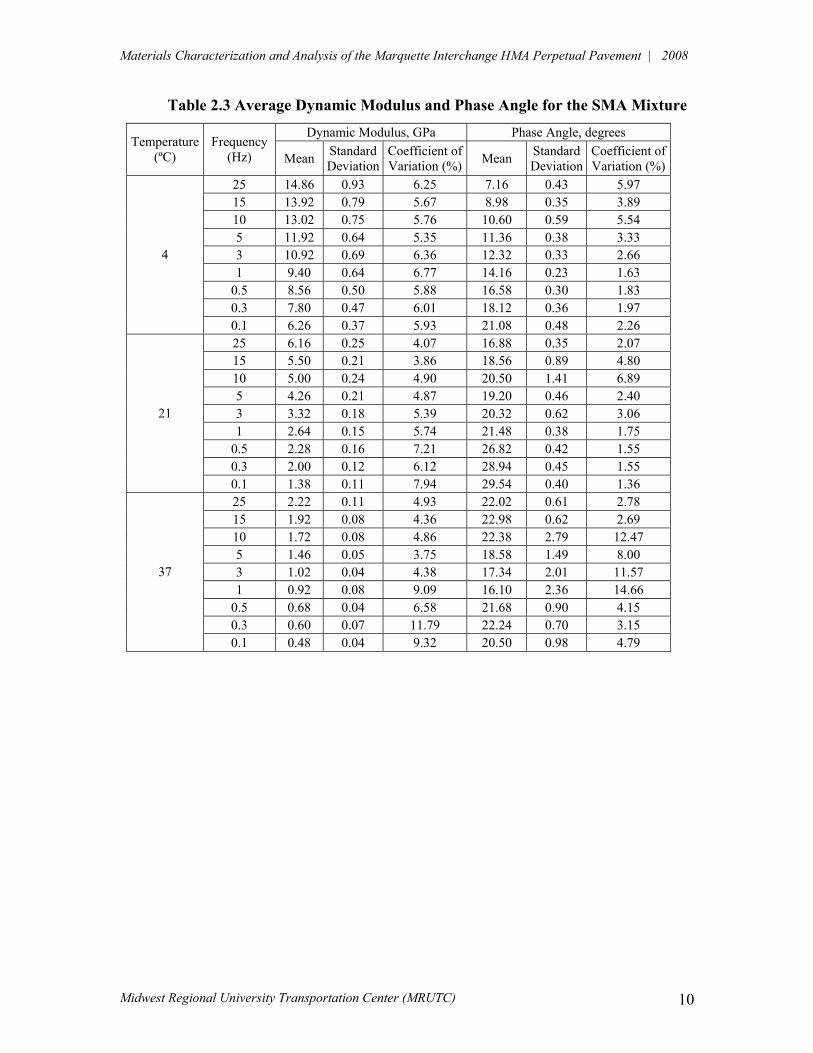
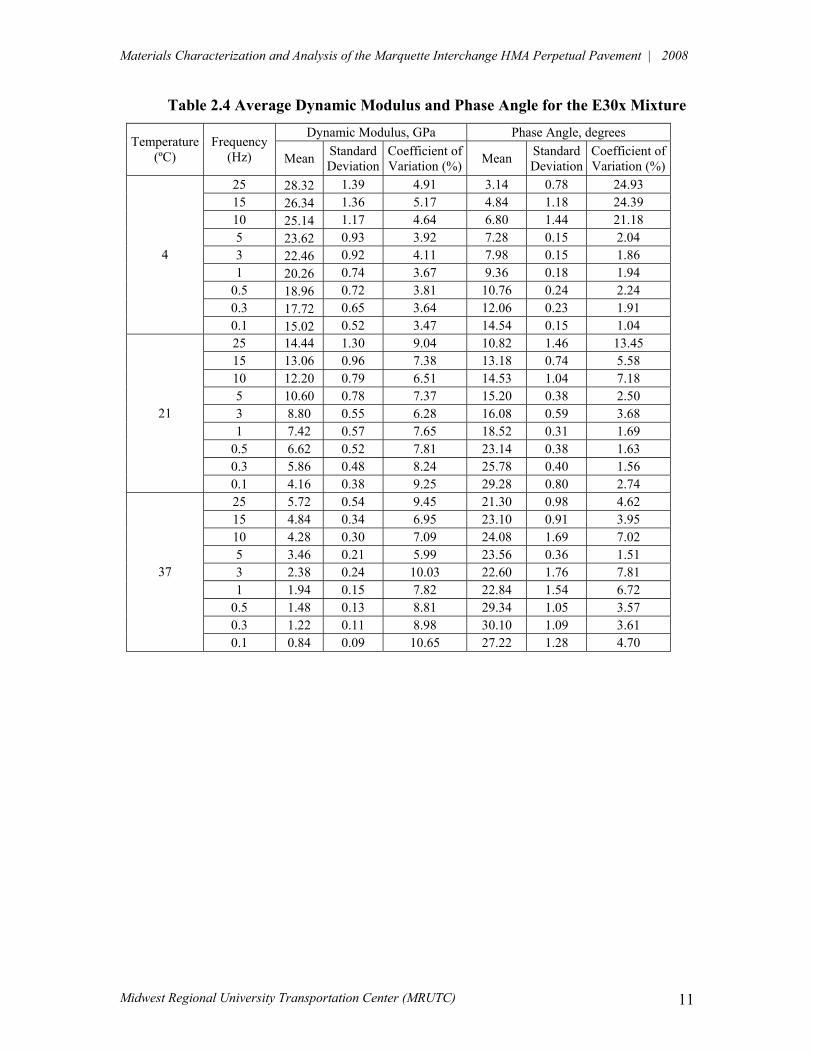
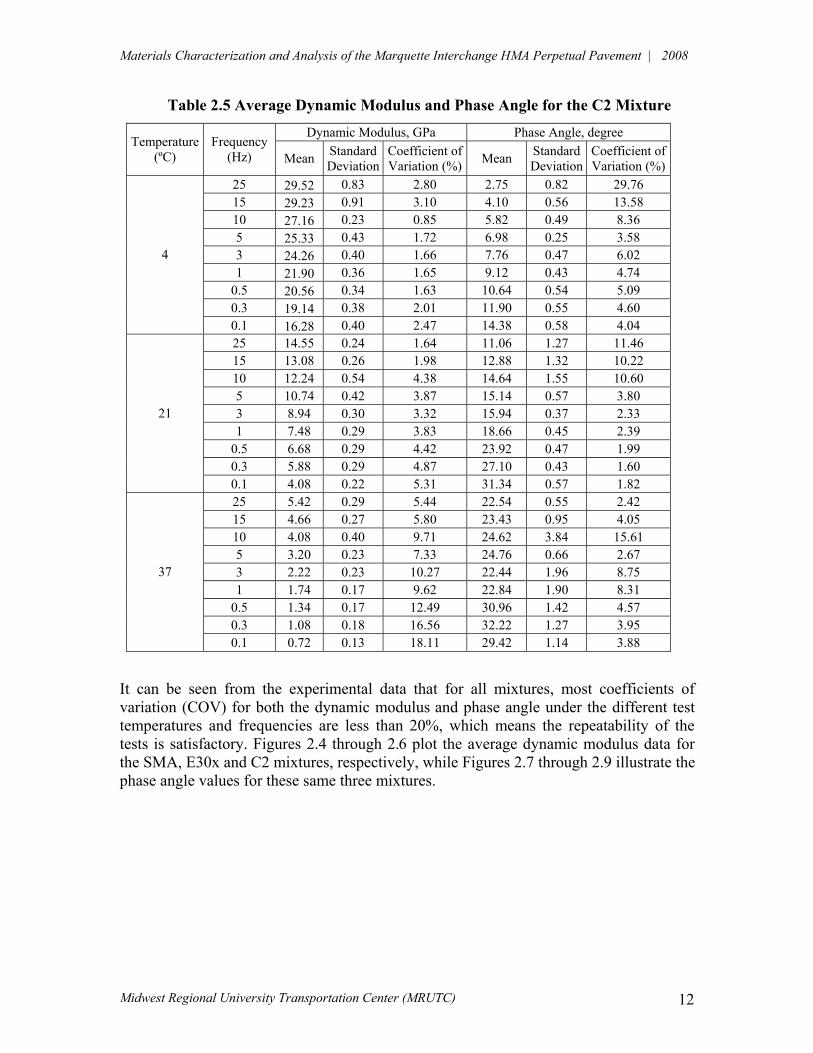
DF &&& /) (2.12) where |E*| and "!= complex modulus and phase angle for the material, respectively; C1F and C1D = amplitude for the load and displacement curve as described above; LG = gage length; A = specimen area; and !F and !D = phase angle for the load and displacement, respectively. One analysis file was obtained for each load frequency. In this analysis file, the complex dynamic modulus in GPa and the phase angle in degrees were obtained for the given test temperature and frequency. Five replicate specimens were tested for each asphalt mixture. After all the complex dynamic modulus and phase angle values were calculated for each specimen under the same test conditions, the average value for both of these parameters was calculated. The coefficients of variation for both dynamic modulus and phase angle were also calculated for each mixture. The average values from the five specimens for the three asphalt mixtures are shown in Table 2.3, 2.4, 2.5, respectively.
Materials Characterization and Analysis of the Marquette Interchange HMA Perpetual Pavement | 2008
Midwest Regional University Transportation Center (MRUTC) 10
Table 2.3 Average Dynamic Modulus and Phase Angle for the SMA Mixture Dynamic Modulus, GPa Phase Angle, degrees
Temperature (ºC)
Frequency (Hz) Mean Standard
DeviationCoefficient of Variation (%) Mean Standard
Deviation Coefficient of Variation (%)
25 14.86 0.93 6.25 7.16 0.43 5.97 15 13.92 0.79 5.67 8.98 0.35 3.89 10 13.02 0.75 5.76 10.60 0.59 5.54 5 11.92 0.64 5.35 11.36 0.38 3.33 3 10.92 0.69 6.36 12.32 0.33 2.66 1 9.40 0.64 6.77 14.16 0.23 1.63
0.5 8.56 0.50 5.88 16.58 0.30 1.83 0.3 7.80 0.47 6.01 18.12 0.36 1.97
4
0.1 6.26 0.37 5.93 21.08 0.48 2.26 25 6.16 0.25 4.07 16.88 0.35 2.07 15 5.50 0.21 3.86 18.56 0.89 4.80 10 5.00 0.24 4.90 20.50 1.41 6.89 5 4.26 0.21 4.87 19.20 0.46 2.40 3 3.32 0.18 5.39 20.32 0.62 3.06 1 2.64 0.15 5.74 21.48 0.38 1.75
0.5 2.28 0.16 7.21 26.82 0.42 1.55 0.3 2.00 0.12 6.12 28.94 0.45 1.55
21
0.1 1.38 0.11 7.94 29.54 0.40 1.36 25 2.22 0.11 4.93 22.02 0.61 2.78 15 1.92 0.08 4.36 22.98 0.62 2.69 10 1.72 0.08 4.86 22.38 2.79 12.47 5 1.46 0.05 3.75 18.58 1.49 8.00 3 1.02 0.04 4.38 17.34 2.01 11.57 1 0.92 0.08 9.09 16.10 2.36 14.66
0.5 0.68 0.04 6.58 21.68 0.90 4.15 0.3 0.60 0.07 11.79 22.24 0.70 3.15
37
0.1 0.48 0.04 9.32 20.50 0.98 4.79
Materials Characterization and Analysis of the Marquette Interchange HMA Perpetual Pavement | 2008
Midwest Regional University Transportation Center (MRUTC) 11
Table 2.4 Average Dynamic Modulus and Phase Angle for the E30x Mixture Dynamic Modulus, GPa Phase Angle, degrees
Temperature (ºC)
Frequency (Hz) Mean Standard
DeviationCoefficient of Variation (%) Mean Standard
Deviation Coefficient of Variation (%)
25 28.32 1.39 4.91 3.14 0.78 24.93 15 26.34 1.36 5.17 4.84 1.18 24.39 10 25.14 1.17 4.64 6.80 1.44 21.18 5 23.62 0.93 3.92 7.28 0.15 2.04 3 22.46 0.92 4.11 7.98 0.15 1.86 1 20.26 0.74 3.67 9.36 0.18 1.94
0.5 18.96 0.72 3.81 10.76 0.24 2.24 0.3 17.72 0.65 3.64 12.06 0.23 1.91
4
0.1 15.02 0.52 3.47 14.54 0.15 1.04 25 14.44 1.30 9.04 10.82 1.46 13.45 15 13.06 0.96 7.38 13.18 0.74 5.58 10 12.20 0.79 6.51 14.53 1.04 7.18 5 10.60 0.78 7.37 15.20 0.38 2.50 3 8.80 0.55 6.28 16.08 0.59 3.68 1 7.42 0.57 7.65 18.52 0.31 1.69
0.5 6.62 0.52 7.81 23.14 0.38 1.63 0.3 5.86 0.48 8.24 25.78 0.40 1.56
21
0.1 4.16 0.38 9.25 29.28 0.80 2.74 25 5.72 0.54 9.45 21.30 0.98 4.62 15 4.84 0.34 6.95 23.10 0.91 3.95 10 4.28 0.30 7.09 24.08 1.69 7.02 5 3.46 0.21 5.99 23.56 0.36 1.51 3 2.38 0.24 10.03 22.60 1.76 7.81 1 1.94 0.15 7.82 22.84 1.54 6.72
0.5 1.48 0.13 8.81 29.34 1.05 3.57 0.3 1.22 0.11 8.98 30.10 1.09 3.61
37
0.1 0.84 0.09 10.65 27.22 1.28 4.70
Materials Characterization and Analysis of the Marquette Interchange HMA Perpetual Pavement | 2008
Midwest Regional University Transportation Center (MRUTC) 12
Table 2.5 Average Dynamic Modulus and Phase Angle for the C2 Mixture Dynamic Modulus, GPa Phase Angle, degree
Temperature (ºC)
Frequency (Hz) Mean Standard
DeviationCoefficient of Variation (%) Mean Standard
Deviation Coefficient of Variation (%)
25 29.52 0.83 2.80 2.75 0.82 29.76 15 29.23 0.91 3.10 4.10 0.56 13.58 10 27.16 0.23 0.85 5.82 0.49 8.36 5 25.33 0.43 1.72 6.98 0.25 3.58 3 24.26 0.40 1.66 7.76 0.47 6.02 1 21.90 0.36 1.65 9.12 0.43 4.74
0.5 20.56 0.34 1.63 10.64 0.54 5.09 0.3 19.14 0.38 2.01 11.90 0.55 4.60
4
0.1 16.28 0.40 2.47 14.38 0.58 4.04 25 14.55 0.24 1.64 11.06 1.27 11.46 15 13.08 0.26 1.98 12.88 1.32 10.22 10 12.24 0.54 4.38 14.64 1.55 10.60 5 10.74 0.42 3.87 15.14 0.57 3.80 3 8.94 0.30 3.32 15.94 0.37 2.33 1 7.48 0.29 3.83 18.66 0.45 2.39
0.5 6.68 0.29 4.42 23.92 0.47 1.99 0.3 5.88 0.29 4.87 27.10 0.43 1.60
21
0.1 4.08 0.22 5.31 31.34 0.57 1.82 25 5.42 0.29 5.44 22.54 0.55 2.42 15 4.66 0.27 5.80 23.43 0.95 4.05 10 4.08 0.40 9.71 24.62 3.84 15.61 5 3.20 0.23 7.33 24.76 0.66 2.67 3 2.22 0.23 10.27 22.44 1.96 8.75 1 1.74 0.17 9.62 22.84 1.90 8.31
0.5 1.34 0.17 12.49 30.96 1.42 4.57 0.3 1.08 0.18 16.56 32.22 1.27 3.95
37
0.1 0.72 0.13 18.11 29.42 1.14 3.88
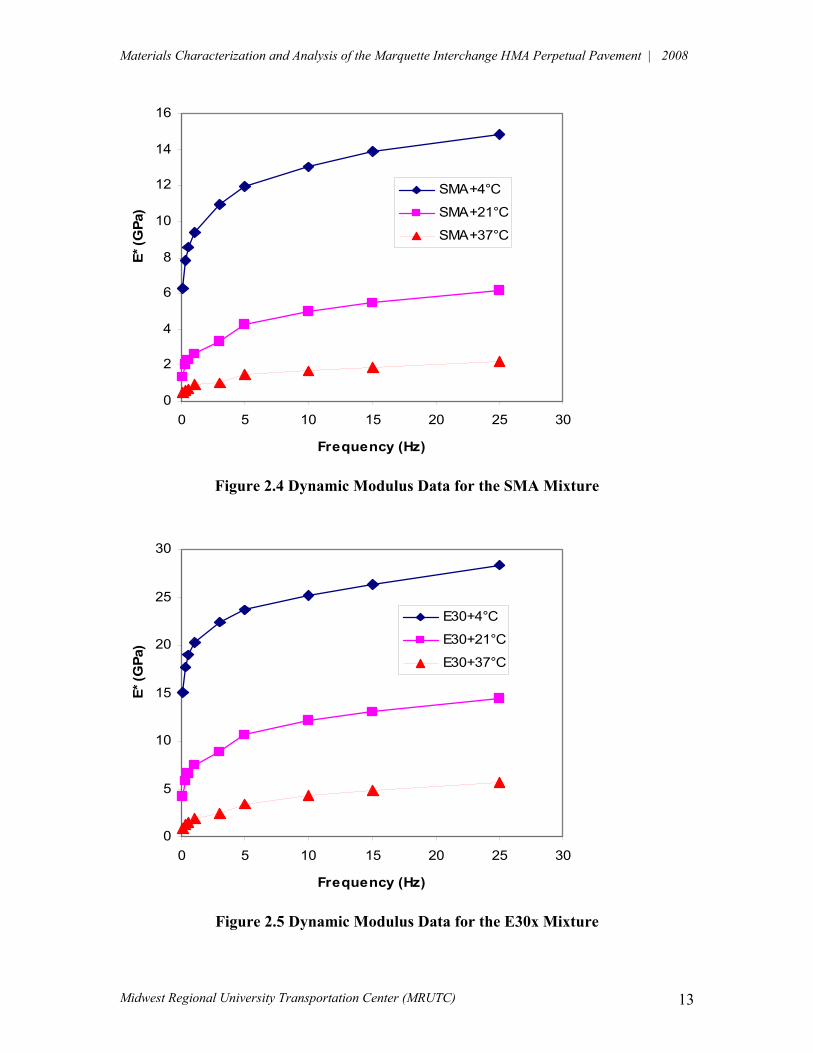
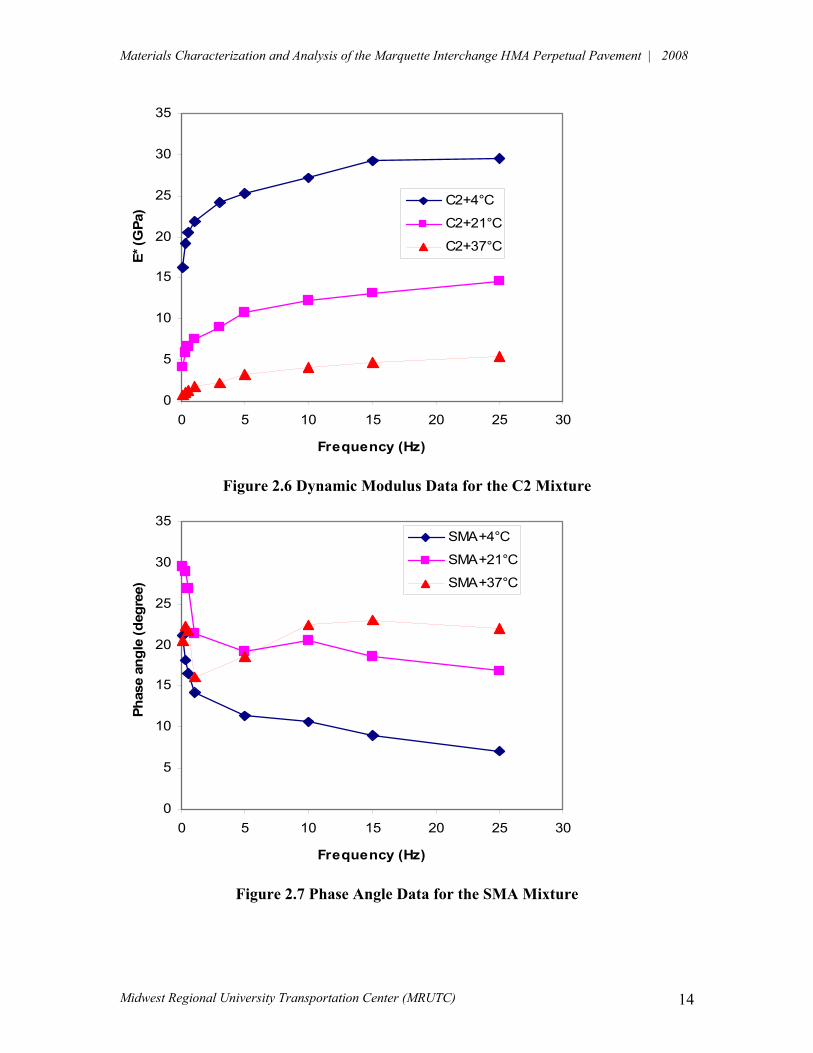
It can be seen from the experimental data that for all mixtures, most coefficients of variation (COV) for both the dynamic modulus and phase angle under the different test temperatures and frequencies are less than 20%, which means the repeatability of the tests is satisfactory. Figures 2.4 through 2.6 plot the average dynamic modulus data for the SMA, E30x and C2 mixtures, respectively, while Figures 2.7 through 2.9 illustrate the phase angle values for these same three mixtures.
Materials Characterization and Analysis of the Marquette Interchange HMA Perpetual Pavement | 2008
Midwest Regional University Transportation Center (MRUTC) 13
0
2
4
6
8
10
12
14
16
0 5 10 15 20 25 30
Frequency (Hz)
E* (G
Pa)
SMA+4°C
SMA+21°C
SMA+37°C
Figure 2.4 Dynamic Modulus Data for the SMA Mixture
0
5
10
15
20
25
30
0 5 10 15 20 25 30
Frequency (Hz)
E* (G
Pa)
E30+4°C
E30+21°C
E30+37°C
Figure 2.5 Dynamic Modulus Data for the E30x Mixture
Materials Characterization and Analysis of the Marquette Interchange HMA Perpetual Pavement | 2008
Midwest Regional University Transportation Center (MRUTC) 14
0
5
10
15
20
25
30
35
0 5 10 15 20 25 30
Frequency (Hz)
E* (G
Pa)
C2+4°C
C2+21°C
C2+37°C
Figure 2.6 Dynamic Modulus Data for the C2 Mixture
0
5
10
15
20
25
30
35
0 5 10 15 20 25 30
Frequency (Hz)
Phas
e an
gle
(deg
ree)
SMA+4°C
SMA+21°C
SMA+37°C
Figure 2.7 Phase Angle Data for the SMA Mixture
Materials Characterization and Analysis of the Marquette Interchange HMA Perpetual Pavement | 2008
Midwest Regional University Transportation Center (MRUTC) 15
0
5
10
15
20
25
30
35
0 5 10 15 20 25 30
Frequency (Hz)
Phas
e an
gle
(deg
ree)
C2+4°C
C2+21°C
C2+37°C
0
5
10
15
20
25
30
35
0 5 10 15 20 25 30
Frequency (Hz)
Phas
e an
gle
(deg
ree)
E30+4°C
E30+21°C
E30+37°C
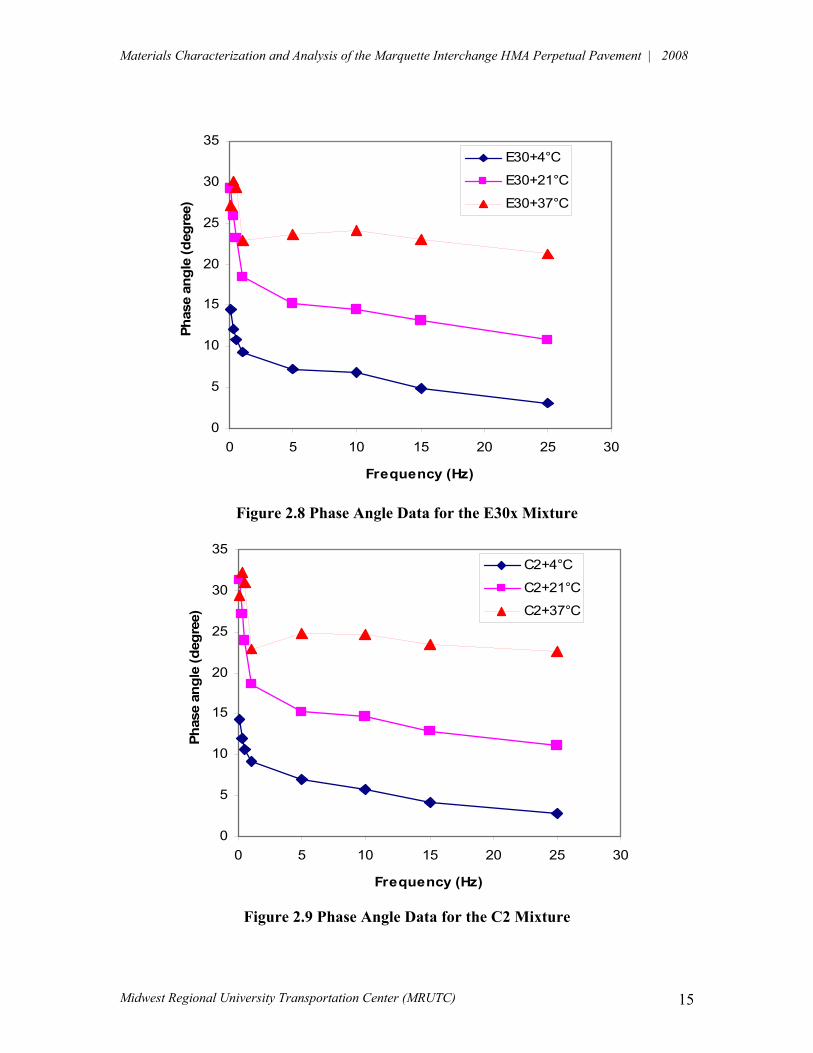
Figure 2.8 Phase Angle Data for the E30x Mixture
Figure 2.9 Phase Angle Data for the C2 Mixture

Materials Characterization and Analysis of the Marquette Interchange HMA Perpetual Pavement | 2008
Midwest Regional University Transportation Center (MRUTC) 16
From the above figures, it was observed that the dynamic modulus values for all mixtures decrease with the increase of test temperature and increase with the increase of frequency, as is well known for asphalt mixtures. As for the phase angle, it was found that the phase angle increases with the increase of test temperature and decreases with frequency. This is nearly true for all mixtures except for few points at the highest test temperature. It is well documented that asphalt materials are viscoelastic materials and they always demonstrates more viscous properties at higher temperatures, which leads to more difficult accurate measurement of the phase angle at higher temperatures, such as 37º C. This can be used to explain the phase angle values at higher temperature, as shown in Figures 2.7 through 2.9. In order to compare the dynamic modulus values for different mixtures, the dynamic modulus data is plotted in one figure, as shown in Figure 2.10.
0
5
10
15
20
25
30
35
0 5 10 15 20 25 30Frequency (Hz)
E* (G
Pa)
SMA+4°CSMA+21°CSMA+37°CE30+4ºCE30+21ºCE30+37ºCC2+4ºCC2+21ºCC2+37ºC
Figure 2.10 Dynamic Modulus Data for all Mixtures
It can be seen from Figure 2.10 that the SMA mixture has substantially lower dynamic modulus value than the other two mixtures, given the same test condition. The E30x and C2 mixtures have very close dynamic modulus values at the two higher test temperatures, whereas at the highest test temperature the C2 mixture has a higher dynamic modulus than the E30x mixture.
Materials Characterization and Analysis of the Marquette Interchange HMA Perpetual Pavement | 2008
Midwest Regional University Transportation Center (MRUTC) 17
2.2.5 Dynamic Modulus Master Curves
The asphalt mixtures are thermorheologically simple materials and the time-temperature superposition principle is applicable in the linear viscoelastic state. The dynamic modulus and phase angle of asphalt mixtures can be shifted along the frequency axis to form single characteristic master curves at a desired reference temperature or frequency.
Typically the shift factors 0T are obtained from the WLF equation [3]:
S
ST TTC
TTC/(/
)2
1 )(log0 (2.13)
where C1 and C2 are constants, Ts is the reference temperature, and T is the temperature of each individual test. A new method of developing the master curve for asphalt mixtures was developed in the research conducted by Pellinen [4] at the University of Maryland. In this study, master curves were constructed fitting a sigmoidal function to the measured compressive dynamic modulus test data using non-linear least squares regression techniques [4]. The shift can be done by solving the shift factors simultaneously with the coefficients of the sigmoidal function. The sigmoidal function is defined by equation 2.14.
1 2Tr sfe
E(/(
())log(
*
1log
34
0! (2.14)
where
log|E*| = log of dynamic modulus; " = minimum modulus value; fr = reduced frequency; # = span of modulus values; sT = shift factor according to temperature; and $, 3 = shape parameters.
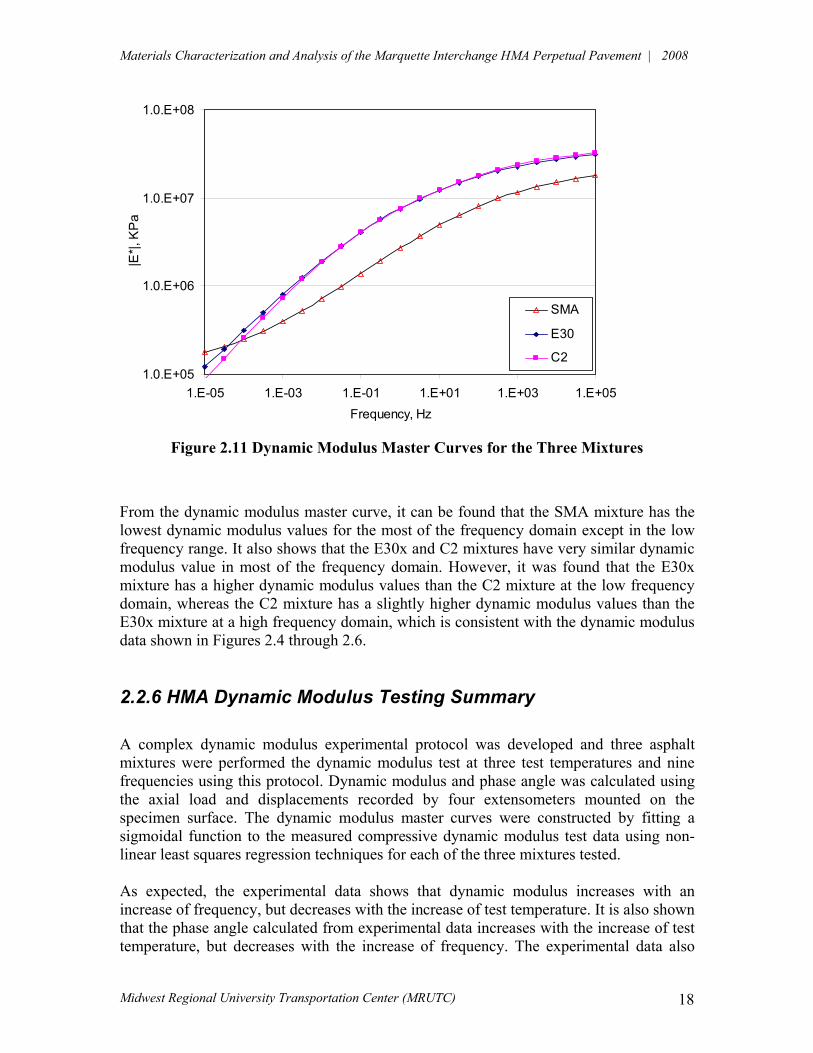
The master curve can be constructed using any non-linear curve-fitting technique. The reference temperature for all mixtures is 21°C. The Microsoft Excel Solver was used to fit the master curve for each set of data. This method uses the Generalized Reduced Gradient nonlinear optimization approach to find the parameters that give the "best fit" between the equation and the data. The nonlinear regression algorithm seeks the values of the parameters that minimize the sum of the squared differences between the values of the observed and predicted values of the dynamic modulus. Figure 2.11 shows the dynamic modulus master curve for the three mixtures.
Materials Characterization and Analysis of the Marquette Interchange HMA Perpetual Pavement | 2008
Midwest Regional University Transportation Center (MRUTC) 18
1.0.E+05
1.0.E+06
1.0.E+07
1.0.E+08
1.E-05 1.E-03 1.E-01 1.E+01 1.E+03 1.E+05Frequency, Hz
|E*|,
KP
a
SMA
E30
C2
Figure 2.11 Dynamic Modulus Master Curves for the Three Mixtures
From the dynamic modulus master curve, it can be found that the SMA mixture has the lowest dynamic modulus values for the most of the frequency domain except in the low frequency range. It also shows that the E30x and C2 mixtures have very similar dynamic modulus value in most of the frequency domain. However, it was found that the E30x mixture has a higher dynamic modulus values than the C2 mixture at the low frequency domain, whereas the C2 mixture has a slightly higher dynamic modulus values than the E30x mixture at a high frequency domain, which is consistent with the dynamic modulus data shown in Figures 2.4 through 2.6. 2.2.6 HMA Dynamic Modulus Testing Summary
A complex dynamic modulus experimental protocol was developed and three asphalt mixtures were performed the dynamic modulus test at three test temperatures and nine frequencies using this protocol. Dynamic modulus and phase angle was calculated using the axial load and displacements recorded by four extensometers mounted on the specimen surface. The dynamic modulus master curves were constructed by fitting a sigmoidal function to the measured compressive dynamic modulus test data using non-linear least squares regression techniques for each of the three mixtures tested. As expected, the experimental data shows that dynamic modulus increases with an increase of frequency, but decreases with the increase of test temperature. It is also shown that the phase angle calculated from experimental data increases with the increase of test temperature, but decreases with the increase of frequency. The experimental data also
Materials Characterization and Analysis of the Marquette Interchange HMA Perpetual Pavement | 2008
Midwest Regional University Transportation Center (MRUTC) 19
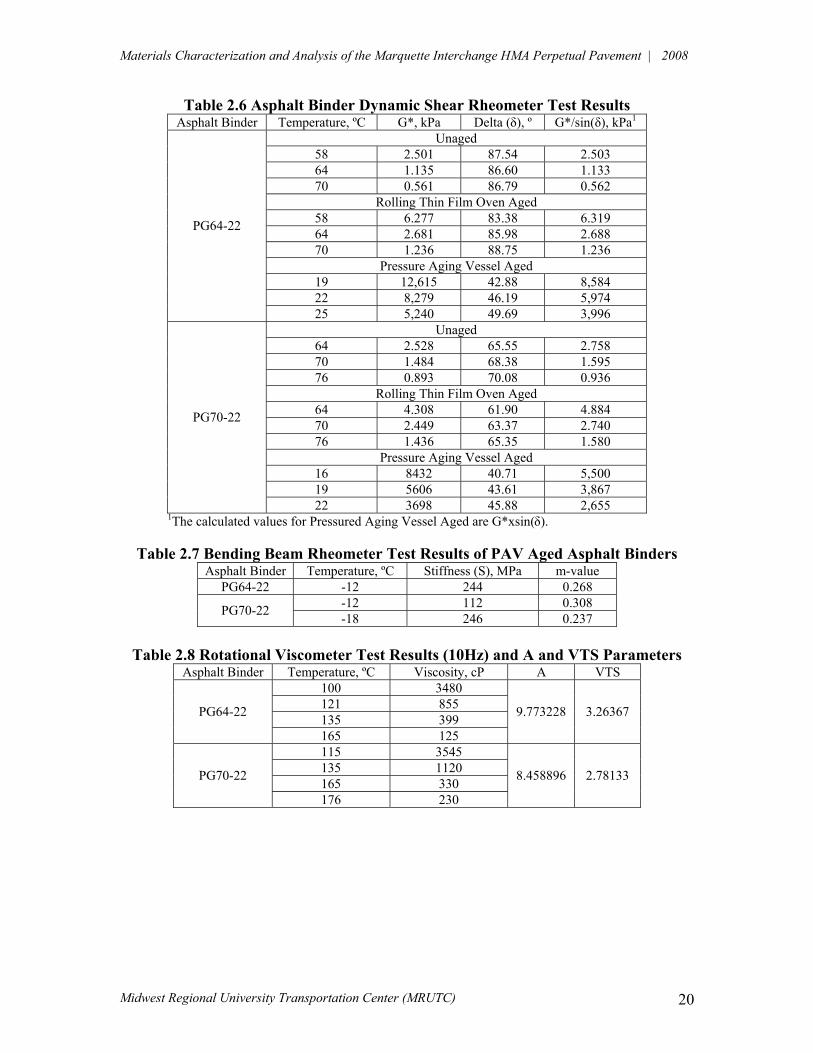
shows that the mixture of SMA has the lowest dynamic modulus values, given the same test condition. The E30x and C2 mixtures have very similar dynamic modulus values at the two higher test temperatures while at the lowest temperature the C2 mixture has higher dynamic modulus values than E30x. The dynamic modulus master curve confirms that the SMA mixture has the lowest dynamic modulus values for most of the frequency domain. The dynamic modulus master curves also demonstrates that the E30x and C2 mixtures have very similar dynamic modulus values for most of the frequency domain, and only a slight difference was found at the high frequency domain. 2.3 Binder Characterization Characterization of tank asphalt binders supplied by Marquette University was done in accordance with AASHTO test specifications. The test specifications followed were:
-Dynamic Shear Rheometer: AASHTO T315-06, -Rolling Thin Film Oven Test: AASHTO T240-06, -Pressure Aging Vessel: AASHTO R28-06, -Bending Beam Rheometer: AASHTO T313-06, and -Rotational Viscometer: AASHTO T316-06.
The test results are summarized in Tables 2.6 through 2.8 below. The A and VTS parameters in Table 2.8 were determined as summarized by Mirza and Witczak (1995) and used in the AASHTO Mechanistic-Empirical Pavement Design Guide (2004).
Materials Characterization and Analysis of the Marquette Interchange HMA Perpetual Pavement | 2008
Midwest Regional University Transportation Center (MRUTC) 20
Table 2.6 Asphalt Binder Dynamic Shear Rheometer Test Results Asphalt Binder Temperature, ºC G*, kPa Delta ("), º G*/sin("), kPa1
Unaged 58 2.501 87.54 2.503 64 1.135 86.60 1.133 70 0.561 86.79 0.562
Rolling Thin Film Oven Aged 58 6.277 83.38 6.319 64 2.681 85.98 2.688 70 1.236 88.75 1.236
Pressure Aging Vessel Aged 19 12,615 42.88 8,584 22 8,279 46.19 5,974
PG64-22
25 5,240 49.69 3,996 Unaged
64 2.528 65.55 2.758 70 1.484 68.38 1.595 76 0.893 70.08 0.936
Rolling Thin Film Oven Aged 64 4.308 61.90 4.884 70 2.449 63.37 2.740 76 1.436 65.35 1.580
Pressure Aging Vessel Aged 16 8432 40.71 5,500 19 5606 43.61 3,867
PG70-22
22 3698 45.88 2,655 1The calculated values for Pressured Aging Vessel Aged are G*xsin(").
Table 2.7 Bending Beam Rheometer Test Results of PAV Aged Asphalt Binders Asphalt Binder Temperature, ºC Stiffness (S), MPa m-value
PG64-22 -12 244 0.268 -12 112 0.308 PG70-22 -18 246 0.237
Table 2.8 Rotational Viscometer Test Results (10Hz) and A and VTS Parameters
Asphalt Binder Temperature, ºC Viscosity, cP A VTS 100 3480 121 855 135 399 PG64-22
165 125
9.773228 3.26367
115 3545 135 1120 165 330 PG70-22
176 230
8.458896 2.78133
Materials Characterization and Analysis of the Marquette Interchange HMA Perpetual Pavement | 2008
Midwest Regional University Transportation Center (MRUTC) 21
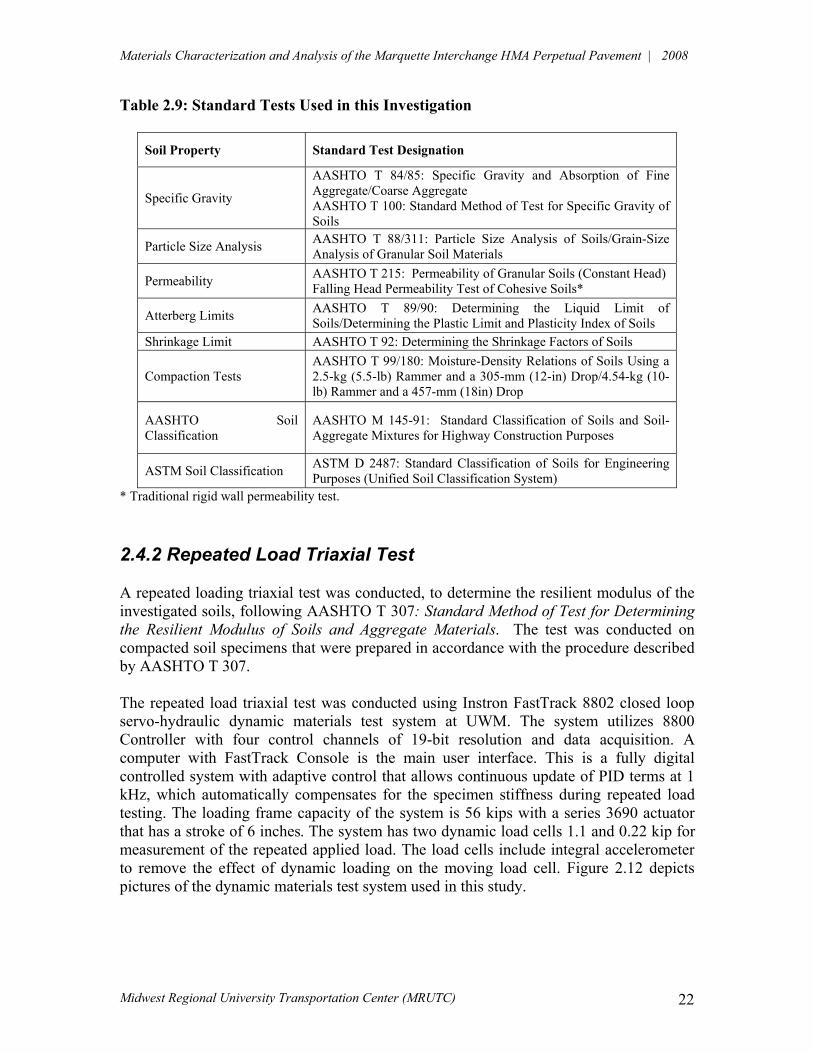
2.4 Characterization of Unbound Subgrade and Aggregate Base Course Materials A laboratory testing program was conducted on subgrade soil and aggregate base course materials obtained from the Marquette Interchange site in Milwaukee, Wisconsin. The testing program was conducted at the Geotechnical and Pavement Research Laboratory at the University of Wisconsin-Milwaukee. Soil and aggregate samples were subjected to different tests to determine their physical properties, compaction characteristics, and resilient modulus. The samples from the Marquette Interchange Project consist of two soil samples and two aggregate samples. The soil samples are from Location 1 (sta. 385+26.43, off. 64.61 Rt) and Location 2 (sta. 385+40.84, off. 63.67 Rt) herein referred to as Soil 1 and Soil 2, respectively. These sampling locations were selected as representative of the two distinct soil types within the instrumented section (sta. 385+10 to 385+50). Two 5-gallon buckets of each soil were provided, each sampled from different elevations. Soil 1 samples were extracted from elevations 657.0’-656.0’ and 656.0’-655.0’, representing the top 12 inches and next 12 inches of native soils, respectively. Soil 2 samples were from elevations 656.4’-655.4’ and 655.4’-654.4’, again representing the top 12 inches and next 12 inches of native soils, respectively. Basic soil characterization tests showed that samples of Soil 1 from each elevation have different properties and as a result different classifications, and will be referred to herein as Soil 1A and Soil 1B. Tests indicated that the two samples of Soil 2 were of the same material and will therefore continue to be grouped as Soil 2. This extended the testing to three soil samples, Soil 1A, Soil 1B, Soil 2, and two aggregate samples: Open-Graded and Dense-Graded. 2.4.1 Laboratory Testing of Subgrade Soils Collected soils were subjected to standard laboratory tests to determine their physical properties, permeability, and compaction characteristics. Soil testing consisted of the following: grain size distribution (sieve and hydrometer analyses), Atterberg limits (liquid limit, LL, plastic limit, PL, and Shrinkage Limit, SL), specific gravity (Gs), and permeability. Soils were also subjected to Standard Proctor test to determine the optimum moisture content (wopt.) and maximum dry unit weight (3dmax). Laboratory tests were conducted following the AASHTO standard test procedures. Table 2.9 presents a summary of the standard tests used in this study.
Materials Characterization and Analysis of the Marquette Interchange HMA Perpetual Pavement | 2008
Midwest Regional University Transportation Center (MRUTC) 22
Table 2.9: Standard Tests Used in this Investigation
Soil Property Standard Test Designation
Specific Gravity
AASHTO T 84/85: Specific Gravity and Absorption of Fine Aggregate/Coarse Aggregate AASHTO T 100: Standard Method of Test for Specific Gravity of Soils
Particle Size Analysis AASHTO T 88/311: Particle Size Analysis of Soils/Grain-Size Analysis of Granular Soil Materials
Permeability AASHTO T 215: Permeability of Granular Soils (Constant Head) Falling Head Permeability Test of Cohesive Soils*
Atterberg Limits AASHTO T 89/90: Determining the Liquid Limit of Soils/Determining the Plastic Limit and Plasticity Index of Soils
Shrinkage Limit AASHTO T 92: Determining the Shrinkage Factors of Soils
Compaction Tests AASHTO T 99/180: Moisture-Density Relations of Soils Using a 2.5-kg (5.5-lb) Rammer and a 305-mm (12-in) Drop/4.54-kg (10-lb) Rammer and a 457-mm (18in) Drop
AASHTO Soil Classification
AASHTO M 145-91: Standard Classification of Soils and Soil-Aggregate Mixtures for Highway Construction Purposes
ASTM Soil Classification ASTM D 2487: Standard Classification of Soils for Engineering Purposes (Unified Soil Classification System)
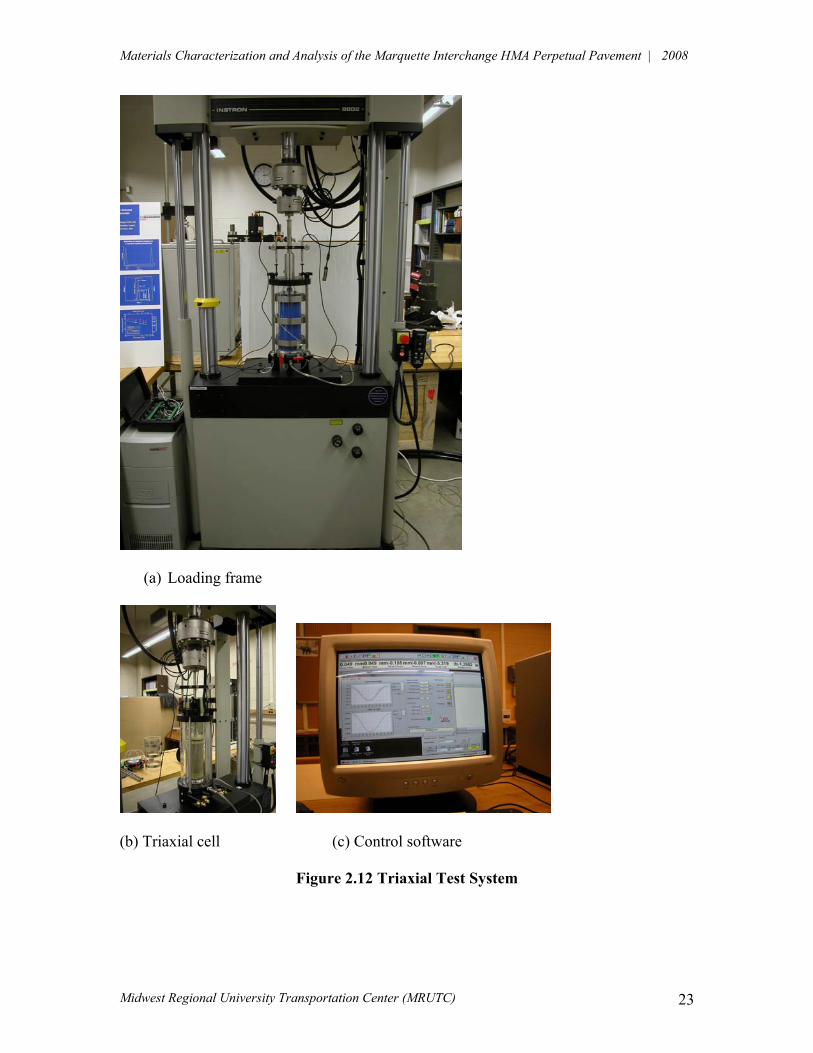
* Traditional rigid wall permeability test. 2.4.2 Repeated Load Triaxial Test A repeated loading triaxial test was conducted, to determine the resilient modulus of the investigated soils, following AASHTO T 307: Standard Method of Test for Determining the Resilient Modulus of Soils and Aggregate Materials. The test was conducted on compacted soil specimens that were prepared in accordance with the procedure described by AASHTO T 307. The repeated load triaxial test was conducted using Instron FastTrack 8802 closed loop servo-hydraulic dynamic materials test system at UWM. The system utilizes 8800 Controller with four control channels of 19-bit resolution and data acquisition. A computer with FastTrack Console is the main user interface. This is a fully digital controlled system with adaptive control that allows continuous update of PID terms at 1 kHz, which automatically compensates for the specimen stiffness during repeated load testing. The loading frame capacity of the system is 56 kips with a series 3690 actuator that has a stroke of 6 inches. The system has two dynamic load cells 1.1 and 0.22 kip for measurement of the repeated applied load. The load cells include integral accelerometer to remove the effect of dynamic loading on the moving load cell. Figure 2.12 depicts pictures of the dynamic materials test system used in this study.
Materials Characterization and Analysis of the Marquette Interchange HMA Perpetual Pavement | 2008
Midwest Regional University Transportation Center (MRUTC) 23
(a) Loading frame
(b) Triaxial cell (c) Control software
Figure 2.12 Triaxial Test System
Materials Characterization and Analysis of the Marquette Interchange HMA Perpetual Pavement | 2008
Midwest Regional University Transportation Center (MRUTC) 24
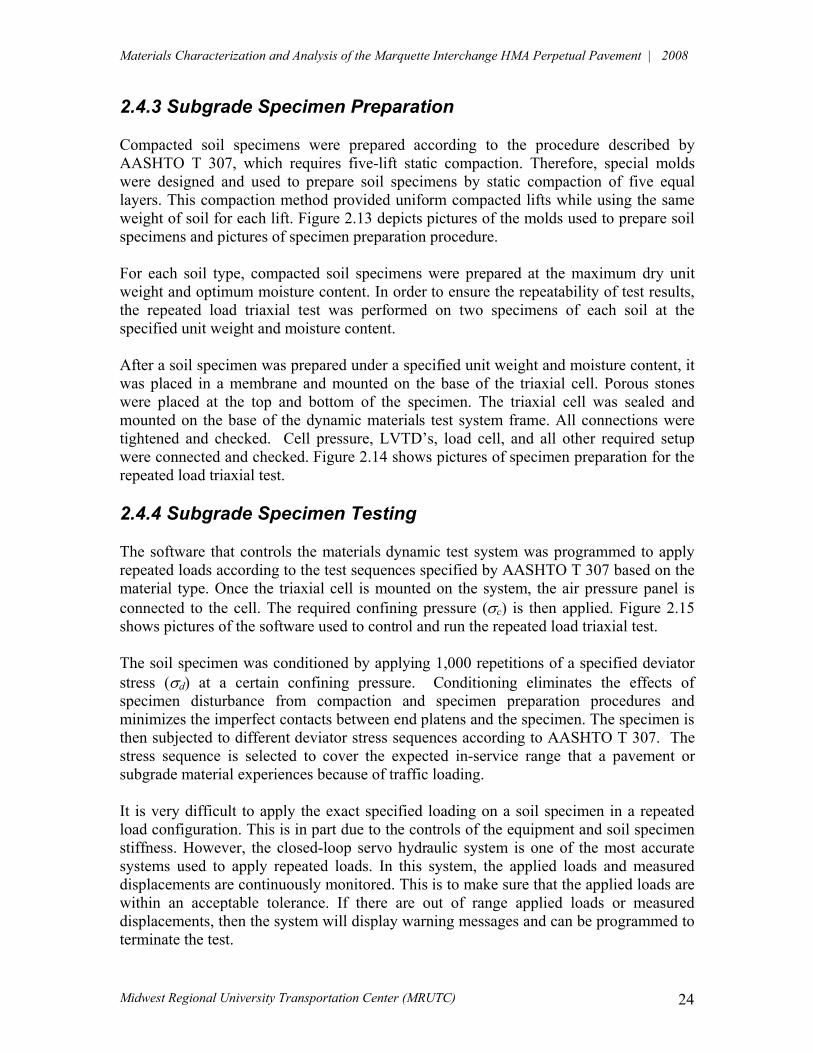
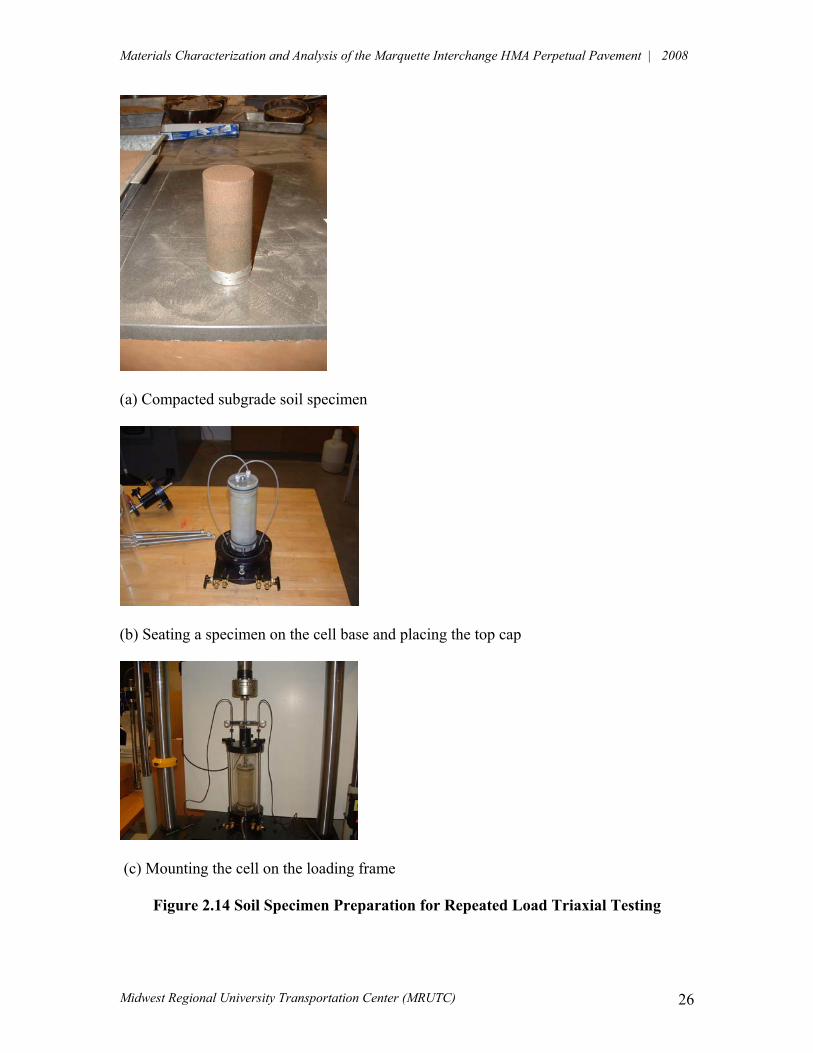
2.4.3 Subgrade Specimen Preparation Compacted soil specimens were prepared according to the procedure described by AASHTO T 307, which requires five-lift static compaction. Therefore, special molds were designed and used to prepare soil specimens by static compaction of five equal layers. This compaction method provided uniform compacted lifts while using the same weight of soil for each lift. Figure 2.13 depicts pictures of the molds used to prepare soil specimens and pictures of specimen preparation procedure. For each soil type, compacted soil specimens were prepared at the maximum dry unit weight and optimum moisture content. In order to ensure the repeatability of test results, the repeated load triaxial test was performed on two specimens of each soil at the specified unit weight and moisture content. After a soil specimen was prepared under a specified unit weight and moisture content, it was placed in a membrane and mounted on the base of the triaxial cell. Porous stones were placed at the top and bottom of the specimen. The triaxial cell was sealed and mounted on the base of the dynamic materials test system frame. All connections were tightened and checked. Cell pressure, LVTD’s, load cell, and all other required setup were connected and checked. Figure 2.14 shows pictures of specimen preparation for the repeated load triaxial test. 2.4.4 Subgrade Specimen Testing The software that controls the materials dynamic test system was programmed to apply repeated loads according to the test sequences specified by AASHTO T 307 based on the material type. Once the triaxial cell is mounted on the system, the air pressure panel is connected to the cell. The required confining pressure (5c) is then applied. Figure 2.15 shows pictures of the software used to control and run the repeated load triaxial test. The soil specimen was conditioned by applying 1,000 repetitions of a specified deviator stress (5d) at a certain confining pressure. Conditioning eliminates the effects of specimen disturbance from compaction and specimen preparation procedures and minimizes the imperfect contacts between end platens and the specimen. The specimen is then subjected to different deviator stress sequences according to AASHTO T 307. The stress sequence is selected to cover the expected in-service range that a pavement or subgrade material experiences because of traffic loading. It is very difficult to apply the exact specified loading on a soil specimen in a repeated load configuration. This is in part due to the controls of the equipment and soil specimen stiffness. However, the closed-loop servo hydraulic system is one of the most accurate systems used to apply repeated loads. In this system, the applied loads and measured displacements are continuously monitored. This is to make sure that the applied loads are within an acceptable tolerance. If there are out of range applied loads or measured displacements, then the system will display warning messages and can be programmed to terminate the test.

Materials Characterization and Analysis of the Marquette Interchange HMA Perpetual Pavement | 2008
Midwest Regional University Transportation Center (MRUTC) 25
(a) Molds of different sizes
(b) Filling mold with one soil layer
(c) Applying static force to compact soil specimen
Figure 2.13 Soil Specimen Preparation
Materials Characterization and Analysis of the Marquette Interchange HMA Perpetual Pavement | 2008
Midwest Regional University Transportation Center (MRUTC) 26
(a) Compacted subgrade soil specimen
(b) Seating a specimen on the cell base and placing the top cap
(c) Mounting the cell on the loading frame
Figure 2.14 Soil Specimen Preparation for Repeated Load Triaxial Testing

Materials Characterization and Analysis of the Marquette Interchange HMA Perpetual Pavement | 2008
Midwest Regional University Transportation Center (MRUTC) 27
Figure 2.15 Computer Program Used for Triaxial Testing
Materials Characterization and Analysis of the Marquette Interchange HMA Perpetual Pavement | 2008
Midwest Regional University Transportation Center (MRUTC) 28
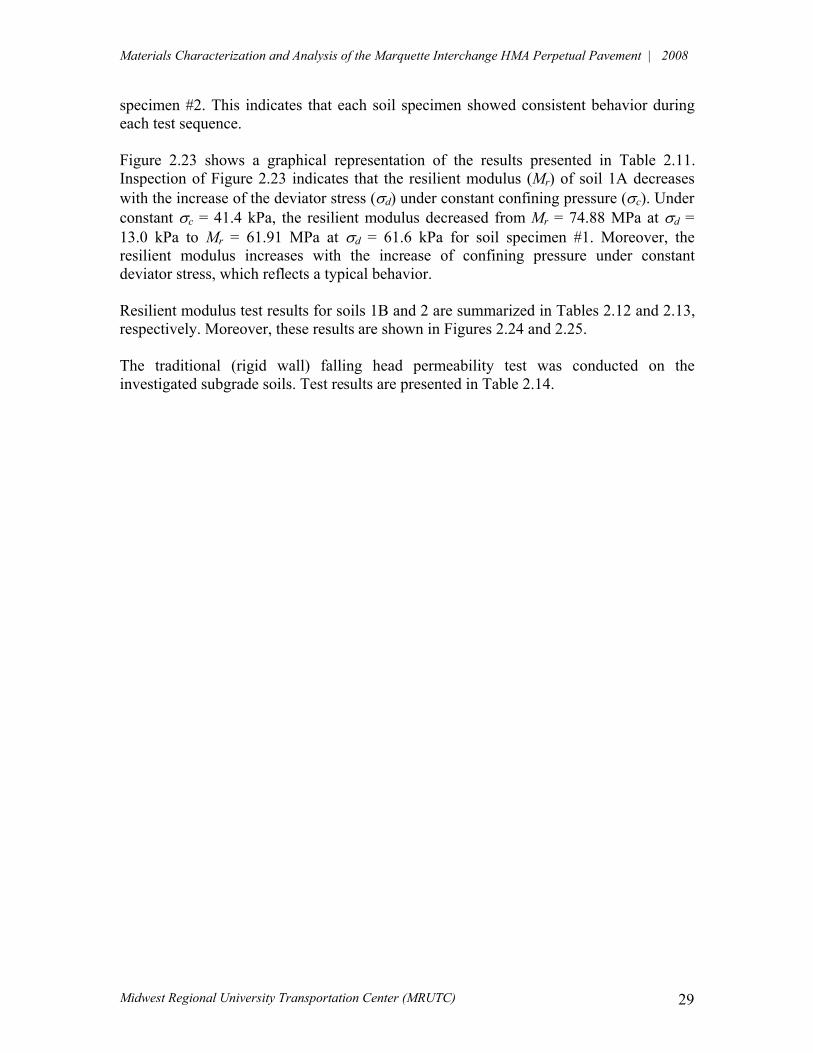
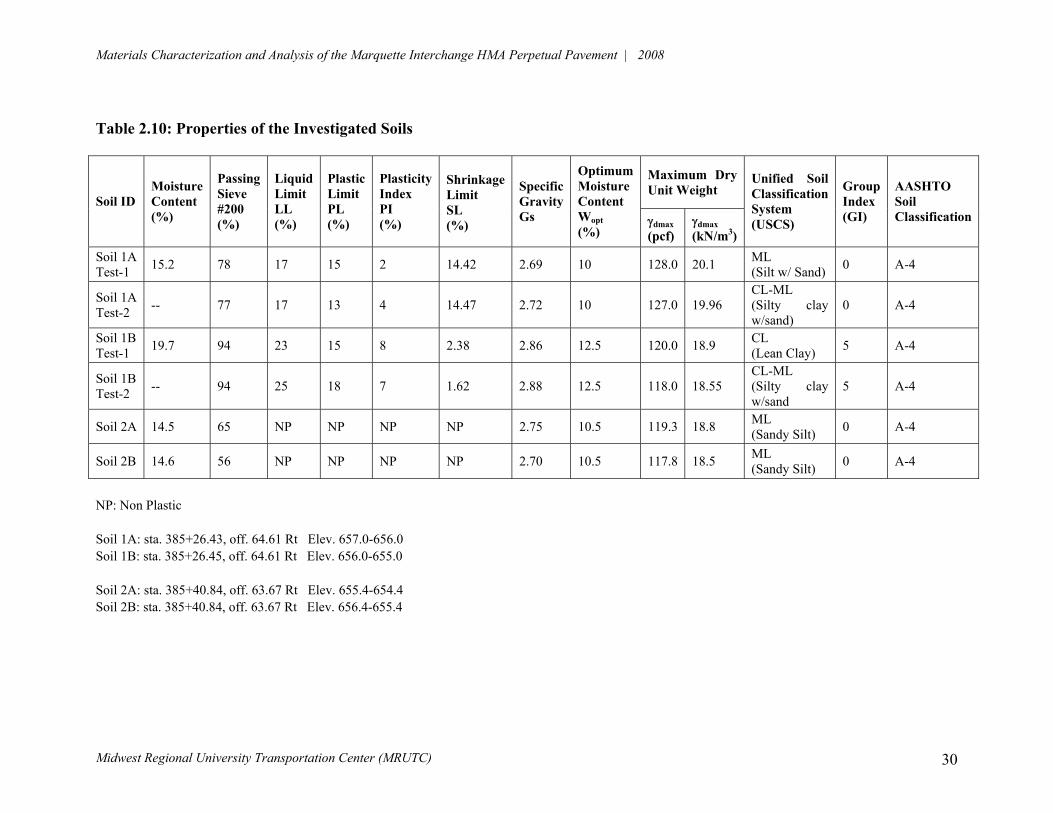
2.4.5 Results of Testing on Subgrade Soils The results of laboratory tests conducted to evaluate soil properties are presented in Table 2.10. The data on soil properties consists of particle size analysis (sieve and hydrometer); consistency limits (LL, PL, SL, and PI); specific gravity; maximum dry unit weight and optimum moisture content; soil classification using the Unified Soil Classification System (USCS); and soil classification using the AASHTO method including group index (GI). The following is a brief description of selected soils. Soil (1A)
Test results indicated that the soil consists of 78% of fine materials (passing sieve #200) with a plasticity index PI = 2, which was classified as silt with sand (ML) according to the USCS and silty soil (A-4) according to the AASHTO soil classification with a group index GI = 0. Figure 2.16 shows the particle size distribution curve of soil 1A. The results of the Standard Proctor test on soil 1A are depicted in Figure 2.17. Test results showed that the maximum dry unit weight 3dmax =20.1 kN/m3 and the optimum moisture content wopt. = 10%.
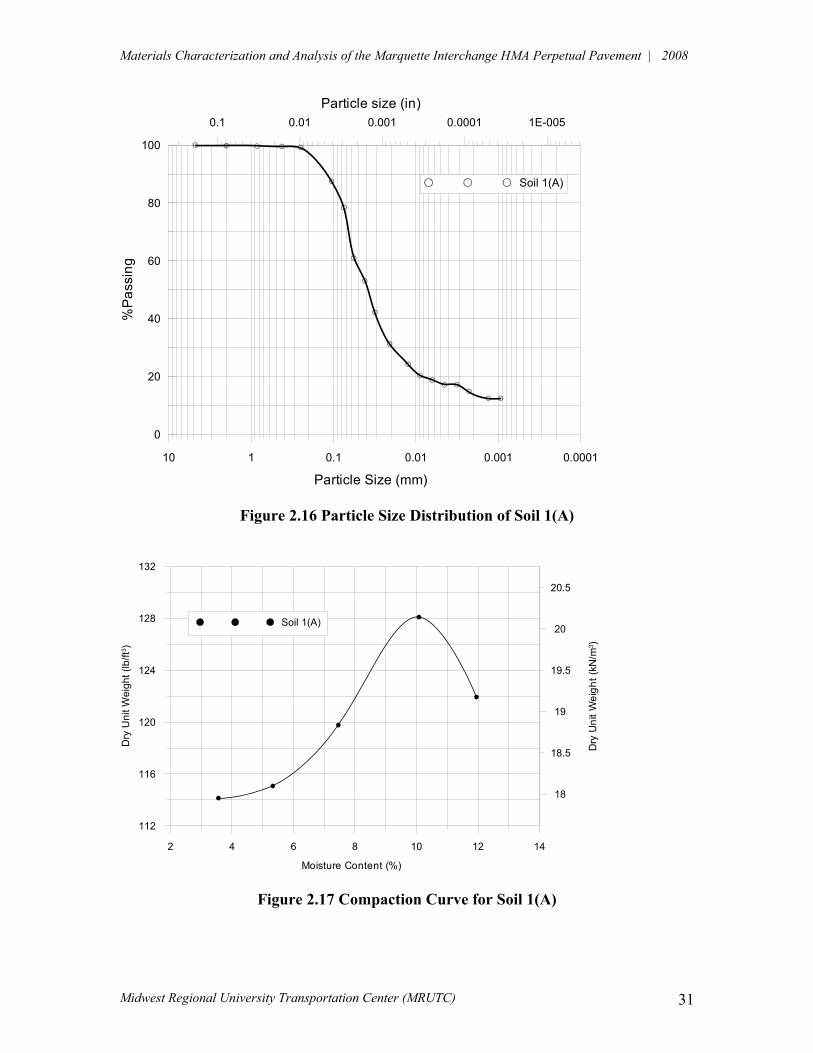
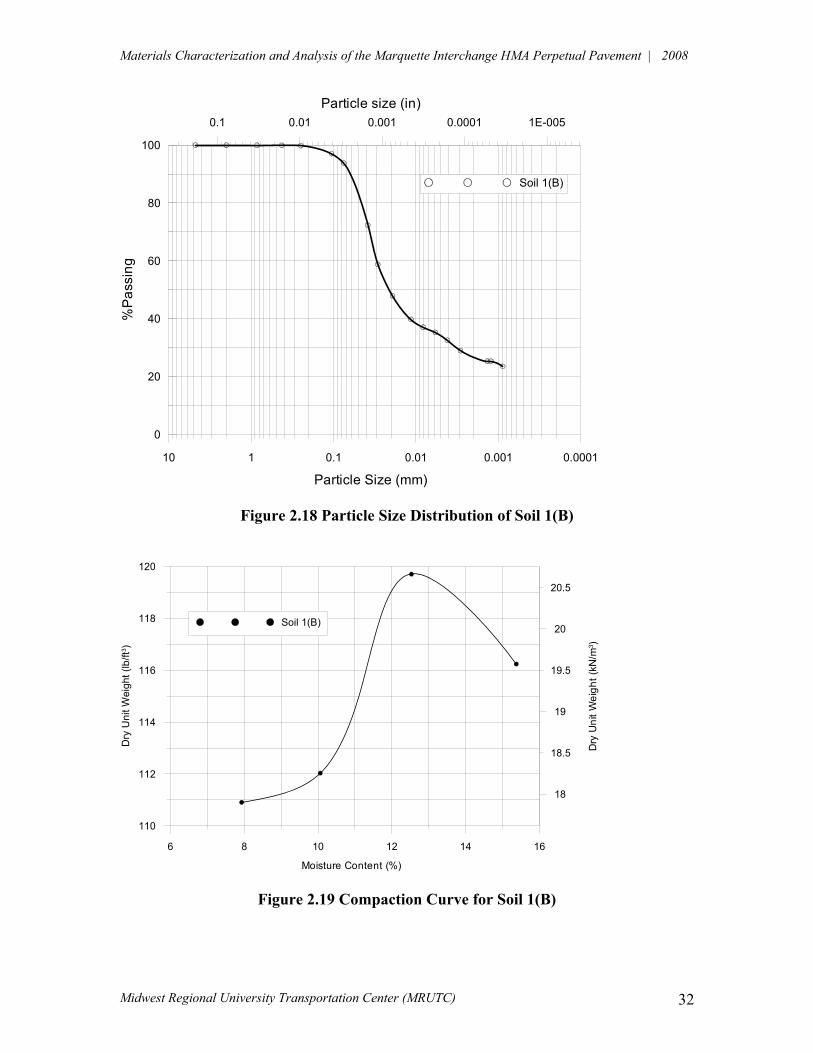
Soil (1B)
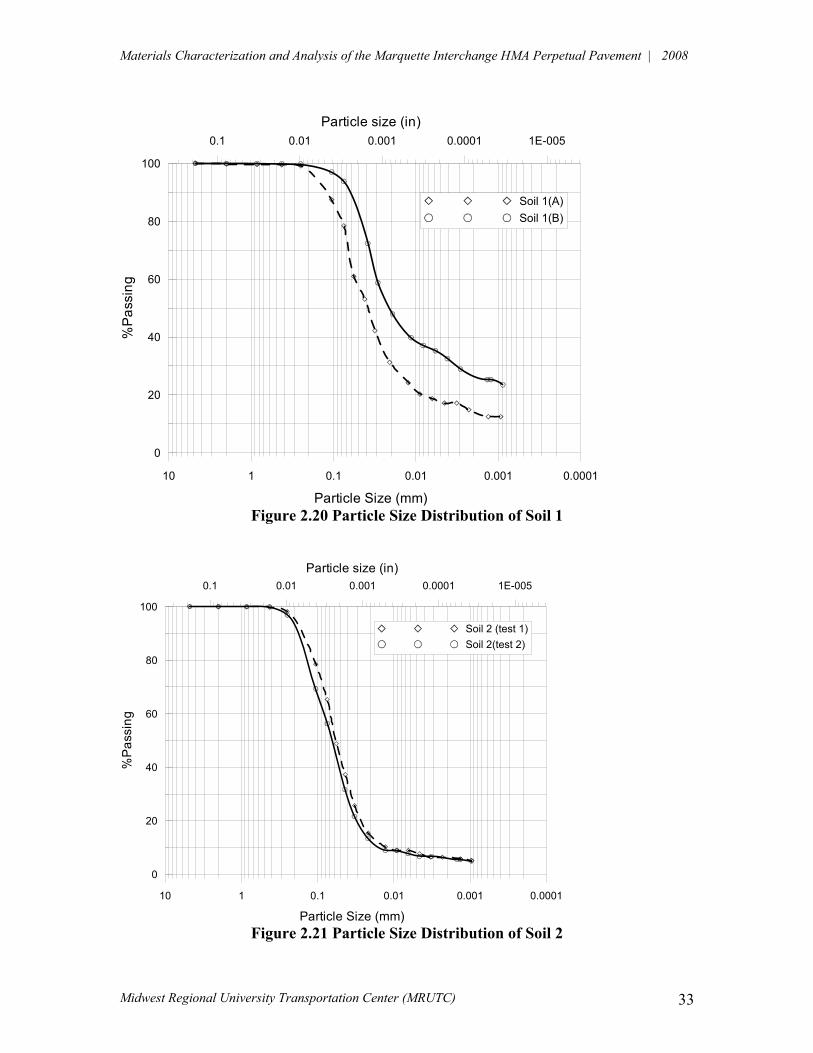
Figure 2.18 depicts the particle size distribution curve for soil 1B. This soil consists of 94% passing sieve #200 with plasticity index PI = 8, which was classified as lean clay (CL) according to USCS and silty soil (A-4) according to the AASHTO soil classification with GI=5. Standard Proctor test results showed that the average maximum dry unit weight 3dmax = 18.9 kN/m3 and the corresponding average optimum moisture content wopt = 12.5%, as shown in Figure 2.19. Figure 2.20 shows a comparison of particle distribution curves for soils 1A and 1B. Soil (2)
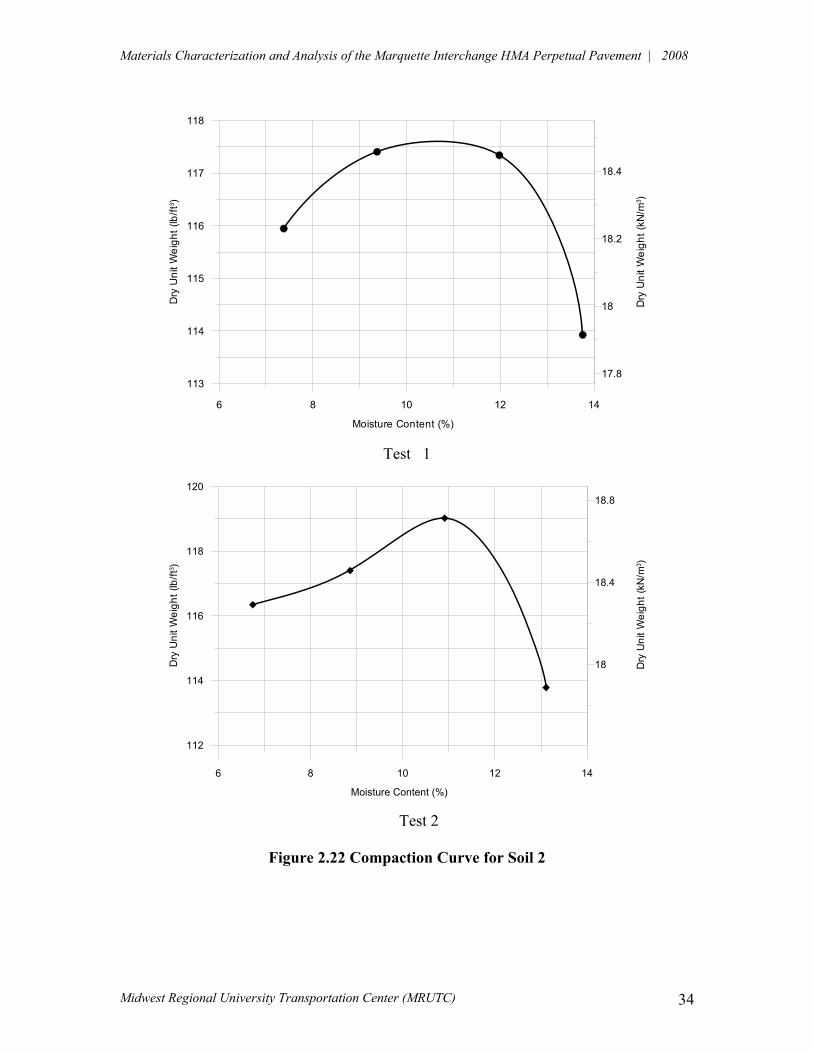
The results of particle size analysis of soil 2 are shown in Figure 2.21. Both tests are showing consistent results. Soil consists of about 60% passing sieve #200 with non plastic fines. The soil was classified as sandy silt (ML) according to USCS and silty soil (A-4) according to the AASHTO soil classification with GI=0. Standard Proctor test results showed that the average maximum dry unit weight 3dmax = 18.6 kN/m3 and the corresponding average optimum moisture content wopt. = 10.5%, as shown in Figure 2.22. The results of the repeated load triaxial test conducted on the investigated soils are shown in Table 2.11. The test was conducted on soil specimens 1 and 2 compacted at 3dmax and optimum moisture content wopt.. Table 2.11 presents the mean resilient modulus values, standard deviation, and coefficient of variation for the 15 test sequences conducted according to AASHTO T 307. The mean resilient modulus values, standard deviation and coefficient of variation summarized in Table 2.11 are obtained from the last five load cycles of each test sequence. The coefficient of variation for the test results presented in Table 2.11 ranges between 0.30 and 9.87% for specimen #1 and from 0.16 to 8.56% for
Materials Characterization and Analysis of the Marquette Interchange HMA Perpetual Pavement | 2008
Midwest Regional University Transportation Center (MRUTC) 29
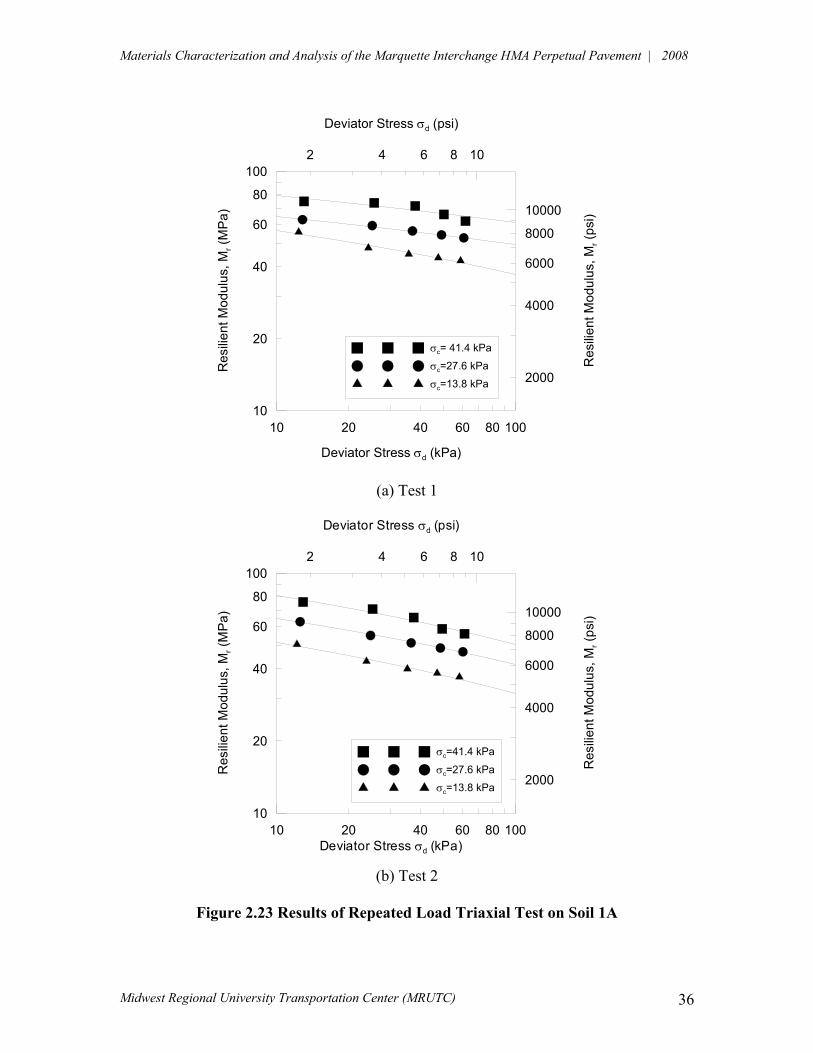
specimen #2. This indicates that each soil specimen showed consistent behavior during each test sequence. Figure 2.23 shows a graphical representation of the results presented in Table 2.11. Inspection of Figure 2.23 indicates that the resilient modulus (Mr) of soil 1A decreases with the increase of the deviator stress (5d) under constant confining pressure (5c). Under constant 5c = 41.4 kPa, the resilient modulus decreased from Mr = 74.88 MPa at 5d = 13.0 kPa to Mr = 61.91 MPa at 5d = 61.6 kPa for soil specimen #1. Moreover, the resilient modulus increases with the increase of confining pressure under constant deviator stress, which reflects a typical behavior. Resilient modulus test results for soils 1B and 2 are summarized in Tables 2.12 and 2.13, respectively. Moreover, these results are shown in Figures 2.24 and 2.25. The traditional (rigid wall) falling head permeability test was conducted on the investigated subgrade soils. Test results are presented in Table 2.14.
Materials Characterization and Analysis of the Marquette Interchange HMA Perpetual Pavement | 2008
Midwest Regional University Transportation Center (MRUTC) 30
Table 2.10: Properties of the Investigated Soils
Maximum Dry Unit Weight
Soil ID Moisture Content (%)
Passing Sieve #200 (%)
Liquid Limit LL (%)
Plastic Limit PL (%)
Plasticity Index PI (%)
ShrinkageLimit SL (%)
Specific Gravity Gs
Optimum Moisture Content Wopt (%)
3dmax (pcf)
3dmax (kN/m3)
Unified Soil Classification System (USCS)
Group Index (GI)
AASHTO Soil Classification
Soil 1A Test-1 15.2 78 17 15 2 14.42 2.69 10 128.0 20.1 ML
(Silt w/ Sand) 0 A-4
Soil 1A Test-2 -- 77 17 13 4 14.47 2.72 10 127.0 19.96
CL-ML (Silty clay w/sand)
0 A-4
Soil 1B Test-1 19.7 94 23 15 8 2.38 2.86 12.5 120.0 18.9 CL
(Lean Clay) 5 A-4
Soil 1B Test-2 -- 94 25 18 7 1.62 2.88 12.5 118.0 18.55
CL-ML (Silty clay w/sand
5 A-4
Soil 2A 14.5 65 NP NP NP NP 2.75 10.5 119.3 18.8 ML (Sandy Silt) 0 A-4
Soil 2B 14.6 56 NP NP NP NP 2.70 10.5 117.8 18.5 ML (Sandy Silt) 0 A-4
NP: Non Plastic Soil 1A: sta. 385+26.43, off. 64.61 Rt Elev. 657.0-656.0 Soil 1B: sta. 385+26.45, off. 64.61 Rt Elev. 656.0-655.0 Soil 2A: sta. 385+40.84, off. 63.67 Rt Elev. 655.4-654.4 Soil 2B: sta. 385+40.84, off. 63.67 Rt Elev. 656.4-655.4
Materials Characterization and Analysis of the Marquette Interchange HMA Perpetual Pavement | 2008
Midwest Regional University Transportation Center (MRUTC) 31
10 1 0.1 0.01 0.001 0.0001
Particle Size (mm)
0
20
40
60
80
100%
Pas
sing
0.1 0.01 0.001 0.0001 1E-005Particle size (in)
Soil 1(A)
Figure 2.16 Particle Size Distribution of Soil 1(A)
2 4 6 8 10 12 14
Moisture Content (%)
112
116
120
124
128
132
Dry
Uni
t Wei
ght (
lb/ft
3 )
Soil 1(A)
18
19
20
18.5
19.5
20.5D
ry U
nit W
eigh
t (kN
/m3 )
Figure 2.17 Compaction Curve for Soil 1(A)
Materials Characterization and Analysis of the Marquette Interchange HMA Perpetual Pavement | 2008
Midwest Regional University Transportation Center (MRUTC) 32
10 1 0.1 0.01 0.001 0.0001
Particle Size (mm)
0
20
40
60
80
100%
Pas
sing
0.1 0.01 0.001 0.0001 1E-005Particle size (in)
Soil 1(B)
Figure 2.18 Particle Size Distribution of Soil 1(B)
6 8 10 12 14 16
Moisture Content (%)
110
112
114
116
118
120
Dry
Uni
t Wei
ght (
lb/ft
3 )
Soil 1(B)
18
19
20
18.5
19.5
20.5D
ry U
nit W
eigh
t (kN
/m3 )
Figure 2.19 Compaction Curve for Soil 1(B)
Materials Characterization and Analysis of the Marquette Interchange HMA Perpetual Pavement | 2008
Midwest Regional University Transportation Center (MRUTC) 33
10 1 0.1 0.01 0.001 0.0001
Particle Size (mm)
0
20
40
60
80
100
%P
assi
ng0.1 0.01 0.001 0.0001 1E-005
Particle size (in)
Soil 1(A)Soil 1(B)
Figure 2.20 Particle Size Distribution of Soil 1
10 1 0.1 0.01 0.001 0.0001
Particle Size (mm)
0
20
40
60
80
100
%P
assi
ng
0.1 0.01 0.001 0.0001 1E-005Particle size (in)
Soil 2 (test 1)Soil 2(test 2)
Figure 2.21 Particle Size Distribution of Soil 2
Materials Characterization and Analysis of the Marquette Interchange HMA Perpetual Pavement | 2008
Midwest Regional University Transportation Center (MRUTC) 34
Test 1
Test 2
Figure 2.22 Compaction Curve for Soil 2
6 8 10 12 14
Moisture Content (%)
113
114
115
116
117
118
Dry
Uni
t Wei
ght (
lb/ft
3 )
17.8
18
18.2
18.4
Dry
Uni
t Wei
ght (
kN/m
3 )
6 8 10 12 14
Moisture Content (%)
112
114
116
118
120
Dry
Uni
t Wei
ght (
lb/ft
3 )
18
18.4
18.8
Dry
Uni
t Wei
ght (
kN/m
3 )

Materials Characterization and Analysis of the Marquette Interchange HMA Perpetual Pavement | 2008
Midwest Regional University Transportation Center (MRUTC) 35
Table 2.11 Results of the Repeated Load Triaxial Test on Subgrade Soil 1A
Test #1 Test #2 Test
Sequence 5c
(kPa) 5d (kPa)
Mr (MPa)
Mr Standard Deviation
Mr COV(%)
5d (kPa)
Mr (MPa)
Mr Standard Deviation
Mr COV (%)
1 13.0 74.88 0.61 0.82 12.9 73.07 6.25 8.56 2 25.6 73.79 0.76 1.02 25.2 70.89 0.54 0.77 3 38.0 71.69 0.48 0.66 37.5 65.40 0.25 0.39 4 50.1 66.01 0.26 0.39 49.3 58.65 0.15 0.25 5
41.4
61.6 61.91 0.20 0.32 61.2 55.93 0.09 0.16 6 12.8 62.78 6.20 9.87 12.5 62.79 0.48 0.76 7 25.1 59.29 0.51 0.86 24.7 55.03 0.46 0.83 8 37.0 56.33 0.27 0.47 36.6 51.24 0.16 0.32 9 49.0 54.24 0.18 0.33 48.5 48.79 0.16 0.34 10
27.6
60.7 52.68 0.16 0.30 60.2 47.05 0.09 0.19 11 12.4 55.77 0.69 1.23 12.2 50.55 0.37 0.74 12 24.2 74.85 0.58 1.21 33.8 42.94 0.27 0.62 13 35.7 45.05 0.29 0.65 35.3 39.97 0.13 0.34 14 47.5 43.48 0.18 0.42 47.0 38.34 0.09 0.23 15
13.8
58.9 42.29 0.16 0.38 58.2 36.96 0.09 0.25
Materials Characterization and Analysis of the Marquette Interchange HMA Perpetual Pavement | 2008
Midwest Regional University Transportation Center (MRUTC) 36
10 10020 40 60 80
Deviator Stress 5d (kPa)
10
100
20
40
60
80
Res
ilient
Mod
ulus
, Mr (
MP
a)
5c= 41.4 kPa
5c=27.6 kPa
5c=13.8 kPa
10000
8000
6000
4000
2000
Res
ilient
Mod
ulus
, Mr (
psi)
108642
Deviator Stress 5d (psi)
(a) Test 1
(b) Test 2
Figure 2.23 Results of Repeated Load Triaxial Test on Soil 1A
10 10020 40 60 80Deviator Stress 5d (kPa)
10
100
20
40
60
80
Res
ilient
Mod
ulus
, Mr (
MPa
)
5c=41.4 kPa
5c=27.6 kPa
5c=13.8 kPa
10000
8000
6000
4000
2000
Res
ilient
Mod
ulus
, Mr (
psi)
108642
Deviator Stress 5d (psi)
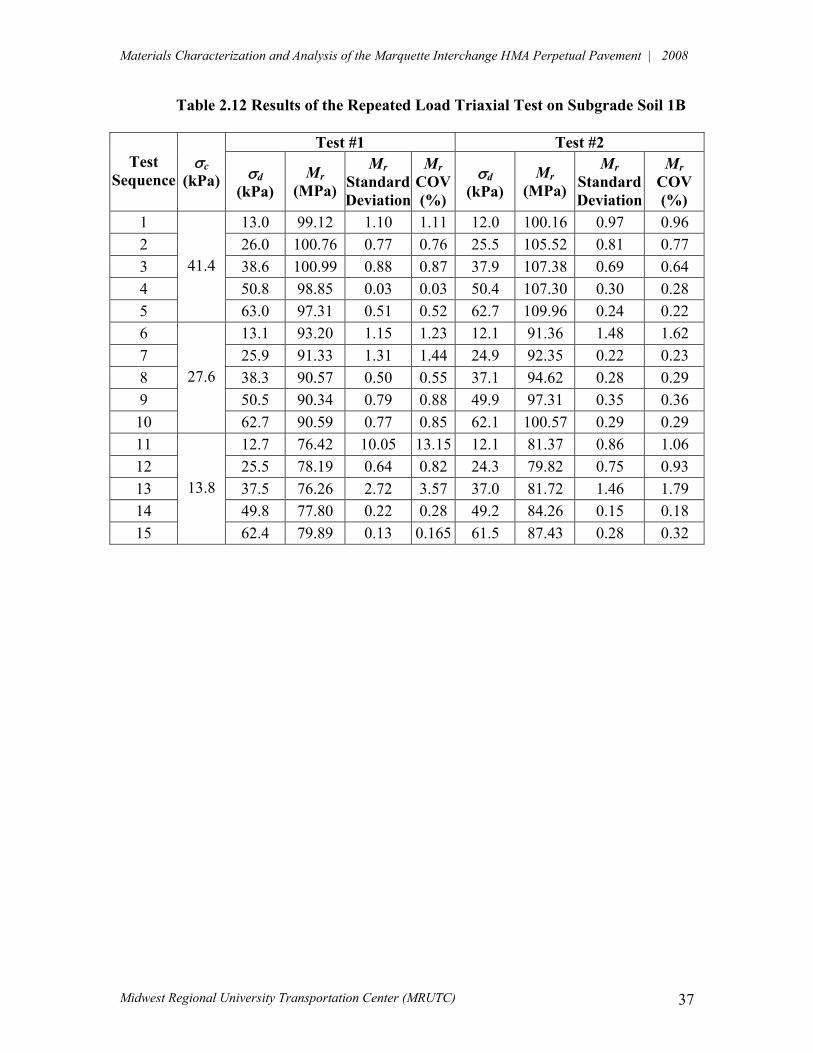
Materials Characterization and Analysis of the Marquette Interchange HMA Perpetual Pavement | 2008
Midwest Regional University Transportation Center (MRUTC) 37
Table 2.12 Results of the Repeated Load Triaxial Test on Subgrade Soil 1B
Test #1 Test #2 Test
Sequence 5c
(kPa) 5d (kPa)
Mr (MPa)
Mr Standard Deviation
Mr COV(%)
5d (kPa)
Mr (MPa)
Mr Standard Deviation
Mr COV (%)
1 13.0 99.12 1.10 1.11 12.0 100.16 0.97 0.96 2 26.0 100.76 0.77 0.76 25.5 105.52 0.81 0.77 3 38.6 100.99 0.88 0.87 37.9 107.38 0.69 0.64 4 50.8 98.85 0.03 0.03 50.4 107.30 0.30 0.28 5
41.4
63.0 97.31 0.51 0.52 62.7 109.96 0.24 0.22 6 13.1 93.20 1.15 1.23 12.1 91.36 1.48 1.62 7 25.9 91.33 1.31 1.44 24.9 92.35 0.22 0.23 8 38.3 90.57 0.50 0.55 37.1 94.62 0.28 0.29 9 50.5 90.34 0.79 0.88 49.9 97.31 0.35 0.36 10
27.6
62.7 90.59 0.77 0.85 62.1 100.57 0.29 0.29 11 12.7 76.42 10.05 13.15 12.1 81.37 0.86 1.06 12 25.5 78.19 0.64 0.82 24.3 79.82 0.75 0.93 13 37.5 76.26 2.72 3.57 37.0 81.72 1.46 1.79 14 49.8 77.80 0.22 0.28 49.2 84.26 0.15 0.18 15
13.8
62.4 79.89 0.13 0.165 61.5 87.43 0.28 0.32

Materials Characterization and Analysis of the Marquette Interchange HMA Perpetual Pavement | 2008
Midwest Regional University Transportation Center (MRUTC) 38
Table 2.13 Results of the Repeated Load Triaxial Test on Subgrade Soil 2
Test #1 Test #2 Test
Sequence 5c
(kPa) 5d (kPa)
Mr (MPa)
Mr Standard Deviation
Mr COV(%)
5d (kPa)
Mr (MPa)
Mr Standard Deviation
Mr COV (%)
1 12.6 63.32 1.18 1.87 12.8 67.33 1.64 2.44 2 25.4 60.32 2.43 4.02 25.6 62.66 0.27 0.44 3 37.9 58.58 0.13 0.23 38.1 59.86 0.37 0.62 4 50.3 56.92 0.19 0.34 50.3 57.47 0.20 0.35 5
41.4
62.8 58.85 0.35 0.68 62.7 58.17 0.17 0.29 6 12.3 51.89 0.35 0.68 12.3 52.70 0.09 0.16 7 24.8 46.43 0.28 0.61 25.4 46.14 0.35 0.77 8 37.2 45.68 0.12 0.26 38.0 45.10 0.11 0.25 9 49.7 46.40 0.20 0.44 50.7 45.88 0.20 0.44 10
27.6
62.1 47.82 0.05 0.09 63.0 46.82 0.06 0.14 11 12.5 37.36 2.85 7.64 13.1 37.95 0.38 1.00 12 24.9 33.55 0.15 0.45 25.5 32.79 0.19 0.59 13 37.8 34.37 0.15 0.43 38.3 33.36 0.17 0.50 14 49.9 34.85 0.06 0.18 50.4 33.77 0.15 0.43 15
13.8
62.6 35.89 0.12 0.35 63.0 35.00 0.09 0.26
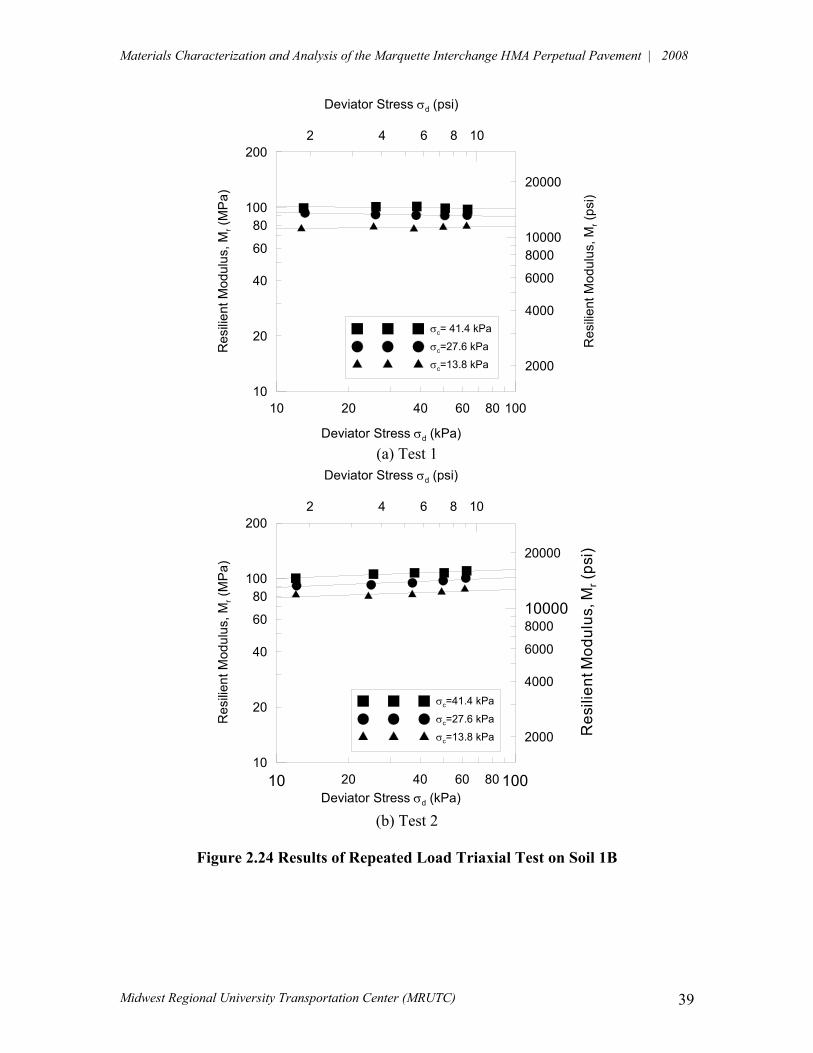
Materials Characterization and Analysis of the Marquette Interchange HMA Perpetual Pavement | 2008
Midwest Regional University Transportation Center (MRUTC) 39
10 10020 40 60 80
Deviator Stress 5d (kPa)
10
100
20
40
60
80
200
Res
ilient
Mod
ulus
, Mr (
MP
a)
5c= 41.4 kPa
5c=27.6 kPa
5c=13.8 kPa
10000
20000
8000
6000
4000
2000
Res
ilient
Mod
ulus
, Mr (
psi)
108642
Deviator Stress 5d (psi)
10 10020 40 60 80Deviator Stress 5d (kPa)
10
100
20
40
60
80
200
Res
ilient
Mod
ulus
, Mr (
MP
a)
5c=41.4 kPa
5c=27.6 kPa
5c=13.8 kPa
10000
20000
8000
6000
4000
2000 Res
ilien
t Mod
ulus
, Mr (
psi)
108642
Deviator Stress 5d (psi)
(a) Test 1
(b) Test 2
Figure 2.24 Results of Repeated Load Triaxial Test on Soil 1B
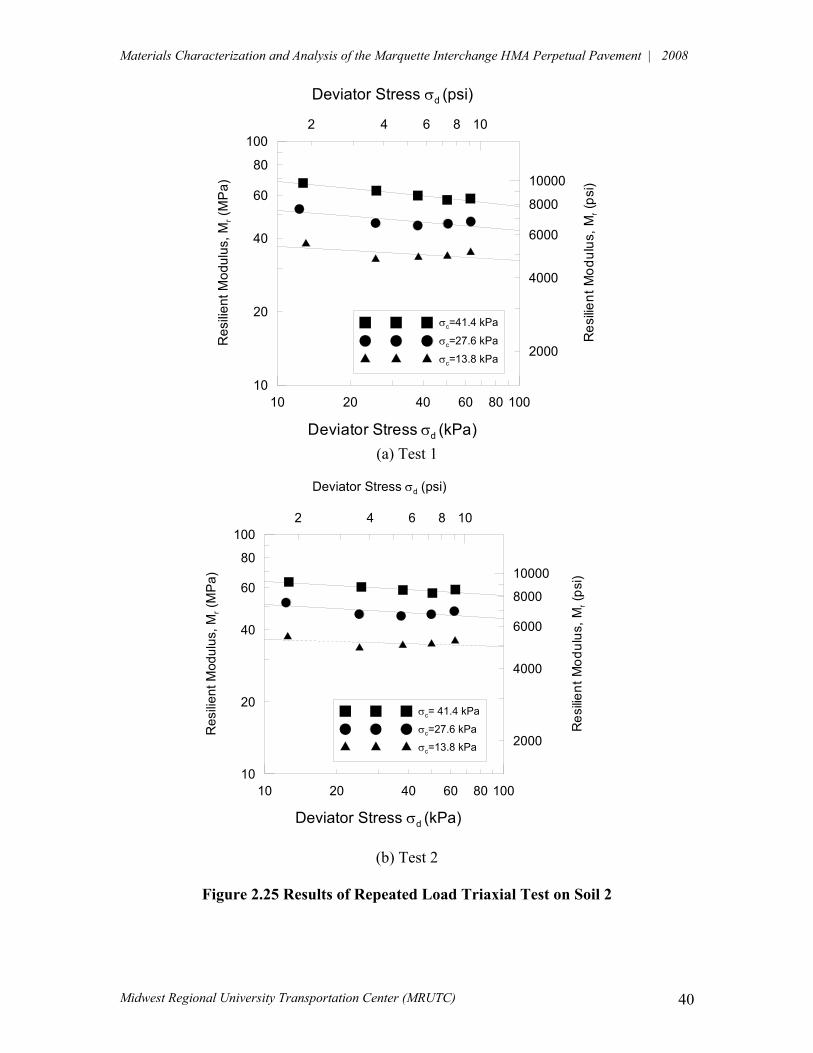
Materials Characterization and Analysis of the Marquette Interchange HMA Perpetual Pavement | 2008
Midwest Regional University Transportation Center (MRUTC) 40
10 10020 40 60 80
Deviator Stress 5d (kPa)
10
100
20
40
60
80
Res
ilient
Mod
ulus
, Mr (
MP
a)
5c=41.4 kPa
5c=27.6 kPa
5c=13.8 kPa
10000
8000
6000
4000
2000
Res
ilient
Mod
ulus
, Mr (
psi)
108642
Deviator Stress 5d (psi)
10 10020 40 60 80
Deviator Stress 5d (kPa)
10
100
20
40
60
80
Res
ilient
Mod
ulus
, Mr (
MP
a)
5c= 41.4 kPa
5c=27.6 kPa
5c=13.8 kPa
10000
8000
6000
4000
2000
Res
ilient
Mod
ulus
, Mr (
psi)
108642
Deviator Stress 5d (psi)
(a) Test 1
(b) Test 2
Figure 2.25 Results of Repeated Load Triaxial Test on Soil 2
Materials Characterization and Analysis of the Marquette Interchange HMA Perpetual Pavement | 2008
Midwest Regional University Transportation Center (MRUTC) 41
Table 2.14 Results of the Falling Head Permeability Tests on Subgrade Soils
Subgrade Soil Coefficient of Permeability k (cm/sec)
Soil 1A – Test 1 5.71×10⁻⁶ Soil 1B – Test 1 1.409×10⁻⁶ Soil 2 – Test 1 1.755×10⁻⁵ Soil 2 – Test 2 1.750×10⁻⁵
2.4.6 Laboratory Testing of Aggregates Collected aggregates were subjected to standard laboratory tests to determine their physical properties, permeability, and compaction characteristics. Aggregate testing consisted of the following: moisture content, grain size distribution, specific gravity (Gs), absorption, and permeability. Aggregates were also subjected to compaction test to determine the optimum moisture content (wopt.) and maximum dry unit weight (3dmax). Repeated load triaxial test was conducted, to determine the resilient modulus of the investigated aggregates, following AASHTO T 307: Standard Method of Test for Determining the Resilient Modulus of Soils and Aggregate Materials. The test was conducted on compacted specimens at optimum moisture content (wopt.) and maximum dry unit weight (3dmax). It should be noted that several test trials were attempted on aggregate specimens and difficulties were encountered during testing, especially with the open graded aggregates. It was difficult to keep the open grade aggregate standing inside the triaxial chamber under very low confining pressure. Therefore three plastic straps were used around the membrane to provide support while minimizing confinement on the specimen. Figure 2.26 depicts pictures of aggregate samples preparation and testing. 2.4.7 Results of Testing Program on Aggregates The results of laboratory tests conducted to evaluate aggregate properties are presented in Table 2.15. The data on aggregate properties consists of moisture content; particle size analysis; specific gravity; absorption; maximum dry unit weight and optimum moisture content; and classification using the Unified Soil Classification System (USCS). Figures 2.27 and 2.28 show the particle size distribution curves for the open graded and dense graded aggregates, respectively. The results of the repeated load triaxial test on the dense graded and open graded aggregates are summarized in Tables 2.16 and 2.17, respectively. For dense graded aggregates, the resilient modulus showed increasing trend with the increase of bulk stress (5b). The coefficient of variation for the resilient modulus values shows very low values (0.09 to 0.52) indicating consistent test results. The variation of the resilient modulus
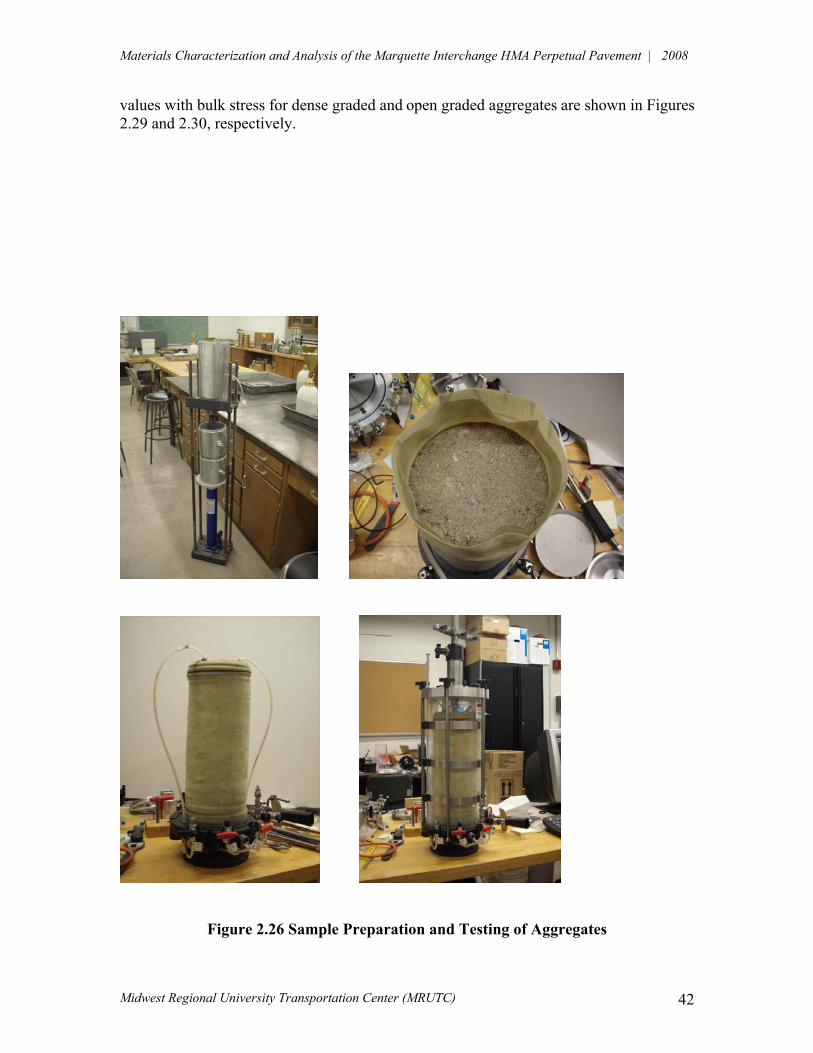
Materials Characterization and Analysis of the Marquette Interchange HMA Perpetual Pavement | 2008
Midwest Regional University Transportation Center (MRUTC) 42
values with bulk stress for dense graded and open graded aggregates are shown in Figures 2.29 and 2.30, respectively.
Figure 2.26 Sample Preparation and Testing of Aggregates
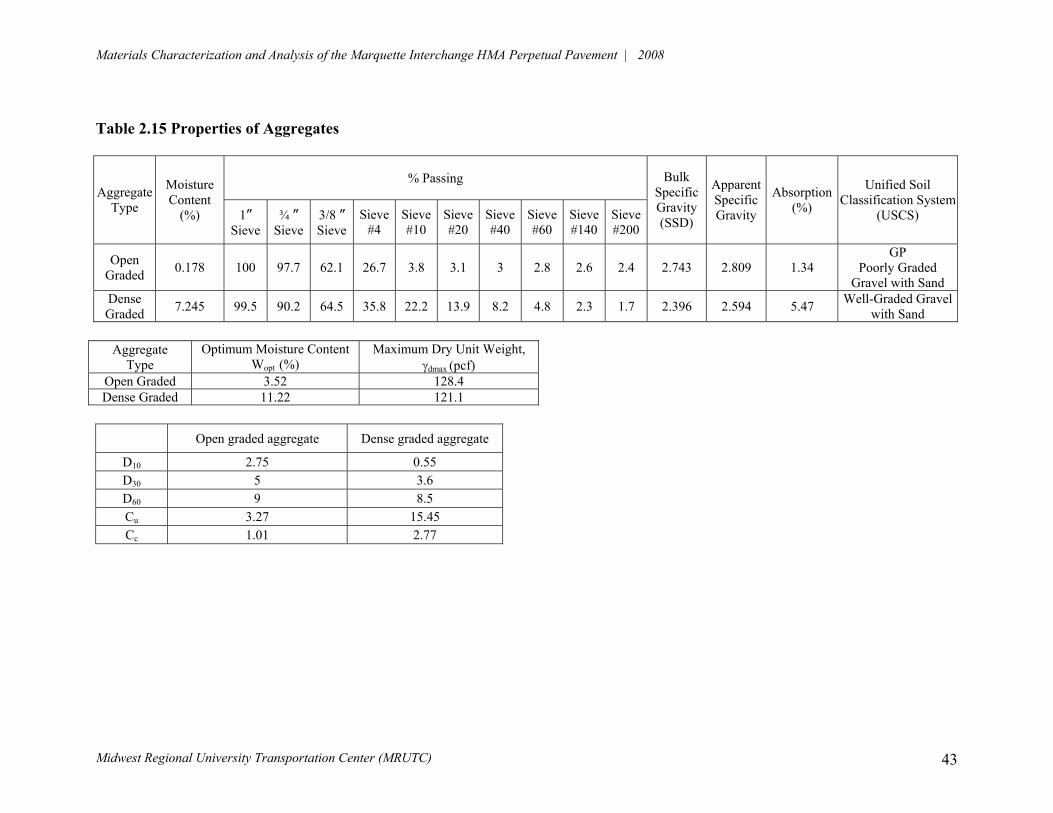
Materials Characterization and Analysis of the Marquette Interchange HMA Perpetual Pavement | 2008
Midwest Regional University Transportation Center (MRUTC) 43
Table 2.15 Properties of Aggregates
% Passing Aggregate
Type
Moisture Content
(%) 1” Sieve
¾ ” Sieve
3/8 ” Sieve
Sieve #4
Sieve #10
Sieve #20
Sieve #40
Sieve #60
Sieve #140
Sieve #200
Bulk Specific Gravity (SSD)
Apparent Specific Gravity
Absorption (%)
Unified Soil Classification System
(USCS)
Open Graded 0.178 100 97.7 62.1 26.7 3.8 3.1 3 2.8 2.6 2.4 2.743 2.809 1.34
GP Poorly Graded
Gravel with Sand Dense Graded 7.245 99.5 90.2 64.5 35.8 22.2 13.9 8.2 4.8 2.3 1.7 2.396 2.594 5.47 Well-Graded Gravel
with Sand
Aggregate Type
Optimum Moisture Content Wopt (%)
Maximum Dry Unit Weight, 3dmax (pcf)
Open Graded 3.52 128.4 Dense Graded 11.22 121.1
Open graded aggregate Dense graded aggregate
D10 2.75 0.55 D30 5 3.6 D60 9 8.5 Cu 3.27 15.45 Cc 1.01 2.77
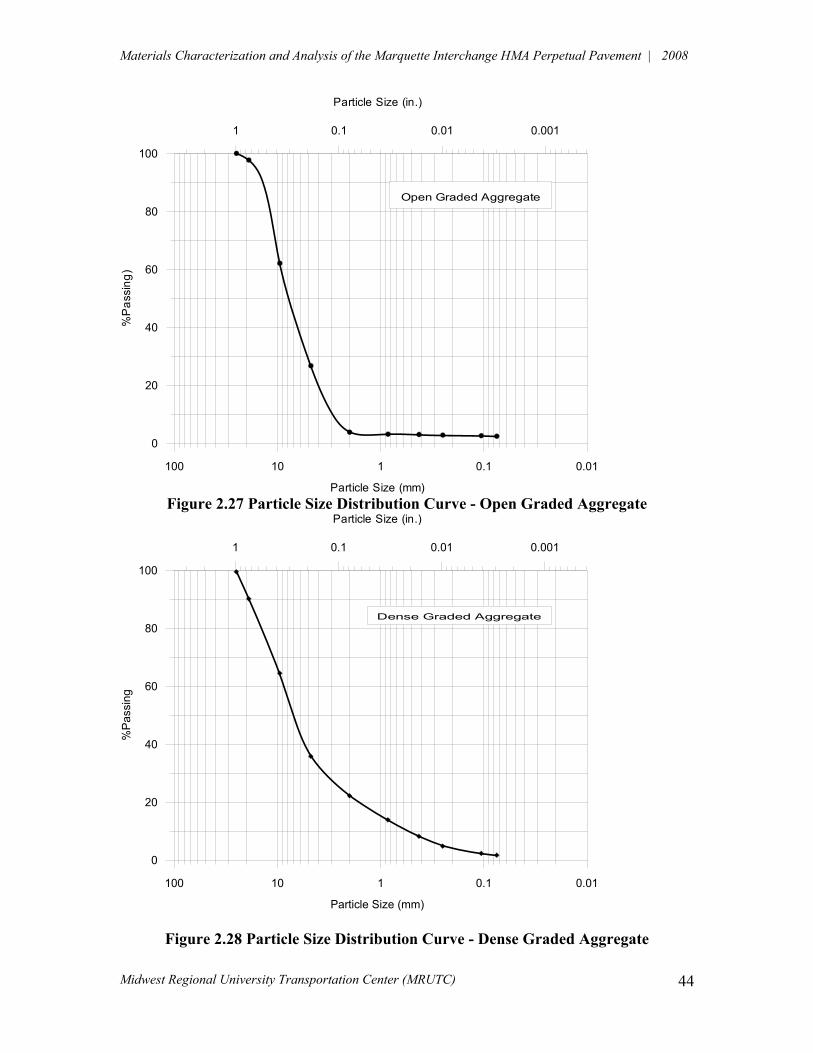
Materials Characterization and Analysis of the Marquette Interchange HMA Perpetual Pavement | 2008
Midwest Regional University Transportation Center (MRUTC)
44
100 10 1 0.1 0.01
Particle Size (mm)
0
20
40
60
80
100
%P
assi
ng)
Open Graded Aggregate
1 0.1 0.01 0.001
Particle Size (in.)
Figure 2.27 Particle Size Distribution Curve - Open Graded Aggregate
100 10 1 0.1 0.01
Particle Size (mm)
0
20
40
60
80
100
%Pa
ssin
g
Dense Graded Aggregate
1 0.1 0.01 0.001
Particle Size (in.)
Figure 2.28 Particle Size Distribution Curve - Dense Graded Aggregate
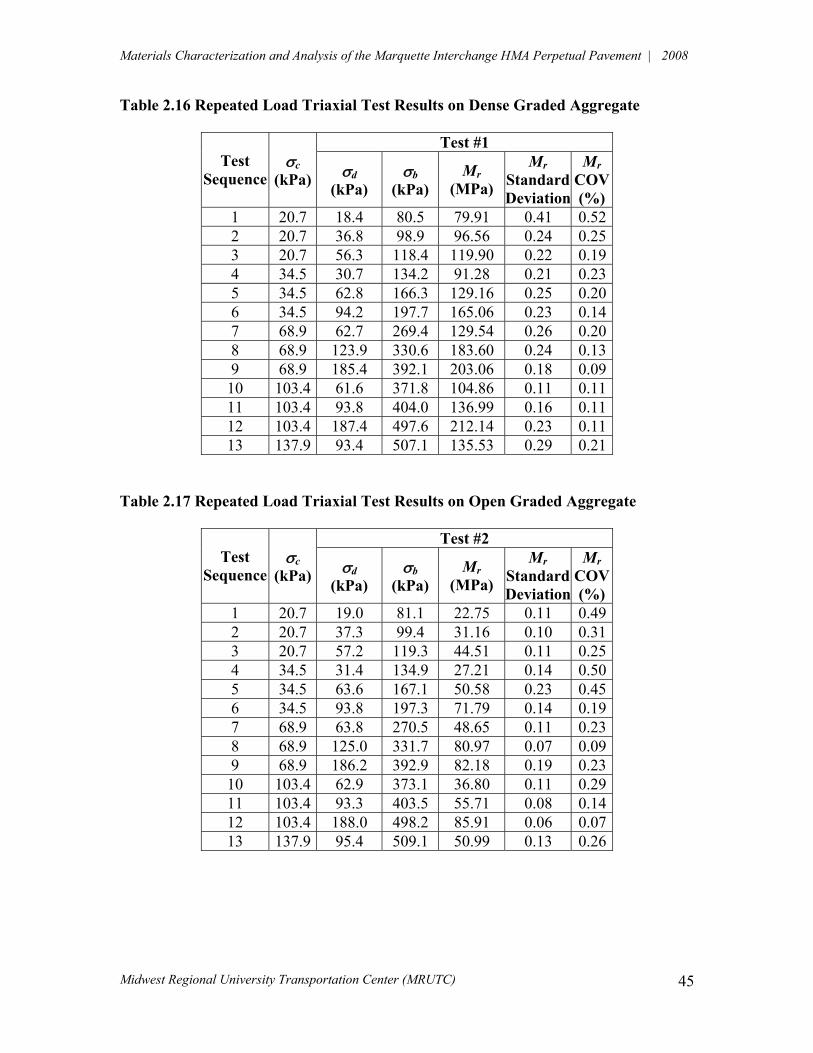
Materials Characterization and Analysis of the Marquette Interchange HMA Perpetual Pavement | 2008
Midwest Regional University Transportation Center (MRUTC)
45
Table 2.16 Repeated Load Triaxial Test Results on Dense Graded Aggregate
Test #1 Test
Sequence 5c
(kPa) 5d (kPa)
5b (kPa)
Mr (MPa)
Mr Standard Deviation
Mr COV (%)
1 20.7 18.4 80.5 79.91 0.41 0.52 2 20.7 36.8 98.9 96.56 0.24 0.25 3 20.7 56.3 118.4 119.90 0.22 0.19 4 34.5 30.7 134.2 91.28 0.21 0.23 5 34.5 62.8 166.3 129.16 0.25 0.20 6 34.5 94.2 197.7 165.06 0.23 0.14 7 68.9 62.7 269.4 129.54 0.26 0.20 8 68.9 123.9 330.6 183.60 0.24 0.13 9 68.9 185.4 392.1 203.06 0.18 0.09 10 103.4 61.6 371.8 104.86 0.11 0.11 11 103.4 93.8 404.0 136.99 0.16 0.11 12 103.4 187.4 497.6 212.14 0.23 0.11 13 137.9 93.4 507.1 135.53 0.29 0.21
Table 2.17 Repeated Load Triaxial Test Results on Open Graded Aggregate
Test #2 Test
Sequence 5c
(kPa) 5d (kPa)
5b (kPa)
Mr (MPa)
Mr Standard Deviation
Mr COV (%)
1 20.7 19.0 81.1 22.75 0.11 0.49 2 20.7 37.3 99.4 31.16 0.10 0.31 3 20.7 57.2 119.3 44.51 0.11 0.25 4 34.5 31.4 134.9 27.21 0.14 0.50 5 34.5 63.6 167.1 50.58 0.23 0.45 6 34.5 93.8 197.3 71.79 0.14 0.19 7 68.9 63.8 270.5 48.65 0.11 0.23 8 68.9 125.0 331.7 80.97 0.07 0.09 9 68.9 186.2 392.9 82.18 0.19 0.23 10 103.4 62.9 373.1 36.80 0.11 0.29 11 103.4 93.3 403.5 55.71 0.08 0.14 12 103.4 188.0 498.2 85.91 0.06 0.07 13 137.9 95.4 509.1 50.99 0.13 0.26
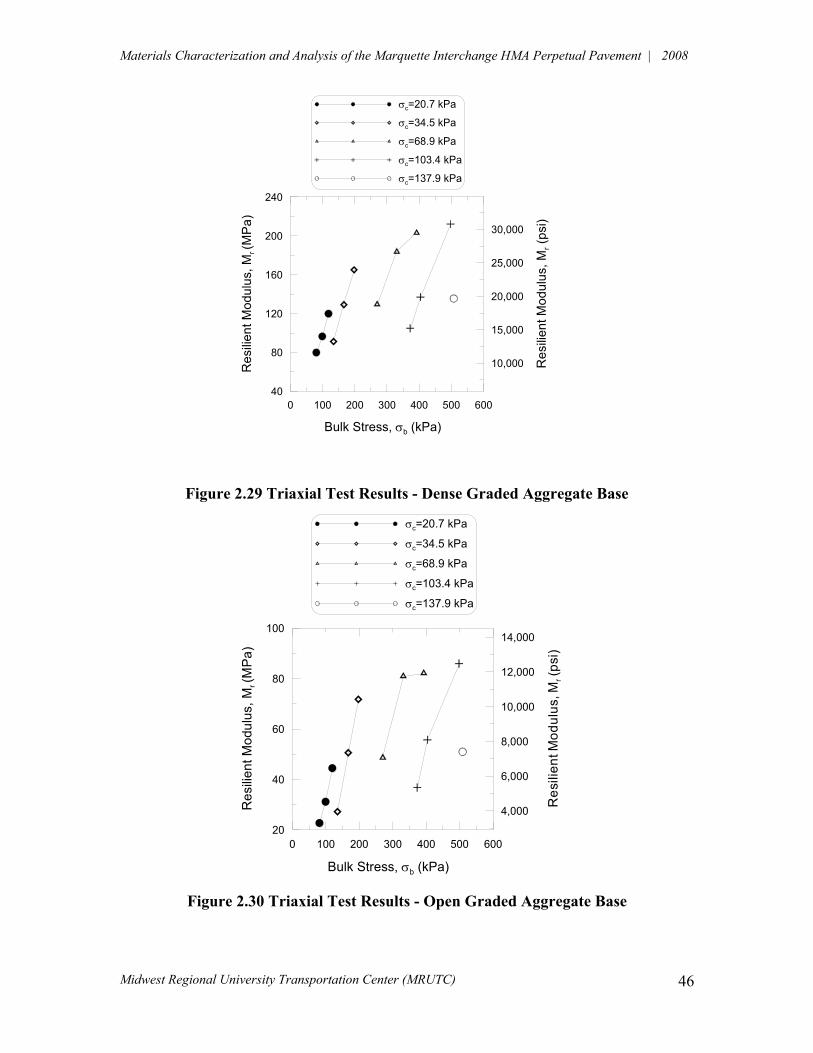
Materials Characterization and Analysis of the Marquette Interchange HMA Perpetual Pavement | 2008
Midwest Regional University Transportation Center (MRUTC)
46
Figure 2.29 Triaxial Test Results - Dense Graded Aggregate Base
Figure 2.30 Triaxial Test Results - Open Graded Aggregate Base
0 100 200 300 400 500 600
Bulk Stress, 5b (kPa)
20
40
60
80
100
Res
ilien
t Mod
ulus
, Mr (
MP
a)
4,000
6,000
8,000
10,000
12,000
14,000
Res
ilien
t Mod
ulus
, Mr (
psi)
5c=20.7 kPa
5c=34.5 kPa
5c=68.9 kPa
5c=103.4 kPa
5c=137.9 kPa
5c=20.7 kPa
5c=34.5 kPa
5c=68.9 kPa
5c=103.4 kPa
5c=137.9 kPa
0 100 200 300 400 500 600
Bulk Stress, 5b (kPa)
40
80
120
160
200
240
Res
ilien
t Mod
ulus
, Mr (
MP
a)
10,000
15,000
20,000
25,000
30,000
Res
ilien
t Mod
ulus
, Mr (
psi)
Materials Characterization and Analysis of the Marquette Interchange HMA Perpetual Pavement | 2008
Midwest Regional University Transportation Center (MRUTC)
47
CHAPTER 3.0 PERFORMANCE ANALYSIS
3.1 Introduction A performance analysis of the HMA perpetual pavement was conducted to estimate the ride quality and levels of cracking and rutting after 50 years of trafficking. The mechanistic-empirical pavement design guide version 1.003 (MEPDG v1.003), which was developed under NCHRP Projects 1-37A and 1-40D, was utilized to provide baseline damage/cracking estimates. The stand-alone software programs KENLAYER and EVERSTRESS were also used to compute critical tensile strains in the HMA layer, which were then used to estimate the 50-year damage due to bottom-up fatigue cracking. Results of the laboratory testing described in Chapter 2 were used in conjunction with field data obtained with pavement sensors to provide necessary inputs for program executions. 3.2 MEPDG v1.003 Input Data Generation The primary focus of the laboratory testing was the development of material characterization inputs for the mechanistic-empirical appraisal of projected pavement performance. Data provided from these tests were further analyzed to establish specific data inputs as required by each software package. A detailed analysis of weigh-in-motion (WIM) data obtained through pavement instrumentations was completed to establish the axle loading spectra data necessary for a thorough pavement analysis. 3.2.1. HMA Dynamic Modulus The HMA dynamic modulus was determined at three temperatures and nine test frequencies for each of the three HMA mixtures used within the HMA perpetual pavement structure. Mixture-specific master curves for were developed in the general form of:
( log )( *)1 rtLog E
e 4 3
0! () ((
(3.1)
log log (log log )TRrt t c 6 6) / / (3.2)
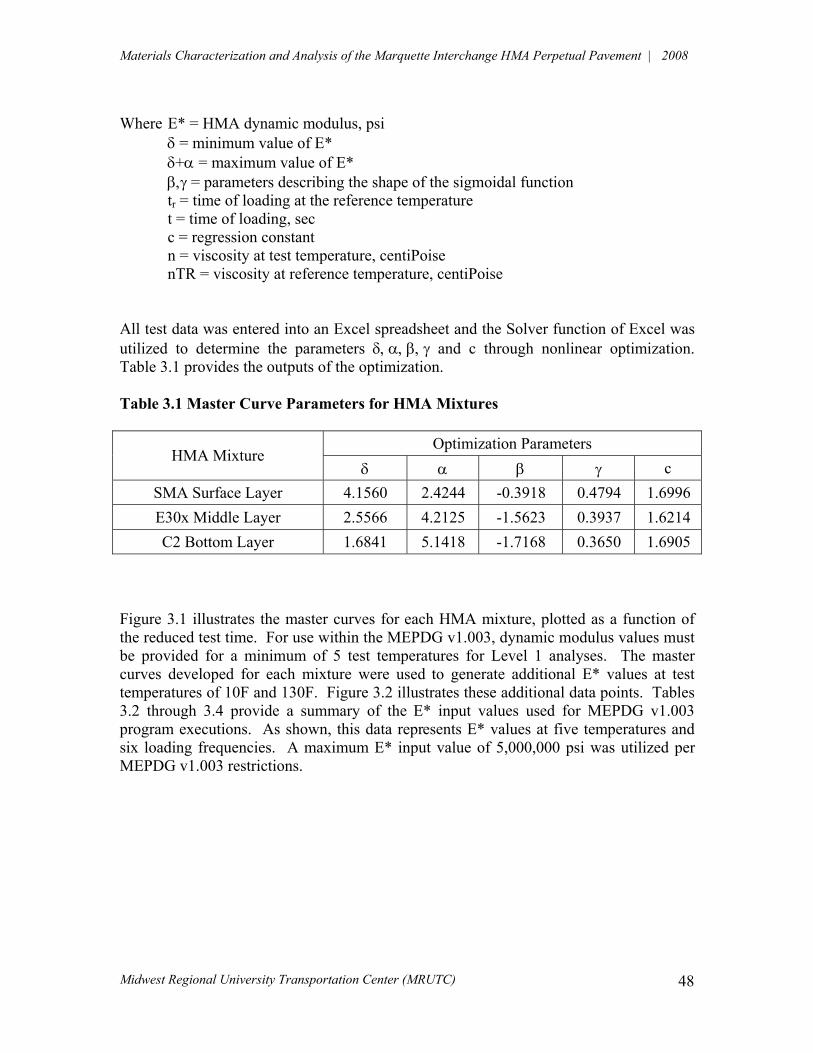
Materials Characterization and Analysis of the Marquette Interchange HMA Perpetual Pavement | 2008
Midwest Regional University Transportation Center (MRUTC)
48
Where E* = HMA dynamic modulus, psi ! = minimum value of E* !+0 = maximum value of E* 473 = parameters describing the shape of the sigmoidal function tr = time of loading at the reference temperature t = time of loading, sec c = regression constant n = viscosity at test temperature, centiPoise nTR = viscosity at reference temperature, centiPoise All test data was entered into an Excel spreadsheet and the Solver function of Excel was utilized to determine the parameters !7%07%47%3 and c through nonlinear optimization. Table 3.1 provides the outputs of the optimization. Table 3.1 Master Curve Parameters for HMA Mixtures
Optimization Parameters HMA Mixture
!% 0% 4% 3% c SMA Surface Layer 4.1560 2.4244 -0.3918 0.4794 1.6996 E30x Middle Layer 2.5566 4.2125 -1.5623 0.3937 1.6214 C2 Bottom Layer 1.6841 5.1418 -1.7168 0.3650 1.6905
Figure 3.1 illustrates the master curves for each HMA mixture, plotted as a function of the reduced test time. For use within the MEPDG v1.003, dynamic modulus values must be provided for a minimum of 5 test temperatures for Level 1 analyses. The master curves developed for each mixture were used to generate additional E* values at test temperatures of 10F and 130F. Figure 3.2 illustrates these additional data points. Tables 3.2 through 3.4 provide a summary of the E* input values used for MEPDG v1.003 program executions. As shown, this data represents E* values at five temperatures and six loading frequencies. A maximum E* input value of 5,000,000 psi was utilized per MEPDG v1.003 restrictions.
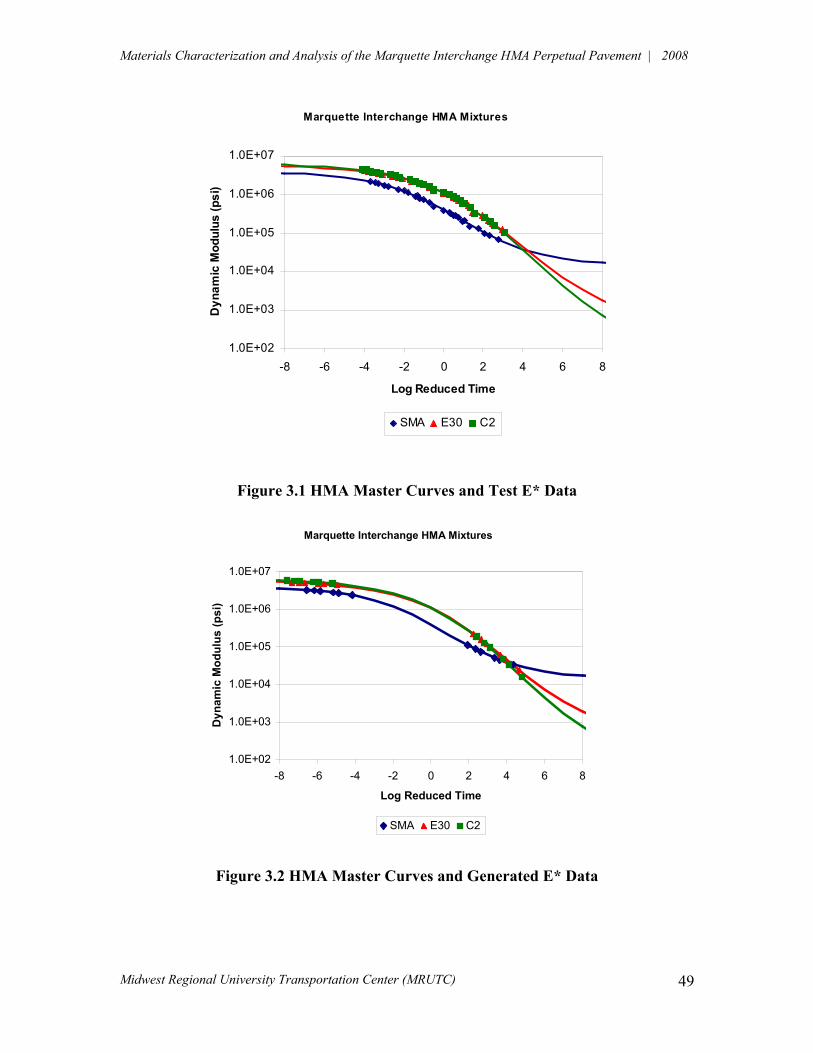
Materials Characterization and Analysis of the Marquette Interchange HMA Perpetual Pavement | 2008
Midwest Regional University Transportation Center (MRUTC)
49
Figure 3.1 HMA Master Curves and Test E* Data
Figure 3.2 HMA Master Curves and Generated E* Data
Marquette Interchange HMA Mixtures
1.0E+02
1.0E+03
1.0E+04
1.0E+05
1.0E+06
1.0E+07
-8 -6 -4 -2 0 2 4 6 8
Log Reduced Time
Dyn
amic
Mod
ulus
(psi
)
SMA E30 C2
Marquette Interchange HMA Mixtures
1.0E+02
1.0E+03
1.0E+04
1.0E+05
1.0E+06
1.0E+07
-8 -6 -4 -2 0 2 4 6 8
Log Reduced Time
Dyn
amic
Mod
ulus
(psi
)
SMA E30 C2
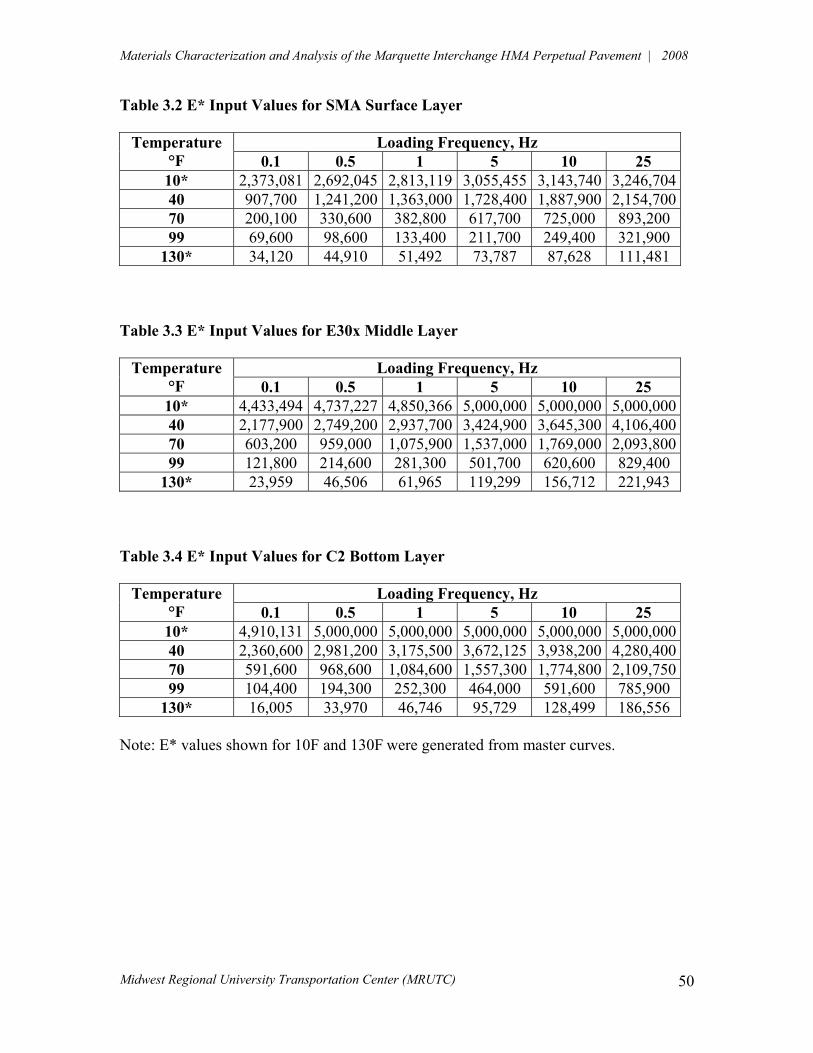
Materials Characterization and Analysis of the Marquette Interchange HMA Perpetual Pavement | 2008
Midwest Regional University Transportation Center (MRUTC)
50
Table 3.2 E* Input Values for SMA Surface Layer
Loading Frequency, Hz Temperature °F 0.1 0.5 1 5 10 25 10* 2,373,081 2,692,045 2,813,119 3,055,455 3,143,740 3,246,70440 907,700 1,241,200 1,363,000 1,728,400 1,887,900 2,154,70070 200,100 330,600 382,800 617,700 725,000 893,200 99 69,600 98,600 133,400 211,700 249,400 321,900
130* 34,120 44,910 51,492 73,787 87,628 111,481 Table 3.3 E* Input Values for E30x Middle Layer
Loading Frequency, Hz Temperature °F 0.1 0.5 1 5 10 25 10* 4,433,494 4,737,227 4,850,366 5,000,000 5,000,000 5,000,00040 2,177,900 2,749,200 2,937,700 3,424,900 3,645,300 4,106,40070 603,200 959,000 1,075,900 1,537,000 1,769,000 2,093,80099 121,800 214,600 281,300 501,700 620,600 829,400
130* 23,959 46,506 61,965 119,299 156,712 221,943 Table 3.4 E* Input Values for C2 Bottom Layer
Loading Frequency, Hz Temperature °F 0.1 0.5 1 5 10 25 10* 4,910,131 5,000,000 5,000,000 5,000,000 5,000,000 5,000,00040 2,360,600 2,981,200 3,175,500 3,672,125 3,938,200 4,280,40070 591,600 968,600 1,084,600 1,557,300 1,774,800 2,109,75099 104,400 194,300 252,300 464,000 591,600 785,900
130* 16,005 33,970 46,746 95,729 128,499 186,556 Note: E* values shown for 10F and 130F were generated from master curves.
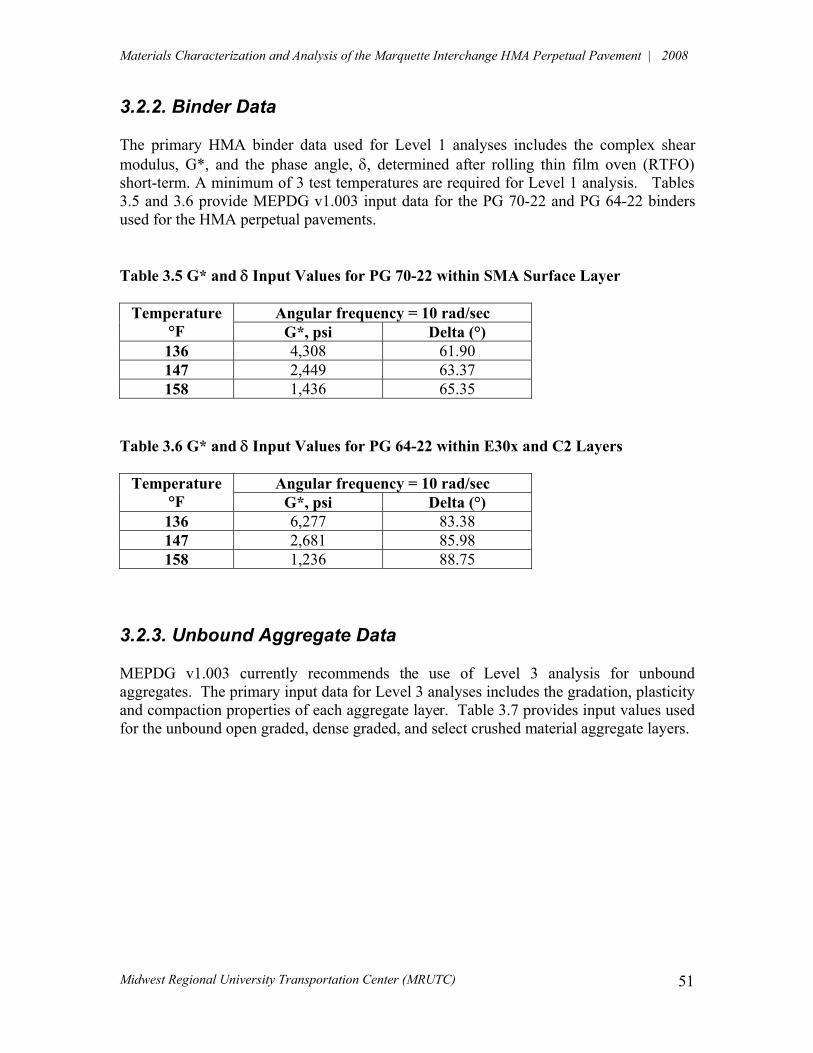
Materials Characterization and Analysis of the Marquette Interchange HMA Perpetual Pavement | 2008
Midwest Regional University Transportation Center (MRUTC)
51
3.2.2. Binder Data The primary HMA binder data used for Level 1 analyses includes the complex shear modulus, G*, and the phase angle, !, determined after rolling thin film oven (RTFO) short-term. A minimum of 3 test temperatures are required for Level 1 analysis. Tables 3.5 and 3.6 provide MEPDG v1.003 input data for the PG 70-22 and PG 64-22 binders used for the HMA perpetual pavements. Table 3.5 G* and ! Input Values for PG 70-22 within SMA Surface Layer
Angular frequency = 10 rad/sec Temperature °F G*, psi Delta (°) 136 4,308 61.90 147 2,449 63.37 158 1,436 65.35
Table 3.6 G* and ! Input Values for PG 64-22 within E30x and C2 Layers
Angular frequency = 10 rad/sec Temperature °F G*, psi Delta (°) 136 6,277 83.38 147 2,681 85.98 158 1,236 88.75
3.2.3. Unbound Aggregate Data MEPDG v1.003 currently recommends the use of Level 3 analysis for unbound aggregates. The primary input data for Level 3 analyses includes the gradation, plasticity and compaction properties of each aggregate layer. Table 3.7 provides input values used for the unbound open graded, dense graded, and select crushed material aggregate layers.

Materials Characterization and Analysis of the Marquette Interchange HMA Perpetual Pavement | 2008
Midwest Regional University Transportation Center (MRUTC)
52
Table 3.7 Input Data for Unbound Aggregates
Property Open Graded Dense Graded Select Crushed Plasticity Index 0 0 0
Liquid Limit 0 0 0 Max Dry Unit Weight, pcf 128.4 121.1 125.0
Optimum Moisture, % 3.5 11.2 5.0 Percent Passing
3-1/2” 97.6 1-1/2” 100 35.0
1” 100 99.5 ¾” 97.7 90.2
3/8” 62.1 64.5 No. 4 26.7 35.8 No. 10 3.8 22.2 10.0 No. 20 3.1 13.9 No. 40 3.0 8.2 No. 200 2.4 1.7 2.0
3.2.4. Soils Data MEPDG v1.003 currently recommends the use of Level 3 analysis for soils. The primary input data for Level 3 analyses includes the gradation, plasticity, compaction properties and hydraulic conductivity of each soil layer. Table 3.8 provides input values used for the two soil layers. Table 3.8 Primary Input Data for Soil Layers
Property Top 12” Remaining AASHTO Class A-4 A-4 Plasticity Index 4 7
Liquid Limit 17 24 Max Dry Unit Weight, pcf 127.5 119.0
Optimum Moisture, % 10.0 12.5 Sat Hydraulic Conductivity, ft/hr 6.7 E-4 1.7 E-4
Percent Passing No. 40 100 100 No. 200 78 94 20 #m 31 48 2 #m 14 26 1 #m 12 24

Materials Characterization and Analysis of the Marquette Interchange HMA Perpetual Pavement | 2008
Midwest Regional University Transportation Center (MRUTC)
53
3.2.4. Traffic Data The primary traffic data for Level 1 analyses includes general traffic factors such as the initial two-way annual average daily truck traffic (AADTT), directional factor (DF), lane distribution factor (LDF), annual growth factor (r) as well specific loading factors such as the distribution of truck traffic by class, the hourly distribution of truck traffic, the average axles per truck class, and axle load spectra for each axle type. Pavement design data was used to generate the general traffic factors, which are summarized in Table 3.9. Data collected from the on-site WIM system was used to generate the specific loading factors. Tables 3.10 through 3.16 provide the specific truck loading input data. Table 3.9 General Traffic Inputs Developed From Pavement Design Data
Traffic Factor Input Value 1999 ADT 138,800 2025 ADT 152,700 % Trucks 11
Average Annual Growth Rate, % 0.4 2006 2-way AADTT 15,950 Directional Factor, % 55
No. of Lanes in Design Direction 4 Lane Distribution Factor, % 50
Operational Speed 55 Table 3.10 Truck Traffic Distribution by Class Developed From WIM Data
FHWA Vehicle Class % of Total Trucks 4 19.6 5 30.3 6 5.5 7 4.6 8 3.0 9 35.9 10 0.7 11 0.3 12 0.1
Total 100

Materials Characterization and Analysis of the Marquette Interchange HMA Perpetual Pavement | 2008
Midwest Regional University Transportation Center (MRUTC)
54
Table 3.11 Hourly Truck Traffic Distribution Developed From WIM Data
Hour Beginning
% of All Trucks
Hour Beginning
% of All Trucks
Midnight 1.1% Noon 7.6% 1:00 am 1.0% 1:00 pm 6.0% 2:00 am 0.9% 2:00 pm 4.9% 3:00 am 1.2% 3:00 pm 5.7% 4:00 am 2.1% 4:00 pm 3.1% 5:00 am 4.8% 5:00 pm 2.2% 6:00 am 8.0% 6:00 pm 2.5% 7:00 am 10.4% 7:00 pm 2.3% 8:00 am 6.8% 8:00 pm 2.0% 9:00 am 6.7% 9:00 pm 1.2% 10:00 am 8.9% 10:00 pm 1.2% 11:00 am 8.2% 11:00 pm 1.2%
Table 3.12 Average Axles per Truck Developed From WIM Data
FHWA Class Single Axle Tandem Axle Tridem Axle Quad Axle 4 1.82 0.18 0.00 0.00 5 2.00 0.00 0.00 0.00 6 1.00 1.00 0.00 0.00 7 1.00 0.00 0.14 0.86 8 3.00 0.00 0.00 0.00 9 1.00 2.00 0.00 0.00 10 1.00 1.00 1.00 0.00 11 5.00 0.00 0.00 0.00 12 4.00 1.00 0.00 0.00
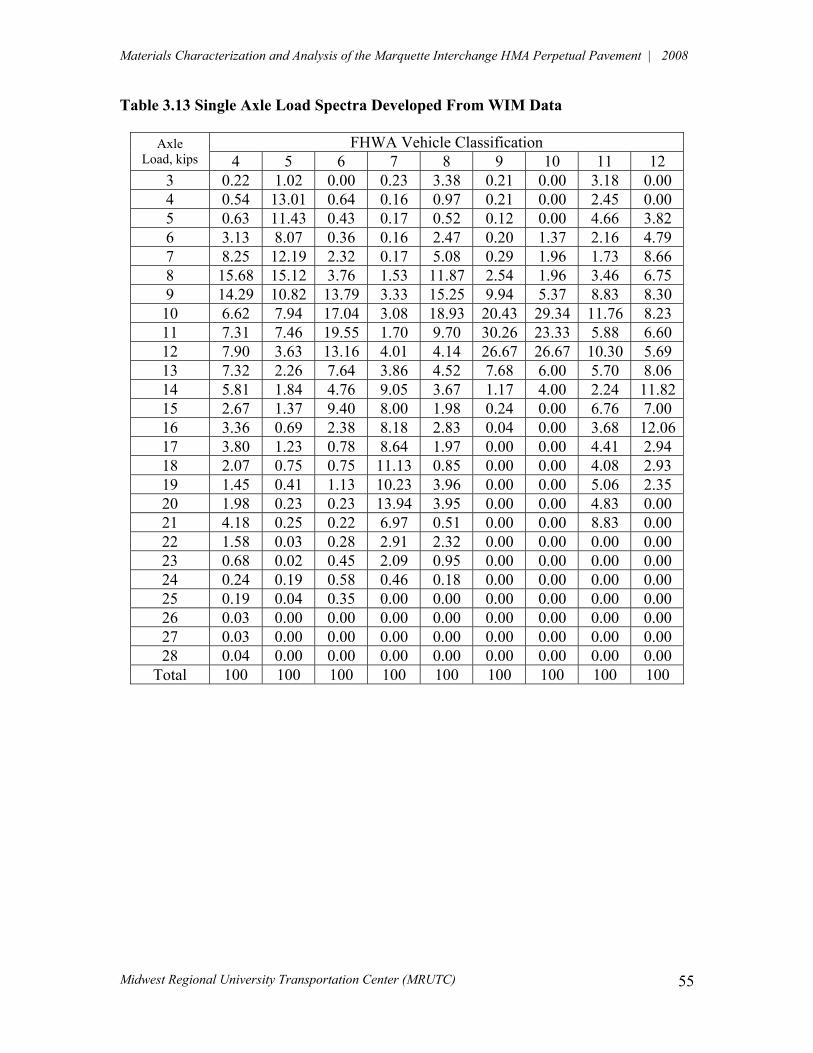
Materials Characterization and Analysis of the Marquette Interchange HMA Perpetual Pavement | 2008
Midwest Regional University Transportation Center (MRUTC)
55
Table 3.13 Single Axle Load Spectra Developed From WIM Data
FHWA Vehicle Classification Axle Load, kips 4 5 6 7 8 9 10 11 12
3 0.22 1.02 0.00 0.23 3.38 0.21 0.00 3.18 0.00 4 0.54 13.01 0.64 0.16 0.97 0.21 0.00 2.45 0.00 5 0.63 11.43 0.43 0.17 0.52 0.12 0.00 4.66 3.82 6 3.13 8.07 0.36 0.16 2.47 0.20 1.37 2.16 4.79 7 8.25 12.19 2.32 0.17 5.08 0.29 1.96 1.73 8.66 8 15.68 15.12 3.76 1.53 11.87 2.54 1.96 3.46 6.75 9 14.29 10.82 13.79 3.33 15.25 9.94 5.37 8.83 8.30 10 6.62 7.94 17.04 3.08 18.93 20.43 29.34 11.76 8.23 11 7.31 7.46 19.55 1.70 9.70 30.26 23.33 5.88 6.60 12 7.90 3.63 13.16 4.01 4.14 26.67 26.67 10.30 5.69 13 7.32 2.26 7.64 3.86 4.52 7.68 6.00 5.70 8.06 14 5.81 1.84 4.76 9.05 3.67 1.17 4.00 2.24 11.82 15 2.67 1.37 9.40 8.00 1.98 0.24 0.00 6.76 7.00 16 3.36 0.69 2.38 8.18 2.83 0.04 0.00 3.68 12.06 17 3.80 1.23 0.78 8.64 1.97 0.00 0.00 4.41 2.94 18 2.07 0.75 0.75 11.13 0.85 0.00 0.00 4.08 2.93 19 1.45 0.41 1.13 10.23 3.96 0.00 0.00 5.06 2.35 20 1.98 0.23 0.23 13.94 3.95 0.00 0.00 4.83 0.00 21 4.18 0.25 0.22 6.97 0.51 0.00 0.00 8.83 0.00 22 1.58 0.03 0.28 2.91 2.32 0.00 0.00 0.00 0.00 23 0.68 0.02 0.45 2.09 0.95 0.00 0.00 0.00 0.00 24 0.24 0.19 0.58 0.46 0.18 0.00 0.00 0.00 0.00 25 0.19 0.04 0.35 0.00 0.00 0.00 0.00 0.00 0.00 26 0.03 0.00 0.00 0.00 0.00 0.00 0.00 0.00 0.00 27 0.03 0.00 0.00 0.00 0.00 0.00 0.00 0.00 0.00 28 0.04 0.00 0.00 0.00 0.00 0.00 0.00 0.00 0.00
Total 100 100 100 100 100 100 100 100 100
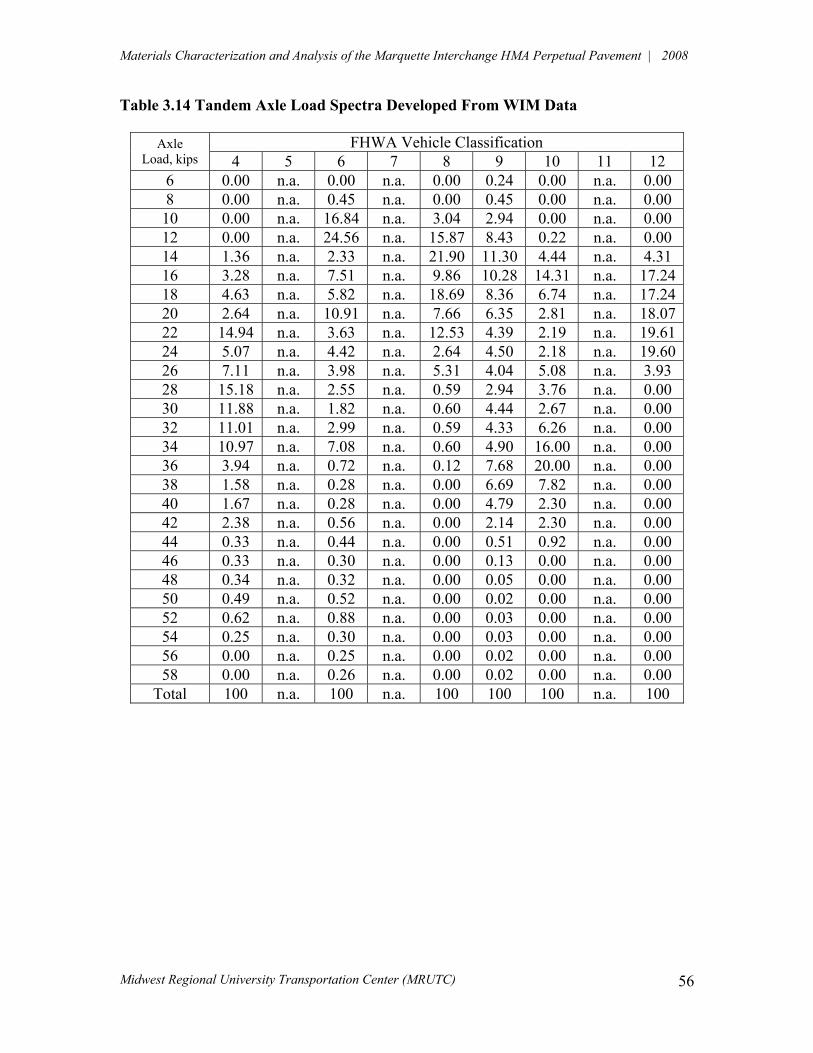
Materials Characterization and Analysis of the Marquette Interchange HMA Perpetual Pavement | 2008
Midwest Regional University Transportation Center (MRUTC)
56
Table 3.14 Tandem Axle Load Spectra Developed From WIM Data
FHWA Vehicle Classification Axle Load, kips 4 5 6 7 8 9 10 11 12
6 0.00 n.a. 0.00 n.a. 0.00 0.24 0.00 n.a. 0.00 8 0.00 n.a. 0.45 n.a. 0.00 0.45 0.00 n.a. 0.00 10 0.00 n.a. 16.84 n.a. 3.04 2.94 0.00 n.a. 0.00 12 0.00 n.a. 24.56 n.a. 15.87 8.43 0.22 n.a. 0.00 14 1.36 n.a. 2.33 n.a. 21.90 11.30 4.44 n.a. 4.31 16 3.28 n.a. 7.51 n.a. 9.86 10.28 14.31 n.a. 17.24 18 4.63 n.a. 5.82 n.a. 18.69 8.36 6.74 n.a. 17.24 20 2.64 n.a. 10.91 n.a. 7.66 6.35 2.81 n.a. 18.07 22 14.94 n.a. 3.63 n.a. 12.53 4.39 2.19 n.a. 19.61 24 5.07 n.a. 4.42 n.a. 2.64 4.50 2.18 n.a. 19.60 26 7.11 n.a. 3.98 n.a. 5.31 4.04 5.08 n.a. 3.93 28 15.18 n.a. 2.55 n.a. 0.59 2.94 3.76 n.a. 0.00 30 11.88 n.a. 1.82 n.a. 0.60 4.44 2.67 n.a. 0.00 32 11.01 n.a. 2.99 n.a. 0.59 4.33 6.26 n.a. 0.00 34 10.97 n.a. 7.08 n.a. 0.60 4.90 16.00 n.a. 0.00 36 3.94 n.a. 0.72 n.a. 0.12 7.68 20.00 n.a. 0.00 38 1.58 n.a. 0.28 n.a. 0.00 6.69 7.82 n.a. 0.00 40 1.67 n.a. 0.28 n.a. 0.00 4.79 2.30 n.a. 0.00 42 2.38 n.a. 0.56 n.a. 0.00 2.14 2.30 n.a. 0.00 44 0.33 n.a. 0.44 n.a. 0.00 0.51 0.92 n.a. 0.00 46 0.33 n.a. 0.30 n.a. 0.00 0.13 0.00 n.a. 0.00 48 0.34 n.a. 0.32 n.a. 0.00 0.05 0.00 n.a. 0.00 50 0.49 n.a. 0.52 n.a. 0.00 0.02 0.00 n.a. 0.00 52 0.62 n.a. 0.88 n.a. 0.00 0.03 0.00 n.a. 0.00 54 0.25 n.a. 0.30 n.a. 0.00 0.03 0.00 n.a. 0.00 56 0.00 n.a. 0.25 n.a. 0.00 0.02 0.00 n.a. 0.00 58 0.00 n.a. 0.26 n.a. 0.00 0.02 0.00 n.a. 0.00
Total 100 n.a. 100 n.a. 100 100 100 n.a. 100

Materials Characterization and Analysis of the Marquette Interchange HMA Perpetual Pavement | 2008
Midwest Regional University Transportation Center (MRUTC)
57
Table 3.15 Tridem Axle Load Spectra Developed From WIM Data FHWA Vehicle Classification Axle
Load, kips 4 5 6 7 8 9 10 11 12 12 n.a. n.a. n.a. 0.00 n.a. n.a. 7.16 n.a. n.a. 15 n.a. n.a. n.a. 0.00 n.a. n.a. 13.31 n.a. n.a. 18 n.a. n.a. n.a. 0.00 n.a. n.a. 7.26 n.a. n.a. 21 n.a. n.a. n.a. 0.00 n.a. n.a. 7.27 n.a. n.a. 24 n.a. n.a. n.a. 1.64 n.a. n.a. 5.21 n.a. n.a. 27 n.a. n.a. n.a. 2.47 n.a. n.a. 2.20 n.a. n.a. 30 n.a. n.a. n.a. 2.47 n.a. n.a. 2.20 n.a. n.a. 33 n.a. n.a. n.a. 9.15 n.a. n.a. 9.32 n.a. n.a. 36 n.a. n.a. n.a. 7.28 n.a. n.a. 8.63 n.a. n.a. 39 n.a. n.a. n.a. 10.32 n.a. n.a. 5.56 n.a. n.a. 42 n.a. n.a. n.a. 2.13 n.a. n.a. 3.13 n.a. n.a. 45 n.a. n.a. n.a. 2.12 n.a. n.a. 16.46 n.a. n.a. 48 n.a. n.a. n.a. 2.13 n.a. n.a. 10.80 n.a. n.a. 51 n.a. n.a. n.a. 20.29 n.a. n.a. 1.49 n.a. n.a. 54 n.a. n.a. n.a. 20.00 n.a. n.a. 0.00 n.a. n.a. 57 n.a. n.a. n.a. 16.19 n.a. n.a. 0.00 n.a. n.a. 60 n.a. n.a. n.a. 3.81 n.a. n.a. 0.00 n.a. n.a.
Total n.a. n.a. n.a. 100 n.a. n.a. 100 n.a. n.a. Table 3.16 Quad Axle Load Spectra Developed From WIM Data
FHWA Vehicle Classification Axle Load, kips 4 5 6 7 8 9 10 11 12
33 n.a. n.a. n.a. 0.00 n.a. n.a. n.a. n.a. n.a. 36 n.a. n.a. n.a. 2.63 n.a. n.a. n.a. n.a. n.a. 39 n.a. n.a. n.a. 0.98 n.a. n.a. n.a. n.a. n.a. 42 n.a. n.a. n.a. 0.64 n.a. n.a. n.a. n.a. n.a. 45 n.a. n.a. n.a. 1.43 n.a. n.a. n.a. n.a. n.a. 48 n.a. n.a. n.a. 2.92 n.a. n.a. n.a. n.a. n.a. 51 n.a. n.a. n.a. 4.69 n.a. n.a. n.a. n.a. n.a. 54 n.a. n.a. n.a. 4.79 n.a. n.a. n.a. n.a. n.a. 57 n.a. n.a. n.a. 10.28 n.a. n.a. n.a. n.a. n.a. 60 n.a. n.a. n.a. 12.06 n.a. n.a. n.a. n.a. n.a. 63 n.a. n.a. n.a. 23.25 n.a. n.a. n.a. n.a. n.a. 66 n.a. n.a. n.a. 15.05 n.a. n.a. n.a. n.a. n.a. 69 n.a. n.a. n.a. 8.98 n.a. n.a. n.a. n.a. n.a. 72 n.a. n.a. n.a. 5.91 n.a. n.a. n.a. n.a. n.a. 75 n.a. n.a. n.a. 4.53 n.a. n.a. n.a. n.a. n.a. 78 n.a. n.a. n.a. 0.82 n.a. n.a. n.a. n.a. n.a. 81 n.a. n.a. n.a. 0.76 n.a. n.a. n.a. n.a. n.a. 84 n.a. n.a. n.a. 0.28 n.a. n.a. n.a. n.a. n.a.
Total n.a. n.a. n.a. 100 n.a. n.a. n.a. n.a. n.a.

Materials Characterization and Analysis of the Marquette Interchange HMA Perpetual Pavement | 2008
Midwest Regional University Transportation Center (MRUTC)
58
3.2.5. Environmental Data The primary environmental data for site-specific performance analyses includes air and pavement temperatures, precipitation, wind speed, % sunshine and frost penetration. The enhanced integrated climatic model (EICM) included within MEPDG v1.003 was utilized to compute monthly average values based on the previous nine years of environmental data available for the Milwaukee area. Tables 3.17 to 3.19 provide general site information used for environmental data computations. The estimated monthly air and pavement layer temperatures are provided in Tables 3.20 to 3.23. Table 3.17 General Site Information for Project Analysis
Project Location Milwaukee, WI Latitude (degrees.minutes) 42.57 N
Longitude (degrees.minutes) 87.54 W Elevation, ft 687
Depth of Water Table, ft 12 Mean Annual Air Temperature, F 48.6
Mean Annual Rainfall, in 30.9 Freezing Index (F-days) 756.5
Average Number of Freeze-Thaw Cycles 52 Table 3.18 Rainfall Statistics for Project Analysis
Month Mean
Rainfall(in)
Std. Dev. (in)
January 1.65 0.87 February 1.67 1.13 March 3.24 1.39 April 4.22 2.39 May 3.88 1.85 June 3.22 1.19 July 3.3 1.65
August 2.93 1.71 September 1.93 1.1
October 1.73 1.09 November 1.32 0.59

Materials Characterization and Analysis of the Marquette Interchange HMA Perpetual Pavement | 2008
Midwest Regional University Transportation Center (MRUTC)
59
Table 3.19 Selected Monthly Data for 1997-1998
Month Min.
Temp. (ºF)
Max. Temp.
(ºF)
AverageTemp.
(ºF)
Max. Range
(ºF) Precip.
(in.)
AverageWind (mph)
Average Sun (%)
NumberWet Days
Max. Frost (in.)
1/1997 -8 59 20.3 27.5 1.27 10.3 49 19 50 2/1997 12 51.1 28.9 26.1 2.38 9.1 44.2 15 50.4 3/1997 10.9 73.9 35.8 30.9 0.67 9.7 52.4 19 40.3 4/1997 19.9 78.1 43.3 31.2 1.98 9.6 59.8 18 5.2 5/1997 34 72 49.1 27.9 1.95 10 29.9 16 0 6/1997 46 90 64.6 34 7.48 7.2 42.4 12 0 7/1997 52 91.9 69.2 24 3.59 8 41.7 15 0 8/1997 54 88 66.6 21 3.95 7.4 35.4 14 0 9/1997 42.1 82 61.6 26 2.92 8.1 47.5 14 0
10/1997 26.1 87.1 51.8 36 1.11 8.6 44.9 11 3 11/1997 14 55.9 35.1 21.1 1.03 8.5 28 20 16.3 12/1997 10 48 30.4 18 0.78 8.7 20.6 17 24.4 1/1998 -4 54 27.7 26 1.94 9.2 13.3 24 32.8 2/1998 24.1 50 34.8 18 2.03 7.9 13.5 17 22.7 3/1998 10 75 36 33 3.15 11.2 22.7 18 27.1 4/1998 28 70 45.8 25 4.16 8.7 34.3 16 0.5 5/1998 45 88 60.1 27 2.48 8.8 45.2 15 0 6/1998 43 93.9 66.2 27 2.83 7.5 38.2 15 0 7/1998 55.9 90 72.6 23.1 1.79 7.5 50.5 12 0 8/1998 57.9 89.1 72.6 21.9 4.34 6.9 46.1 15 0 9/1998 46 90 67.2 27 2.17 7.2 58.6 12 0
10/1998 34 72 54 22.8 2.47 8.4 43.4 12 0 11/1998 25 66 42.9 36 2.69 10.5 36.4 12 2.8 12/1998 -3 64 32.2 34 0.88 8.8 49 9 26.9
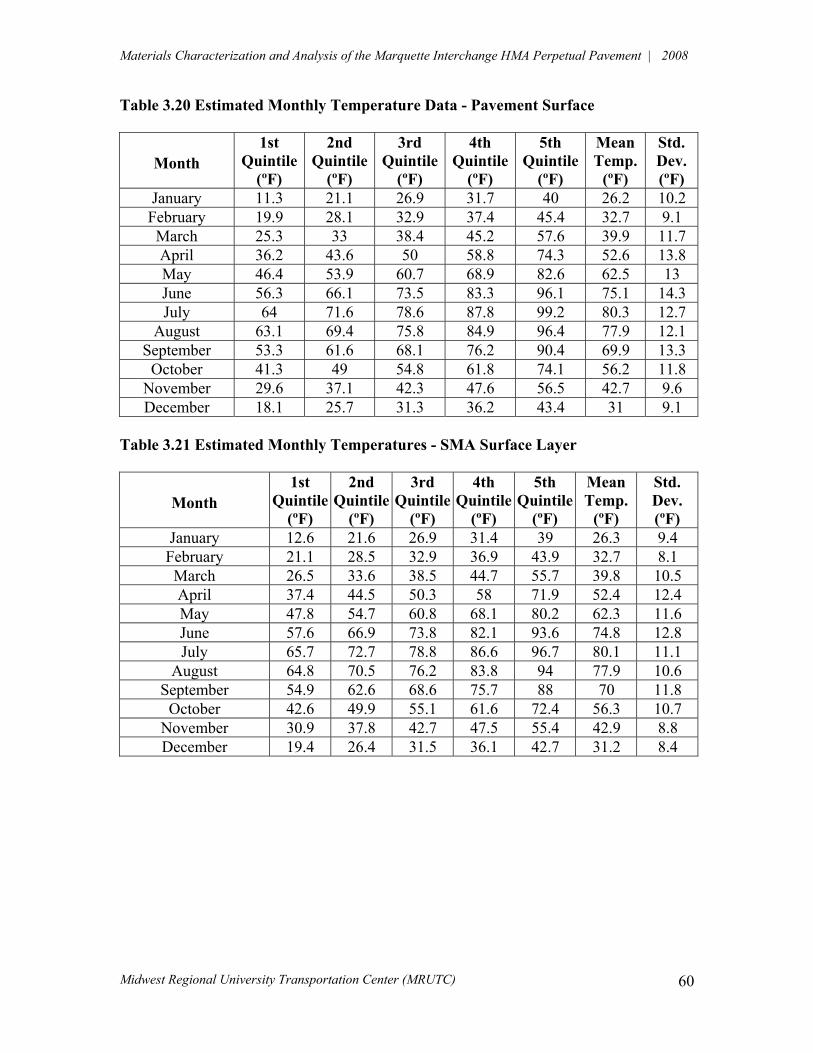
Materials Characterization and Analysis of the Marquette Interchange HMA Perpetual Pavement | 2008
Midwest Regional University Transportation Center (MRUTC)
60
Table 3.20 Estimated Monthly Temperature Data - Pavement Surface
Month 1st
Quintile (ºF)
2nd Quintile
(ºF)
3rd Quintile
(ºF)
4th Quintile
(ºF)
5th Quintile
(ºF)
Mean Temp.
(ºF)
Std. Dev.(ºF)
January 11.3 21.1 26.9 31.7 40 26.2 10.2 February 19.9 28.1 32.9 37.4 45.4 32.7 9.1 March 25.3 33 38.4 45.2 57.6 39.9 11.7 April 36.2 43.6 50 58.8 74.3 52.6 13.8 May 46.4 53.9 60.7 68.9 82.6 62.5 13 June 56.3 66.1 73.5 83.3 96.1 75.1 14.3 July 64 71.6 78.6 87.8 99.2 80.3 12.7
August 63.1 69.4 75.8 84.9 96.4 77.9 12.1 September 53.3 61.6 68.1 76.2 90.4 69.9 13.3
October 41.3 49 54.8 61.8 74.1 56.2 11.8 November 29.6 37.1 42.3 47.6 56.5 42.7 9.6 December 18.1 25.7 31.3 36.2 43.4 31 9.1
Table 3.21 Estimated Monthly Temperatures - SMA Surface Layer
Month 1st
Quintile(ºF)
2nd Quintile
(ºF)
3rd Quintile
(ºF)
4th Quintile
(ºF)
5th Quintile
(ºF)
Mean Temp.
(ºF)
Std. Dev. (ºF)
January 12.6 21.6 26.9 31.4 39 26.3 9.4 February 21.1 28.5 32.9 36.9 43.9 32.7 8.1 March 26.5 33.6 38.5 44.7 55.7 39.8 10.5 April 37.4 44.5 50.3 58 71.9 52.4 12.4 May 47.8 54.7 60.8 68.1 80.2 62.3 11.6 June 57.6 66.9 73.8 82.1 93.6 74.8 12.8 July 65.7 72.7 78.8 86.6 96.7 80.1 11.1
August 64.8 70.5 76.2 83.8 94 77.9 10.6 September 54.9 62.6 68.6 75.7 88 70 11.8
October 42.6 49.9 55.1 61.6 72.4 56.3 10.7 November 30.9 37.8 42.7 47.5 55.4 42.9 8.8 December 19.4 26.4 31.5 36.1 42.7 31.2 8.4
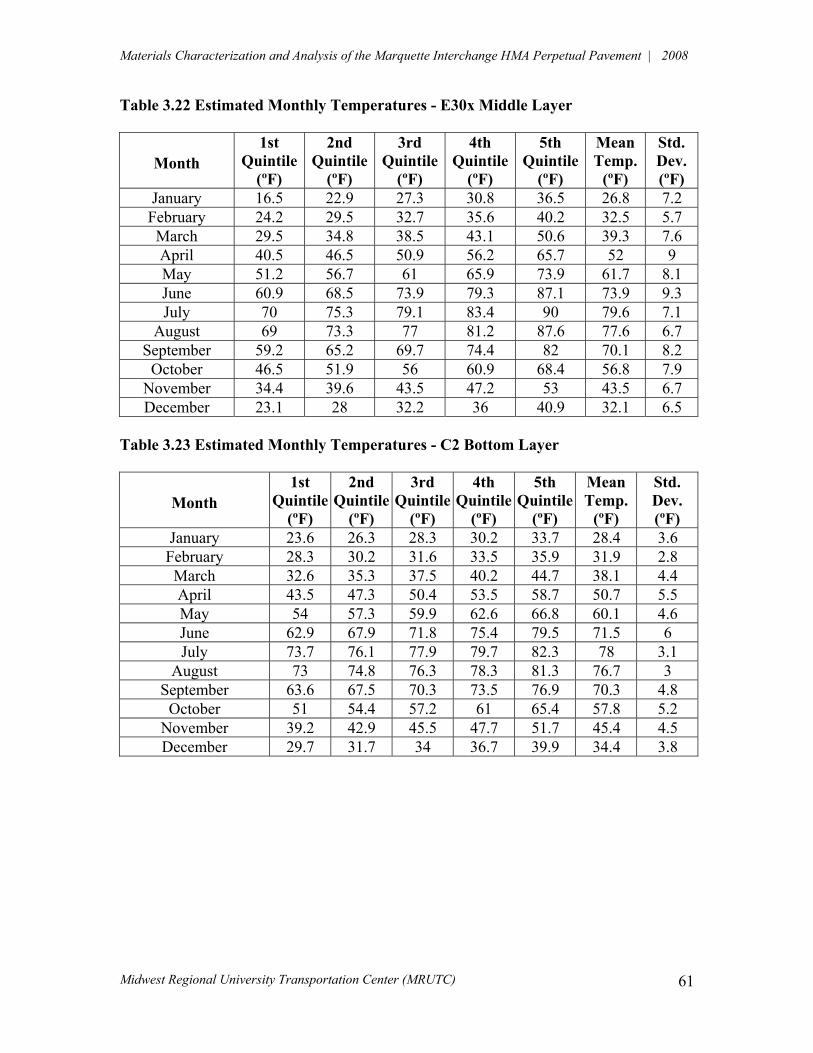
Materials Characterization and Analysis of the Marquette Interchange HMA Perpetual Pavement | 2008
Midwest Regional University Transportation Center (MRUTC)
61
Table 3.22 Estimated Monthly Temperatures - E30x Middle Layer
Month 1st
Quintile (ºF)
2nd Quintile
(ºF)
3rd Quintile
(ºF)
4th Quintile
(ºF)
5th Quintile
(ºF)
Mean Temp.
(ºF)
Std. Dev.(ºF)
January 16.5 22.9 27.3 30.8 36.5 26.8 7.2 February 24.2 29.5 32.7 35.6 40.2 32.5 5.7 March 29.5 34.8 38.5 43.1 50.6 39.3 7.6 April 40.5 46.5 50.9 56.2 65.7 52 9 May 51.2 56.7 61 65.9 73.9 61.7 8.1 June 60.9 68.5 73.9 79.3 87.1 73.9 9.3 July 70 75.3 79.1 83.4 90 79.6 7.1
August 69 73.3 77 81.2 87.6 77.6 6.7 September 59.2 65.2 69.7 74.4 82 70.1 8.2
October 46.5 51.9 56 60.9 68.4 56.8 7.9 November 34.4 39.6 43.5 47.2 53 43.5 6.7 December 23.1 28 32.2 36 40.9 32.1 6.5
Table 3.23 Estimated Monthly Temperatures - C2 Bottom Layer
Month 1st
Quintile(ºF)
2nd Quintile
(ºF)
3rd Quintile
(ºF)
4th Quintile
(ºF)
5th Quintile
(ºF)
Mean Temp.
(ºF)
Std. Dev. (ºF)
January 23.6 26.3 28.3 30.2 33.7 28.4 3.6 February 28.3 30.2 31.6 33.5 35.9 31.9 2.8 March 32.6 35.3 37.5 40.2 44.7 38.1 4.4 April 43.5 47.3 50.4 53.5 58.7 50.7 5.5 May 54 57.3 59.9 62.6 66.8 60.1 4.6 June 62.9 67.9 71.8 75.4 79.5 71.5 6 July 73.7 76.1 77.9 79.7 82.3 78 3.1
August 73 74.8 76.3 78.3 81.3 76.7 3 September 63.6 67.5 70.3 73.5 76.9 70.3 4.8
October 51 54.4 57.2 61 65.4 57.8 5.2 November 39.2 42.9 45.5 47.7 51.7 45.4 4.5 December 29.7 31.7 34 36.7 39.9 34.4 3.8
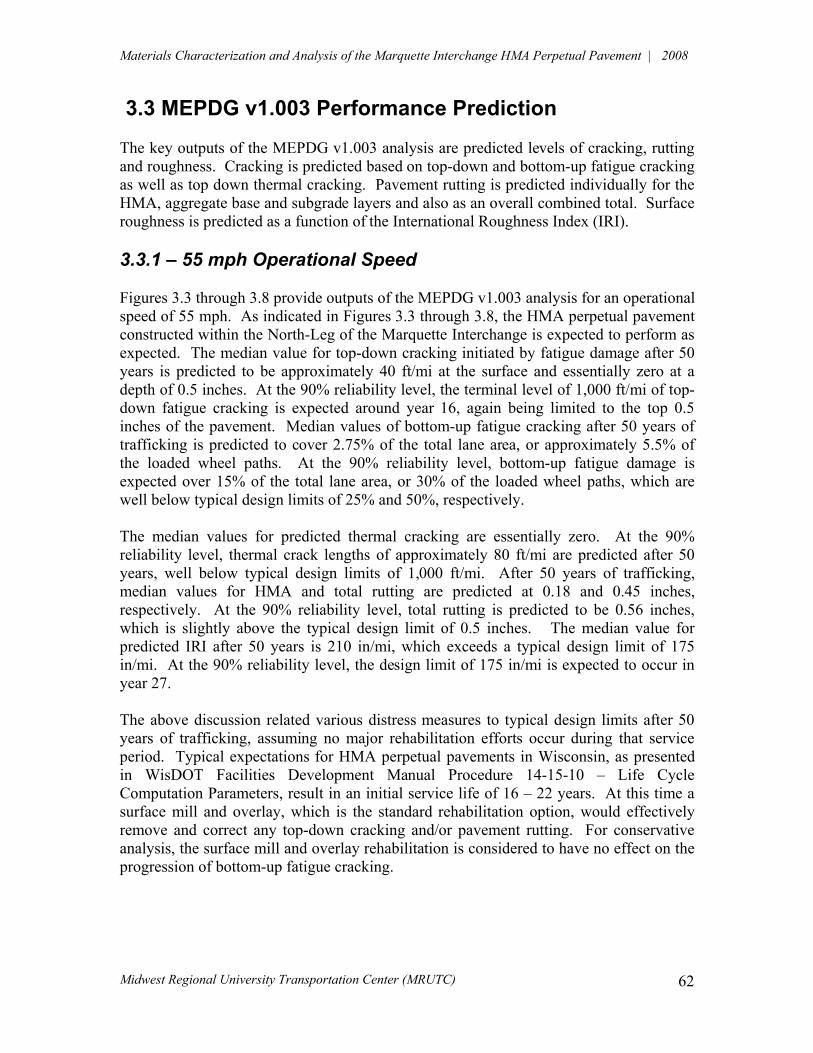
Materials Characterization and Analysis of the Marquette Interchange HMA Perpetual Pavement | 2008
Midwest Regional University Transportation Center (MRUTC)
62
3.3 MEPDG v1.003 Performance Prediction The key outputs of the MEPDG v1.003 analysis are predicted levels of cracking, rutting and roughness. Cracking is predicted based on top-down and bottom-up fatigue cracking as well as top down thermal cracking. Pavement rutting is predicted individually for the HMA, aggregate base and subgrade layers and also as an overall combined total. Surface roughness is predicted as a function of the International Roughness Index (IRI). 3.3.1 – 55 mph Operational Speed Figures 3.3 through 3.8 provide outputs of the MEPDG v1.003 analysis for an operational speed of 55 mph. As indicated in Figures 3.3 through 3.8, the HMA perpetual pavement constructed within the North-Leg of the Marquette Interchange is expected to perform as expected. The median value for top-down cracking initiated by fatigue damage after 50 years is predicted to be approximately 40 ft/mi at the surface and essentially zero at a depth of 0.5 inches. At the 90% reliability level, the terminal level of 1,000 ft/mi of top-down fatigue cracking is expected around year 16, again being limited to the top 0.5 inches of the pavement. Median values of bottom-up fatigue cracking after 50 years of trafficking is predicted to cover 2.75% of the total lane area, or approximately 5.5% of the loaded wheel paths. At the 90% reliability level, bottom-up fatigue damage is expected over 15% of the total lane area, or 30% of the loaded wheel paths, which are well below typical design limits of 25% and 50%, respectively. The median values for predicted thermal cracking are essentially zero. At the 90% reliability level, thermal crack lengths of approximately 80 ft/mi are predicted after 50 years, well below typical design limits of 1,000 ft/mi. After 50 years of trafficking, median values for HMA and total rutting are predicted at 0.18 and 0.45 inches, respectively. At the 90% reliability level, total rutting is predicted to be 0.56 inches, which is slightly above the typical design limit of 0.5 inches. The median value for predicted IRI after 50 years is 210 in/mi, which exceeds a typical design limit of 175 in/mi. At the 90% reliability level, the design limit of 175 in/mi is expected to occur in year 27. The above discussion related various distress measures to typical design limits after 50 years of trafficking, assuming no major rehabilitation efforts occur during that service period. Typical expectations for HMA perpetual pavements in Wisconsin, as presented in WisDOT Facilities Development Manual Procedure 14-15-10 – Life Cycle Computation Parameters, result in an initial service life of 16 – 22 years. At this time a surface mill and overlay, which is the standard rehabilitation option, would effectively remove and correct any top-down cracking and/or pavement rutting. For conservative analysis, the surface mill and overlay rehabilitation is considered to have no effect on the progression of bottom-up fatigue cracking.
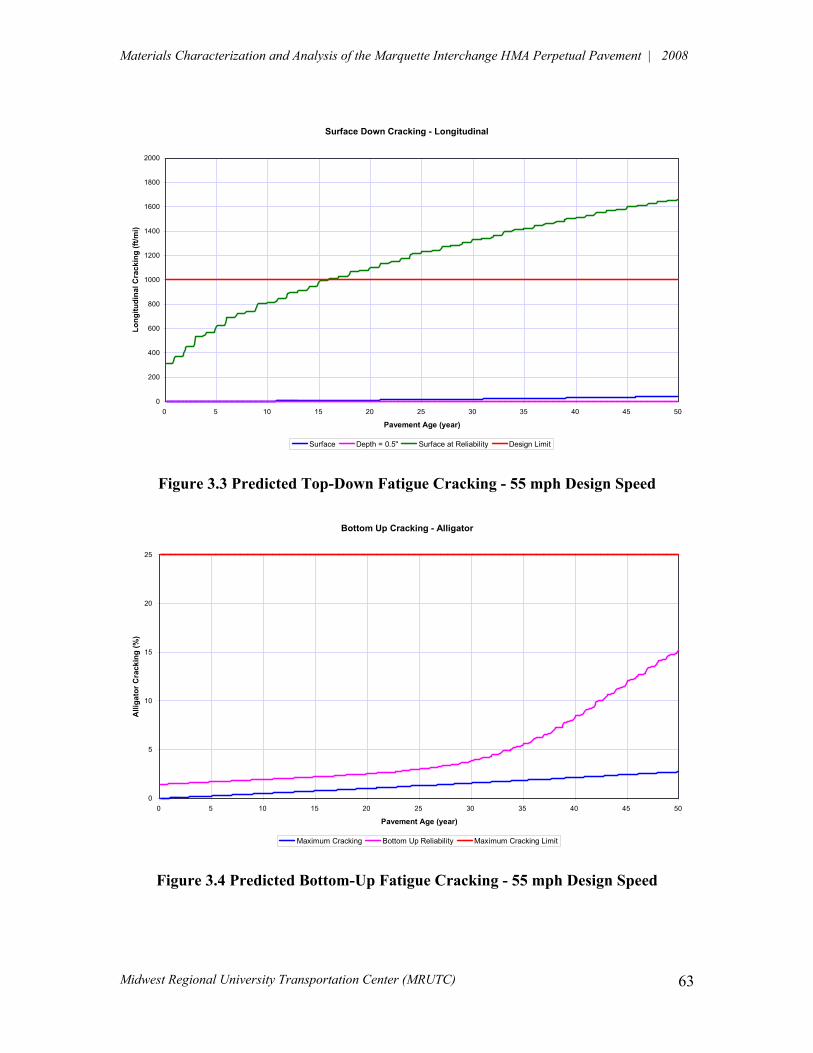
Materials Characterization and Analysis of the Marquette Interchange HMA Perpetual Pavement | 2008
Midwest Regional University Transportation Center (MRUTC)
63
Surface Down Cracking - Longitudinal
0
200
400
600
800
1000
1200
1400
1600
1800
2000
0 5 10 15 20 25 30 35 40 45 50
Pavement Age (year)
Long
itudi
nal C
rack
ing
(ft/m
i)
Surface Depth = 0.5" Surface at Reliability Design Limit
Figure 3.3 Predicted Top-Down Fatigue Cracking - 55 mph Design Speed
Bottom Up Cracking - Alligator
0
5
10
15
20
25
0 5 10 15 20 25 30 35 40 45 50
Pavement Age (year)
Alli
gato
r Cra
ckin
g (%
)
Maximum Cracking Bottom Up Reliability Maximum Cracking Limit
Figure 3.4 Predicted Bottom-Up Fatigue Cracking - 55 mph Design Speed
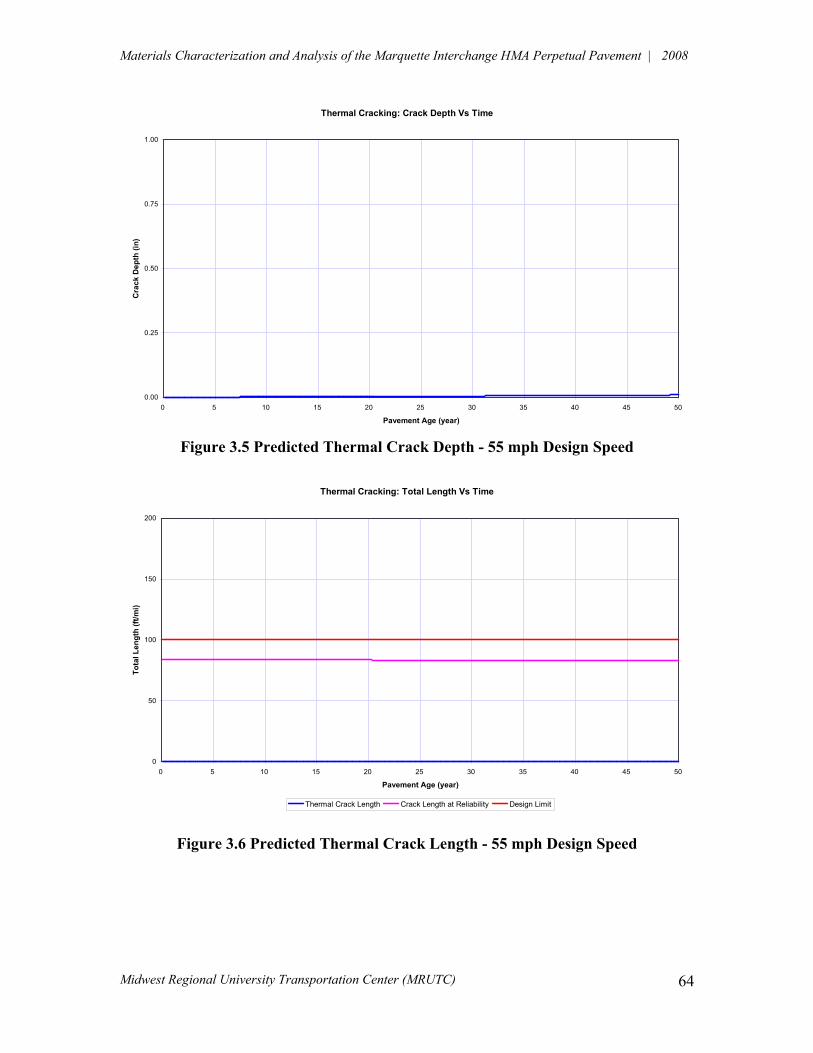
Materials Characterization and Analysis of the Marquette Interchange HMA Perpetual Pavement | 2008
Midwest Regional University Transportation Center (MRUTC)
64
Thermal Cracking: Crack Depth Vs Time
0.00
0.25
0.50
0.75
1.00
0 5 10 15 20 25 30 35 40 45 50
Pavement Age (year)
Cra
ck D
epth
(in)
Figure 3.5 Predicted Thermal Crack Depth - 55 mph Design Speed
Thermal Cracking: Total Length Vs Time
0
50
100
150
200
0 5 10 15 20 25 30 35 40 45 50
Pavement Age (year)
Tota
l Len
gth
(ft/m
i)
Thermal Crack Length Crack Length at Reliability Design Limit
Figure 3.6 Predicted Thermal Crack Length - 55 mph Design Speed
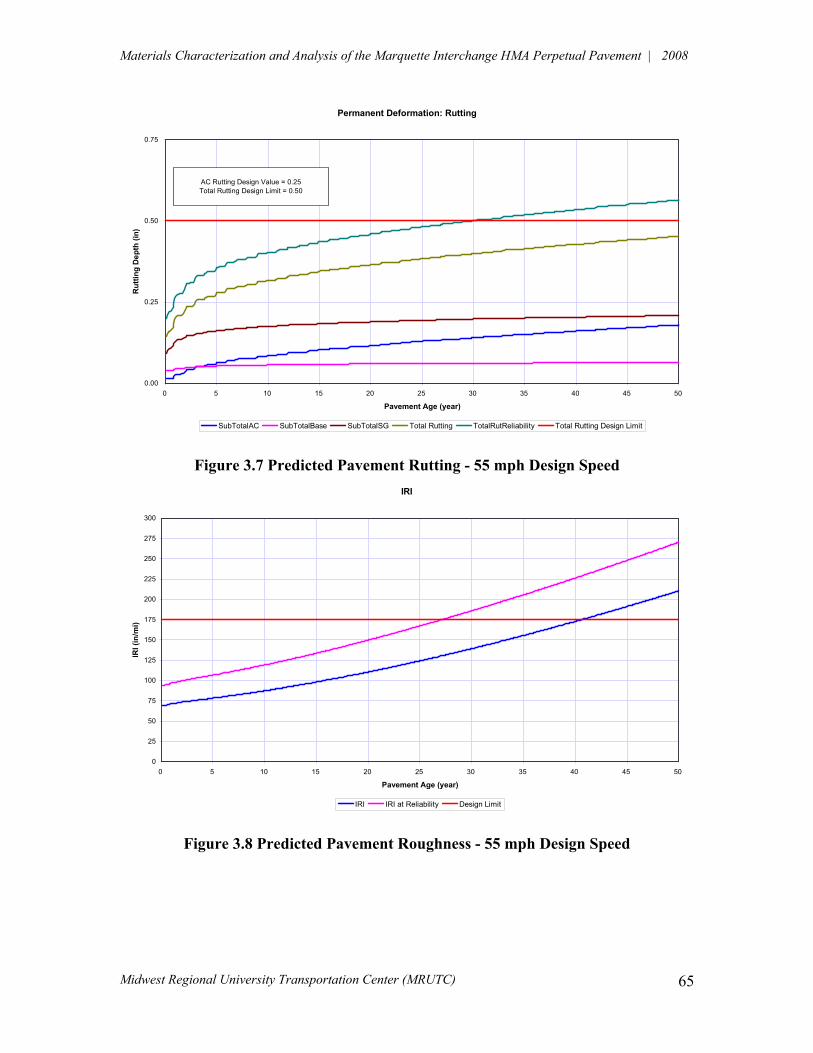
Materials Characterization and Analysis of the Marquette Interchange HMA Perpetual Pavement | 2008
Midwest Regional University Transportation Center (MRUTC)
65
Permanent Deformation: Rutting
0.00
0.25
0.50
0.75
0 5 10 15 20 25 30 35 40 45 50
Pavement Age (year)
Rut
ting
Dep
th (i
n)
SubTotalAC SubTotalBase SubTotalSG Total Rutting TotalRutReliability Total Rutting Design Limit
AC Rutting Design Value = 0.25Total Rutting Design Limit = 0.50
Figure 3.7 Predicted Pavement Rutting - 55 mph Design Speed IRI
0
25
50
75
100
125
150
175
200
225
250
275
300
0 5 10 15 20 25 30 35 40 45 50
Pavement Age (year)
IRI (
in/m
i)
IRI IRI at Reliability Design Limit
Figure 3.8 Predicted Pavement Roughness - 55 mph Design Speed
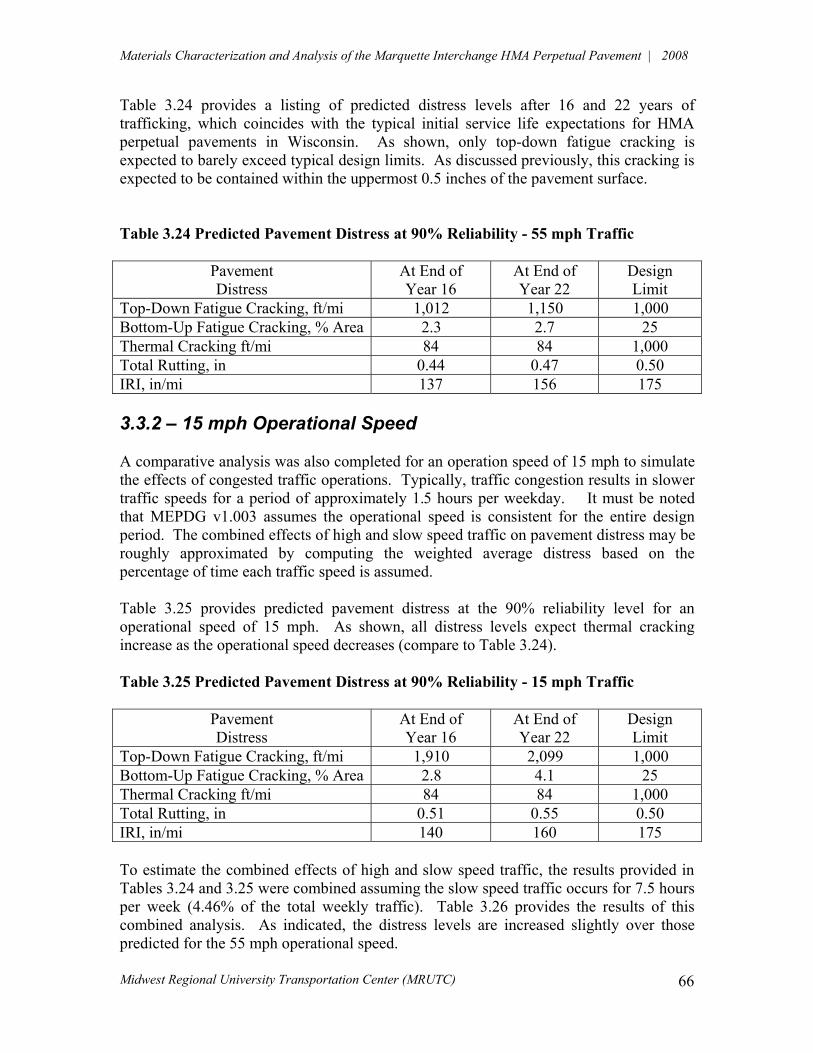
Materials Characterization and Analysis of the Marquette Interchange HMA Perpetual Pavement | 2008
Midwest Regional University Transportation Center (MRUTC)
66
Table 3.24 provides a listing of predicted distress levels after 16 and 22 years of trafficking, which coincides with the typical initial service life expectations for HMA perpetual pavements in Wisconsin. As shown, only top-down fatigue cracking is expected to barely exceed typical design limits. As discussed previously, this cracking is expected to be contained within the uppermost 0.5 inches of the pavement surface. Table 3.24 Predicted Pavement Distress at 90% Reliability - 55 mph Traffic
Pavement Distress
At End of Year 16
At End of Year 22
Design Limit
Top-Down Fatigue Cracking, ft/mi 1,012 1,150 1,000 Bottom-Up Fatigue Cracking, % Area 2.3 2.7 25 Thermal Cracking ft/mi 84 84 1,000 Total Rutting, in 0.44 0.47 0.50 IRI, in/mi 137 156 175 3.3.2 – 15 mph Operational Speed A comparative analysis was also completed for an operation speed of 15 mph to simulate the effects of congested traffic operations. Typically, traffic congestion results in slower traffic speeds for a period of approximately 1.5 hours per weekday. It must be noted that MEPDG v1.003 assumes the operational speed is consistent for the entire design period. The combined effects of high and slow speed traffic on pavement distress may be roughly approximated by computing the weighted average distress based on the percentage of time each traffic speed is assumed. Table 3.25 provides predicted pavement distress at the 90% reliability level for an operational speed of 15 mph. As shown, all distress levels expect thermal cracking increase as the operational speed decreases (compare to Table 3.24). Table 3.25 Predicted Pavement Distress at 90% Reliability - 15 mph Traffic
Pavement Distress
At End of Year 16
At End of Year 22
Design Limit
Top-Down Fatigue Cracking, ft/mi 1,910 2,099 1,000 Bottom-Up Fatigue Cracking, % Area 2.8 4.1 25 Thermal Cracking ft/mi 84 84 1,000 Total Rutting, in 0.51 0.55 0.50 IRI, in/mi 140 160 175 To estimate the combined effects of high and slow speed traffic, the results provided in Tables 3.24 and 3.25 were combined assuming the slow speed traffic occurs for 7.5 hours per week (4.46% of the total weekly traffic). Table 3.26 provides the results of this combined analysis. As indicated, the distress levels are increased slightly over those predicted for the 55 mph operational speed.

Materials Characterization and Analysis of the Marquette Interchange HMA Perpetual Pavement | 2008
Midwest Regional University Transportation Center (MRUTC)
67
Table 3.26 Predicted Pavement Distress at 90% Reliability - Combined Traffic
Pavement Distress
At End of Year 16
At End of Year 22
Design Limit
Top-Down Fatigue Cracking, ft/mi 1,058 1,199 1,000 Bottom-Up Fatigue Cracking, % Area 2.3 2.8 25 Thermal Cracking ft/mi 84.5 84.5 1,000 Total Rutting, in 0.45 0.48 0.50 IRI, in/mi 138 157 175 3.4 KENLAYER Pavement Analysis A comparative analysis of predicted levels of bottom-up fatigue cracking was completed using the KENPAVE software. KENPAVE includes the KENLAYER computer program which is suitable for the analysis of flexible pavements with no joints or rigid surface layers. KENLAYER allows the pavement to be modeled as a stress-dependent multilayer system and provides detailed outputs of stress, strain and deflection under single or multiple circular wheel loadings. A fatigue damage analysis can me made by dividing each year into a maximum of twelve periods (months), each with a unique set of layer material properties in response to environmental changes in moisture and/or temperature. Load-induced strains were used to compute the fatigue consumption in each period, and then summed to estimate the yearly fatigue damage. In general applications, the time to a fatigue damage level of 1.00 is determined as the expected service life of the pavement. KENLAYER allows for the pavement structure to be modeled with a maximum of 19 distinct layers. For this analysis, the HMA perpetual pavement was modeled as a 9-layer system, as shown in Figure 3.9, with both linear elastic and nonlinear elastic (stress-dependent) material layers. Twelve design periods were utilized to simulate year-round pavement conditions. Single wheel and dual tandem wheel loadings of varying magnitude and speed were utilized to simulate the loading spectra. Maximum load-induced tensile strains were computed for each combination of loading and design period and used to estimate the resulting fatigue damage.
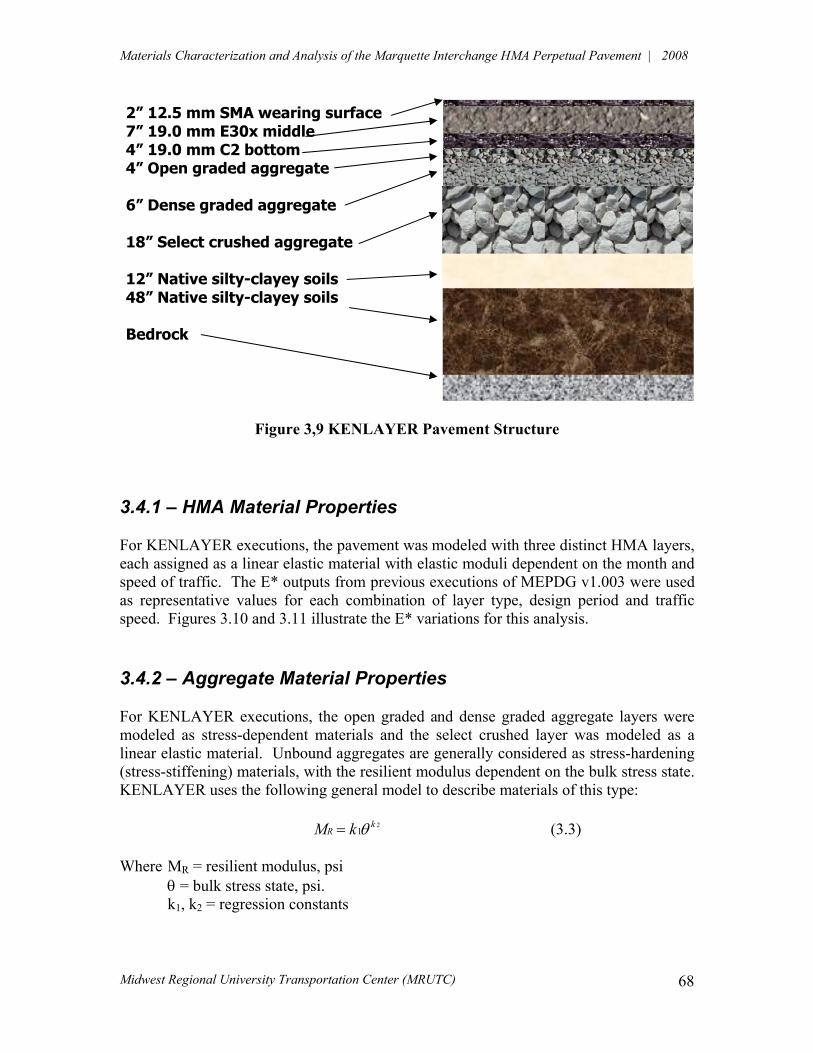
Materials Characterization and Analysis of the Marquette Interchange HMA Perpetual Pavement | 2008
Midwest Regional University Transportation Center (MRUTC)
68
Figure 3,9 KENLAYER Pavement Structure 3.4.1 – HMA Material Properties For KENLAYER executions, the pavement was modeled with three distinct HMA layers, each assigned as a linear elastic material with elastic moduli dependent on the month and speed of traffic. The E* outputs from previous executions of MEPDG v1.003 were used as representative values for each combination of layer type, design period and traffic speed. Figures 3.10 and 3.11 illustrate the E* variations for this analysis. 3.4.2 – Aggregate Material Properties For KENLAYER executions, the open graded and dense graded aggregate layers were modeled as stress-dependent materials and the select crushed layer was modeled as a linear elastic material. Unbound aggregates are generally considered as stress-hardening (stress-stiffening) materials, with the resilient modulus dependent on the bulk stress state. KENLAYER uses the following general model to describe materials of this type:
21
kRM k &) (3.3)
Where MR = resilient modulus, psi
& = bulk stress state, psi. k1, k2 = regression constants
2” 12.5 mm SMA wearing surface7” 19.0 mm E30x middle 4” 19.0 mm C2 bottom 4” Open graded aggregate 6” Dense graded aggregate 18” Select crushed aggregate 12” Native silty-clayey soils 48” Native silty-clayey soils Bedrock
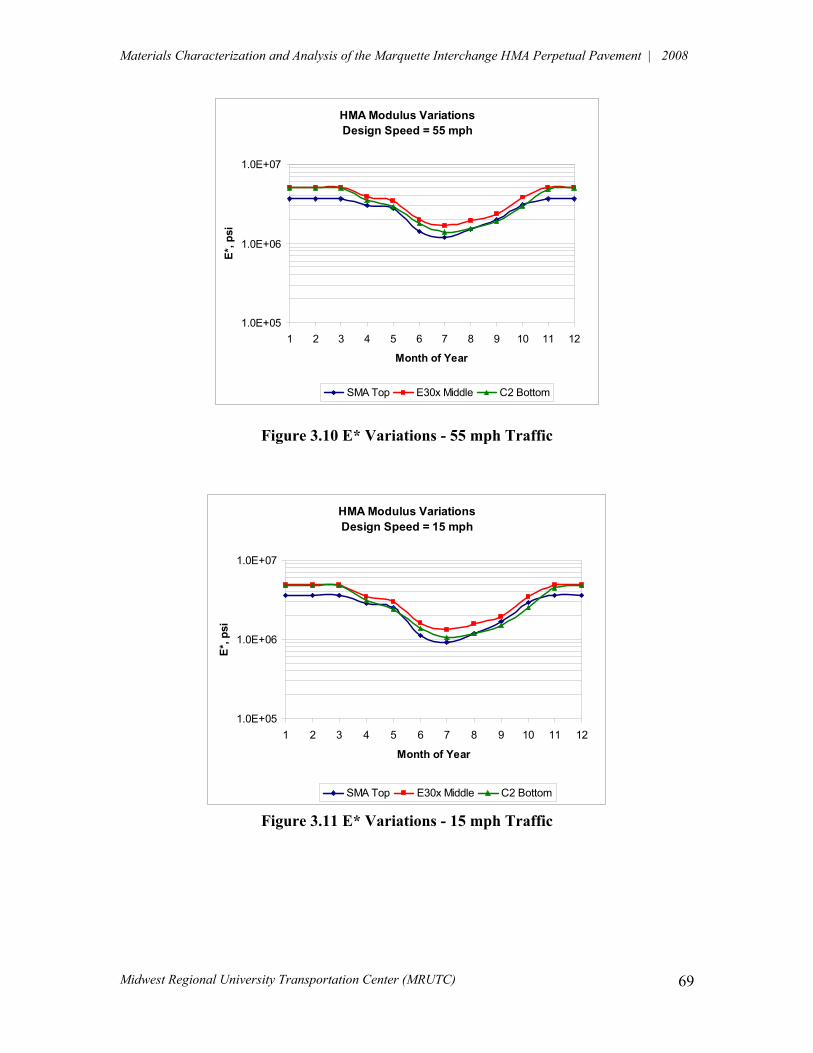
Materials Characterization and Analysis of the Marquette Interchange HMA Perpetual Pavement | 2008
Midwest Regional University Transportation Center (MRUTC)
69
HMA Modulus VariationsDesign Speed = 55 mph
1.0E+05
1.0E+06
1.0E+07
1 2 3 4 5 6 7 8 9 10 11 12
Month of Year
E*, p
si
SMA Top E30x Middle C2 Bottom
HMA Modulus VariationsDesign Speed = 15 mph
1.0E+05
1.0E+06
1.0E+07
1 2 3 4 5 6 7 8 9 10 11 12
Month of Year
E*, p
si
SMA Top E30x Middle C2 Bottom
Figure 3.10 E* Variations - 55 mph Traffic
Figure 3.11 E* Variations - 15 mph Traffic
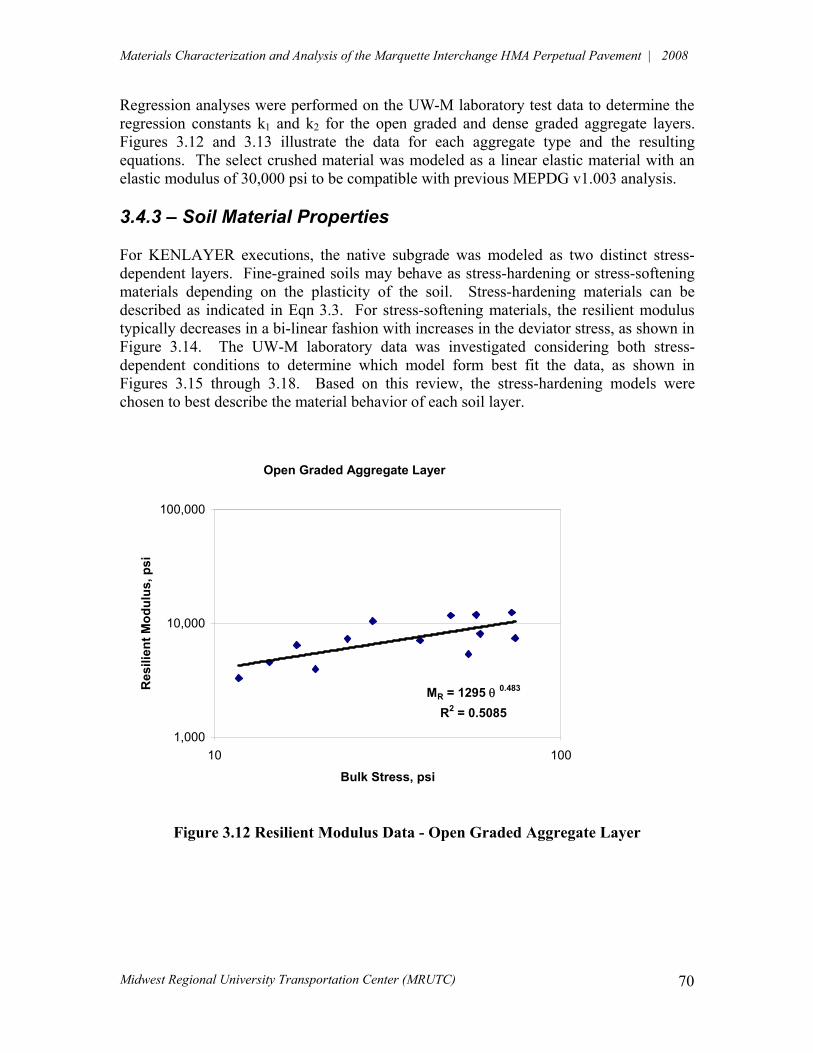
Materials Characterization and Analysis of the Marquette Interchange HMA Perpetual Pavement | 2008
Midwest Regional University Transportation Center (MRUTC)
70
Regression analyses were performed on the UW-M laboratory test data to determine the regression constants k1 and k2 for the open graded and dense graded aggregate layers. Figures 3.12 and 3.13 illustrate the data for each aggregate type and the resulting equations. The select crushed material was modeled as a linear elastic material with an elastic modulus of 30,000 psi to be compatible with previous MEPDG v1.003 analysis. 3.4.3 – Soil Material Properties For KENLAYER executions, the native subgrade was modeled as two distinct stress-dependent layers. Fine-grained soils may behave as stress-hardening or stress-softening materials depending on the plasticity of the soil. Stress-hardening materials can be described as indicated in Eqn 3.3. For stress-softening materials, the resilient modulus typically decreases in a bi-linear fashion with increases in the deviator stress, as shown in Figure 3.14. The UW-M laboratory data was investigated considering both stress-dependent conditions to determine which model form best fit the data, as shown in Figures 3.15 through 3.18. Based on this review, the stress-hardening models were chosen to best describe the material behavior of each soil layer.
Open Graded Aggregate Layer
MR = 1295 & 0.483
R2 = 0.5085
1,000
10,000
100,000
10 100
Bulk Stress, psi
Res
ilien
t Mod
ulus
, psi
Figure 3.12 Resilient Modulus Data - Open Graded Aggregate Layer
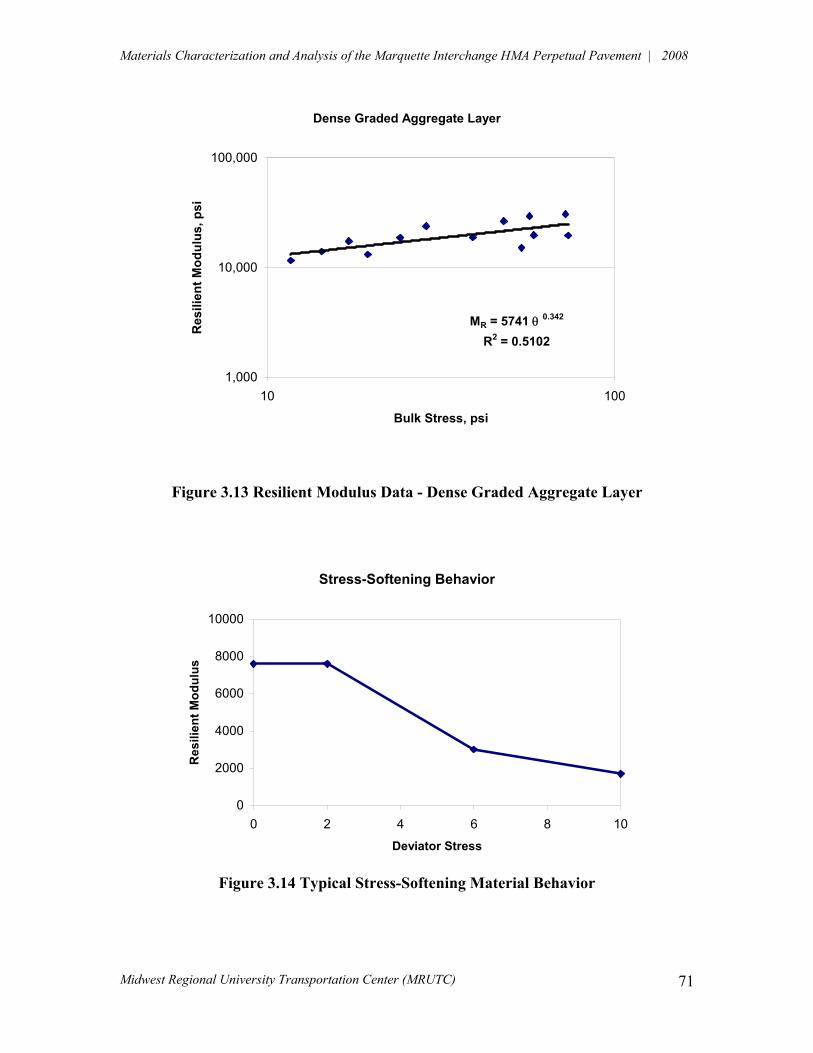
Materials Characterization and Analysis of the Marquette Interchange HMA Perpetual Pavement | 2008
Midwest Regional University Transportation Center (MRUTC)
71
Dense Graded Aggregate Layer
MR = 5741 & 0.342
R2 = 0.5102
1,000
10,000
100,000
10 100
Bulk Stress, psi
Res
ilien
t Mod
ulus
, psi
Figure 3.13 Resilient Modulus Data - Dense Graded Aggregate Layer
Stress-Softening Behavior
0
2000
4000
6000
8000
10000
0 2 4 6 8 10
Deviator Stress
Res
ilien
t Mod
ulus
Figure 3.14 Typical Stress-Softening Material Behavior
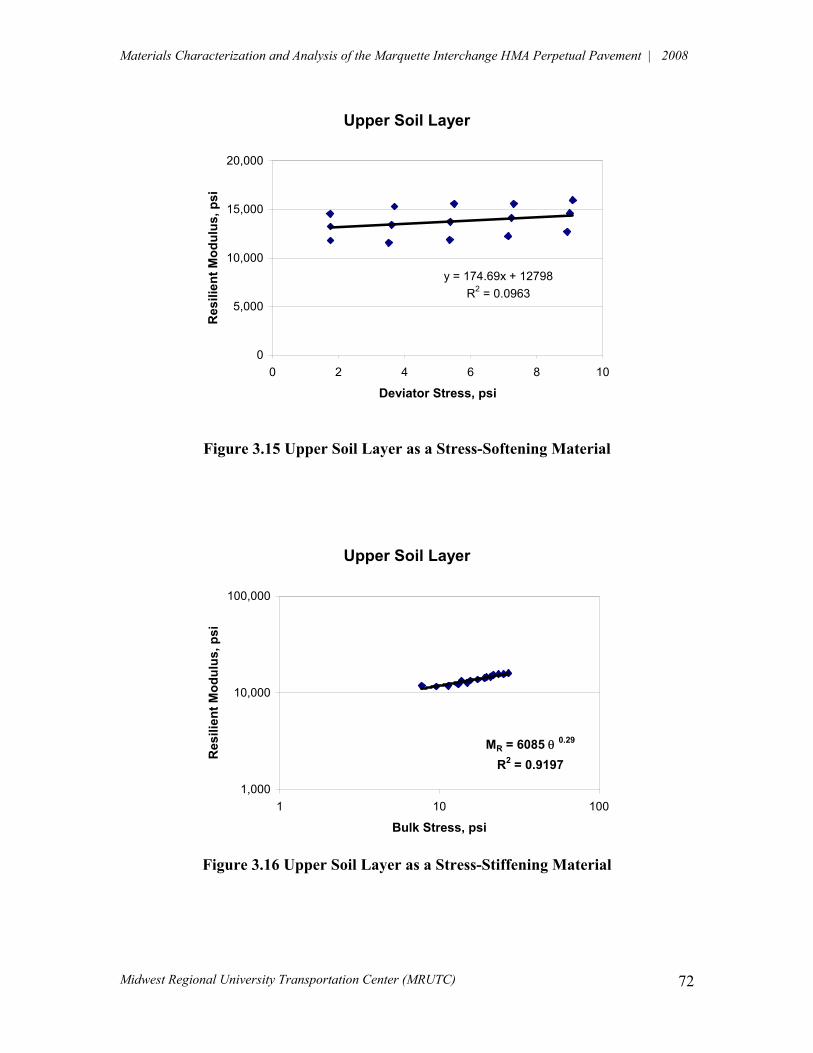
Materials Characterization and Analysis of the Marquette Interchange HMA Perpetual Pavement | 2008
Midwest Regional University Transportation Center (MRUTC)
72
Upper Soil Layer
y = 174.69x + 12798R2 = 0.0963
0
5,000
10,000
15,000
20,000
0 2 4 6 8 10
Deviator Stress, psi
Res
ilien
t Mod
ulus
, psi
Figure 3.15 Upper Soil Layer as a Stress-Softening Material
Upper Soil Layer
MR = 6085 & 0.29
R2 = 0.9197
1,000
10,000
100,000
1 10 100
Bulk Stress, psi
Res
ilien
t Mod
ulus
, psi
Figure 3.16 Upper Soil Layer as a Stress-Stiffening Material
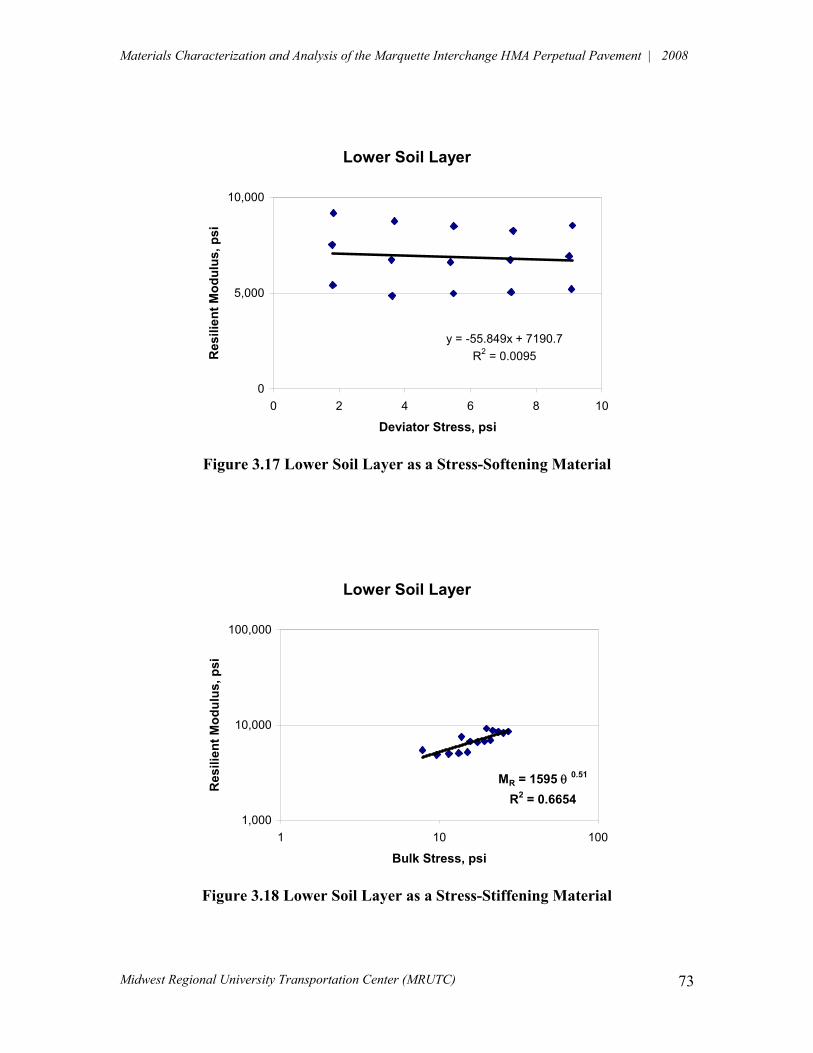
Materials Characterization and Analysis of the Marquette Interchange HMA Perpetual Pavement | 2008
Midwest Regional University Transportation Center (MRUTC)
73
Lower Soil Layer
y = -55.849x + 7190.7R2 = 0.0095
0
5,000
10,000
0 2 4 6 8 10
Deviator Stress, psi
Res
ilien
t Mod
ulus
, psi
Figure 3.17 Lower Soil Layer as a Stress-Softening Material
Lower Soil Layer
MR = 1595 & 0.51
R2 = 0.66541,000
10,000
100,000
1 10 100
Bulk Stress, psi
Res
ilien
t Mod
ulus
, psi
Figure 3.18 Lower Soil Layer as a Stress-Stiffening Material
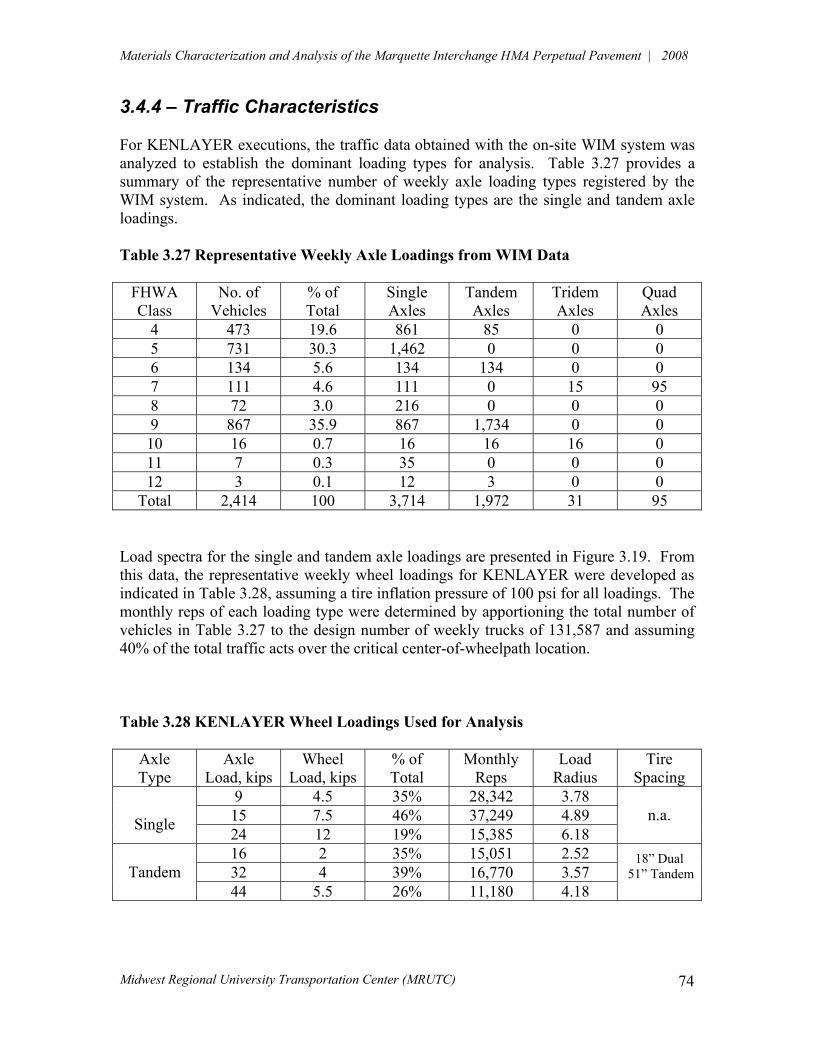
Materials Characterization and Analysis of the Marquette Interchange HMA Perpetual Pavement | 2008
Midwest Regional University Transportation Center (MRUTC)
74
3.4.4 – Traffic Characteristics For KENLAYER executions, the traffic data obtained with the on-site WIM system was analyzed to establish the dominant loading types for analysis. Table 3.27 provides a summary of the representative number of weekly axle loading types registered by the WIM system. As indicated, the dominant loading types are the single and tandem axle loadings. Table 3.27 Representative Weekly Axle Loadings from WIM Data
FHWA Class
No. of Vehicles
% of Total
Single Axles
Tandem Axles
Tridem Axles
Quad Axles
4 473 19.6 861 85 0 0 5 731 30.3 1,462 0 0 0 6 134 5.6 134 134 0 0 7 111 4.6 111 0 15 95 8 72 3.0 216 0 0 0 9 867 35.9 867 1,734 0 0 10 16 0.7 16 16 16 0 11 7 0.3 35 0 0 0 12 3 0.1 12 3 0 0
Total 2,414 100 3,714 1,972 31 95 Load spectra for the single and tandem axle loadings are presented in Figure 3.19. From this data, the representative weekly wheel loadings for KENLAYER were developed as indicated in Table 3.28, assuming a tire inflation pressure of 100 psi for all loadings. The monthly reps of each loading type were determined by apportioning the total number of vehicles in Table 3.27 to the design number of weekly trucks of 131,587 and assuming 40% of the total traffic acts over the critical center-of-wheelpath location. Table 3.28 KENLAYER Wheel Loadings Used for Analysis
Axle Type
Axle Load, kips
Wheel Load, kips
% of Total
Monthly Reps
Load Radius
Tire Spacing
9 4.5 35% 28,342 3.78 15 7.5 46% 37,249 4.89
Single 24 12 19% 15,385 6.18 n.a.
16 2 35% 15,051 2.52 32 4 39% 16,770 3.57
Tandem
44 5.5 26% 11,180 4.18
18” Dual 51” Tandem
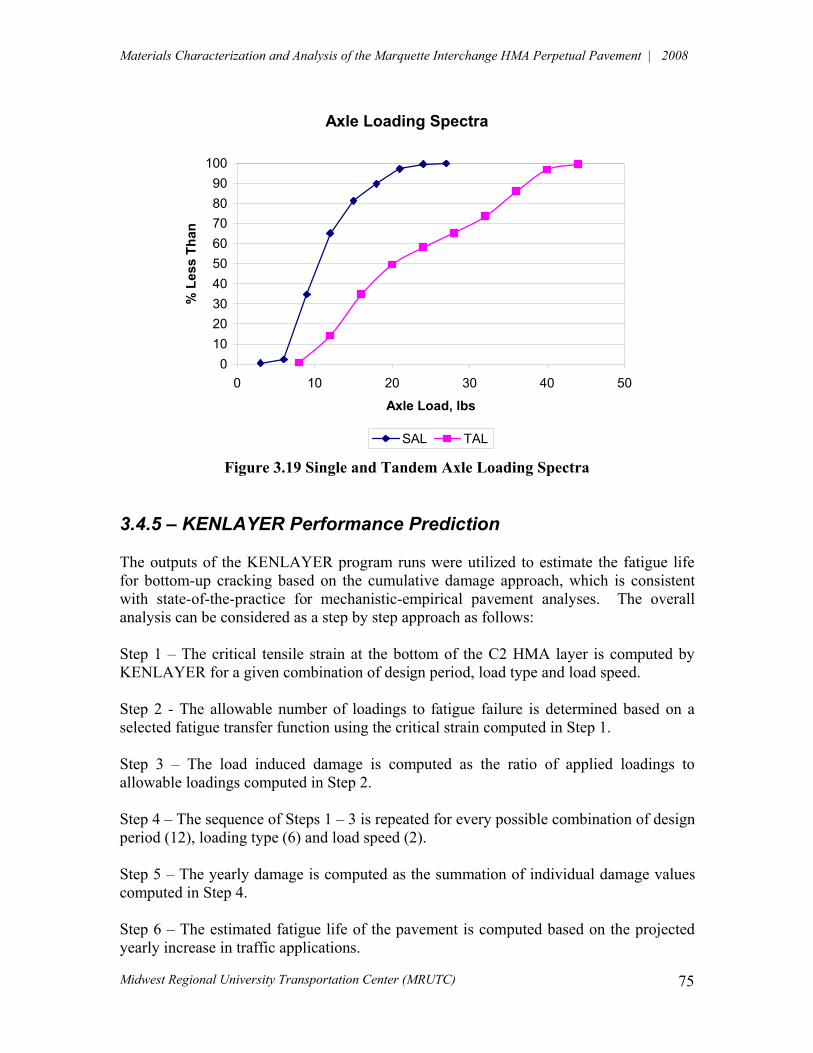
Materials Characterization and Analysis of the Marquette Interchange HMA Perpetual Pavement | 2008
Midwest Regional University Transportation Center (MRUTC)
75
Axle Loading Spectra
0102030405060708090
100
0 10 20 30 40 50
Axle Load, lbs
% L
ess
Than
SAL TAL
Figure 3.19 Single and Tandem Axle Loading Spectra 3.4.5 – KENLAYER Performance Prediction The outputs of the KENLAYER program runs were utilized to estimate the fatigue life for bottom-up cracking based on the cumulative damage approach, which is consistent with state-of-the-practice for mechanistic-empirical pavement analyses. The overall analysis can be considered as a step by step approach as follows: Step 1 – The critical tensile strain at the bottom of the C2 HMA layer is computed by KENLAYER for a given combination of design period, load type and load speed. Step 2 - The allowable number of loadings to fatigue failure is determined based on a selected fatigue transfer function using the critical strain computed in Step 1. Step 3 – The load induced damage is computed as the ratio of applied loadings to allowable loadings computed in Step 2. Step 4 – The sequence of Steps 1 – 3 is repeated for every possible combination of design period (12), loading type (6) and load speed (2). Step 5 – The yearly damage is computed as the summation of individual damage values computed in Step 4. Step 6 – The estimated fatigue life of the pavement is computed based on the projected yearly increase in traffic applications.
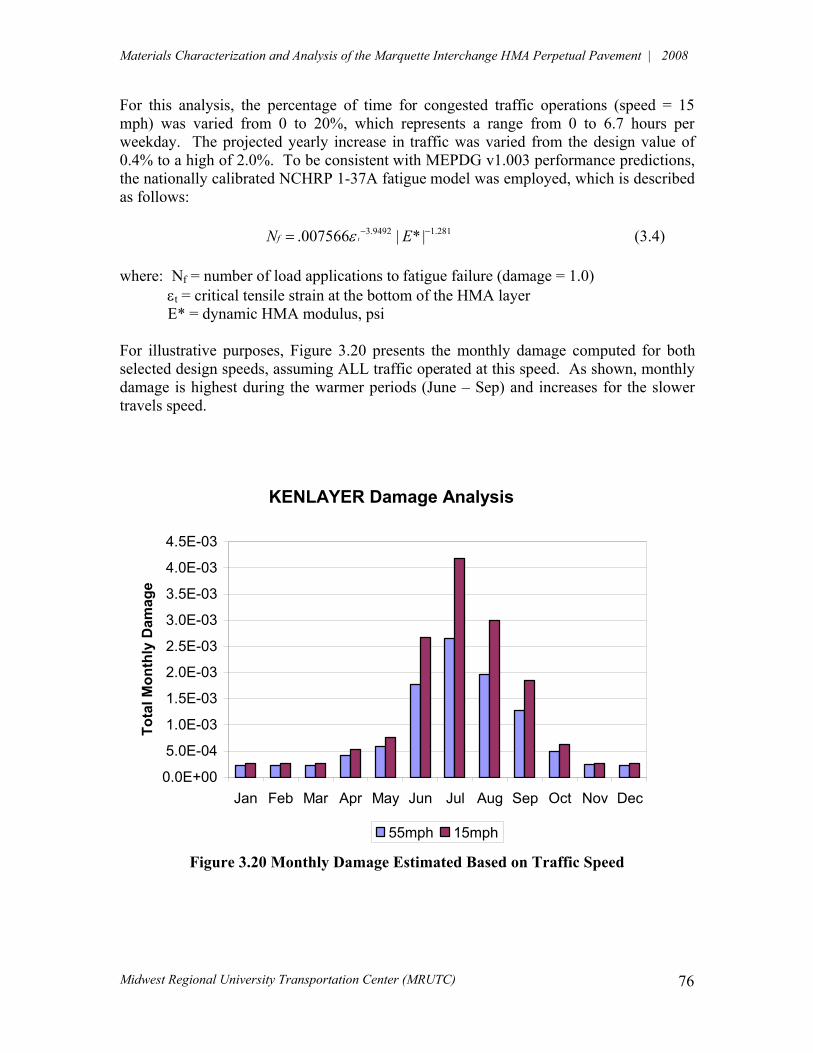
Materials Characterization and Analysis of the Marquette Interchange HMA Perpetual Pavement | 2008
Midwest Regional University Transportation Center (MRUTC)
76
For this analysis, the percentage of time for congested traffic operations (speed = 15 mph) was varied from 0 to 20%, which represents a range from 0 to 6.7 hours per weekday. The projected yearly increase in traffic was varied from the design value of 0.4% to a high of 2.0%. To be consistent with MEPDG v1.003 performance predictions, the nationally calibrated NCHRP 1-37A fatigue model was employed, which is described as follows:
3.9492 1.281.007566 | * |tfN E$ / /) (3.4) where: Nf = number of load applications to fatigue failure (damage = 1.0) % $t = critical tensile strain at the bottom of the HMA layer
E* = dynamic HMA modulus, psi
For illustrative purposes, Figure 3.20 presents the monthly damage computed for both selected design speeds, assuming ALL traffic operated at this speed. As shown, monthly damage is highest during the warmer periods (June – Sep) and increases for the slower travels speed.
KENLAYER Damage Analysis
0.0E+00
5.0E-04
1.0E-03
1.5E-03
2.0E-03
2.5E-03
3.0E-03
3.5E-03
4.0E-03
4.5E-03
Jan Feb Mar Apr May Jun Jul Aug Sep Oct Nov Dec
Tota
l Mon
thly
Dam
age
55mph 15mph
Figure 3.20 Monthly Damage Estimated Based on Traffic Speed
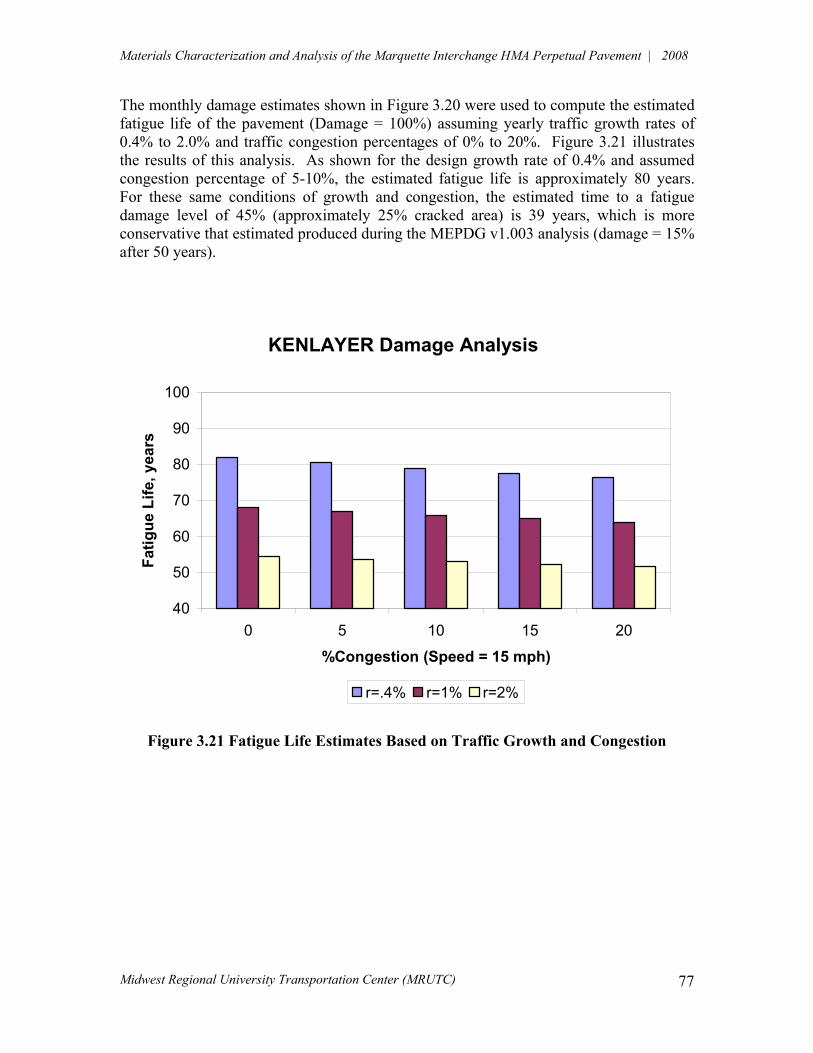
Materials Characterization and Analysis of the Marquette Interchange HMA Perpetual Pavement | 2008
Midwest Regional University Transportation Center (MRUTC)
77
The monthly damage estimates shown in Figure 3.20 were used to compute the estimated fatigue life of the pavement (Damage = 100%) assuming yearly traffic growth rates of 0.4% to 2.0% and traffic congestion percentages of 0% to 20%. Figure 3.21 illustrates the results of this analysis. As shown for the design growth rate of 0.4% and assumed congestion percentage of 5-10%, the estimated fatigue life is approximately 80 years. For these same conditions of growth and congestion, the estimated time to a fatigue damage level of 45% (approximately 25% cracked area) is 39 years, which is more conservative that estimated produced during the MEPDG v1.003 analysis (damage = 15% after 50 years).
KENLAYER Damage Analysis
40
50
60
70
80
90
100
0 5 10 15 20
%Congestion (Speed = 15 mph)
Fatig
ue L
ife, y
ears
r=.4% r=1% r=2%
Figure 3.21 Fatigue Life Estimates Based on Traffic Growth and Congestion
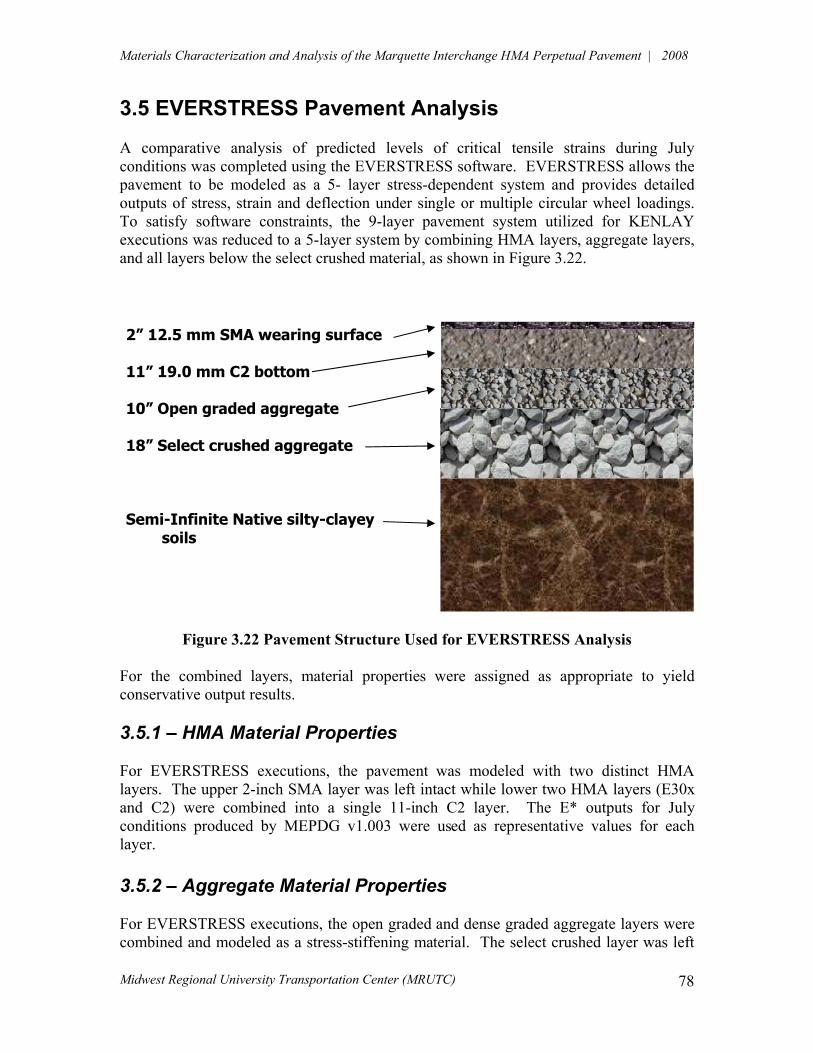
Materials Characterization and Analysis of the Marquette Interchange HMA Perpetual Pavement | 2008
Midwest Regional University Transportation Center (MRUTC)
78
3.5 EVERSTRESS Pavement Analysis A comparative analysis of predicted levels of critical tensile strains during July conditions was completed using the EVERSTRESS software. EVERSTRESS allows the pavement to be modeled as a 5- layer stress-dependent system and provides detailed outputs of stress, strain and deflection under single or multiple circular wheel loadings. To satisfy software constraints, the 9-layer pavement system utilized for KENLAY executions was reduced to a 5-layer system by combining HMA layers, aggregate layers, and all layers below the select crushed material, as shown in Figure 3.22.
Figure 3.22 Pavement Structure Used for EVERSTRESS Analysis For the combined layers, material properties were assigned as appropriate to yield conservative output results. 3.5.1 – HMA Material Properties For EVERSTRESS executions, the pavement was modeled with two distinct HMA layers. The upper 2-inch SMA layer was left intact while lower two HMA layers (E30x and C2) were combined into a single 11-inch C2 layer. The E* outputs for July conditions produced by MEPDG v1.003 were used as representative values for each layer. 3.5.2 – Aggregate Material Properties For EVERSTRESS executions, the open graded and dense graded aggregate layers were combined and modeled as a stress-stiffening material. The select crushed layer was left
2” 12.5 mm SMA wearing surface 11” 19.0 mm C2 bottom 10” Open graded aggregate 18” Select crushed aggregate Semi-Infinite Native silty-clayey
soils
Materials Characterization and Analysis of the Marquette Interchange HMA Perpetual Pavement | 2008
Midwest Regional University Transportation Center (MRUTC)
79
intact and modeled as a linear elastic material (E = 30ksi). EVERSTRESS uses the following general model to describe stress-stiffening materials:
2
1
k
Ra
M kP&8 9) : ;
< = (3.5)
Where MR = resilient modulus, psi
& = bulk stress state, psi Pa = atmospheric pressure, psi k1, k2 = regression constants
For this analysis, properties of the open graded layer were utilized, producing the following relation:
0.483
4,746Ra
MP&8 9) : ;
< = (3.6)
3.5.3 – Soil Material Properties For EVERSTRESS executions, the native subgrade was modeled as a single stress-stiffening layer with properties of the upper soil layer used for the KENLAYER analysis, producing the following relation:
0.29
13,231Ra
MP&8 9) : ;
< = (3.7)
3.5.4 – Traffic Characteristics For EVERSTRESS executions, the single and tandem axle loadings were modeled exactly as utilized for the KENLAYER analysis.

Materials Characterization and Analysis of the Marquette Interchange HMA Perpetual Pavement | 2008
Midwest Regional University Transportation Center (MRUTC)
80
3.5.5 – EVERSTRESS Critical Strain Comparison The critical load-induced tensile strains at the bottom of the C2 HMA layer computed by EVERSTRESS were compared to those values produced by KENLAYER to determine if reasonable agreement was achieved, as illustrated in Figure 3.23. As shown, the critical strains computed by both programs are in close agreement, providing an independent verification of the previously described KENLAYER results.
Critical Strain ComparisonJuly Condiditons
0
10
20
30
40
50
60
SAL1 SAL2 SAL3 TAL1 TAL2 TAL3
Tens
ile S
trai
n x1
0-6
KENLAYER EVERSTRESS
Figure 3.23 Critical Strain Comparison
Materials Characterization and Analysis of the Marquette Interchange HMA Perpetual Pavement | 2008
Midwest Regional University Transportation Center (MRUTC)
81
CHAPTER 4.0 SUMMARY & RECOMMENDATIONS
4.1 Summary This report presents the results of laboratory testing and mechanistic-empirical analyses completed for the Hot Mix Asphalt (HMA) perpetual pavement constructed within the North leg of the Marquette Interchange project. This project serves as a supplement to Wisconsin Highway Research Program (WHRP) Study 0092-06-01 Perpetual Pavement Instrumentation for the Marquette Interchange Project. The HMA perpetual pavement structure is located in a heavily trafficked urban corridor and was designed and constructed to provide a service life in excess of 48 years before reconstruction may be required. As part of the life cycle of this pavement, rehabilitation operations including a mill and relay of the SMA surface layer may occur at intervals of approximately 16 and 32 years after initial construction. These rehabilitation operations are expected to take place during night-time lane closures, resulting in minimal disruptions to normal traffic flows. The laboratory testing completed at UW-Milwaukee and Iowa State University using paving materials obtained during construction. This lab testing provided valuable data to characterize the HMA, unbound aggregate and unbound soil pavement layers. This data was used to develop Level 1 HMA inputs to the current version of the Mechanistic-Empirical Pavement Design Guide (MEPDG v1.003) and to better characterize the unbound aggregates and soils during Level 3 analysis. At the time of this report, Level 1 analysis of unbound aggregates and soils is not recommended for MEPDG v1.003. Weigh-In-Motion (WIM) data obtained as part of WHRP Project 0092-06-01 was analyzed to develop site-specific inputs for the heavy axle loading spectra. Pavement performance predictions were developed using the MEPDG v1.003 and stand-alone KENPAVE software. For both analyses, the baseline material properties determined via laboratory testing were used to estimate monthly variations in response to changes in environmental conditions (i.e., temperature, moisture). Critical pavement stresses and strains resulting from applied traffic loadings were used to develop estimates of accumulated cracking, rutting and roughness over time. Consideration was given to both free flow (55 mph) and congested (15 mph) traffic conditions. Using a combined traffic approach, pavement distress at the 90% reliability level were projected after 16 and 22 years of trafficking as follows:
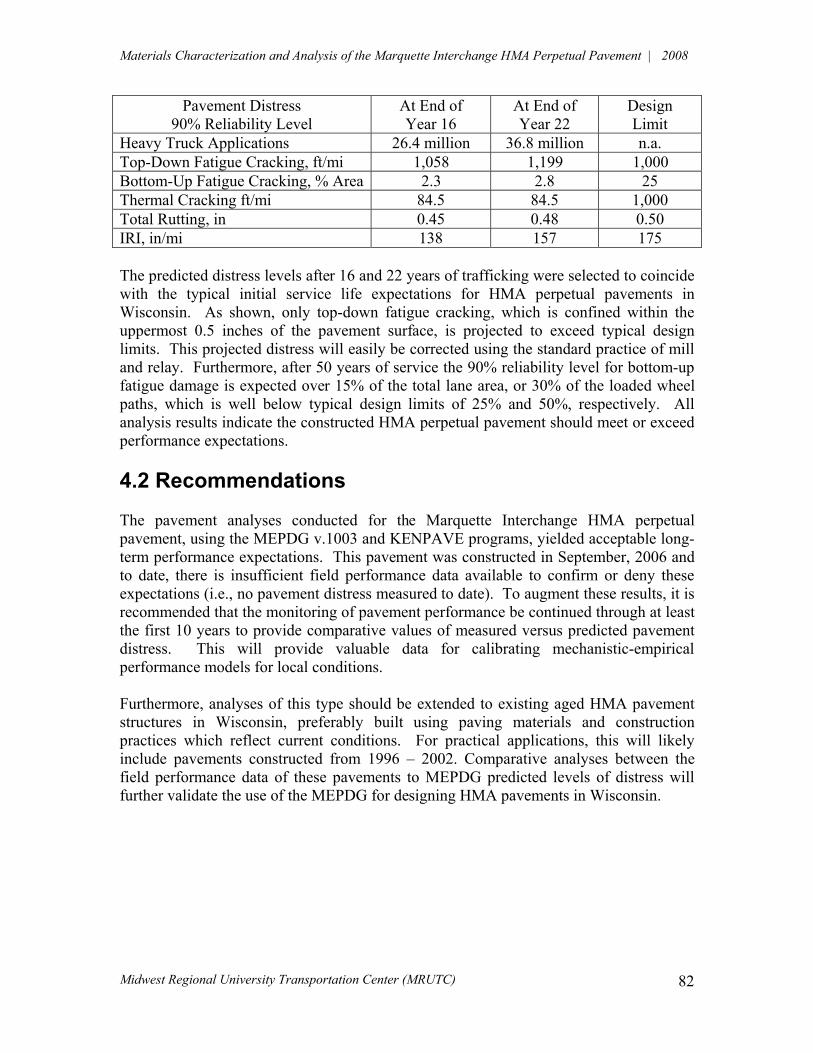
Materials Characterization and Analysis of the Marquette Interchange HMA Perpetual Pavement | 2008
Midwest Regional University Transportation Center (MRUTC)
82
Pavement Distress 90% Reliability Level
At End of Year 16
At End of Year 22
Design Limit
Heavy Truck Applications 26.4 million 36.8 million n.a. Top-Down Fatigue Cracking, ft/mi 1,058 1,199 1,000 Bottom-Up Fatigue Cracking, % Area 2.3 2.8 25 Thermal Cracking ft/mi 84.5 84.5 1,000 Total Rutting, in 0.45 0.48 0.50 IRI, in/mi 138 157 175 The predicted distress levels after 16 and 22 years of trafficking were selected to coincide with the typical initial service life expectations for HMA perpetual pavements in Wisconsin. As shown, only top-down fatigue cracking, which is confined within the uppermost 0.5 inches of the pavement surface, is projected to exceed typical design limits. This projected distress will easily be corrected using the standard practice of mill and relay. Furthermore, after 50 years of service the 90% reliability level for bottom-up fatigue damage is expected over 15% of the total lane area, or 30% of the loaded wheel paths, which is well below typical design limits of 25% and 50%, respectively. All analysis results indicate the constructed HMA perpetual pavement should meet or exceed performance expectations. 4.2 Recommendations The pavement analyses conducted for the Marquette Interchange HMA perpetual pavement, using the MEPDG v.1003 and KENPAVE programs, yielded acceptable long-term performance expectations. This pavement was constructed in September, 2006 and to date, there is insufficient field performance data available to confirm or deny these expectations (i.e., no pavement distress measured to date). To augment these results, it is recommended that the monitoring of pavement performance be continued through at least the first 10 years to provide comparative values of measured versus predicted pavement distress. This will provide valuable data for calibrating mechanistic-empirical performance models for local conditions. Furthermore, analyses of this type should be extended to existing aged HMA pavement structures in Wisconsin, preferably built using paving materials and construction practices which reflect current conditions. For practical applications, this will likely include pavements constructed from 1996 – 2002. Comparative analyses between the field performance data of these pavements to MEPDG predicted levels of distress will further validate the use of the MEPDG for designing HMA pavements in Wisconsin.