materials and the environment solution manual for exercises
TRANSCRIPT

Eco text: solution manual 0 MFA, 23/01/2009
Materials and the Environment
Solution manual for exercises
Solutions to exercise: Page
Chapter 1 2
Chapter 2 4
Chapter 3 12
Chapter 4 16
Chapter 5 20
Chapter 6 24
Chapter 7 30
Chapter 8 41
Chapter 9 53
Chapter 10 66
Chapter 11 69

Eco text: solution manual 1 MFA, 23/01/2009

Eco text: solution manual 2 MFA, 23/01/2009
Chapter 1 E 1.1. Use Google to research the history and uses of one of the following materials:
Tin
Glass
Cement
Bakelite
Titanium
Carbon fiber
Present the result as a short report of about 100 - 200 words (roughly half a page). Imagine that you
are preparing it for school children. Who used it first? Why? What is exciting about the material? Do
we now depend on it, or could we, with no loss of engineering performance or great increase in cost,
live without it?
Specimen answer: tin. Tin (symbol Sn), a silver-white metal, has a long history. It was traded in the
civilizations of the Mediterranean as early as 1500 BC (the Old Testament of the Christian bible
contains many references to it). Its importance at that time lay in its ability to harden copper to give
bronze (copper containing about 10% tin), the key material for weapons, tools and statuary of the
Bronze age (1500 BC – 500 BC). Today tin is still used to make bronze, for solders and as a corrosion
resistant coating on steel sheet (“tin plate” ) for food and drink containers – a “tinnie”, to an Australian,
is a can of beer. Plate glass is made by floating molten glass on a bed of liquid tin (the Pilkington
process). Thin deposits of tin compounds on glass give transparent, electrically conducting coatings
used for frost-free windshields and for panel lighting.
Most of the applications of tin could be filled by other materials – polymer coatings for food
containers, aluminum instead of tin to make bronzes, indium for transparent coatings (though at an
increased cost). Finding a replacement for tin in solders is more difficult.
E 1.2. There is international agreement that it is desirable (essential, in the view of some) to reduce
global energy consumption. Producing materials from ores and feedstocks requires energy (its
“embodied energy”). The table lists the energy per kg and the annual consumption of five materials of
engineering. If consumption of each could be reduced by 10%, which material offers the greatest
global energy saving? Which the least?
Material Embodied energy
MJ/kg
Annual global
consumption (tonnes/yr)
Annual energy
commitment (MJ)
Steels 29 1.1 x 10⁹ 3.2 x 10¹⁰
Aluminum alloys 200 3.2 x 10⁷ 6.4 x 10⁹
Polyethylene 80 6.8 x 10⁷ 5.4 x 10⁹
Concrete 1.2 1.5 x 10¹⁰ 1.8 x 10¹⁰
Device-grade silicon Approximately 2000 5 x 10³ 1.0 x 10⁷
Answer. An additional column has been added to the table above: it shows the annual energy
commitment associated with the production of each material (the product of the numbers in the two
columns to its left). Reducing consumption of steel and of concrete – by more efficient design of
structures perhaps – have by far the greatest potential for global energy saving. Doing the same for
device grade silicon has the least, by a large factor. Although the embodied energies of materials differ
considerably, it is the much greater differences in annual consumption that dominate the total energy
Eco text: solution manual 3 MFA, 23/01/2009
commitment and the carbon burden they generate. This is one reason that much of the discussion of
this book focuses on the materials used in the greatest quantities.
E1.3. The ultimate limits of most resources are difficult to assess precisely, although estimates can be
made. One resource, however, has a well-defined limit: that of usable land. The surface area of Earth
is 511 million square km, or 5.11 x 10¹⁰
hectares (a hectare is 0.01 sq. km.) Only a fraction of this is
land, and only part of that land, is useful; the best estimate is that 1.1 x 10¹⁰
hectares of Earth’s surface
is biologically productive. Industrial countries require 6+ hectares of biologically productive land per
head of population to support current levels of consumption. The current (2008) global population is
close to 6.7 billion (6.7 x 10⁹). What conclusions can you draw from these facts?
Answer. The current biologically productive area per person is 1.1 x 10¹⁰
/ 6.7 x 109 = 1.64
hectares/person, less than 1/3 of that currently needed to support a person in a developed country. Thus
a large fraction of the world’s population can never reach the same level of consumption currently
enjoyed by developed countries unless the global population declines, or new forms of intensive
agriculture, perhaps based on genetically modified crops and animals, enable a dramatic increase
(factor 3) in the productivity of the areas of the earth’s surface that are biologically productive.
Eco text: solution manual 4 MFA, 23/01/2009
Chapter 2
E2.1 Explain the distinction between reserves and the resource base.
Answer. A mineral reserve is defined as that part of a known mineral deposit that can be extracted
legally and economically at the time it is determined. Reserves are an economic construct, which grow
and shrink under varying economic, technical and legal conditions. Improved extraction technology
can enlarge it, but environmental legislation or changing political climate may make it shrink. Demand
stimulates prospecting, with the consequence that reserves tend to grow in line with consumption.
The resource base (or just resource) of a mineral is the real total, and it is much larger
than the reserve but much less certain. It includes not only the current reserves but also all
usable deposits that might be revealed by future prospecting and that, by various extrapolation
techniques, can be estimated. It includes, too, known and unknown deposits that cannot be mined
profitably now but which – due to higher prices, better technology or improved transportation – may
become available in the future.
The answer should include a sketch of the diagram illustrating reserves and resources is
(Figure 2.10 of the book).
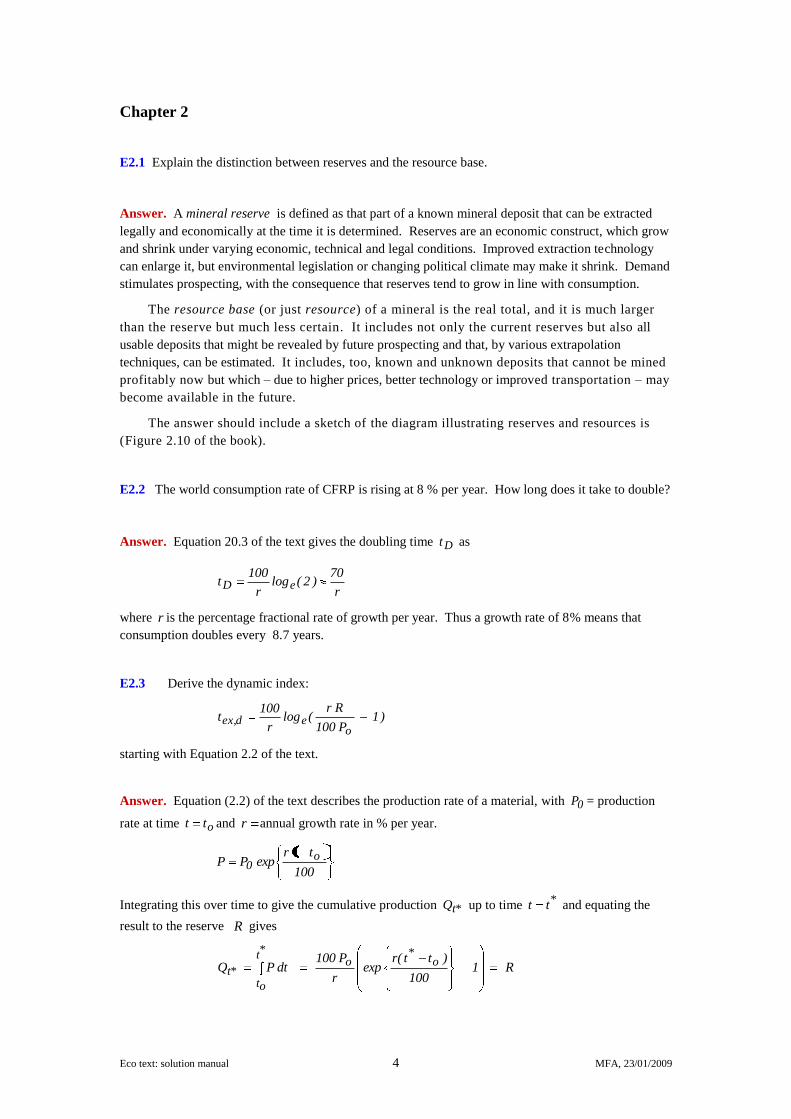
E2.2 The world consumption rate of CFRP is rising at 8 % per year. How long does it take to double?
Answer. Equation 20.3 of the text gives the doubling time Dt as
r
70)2(log
r
100t eD
where r is the percentage fractional rate of growth per year. Thus a growth rate of 8% means that
consumption doubles every 8.7 years.
E2.3 Derive the dynamic index:
)1P100
Rr(log
r
100t
oed,ex
starting with Equation 2.2 of the text.
Answer. Equation (2.2) of the text describes the production rate of a material, with 0P = production
rate at time ott and r annual growth rate in % per year.
100
ttrexpPP o
0
Integrating this over time to give the cumulative production *tQ up to time *tt and equating the
result to the reserve R gives
R1100
)tt(rexp
r
P100dtPQ o
*o
*t
ot*t

Eco text: solution manual 5 MFA, 23/01/2009
Solving for the time interval ( o* tt ) gives the desired result
)1P100
Rr(log
r
100tt*t
oed,exo
E2.4 A total of 5 million cars were sold in China in 2007; in 2008 the sale was 6.6 million. What is the
annual growth rate, expressed as % per year? If there were 15 million cars already on Chinese roads by
the end of 2007 and this growth rate continues, how many cars will there be in 2020, assuming that the
number that are removed from the roads in this time interval can be neglected?
Answer. Starting with equation (2.2)
100
ttrexpPP o
0
we enter 610x6.6P and 6o 10x5P and the time interval ott = 1 year, and solve for r . The
result is r 27.8% per year.
The cumulative number of cars entering use in the subsequent 13 years is found from the integral
of this equation over time
1100
)tt(rexp
r
P100dtPQ o
*o
*t
ot*t
Entering 6o 10x5P (the number 2007), r 27.8% per year and 13t*t o gives the additional
number of cars by 2020 at 6*t 10x650Q . To this (if we are picky) we must add the number already
there in 2007, giving a final total of 610x655 , larger than the number in 2007 by a factor of 100.
(This colossal number is still only equivalent to 1 car per 3-person family, less than the current car
ownership per family in the US,)
E2.5 Prove the statement made in the text that, “At a global growth rate of just 3% per year, we will
mine, process, and dispose of more „stuff‟ in the next 25 years than in the entire 300 years since the start
of the Industrial Revolution.”.
.
Answer. Exponential growth has a number of alarming features, among them, the doubling time both
of consumption and of the total quantity consumed. The consumption rate C of a resource grows by
follows the law
C = C0 exp r (t – t0) (1)
here C0 is the consumption rate when t = t0. The doubling time for the consumption rate is tDC, meaning
that the rate will have doubled to 2C0 in the time tD = t – t0. It is calculated by equating C in equation 1
to 2C0.
2C0 = C0 exp (r tD) giving tD = 21
nr
the quantity 2n = 0.69, so that, at a growth rate of 3% per year ( )03.0r , consumption doubles in 23
years.

Eco text: solution manual 6 MFA, 23/01/2009
We are interested here not in the consumption rate but in the total quantity, Q, consumed since
consumption began. It is the integral of C over time.
Q = dτtτrCCdτ oo )(expt0
t0
giving Q = )exp()exp ooo trt-(trr
C (2)
Q0 is the total amount consumed prior to the present day (when t = t0), thus,
Q0 = )exp(1 oo trr
C (3)
We want the time tQ (the time to double the total quantity consumed) where tQ = t – t0 is the time from
the present day that Q = 2 Q0, i.e. when (from equations 2 and 3)
)exp(1)exp(texp Q oo
oo tr
r
C2trr
r
C
solving for tQ gives
exp (r tQ) = 2 – exp (– r t0)
Now note that if t0 = 100 years (meaning that consumption started 100 years ago) and r = 3% per year
(0.03), then exp (- r t0 ) = 0.05. If t0 = 1000 years, it is roughly 10-13
. Compared with 2 both numbers
are negligible. Thus, the result for the doubling time of consumption is the same as that for
consumption rate, namely.
tQ = 21
nr
(The underlying reason both tD and tQ are the same is simply that xx ee dx )
That means that the total quantity of a given resource that will be consumed in the next 23 years
(given the modest rate of growth of consumption of 3%/year) is equal to the total quantity consumed
over the history of industrial development. Not a happy thought.
E2.6 Understanding reserves: copper. The following table lists the world production and reported
reserves of copper over the last 20 years.
Year Price
(US$/kg)
World production
(million tonnes/yr)
Reserves
(million tonnes)
Reserves/World
production (yrs)
Growth rate
(%/yr)
1995 2.93 9.8 310 31.6
1996 2.25 10.7 310 29.0 8.8
1997 2.27 11.3 320 28.3 5.5
1998 1.65 12.2 340 27.9 7.7
1999 1.56 12.6 340 27.0 3.2
2000 1.81 13.2 340 25.8 4.7
2001 1.67 13.7 340 24.8 3.7
2002 1.59 13.4 440 32.8 -2.2
2003 1.78 13.9 470 33.8 3.7
2004 2.86 14.6 470 32.2 4.9
2005 3.7 14.9 470 31.5 2.0
2006 6.81 15.3 480 31.4 2.6
Examine trends (plot price, production, and reserves against time): what do you conclude?
Tabulate the reserves/world production to give the static index of exhaustion. What does the
result suggest about reserves?

Eco text: solution manual 7 MFA, 23/01/2009
Answer. The figure shows the data. The rates
of growth of production are listed in the last
column of the table above: world production
and reserves have increased steadily over the
12 year period 1995 - 2006. The ratio of
reserves to production (second last column of
the table) is steady at around 30 years. All this
suggests a well-balanced market, with no
indicators of supply problems. Only the price,
which was steady or falling up to 2003 shows a
sudden increase in 2005 / 2006 because of a
surge in demand from China. All the other
indicators suggest that the supply chain is
capable of adapting to meet it.
E2.7 The following table shows the production rate and the reserves of five metals over a period of 10
years. What has been the growth rate of production? What is that of the reserves? What conclusions
can you draw about the criticality of the material?
Metal Year Production rate,
tonnes/year
Reserves,
tonnes
Growth rate
of production
% per year
Growth rate
of reserves
% per year
Platinum 2005
1995
217
145
71 x 103
56 x 103
4.03 2.37
Nickel 2005
1995
1.49 x 10⁶
1.04 x 10⁶
64 x 106
47 x 106
3.6 3.09
Lead 2005
1995
3.27 x 10⁶
2.71 x 10⁶
67 x 106
69 x 106
1.88 1.97
Copper 2005
1995
15.0 x 10⁶
10.0x 10⁶
480 x 106
310 x 106
4.05 4.37
Cobalt 2005
1995
57.5 x 10³
22.1 x 10³
7 x 10⁶
4 x 10⁶
9.56 5.60
Answer. The last two columns of the table above show the growth rates, calculated from equation 2.2
of the text
100
ttrexpPP o
o which, on inversion, gives oo P
Pln
tt
100r
Inserting the 2005 value of production or reserves for P , the 1995 value for oP and ott = 10
years gives the average growth rate over the 10 year interval.
For two of the metals – lead and copper – the rate of growth of reserves is more or less in balance
with the growth in production. For nickel, reserves lag behind production but not by much. The two
metals that are cause for concern are platinum and cobalt. Both are used for critical functions for
which there is no other easy substitute: platinum for catalysts and cobalt for high temperature alloys.
For both the growth of reserves – meaning the rate at which new, exploitable ore bodies are proven –
lags well behind the rate of production.

Eco text: solution manual 8 MFA, 23/01/2009
E2.8 Tabulate the annual world production in tonnes/year and the densities (kg/m3) of carbon steel,
PE, soft wood, and concrete. (You will find the data in data sheets for these materials in Chapter 12 of
the book; use an average of the ranges given in the data sheets.) Calculate, for each, the annual world
production measured in m3/year. How does the ranking change?
Answer. The first three columns of the table below list data for world production in tonnes/year,
mP ,and density, , in kg/m3, drawn (as averages) from the data sheets of Chapter 12. The last
column lists the world production in m3/year , vP calculated as
mv
P1000P
(The 1000 is to convert the density into tonnes/m3.) Concrete and steel dominated production when
measured in tonnes per year . But for at least two of these materials – softwood and concrete – it is the
volume that is used that is important, not the weight. By this measure wood is second only to concrete
in the quantity used. Wood remains one of the central materials of structural engineering.
Material
World production
tonnes/year
Density
kg/m3
World production
m3/year
Carbon steel 1.15 x 10⁹ 7850 1.46 x 10⁸
Polyethylene 6.85 x 10⁷ 950 7.2 x 10⁷
Softwood 9.65 x 10⁸ 520 1.86 x 10⁹
Concrete 1.53 x 10¹⁰ 2450 6.25 x 10⁹
E2.9 The prices of cobalt, copper, and nickel have fluctuated wildly in the past decade. Those of
aluminum, magnesium, and iron have remained much more stable. Why? Research this topic by
examining uses (is it one of high value-added goods?) and the localization of the producing mines. The
USGS Website listed under Further Reading is a good starting point.
Answer. Take cobalt as an example. A web search (and a search of CES) gives the following
information.
World production of cobalt has increased steadily year-on-year, and has almost trebled from
around 20,000 tonnes in 1995 to 54,000 tonnes in 2005, an average rate of growth at times exceeding
12% per year, far higher than that of most materials. The ores of cobalt are localized in relatively few
countries. Since 2002, the strongest growth in production of cobalt has come in China, where output
grew at over 60% per year in 2005 as a result of expansion by domestic producers. Other recent
increases have come from new projects including Voisey's Bay in Canada (Inco), Coral Bay in the
Philippines (Sumitomo) and Sally Malay in Australia (Sally Malay and Sumitomo).
Cobalt costs about $30/kg – far more than common structural materials. It is used for catalysts;
medical implants, cermets (tungsten carbide – cobalt) cutting tools, alloying of steels, high-
temperature cobalt based superalloys, alloys for high field magnets, and as a pigment in glass and
paints. These are high value-added applications, as you might anticipate from the high price of the
metal.
When the supply chain for metals with unique applications, like cobalt, is unable to meet demand,
the price rises steeply because there are no substitutes. When, by contrast, substitutes are readily
available (plastics substituting for steel or aluminum in many applications, the existence and
availability of the substituted dampens price fluctuations.

Eco text: solution manual 9 MFA, 23/01/2009
E2.10 The production of zinc over the period 1992 – 2006 increased at a rate of 3.1 % per year. The
reserves, over the same period, increased 3.5%. What conclusions about the criticality of zinc supply
can you draw from these figures?
Answer. The symptoms of criticality are
The rate of growth of discovery falls below the rate of growth of production.
The production rate curve peaks and starts to decline
The minimum economic ore grade falls
The price starts to rise sustainable.
We are told in the question that growth in production has been steady – no sign of a flattening out
suggesting a peak in production is near. The growth rate of reserves is comfortably larger than that of
production indicating no shortage of supply. Taken together these indicators point to a market for zinc
that is well balanced.
E2.11 The production of platinum, vital for catalysts and catalytic converters, has risen from 145 to
217 tonnes per year over the last 10 years. The ores are highly localized in South Africa, Russia, and
Canada. The reserves have risen from 56,000 to 71,000 tonnes in the same time interval. Would you
classify platinum as a critical material? Base your judgment on the relative growth rates of production
and reserves, and on the dynamic index (equation 2.6) calculated using 2005 data.
Answer. Platinum has applications for which there is no present substitute. The growth rates of
production and of reserves, calculated as described in the solution to Exercise E2.7, are listed in the
table below. The dynamic index of exploitation, calculated from these data, is 20.9 years.
Year Production rate,
tonnes/year
Reserves, tonnes Growth rate of
production
% per year
Growth rate of
reserves
% per year
Platinum 2005
1995
217
145
71 x 103
56 x 103
4.03 2.37
Those are the facts. What deductions? There are many danger signs here. Sources are localized
and only one is in a country with a long history of economic and political stability. The growth rate of
reserves has, over a 10 year period, lagged behind that of exploitation. The dynamic index – not a
reliable measure, but another indicator none the less – is low when compared with those of most other
metals.
E2.12 Global water consumption has tripled in the last 50 years. What is the growth rate, r %, in
consumption assuming exponential growth? By what factor will water consumption increase between
2008 and 2050?
Answer. Write consumption as
100
ttrexpCC o
o which, on inversion, gives oo C
Cln
tt
100r
The ratio 3C/C o for the time interval 50tt o years, giving year/%2.2r .
If this growth rate continues, the consumption of water will increase over the next 42 years by the
factor

Eco text: solution manual 10 MFA, 23/01/2009
52.2100
ttrexp
C
C o
o
that is, it will more than double. Water supply in many parts of the world is already barely able to meet
demand. It is not clear how this need will be met.
E2.13 Plot the Annual world production of metals against their Price, using mean values from the
data sheets in Chapter 12 of this book. What trend is visible?
Answer. See the answer to Exercise E2.14, in which the annual world production for materials is
plotted against price as a CES exercise. Metals are labeled. The trend described in the solution to
E2.14 appears also when metal data alone areplotted.
Exercises using CES Eco Level 2
E2.14 Use CES to plot the Annual world production of materials against their Price. What trend is
visible?
Answer. The figure shows the plot. There is a correlation – the lower the price, the larger is the
annual production. The contours have a slope -2, which, with log scales (as here) means that, very
approximately,
2icePr
1productionworldAnnual
-2

Eco text: solution manual 11 MFA, 23/01/2009
E2.15 Make a plot of apparent resource life for materials (the reserves in tonnes divided by the annual
production rate in tonnes per year), using the “Advanced” facility in CES to plot the ratio. Which
metals have the longest apparent resource life? Why are these apparent lives not a reliable measure of
the true life of the mineral?
Answer. The figure shows the plot of the static index, created with the CES Eco Level 2. The ores of
magnesium, aluminum and titanium are plentiful and very widely distributed; for these there is no
concern about depletion. Those of nickel, copper, zinc and lead are more localized and already
significantly depleted, with the result that the ore grade currently mined is much leaner than it was 25
years ago.
The static index, however, is not a true indicator of resource life. This is because the reserves are
an economic construct, which grow and shrink under varying economic, technical and legal conditions.
Improved extraction technology can enlarge it, but environmental legislation or changing political
climate may make it shrink. Demand stimulates prospecting, with the consequence that reserves tend
to grow in line with consumption. The figure shows that the reserves of the more critical metals are
typically between 20 to 50 times the annual production. This is a comfort zone. If the reserves fall
below this zone, there is growing incentive to prospect for and develop new mines; if they rise above
it, there is little incentive to do so.

Eco text: solution manual 12 MFA, 23/01/2009
Chapter 3
E3.1 Which phase of life would you expect to be the most energy intensive (in the sense of consuming
fossil fuel) for the following products? Pick one and list the resources and emissions associated with
each phase of its life along the lines of Figure 3.3 (template provided).
Answer. At this stage we can only guess at the energy-intensive phase – later, when we get to eco-
audits, the question can be answered properly. As a general rule, if a product requires energy to
perform the use-phase of its life, then it is the cumulative energy of use that dominates. When the
product does not use energy, it is the material production phase that dominates.
Product Energy intensive life phase
A toaster Probably the use phase
A two car garage The material production phase if garage is unheated; if heated, then the use phase
A bicycle The material production phase of life
A motorbike The use phase
A refrigerator The use phase
A coffee maker Perhaps material production if the coffee maker is rarely used, otherwise use.
A LPG-fired patio heater No need to ask.
Take the coffee maker as an example.
Resources
Oil for polymers
Minerals for metals, glass
Energy for both
Emissions
CO2, NOx, SOx
Slag, tailings
Chemical waste
Low grade heat
Minerals for metals
Energy for both
Resources
Energy: polymer molding
Energy: metal forming
Energy: glass molding
Emissions
Cut-offs (recycled)
Low grade heat
Resources
Water
Paper for filters
Coffee
Energy to heat water
Emissions
Low grade heat
Coffee grounds
Waste filters
Resources
Energy for collection
Energy to disassemble
Energy to recycle
Emissions
Materials (recycled)
Waste to landfill

Eco text: solution manual 13 MFA, 23/01/2009
E3.2 Identify an appropriate functional unit for each of the products listed below. Think of the basic
need the product provides – it is this that determines use – and list what you would choose, thinking of
all from an environmental standpoint.
Answer. The table lists the suggested functional units
Product Functional unit
Washing machines Energy (kW.hr or MJ) or liters of water per kg of clothes washed
Refrigerators Energy (kW.hr or MJ) per m3 of cooled space per year
Home heating systems Energy (kW.hr or MJ) per unit volume of heated space per unit time (per m3 per
year)
Air conditioners Energy (kW.hr or MJ) per unit volume of cooled space per unit time (per m3 per
year)
Lighting Power (Watts) per lumen (the measure of light intensity)
Home coffeemaker Energy (kW.hr or MJ) per cup of coffee
Public transport Energy (kW.hr or MJ) per passenger.mile
Handheld hair dryers Energy (kW.hr or MJ) per drying episode (difficult: long hair takes longer than
short)
E3.3 What is meant by “externalized” costs and costs that are “internalized” in an environmental
context? Now a moment of introspection: list three internalized costs associated with your lifestyle.
Now list three that are externalized. If your life is so pure that you have fewer than three, list some for
the other people you know.
Answer. Many human activities incur costs, some obvious, some hidden. Industrial emissions, in
particular, incur costs though damage to health and property via air and water pollution, acid rain,
ozone layer depletion and climate change. When the damage is local and the creator of the emissions
accepts the responsibility and the cost for containing and remediating it, the environmental cost is said
to be internalized. When the damage not attributable, and particularly when it is global in impact, it is
much more difficult to establish creator-responsibility. In these circumstances the environmental cost
becomes a burden on society as a whole and is said to be externalized. Much current negotiation and
legislation aims to internalize environmental costs that, at present, are externalized.
Internalized
Cost of mobile phone (assuming microwave radiation is harmless)
Cost of use of personal computer
Cost of broadband connection
Cost of private health care
Cost of home ownership
Externalized
Dropping cigarette butts, gum, hamburger wrappers in the street
Disposing of television sets or personal computers by dumping
Travel by plane (the traveler does not yet pay for the eco-damage of the emissions)
Dumping, rather than recycling, nickel-cadmium batteries

Eco text: solution manual 14 MFA, 23/01/2009
E3.4 What, in the context of life-cycle assessment, is meant by “system boundaries”? How are they
set?
Answer. To assess the energy demand, carbon footprint and emissions-profile of a product it is
necessary to sum the contributions it makes to each of these over its entire life cycle. Deciding what to
include and what exclude in the life-cycle (the “system”),however, is not simple. The first step in life-
cycle assessment (LCA) is to decide on the system boundary. The boundary should normally enclose
all four phases of life: material production, product manufacture, product use and product disposal. For
the LCA to meet ISO standards, the LCA expert must define and state what aspects of each phase of
life are included within the system boundary and which aspects remain outside it.
It is sometimes desirable to conduct a partial LCA, setting the system boundary around only one
phase of life. Thus the embodied energy and carbon footprint of a material is found by enclosing only
the material production within the system boundary.
E3.5 Describe briefly the steps prescribed by the ISO 14040 Standard to guide life-cycle assessment
of products.
Answer. The four steps in conducting an LCA, elaborated in the ISO 14040 set of standards, are:
Setting goals and scope. Why do the assessment? What is the subject and which bit(s) of its life
are to be assessed (setting system boundaries)?
Inventory compilation: what resources are consumed, what emissions excreted?
Impact assessment: what do these do to the environment – particularly, what bad things?
Interpretation: what do the results mean and how are they to be used?
E3.6 What are the difficulties with a full LCA? Why would a simpler, if approximate, technique be
helpful?
Answer.
A full LCA is a time-consuming task requiring days or weeks of experts‟ time, and thus is
expensive.
Despite the formalism that attaches to LCA methods, the results are subject to considerable
uncertainty.
The output of an LCA that meets the ISO 14040 Standard is complex and detailed – it is of
little help for design.
A simpler, approximate approach would, by reducing the cost and speeding the process, allow much
wider application.
E3.7 Pick two of the products listed in Exercise E.3.1 and, using your judgment, attempt to fill out the
simplified streamlined LCA matrix to give an environmentally responsible product rating. Make your
own assumptions (and report them) about where the product was made and thus how far it has to be
transported, and whether it will be recycled. Assign an integer between 0 (highest impact) and 4 (least
impact) to each box and then sum to give an environmental rating, providing a comparison. Try the
protocol.

Eco text: solution manual 15 MFA, 23/01/2009
Material. Is it energy-intensive? Does it create excessive emissions? Is it difficult or
impossible to recycle? Is the material toxic? If the answer to these questions is yes, score
4. If the reverse, score 0. Use the intermediate integers for other combinations.
Manufacture. Is the process one that uses much energy? Is it wasteful (meaning cut-offs
and rejects are high)? Does it produce toxic or hazardous waste? Does it make use of
volatile organic solvents? If yes, score 4. If no, score 0, etc.
Transport. Is the product manufactured far from its ultimate market? Is it shipped by air
freight? If yes, score 4. If no, score 0.
Use. Does the product use energy during its life? Is the energy derived from fossil fuels?
Are any emissions toxic? Is it possible to provide the use-function in a less energy-
intensive way? Scoring as above.
Disposal. Will the product be sent to land-fill at end of life? Does disposal involve toxic or
long-lived residues? Scoring as above.
What difficulties did you have? Do you feel confident that the results are meaningful?
Answer. Example: the toaster.
A toaster uses about 1 kg of materials, largely metals. Manufacture, almost certainly in South
Asia, requires only simple processes, though chromium plating is a particularly toxic process. Most
toasters used in the US and Europe are made in South-east Asia, so considerable transport is involved.
A toaster consumes electrical energy during use, most of which at present derives from fossil fuels,
with associated emissions. The toaster itself produces no emissions (unless you burn the toast) and is
simple to recycle at end of life. The figure shows an attempt to fill out the matrix, based on this
information.
It is not all easy to fill out the matrix with confidence unless you have considerable experience of
assessing products in this way – the rankings chosen here are, quite frankly, guesses. This is just one
example of the matrix approach – there are many variants of the row and column categories. Some are
better adapted for particular products than others, but it is evident that any one of them requires a
degree of experience. The present attempt (correctly) identifies the use and the transport phase
(assuming the product is shipped over large distances) as the most damaging . The final total, 34 out of
a possible maximum of 80 suggests the product is not a particularly harmful one.

Eco text: solution manual 16 MFA, 23/01/2009
Chapter 4
E4.1 Many products are thrown away and enter the waste stream, even though they still work. What
are the reasons for this?
Answer. A product reaches the end of its life when it‟s no longer valued, even though it may still
work well The life expectancy is the least of
The physical life, meaning the time in which the product breaks down beyond economic
repair;
The functional life, meaning the time when the need for it ceases to exist;
The technical life, meaning the time at which advances in technology have made the product
unacceptably obsolete;
The economical life, meaning the time at which advances in design and technology offer the
same functionality at significantly lower operating cost;
The legal life – the time at which new standards, directives, legislation or restrictions make the
use of the product illegal
And finally the loss of desirability – the time at which changes in taste, fashion, or aesthetic
preference render the product unattractive.
E4.2 Do you think manufacture without waste is possible? “Waste”, here, includes waste heat,
emissions, and solid and liquid residues that cannot be put to a useful purpose. If not, why not?
Answer. All manufacture involves conversion: conversion of ores and feedstock into raw materials,
conversion of raw materials into products, the use of the products and their ultimate disposal. All of
these steps involve energy, sometimes in its primary form as oil or gas, but more usually in a converted
form as electricity or mechanical power.
All conversions involve conversion efficiencies. Some conversion efficiencies are high –
conversion of electric to mechanical power, for instance, can be achieved with an efficiency of 90% .
Others, for fundamental thermodynamic reasons, are not – the conversion of fossil fuels to electric
power is, at best, only 45% efficient. The losses, small or large, constitute one sort of waste – waste
heat – and, if fossil fuels are involved, another: waste emissions.
Just as there are conversion efficiencies for energy, there are conversion efficiencies for the
transformation of materials during manufacture, and for the recovery of materials at end of life. Some
are economic in origin – salvaging and sorting 100% of the scrap produced during manufacture is not
economic, though salvaging 90% might be. Recovering materials at end of life has lower efficiencies
because the dispersion of materials in products makes full recovery uneconomic, and because
contamination of one material by another cannot, in some products, be prevented. All these factors
combine to make some waste unavoidable.
E4.3 What options are available for coping with the waste stream generated by modern industrial
society?
Answer. Materials have a life-cycle. They are extracted and refined, manufactured into products,
used, and at end of first life, rejected as “waste”. But what is waste to some markets is a resource to
others, creating a number of alternative channels down which the materials continue to flow. The
sketch of Figure 4.1 of the text introduced the options: commit to landfill, combust for heat recovery,
recycle (or downcycle), re-engineer (refurbish or recondition) and reuse.

Eco text: solution manual 17 MFA, 23/01/2009
E4.4 Recycling has the attraction of returning materials into the use stream. What are the obstacles to
recycling?
Answer. The recycling market is like any other, with prices that fluctuate according to the balance of
supply and demand. In a free market the materials that are recycled are those from which a profit can
be made. Recycling requires energy, and this energy carries its burden of emissions. The recycle
energy is generally small compared to the initial embodied energy, making recycling – when it is
possible at all – an energy-efficient propositions. But there are difficulties.
Recycling may not be cost-efficient; that depends on the degree to which the material has
become dispersed. In-house scrap, generated at the point of production or manufacture is
localized and is already recycled efficiently (near 100% recovery). Widely distributed
“scrap” – material contained in discarded products – is a much more expensive proposition to
collect, separate and clean.
Many materials cannot recycled, although they may still be reused in a lower-grade activity;
continuous-fiber composites, for instance, cannot be re-separated economically into fiber and
polymer in order to reuse them, though they can be chopped and used as fillers.
Most materials require an input of virgin material to avoid build-up of uncontrollable
impurities. Thus the fraction of a material production that can ultimately re-enter the use-
stream depends on the material itself, on the product into which has been incorporated and on
the price of virgin material with which the recycled material must compete.
E4.5 Car tires create a major waste problem. Use the Internet to research ways in which the materials
contained in car tires can be used, either in the form of the tire or in some decomposition of it.
Answer. The following sites are among many that provide information about used tyres.
1. www.ct.gov/dep/
2. www.defra.gov.uk/environment/waste/topics/tyres.htm
3. www.ni-environment.gov.uk/usedtyresleaflet.pdf
4. www.tyredisposal.co.uk/cms/index.php
The first describes regulations about disposal of tyres, the second lists ways to use them, and the third
provides statistics for collection, reuse and disposal. From them we learn that 3.9 million tons of used
tyres are produced in the US every year, of which 18.7% are recycled.
Tyres do not compost. The main channels for reusing used tyres are:
Retreading almost doubles the life of tyres. Most can only be retreaded once, however.
Rubber crumb is made by shredding tyres. It is used for playground and sports track surfaces.
Whole or part tyres can be used in wall structures for earth retention.
Sea defences can be constructed using floating arrays of tyres
Fuel: used tyres are burnt for heat, particularly in cement making.
E4.6 List three important functions of packaging.

Eco text: solution manual 18 MFA, 23/01/2009
Answer. Packaging performs at least five functions
Protection: packaging extends product life by protecting foodstuffs and controlling the
atmosphere that surrounds them.
Security: tamper-proof packaging protects the consumer.
Information: pack information identifies the product, its sell-by date (if it has one) and gives
instructions for use.
Affiliation: brands are defined by their packaging.
Presentation: packaging “presents” the product in much the same way that clothing presents
the wearer.
E4.7 As a member of a brainstorming group, you are asked to devise ways of reusing polystyrene
foam packaging – the sort that encases TV sets, computers, appliances, and much else when
transported. Use free thinking; no suggestion is too ridiculous.
Answer. The idea here is to encourage free thinking. Here are just a few possible uses
Break up for bean bags.
Drainage for patio garden pots.
Flotation for fish-farm enclosures.
Shred to make artificial snow for theatre productions.
Send to Art schools as raw material for hot-wire sculptures.
Pack in the attic to improve the thermal insulation of your home / garage / outhouse.
E4.8 You are employed to recycle German washing machines, separating the materials for recycling.
You encounter components with the following recycle marks:
How do you interpret them?
Answer. Chapter 4 and its Appendix (Section 4.8) gives the information needed to crack the codes.
(a) Polypropylene. (b) Polyamide 6 (Nylon 6) with 10% glass fiber. (c) Polypropylene with 20% talc.
(d) Polystyrene with 15% glass fines (powdered glass).

Eco text: solution manual 19 MFA, 23/01/2009
E4.9 The metal lead has a number of uses, principally as electrodes in vehicle batteries, in architecture
for roofing and pipe work (particularly on churches), and as pigment for paints. The first two of these
allow recycling; the third does not. Batteries consume 38% of all lead, have an average life of four
years, a growth rate of 4% per year, and the lead they contain is recycled with an efficiency of 80%.
Architectural lead accounts for 16 % of total consumption. The lead on buildings has an average life of
70 years, the same growth rate (4% per year) as batteries, and 95% of it is recycled. What is the
fractional contribution of recycled lead from each source to current supply?
Answer. Inserting these data into equation (4.4) show that lead from batteries contributes a fraction
0.26 that from buildings only 0.009 to current supply. The short life of the batteries means that the lead
they contain makes a much larger contribution to the secondary scrap stream, even though the fraction
recycled is smaller than that of architectural lead.
E4.10 A material M is imported into a country principally to manufacture one family of products with
an average life span of five years and a growth rate of cr % per year. The material is not at present
recycled at end of life, but it could be. The government is concerned that imports should not grow.
What level of recycling is necessary to make this possible?
Answer. Consumption C is growing at a rate cr % per year . Over the life of the product, t , it
grows from oC to
)t100
rexp(CC c
o
an increase of
oc
o C)t100
rexp(CC
For zero growth in imports recycling must feed back into the “Material” phase of life a quantity of
material equal to the growth in consumption over the product life time. This requires a recycle fraction
critf where
oc
oocrit C)t100
rexp(CCCf
Thus
1)t100
rexp(f c
crit
Clearly critf cannot be greater than 1. Thus the scheme will only work if
2)t100
rexp( c
or )2ln(r
100t
c

Eco text: solution manual 20 MFA, 23/01/2009
Chapter 5
E5.1 What is a protocol? What do the Montreal Protocol and the Kyoto Protocol commit the
signatories to do?
Answer. The word “protocol” crops up most frequently in the language of medicine: there it means a
detailed plan, or set of steps, to be followed in a study, an investigation or an intervention. The
meaning of “protocol” in the context of this Chapter is a treaty – an agreement under international
law entered into by the actors, namely states and international organizations.
The Montreal Protocol of 1987 commits the nations that signed it to phase out the use of
chemicals that deplete ozone in the stratosphere.
The Kyoto Protocol of 1998 commits the nations that signed it to reduce the emissions of
gases that, through the greenhouse effect, cause climate change.
E5.2 What is meant by internalized and externalized environmental costs? If a company is required to
“internalize its previous externalities,” what does it mean?
Answer. When environmental damage can be attributed to an particular industry or activity that
accepts both the responsibility and the expense of containing and remediating it, the environmental
cost is said to be internalized. When the damage is not attributable, the environmental cost becomes a
burden on society as a whole and is said to be externalized.
Much current negotiation and legislation aims to internalize environmental costs that, at present, are
externalized (the “Polluter pays” policy). This can take the form of outright bans, fines, penalties or
taxes, all of which require a mechanism to insure compliance, and many of which are unpopular. The
alternative is to use market forces to initiate change, through trading schemes, subsidies and other
incentives to make environmental protection economically attractive.
E5.3. What is the difference between command and control methods and the use of economic
instruments to protect the environment?
Answer. Command and control environmental legislation makes it illegal to use specific resources or
allow specific emissions – examples are bans on dumping of toxic waste, the use of lead in petrol, the
release of certain chemicals that pollute water or those that damage the ozone layer. There is a growing
recognition that this can lead to perverse effects where action to fix one isolated problem just shifts the
burden elsewhere and may even increase it. For this reason there has been a shift from command and
control legislation towards the use of economic instruments – green taxes, subsidies, trading schemes –
that seek to use market forces to encourage the efficient use of materials and energy. Instead of
outright bans, economic instruments seek to target environmental burdens that have costs that are not
paid for by the provider or user (externalized costs), transferring the costs back to the activity creating
it, thereby internalising them.
E5.4 How does emissions trading work?
Answer. Emissions trading is a market-based scheme that allows participants to buy and sell permits
for emissions, or credits for reduction in emissions in certain pollutants. Taking carbon as an example,
the regulator first decides on a total acceptable emissions level and divides this into tradable units

Eco text: solution manual 21 MFA, 23/01/2009
called permits. These are allocated to the participants, based on their actual carbon emissions at a
chosen point in time. The actual carbon emissions of any one participant change with time, falling if
they develop more efficient production technology or rising if they increase capacity. A company that
emits more than its allocated allowances must purchase allowances from the market, while a company
that emits less than its allocations can sell its surplus. The buyer is paying a charge for polluting while
the seller is rewarded for having reduced emissions.
Emissions trading has another dimension – that of off-setting carbon release by buying credits in
activities that absorb or sequester carbon or that replace the use of fossil fuels by energy sources that
are carbon-free: tree planting, solar, wind or wave power for example. By purchasing sufficient credits
the generator of CO2 can claim to be “carbon neutral”.
E5.5. Carbon trading sounds like the perfect control mechanism to enable emissions reduction. But
nothing in this world is perfect. Use the Internet to research the imperfections in the system and report
your findings.
Answer. The criticisms of Carbon trading and offsetting are as follows.
It provides an excuse for enterprises to continue to pollute as before by buying credits and
passing the cost on to the consumer.
The scheme only achieves it aim if the mitigating project runs for its planned life, and this is
often very long. Trees, for instance, have to grow for 50 to 80 years to capture the carbon
with which they are credited – fell them sooner for quick profit and the off-set has not been
achieved. Wind turbines and wave power, similarly, achieved their claimed offset only at the
end of their design life, typically 20 to 25 years.
It is hard to verify that the credit payments actually reach the mitigating projects – the tree-
planters or wind turbine builders – for which they were sold; too much of it gets absorbed in
administrative costs.
E5.6. What are the merits and difficulties associated with (a) taxation and (b) trading schemes as
economic instruments to control pollution?
Answer.
Historically, environmental legislation has targeted individual, obvious problems – dumping of toxic
waste, lead in petrol, water pollution, ozone depletion – taking a command and control approach based
on outright bans, fines, penalties or direct taxes. There is a growing recognition that this can lead to
perverse effects where action to fix one isolated problem just shifts the burden elsewhere and may even
increase it.
Trading schemes and other economic instruments – green taxes, subsidies, carbon credits – seek to use
market forces to encourage the efficient use of materials and energy. The motive is to transfer
externalized costs back to the activity creating them. The difficulties are those of ensuring that the
trading schemes function as a well-balanced market and are not distorted by high administrative costs
or misuse.
Eco text: solution manual 22 MFA, 23/01/2009
E5.7. Your neighbor with a large 4 x 4 boasts that his car, despite its size, is carbon-neutral. What on
earth does he mean (or does he think he means)?
Answer. He means that he, or the company from which he bought the vehicle, has purchased carbon
reduction certificates equal to the expected carbon emission of the vehicle. He thinks he means that
these pay for projects that absorb carbon (like tree planting) or replace carbon-using energy sources
with those that do not, but it is not always easy to verify how much of the payment reaches the project
and how much is absorbed in administrative costs on the way.
E5.8. In December 2007 Saab posted advertisements urging consumers to “switch to carbon neutral
motoring,” claiming that “every Saab is green.” In a press release the company said it planned to plant
17 native trees for each car purchased. The company claimed that its purchase of offsets for each car
sold made Saab the first car brand to make its entire range carbon-free.
What is misleading about this statement? (The company has since withdrawn it.)
Answer. The scheme only achieves it aim if the mitigating project runs for its planned life, and this is
often very long. Trees, for instance, have to grow for 50 to 80 years to capture the carbon with which
they are credited – fell them sooner for quick profit and the off-set has not been achieved. Wind
turbines and wave power, similarly, achieved their claimed offset only at the end of their design life,
typically 25 years. Even Saabs only last for 15 years, so the mitigation claimed for them is not even
half-achieved by the time the vehicle dies.
E5.9. What tools are available to help companies meet the VOC regulations? Carry out a Web search
to find out and report your findings.
Answer. Numerous sites offer advice, help and new disposal methods for dealing with volatile organic
compounds. Among them are
1. en.wikipedia.org/wiki/Volatile_organic_compound
2. www.parish-supply.com/volatile_organic_compounds.htm
3. www.processingtalk.com
4. www.coatings.org.uk/
5. http://www.epd.gov.hk/epd
From them we learn that VOCs (volatile organic compounds) are found in wide variety of
everyday products such as solvent-based paints, printing inks, many consumer products, organic
solvents and petroleum products. The US, the European Union, Australia and New Zealand all are in
progress of introducing labelling, restrictions on use, and a ban on sales without permit to limit the
release of VOCs into the atmosphere. At present most sites focus on explaining the regulation; a few
offer technical solutions for dealing with VOCs to render them harmless (generally by controlled
combustion).

Eco text: solution manual 23 MFA, 23/01/2009
E5.10. What tools are available to help companies meet the EuP regulations? Carry out a Web search
to find out and report your findings.
Answer. Numerous sites report, offer advice and consultancy on the EuP Directive. Among them are:
1. www.infoworld.com/article/06/10/31/45OPreality_1.html
2. www.ee.sgs.com/eup_compliance_eup_ee
3. www.synapsistech.com/solutions/compliance/eup.html
4. www.era.co.uk/Services/ecodesign.asp
From these we learn the following
The Directive. The EuP Directive will require manufacturers to calculate the energy used to
produce, transport, sell, use, and dispose of almost every one of its products. It will require
that the manufacturer go all the way back to the energy used when extracting the raw materials
to make its product, including all subassemblies and components. And in time, it will set
limits on a product-by-product basis of how much energy can be used in a product‟s entire
lifecycle (Source (1), above).
EuP compliance in brief. Manufacturers can choose to perform the conformity assessment
either by ecological product profiles or within a management system like ISO 14001 or
EMAS. Companies will be required to produce a document file for each of their products and
should therefore start by collecting data on the mentioned environmental aspects in the
different life cycle phases (Source (2)).
Services and tools to help with EuP compliance. A number of web sites (Source (3) is an
example) offer in-house training and planning assistance to help companies set up procedures
to comply with the Directive. Others (e.g. Source (4) go further, offering to design and put it
place compliance procedures. It appears that many organizations with environmental
knowledge are seeking to capture what maybe a large market in establishing procedures that
are practical and affordable, but none have yet emerged as clear market leader.

Eco text: solution manual 24 MFA, 23/01/2009
Chapter 6
E 6.1. What is meant by embodied energy per kilogram of a metal? Why does it differ from the free
energy of formation of the oxide, carbonate, or sulfide from the elements that make it up?
Answer. The embodied energy of a metal is the output of an energy audit of the resources and
processes need to extract, refine or synthesize it. Energy is consumed in mining or extracting the ores
and feedstock, concentrating the ore and reducing it to metal, all with energy losses. To convert an
oxide, sulfide, or carbonate ore to metal, the free energy of formation of those compounds must, of
course, be provided. The embodied energy includes this, but it also includes the energy to mine,
transport and concentrate the ore, and the energy “loss” that results from the inefficiencies of the
processes.
E 6.2 What is meant by the process energy per kilogram for casting a metal? Why does it differ
from the latent heat of melting of the metal?
Answer. In order to cast a metal, energy must be provided to heat the metal to its melting point, to
melt it (requiring the latent heat of melting) and to raise the temperature of the liquid a little higher to
ensure that, when cast, it does not solidify before it has filled the mold. The kiln itself has to be heated
to the same temperature, requiring additional energy. The heat itself is provided by the combustion of
fossil fuel (efficiency about 70%) or by electric heating (oil-equivalent efficiency about 40%). The
thermal energy of both kiln and metal is lost as low-grade heat when the casting cools to room
temperature. The casting energy is the sum of all the energies involved.
E 6.3 Make a bar chart of CO2 footprint divided by embodied energy using data from the data sheets
of Chapter 12. Which material has the highest ratio? Why?
Answer. The Figure shows the important features. For most materials the ratio is about0.04 - 0.06.
For cement and concrete it is far higher. This is because, making cement (a component of concrete)
involves “calcining” calcium carbonate, driving off carbon dioxide to leave lime. This CO2
contribution adds to that derived from the fuel that is used to heat the kiln to give the high total.

Eco text: solution manual 25 MFA, 23/01/2009
E 6.4 The embodied energies and CO2 footprints for woods, plywood, and paper do not include a
credit for the energy and carbon stored in the wood itself, for the reasons explained in the text.
Recalculate these, crediting them with sequestering carbon by subtracting out the stored contribution
(take it to be 2.8 kg CO2 per kg). Is there a net saving?
Answer. The table lists the embodied energies and carbon footprints for wood, plywood and paper,
taking the means of the ranges shown on the data sheets. The last two columns show the values
adjusted as described in the question. Crediting the materials with storing energy and carbon gives all
of them a negative carbon footprint and all but one (paper) a negative embodied energy. The reasons
we use the “uncorrected” values are explained in the text.
Material Embodied
energy (MJ/kg)
CO2 footprint
(kg/kg)
Embodied energy,
adjusted (MJ/kg)
CO2 footprint,
adjusted (kg/kg)
Wood 7.4 0.43 -17.6 -2.37
Plywood 15 0.75 -10 -2.05
Paper 27 1.44 2 -1.36
E6.5 Rank the three common commodity materials low carbon steel, age-hardening aluminum alloy,
and polyethylene by embodied energy/ kg, and embodied energy/m3, using data drawn from the data
sheets of Chapter 12 (use the means of the ranges given in the databases). Now rank them by
embodied energy per unit strength. What do you learn?
Answer. The table shows the data and the calculated information. Column 2 gives the embodied
energy per kg, mH . Steel has the lowest. Column 5 lists the embodied energy per unit volume, mH
– polyethylene has by far the lowest. The last column is the embodied energy per unit stiffness (note
the inclusion of in the ratio so that top and bottom are both in the same units). Now steel is the
lowest, and by a large margin. If you want a material that is stiff and has low embodied energy, steel is
the best bet.
Material Energy mH
MJ/kg
Density
kg/m3
Modulus E
GPa mH
MJ/m3
E/H m
(Dimensionless)
Low carbon steel 32 7850 207 2.51 x 10⁵ 1.2
Aluminum alloys 220 2700 75 5.94 x 10⁵ 7.9
Polyethylene 81 950 0.74 7.7 x 10⁴ 104
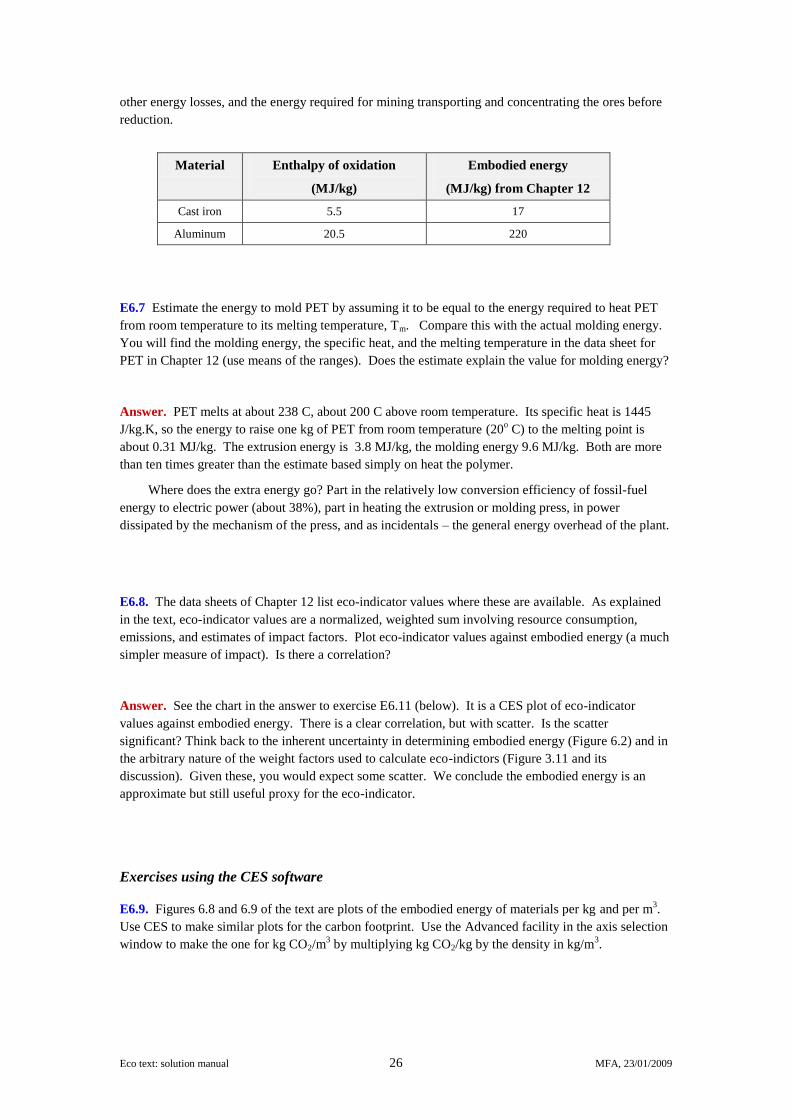
E6.6 Iron is made by the reduction of iron oxide, Fe2O3, with carbon; aluminum by the
electrochemical reduction of Bauxite, basically Al2O3. The enthalpy of oxidation of iron to its oxide is
5.5 MJ/kg, that of aluminum to its oxide is 20.5 MJ/kg. Compare these with the embodied energies of
cast iron and of aluminum, retrieved from the data sheets of Chapter 12 (use means of the ranges given
there). What conclusions do you draw?
Answer. The table shows the data. The embodied energies are larger, by a factor of 3 to 10, than the
enthalpy of oxidation. This is because of the inherent irreversibility of the reduction process, heat and
Eco text: solution manual 26 MFA, 23/01/2009
other energy losses, and the energy required for mining transporting and concentrating the ores before
reduction.
Material Enthalpy of oxidation
(MJ/kg)
Embodied energy
(MJ/kg) from Chapter 12
Cast iron 5.5 17
Aluminum 20.5 220
E6.7 Estimate the energy to mold PET by assuming it to be equal to the energy required to heat PET
from room temperature to its melting temperature, Tm. Compare this with the actual molding energy.
You will find the molding energy, the specific heat, and the melting temperature in the data sheet for
PET in Chapter 12 (use means of the ranges). Does the estimate explain the value for molding energy?
Answer. PET melts at about 238 C, about 200 C above room temperature. Its specific heat is 1445
J/kg.K, so the energy to raise one kg of PET from room temperature (20o C) to the melting point is
about 0.31 MJ/kg. The extrusion energy is 3.8 MJ/kg, the molding energy 9.6 MJ/kg. Both are more
than ten times greater than the estimate based simply on heat the polymer.
Where does the extra energy go? Part in the relatively low conversion efficiency of fossil-fuel
energy to electric power (about 38%), part in heating the extrusion or molding press, in power
dissipated by the mechanism of the press, and as incidentals – the general energy overhead of the plant.
E6.8. The data sheets of Chapter 12 list eco-indicator values where these are available. As explained
in the text, eco-indicator values are a normalized, weighted sum involving resource consumption,
emissions, and estimates of impact factors. Plot eco-indicator values against embodied energy (a much
simpler measure of impact). Is there a correlation?
Answer. See the chart in the answer to exercise E6.11 (below). It is a CES plot of eco-indicator
values against embodied energy. There is a clear correlation, but with scatter. Is the scatter
significant? Think back to the inherent uncertainty in determining embodied energy (Figure 6.2) and in
the arbitrary nature of the weight factors used to calculate eco-indictors (Figure 3.11 and its
discussion). Given these, you would expect some scatter. We conclude the embodied energy is an
approximate but still useful proxy for the eco-indicator.
Exercises using the CES software
E6.9. Figures 6.8 and 6.9 of the text are plots of the embodied energy of materials per kg and per m3.
Use CES to make similar plots for the carbon footprint. Use the Advanced facility in the axis selection
window to make the one for kg CO2/m3 by multiplying kg CO2/kg by the density in kg/m
3.

Eco text: solution manual 27 MFA, 23/01/2009
Answer. The chart is shown below. Not surprisingly, it looks very like the embodied energy per m3,
shown in Figure 6.9 of the text. (The Metals, Polymers, Ceramics and Hybrids are segregated to
separate columns by selecting them for the x-axis using the “Trees” option in the Advanced facility.)
E6.10 Plot a bar chart for the embodied energies of metals and compare it with one for polymers, on a
“per unit yield strength” basis, using CES. You will need to use the Advanced facility in the axis-
selection window to make the function:
Energy per unit strength =
Which materials are attractive by this measure?
Answer. The figure shows the CES output. (The Metals and Polymers are segregated to separate
columns by selecting them for the x-axis using the “Trees” option in the Advanced facility.) Carbon
steels and cast irons have a lower embodied energy per unit of strength – than any other metal or any
polymer.
Embodied energy × Density
Yield Strength

Eco text: solution manual 28 MFA, 23/01/2009
E6.11 Compare the eco-indicator values of materials with their embodied energy per unit volume. To
do so, make a chart with (Embodied energy × Density) on the x axis and Eco-indicator value on the y
axis. (Ignore the data for foams since these have an artificially inflated volume.) Is there a correlation
between the two? Is it linear? Given that the precision of both could be in error by 10 %, are they
significantly different measures? Does this give us a way of estimating, approximately, eco-indicator
values where none are available?
Answer. The plot of eco-indicator values against embodied energy is shown below. There is a clear
correlation, but with some scatter. See the answer to Exercise 6.9 for a commentary on this.
Eco – indicator values

Eco text: solution manual 29 MFA, 23/01/2009
E6.12 Plot material price against annual production. Is there a correlation?
Answer. The plot shows that there is a correlation. The grid of broken lines has a slope of -2, meaning
2)ice(Pr
1productionworldAnnual
It is no surprise that production falls as price rises. The origin of the power of -2 is obscure.
Slope -2

Eco text: solution manual 30 MFA, 23/01/2009
Chapter 7
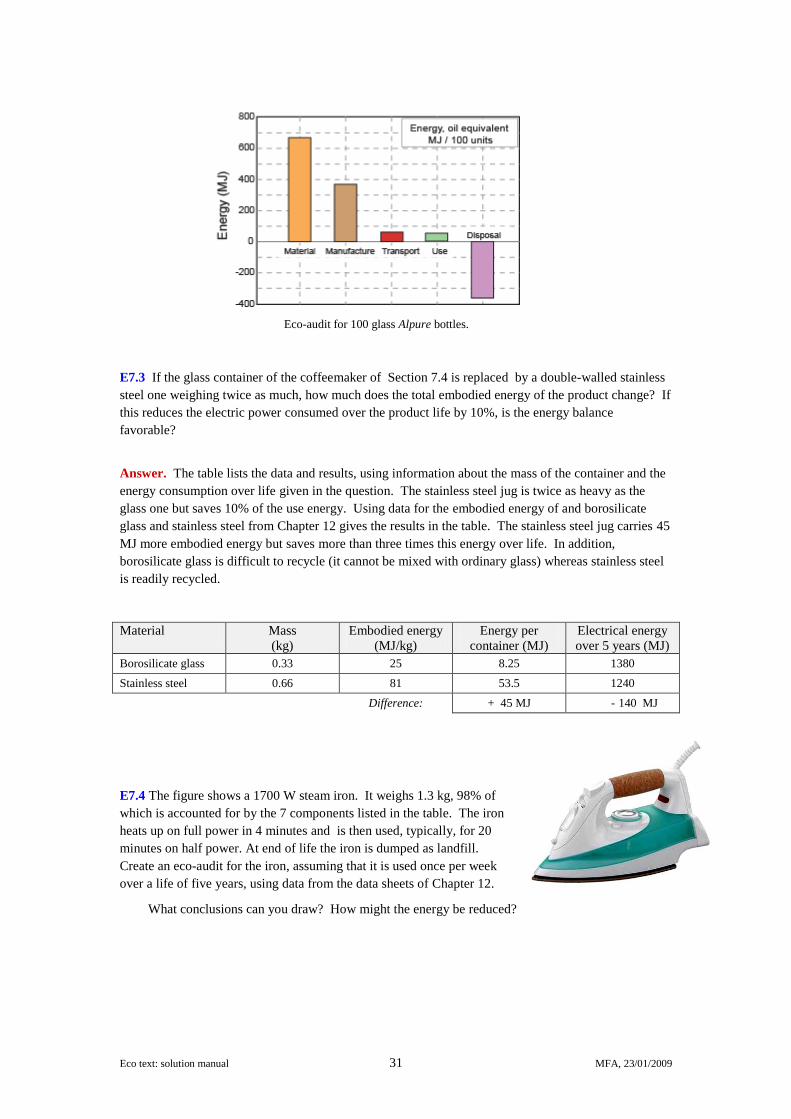
E7.1 If the embodied energies and CO2 used in the Alpure water case study in the chapter are
uncertain by a factor of 25%, do the conclusions change? Mark 25% margins onto each bar in a
copy of Figure 7.3 (you are free to copy it) and then state your case.
Answer. The error margins are marked on the figures below. Even when the most extreme values are
taken, the dominant contributions to energy and carbon are those of the material of the bottle. The
conclusions reached in the text still stand.
E7.2 Alpure water has proved to be popular. The importers now want to move up-market. To do so
they plan to market their water in 1 liter glass bottles of appealing design instead of the rather ordinary
PET bottles with which we are familiar from the case study in the chapter. A single 1-liter glass bottles
weigh 430 grams, much more than the 40 grams of those made of PET. Critics argue that this
marketing-strategy is irresponsible because of the increased weight. The importers respond that glass
has lower embodied energy than PET.
Use the methods of this chapter and the data available in Chapter 12 to analyze this situation.
What do you conclude?
Answer. The energy audit for 100 glass bottles, carried out in the same way as the PET bottles
described in the text and assuming the glass is recycled at end of life, gives the breakdown shown
below. (Data are taken from the record for soda-glass in Chapter 12, using mean values of the ranges
of embodied and process energies). The total life energies without recycling are summarized in the
table below. The choice of glass is almost 3 times more energy intensive than PET.
If both the PET and the glass are recycled, energy is “recovered”: it is the difference between the
embodied energy and the recycle energy, also listed in the data sheets of Chapter 12. The last column
of the table lists the life-energy with recycling; the bar chart shows the contributions. The glass bottle
remains almost three more energy intensive than the one made of PET.
Material
(100 bottles)
Life energy without
recycling (MJ)
Life energy with
recycling (MJ)
PET bottles 490 300
Glass bottles 1200 830
Eco text: solution manual 31 MFA, 23/01/2009
E7.3 If the glass container of the coffeemaker of Section 7.4 is replaced by a double-walled stainless
steel one weighing twice as much, how much does the total embodied energy of the product change? If
this reduces the electric power consumed over the product life by 10%, is the energy balance
favorable?
Answer. The table lists the data and results, using information about the mass of the container and the
energy consumption over life given in the question. The stainless steel jug is twice as heavy as the
glass one but saves 10% of the use energy. Using data for the embodied energy of and borosilicate
glass and stainless steel from Chapter 12 gives the results in the table. The stainless steel jug carries 45
MJ more embodied energy but saves more than three times this energy over life. In addition,
borosilicate glass is difficult to recycle (it cannot be mixed with ordinary glass) whereas stainless steel
is readily recycled.
Material Mass
(kg)
Embodied energy
(MJ/kg)
Energy per
container (MJ)
Electrical energy
over 5 years (MJ)
Borosilicate glass 0.33 25 8.25 1380
Stainless steel 0.66 81 53.5 1240
Difference: + 45 MJ - 140 MJ
E7.4 The figure shows a 1700 W steam iron. It weighs 1.3 kg, 98% of
which is accounted for by the 7 components listed in the table. The iron
heats up on full power in 4 minutes and is then used, typically, for 20
minutes on half power. At end of life the iron is dumped as landfill.
Create an eco-audit for the iron, assuming that it is used once per week
over a life of five years, using data from the data sheets of Chapter 12.
What conclusions can you draw? How might the energy be reduced?
Eco-audit for 100 glass Alpure bottles.

Eco text: solution manual 32 MFA, 23/01/2009
Steam iron: bill of materials
Component Mass (kg) Material Shaping
process
Material
energy* MJ/kg
Process
energy* MJ/kg
Body 0.15 Polypropylene Molded 97 8.6
Heating element 0.03 Nichrome Drawn 134 2.65
Base 0.80 Stainless steel Cast 82 3.35
Cable sheath, 3 meter 0.18 Polyurethane Molded 82 10.1
Cable core, 3 meter 0.05 Copper Drawn 71 2.0
Plug body 0.037 Phenolic Molded 90 12.7
Plug pins 0.03 Brass Rolled 71 2.0
* From the data sheets of Chapter 12
Answer. The material energy is found by multiplying the mass of each component by its embodied
energy/kg (listed, using data from Chapter 12, on the right of the table) and summing. The result is
108 MJ. The process energy is found in the same way; here the result is 6.5 MJ. To calculate the use-
phase energy multiply the power (1.7 kW) by the effective use-time on full power (4 minutes on full
power, 20 on half power, equivalent to 14 minutes per day, 52 days per year, 5 years) converted to
seconds, then divided by 1000 (to convert kJ to MJ), giving 371 MJ. But this is electrical energy,
generated from fossil fuel with an efficiency of around 38%, so to get the “oil equivalent” energy this
electrical energy must be divided by 0.38, giving 977 MJ.
The bar chart shows this distribution of energy commitment over the phases of life. The use
phase dominates, accounting for 90% of the total energy. About 29% of the use-phase energy is used
to heat the iron itself up to the working temperature, requiring energy
TCmQ p
Where m is the mass of the base of the iron (0.8 kg), pC is its specific heat and T is the
temperature interval through which it is heated. Thus energy could be saved by reducing the mass of
the base of the iron or by selecting a material for it with a lower specific heat, or both.

Eco text: solution manual 33 MFA, 23/01/2009
E7.5 The picture shows a 970 W toaster. It weighs 1.2 kg including
0.75 m of cable and plug. It takes 2 minutes, 15 seconds, to toast a
pair of slices. It is used to toast, on average, eight slices per day, so it
draws its full electrical power for 9 minutes (540 seconds) per day
over its design life of three years. The toasters are made locally;
transport energy and CO2 are negligible. At end of life it is dumped.
Create an eco-audit for the toaster using data from the data sheets of
Chapter 12.
Toaster: bill of materials
Component Mass
(kg)
Material Shaping
process
Material
energy* MJ/kg
Process
energy* MJ/kg
Body 0.24 Polypropylene Molded 97 8.6
Heating element 0.03 Nichrome Drawn 134 2.65
Inner frame 0.93 Low carbon steel Rolled 32 2.4
Cable sheath, 0.75 meter 0.045 Polyurethane Molded 82 10.1
Cable core, 0.75 meter 0.011 Copper Drawn 71 2.0
Plug body 0.037 Phenolic Molded 90 12.7
Plug pins 0.03 Brass Rolled 71 2.0
* From the data sheets of Chapter12
Answer. The material energy is found by multiplying the mass of each component by its embodied
energy/kg (listed, using data from Chapter 12, on the right of the table) and summing. The result is 67
MJ. The process energy is found in the same way; here the result is 5.4 MJ. To calculate the use-phase
energy multiply the power (0.97 kW) by the use-time on full power (9 minutes per day, 365 days per
year, 3 years) converted to seconds, then divided by 1000 (to convert kJ to MJ), giving 574 MJ. The
result is the MJ of electrical energy consumed over life. But this is electrical energy, generated from
fossil fuel with an efficiency of around 38%, so to get the “oil equivalent” energy this electrical energy
must be divided by 0.38, giving 1510 MJ.
The bar chart shows this distribution of energy commitment over the phases of life. The use
phase dominates, accounting for 90% of the total energy. How could the energy efficiency be
increased? Air circulates through the toaster during use, necessary to carry off the moisture distilled
from the bread, but carrying off energy too. Optimizing this air flow and the use of infra-red lamp
elements instead of the resistance coils could focus the heat more precisely where it is needed. When
toasting a single slice in a 2-slice toaster half the heat is wasted. Provision of a switch or sensor to
limit heating to the slot containing bread would significantly reduce energy consumption.

Eco text: solution manual 34 MFA, 23/01/2009
E7.6 It is proposed to replace the low-alloy steel bumper set of Case Study 7.6 by one made of
CFRP. It is anticipated that the CFRP will weigh 7 kg. Following the procedure of the text,
drawing data from the data sheets of Chapter 12, estimate whether, over the life pattern used in the
text, there is a net energy saving.
Answer. The table below lists mean values for the embodied energies of the two materials. Using the
energy consumption of a gasoline-powered car as 2.1 MJ/tonne.km (Table 6.7 of the text) we find the
use-energy over 250,000 km to have the values shown in the second last column. The two bar charts
display the relative magnitudes of material and use energies. Based on this very crude comparison, the
substitution gives a substantial energy saving if the vehicle is driven the full 250,000 km. The break-
even distance is found by equating the total energy associated with the steel bumper-set to that of the
CFRP set for a driven distance of X km, and solving for X. The result is 98,500 km.
Material of
fender
Mass
kg
Material
energy, MJ/kg*
Material
energy, MJ
Use energy,
MJ
Total: material
plus use, MJ
Low alloy steel 14 35 490 7210 7700
CFRP 7 273 1910 3610 5520
* From the data sheets of Chapter 12.
E7.7 The production of a small car (mass 1000 kg) requires
materials with a total embodied energy of 70 GJ, and a further
15 GJ for the manufacturing phase. The car is manufactured in
Germany and delivered to the US show room by sea freight
(distance 10,000 km) followed by delivery by heavy truck
over a further 250 km (Table 6.7 of the text gives the energy
per tonne.km for both). The car has a useful life of 10 years
and will be driven, on average, 25,000 km per year,
consuming 2MJ/km. Assume that recycling at end of life
recovers 25 GJ per vehicle.
Make an energy-audit bar chart for the car with bars for material, manufacture, distribution, and use.
Which phase of life consumes most energy? The inherent uncertainty of current data for embodied and
processing energies is considerable; if both of these were in error by a factor of 2 either way, can you still
draw firm conclusions from the data? If so, what steps would do most to reduce life-energy
requirements?

Eco text: solution manual 35 MFA, 23/01/2009
Answer. The figure shows the bar chart based on the data with the factor of 2 uncertainty indicated by T-
bars showing the ranges on the Material and the Manufacturing bars. Even with this colossal allowance
for the imprecision of the base-line data the conclusion is inescapable: the use-phase of the vehicle
remains the dominant contribution to life-energy consumption (more on this in Chapter 9). Material
choice should focus first on reducing vehicle mass since it is this that most directly correlates with fuel
consumption. It is essential to then check that the consequent change in embodied energy of the material
choice has not negated the gain resulting from the lower mass, using the method of exercise E7.6.
E7.8 The table below lists one European automaker‟s summary of the material content of a midsized
family car. Material proxies for the vague material descriptions are given in brackets and italicized.
The vehicle is gasoline-powered and weighs 1800 kg. The data sheets of Chapter 12 provide the
embodied energies of the materials; mean values are listed in the table. Table 6.7 gives the energy of
use: 2.1 MJ/tonne.km, equating to 3.8 MJ/km for a car of this weight. Use this information to allow a
rough comparison of embodied and use energies of the car, assuming it is driven 25,000 km per year
for 10 years.
Material content of a family car, total weight 1800 kg
Material Mass (kg) Material energy,
MJ/kg*
Energy per car
GJ
Steel (Low alloy steel) 950 32 30.4
Aluminum (Cast aluminum alloy) 438 220 96.4
Thermoplastic polymers (PU, PVC) 148 80 11.8
Thermosetting polymers (Polyester) 93 88 8.2
Elastomers (Butyl rubber) 40 110 4.4
Glass (Borosilicate glass) 40 15 0.6
Other metals (Copper) 61 72 4.4
Textiles (Polyester) 47 47 2.2
Total mass 1800 Total energy 158.4
* From the data sheets of Chapter 12

Eco text: solution manual 36 MFA, 23/01/2009
Answer. The material energy of the car is found by multiplying the mass of each material used in it by
its embodied energy. The column added to the right of the table above lists the contributions and their
sum, 158 GJ per car. The bar chart below shows the comparison. The input data are of the most
approximate nature, but it would take very large discrepancies to change the conclusion: the energy
consumed in the use phase (here about 85%) greatly exceeds that embodied in the materials of the
vehicle. Fuel consumption scales with weight (more detail on this in Chapter 9). The answer here is to
make the car from lighter materials – provided, of course, that the embodied energy of the replacement
is not so high that it offsets the gain made by light-weighting.
E7.10 Conduct a CO2 eco-audit for the patio heater shown here. It is
manufactured in Southeast Asia and shipped 8,000 km to the United States,
where it is sold and used. It weighs 24 kg, of which 17 kg is rolled stainless steel,
6 kg is rolled carbon steel, 0.6 kg is cast brass, and 0.4 kg is unidentified
injection-molded plastic (so use a proxy of your own choosing for this). In use it
delivers 14 kW of heat (“enough to keep 8 people warm”), consuming 0.9 kg of
propane gas (LPG) per hour, releasing 0.059 kg of CO2 /MJ. The heater is used
for 3 hours per day for 30 days per year, over five years, at which time the owner
tires of it and takes it to the recycling depot (only 6 miles/10 km away, so neglect
the transport CO2), where the stainless steel is dismembered, and the steel and
brass are sent for recycling. Use data from the text and data sheets to construct a
bar chart for CO2 emission over life.
Answer. The table below lists the carbon footprints of the materials and manufacturing processes for
the patio heater. The bar chart plots the totals. Sea transport over 8000km, consuming 0.015 kg CO2/
tonne.km (from Table 6.7 of the text) releases 2.9 kg of carbon dioxide per unit, so small as to be
invisible on the bar chart. The use of the heater, delivering 14 kW, or 50.4 MJ/hour with the release of
0.059 kg CO2/MJ, emits 1338 kg of CO2.
Recycling saves the difference between the carbon footprint of virgin and that of recycled
material. The second table lists these differences, using data for virgin and recycled material from the
data sheets of Chapter 12.
Not surprisingly, the carbon emission during use (over 1 tonne of CO2 over the course of life)
dominates. There is only one way to reduce the carbon footprint of a device like this: turn it off.

Eco text: solution manual 37 MFA, 23/01/2009
Material Mass (kg) Material CO2
kg/kg*
Material CO2
per unit, kg
Process CO2
kg/kg*
Process CO2
per unit, kg
Stainless steel, rolled 17 5.05 85.9 0.285 4.8
Carbon steel, rolled 6 2.5 15 0.195 1.2
Brass, cast 0.6 5.25 3.2 0.16 0.1
Thermoplastic polymer molded
(polypropylene)
0.4 2.7 1.1 0.68 0.27
Totals 24 105 6.4
* From the data sheets of Chapter 12
Recycled material Mass (kg) Difference between material CO2
and recycling CO2 kg/kg*
CO2 saved by recycling
per unit, kg
Stainless steel, rolled 17 3.6 61.2
Carbon steel, rolled 6 1.8 10.8
Brass, cast 0.6 3.95 2.4
Thermoplastic polymer molded
(polypropylene)
0.4 1.55 0.6
Totals 24 75

Eco text: solution manual 38 MFA, 23/01/2009
Exercises using the CES eco-audit tool
These exercises repeat or extend those of the text or of the preceding exercises, using the eco-
audit tool of the CES Edu software (found in the pull-down menu under “Tools”). The output and bar
charts in some cases differ slightly from those of the earlier exercises because of the way the software
creates means of the property ranges (it uses geometric rather than arithmetic means, more logical
when ranges are large) and because it calculates the oil equivalent of electrical energy using a country-
dependent energy mix (the mix of fossil fuel, hydro, wind and nuclear in the grid supply).
E7.11 Repeat the analysis of the PET bottle for the Alpure water case, the first case study in the
Chapter, entering data from Table 7.1 using the CES eco-audit tool. Then repeat, replacing the PET
bottle by a glass one, using the additional information in exercise E7.2.
Answer. The resulting bar charts and report reproduce those already presented in Exercises E7.1 and
7.2.
E7.12 Carry out the eco-audit for the jug kettle of Section 7.3, now using the fact that the kettle body
and the cardboard packaging are recycled at end of life.
Answer. Enter the bill of materials for the jug kettle, listed in the first four columns of Table 7.5 of the
text into the eco-audit tool, selecting “Recycle” for end of life for the PP body and the packaging and
“Landfill” for all the others. The report summary and bar chart delivered by the software are show
below, here using the electrical energy mix for Australia. The recycling offers a potential energy
saving of 51 MJ, 2.4% of the energy total.
Summary: jug kettle with recycling
Life phase Energy, MJ
Material 120
Manufacture 10
Transport 130
Use 1900
End of life -51
Total 2110
Jug kettle

Eco text: solution manual 39 MFA, 23/01/2009
E7.13 Carry out the eco-audit for the coffeemaker of Section 7.4, now using the fact that it is made
entirely out of recycled materials (tick the box “100% recycled”).
Answer. Enter the bill of materials for the coffee maker, listed in the first four columns of Table 7.6 of
the text into the eco-audit tool, selecting “Recycle” for end of life for the PP body (as in the original
case study of the text) and “Landfill” for all the others. The report summary delivered by the software
is show below, here using the average electrical energy mix for Europe, and selecting “Virgin
materials” for all. The resulting bar-chart is shown below – it reproduces that shown as Figure 7.7 of
the text. The material energy of 147 MJ is 8% if the total.
When all the material inputs are entered instead as “100% recycled” the material energy falls to
59 MJ, now only 4 % of the total.
Summary: Coffee maker, virgin materials
Life phase Energy, MJ
Material 147
Manufacture 13
Transport 6
Use 1480
End of life -52
Total 1594
E7.14 Carry out the eco-audit for the portable space heater using the bill of materials from Section 7.5,
assuming that at end of first life, the fan and heat shield are re-engineered to incorporate them into a
new product.
Answer. Enter the bill of materials for the space heater, listed in the first four columns of Table 7.7 of
the text into the eco-audit tool, selecting “Re-engineer” for end of life for the heat shield and all the
components of the fan, and “Landfill” for all the others. The report summary and bar-chart are shown
below.
Re-engineering (and then reusing) the fan and heat shield saves 3.3 kg of CO2.
Summary: Space heater
Life phase CO2, kg
Material 19
Manufacture 1.7
Transport 1.3
Use 190
End of life -3.3
Total 209
Space heater
Coffee maker

Eco text: solution manual 40 MFA, 23/01/2009
E7.15 Carry out Exercise E.7.5 (the toaster) using the CES eco-audit tool and the bill of materials
listed there. Make bar charts for both energy and CO2. Then tick the box “standard grade” in the
calculation, and repeat. Compare the result with using virgin material for making the toaster.
“Standard grade” means that the materials contain the typical recycle fraction listed in the data sheets
of Chapter 12.
Answer. Enter the bill of materials for the toaster, from Exercise E7.5 into the eco-audit tool. The
report summaries and bar-charts for energy and CO2 when virgin materials are used are shown below.
The same audit, using “Standard” grades for all materials reduces the Material energy from 68 to 56
MJ and the Material CO2 from 3.7 to 2.9 kg.
Summary: Toaster - energy
Life phase Energy, MJ
Material 68
Manufacture 5.4
Transport 0
Use 1250
End of life 0
Total 1323
Summary: Toaster – CO2
Life phase CO2, kg
Material 3.7
Manufacture 0.4
Transport 0
Use 164
End of life 0
Total 168
Toaster

Eco text: solution manual 41 MFA, 23/01/2009
Chapter 8
E 8.1. What is meant by an objective and what by a constraint in the requirements for a design? How
do they differ?
Answer. A constraint is an essential condition that must be met, usually expressed as an upper or
lower limit on a material property. An objective is a quantity for which an extreme value (a maximum
or minimum) is sought, frequently the minimization of cost, mass, volume or – of particular relevance
here – environmental impact. The distinction is brought out by comparing common constraints and
objectives, as in the table below. A constraint is a “Go / No go” criterion – if the constraint is not met,
the material is rejected. An objective allows the materials that meet all the constraints to be ranked: the
one that minimizes the objective is the best choice.
Common constraints Common objectives
Must meet a target value of
Stiffness
Strength
Fracture toughness
Thermal conductivity
Service temperature
Minimize
Cost
Mass
Volume
Energy consumption
Carbon emissions
E 8.2. Describe and illustrate the Translation step of the material selection strategy. Materials are
required to make safe, eco-friendly swings and climbing frames for a children‟s‟ playground. How
would you translate these design requirements into a specification for selecting materials?
Answer. The design requirements for a component of a product specify what it should do but not what
properties its materials should have. Translation is the step of converting the design requirements into
constraints and objectives that can be applied to a materials database. Thus the design requirement
“Materials are required to make safe, eco-friendly swings and climbing frames for a children‟s‟
playground” might translate as shown in the table.
Design requirements Translation
Materials are required to make safe,
eco-friendly swings and climbing
frames for a children‟s‟ playground
Constraints: seek materials that meet
specified levels of
Stiffness
Strength
Fracture toughness
Objective: minimize
Carbon footprint of material

Eco text: solution manual 42 MFA, 23/01/2009
E8.3. Bicycles come in many forms, each aimed at a particular sector of the market:
Sprint bikes
Touring bikes
Mountain bikes
Shopping bikes
Children‟s bikes
Folding bikes
Use your judgment to identify the primary objective and the constraints that must be met for each of
these.
Answer. Suggested constraints and objectives are listed in the table below. The balance between cost
and other objectives (like mass) depend on the consumer-group at which the bike is aimed.
Bike type Constraints Objective(s)
Spring bikes Meet target values of stiffness and
strength.
Minimize mass
Touring bikes Meet target value strength and
mass.
Minimize cost
Mountain bikes Meet target values of stiffness and
strength
Maximize damage tolerance
(toughness, fatigue strength)
Shopping bikes Meet target values of strength and
mass.
Minimize cost
Children‟s bikes Meet target values of strength and
toughness, ease of molding or forming.
Minimize cost
Folding bikes Meet target values of stiffness and
strength.
Minimize mass (for portability)
and volume (for compactness).
E 8.4. You are asked to design a fuel-saving cooking pan with the goal of wasting as little heat as
possible while cooking. What objective would you choose, and what constraints would you
recommend must be met?
Answer. The table lists constraints and an objective
Constraints Objective: minimize
Must be non-toxic
Meet an upper limit on
acceptable cost
Meet constraints of formability
Meet FDA* standards for
contact with food.
Must be recyclable (to save
embodied energy)
Thermal resistance (thus maximize
thermal conductivity)
*The US Food and Drug Administration approves materials for contact with foods.

Eco text: solution manual 43 MFA, 23/01/2009
E 8.5. Formulate the constraints and objective you would associate with the choice of material to make
the forks of a racing bicycle.
Answer. The important constraints are those of meeting target values of stiffness (for control and
comfort) and strength (for safety). Cost, in highly competitive sport, is irrelevant. Mass, however,
carries a heavy performance penalty. The central objective is to minimize mass.
E8.6. What is meant by a material index?
Answer. The performance of a component or product is limited by the properties of the materials of
which it is made. Sometimes it is limited by a single property, sometimes by a combination of them.
The property or property-group that limits performance for a given design is called its material index.
Performance is maximized by seeking the materials with the most extreme (biggest or smallest) value
of the index, usually the smallest.
E8.7. The objective in selecting a material for a panel of given in-plane dimensions for the lid casing of
an ultrathin portable computer is that of minimizing the panel thickness h while meeting a constraint
on bending stiffness, *S , to prevent damage to the screen. What is the appropriate material index?
Answer. The index, read from Table 8.3 of the text, is that for a stiffness limited panel of minimum
volume: minimize 3/1E/1 , where E is Young‟s modulus (or, more strictly, the flexural modulus,
equal to E for isotropic materials but not for those, like fiber composites, that are not isotropic).
E8.8. Plot the index for a light, stiff panel on a copy of the modulus/density chart of Figure 8.11,
positioning the line such that six materials are left above it, excluding ceramics because of their
brittleness. Which six do you find? To what material classes do they belong?
Answer. The index for selecting materials for light stiff panels, read from Table 8.3, is 3/1E/ .
Construct a line by hand, or on a scanned image of the chart in WORD, with the slope indicated by the
guide line on the figure, then position it so that a few materials lie to its left, as shown. These materials
have the lowest (best) values of the index. Omitting ceramics and glasses because of brittleness, we
find
Woods
CFRP (carbon fiber reinforced polymers)
Magnesium (Mg) alloys
Three density-grades of rigid polymer foams.
Polymer foams have the problem that their modulus is low, so although they are light, the panel has to
be thick to achieve much stiffness. It is possible to apply a constraint on thickness (it translates into a
lower limit for modulus); applying it then removes any materials that can only meet the stiffness
constraint if they are too thick.

Eco text: solution manual 44 MFA, 23/01/2009
E8.9. Panels are needed to board up the windows of an unused building. The panels should have the
lowest possible embodied energy but be strong enough to deter an intruder who, in attempting to break
in, will load the panels in bending. Which index would you choose to guide choice?
Plot the index on the strength/embodied energy chart of Figure 8.14, positioning the line to find
the best choice, excluding ceramics because of their brittleness. Which six do you find? To what
material classes do they belong?
Answer. The index for a strength limited panel of minimum embodied energy, read from Table 8.3 of
the text, is 2/1ym /H , where mH is the embodied energy per kg of the material, is its density
and y its yield strength. The index is plotted on the Strength – Embodied energy chart using the
procedure described in the answer to example E8.8, reading the slope from the appropriate guide line in
the lower right of the chart. It is position to leave a few materials to its left, as shown. Ignoring
ceramics because or brittleness, the best choices are
Woods
Cast irons
Carbon steels
Three density-grades of rigid polymer foams.
Polymer foams are unsuitable for other reasons (too easily cut, and too thick) leaving the others as the
most environmentally friendly choices.
The Modulus – Density chart: the one for stiffness at minimum weight.
Index
3/1E/

Eco text: solution manual 45 MFA, 23/01/2009
E8.10. A material is required for a disposable fork for a fast-food chain. List the objective and the
constraints that you would see as important in this application.
Answer. The primary considerations in choosing materials for disposable applications are health, cost
and the environmental damage that disposal might cause. The table list the resulting constraints and
objectives.
Constraints: the material must be Objective: minimize
Non toxic
Cheap
Cheap also to mold or shape
Low embodied energy
Easily (and profitably) recyclable
Embodied energy or
Carbon footprint
(they lead to essentially the same
choice)
The Strength – Embodied energy chart: the one for strength at minimum embodied
energy.
.
Index
2/1ym /H

Eco text: solution manual 46 MFA, 23/01/2009
E8.12. Show that the index for selecting materials for a
strong panel with the dimensions shown here, loaded in
bending, with the minimum embodied energy content, is
2/1y
mHM
where mH is the embodied energy of the material, its density and y its yield strength. To do so,
rework the panel derivation in Section 8.10 replacing the stiffness constraint with a constraint on
failure load F requiring that it exceed a chosen value *F where
*y2 F
Lh
ICF
where C2 is a constant and I is the second moment of area of the panel : 12
hbI
3
.
Answer. The objective function for the embodied energy of the panel, pH , is the volume Lbh times
the embodied energy of the material per unit volume, mH
mp HLhbH
Its failure load F must be at least *F , where
*y2 F
Lh
ICF
Here 2C is a constant that depends only on the distribution of the loads and I is the second moment of
area, which, for a rectangular section, is
12
hbI
3
We can reduce the energy p
H by reducing h , but only so far that the stiffness constraint is still met.
Combining the last two equations and solving for h gives
2/.1
y2
*
bC
LF12h
Using this to eliminate h in the objective function gives
2/1
y
m
2/1
2
3*
pH
C
bLF12H
The quantities *F , L , b and 2C are all specified; the only freedom of choice left is that of the
material. The best materials for a strong panel with the lowest embodied energy are those with the
smallest values of
2/1
y
mp
HM

Eco text: solution manual 47 MFA, 23/01/2009
E8.13. Use the chart mHE of Figure 8.13 to find the metal with a modulus E greater than 100
GPa and the lowest embodied energy per unit volume.
Answer. The construction is shown below. The metal with a modulus greater than 100GPa and the
lowest embodied energy is cast iron.
8.14. A maker of polypropylene (PP) garden furniture is concerned that the competition is stealing part
of his market by claiming that the “traditional” material for garden furniture, cast iron, is much less
energy and CO2 intensive than the PP. A typical PP chair weighs 1.6 kg; one made of cast iron weighs
11 kg. Use the data sheets for these two materials in Chapter 12 of the book to find out who is right.
Remember the warning about precision at the start of Chapter 12.
If the PP chair lasts 5 years and the cast iron chair lasts 25 years, does the conclusion change?
Answer. The table lists mean values of embodied energy and carbon footprint, per kg, for the two
materials. The last two columns show the values per chair. If the difference in lifetime is ignored, the
two chairs do not differ significantly in embodied energy, but they do in carbon release. If the longer
life of the cast iron chair is recognized by dividing the values by the life in years (to give energy and
carbon per chair.year) the cast iron chair wins easily.
Material Embodied energy*
MJ/kg
CO2*
kg/kg
Embodied energy
MJ/chair
CO2
kg/chair
Cast iron 17 1.05 187 11.6
Polypropylene 103 2.7 165 4.32
* From the data sheets of Chapter12.
The Modulus – Embodied energy chart: the one for stiffness at minimum embodied energy.
Modulus
E = 100 GPa
Lower embodied
energy

Eco text: solution manual 48 MFA, 23/01/2009
Exploring design using CES Edu level 2 Eco
E8.15. Use a Limit stage to find materials with modulus E > 180GPa and embodied energy mH < 30
MJ/kg.
Answer. Apply the two constraints using a “Limit” stage in CES Edu Level 2 with Eco. Four materials
meet them. They are
Selected materials
Cast iron, ductile (nodular)
High carbon steel
Low carbon steel
Medium carbon steel
E8.16. Use a Limit stage to find materials with yield strength y > 100MPa and a carbon footprint
2CO < 1 kg/kg.
Answer. Two materials meet the constraints. They are
Selected materials
Cast iron, ductile (nodular)
Cast iron, gray
E8.17. Make a bar chart of embodied energy mH . Add a “Tree” stage to limit the selection to
polymers alone. Which polymers have the lowest embodied energy?
Answer. The figure below shows the bar-chart created by CES. It was made using a “Graph” stage
with Embodied energy plotted on the y-axis. The selection was limited to Polymers and elastomers by
selecting, for the x-axis, this subset using the “Tree” option found under Advanced in the axis choice
dialog box. The four polymers with the lowest embodied energy are listed below. They are all bio-
polymers – polymers made from natural feedstock, not oil.
Selected materials
Natural Rubber (NR)
Polyhydroxyalkanoates (PHA, PHB)
Polylactide (PLA)
Starch-based thermoplastics (TPS)

Eco text: solution manual 49 MFA, 23/01/2009
E8.18. Make a chart showing modulus E and density . Apply a selection line of slope 1,
corresponding to the index E/ positioning the line such that six materials are left above it. What
families do they belong to?
Answer. The chart generated by CES is shown below with a selection line of slope 1 positioned to
leave six materials above the line. These are the materials with the lowest values of the index. They
are listed in the table. Five are ceramics, one is a composite.
Selected materials
Alumina
Aluminum nitride
Boron carbide
CFRP, epoxy matrix (isotropic)
Silicon carbide
Silicon nitride

Eco text: solution manual 50 MFA, 23/01/2009
E8.19. A material is required for a tensile tie-rod to link the front and back walls of a barn to stabilize
both. It must meet a constraint on strength and have as low an embodied energy as possible. To be
safe, the material of the tie must have fracture toughness c1K > 18 MPa.m1/2
. The relevant index is
ym /HM
.
Construct a chart of y plotted against mH . Add the constraint of adequate fracture toughness,
meaning c1K > 18 MPa.m1/2
, using a Limit stage. Then plot an appropriate selection line on the chart
and report the three materials that are the best choices for the tie.
Answer. The chart is shown below with a selection line leaving just three materials exposed. They are
listed in the table.
Selected materials
Cast iron, ductile (nodular)
High carbon steel
Low alloy steel

Eco text: solution manual 51 MFA, 23/01/2009

Eco text: solution manual 52 MFA, 23/01/2009
E8.20. A company wishes to enhance its image by replacing oil-based plastics in its products by
polymers based on natural materials. Use the “Search” facility in CES to find biopolymers. List the
materials you find. Are their embodied energies and CO2 footprints less than those of conventional
plastics? Make bar charts of embodied energy and CO2 footprint to find out.
Answer. A search on “Biopolymer” delivers the 5 materials listed in the table. The plot of embodied
energies for polymers, shown in the answer to exercise E8.17 shows that the first four have lower
embodied energies than any other polymer or elastomers. The equivalent chart of carbon footprint,
below, reveals that CO2 release associated with their production is at the lower end of that for
polymers – it is about the same as that polyethylene or PVC.
Selected materials
Natural Rubber (NR)
Polylactide (PLA)
Polyhydroxyalkanoates (PHA, PHB)
Starch-based thermoplastics (TPS)
Cellulose polymers (CA)

Eco text: solution manual 53 MFA, 23/01/2009
Chapter 9
E9.1. The materials of the drink containers of Figure 9.1 are recycled to different degrees. How does
the ranking of Table 9.2 change if the contribution of recycling is included? To do so, multiply the
energy per liter in the last column of the table by the factor
m
rcrc
H
H1f1
where rcf is the recycle fraction in current supply, mH is the embodied energy for primary material
production, and rcH is that for recycling of the material. You will find data for all three attributes in
the data sheets of Chapter 12.
Answer. The first table below lists the materials of the drink containers and the embodied energies,
energies to recycle and typical recycled fraction in current supply. The second table reproduces Table
9.2 of the text with two additional columns added. The first lists the correction factor , the second lists
the energy per liter multiplied by the correction factor.
The inclusion of recycled material significantly reduces all the energies. Steel still emerges as the
best choice, but glass rather than aluminium now becomes the most energy-intensive.
Container type Material Embodied
energy* MJ/kg
Recycle energy*
(MJ/kg)
Recycle fr. in
current supply*
PET 400 ml bottle
PE 1 liter milk bottle
Glass 750 ml bottle
Al 440 ml can
Steel 440 ml can
PET
High density PE
Soda glass
5000 series Al alloy
Plain carbon steel
84
81
15.5
208
32
38.5
34
6.8
19.5
9.0
0.21
0.085
0.24
0.44
0.42
* From the data sheets of Chapter 12
Container type Material Mass,
grams
Energy/liter
MJ/liter
Correction
factor
Corrected
energy MJ/liter
PET 400 ml bottle
PE 1 liter milk bottle
Glass 750 ml bottle
Al 440 ml can
Steel 440 ml can
PET
High density PE
Soda glass
5000 series Al alloy
Plain carbon steel
25
38
325
20
45
5.3
3.8
6.7
9.5
3.3
0.89
0.95
0.87
0.60
0.70
4.7
3.6
5.8
5.7
2.3
E9.2. Derive the correction factor to allow for recycle content cited in Exercise E.9.1
Answer. If the drink containers are made of virgin material, each carries an embodied energy of mH
per kg. If instead they are made of material containing a fraction rcf of recycled material that had
required the recycle energy rcH to produce it, the energy per kg falls to rcrcmrc HfH)f1( .
The factor we seek is the ratio of these two:
m
rcrc
m
rcrcmrc
H
H1f1
H
HfH)f1(

Eco text: solution manual 54 MFA, 23/01/2009
E9.4. Use the indices for the crash barriers (Equations 9.1 and 9.2) with the charts for strength and
density (Figure 8.12) and strength and embodied energy (Figure 8.14) to select materials for each of the
barriers. Position your selection line to include one metal for each. Reject ceramics and glass on the
grounds of brittleness. List what you find for each barrier.
Answer.
3/2y
3/2y
mH

Eco text: solution manual 55 MFA, 23/01/2009
The figure above shows the two charts with the indices3/2
y
m1
HM and
3/2y
2M marked.
Each is position to leave one class of metal exposed. The upper selection is that for the mobile barrier
with minimizing mass as the objective. The best choice is CFRP (carbon fiber reinforced polymers);
among metals, magnesium alloys offer the lightest solution . The lower selection is that for the static
barrier with minimizing embodied energy as the objective. The selection is wood; among , metals cast
irons offer the solution with lowest embodied energy.
The exercise brings out how strongly the selection to minimize environmental burden depends on
the application, as did the selection method used in the text.
E9.5. Complete the selection of materials for light, stiff shells of Section 9.4 by plotting the stiffness
index
2/11
EM
onto a copy of the modulus-density chart of Figure 8.11. Reject ceramics and glass on the grounds of
brittleness and foams on the grounds that the shell would have to be very thick. Which materials do
you find? Which of these would be practical for a real shell?
Answer. The selection line with slope 2 (picked up from the guide line on the lower right) is position
here such that CFRP, magnesium alloys, aluminium alloys and wood lie above it (ignoring the
ceramics and foams). All are practical for shells. The earliest light-weight shells were made of
plywood (some still are), aluminium sheet is routinely used for shell structures; magnesium sheet can
be used in the same way but its has more limited ductility, making it harder to shape; finally CFRP is
now the material of choice for light weight shells.
Selected materials: mobile barrier
Carbon-fiber reinforced polymers (CFRP)
Magnesium alloys
(Aluminum alloys)
(Wood)
Selected materials: static barrier
Wood
Cast irons
(Carbon steels)

Eco text: solution manual 56 MFA, 23/01/2009
E9.6. In a faraway land, fridges cost the same as they do here but electrical energy costs 10 times more
than here – that is, it costs $2/kW.hr. Make a copy of the tradeoff plot for fridges (Figure 9.8) and plot
a new set of penalty lines onto it, using this value for the exchange constant, e . If you had to choose
just one fridge to use in this land, which would it be?
Answer. We wish to minimize life-cost, which we take to be the sum of the initial cost and the cost
of the energy used over life. So define the penalty function
tHCZ *fe
*f
*
where *fC is the initial cost and *
fH is the energy per year (both per cubic meter of cold space), e ,
the exchange constant, is the cost of energy per kW.hr and t is the service life of the fridge in years,
making *Z the life-cost of the fridge per cubic meter of cold space. Inserting a life t of 10 years and
an energy cost e of $2/kW.hr gives
*f
*f
* H20CZ
Rearranging gives
*f
**f C
20
1Z
20
1H
The Modulus – Density chart: the one for stiffness at minimum weight.
.
2/1E

Eco text: solution manual 57 MFA, 23/01/2009
So the penalty function plots as a set of lines of slope 1/20 on the trade of plot of *fH against *
fC .
They are shown in black on the figure.
The choice that minimizes total life-cost when electrical power costs $2/kW.hr is that nearest the
point where the new *Z contours are tangent to the trade-off surface. It is ringed in red: the Hotpoint
RLA 175.
E9.7. You are asked to design a large heated workspace in a cold climate, making it as ecofriendly as
possible by using straw-bale insulation. Straw, when compressed, has a density of 600 kg/m3, a
specific heat capacity of 1670 J/kg.K and a thermal conductivity of 0.09 W/m.K. The space will be
heated during the day (12 hours) but not at night. What is the optimum thickness of straw to minimize
the energy loss?
Answer. The required insulation wall-thickness, w, is given by equation 9.16 of the text:
1/2
p ρC
t2w
where is the thermal conductivity, pC is the specific heat of the wall per unit mass (so pC is the
specific heat per unit volume) and t is the time interval between heating and cooling. Inserting the
data given in the question (and remembering to convert the 12 hour cycle time into seconds) gives the
result
w = 0.09 meters = 9 centimeters.
Contours of Z* for an
exchange constant of
$2/kW.hr
The trade-off plot for fridges with contours of the new penalty function Z*.

Eco text: solution manual 58 MFA, 23/01/2009
E9.8. The makers of a small electric car want to make bumpers out of a molded thermoplastic. Which
index is the one to guide this selection? Plot it on the appropriate chart from the set shown in Figures
8.11 – 8.14 and make a selection.
Answer. The use-energy of any vehicle, be it gasoline or electric powered, increases with the mass of
the vehicle. The bumper contributes to this mass. Maximizing range for a given battery capacity
means minimizing mass. The function of the bumper is to sustain bending loads. The required index
(equation 9.2 of the text) is
3/2y
2M
This is plotted on the strength – density chart below, picking up the slope of 1.5 from the guide line at
the lower right. The selection line is position such that a few polymers remain above it – they are the
best choice. They are:
Polycarbonate, PC
Polyamide (nylon) PA and
Polyetheretherketone PEEK
In practice bumpers are made of blends of Polycarbonate with other polymers such as Polypropylene or
Polyamide, or of fiber reinforced thermosets such as Polyester. PEEK is too expensive for application
such as this.
The Strength – Density chart: the one for strength at minimum weight.
.
3/2y
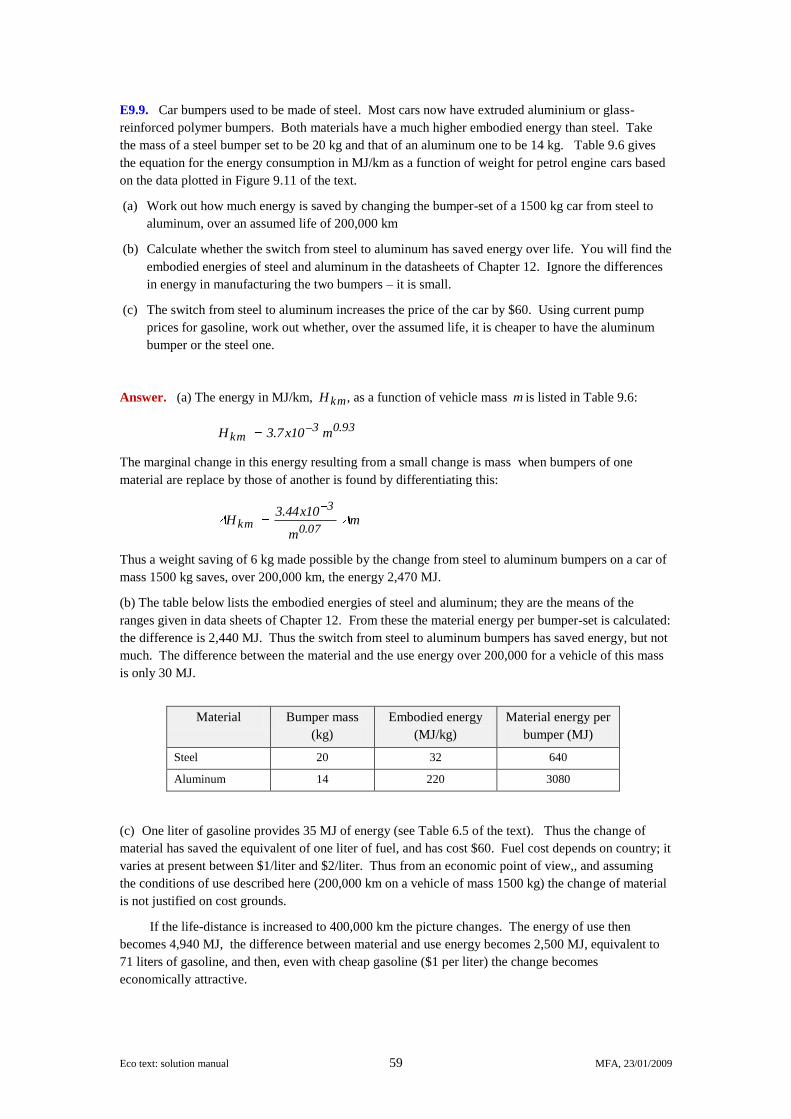
Eco text: solution manual 59 MFA, 23/01/2009
E9.9. Car bumpers used to be made of steel. Most cars now have extruded aluminium or glass-
reinforced polymer bumpers. Both materials have a much higher embodied energy than steel. Take
the mass of a steel bumper set to be 20 kg and that of an aluminum one to be 14 kg. Table 9.6 gives
the equation for the energy consumption in MJ/km as a function of weight for petrol engine cars based
on the data plotted in Figure 9.11 of the text.
(a) Work out how much energy is saved by changing the bumper-set of a 1500 kg car from steel to
aluminum, over an assumed life of 200,000 km
(b) Calculate whether the switch from steel to aluminum has saved energy over life. You will find the
embodied energies of steel and aluminum in the datasheets of Chapter 12. Ignore the differences
in energy in manufacturing the two bumpers – it is small.
(c) The switch from steel to aluminum increases the price of the car by $60. Using current pump
prices for gasoline, work out whether, over the assumed life, it is cheaper to have the aluminum
bumper or the steel one.
Answer. (a) The energy in MJ/km, kmH , as a function of vehicle mass m is listed in Table 9.6:
93.03km m10x7.3H
The marginal change in this energy resulting from a small change is mass when bumpers of one
material are replace by those of another is found by differentiating this:
mm
10x44.3H
07.0
3
km
Thus a weight saving of 6 kg made possible by the change from steel to aluminum bumpers on a car of
mass 1500 kg saves, over 200,000 km, the energy 2,470 MJ.
(b) The table below lists the embodied energies of steel and aluminum; they are the means of the
ranges given in data sheets of Chapter 12. From these the material energy per bumper-set is calculated:
the difference is 2,440 MJ. Thus the switch from steel to aluminum bumpers has saved energy, but not
much. The difference between the material and the use energy over 200,000 for a vehicle of this mass
is only 30 MJ.
Material Bumper mass
(kg)
Embodied energy
(MJ/kg)
Material energy per
bumper (MJ)
Steel 20 32 640
Aluminum 14 220 3080
(c) One liter of gasoline provides 35 MJ of energy (see Table 6.5 of the text). Thus the change of
material has saved the equivalent of one liter of fuel, and has cost $60. Fuel cost depends on country; it
varies at present between $1/liter and $2/liter. Thus from an economic point of view,, and assuming
the conditions of use described here (200,000 km on a vehicle of mass 1500 kg) the change of material
is not justified on cost grounds.
If the life-distance is increased to 400,000 km the picture changes. The energy of use then
becomes 4,940 MJ, the difference between material and use energy becomes 2,500 MJ, equivalent to
71 liters of gasoline, and then, even with cheap gasoline ($1 per liter) the change becomes
economically attractive.

Eco text: solution manual 60 MFA, 23/01/2009
Exercises using the CES Edu software.
E9.10. Refine the selection for shells (Chapter 9, Section 9.4) using Level 3 of the CES software.
Make a chart with the two shell indices
2/11E
M and 2/1
y
2M
as axes, using the “Advanced” facility to make the combination of properties. Then add a “Tree” stage,
selecting only metals, polymers and composites and natural materials. Which ones emerge as the best
choice? Why?
Answer. The figure below shows the CES Level 2 output. The materials that have the most attractive
values of both indices are those at the bottom left. They are listed in the table below. All have low
densities. Density enters the two indicies with a power of 1; modulus E and strength y enter
only as the square root. Thus density plays a larger role in determining the value of the index than the
other two properties, which in part explains the selection.
Selected materials
Age-hardening wrought Al-alloys
CFRP, epoxy matrix (isotropic)
Softwood: pine, along grain
Titanium alloys
Wrought magnesium alloys
The interesting
bit

Eco text: solution manual 61 MFA, 23/01/2009
E9.11. Tackle the crash barrier case study using CES Level 2 following the requirements set out in
Table 9.3. Use a Limit stage to apply the constraints on fracture toughness m.MPa18K c1 and the
requirement of recyclability. Then make a chart with density on the x-axis and yield strength y
on the y-axis and apply a selection line with the appropriate slope to represent the index for the mobile
barrier:
3/2y
2M
List the best candidates. Then replace Level 2 with Level 3 data and explore what you find.
Answer. The two figures below show the Level 2 and the Level 3 charts on exactly the same axes,
and with a selection line with the appropriate slope (1.5) in the same position on both. Switching from
Level 2 to Level 3 has populated the chart in much more detail. There are no polymer matrix
composites on either plot – they are eliminated by the requirement of recyclability. The selection at
Level 2 with the selection line in the position shown is
Selected materials, Level 2
Age-hardening wrought Al-alloys
Titanium alloys
Wrought magnesium alloys
The same selection at Level 3 gives 76 alloys of magnesium, aluminum, titanium and steels.
Displacing the line upwards to refine the search until just six are left gives a much more specific
selection listed below.
Level 2 data
3/2y
1.5
Level 2 data
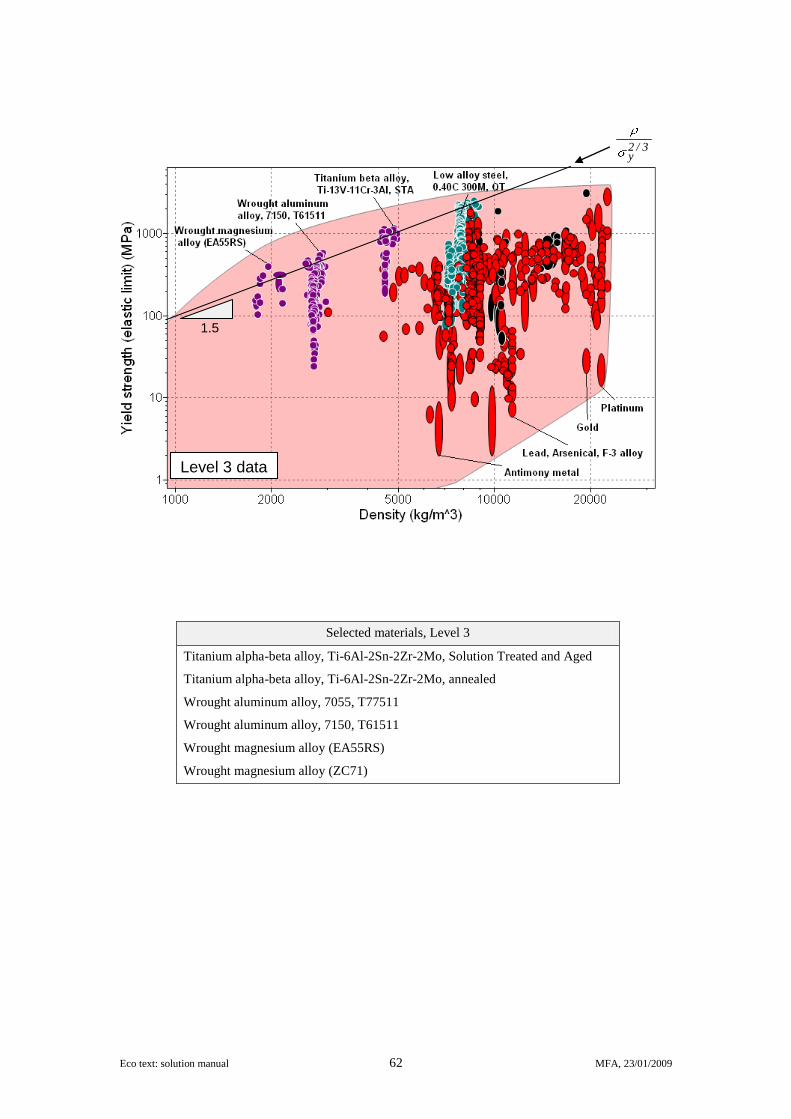
Eco text: solution manual 62 MFA, 23/01/2009
Selected materials, Level 3
Titanium alpha-beta alloy, Ti-6Al-2Sn-2Zr-2Mo, Solution Treated and Aged
Titanium alpha-beta alloy, Ti-6Al-2Sn-2Zr-2Mo, annealed
Wrought aluminum alloy, 7055, T77511
Wrought aluminum alloy, 7150, T61511
Wrought magnesium alloy (EA55RS)
Wrought magnesium alloy (ZC71)
Level 3 data
3/2y
1.5
Level 3 data

Eco text: solution manual 63 MFA, 23/01/2009
E9.12. Repeat the procedure of Exercise E9.11, but this time make a chart using CES Level 2 on
which the index for the static barrier
3/2y
m1
HM
can be plotted – you will need the Advanced facility to make the product mH . List what you find to
be the best candidates. Then, as before, dump in Level 3 data and explore what you find.
Answer. The two figures below show the Level 2 and the Level 3 charts on exactly the same axes,
and with a selection line with the appropriate slope (1.5) in the same position on both. Switching from
Level 2 to Level 3 has populated the chart in much more detail. As in the preceding exercise there are
no polymer matrix composites on either plot – they are eliminated by the requirement of recyclability.
The selection at Level 2 with the selection line in the position shown is
Selected materials, Level 2
Cast iron, ductile (nodular)
Cast iron, gray
High carbon steel
Low alloy steel
Low carbon steel
Medium carbon steel
The same selection at Level 3 gives 379 cast irons and steels, many of them sophisticated tool
steels. Displacing the line upwards to refine the search until just six are left, for instance, gives a much
more specific selection shown, below.
Selected materials, Level 3
Low-carbon mold tool steels, AISI P2
Low-carbon mold tool steels, AISI P3
Low-carbon mold tool steels, AISI P5
Oil-hardening cold work tool steel, AISI O6
Water-hardening tool steel, AISI W2 (Annealed)
Water-hardening tool steel, AISI W5 (Annealed)
These steels are expensive and an inappropriate choice for a low-grade application such as a static
crash barrier. The problem is overcome by applying a further constraint, using a “Limit” stage,
requiring that the material cost less than $1/kg. The result is shown in the third chart and table below.
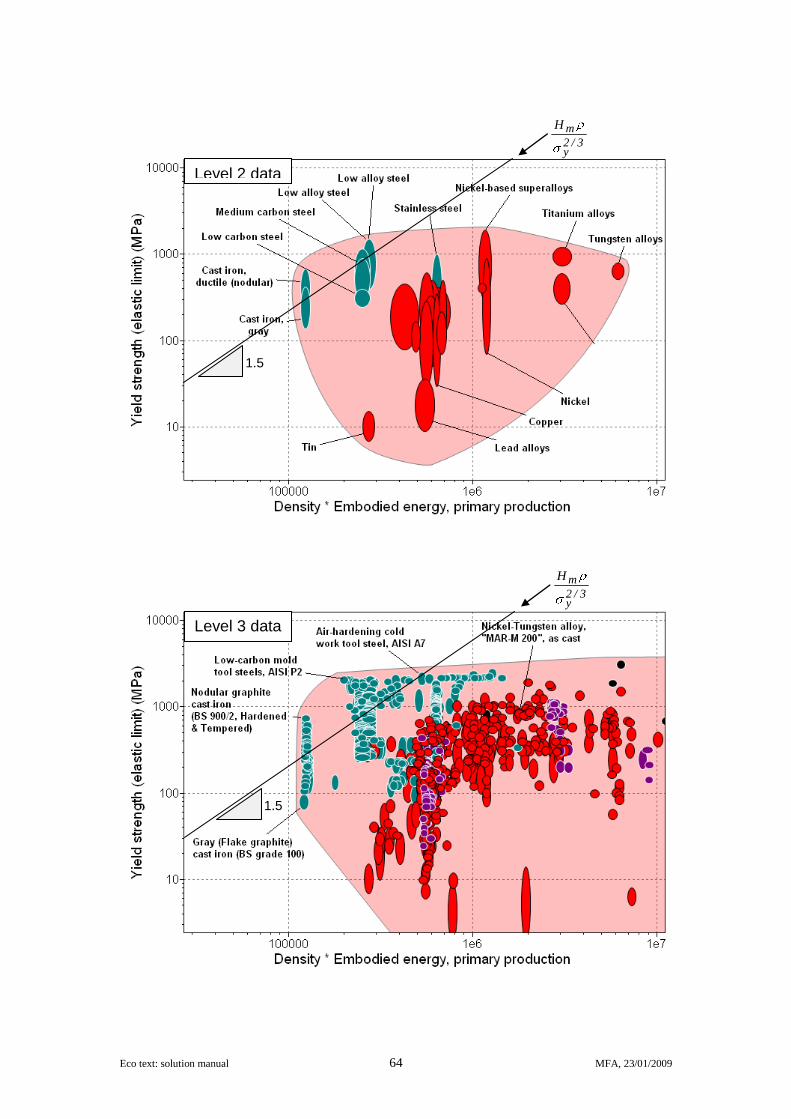
Eco text: solution manual 64 MFA, 23/01/2009
1.5
1.5
3/2y
mH
3/2y
mH
Level 3 data
Level 2 data

Eco text: solution manual 65 MFA, 23/01/2009
Selected materials, Level 3 with limit on price of £1/kg
Carbon steel, AISI 1340 (tempered @ 205 C, oil quenched)
Low alloy steel, AISI 9255 (tempered @ 205 C, oil quenched)
Nodular graphite cast iron (BS 700/2, Hardened & Tempered)
Nodular graphite cast iron (BS 900/2, Hardened & Tempered)
Pearlitic malleable cast iron (BS grade P 70-02)
Pearlitic malleable cast iron (former BS P 690/2-OQ)
1.5
3/2y
mH
Level 3 data with price < $1/kg

Eco text: solution manual 66 MFA, 23/01/2009
Chapter 10
E10.1. Distinguish pollution control and prevention (PCP) from design for the environment (DFE).
When would you use the first? When the second?
Answer. Pollution control and prevention (PC and P) is intervention to mitigate environmental
damage caused by existing products or processes without the burden of redesigning them. It is
basically a clean-up or “end-or-pipe” measure. Taking transport as an example, it is the addition of
catalytic converters to cars, a step to mitigate an identified problem with an existing product or system.
Taking water-borne pollution of beaches as an example, it is extending the exit pipe to carry effluent
further out to sea.
Design for the environment (DFE) is the strategy to foresee and minimize the damaging effects of
product families at the design stage, balancing them against the conflicting objectives of performance,
reliability, quality and cost. Returning to the example of the car: it is to redesign the vehicle, giving
emphasis to the objectives of minimizing emissions by reducing weight or adopting an alternative
propulsion system – hybrid, perhaps, or electric. Using the example of water-borne waste again, it is
redesigning the process generating the effluent so that, through filtration, chemical or biological
treatment, the water leaving the plant is no longer polluted.
E10.2. What is meant by the ecological metaphor? What does it suggest about ways to use materials
in a sustainable way?
Answer. The ecological metaphor, a concept emerging from industrial ecology, is based on the
precept that we must see human activities as part of the global eco-system, and that there is, in some
senses, a parallel between the functioning of the natural and the industrial systems. It has sometimes
led to the idea is that a study of the processes and balances that have evolved in nature might suggest
ways reconcile the imbalance between the industrial and the natural systems.
E10.3 What are the potential sources of renewable energy? What are the positive and negative aspects
of converting to an economy based wholly on renewable sources?
Answer. There are five potential sources of renewable energy:.
Wind
Wave
Tidal
Geothermal
Solar, both as direct heat and, via photocells, as electricity
It is these that offer the possibility of power generation without atmospheric carbon.
Positive aspects of converting to renewable energy sources. All renewable energy sources generate
electrical power without significant emissions. All offer independence from the international trade in
fossil fuels and the uncertainty of price and supply that this involves. And all require a large number
capture devices distributed over a large area of land or sea, making the system as a whole difficult to
disrupt.
Negative aspects of converting to renewable energy sources. Extracting significant power for
renewable resources involves committing large areas of land or sea because the energy is so dispersed.
Establishing a renewable-energy based system requires very large capital investment but so, too, does
the building of conventional power generating plant. The dispersion and reliance on (and thus lack of
protection from) the forces of nature creates maintenance problems.

Eco text: solution manual 67 MFA, 23/01/2009
E10.4. The land area of the Netherlands (Holland) is 41,526 km2. Its population is 16.5 million and
the average power consumed per capita there is 6.7 kW. If the average wind power is 2 W/m2 of land
area and wind turbines operate at a load factor of 0.5, what fractional of the area of the country would
be taken up by turbines in order to meet the energy needs?
Answer. The average power demand of the Netherlands is
kW10x11.1personperpowerxPopulationP 8
The wind power that can be generated from an area A km2 is
kWA10001000/5.0x2x10xAP 6
w
Here the factor of 106 is to convert km
2 to m
2 and the factor of 1000 is to convert W to kW. Equating
this to the power demand gives
25 km10x11.1A
This is 2.67 times the area of the Netherlands. There is no way wind power can supply all the
country‟s needs.
E10.5. The land area of the New York State is 131,255 km2. Its population is 19.5 million and the
average power consumed per capita there is 10.5 kW. If the average wind power is 2 W/m2 of land
area and wind turbines operate at a load factor of 0.25, what fractional of the area of the country would
be taken up by turbines in order to meet the energy needs?
Answer. The average power demand of the State of New York is
kW10x05.2personperpowerxPopulationP 8
The wind power that can be generated from an area A km2 is
kWA5001000/25.0x2x10xAP 6
w
Here the factor of 106 is to convert km
2 to m
2 and the factor of 1000 is to convert W to kW. Equating
this to the power demand gives
25 km10x1.14A
This is 3.12 times the area of the State of New York. There is no way wind power from within the
State can supply all the energy it needs. Even with a probably unrealistic load factor of 0.5, the area is
insufficient.

Eco text: solution manual 68 MFA, 23/01/2009
E10.6. The combined land area of the State of New Mexico (337,367 km2) and Nevada (286,367 km
2)
is 623,734 km2. The population if the United States is 301 million and the average power consumed
per capita there is 10.2 kW. Mass-produced solar cells can capture 10% of the energy that falls on
them, which, in New Mexico, is roughly 50W/m2. Is the combined area of the two States large enough
to provide solar power that would meet the current needs of the United States?
Answer. The average power demand of the US is
kW10x07.3personperpowerxPopulationP 9
The solar power that can be generated from an area A km2 is
kWA50001000/1.0x50x10xAP 6
w
Here the factor of 106 is to convert km
2 to m
2 and the factor of 1000 is to convert W to kW. Equating
this to the power demand gives
25 km10x14.6A
This is 0.98 times the combined area of the two States. The power needs could just be met if both
States were completely paved with solar cells.

Eco text: solution manual 69 MFA, 23/01/2009
Chapter 11
E11.1. An aluminum saucepan weighs 1.2 kg, and costs $10. The embodied energy of aluminum is 220
MJ/kg. If the cost of industrial electric power doubles from 0.0125 $/MJ to 0.025 $/MJ, how much will it
change the cost of the saucepan?
Answer. The cost of the electric power at 0.0125 $/MJ to make the aluminum for one 1.2 kg saucepan is
$ 3.30. If the price of energy doubles to 0.025 $/MJ this rises to $ 6.6. The cost of the saucepan will rise to
$ 13.3, an increase of 33%.
E11.2. An MP3 player weighs 100 grams, and costs $120. The embodied energy of assembled integrated
electronics of this sort is about 2000 MJ/kg. If the cost on industrial electric power doubles from 0.0125
$/MJ to 0.025 $/MJ, how much will it change the cost of the MP3 player?
Answer. The cost of the electric power at 0.0125 $/MJ to make one MP3 player is $2.5. If the price of
energy doubles this rises to $ 5. The cost of the player will rise to $ 125, an increase of just 4%.
E 11.3. Cars in Cuba are repaired and continue in use when 25 years old. The average life of a car in the
US is 13 years. What is the underlying reason for this?
Answer. In affluent economies such as those of the US and much of Europe consumers are sufficiently
wealthy to purchase products as much for their character, associations and styling as for their functionality.
New models often appear on an annual basis, stimulating replacement of previously purchased products
before the end of their functional life. High labor costs make maintenance and repair uneconomic so that
even minor breakdown causes rejection and replacement.
In less affluent economies the capital cost of products represents a much larger fraction of disposable
income. To avoid the need for more capital investment products are kept for their full functional life, which
is extended by maintenance and repair enabled by low labor costs.
E11.4. Use the Worldwide Web to research the meaning and history of “The precautionary principle”.
Select and report the definition that, in your view, best sums up the meaning.
Answer. Numerous sites comment on or criticize the precautionary principle, which has a long
history. Among them are:
1. en.wikipedia.org/wiki/Precautionary_principle
2. www.jncc.gov.uk/page-1575
3. www.sirc.org/articles/beware
4. www.i-sis.org.uk/prec.php
From these we learn the following.
The precautionary principle states that when there is reasonable suspicion of harm, lack of scientific
certainty or consensus must not be used to postpone preventative action. Originating in 1930s

Eco text: solution manual 70 MFA, 23/01/2009
Germany as Vorsorgeprinzip (literally foresight principle), it has become one of the guiding principles
in dealing with issues of loss of biodiversity, the deployment of genetically modified crops, the
uncontrolled development of nanotechnology and, above all, to issues relating to climate change. Since
the 1970s the principle has sometimes been invoked by green activists and those opposed to
technological change, often with little scientific justification, thereby ensnaring what is, at bottom,
sound common sense in an emotional net. Despite this it remains at the heart of discussions of mans‟
influence on the environment.
E11.5. Use the Worldwide Web to research examples of problems that are approached by predictive
modeling.
Answer. A number of sites discuss and give examples of predictive modelling. Among them are:
1. en.wikipedia.org/wiki/Predictive_modeling
2. searchdatamanagement.techtarget.com
3. www.dmreview.com/specialreports/20050215/1019956-1.html
From these we learn the following.
Predictive modeling is the use of mathematical models based on known or measured behavior to
predict the behavior of systems under conditions for which measurements do not exist.
Physically-based models are based on the principles of physics, often expressed as differential
equations that can then be calibrated against known response and subsequently integrated with new
boundary conditions to explore response under different circumstances. The design of a new aircraft,
behavior of systems in space and the explosion of nuclear devices are examples; in all three examples
response to service or use conditions cannot easily be measured because of the expense of doing so or
because international treaties forbid it. The behavior must be predicted. Physically-based models
enable this.
Statistically-based models use predictive analytics to create a statistical model of future behavior.
Predictive analytics is the area of data mining concerned with forecasting probabilities and trends. A
predictive model is made up of a number of predictors, variable factors that are likely to influence
future behavior or results. In marketing, for example, a customer's gender, age, and purchase history
might predict the likelihood of a future sale.
To create a predictive model, data is collected for the relevant predictors, a statistical model is
formulated, predictions are made and the model is validated (or revised) as additional data becomes
available. The model may employ a simple linear equation or a complex neural network, mapped out
by sophisticated software. The Data Mining Group, a vendor consortium, uses a XML-based language
called the Predictive Model Markup Language (PMML) to enable the definition and sharing of
predictive models between applications.