materials and research division · · 2015-12-08materials and research division. ... 20-year...
TRANSCRIPT

NORTH DAKOTA DEPARTMENT OF TRANSPORTATION
MATERIALS AND RESEARCH DIVISION
Experimental Study ND 2002-01
Base Reinforcement Using Geogrid
Fifth Evaluation Report
NH-4-052(044)058
February 2015
Prepared by
NORTH DAKOTA DEPARTMENT OF TRANSPORTATION
BISMARCK, NORTH DAKOTA www.dot.nd.gov
DIRECTOR Grant Levi, P.E.
MATERIALS AND RESEARCH DIVISION Ron Horner
RCS HHO-30-19
U.S. DEPARTMENT OF TRANSPORTATION
FEDERAL HIGHWAY ADMINISTRATION
EXPERIMENTAL PROJECT REPORT
EXPERIMENTAL
PROJECT
EXPERIMENTAL PROJECT NO.
STATE Y EAR NUMBER SURF
CONSTRUCTION PROJ NO NH-4-052(044)058
LOCATION Ward & Renville Co. 1 ND 2002 - 01
EVALUATION FUNDING
1 x HP&R 3 DEMONSTRATION 48 2 x CONSTRUCTION 4 IMPLEMENTATION
NEEP NO. 49
PROPRIETARY FEATURE?
x Yes 51 No
SHORT TITLE TITLE
Base Reinforcement Using Geogrid 52
THIS FORM
DATE MO. 140 2
--
YR.
09
REPORTING 1 INITIAL 2 X ANNUAL 3 FINAL
KEY WORDS
KEY WORD 1 Base Reinforcement KEY WORD 2 Geogrid
KEY WORD 3 KEY WORD 4
UNIQUE WORD
233
PROPRIETARY FEATURE NAME
TENSAR
CHRONOLOGY
Date Work Plan
Approved
277
Date Feature
Constructed:
7-03
281
Evaluation
Scheduled Until:
2013
285
Evaluation
Extended Until:
289
Date Evaluation
Terminated:
293
QUANTITY
AND COST
QUANTITY OF UNITS
(ROUNDED TO WHOLE NUMBERS) UNITS UNIT COST (Dollars, Cents)
25,031 297
1 LIN. FT
2 x SY
3 SY-IN
4 CY
305
5 TON
6 LBS
7 EACH
8 LUMP SUM
$2.78
306
AVAILABLE
EVALUATION
REPORTS
CONSTRUCTION
x 315
PERFORMANCE
X
FINAL
EVALUATION
CONSTRUCTION PROBLEMS
1 X NONE 2 SLIGHT 3 MODERATE 4 SIGNIFICANT
318 5 SEVERE
PERFORMANCE
1 EXCELLENT
2 GOOD
3 X SATISFACTORY
4 MARGINAL
319 5 UNSATISFACTORY
APPLICATION
1 ADOPTED AS PRIMARY STD. 4 X PENDING (Explain in remarks if 3, 4, 5, or 6 is
2 PERMITTED ALTERNATIVE 5 REJECTED checked)
320 3 ADOPTED CONDITIONALLY 6 NOT CONSTRUCTED
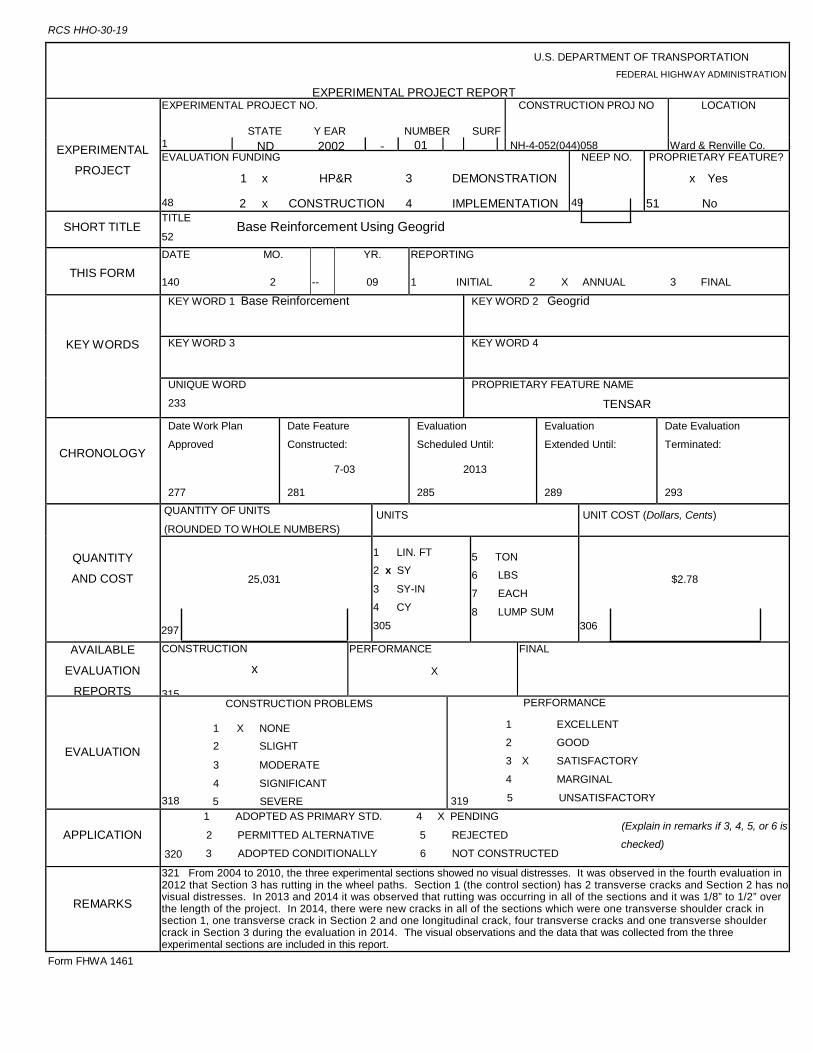
REMARKS
321 From 2004 to 2010, the three experimental sections showed no visual distresses. It was observed in the fourth evaluation in 2012 that Section 3 has rutting in the wheel paths. Section 1 (the control section) has 2 transverse cracks and Section 2 has no visual distresses. In 2013 and 2014 it was observed that rutting was occurring in all of the sections and it was 1/8” to 1/2” over the length of the project. In 2014, there were new cracks in all of the sections which were one transverse shoulder crack in section 1, one transverse crack in Section 2 and one longitudinal crack, four transverse cracks and one transverse shoulder crack in Section 3 during the evaluation in 2014. The visual observations and the data that was collected from the three experimental sections are included in this report.
Form FHWA 1461

Experimental Study ND 2002-01
Base Reinforcement Using Geogrid
Fourth Evaluation Report
NH-4-052(044)058
March 2015
Written by:
Seung IL Baek
Jared Loegering
Andy Mastel
Mike Marquart

Disclaimer The contents of this report reflect the views of the author or authors who are responsible for the facts and the accuracy of the data presented herein. The contents do not reflect the official views of the North Dakota Department of Transportation or the Federal Highway Administration. This report does not constitute a standard, specification, or regulation.

Table of Contents Purpose and Need ..............................................................................................................................1
Objective .............................................................................................................................................1
Scope..................................................................................................................................................1
Location ..............................................................................................................................................1
Design ................................................................................................................................................3
Construction .......................................................................................................................................5
Costs................................................................................................................................11
Plan and Profile Views ....................................................................................................11
Construction Summary ....................................................................................................13
Evaluation………...............................................................................................................................14
Falling Weight Deflectometer…........................................................................................14
2004 to 2005 Evaluation ..................................................................................................15
2006 to 2008 Evaluation ..................................................................................................15
2009 to 2010 Evaluation ..................................................................................................16
2011 to 2012 Evaluation ..................................................................................................17
2013 to 2014 Evaluation ..................................................................................................19
Summary ..........................................................................................................................................23
Appendix A: Average FWD results for each section .........................................................................A
Table 5: Avg. Deflections for each section ...................................................................A-1
Table 6: Avg. Asphalt modulus for each section ..........................................................A-1
Table 7: Avg. base modulus for each section ..............................................................A-2
Table 8: Avg. subgrade modulus for each section .......................................................A-2
Appendix B: FWD Graphs..................................................................................................................B
Appendix C: Maintenance Costs........................................................................................................C
Appendix D: Traffic Counts…….........................................................................................................D
Appendix E: Linear Soils Report …….................................................................................................F
Appendix F: Geogrid tensile strength test results .........................................................................G

Base Reinforcement Using Geogrid ND 02-01 Fifth Evaluation Report
North Dakota Department of Transportation 1 Materials & Research Division
Fifth Evaluation Report
Base Reinforcement Using Geogrid
ND 2002-01 Purpose and Need
North Dakota’s aging highways are being rehabilitated with thicker base sections
to improve pavement performance. The bases are being constructed with virgin
aggregates and blends of recycled materials to provide adequate drainage and support
for the pavement. Most of the aggregate used is a local material that is being depleted
and is becoming harder to find. In some areas, aggregate is being brought in from
surrounding states, which adds substantial costs to rebuilding the roadway.
The North Dakota Department of Transportation (NDDOT) is looking at ways to
improve the performance of the pavement, decrease future maintenance costs,
conserve aggregate resources, and reduce the time needed to rehabilitate the roadway.
Objective
The objective of this study is to determine if using geogrid as a base
reinforcement will provide the performance characteristics required, while reducing
aggregate use and construction time.
Scope
The scope of the work was to install geogrid in the base material of a newly
constructed roadbed to reinforce the base. The geogrid was placed 6” below the top of
the base in two sections having different base thicknesses. These sections will be
compared to a standard section for 10 years and will include distresses, pavement
condition, maintenance costs, and FWD data. Location
Geogrid was installed on project NH-4-052(044)058 from RP 61.757 to RP
63.257. The project is on US Highway 52 from Donnybrook to Carpio. This section of
highway is northwest of Minot in Ward and Renville counties. Refer to Figure 1 on the
next page for the location of the project.

Base Reinforcement Using Geogrid ND 02-01 Fifth Evaluation Report
North Dakota Department of Transportation 2 Materials & Research Division
Project NH-4-052(044)058
US HWY 52 – Donnybrook to Carpio
Figure 1 - Project Location.

Base Reinforcement Using Geogrid ND 02-01 Fifth Evaluation Report
North Dakota Department of Transportation 3 Materials & Research Division
Design
Three different sections were designed based on the following parameters: 5,500
psi soil modulus; 445 two-way flexible ESALs; 1.3% growth rate; 1,841,393 accumulated
one-way flexible ESALs; 80% reliability; 20-year design life; Class 31 HBP; and a
blended base (consisting of approximately 50% salvaged HBP and 50% virgin
aggregate). Refer to Table 1 for the design sections and Table 2 for the specifications
of the blended base.
Table 1
Class 3 Modified (Virgin Aggregate Used to Blend with Recycled Asphalt) Sieve Size Percent Passing
1” 100 #4 35-85 #30 20-50
#200 4-10 Shale content 12% Maximum
Blended Base Course and Salvaged Base Course Gradation
Sieve Size Percent Passing
1 1/2” 100 1” 90-100
Table 2
The geogrid comes in two widths, 9.8’ and 13.1’. The manufacturer
recommends a one-foot overlap of the material unless the subgrade is extremely
weak and then a three-foot overlap is recommended. A one-foot overlap of the
material was utilized.
Section
Blended Base
Depth
HBP Class 31
Depth
Depth of Geogrid From
Top of Pavement
Width of Geogrid
1 (Control) 18” 5.5” N/A N/A 2 18” 5.5” 11.5” 42’-8” 3 12” 5.5” 11.5” 42’-8”

Base Reinforcement Using Geogrid ND 02-01 Fifth Evaluation Report
North Dakota Department of Transportation 4 Materials & Research Division
According to the manufacturer, and research conducted by the Federal Aviation
Administration (FAA), and the Army Corps of Engineers (COE), utilizing geogrid in the
base section has a Traffic Benefit Ratio (TBR) of 3 using Tensar BX1100. The TBR is
a multiplier of 3 placed on the design ESALs.
Refer to photos 1 and 2 for a sample of the Tensar BX 1100 Geogrid. Referring
to Table 3 below, Section 1 (control) has an expected ESAL life of 1,813,132, Section
2 (using geogrid, with 18” of base depth) has an expected ESAL life of 5,439,396, and
Section 3 (using geogrid, with 12” of base depth) has an expected ESAL life of
1,812,314.
Photo 1 - Tensar BX1100 Geogrid Photo 2- Size of geogrid opening vs. a penny.
Section Expected ESAL
Life
Design ESAL Calculated By
1 (Control) 1,813,132 Darwin 3.01and SpectraPave2
2 5,439,396 SpectraPave2
3 1,812,314 SpectraPave2 Table 3
The pavement thickness design for the test sections utilized DARWIN (1993
AASHTO Design Software) and SpectraPave2 (design software from Tensar, the
geogrid manufacturer). Tensar recommends that the geogrid be placed 10” to 13”
below the top of the asphalt surface for the best performance. Tensar indicates that by
utilizing geogrid in the base, total base depth can be reduced by approximately 6”
while carrying the same traffic. Refer to Figure 2 below for the typical sections.

Base Reinforcement Using Geogrid ND 02-01 Fifth Evaluation Report
North Dakota Department of Transportation 5 Materials & Research Division
Section 1 (Control) 5.5” Class 31 HBP 18” Blended Base.
Section 2 5.5” Class 31 HBP 18” Blended Base Geogrid placed 11.5” below top of the pavement.
Section 3 5.5” Class 31 HBP 12” Blended Base Geogrid placed 11.5” below top of the pavement.
Figure 2 - Typical sections. Construction
The locations of the three experimental sections were selected in 2002 between
RP 61.757 and RP 63.257. They were determined by Materials and Research
personnel after studying the project terrain and soil types indicated in the Linear Soils
Report. The soils report is found in Appendix E. The area selected for the
experimental sections had the most uniform soils.
The Tensar Geogrid BX1100 was sampled and sent to an independent
laboratory for testing prior to installation. The geogrid passed the strength
requirements of the certification. Copies of the test results are located in Appendix F.
The original design called for a blended base (50% salvaged HBP and 50% virgin
aggregate). However, to save cost and time, Class 5 was used on the top 8.5” for
Section 1 and 2 and blended based was used for the bottom 9.5”. Section 3 used
Class 5 for the entire 12.0.” In the original design, the geogrid was supposed to be
laid 11.5” below the top of the pavement for Section 2 and 3. Section 3 geogrid was
installed properly at 11.5” below the top of pavement but the Section 2 geogrid was
installed14.0” below the top of the pavement.

Base Reinforcement Using Geogrid ND 02-01 Fifth Evaluation Report
North Dakota Department of Transportation 6 Materials & Research Division
The contractor began spreading the base material in Section 2 on July 28, 2003.
Each section was constructed as shown in the typical sections, which are located in the
design section of this report.
Steve Madaus of Contech Construction Products, Inc. was on site at the project
to direct the geogrid installation. When the required base thickness was laid and
compacted, the geogrid was rolled out. The geogrid was overlapped by a minimum of
1 foot. Steve said that it is ok to drive on the geogrid but to avoid stopping, sharp
turning, or spinning wheels.
The geogrid rolls were 13.1 feet wide. The stiffness of the geogrid helped to keep
the material even and tight. The upper base material was placed on top of the geogrid
with belly-dump trucks. The geogrid had a tendency to roll or cause a slight wave
ahead of the tires if the truck was moving too fast. The geogrid would then become
uneven in these areas. Base material was used in these areas to hold it down. This
made it easier for the blade to spread the windrow. There were a few places
where the uneven geogrid could not be smoothed out enough and was cut to lay flat
and then covered with a geogrid patch. Another method was to fold the material under
to take up the slack. The geogrid is supplied in rolls and has a tendency to roll back up.
The contractor used large headed nails in some cases to hold down the geogrid. Photo
3 shows a roll of Tensar BX-1100 Geogrid.
Photo 3 – A roll of Tensar Geogrid BX 1100.
The geogrid installation is shown in the following photos.

Base Reinforcement Using Geogrid ND 02-01 Fifth Evaluation Report
North Dakota Department of Transportation 7 Materials & Research Division
Photo 4 – Starting new roll of geogrid.
Photo 5 – Nailing down overlap of new roll, rolling out geogrid, and
spreading base material.

Base Reinforcement Using Geogrid ND 02-01 Fifth Evaluation Report
North Dakota Department of Transportation 8 Materials & Research Division
Photo 6 - Damaged areas like this can be repaired by overlaying with
a 3’x3’ patch.
Photo 7 – Overlapping two rolls of geogrid and staking down edges.

Base Reinforcement Using Geogrid ND 02-01 Fifth Evaluation Report
North Dakota Department of Transportation 9 Materials & Research Division
Photo 8 – Placing the base material on the geogrid.
Photo 9 – Spreading base – notice the base material on the geogrid. It keeps the ends down so it stays in place.

Base Reinforcement Using Geogrid ND 02-01 Fifth Evaluation Report
North Dakota Department of Transportation 10 Materials & Research Division
Photo 10 – Some waves in the geogrid – nailing overlap area.
Photo 11 - Compacting the base material on top of the geogrid.

Base Reinforcement Using Geogrid ND 02-01 Fifth Evaluation Report
North Dakota Department of Transportation 11 Materials & Research Division
Costs
The cost of each of the three sections is shown below.
Section 1 (Control): RP 61.757 to RP 62.257 9.5 inch Blended Base (bottom layer) 8.5 inch Class 5 $90,290.11
Section 2: RP 62.257 to RP 62.757
9.5 inch Blended Base (bottom layer) 42.67 ft. wide geogrid 8.5 inch Class 5 $121,581.50
Section 3: RP 62.757 to 63.257
6 inch Class 5 (bottom layer) 42.67 ft. wide geogrid 6 inch Class 5 $82,944.84
Test Section 2 and 3 used 25,037 square yards of geogrid. An additional 780
tons of Class 5 at $4.90 per ton was used on Test Section 3 to fill the slough to the 72
foot graded shoulder. Comparing the Control Section to Section 3, $90,290.11 -
$82,944.84 = a savings of $7,345.27 by substituting geogrid for 6” of base material.
The geogrid was bid at $2.50 per square yard and included full compensation for all
labor, equipment and materials to complete the work.
Plan and Profile Views
Three plan and profile views were drawn and are shown on the next page. The
views show the station limits and the layer thicknesses as constructed. Section 3 side
view shows how the transitions were constructed. Figure 3 shows a plan view of
Section 3 including areas where the geogrid was damaged and repaired. It also shows
one area that contains no geogrid. Should any problems show up in the future, this
view may help to identify the cause.

North Dakota Department of Transportation 12 Materials & Research Division
Base Reinforcement Using Geogrid ND 02-01 Fifth Evaluation Report
63.257
Figure 3- Plan view and cross section view.

North Dakota Department of Transportation 13 Materials & Research Division
Base Reinforcement Using Geogrid ND 02-01 Fifth Evaluation Report
Construction Summary
The NDDOT is looking for ways to improve the performance of bases in roadways,
conserve aggregates, reduce future maintenance costs, and reduce time needed to
rehabilitate the roadway. To meet this objective, geogrid base reinforcement was
designed as an experimental feature in two sections on this project.
Three sections each one-half mile in length were constructed. Two sections used
geogrid in the base and one was a control section. The three sections were built as
shown in Table 4. The original design called for a blended base (50% salvaged HBP and
50% virgin aggregate). However, to save cost and time, Class 5 was used on the top
8.5” and blended base was used for the bottom for Section 1 and 2. Section 3 used
Class 5 for the entire 12.0.” In the original design, the geogrid was supposed to be laid
11.5” below the top of the pavement for Section 2 and 3. Section 3 geogrid was installed
properly at 11.5” below the top of pavement but the Section 2 geogrid was installed 14.0”
below the top of the pavement.
Section Number
1 2 3 HBP 5.5” 5.5” 5.5”
Class 5 8.5” 8.5” 6.0” Geogrid none 42.67 ft. wide 42.67 ft. wide
Blend Base 9.5” 9.5” None Class 5 None None 6.0"
Table 4
The geogrid installation was completed with minimal problems. Patches had to
be placed in a few areas due to geogrid tears. Waves in the geogrid occurred if
aggregate dumping or spreading of the aggregate was placed too fast. Overall the
geogrid installation went very well.
A 1½” lift of asphalt was placed on the compacted base and served as the driving
surface until the final asphalt lift was placed in 2004. Load testing was conducted with
the FWD on these three sections. The base modulus of each section was computed
from test data and either met or passed the design value.

North Dakota Department of Transportation 14 Materials & Research Division
Base Reinforcement Using Geogrid ND 02-01 Fifth Evaluation Report
Evaluation
Falling Weight Deflectometer
The Falling Weight Deflectometer (FWD) is a tool that is used to help evaluate
the strength of roadway sections. It drops a pre-selected load onto the pavement
surface. The resulting deflection of the roadway system is measured and stored.
The modulus of each layer is calculated from the data using the Elmod 5 program.
The FWD is shown in photo 12:
Photo 12 – The FWD operation.
The modulus is an indication of load carrying capacity. The load carrying
capacity generally increases with a modulus increase. A base value used for design
purposes is 20 ksi.

North Dakota Department of Transportation 15 Materials & Research Division
Base Reinforcement Using Geogrid ND 02-01 Fifth Evaluation Report
First Evaluation-2004 to 2005
The FWD data was collected and analyzed from all three sections from 2003 to
2005. The average base modulus in Section 1 was 41,000 psi with a standard
deviation of 8,900 psi; the average base modulus was 41,500 psi with a standard
deviation of 7,550 psi in Section 2, and in Section 3 the average base modulus was
28,500 psi with a standard deviation of 5,500 psi. Tables and graphs showing the
deflection and modulus of the asphalt, base and subgrade layers of each section can
be found in Appendix A and Appendix B. The deflection from sensor #1 at the load
plate is the highest or total deflection of the load applied.
The roadway had an asphalt thickness of 1½“in 2003 and received an
additional 4” of asphalt in 2004. This asphalt thickness will affect the modulus of
each layer. The base and subgrade modulus values in Section 3 are lower than in
Section 1 and 2.
Section 3 has a 12” base and Section 1 and 2 have an 18” base. The average
deflection of Section 3, as shown in Table 5, is higher than Sections 1 and 2. This
means Section 3 deflected more and thus results in lower modulus values. As a
rule, when the deflections increase the modulus decreases.
Maintenance costs were minimal. Refer to Appendix C. Second Evaluation-2006 to 2008
The FWD data was collected and analyzed from all three sections from 2006
through 2008. The average base modulus in Section 1 was 38,000 psi with a
standard deviation of 9,700 psi; the average base modulus was 32,000 psi with a
standard deviation of 6,700 psi in Section 2, and in Section 3 the average base
modulus was 32,000 psi with a standard deviation of 8,000 psi. The average base
and subbase modulus were similar to the FWD data from the first evaluation
completed from 2004 to 2005. Updated tables and graphs showing the average
deflection and modulus of the asphalt, base and subgrade layers of each section
can be found in Appendix A and Appendix B. The deflection from sensor #1 at the
load plate is the highest or total deflection of the load applied.
Maintenance did not do any work to these sections, refer to Appendix C.

North Dakota Department of Transportation 16 Materials & Research Division
Base Reinforcement Using Geogrid ND 02-01 Fifth Evaluation Report
Third Evaluation-2009 to 2010
Pathways van data collected show an IRI of 59 for mile point 62, which falls
into the good category. The FWD data was collected and analyzed from all three
sections in 2009 and 2010. The average base modulus in Section 1 was 37,000 psi
with a standard deviation of 11,500 psi; the average base modulus was 29,000 psi
with a standard deviation of 6,400 psi in Section 2, and in Section 3 the average base
modulus was 23,000 psi with a standard deviation of 5,700 psi. The average base and
subbase modulus were similar to the FWD data from the second evaluation completed
from 2006 to 2008. Updated tables and graphs showing the average deflection and
modulus of the asphalt, base and subgrade layers of each section can be found in
Appendix A and Appendix B. The deflection from sensor #1 at the load plate is the
highest or total deflection of the load applied.
Maintenance did not do any work to these sections, refer to Appendix C.
Section 1 (control section) has one transverse crack that is sealed and one crack
in the control section that is unsealed. Section 2 and Section 3 have no visual
distresses.

North Dakota Department of Transportation 17 Materials & Research Division
Base Reinforcement Using Geogrid ND 02-01 Fifth Evaluation Report
Fourth Evaluation-2011 to 2012
Materials and Research personnel visually inspected the project on 1/7/2013.
2012 data from the pathways van shows an IRI of 63 at mile point 62, which falls into
the good category. FWD data was collected and analyzed from all three sections in
both 2011 and 2012. Updated tables and graphs showing the average deflection and
modulus of the asphalt, base and subgrade layers of each section can be found in
Appendix A and Appendix B. The average deflection of each section is from sensor
#1 at the load plate and is the highest or total deflection of the load applied.
The fourth evaluation was the first evaluation completed that had a change
between the sections. Section 1 and 2 did not have a change from the last evaluation
completed in 2010, but Section 3 had some rutting in the wheel paths. Because of the
change in the sections, a comparison of the traffic counts used in the design from
2002 and the current traffic counts was performed to see if increased traffic was a
factor in the change.
The original 20-year design completed in 2002 was based on traffic data that
predicted an Average Annual Daily Truck Traffic (AADTT) of 555 at the end of the
design period. The AADTT in 2012 was 945 which was an increase of 219% from 430
in 2002. This data shows that there is a significant traffic change in traffic over the
section. The traffic information can be found in Appendix D.
Maintenance did not do any work in these sections, refer to Appendix C.
Section 1(Control):
There were two transverse cracks in the control section (similar to the third
evaluation), one that is sealed and one that is unsealed. There were no other visual
distresses found in Section 1 besides the two cracks. The average base modulus in
Section 1 was 41,000 psi with a standard deviation of 9,800 psi. The average base and
subbase modulus were similar to the FWD data from the third evaluation completed from
2009 to 2010.

North Dakota Department of Transportation 18 Materials & Research Division
Base Reinforcement Using Geogrid ND 02-01 Fifth Evaluation Report
Section 2:
There were no visual distresses found in Section 2. The average base modulus
was 33,000 psi with a standard deviation of 6,750 psi in Section 2. The average base
and subbase modulus were similar to the FWD data from the third evaluation completed
from 2009 to 2010.
Section 3:
Rutting was found from the visual inspection in Section 3. The rutting ranged from
1/8” to 1/4” over the length of the whole section and was found in the left wheel path.
There were no other visual distresses found in Section 3 besides the rutting. The average
base modulus was 29,500 psi with a standard deviation of 6,000 psi in Section 3. The
average base and subbase modulus were similar to the FWD data from the third
evaluation completed from 2009 to 2010. The similarities in the base and subbase
modulus imply that there might be other factors that are causing this section to rut. The
traffic counts show that there is a significant increase in traffic from construction in 2002
to the recent traffic counts collected in 2012.

North Dakota Department of Transportation 19 Materials & Research Division
Base Reinforcement Using Geogrid ND 02-01 Fifth Evaluation Report
Fifth Evaluation-2013 to 2014
Materials and Research personnel visually inspected the project on 11/26/2013
and 09/04/2014. The 2013 data from the pathways van shows an IRI of 66 at mile
point 62, which falls into the good category. FWD data was collected and analyzed
from all three sections in both 2013 and 2014. Updated tables and graphs showing
the average deflection and modulus of the asphalt, base and subgrade layers of each
section can be found in Appendix A and Appendix B. The average deflection of each
section is from sensor #1 at the load plate and is the highest or total deflection of the
load applied.
All of the sections have increased rutting from the last evaluation completed in
2012 and there were new cracks throughout sections in 2014 evaluation.
Maintenance did not do any work in these sections, refer to Appendix C.

North Dakota Department of Transportation 20 Materials & Research Division
Base Reinforcement Using Geogrid ND 02-01 Fifth Evaluation Report
Section 1(Control) Pavement Condition
There were two transverse cracks in the control section, one that is sealed and one
that is unsealed, and there was one transverse shoulder crack which extends to the
driving lane. It was also observed that rutting was occurring throughout this section in
both wheel paths which was a change from no rutting from the fourth evaluation. The
rutting was between 1/8” to 1/4”, and can be seen the photo below.
Photo 4, Rutting in Section 1
Soil Modulus The average base modulus in Section 1 was 34,500 psi with a standard deviation of
7,900 psi. The average base and subbase modulus were similar to the FWD data from
the fourth evaluation completed from 2011 to 2012.

North Dakota Department of Transportation 21 Materials & Research Division
Base Reinforcement Using Geogrid ND 02-01 Fifth Evaluation Report
Section 2 Pavement Condition
There was one transverse crack found in Section 2 which was a change from the
fourth evaluation. It was observed that rutting was occurring throughout this section in
both wheel paths which was a change from no rutting from the fourth evaluation. The
rutting was between 1/8” to 1/4”, and can be seen in the photo below.
Photo 5, Rutting in Section 2
Soil Modulus The average base modulus was 28,800 psi with a standard deviation of 6,600 psi in
Section 2. The average base and subbase modulus were similar to the FWD data from
the fourth evaluation completed from 2011 to 2012.

North Dakota Department of Transportation 22 Materials & Research Division
Base Reinforcement Using Geogrid ND 02-01 Fifth Evaluation Report
Section 3 Pavement Condition
There were one 6’ longitudinal crack in the outside wheel path, one transverse
shoulder crack, and four transverse cracks approximately 2ft apart found in Section 3
which was a change from the fourth evaluation. Rutting was found from the visual
inspection in Section 3. The rutting found was between 1/8” and 1/2”, which was similar
from the fourth evaluation. The rutting is shown in the photo below:
Photo 6, Rutting in Section 3
Soil Modulus The average base modulus was 27,800 psi with a standard deviation of 5,500 psi in
Section 3. The average base and subbase modulus were similar to the FWD data from
the fourth evaluation completed from 2011 to 2012.

North Dakota Department of Transportation 23 Materials & Research Division
Base Reinforcement Using Geogrid ND 02-01 Fifth Evaluation Report
Summary
From 2004 until 2010, all three sections were performing well and there was not a
significant difference between the different sections. In 2012 it was observed that rutting
was starting to occur in Section 1 and rutting was found from the visual inspection in
Section 3. In 2013 and 2014 it was observed that rutting was occurring in all of the
sections and it was 1/8” to 1/2” over the length of the project. There were new cracks in
all of the sections which were one transverse shoulder crack in Section 1, one transverse
crack in Section 2 and one longitudinal crack, four transverse cracks and one transverse
shoulder crack in Section 3 during the evaluation in 2014.
The similarities in the base and subgrade modulus from year to year show that there
might be other factors that are causing the sections to rut. The original 20-year design
completed in 2002 was based on traffic data that predicted an Average Annual Daily
Truck Traffic (AADTT) of 555 at the end of the design period. The AADTT in 2014 was
925 which was an increase of 215% from 430 in 2002. This data shows that there is a
significant change in traffic over the sections since construction in 2002.
The chip seal that was placed in 2007 over the whole project does have noticeable
wear in the wheel tracks. Pathways van 2013 data for mile point 62 shows an IRI of 66
which falls into the good category. The ride has gotten slightly worse since the 2012
evaluation, which had an IRI of 63. There hasn’t been any maintenance work performed
on these sections other than sealing one crack since the 2007 chip seal.
Materials and Research personnel will continue to monitor this project and
another evaluation will be completed in 2016.

Appendix A: Average FWD results for each section

A-2
Average Deflection (Mils) Section 2003* 2004 2005 2006 2007 2008 2010 2011 2012 2013 2014
1 (Control) 15.77 10.99 10.09 12.44 13.11 12.54 13.10 10.09 12.34 13.65 11.19
2 18.02 10.89 9.97 14.02 14.62 15.12 15.15 11.22 14.01 16.45 12.12
3 26.21 15 14.21 17.99 18.4 18.83 19.51 15.65 18.70 20.34 16.08
Table 5: Average deflections for each section
*1.5 in. of HBP was placed in 2003 with the remainder 4.0 in. laid in 2004.
Average Modulus (ksi) Section Asphalt
2003* 2004 2005 2006 2007 2008 2010 2011 2012 2013 2014 1 (Control) 1154 446 593 276 310 300 326 675 336 349 564
2 1105 435 588 234 271 244 288 619 325 278 571 3 1331 337 406 187 171 193 213 353 222 203 368
Table 6: Average asphalt modulus for each section *1.5 in. of HBP was placed in 2003 with the remainder 4.0 in. laid in 2004.
Average Modulus (ksi) Section Base
2003* 2004 2005 2006 2007 2008 2010 2011 2012 2013 2014 1 (Control) 45 40 42 40 36 39 37 41 41 33 36
2 31 41 42 35 31 30 29 49 31 27 31 3 22 28 29 30 39 27 23 33 26 27 29
Table 7: Average base modulus for each section
*1.5 in. of HBP was placed in 2003 with the remainder 4.0 in. laid in 2004.
Section Average Modulus (ksi)
Subgrade 2003* 2004 2005 2006 2007 2008 2010 2011 2012 2013 2014
1 (Control) 28 25 23 27 24 25 25 25 27 24 24 2 28 25 25 26 23 24 23 21 24 22 21 3 16 22 21 21 14 20 20 12 20 17 17
Table 8: Average subgrade modulus for each section *1.5 in. of HBP was placed in 2003 with the remainder 4.0 in. laid in 2004.

Appendix B: FWD Graphs

B-4
0
15
30
45
61.4
000
61.4
100
61.4
200
61.4
301
61.4
400
61.4
500
61.4
600
61.4
700
61.4
800
61.4
901
61.5
003
61.5
100
61.5
201
62.0
000
62.0
100
62.0
200
62.0
301
62.0
400
62.0
500
62.0
600
62.0
701
62.0
801
62.0
900
62.1
001
62.1
102
62.1
201
62.1
302
Def
lect
ion
(Mill
i-Inc
hes)
Stations (RP.feet)
NH-4-052(044)058 Section 1 (Control) Deflections
2003 2004 2005 2006 2007 2008 2010 2011 2012 2013 2014
2003 was tested with only 1.5" lift. The remainder of years were tested with 5.5" of HBP.
0
15
30
45
62.1
363
62.1
501
62.1
600
62.1
700
62.1
800
62.1
900
62.2
000
62.2
101
62.2
201
62.2
303
62.2
402
62.2
500
62.2
600
62.2
701
62.2
903
62.3
000
62.3
100
62.3
200
62.3
300
62.3
403
62.3
501
62.3
599
62.3
701
62.3
801
62.3
902
Def
lect
ion(
Mill
i-Inc
hes)
Stations (RP.feet)
NH-4-052(044)058 Section 2 Deflections
2003 2004 2005 2006 2007 2008 2010 2011 2012 2013 2014
2003 was tested with only 1.5" lift. The remainder of years were tested with 5.5" of HBP.

B-5
0
15
30
45
62.4
005
62.4
101
62.4
200
62.4
303
62.4
400
62.4
501
62.4
602
62.4
702
62.4
800
62.4
900
62.5
002
62.5
102
62.5
203
63.0
000
63.0
100
63.0
199
63.0
301
63.0
401
63.0
503
63.0
602
63.0
700
63.0
801
63.0
900
63.1
002
63.1
100
63.1
201
63.1
301
Def
lect
ion
(mill
i-Inc
hes)
Stations (RP.feet)
NH-4-052(044)058 Section 3 Deflections
2003 2004 2005 2006 2007 2008 2010 2011 2012 2013 2014
2003 was tested with only 1.5" lift. The remainder of years were tested with 5.5" of HBP.
0200400600800
100012001400160018002000
61.4
000
61.4
100
61.4
200
61.4
301
61.4
400
61.4
500
61.4
600
61.4
700
61.4
800
61.4
901
61.5
003
61.5
100
61.5
201
62.0
000
62.0
100
62.0
200
62.0
301
62.0
400
62.0
500
62.0
600
62.0
701
62.0
801
62.0
900
62.1
001
62.1
102
62.1
201
62.1
302
Mod
ulus
(KSI
)
Stations (RP.feet)
NH-4-052(044)058 Section 1 (Control) HBP
2003 2004 2005 2006 2007 2008 2010 2011 2012 2013 2014
2003 was tested with only 1.5" lift. The remainder of years were tested with 5.5" of HBP.

B-6
0
200
400
600
800
1000
1200
1400
1600
1800
2000
62.1
363
62.1
501
62.1
600
62.1
700
62.1
800
62.1
900
62.2
000
62.2
101
62.2
201
62.2
303
62.2
402
62.2
500
62.2
600
62.2
701
62.2
903
62.3
000
62.3
100
62.3
200
62.3
300
62.3
403
62.3
501
62.3
599
62.3
701
62.3
801
62.3
902
Mod
ulus
(KSI
)
Stations (RP.feet)
NH-4-052(044)058 Section 2 HBP
2003 2004 2005 2006 2007 2008 2010 2011 2012 2013 2014
2003 was tested with only 1.5" lift. The remainder of years were tested with 5.5" of HBP.
0
200
400
600
800
1000
1200
1400
1600
1800
2000
62.4
005
62.4
101
62.4
200
62.4
303
62.4
400
62.4
501
62.4
602
62.4
702
62.4
800
62.4
900
62.5
002
62.5
102
62.5
203
63.0
000
63.0
100
63.0
199
63.0
301
63.0
401
63.0
503
63.0
602
63.0
700
63.0
801
63.0
900
63.1
002
63.1
100
63.1
201
63.1
301
Mod
ulus
(KSI
)
Stations (RP.feet)
NH-4-052(044)058 Section 3 HBP
2003 2004 2005 2006 2007 2008 2010 2011 2012 2013 2014
2003 was tested with only 1.5" lift. The remainder of years were tested with 5.5" of HBP.

B-7
0
15
30
45
60
75
61.4
000
61.4
100
61.4
200
61.4
301
61.4
400
61.4
500
61.4
600
61.4
700
61.4
800
61.4
901
61.5
003
61.5
100
61.5
201
62.0
000
62.0
100
62.0
200
62.0
301
62.0
400
62.0
500
62.0
600
62.0
701
62.0
801
62.0
900
62.1
001
62.1
102
62.1
201
62.1
302
Mod
ulus
(KSI
)
Stations (RP.feet)
NH-4-052(044)058 Section 1 (Control) Base
2003 2004 2005 2006 2007 2008 2010 2011 2012 2013 2014
2003 was tested with only 1.5" lift. The remainder of years were tested with 5.5" of HBP.
0
15
30
45
60
75
62.1
363
62.1
501
62.1
600
62.1
700
62.1
800
62.1
900
62.2
000
62.2
101
62.2
201
62.2
303
62.2
402
62.2
500
62.2
600
62.2
701
62.2
903
62.3
000
62.3
100
62.3
200
62.3
300
62.3
403
62.3
501
62.3
599
62.3
701
62.3
801
62.3
902
Mod
ulus
(KSI
)
Stations (RP.feet)
NH-4-052(044)058 Section 2 Base
2003 2004 2005 2006 2007 2008 2010 2011 2012 2013 2014
2003 was tested with only 1.5" lift. The remainder of years were tested with 5.5" of HBP.

B-8
0
15
30
45
60
75
62.4
005
62.4
101
62.4
200
62.4
303
62.4
400
62.4
501
62.4
602
62.4
702
62.4
800
62.4
900
62.5
002
62.5
102
62.5
203
63.0
000
63.0
100
63.0
199
63.0
301
63.0
401
63.0
503
63.0
602
63.0
700
63.0
801
63.0
900
63.1
002
63.1
100
63.1
201
63.1
301
Mod
ulus
(KSI
)
Stations (RP.feet)
NH-4-052(044)058 Section 3 Base
2003 2004 2005 2006 2007 2008 2010 2011 2012 2013 2014
2003 was tested with only 1.5" lift. The remainder of years were tested with 5.5" of HBP.
0
15
30
45
60
61.4
000
61.4
100
61.4
200
61.4
301
61.4
400
61.4
500
61.4
600
61.4
700
61.4
800
61.4
901
61.5
003
61.5
100
61.5
201
62.0
000
62.0
100
62.0
200
62.0
301
62.0
400
62.0
500
62.0
600
62.0
701
62.0
801
62.0
900
62.1
001
62.1
102
62.1
201
62.1
302
Mod
ulus
(KSI
)
Stations (RP.feet)
NH-4-052(044)058 Section 1 (Control) Subgrade
2003 2004 2005 2006 2007 2008 2010 2011 2012 2013 2014
2003 was tested with only 1.5" lift. The remainder of years were tested with 5.5" of HBP.

B-9
0
15
30
45
60
62.1
363
62.1
501
62.1
600
62.1
700
62.1
800
62.1
900
62.2
000
62.2
101
62.2
201
62.2
303
62.2
402
62.2
500
62.2
600
62.2
701
62.2
903
62.3
000
62.3
100
62.3
200
62.3
300
62.3
403
62.3
501
62.3
599
62.3
701
62.3
801
62.3
902
Mod
ulus
(KSI
)
Stations (RP.feet)
NH-4-052(044)058 Section 2 Subgrade
2003 2004 2005 2006 2007 2008 2010 2011 2012 2013 2014
2003 was tested with only 1.5" lift. The remainder of years were tested with 5.5" of HBP.
0
15
30
45
60
62.4
005
62.4
101
62.4
200
62.4
303
62.4
400
62.4
501
62.4
602
62.4
702
62.4
800
62.4
900
62.5
002
62.5
102
62.5
203
63.0
000
63.0
100
63.0
199
63.0
301
63.0
401
63.0
503
63.0
602
63.0
700
63.0
801
63.0
900
63.1
002
63.1
100
63.1
201
63.1
301
Mod
ulus
(KSI
)
Stations (RP.feet)
NH-4-052(044)058 Section 3 Subgrade
2003 2004 2005 2006 2007 2008 2010 2011 2012 2013 2014
2003 was tested with only 1.5" lift. The remainder of years were tested with 5.5" of HBP.

Appendix C: Maintenance Costs

Maintenance Costs (dollars/lane mile) Section 2003 2004 2005 2006 2007 2008 2009 2010 2011 2012 2013 2014
1 (Control) 0 0 0 0 0 0 0 0 0 0 0 0
2 0 0 0 0 0 0 0 0 0 0 0 0
3 0 0 0 0 0 0 0 0 0 0 0 0
Table 9 On 12/16/2008, 5/8/2011, 1/8/2013 and 2/10/2015 Materials and
Research personal spoke to Monte Lee (Minot District Maintenance
Foreman). He stated that there has not been any maintenance performed
on the three research sections near Donnybrook.

Appendix D: 2002 and 2012 Traffic Counts

2002 Traffic

2012 Traffic

2014 Traffic

Appendix E: Linear Soils Report
D - 1
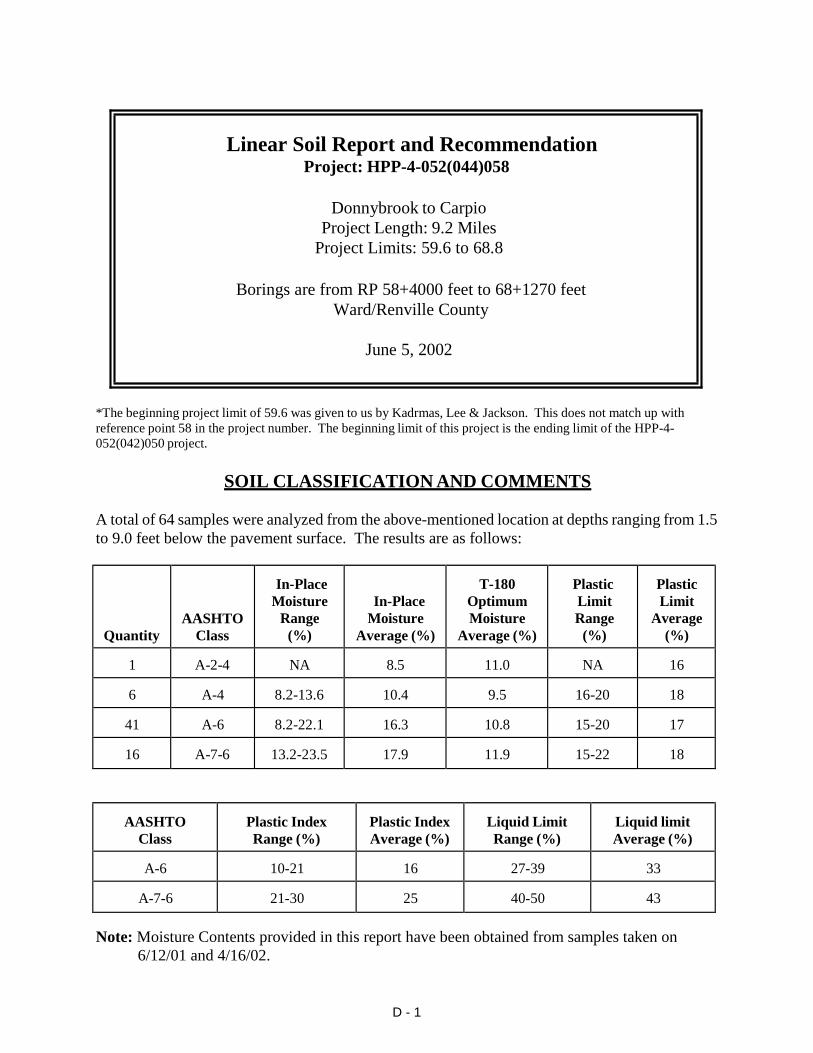
Linear Soil Report and Recommendation Project: HPP-4-052(044)058
Donnybrook to Carpio Project Length: 9.2 Miles
Project Limits: 59.6 to 68.8
Borings are from RP 58+4000 feet to 68+1270 feet Ward/Renville County
June 5, 2002
*The beginning project limit of 59.6 was given to us by Kadrmas, Lee & Jackson. This does not match up with reference point 58 in the project number. The beginning limit of this project is the ending limit of the HPP-4- 052(042)050 project.
SOIL CLASSIFICATION AND COMMENTS
A total of 64 samples were analyzed from the above-mentioned location at depths ranging from 1.5 to 9.0 feet below the pavement surface. The results are as follows:
Quantity
AASHTO Class
In-Place Moisture
Range (%)
In-Place Moisture
Average (%)
T-180 Optimum Moisture
Average (%)
Plastic Limit Range
(%)
Plastic Limit
Average (%)
1
A-2-4
NA
8.5
11.0
NA
16
6
A-4
8.2-13.6
10.4
9.5
16-20
18
41
A-6
8.2-22.1
16.3
10.8
15-20
17
16
A-7-6
13.2-23.5
17.9
11.9
15-22
18
AASHTO Class
Plastic Index Range (%)
Plastic Index Average (%)
Liquid Limit Range (%)
Liquid limit Average (%)
A-6
10-21
16
27-39
33
A-7-6
21-30
25
40-50
43
Note: Moisture Contents provided in this report have been obtained from samples taken on 6/12/01 and 4/16/02.

D - 2
Linear Soil Report and Recommendations Project HPP-4-052(044)058 Page 2
SOIL CLASSIFICATION AND COMMENTS (Cont.)
Comparison of the In-Place Moisture Contents to the Plastic Limits at the 2, 3, and 4 foot depths are shown below:
Quantity
Below Plastic Limit
Plastic Limit to 5% Above
More than 5% Above Plastic Limit
2 Foot
50
76%
24%
None
3 Foot
55
62%
34%
4% (2 samples)
4 Foot
58
45%
50%
5% (3 samples)
5 Foot
9
67%
22%
11% (1 sample)
6 Foot
6
67%
33%
None
7 Foot
4
75%
25%
None
8 Foot
3
67%
33%
None
9 Foot
1
None
100%
None
The Plastic Index values ranged from 6 to 30. The swell potential, based on the Plastic Index (PI) results, is shown below:
Swell Potential
Low (PI<25)
Marginal (25<PI<35)
High (PI>35)
86%
14% (9 samples)
None
Frost Susceptibility: None of the samples were classified as F4 soils (Highly Frost Susceptible).
Group Index: The A-6 and A-7-6 Group Indexes ranged from a low of 0 to a high of 23 with an average of 8. A group index of 20 or greater indicates a very poor sub-grade material. Only two samples from this project were above 20.

D - 3
Linear Soil Report and Recommendations Project HPP-4-052(044)058 Page 3
SOIL CLASSIFICATION AND COMMENTS (Cont.)
Moisture samples were taken at all boring locations. The results are as follows:
Depth
Quantity
In-Place Moisture Range (%)
In-Place Moisture Average (%)
2 Foot
105
2.1-16.0
9.7
3 Foot
114
2.2-22.9
11.2
4 Foot
117
1.8-28.6
11.7
5 Foot
10
10.0-21.7
15.3
6 Foot
7
6.3-17.6
12.5
7 Foot
5
12.1-17.4
14.8
8 Foot
3
16.5-19.4
17.5
9 Foot
1
NA
17.1
Moisture content at the 2, 3, and 4 foot depths were determined using analyzed samples and have been compared to the optimum moisture content as determined by the AASHTO T-180 specifications. In-Place Moisture vs. Optimum Moisture results are shown in the following table.
In-Place Moisture vs. Optimum Moisture
Quantity
AASHTO Class.
Below Optimum
Optimum to Moderate (0 to 6% over optimum)
Moderate to High
(6 to 10% over
optimum)
High
(10 to 16% over
optimum)
Very High (>16% over optimum)
1
A-2-4
None
100%
None
None
None
6
A-4
33%
67%
None
None
None
41
A-6
2%
56%
39%
2% (1 sample)
None
16
A-7-6
None
38%
62%
None
None

D - 4
Linear Soil Survey Report and Recommendations Project HPP-4-052(044)058 Page 4
SOIL CLASSIFICATION AND COMMENTS (Cont.)
Summary of Findings: Four percent of the 3 foot, 5% of the 4 foot, and 11% (1 sample) of the 5 foot samples had a moisture content in the More than 5% Above the Plastic Limit@ range.
Eighty-six percent of the sample had low swell potential. The remaining samples possessed marginal swell potential.
The In-Place moisture contents at the two, three, and four foot depths were 11.2%, 11.7%, and 15.3%, respectively.
One A-6 sample had a moisture content in the High (10%-16% over optimum) category.
Maintenance Problem Areas: On June 12th, 2001, Monte Babeck, Drill Crew Chief, and Monte Lee, Minot District Maintenance Coordinator, met and reviewed the project. A general observation of the pavement revealed several depressed, transverse cracks. The following areas were mentioned by Mr. Lee as problem areas.
-RP 63+0500 to RP 63+0700: This area has been blade patched multiple times because of settlement and a dip forming over a culvert. -RP 63+2800 to RP 63+3200: A blade patch and chip seal have been placed in this area. The main types of distress were alligator cracking and secondary cracking. Pieces of asphalt have broken away in some area. -RP 66+2500 to RP 67+0000: This area is located on the backside of a hill. Blade patching and scotch patching have been performed here. Alligator cracking was part of the reason for the patching. -RP 67+0000 to RP 68+0000: This area has multiple blade patches due to rutting, shoving, and depressed cracks.
Water was found adjacent to the roadway in the following areas.
-RP 60+0700 to RP 60+1700: Water present South of the roadway 7-8 feet below road grade. -RP 65+0000 to RP 65+1300: Water present South of the roadway 7-8 feet below road grade. -RP 65+3400 to RP 65+4100: Water present South of the roadway 7-8 feet below road grade. -RP 67+1100 to RP 67+1800: Water present North of the roadway 5-6 feet below road grade.

D - 5
Linear Soil Survey Report and Recommendations Project HPP-4-052(044)058 Page 5
SOIL CLASSIFICATION AND COMMENTS (Cont.)
Roadway Pavement Section: This section of roadway was originally graded in 1947. In 1947, 2.0 inches of asphalt was placed on 5.0 inches of stabilized base. Since then four 1.5 inch overlays have been placed from the years of 1956 to 1986. A contract sand seal was placed in 1988 and a 1.0 inch intermittent contract patch was placed in 1994.
This is to be a grade/aggregate base project. The proposed pavement section is 5.5 inches of HBP, placed upon 18 inches of dense graded base.
Maintenance costs totaled $74,568 from RP 59 to 68, during the years of 1992 through 2000. The average cost per mile per year was $828. The most work was performed in miles 66 and 67. In mile 66 $19,158 was spent over the 9 years, averaging $2,129 of maintenance per year. Mile
67 had $14,914 in maintenance, with an average of $1,657 per year. The majority of the work performed in these miles were in the form of bituminous overlays/blade patching.

D - 6
Linear Soil Survey Report and Recommendations Project HPP-4-052(044)058 Page 6
DESIGN RECOMMENDATIONS Subcut Recommendations: We recommend subcutting the first area due to the presence of organics and high moisture content at the three foot depth. The remaining 18" subcuts are recommended because of past maintenance problems, poor soil properties uncovered during the soil analysis, or a combination of the the two.
Note: To account for unforseen poor subgrade conditions we recommend allowing an additional 1,000 feet of 18" subcut to be used at the discretion of the Project Engineer.
Note: We recommend that subcuts be performed with a backhoe using a smooth cutting edge to minimize disturbance to underlying soils. In addition, we recommend that construction equipment with heavy tire pressures traveling over the following soft subgrade areas be kept to a minimum to prevent additional moisture from pumping up.
RP + Feet to RP + Feet Remarks 60+3250 60+3750
Total 36" Subcut Length=500 feet
63+2800 63+3200 68+0600 68+1000
Proposed 18" Subcut Length=800 feet Additional 18" Subcut Length=1000 feet Total 18" Subcut Length=1800 feet
Subcut to a depth of 36" below the newly proposed grade. Place Reinforcement fabric (R1) at the bottom of all subcut excavations and backfill with Class 3, Class 5, or salvaged aggregate. Place a minimum of 12" of aggregate on the fabric prior to compacting. Do not scarify the bottom of the subcut. Subcut to a depth of 18" below the newly proposed grade. Place Reinforcement fabric (R1) at the bottom of all subcut excavations and backfill with Class 3, Class 5, or salvaged aggregate. Place a minimum of 12" of aggregate on the fabric prior to compacting. Do not scarify the bottom of the subcut.
Notes: A 20:1 transition must be constructed prior to entering and on exiting subcut and culvert or box culvert sections to avoid differential heave.
Compaction of aggregate for subgrade repair should comply with NDDOT Standard Specification 302.04 E.
If areas of free water are encountered during construction drainage must be provided. Materials and Research can be contacted for drainage design.

Linear Soil Survey Report and Recommendations Project HPP-4-052(044)058 Page 7
D - 7
DESIGN RECOMMENDATIONS (Cont.) Subgrade Preparation: We recommend 12" Subgrade Preparation on this project. Subgrade Preparation should comply with NDDOT Standard Specification 230.02 B.5, Type C (12"). Compaction control should be in accordance with NDDOT Specification 203.02 G, Type A, and also with AASHTO T-180.
Pipe Installation: The culvert located within the area of RP 63+0500 to RP 63+0700 should be rebuilt according the current pipe detail. Attached is a copy of the pipe installation detail that should be followed for all pipe replacements.
If the vertical profile or horizontal alignment is changed in either the conceptual phase or the design phase, Materials and Research must be notified as soon as possible to ensure that there is adequate geotechnical information addressing these areas.
The information in this report is based on the grading/aggregate base option. If the proposed improvement changes, reassessment of our recommendations will be necessary.
Please contact me at 328-6907 or Jon Ketterling at 328-6908 if there are any questions or modifications to the plans for rehabilitation of this roadway.
Benjie Foss Geotechnical Section

Appendix F: Geogrid Tensile Strength Test Results

TENSILE STRENGTH TEST RESULTS ASTM D-6637
CLIENT: NORTH DAKOTA D.O.T. CLIENT PROJECT: AC-HPP-4-052(044)058
PROJECT NO.: L03127-08
544 Braddock Avenue • East Pittsburgh, PA 1'i:)1_2{ Phone (412) 823-7600 • Fax (412) 823-8999
LAB IDNO.: L03127-08-01 .MATERIAL: TENSAR BX1100 GEOGRID
SAMPLE: #1 LOT NO.: 071
TEST
UNITS SPECIMEN NO.
AVG
STD 1 2 3 4 5
RIB COUNT
WIDE WIDTH STRENGTH
MD
WIDE WIDTH STRENGTH
CD
RETEST WIDE WIDTH
STRENGTH CD
MD Ribs/ft. CD Ribs/ft.
2%-MD lbs./ft.
5%-MD lbs./ft. Ult.-MD lbs./ft.
Elong at Peak-%
2%-CD lbs./ft.
5%-CD lbs./ft. Ult.-CD lbs./ft.
Elong at Peak-%
2%-CD lbs./ft.
5%-CD lbs./ft. Ult -CD lbs /ft
7.94 10.67
253 663 941 10
424 1,033 1,628
12
440 1,044 1,593
11
313 710 944 8
427 1,027 1,608
12
439 1,044 1,650
12
301 707 946
8
410 1,015 1,618
13
441 1,030 1,525
10
297 712 961
8
423 1,028 1,620
12
418 1,025 1.498
9
287 689 966 9
421 1,024 1,509
9
446 1,063 1,649
11
290
696 952
9
421 1,025 1,597
12
437 1,041 1,583
11
22.66 20.74 11.09 0.64
6.74 6.55
49.37 1.37
11.10 15.01 69.74 1.25
CHECKED BY: tJ!1 DATE: & -)s-t)}
'I
H:\Syntheticsi:2003 Synthetics L03127.QB-01BiaxGrtd.xls]Sheet1 L03127.08-01 06125/03

E-2
LAB IDNO.: L03127-08"02 MATERIAL: TENSAR BX1100 GEOGRID
SAMPLE: #2 LOT NO.: 080
TEST
UNITS
SPECIMEN NO. AVG
STD 1 2 3 4 5
RIB COUNT
WIDE WIDTH
STRENGTH
MD
WIDE WIDTH STRENGTH
CD
MD Ribs/It CD Ribs/It
2%-MD lbs./ft.
5%-MD lbs./ft. Ult.-MD lbs./ft.
Elong at Peak-%
2%-CD lbslft 5%-CD lbs./ft. Ult.-CD lbs./ft.
Elong at Peak-%
7.94 10.63
302 710 897
7
439
1 '125 1,605
9
289 691 875 7
485 1 '158 1,661
11
299 693 975 10
490 1 '167 1,637
9
304 704 756 6
469 1 '132 1,454
7
276 689 995 10
534 .1 '197 1,624
10
294 698 900
8
484 1,156 1,596
9
11.51 9.09 94.63 2.05
34.75 29.14 82.12 1.43
CHECKED BY: DATE: & ,;25 .U_3
T:\Synthetics\2003 SyntheticsL031 27·08-02BiaxGrid.xis]Sheet1 L03127-08-02 6/25/03
544 Braddock Avenue • East Pittsburgh, PA 15112 • Phone (412) 823-7600 •. Fax (412) 823-8999

TENSILE STRENGTH TEST RESULTS ASTM D-6637
CLIENT: NORTH DAKOTA D.O.T. CLIENT PROJECT: AC-HPP-4-052(044)058
PROJECT NO.: L03127-08 LAB IDNO.: L03127-08-04 MATERIAL: TENSAR BX1100 GEOGRID
SAMPLE: #3 LOT NO.: 093
544 Braddock Avenue • East Pittsburgh, PA 15112 • Phone (412) 823-7600 • Fax (412) 823-8999 E-3
SAMPLE:.# 3 LOT NO.: 084
TEST
UNITS SPECIMEN NO.
AVG
STD 1 2 3 4 5
RIB COUNT
WIDE WIDTH STRENGTH
MD
WIDE WIDTH STRENGTH
co
MD Ribs/ft. CD Ribs/ft.
2%-MD lbs./ft.
5%-MD lbs./ft. Ult.-MD lbs./ft.
Elong at Peak-%
2%-CD lbs./ft.
5%-CD lbs./ft. Ult.-CD lbslft
El t P k %
7.94 10.33
292 706
1,058 17
504
1'161 1,587
10
295 705 979
9
476 1,133 1,505
9
312 717 900 7
446
1 '115 1,532
8
290 708 922
8
471 1,087 1,537
10
288 691 855
7
490
1'125 1,475
8
295 705 943 9
478 1,124 1,527
9
9.78 9.28 78.36 4.09
21.73 26.93 41.69 0.97
CHECKED BY: yo
T:\Synthetics\2003 Synthetics\(L031 27·08-03BiaxGrid.xts]Sheet1 L03127-G8-03 6125103

TENSILE STRENGTH TEST RESULTS ASTM D-6637
CLIENT: NORTH DAKOTA D.O.T. CLIENT PROJECT: AC-HPP-4-052(044)058
PROJECT NO.: L03127-08 LAB IDNO.: L03127-08-04 MATERIAL: TENSAR BX1100 GEOGRID
SAMPLE: #4 LOT NO.: 093
544 Braddock Avenue • East Pittsburgh, PA 1 1_1• Phone (412) 823-7600 • Fax (412) 823-8999
TEST
UNITS SPECIMEN NO.
AVG
STD 1 2 3 4 5
RIB COUNT
WIDE WIDTH
STRENGTH
MD
WIDE WIDTH STRENGTH
CD
MD Ribs/ft. CD Ribs/ft.
2%-MD lbs./ft.
5%-MD lbs./ft. Ult.-MD lbs./ft.
Elong at Peak-%
2%-CD lbslft 5%-CD lbs./ft. Ult.-CD lbs./ft.
Elong at Peak-%
7.94 10.38
299 708 875
7
477 1,123 1,566
10
293 700
1,025 11
479 1,141 1,414
7
293 698 926
8
480 1,126 1,564
10
302 708 941
8
447 1,091 1,551
10
286 689 904
8
438 1,097 1,576
11
294 701 934 8
464 1,115 1,534
10
6.17 7.85 56.74 1.58
19.95 21.01 67.88 1.36
CHECKED BY: y!Z DATE:&' · -0 3
T:\Synthetics\2003 Synthetics\{L03127 08-04BiaxGrid.xls]Sheet1 L03127-08-04 6/25/03

TENSILE STRENGTH TEST RESULTS ASTM D-6637
CLIENT: NORTH DAKOTA D.O.T. CLIENT PROJECT: AC-HPP-4-052(044)058
PROJECT NO.: L03127-13 LAB IDNO.: L03127-13-01 MATERIAL: TENSAR BX1100 GEOGRID
SAMPLE:# 5 LOT NO.: 013
544 Braddock Avenue East Pittsburgh, PA 15112 ·Phone (412) 823-7600 ·Fax (412) 823-8999 E-5
TEST
UNITS SPECIMEN NO.
AVG
STD 1 2 3 4 5
RIB COUNT
WIDE WIDTH STRENGTH
MD
WIDE WIDTH STRENGTH
CD
MD Ribslft CD Ribslft
2%-MD lbs./ft.
5%-MD lbs./ft. Ult.-MD lbslft
Elong at Peak-%
2%-CD lbslft 5%-CD lbslft Ult.-CD lbs./ft. Elong
at Peak-%
7.95 10.63
406 731
883 7
674 1,261 1,538
8
427 761 914
8
664 1,246 1,559
8
431 771 915
7
659 1 ,251 1,610
9
423 772 977
8
574 1 ,204 1,612
10
418 764 957
8
683 1,266 1,508
7
421 760 929
8
651 1,246 1,565
9
9.86 16.87 37.64 0.57
43.98 24.57 45.51 1.26
CHECKED BY: ;76 DATE: 8 - 2 8 -0 3
\\GEOSERVER\Data Drive\Synthetics\2003 Synthetics\(L03127-13-01 BiaxGri L03127-13-01 8/28/03