materials and methods - shodhgangashodhganga.inflibnet.ac.in/bitstream/10603/15221/11/11_chapter...
TRANSCRIPT

Dept. of Pharmaceutical Sciences, JJT University, Rajasthan 23
2.
MATERIALS AND METHODS
2.1 Materials
Procurement of drug and excipients
Drugs, excipients, chemicals/ reagents and instruments used for various experiments
are enlisted in Table 2.1 and 2.2.
Table 2.1: Drug, excipients, chemicals/ reagents used for various experiments
Material Gifted/Supplied by
Drug
Telmisartan
(Abbreviation used further: TEL )
Glochem Industries Ltd.
Vishakhapatnam, AP, India
Verapamil Hydrochloride
(Abbreviation used further: VPH )
Piramal Healthcare Limited,
Goregaon East, Mumbai, MS, India
Oil
Captex 355 ABITEC Corporation
Campul MCM
Acrysol EL 135 Corel Pharma, Gujarat, India
Capryol 90
Gattefosse India Pvt. Ltd., Mumbai Maisine 35-1
Capryol 90
Arachis oil
Loba Chemie Pvt. Ltd., Mumbai
Castor oil
Coconut oil
Cotton seed oil
Ethyl oleate
Oleic acid
Terpentine oil

Chapter 2 Materials and Methods
Dept. of Pharmaceutical Sciences, JJT University, Rajasthan 24
Surfactant and co-surfactant
Cremophore RH 40 BASF, Mumbai
Labrafac
Gattefosse India Pvt. Ltd., Mumbai
Labrafil 2125 cs
Labrasol
Plurol oleique
Transcutol P
Glycerol
Loba Chemie Pvt. Ltd., Mumbai
PEG 400
PEG 200
Span 20
Span 80
Tween 20
Tween 80
Solid carriers
HPMC K15 M Agenta pharma, Mumbai
Maltodextrin Loba Chemie Pvt. Ltd., Mumbai
Neusilin US2 Fuji chemicals Japan
Aerosil 200 S. D. Fine Chemicals, Mumbai
Table 2.2: Instruments used for various experiments
Instrument Make Place
DSC SIIO 6300, Japan Diya Labs, Mumbai, MS,
India
PXRD Bruker D2 Phaser Shivaji University, Kolhapur,
MS, India
FTIR BRUKER ALPHA-E Gaurishankar Education
Society’s Satara College of
Pharmacy, Satara, MS, India
Malvern Zetasizer Malvern Instruments Nano
ZS90
Indian Institute of Science,
Bangalore, Karnataka, India
SEM JEOL-JSM- 6360, Japan Shivaji University, Kolhapur,
MS, India
Digital Centrifuge Remi Motors Ltd., Mumbai

Chapter 2 Materials and Methods
Dept. of Pharmaceutical Sciences, JJT University, Rajasthan 25
Dissolution Test
Apparatus
Veego VDA-8DR
Tatyasaheb Kore College of
Pharmacy, Warananagar, MS,
India
Electronic Balance Shimadzu corporation
Hot Air Oven Laboratory oven, Dolphin
HPLC HPLC - AGILLENT-Model
NO.1120 LC Compact
Lab spray dryer JISL, LSD-48 mini spray dryer
Magnetic Stirrer Remi Motors Ltd., Mumbai
Rotary shaker Remi Motors Ltd., Mumbai
Stability chamber Remi Motors Ltd., Mumbai
Ultrasonicator Spectra Lab, Mumbai
UV-Visible
Spectrophotometer
Shimadzu-1800, Japan
Animals used
Table 2.3: Animals used in experiment
Rabbit
Species / Common name Rabbits (New Zealand, White)
Weight 1.6-2 Kg
Gender Any Sex
Proposed source of animals Animal House of Tatyasaheb Kore
College of Pharmacy, Warananagar, MS,
India
Rat
Species / Common name Wistar rat
Weight 250-300 g
Gender Male
Proposed source of animals Animal House of Tatyasaheb Kore
College of Pharmacy, Warananagar, MS,
India

Chapter 2 Materials and Methods
Dept. of Pharmaceutical Sciences, JJT University, Rajasthan 26
2.2 Drug profile
2.2.1 Telmisartan (Neil M. J., et al., 2006 and Burnier M., 2009)
Chemical Formula C33H30F2N4O2
Molecular weight 514.617 g/mol
Chemical Structure
Category Angiotensin II (AT1) receptor antagonist
Description White or slightly yellowish, crystalline powder
Melting range 261 - 263 0C
Pharmacokinetic
parameters
Pharmacokinetic parameters
Oral bioavailability 42 %
Plasma half-life mean 24 h
Volume of distribution 7.0 L/Kg
Plasma protein binding > 99.5 %
Plasma clearance > 800 mL/min
Onset of action Within 3 h after administration
of a single dose

Chapter 2 Materials and Methods
Dept. of Pharmaceutical Sciences, JJT University, Rajasthan 27
2.2.2 Verapamil hydrochloride (Indian Pharmacopoeia, 1996, The United State
Pharmacopoeia 2000 and Tripathi K. D. 2003)
Chemical Formula C13H12F2N6O
Molecular weight 491.07 g/mol
Chemical Structure
Category Calcium channel blocker
Description White, crystalline powder
Melting range 140 - 144 0C
Pharmacokinetic
parameters
Pharmacokinetic parameters
Oral bioavailability 20 - 35 %
Plasma half-life mean 2.8 - 7.4 h
Volume of distribution 5.0 L/Kg
Plasma protein binding 90 %
Plasma clearance 0.9 L/h/kg
Onset of action < 1.5 minutes (i.v.),
30 minutes (oral)
Disposition About 90% bound to plasma
protein. 70% eliminated by
kidney; 15% by gastrointestinal
tract.
Mechanism of action It dilates arterioles and has some a adrenergic blocking
activity – decreases total peripheral resistance but BP is only
modestly lowered. The heart rate generally decreases, A-V
conduction is slowed, but cardiac output is maintained by

Chapter 2 Materials and Methods
Dept. of Pharmaceutical Sciences, JJT University, Rajasthan 28
reflex sympathetic stimulation. Coronary flow is increased.
2.3 Excipient profile (Rowe R. C., et al., 2009)
2.3.1 Oleic acid
Chemical Name (Z)-9-Octadecenoic acid
CAS Registry Number 112-80-1
Empirical Formula C18H34O2
Molecular Weight 282.47
Structural Formula
Functional Category Emulsifying agent; skin penetrant.
Description A yellowish to pale brown, oily liquid with a characteristic
lard-like odor and taste.
Solubility Miscible with benzene, chloroform, ethanol (95%), ether,
hexane, and fixed and volatile oils; practically insoluble in
water.
Viscosity (dynamic) 26 mPa s (26 cP) at 25oC
Safety Oleic acid is used in oral and topical pharmaceutical
formulations.
Chapter 2 Materials and Methods
Dept. of Pharmaceutical Sciences, JJT University, Rajasthan 29
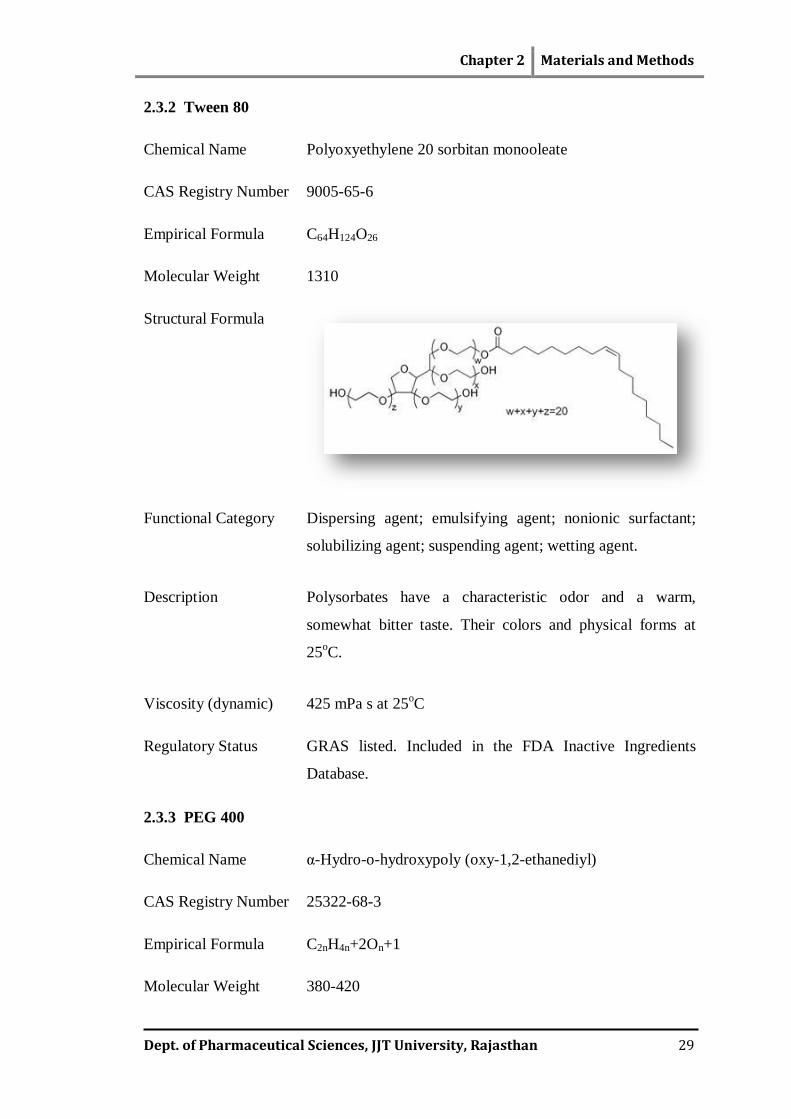
2.3.2 Tween 80
Chemical Name Polyoxyethylene 20 sorbitan monooleate
CAS Registry Number 9005-65-6
Empirical Formula C64H124O26
Molecular Weight 1310
Structural Formula
Functional Category Dispersing agent; emulsifying agent; nonionic surfactant;
solubilizing agent; suspending agent; wetting agent.
Description Polysorbates have a characteristic odor and a warm,
somewhat bitter taste. Their colors and physical forms at
25oC.
Viscosity (dynamic) 425 mPa s at 25oC
Regulatory Status GRAS listed. Included in the FDA Inactive Ingredients
Database.
2.3.3 PEG 400
Chemical Name α-Hydro-o-hydroxypoly (oxy-1,2-ethanediyl)
CAS Registry Number 25322-68-3
Empirical Formula C2nH4n+2On+1
Molecular Weight 380-420

Chapter 2 Materials and Methods
Dept. of Pharmaceutical Sciences, JJT University, Rajasthan 30
Structural Formula
Solubility Liquid polyethylene glycols are soluble in acetone, alcohols,
benzene, glycerin, and glycols.
Viscosity 90.0 mm2/s (cSt) at 25
oC
2.3.4 Castor oil
Chemical Name Castor oil
CAS Registry Number 8001-79-4
Empirical Formula C18H34O3
Molecular Weight 298.4608
Structural Formula
Functional Category Emollient; oleaginous vehicle; solvent.
Viscosity (dynamic) 1000 mPa s (1000 cP) at 20oC

Chapter 2 Materials and Methods
Dept. of Pharmaceutical Sciences, JJT University, Rajasthan 31
2.3.5 Labrasol
Functional Category Dissolution enhancer; emulsifying agent; nonionic
surfactant; penetration agent; solubilizing agent; sustained-
release agent.
Description It is roughly white oily liquid at room temperature. It has
little odour and HLB value of 14. It possesses relative
density of 1.06-1.07 at 20 ºC.
Solubility It is soluble in water and many organic solvent.
Regulatory Status USP-NF/EP/ IIG
2.3.6 Transcutol P
Empirical Formula C6H14O3
Molecular Weight 134.17356
Structural Formula
Functional Category A high purity solvent and solubilizer for poorly water
soluble active pharmaceutical ingredients. Associated with
improved drug penetration, permeation.
Description Colourless liquid
Solubility Soluble in water.
Safety Safety of use is supported by extensive toxicological
evaluations and precedence of use in approved
pharmaceutical products.
Regulatory Status USP-NF, EP, USIFA, IIG
Chapter 2 Materials and Methods
Dept. of Pharmaceutical Sciences, JJT University, Rajasthan 32
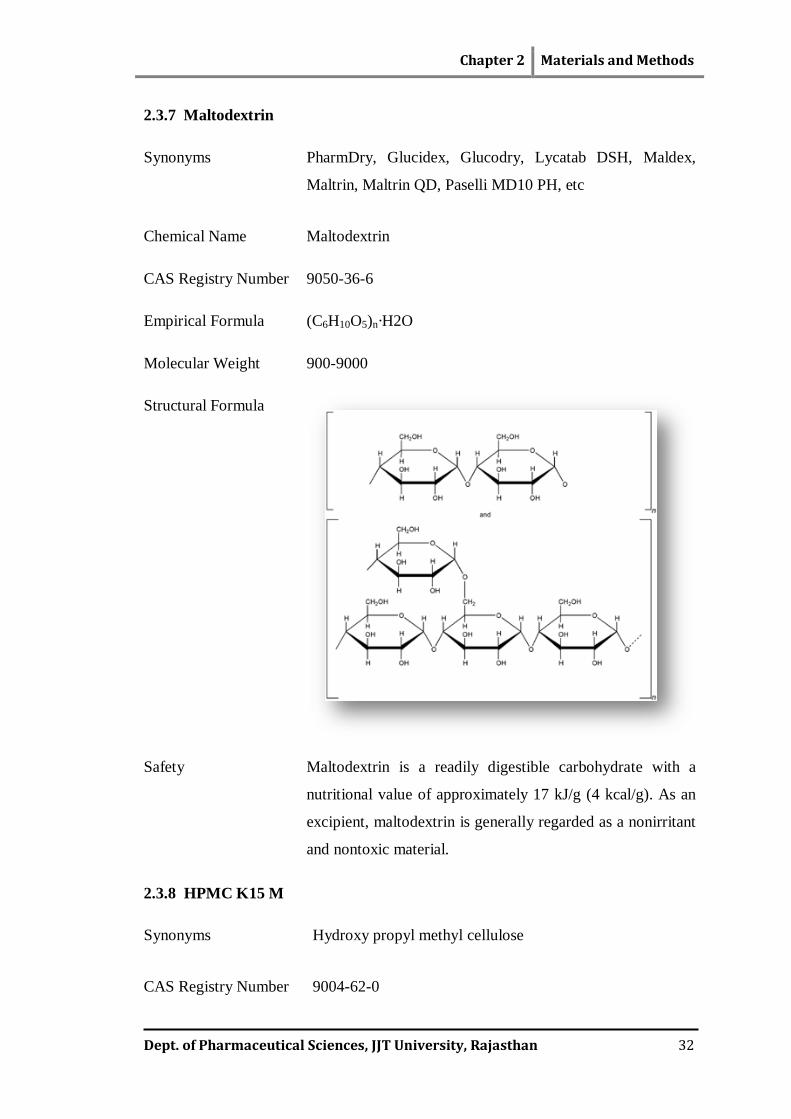
2.3.7 Maltodextrin
Synonyms PharmDry, Glucidex, Glucodry, Lycatab DSH, Maldex,
Maltrin, Maltrin QD, Paselli MD10 PH, etc
Chemical Name Maltodextrin
CAS Registry Number 9050-36-6
Empirical Formula (C6H10O5)n·H2O
Molecular Weight 900-9000
Structural Formula
Safety Maltodextrin is a readily digestible carbohydrate with a
nutritional value of approximately 17 kJ/g (4 kcal/g). As an
excipient, maltodextrin is generally regarded as a nonirritant
and nontoxic material.
2.3.8 HPMC K15 M
Synonyms Hydroxy propyl methyl cellulose
CAS Registry Number 9004-62-0

Chapter 2 Materials and Methods
Dept. of Pharmaceutical Sciences, JJT University, Rajasthan 33
Empirical Formula (C6H10O5)n·H2O
Structural Formula
Viscosity (dynamic) 15000 cps
2.3.9 Neusilin US2
Synonyms Aluminium magnesium silicate, Aluminosilicic acid
(HAlSiO4), magnesium salt, Aluminum Magnesium
Silicate, aluminum magnesium tetrakis(oxidanidyl)silane,
aluminum magnesium tetraoxidosilane, Angast,
Magnesium aluminate metasilicate, Magnesium
aluminosilicate (MgAl2Si2O8), Magnesium aluminum
silicate (MgAl2(SiO4)2), Neusilin, Neusilin FH 2,
Neusilin FL 2, Neusilin UFL 2
Chemical Name Aluminum magnesium tetraoxidosilane
CAS Registry Number 12511-31-8
Empirical Formula Al2O3·MgO·1.7SiO2·xH2O

Chapter 2 Materials and Methods
Dept. of Pharmaceutical Sciences, JJT University, Rajasthan 34
Structural Formula
Functional Category Functions for direct compression or wet granulation, oil
adsorption capacity and flow enhancing properties.
Description White amorphous granules and powder.
2.3.10 Aerosil 200
Chemical Name Silica
CAS Registry Number 7631-86-9, 112945-52-5
Empirical Formula SiO2
Molecular Weight 60.08

Chapter 2 Materials and Methods
Dept. of Pharmaceutical Sciences, JJT University, Rajasthan 35
2.4 Methods
2.4.1 Preformulation study
Preformulation study on the procured sample of drug includes conducting physical
tests and compatibility studies. (Lachman L., et al., 1990 and Howard Y. A., et al.,
2000)
2.4.1.1 Characterization of TEL and VPH
Organoleptic properties (Neil M. J., et al., 2006, Indian Pharmacopoeia, 2007 and
British Pharmacopoeia, 2009)
TEL and VPH were tested for organoleptic properties such as appearance, colour,
taste, etc.
Melting Point determination
Melting point determination of the obtained sample of TEL and VPH was done by
open capillary method (Neil M. J., et al., 2006, Indian Pharmacopoeia, 2007, British
Pharmacopoeia, 2009 and Vogel A. I., et al., et al., 1978)
pH
pH of TEL and VPH was determined in a 5% w/v solution prepared with the aid of
gentle heat. (Neil M. J., et al., 2006 and Indian Pharmacopoeia, 2007
Clarity and colour of solution
Clarity and colour of TEL solution was determined by preparing solution of 0.5 g of
TEL dissolved in 1M NaOH and diluted to 10 mL with same solvent. Clarity and
colour of 5.0% w/v solution of VPH was determined in carbon dioxide-free water
prepared with the aid of gentle heat. Clarity was determined manually. Results were
compared with specifications given in Pharmacopoeia and certificate of analysis
provided by drug sample provider. (Indian Pharmacopoeia, 2007 and British
Pharmacopoeia, 2009)
Loss on drying
Loss on drying was determined by keeping 0.5 g of TEL and 1 g of VPH in oven at
1050C for 2 h. Results were compared with specifications given in Pharmacopoeia

Chapter 2 Materials and Methods
Dept. of Pharmaceutical Sciences, JJT University, Rajasthan 36
and certificate of analysis provided by drug sample provider. (Indian Pharmacopoeia,
2007 and British Pharmacopoeia, 2009)
2.4.1.2 Spectroscopic study for TEL
A. UV Spectroscopy (Determination of λmax):
Preparation of Standard Curve (Patel P. A., et al., 2010)
In methanol
The standard curve in methanol was prepared to analyze the drug content in different
oils, surfactants and co-surfactants during solubility study of TEL. From this solution
10 mL was withdrawn and diluted to 100 mL with methanol. From this stock solution
serial dilutions were made to obtain the solutions in concentration ranging from 2-18
µg/mL. The absorbance of the solution was measured at 296 nm.
In hydrochloric acid buffer pH 1.2
10 mg of TEL was dissolved in a small amount of methanol in 100 mL volumetric
flask and the volume was made up to 100 mL using acid buffer pH 1.2 to obtain a
concentration of 100 μg/mL. From this solution 10 mL was withdrawn and diluted to
100 mL with acid buffer pH 1.2. From this stock solution serial dilutions were made
to obtain the solutions in concentration ranging from 2-18 µg/mL. The absorbance of
the solution was measured at 296 nm.
In phosphate buffer pH 7.5
From this solution 10 mL was withdrawn and diluted to 100 mL with phosphate
buffer pH 7.5. From this stock solution serial dilutions were made to obtain the
solutions in concentration ranging from 2-18 µg/mL. The absorbance of the solution
was measured at 296 nm.
B. IR spectrum interpretation
The infrared absorption spectrum of pure TEL was recorded on FT-IR
spectrophotometer (BRUKER ALPHA-E) and the spectrum analysis was done for
functional groups. (Vogel A. I., et al., et al., 1978 and Skoog D. A., et al., 2003)

Chapter 2 Materials and Methods
Dept. of Pharmaceutical Sciences, JJT University, Rajasthan 37
2.4.1.3 Spectroscopic study for VPH
A. UV Spectroscopy (Determination of λmax):
The stock solution of VPH was prepared by dissolving accurately 10 mg of VPH in
methanol in a 100 mL volumetric flask to obtain a concentration of 100 μg/mL. The
UV spectrum was recorded in the range of 220-360 nm on Shimadzu UV-visible
spectrophotometer (Shimadzu-1800, Japan) at 1 cm, slit width. (Skoog D. A., et al.,
2003)
B. IR spectrum interpretation
The infrared absorption spectrum of pure VPH was recorded on FT-IR
spectrophotometer (BRUKER ALPHA-E) and the spectrum analysis was done for
functional groups. (Indian Pharmacopoeia, 2007, Vogel A. I., et al., et al., 1978 and
Skoog D. A., et al., 2003)
2.4.2 Determination of the solubility of drugs in oils, surfactants and co-
surfactants
Different oils, surfactants, co-surfactants used to study solubility of TEL and VPH are
mentioned in Table 2.4. 2 mL of different oils, surfactant, and co-surfactants were
taken separately in small vial and excess amount of the drug was added to each vial.
The vials were tightly closed and were stirred continuously for 72 h using mechanical
shaker at 25oC. Then oils, surfactant, and co-surfactants were centrifuged at 10000
rpm for 10 min to separate un-dissolved drug. The supernatant was taken and diluted
with methanol and solubility was quantified with UV-spectroscopy (Shimadzu 1800)
at 296 nm for TEL and at 278 nm for VPH. (Yuan Y., et al., 2006, Hong J. Y., et al.,
2006 and Balakrishnan P., et al., 2009)
Table 2.4: Oils, surfactants and co-surfactants used to determine solubility of
TEL and VPH
Oil Surfactant and Co-surfactant
Acrysol EL 135 Campul MCM
Arachis oil Capryol 90
Capryol 90 Cremophore RH 40

Chapter 2 Materials and Methods
Dept. of Pharmaceutical Sciences, JJT University, Rajasthan 38
Captex 355 Glycerol
Castor oil Labrafac
Coconut oil Labrafil 2125 cs
Cotton seed oil Labrasol
Ethyl oleate PEG 400
Maisine 35-1 PEG 200
Oleic acid Plurol oleique
Terpentine oil Span 20
Span 80
Transcutol P
Tween 20
Tween 80
2.4.3 Screening of surfactant and co-surfactant
Depending upon the hydrophobic lipophilic balance (HLB) system for surface active
agents, the selection of surfactants for micro emulsion was done. The HLB value for
each component (single and in combination) was determined wherever necessary. The
surfactant in combination with co-surfactants was tried for screening a stable micro
emulsion system which could incorporate the optimum amount of internal phase.
2.4.3.1 Screening of co-surfactants
Various co-surfactants (from solubility study of TEL: PEG 400 and PEG 200 and
from solubility study of VPH: Transcutol P and Plurol oleique) were screened for
SMEDDS formulation. Mixtures of 100 mg of co-surfactant, 200 mg of selected
surfactant (Tween 80 for TEL and Labrasol for VPH) and 300 mg of selected oil
phase were prepared and evaluated in the same manner as described in the above
section for surfactant screening. (Date A. A., et al., 2007)
2.4.4 Construction of pseudo ternary phase diagram
2.4.4.1 Construction of pseudo ternary phase diagram for TEL liquid SMEDDS
From solubility study and screening of surfactants and co-surfactants, co-surfactant
respectively and for preparation of stable SMEDDS, micro emulsion region was

Chapter 2 Materials and Methods
Dept. of Pharmaceutical Sciences, JJT University, Rajasthan 39
identified by constructing pseudo ternary phase diagram containing different
proportion of surfactant: co-surfactant i. e. S/Co (Km value 1:1, 2:1, 3:1, 1:2 and 1:3),
oil and water. In brief Smix and oil were mixed at ratio of 1:9, 2:8, 3:7, 4:6, 5:5, 6:4,
7:3, 8:2 and 9:1 in pre-weighed test tube.
2.4.4.2 Construction of pseudo ternary phase diagram for VPH liquid SMEDDS
From solubility study and screening of surfactants and co-surfactants, Castor oil,
Labrasol and Transcutol P were selected as oil, surfactant and co-surfactant
respectively and pseudo ternary phase diagram containing different proportion of
surfactant: co-surfactant i. e. S/Co (Km value 1:1, 2:1, 3:1, 1:2 and 1:3), oil and water
was constructed by adopting method described above.
2.4.5 Formulation of Liquid SMEDDS
2.4.5.1 Formulation of Liquid SMEDDS of TEL
From constructed phase diagrams Km value at which high micro emulsion region
obtained was selected for further studies. The three formulations as TLM1, TLM2,
and TLM3 were selected from this micro emulsion region and used for further
evaluation studies. The % content of water, oil and Surfactant/co-surfactant in each
selected formulation was determined. Composition of liquid SMEDDS of TEL is
shown in Table 3.23.
2.4.5.2 Formulation of Liquid SMEDDS of VPH
From constructed phase diagrams Km value at which high micro emulsion region
obtained was selected for further studies. The three formulations as VLM1, VLM2,
and VLM3 were selected from this micro emulsion region and used for further
evaluation studies. The % content of water, oil and Surfactant/co-surfactant in each
selected formulation was determined. Composition of liquid SMEDDS of VPH is
shown in Table 3.24.

Chapter 2 Materials and Methods
Dept. of Pharmaceutical Sciences, JJT University, Rajasthan 40
2.4.6 Evaluation of Liquid SMEDDS
2.4.6.1 Evaluation of Liquid SMEDDS of TEL
Thermodynamic stability studies
Thermodynamic stability study of prepared SMEDDS was determined by carrying
heating cooling cycle, centrifugation test and freeze thaw cycle. (Shafiq S., et al.,
2007)
Heating cooling cycle
Centrifugation test
Freeze thaw cycle
Robustness to dilution
It was studied by diluting liquid SMEDDS to 50, 100 and 1000 times with water,
buffer pH 1.2, buffer pH 7.5 (for TEL SMEDDS) and buffer pH 6.8 (for VPH
SMEDDS). (Date A. A., et al., 2007)
Assessment of Efficiency of self-emulsification
Efficiency of self-emulsification was assessed by procedure used by Khoo Shui-Mei
et.al. (1998). The in-vitro performance of the formulations was visually assessed
using the following grading system: (Khoo S. M., et al., 1998 and Shafiq S., et al.,
2007)
% Transmittance
1 mL of Liquid SMEDDS was diluted to 100 mL distilled water and observed at 650
nm using UV–Vis spectrophotometer (Shimadzu-1800, Japan) (Date A. A., et al.,
2007)

Chapter 2 Materials and Methods
Dept. of Pharmaceutical Sciences, JJT University, Rajasthan 41
Globule size, PDI and Zeta potential
Figure 2.1: Malvern Zetasizer (Nano ZS90)
Dynamic Light Scattering
Its principle is that fine particles and molecules that are in constant random thermal
motion, called Brownian motion, diffuse at a speed related to their size, smaller
particles diffusing faster than larger particles. The speed of Brownian motion is also
determined by the temperature, therefore precision temperature control is essential for
accurate size measurement.
To measure the diffusion speed, the speckle pattern produced by illuminating the
particles with a laser is observed. The scattering intensity at a specific angle will
fluctuate with time, and this is detected using a sensitive avalanche photodiode
detector (APD). The intensity changes are analysed with a digital autocorrelator
which generates a correlation function.
To produce high quality data, the Zetasizer Nano series is designed to provide
optimised components at every stage in the measurement chain from the laser and
temperature control, through to the optical design and detector. (Zetasizer Nano
series)

Chapter 2 Materials and Methods
Dept. of Pharmaceutical Sciences, JJT University, Rajasthan 42
Figure 2.2: Schematics of Dynamic Light scattering instrument
Liquid SMEDDS was diluted to 10 times with distilled water and globule size, PDI
and zeta potential were determined using Malvern Zetasizer (Nano ZS90). (Attwood
D., 1994, Khoo S. M., et al., 1998, Shafiq S., et al., 2007 and Date A. A., et al., 2007)
Viscosity
The viscosity of the formulations (0.5 g) was determined as such without dilution
using Brookfield LVDV II + pro viscometer using spindle S18 at 20 rpm at room
temperature. (Shafiq S., et al., 2007)
2.4.6.2 Evaluation of Liquid SMEDDS of VPH
Liquid SMEDDS of VPH are also evaluated for thermodynamic stability studies, %
transmittance, globule size, PDI and zeta potential, viscosity, dye solubilization test
and cloud point measurement by adopting same procedure as that of for evaluation of
liquid SMEDDS of TEL.
2.4.7 Formulation of S-SMEDDS
2.4.7.1 Formulation of S-SMEDDS of TEL
S-SMEDDS of TEL was prepared by spray drying and adsorption technique.

Chapter 2 Materials and Methods
Dept. of Pharmaceutical Sciences, JJT University, Rajasthan 43
Formulation of S-SMEDDS of TEL by spray drying technique
Composition for formulation of S-SMEDDS of TEL by spray drying technique is
shown in Table 2.5. Maltodextrin was dissolved in 100 mL distilled water. The liquid
SMEDDS was added in above solution of maltodextrin. This emulsion was spray
dried using lab spray dryer (JISL, LSD-48) under optimized conditions specified in
Table 2.6. (Dollo G., et al., 2003)
Table 2.5: Composition of S-SMEDDS of TEL by spray drying technique
Formulation
Code
Component (g)
Liquid
SMEDDS Maltodextrin Water (mL)
TSM1 10 10 100
TSM2 10 10 100
TSM3 10 10 100
Table 2.6: Optimized conditions for spray drying for TEL S-SMEDDS
Parameters Optimized values
Inlet temperature 120 ⁰C
Outlet temperature 70 ⁰C
Aspirator speed 80 %
Feed rate 10 %
The prepared S-SMEDDS was collected from collector and cyclone separator and
stored in sealed vial. These vials were kept in desiccators until analysis.
Chapter 2 Materials and Methods
Dept. of Pharmaceutical Sciences, JJT University, Rajasthan 44
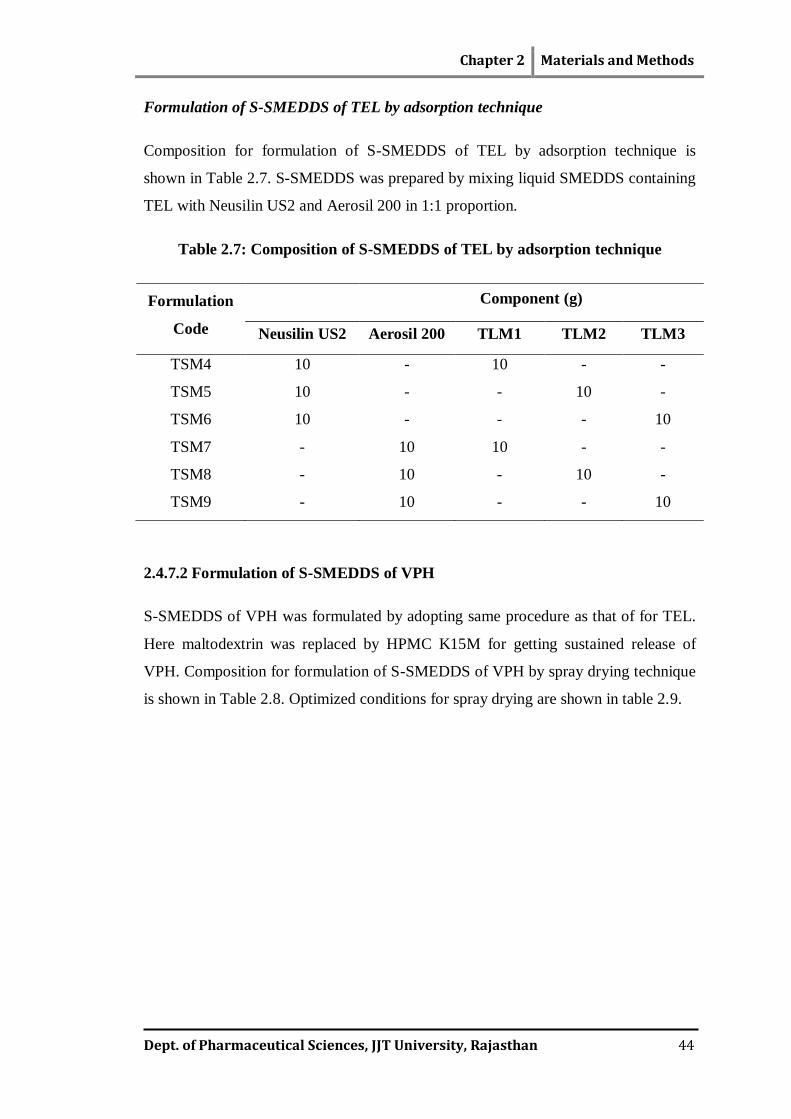
Formulation of S-SMEDDS of TEL by adsorption technique
Composition for formulation of S-SMEDDS of TEL by adsorption technique is
shown in Table 2.7. S-SMEDDS was prepared by mixing liquid SMEDDS containing
TEL with Neusilin US2 and Aerosil 200 in 1:1 proportion.
Table 2.7: Composition of S-SMEDDS of TEL by adsorption technique
Formulation
Code
Component (g)
Neusilin US2 Aerosil 200 TLM1 TLM2 TLM3
TSM4 10 - 10 - -
TSM5 10 - - 10 -
TSM6 10 - - - 10
TSM7 - 10 10 - -
TSM8 - 10 - 10 -
TSM9 - 10 - - 10
2.4.7.2 Formulation of S-SMEDDS of VPH
S-SMEDDS of VPH was formulated by adopting same procedure as that of for TEL.
Here maltodextrin was replaced by HPMC K15M for getting sustained release of
VPH. Composition for formulation of S-SMEDDS of VPH by spray drying technique
is shown in Table 2.8. Optimized conditions for spray drying are shown in table 2.9.

Chapter 2 Materials and Methods
Dept. of Pharmaceutical Sciences, JJT University, Rajasthan 45
Table 2.8: Composition of S-SMEDDS of VPH by spray drying technique
Formulation
Code
Component (g)
Liquid
SMEDDS HPMC K15M Water (mL)
VSM1 10 10 100
VSM2 10 10 100
VSM3 10 10 100
Table 2.9: Optimized conditions for spray drying for VPH S-SMEDDS
Parameters Optimized values
Inlet temperature 150 ⁰C
Outlet temperature 70 ⁰C
Aspirator speed 85 %
Feed rate 10 %
2.4.8 Characterization of S-SMEDDS
2.4.8.1 Micromeritic properties of S-SMEDDS and drug content
Organoleptic properties
The organoleptic properties of S-SMEDDS, like color, odor and physical appearance
were checked by visual observation.
Angle of repose
Bulk density
Compressibility Index
Hausner ratio

Chapter 2 Materials and Methods
Dept. of Pharmaceutical Sciences, JJT University, Rajasthan 46
Spray drying process yield
Spray drying process yield was calculated for formulation TSM1, TSM2, TSM3,
VSM1, VSM2 and VSM3 batches. (Hansen T., et al., 2004) The powder obtained
from spray drying was mixed well and the product yield was calculated from the
following formula:
Where W is Weight of product obtained from spray dryer and Wo is Weight of total
dissolved solid in micro emulsion.
Drug content
For S-SMEDDS obtained from spray drying technique
Amount of drug present in S-SMEDDS obtained from spray drying technique (TSM1,
TSM2, TSM3, VSM1, VSM2 and VSM3) was determined by taking 100 mg of S-
SMEDDS and carrying out assay method for TEL and VPH as follows: The powder
of each formulation was taken in the 100 mL volumetric flask. To this sufficient
quantity of acid buffer pH 1.2 was added and the flask was shaken for 10 min. Then
the volume was made with acid buffer pH 1.2. This was then filtered through nylon
filter paper (0.45 µm), and from filtrate exactly 1 mL was transferred to another
volumetric flask of 100 mL and volume was made with acid buffer pH 1.2. The UV
absorbance of this was taken at 296 nm for TEL and at 278 for VPH. Drug content
was then calculated by using calibration curve of plain TEL and VPH in acid buffer
pH 1.2. (Indian Pharmacopoeia, 1996)
For S-SMEDDS obtained from adsorption technique
Drug content was estimated by extracting TEL from S-SMEDDS. (Patel P. A., et al.,
2010)

Chapter 2 Materials and Methods
Dept. of Pharmaceutical Sciences, JJT University, Rajasthan 47
2.4.8.2 In-vitro dissolution studies
In-vitro dissolution studies for S-SMEDDS of TEL
The in-vitro dissolution study of S-SMEDDS of TEL and plain TEL were carried out
using USP- type-II dissolution test apparatus. Hard gelatin capsule of size ‘0’ was
filled with S-SMEDDS (equivalent to 20 mg of TEL) and plain TEL and put into each
of 900 mL pH 1.2 and pH 7.5 buffer solutions at 37±0.50C with 50 rpm rotating
speed.
In-vitro dissolution studies for S-SMEDDS of VPH
Hard gelatin capsule of size ‘000’ was filled with S-SMEDDS (equivalent to 120 mg
of VPH) and VPH:HPMC K15M physical mixture (PM). The in-vitro dissolution
study of S-SMEDDS of VPH and PM were carried out using USP- type-I dissolution
test apparatus at 370C ± 0.5oC and 100 rpm speed. The dissolution studies were
carried out in acid buffer of pH 1.2 for one hour and in phosphate buffer pH 6.8 for
further seven hours under sink condition.
2.4.9 Selection of optimized formulations for further study
The S-SMEDDS batches of TEL and VPH were optimized on the basis of drug
content, in-vitro drug release, globule size, PDI, zeta potential of reconstituted S-
SMEDDS, spray dried process yield, etc and selected formulations were further
studied for solid state characterization, morphological analysis, ex-vivo intestinal
permeability studies, bioavailability and stability study.
2.4.10 Solid state characterization of S- SMEDDS
2.4.10.1 FTIR study
FTIR studies were done to assess whether any possible interaction among drug,
maltodextrin HPMC K15M and Neusilin US2. Infrared spectrums of plain drug,
physical mixture of drug and carriers and selected formulations of S-SMEDDS were
recorded. From the spectrum analysis the compatibility of ingredients in the
formulations was found out. (Raja R. K., et al., 2011)

Chapter 2 Materials and Methods
Dept. of Pharmaceutical Sciences, JJT University, Rajasthan 48
2.4.10.2 Powder X-ray diffraction (PXRD)
Figure 2.3: X-ray powder diffractometer (D2 Phaser, Bruker AXS)
Figure 2.4: Schematic diagram of X ray diffractometer
To verify the physical state of TEL and VPH in pure state and the changes in the
crystallinity in S-SMEDDS. PXRD of plain TEL, VPH, and selected S-SMEDDS was
carried out using X-ray diffractometer (D2 Phaser, Bruker AXS). (Yi T., et al., 2008)

Chapter 2 Materials and Methods
Dept. of Pharmaceutical Sciences, JJT University, Rajasthan 49
2.4.10.3 Differential scanning calorimetry (DSC)
Figure 2.5: Differential scanning calorimeter
Physical state of TEL and VPH in S-SMEDDS was characterized using differential
scanning calorimeter. Thermograms of TEL, VPH, Maltodextrin, HPMC K15M,
Neusilin US2 and S-SMEDDS were obtained using differential scanning calorimeter
(SIIO 6300, Japan). (Yi T., et al., 2008)
2.4.11 Morphological analysis of S-SMEDDS
Morphological analysis of S-SMEDDS was done using SEM.
Figure 2.6: Scanning electron microscope (JEOL, Japan)
Chapter 2 Materials and Methods
Dept. of Pharmaceutical Sciences, JJT University, Rajasthan 50
Scanning electron micrographs for VPH, TEL, Neusilin US2 and selected S-
SMEDDS was taken using Scanning electron microscope (JEOL, Japan) at
accelerating voltage at 3-5 kV to study surface topography. (Yi T., et al., 2008)
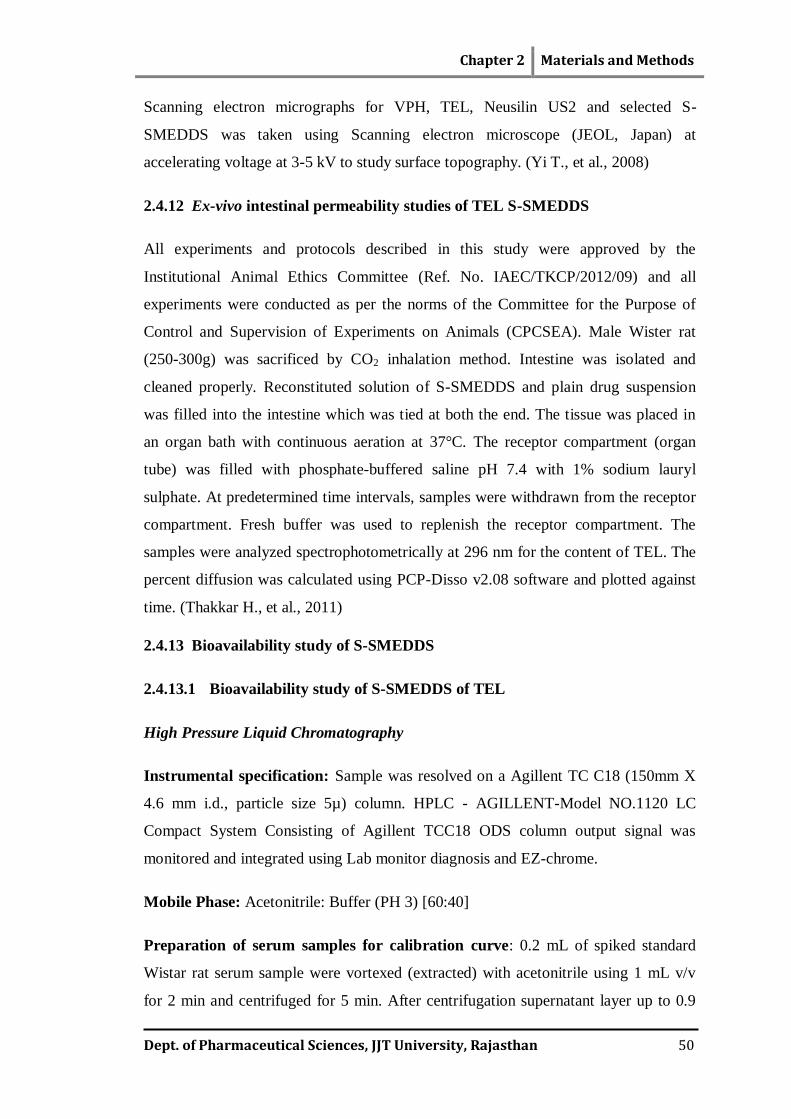
2.4.12 Ex-vivo intestinal permeability studies of TEL S-SMEDDS
All experiments and protocols described in this study were approved by the
Institutional Animal Ethics Committee (Ref. No. IAEC/TKCP/2012/09) and all
experiments were conducted as per the norms of the Committee for the Purpose of
Control and Supervision of Experiments on Animals (CPCSEA). Male Wister rat
(250-300g) was sacrificed by CO2 inhalation method. Intestine was isolated and
cleaned properly. Reconstituted solution of S-SMEDDS and plain drug suspension
was filled into the intestine which was tied at both the end. The tissue was placed in
an organ bath with continuous aeration at 37°C. The receptor compartment (organ
tube) was filled with phosphate-buffered saline pH 7.4 with 1% sodium lauryl
sulphate. At predetermined time intervals, samples were withdrawn from the receptor
compartment. Fresh buffer was used to replenish the receptor compartment. The
samples were analyzed spectrophotometrically at 296 nm for the content of TEL. The
percent diffusion was calculated using PCP-Disso v2.08 software and plotted against
time. (Thakkar H., et al., 2011)
2.4.13 Bioavailability study of S-SMEDDS
2.4.13.1 Bioavailability study of S-SMEDDS of TEL
High Pressure Liquid Chromatography
Instrumental specification: Sample was resolved on a Agillent TC C18 (150mm X
4.6 mm i.d., particle size 5µ) column. HPLC - AGILLENT-Model NO.1120 LC
Compact System Consisting of Agillent TCC18 ODS column output signal was
monitored and integrated using Lab monitor diagnosis and EZ-chrome.
Mobile Phase: Acetonitrile: Buffer (PH 3) [60:40]
Preparation of serum samples for calibration curve: 0.2 mL of spiked standard
Wistar rat serum sample were vortexed (extracted) with acetonitrile using 1 mL v/v
for 2 min and centrifuged for 5 min. After centrifugation supernatant layer up to 0.9

Chapter 2 Materials and Methods
Dept. of Pharmaceutical Sciences, JJT University, Rajasthan 51
mL was separated and evaporated. Finally dry residue was reconstituted with mobile
phase.
Calibration curve range: 1, 10, 20, 30, 50, 60 and 70 μg /mL in wistar rat serum
Bioavailability in male Wistar rats
The experimental procedures were approved by the Institutional Animal ethical
committee Tatyasaheb Kore College of Pharmacy, Warananagar. (Ref. No.
IAEC/TKCP/2012/09)
3 groups of rats were used for the experiments each group consists 3 rats. First group
was administered aqueous suspension of TEL. Second group was administered with
aqueous solution of TEL S-SMEDDS (equivalent to 20 mg of TEL. Third group was
kept as controlled. (Kim J. Y., et al., 2000 and Setthacheewakul S., et al., 2010)
The samples were centrifuged at 13,000 rpm 20 ºC for 10 min and plasma was
separated. 0.2 mL of plasma was vortexed (extracted) with acetonitrile using 1mL v/v
up to 2 min and centrifuged at 3000 rpm up to 5 min. From this centrifuged solution
supernatant layer up to 0.9 mL was separated and evaporated to dryness. (Kumar G.
V., et al., 2011)
Biopharmaceutical evaluation (Brahmankar D. M., et al., 1995)
The elimination rate constant (K) was estimated from the terminal slope of the plasma
concentration-time curve values.
Elimination half-life t1/2 was calculated from quotient 0.693/K
Area under the plasma drug concentration- time curve up to measurable
concentration, AUC(0- t) was calculated using the trapezoidal rule. The area under the
curve zero to infinity, AUC(0- α) was calculated by equation:
Chapter 2 Materials and Methods
Dept. of Pharmaceutical Sciences, JJT University, Rajasthan 52
Where, Ct is the last measurable concentration.
To assess the degree of retardation of drug release mean residence time (MRT) was
calculated.
Relative bioavailability (Frel) of TEL from TSM1 and TSM4 to that of plain TEL
suspension was calculated using formula: (Zhang Y., et al., 2012)
2.4.13.2 Bioavailability study of S-SMEDDS of VPH
High Pressure Liquid Chromatography
Instrumental specification: Sample was resolved on a Agillent TC C18 (150mm X
4.6 mm i.d.,particle size 5µ) column. HPLC - AGILLENT-Model NO.1120 LC
Compact System Consisting of Agillent TCC18 ODS column output signal was
monitored and integrated using Lab monitor diagnosis and EZ-chrome.
Mobile Phase: Acetonitrile: Acetate Buffer (PH 7) [65:35]
Stock and Working standard solutions: The stock solution of the VPH was
prepared by dissolving 25 mg of pure drug in 100 mL volumetric flasks containing 50
mL of methanol, filtered and sonicated for about 15 min.
Preparation of serum samples for calibration curve: 0.2 mL of rabbit serum
samples was vortexed (extracted) with acetonitrile using 1mL v/v for 2 min and
centrifuged up to 5min. After centrifugation supernatant layer up to 0.9 mL was
separated and evaporated. Finally dry residue was reconstituted with mobile phase.
Calibration curve range: 1, 10, 20, 30, 50, 60 and 70 μg /mL in wistar rat serum
Bioavailability studies in Rabbits
The Institutional Animal Ethical Committee approved the protocol for this study (Ref.
No. IAEC/TKCP/2012/09). Blood samples were collected from marginal ear vein at

Chapter 2 Materials and Methods
Dept. of Pharmaceutical Sciences, JJT University, Rajasthan 53
time intervals of 0, 1, 2, 3.5, 5, 8 and 12 h and analyzed using HPLC. (Mallick S., et
al., 2000)
Biopharmaceutical evaluation
Different pharmacokinetic parameters were determined same as above.
2.4.14 Accelerated stability study
The hard gelatin capsules size ‘0’ filled with the S-SMEDDS of TEL (TSM1 and
TSM4) and hard gelatin capsules size ‘000’ filled with the S-SMEDDS of VPH
(VSM1) were stored in air-tight glass containers and protected from light. Samples
maintained in a stability chamber under intermediate conditions and evaluated under
accelerated conditions (45 ⁰C ± 2 ⁰C, 75 ± 5% RH) with humidity and temperature
control, were taken at 0, 1, 2 and, 3 month for both the conditions. Appearance, self-
emulsifying properties, and drug content of both optimized formulations of S-
SMEDDS were evaluated. (Setthacheewakul S., et al., 2010)