materials 2013 sector report
TRANSCRIPT
Global Outlook 2012-2014 Applied Portfolio Management
O c t o b e r 9 t h , 2 0 1 3 B e n L i n
Materials Sector Report
Metals & Mining Industr
y
Chemicals Industry
Table of Content
Ø RECOMMENDATION 2
Ø ECONOMIC OUTLOOK 2
Ø SECTOR OVERVIEW 3 - 7
Ø BUSINESS ANALYSIS 8 - 27
Ø Financial ANALYSIS 28 - 38
Ø Valuation ANALYSIS 39 - 41
Ø Conclusion 42
Ø References 43 - 44
Economic Outlook
Recommendation
I recommend overweighting our holdings in the materials sector from its current 1.7 percent to 4.46
percent, 1.01 percent higher relative to the weight of S&P 500, by primarily focusing on the
chemicals industry because the increasing volume and decreasing price of domestic natural gas, as
well as the maturing GTL technology will significantly reduce chemicals production cost on the top
of the industry’s strong cost control system. In addition, the solid growth of the product line in the
chemicals industry has strengthened by the decline in the mining industry, the government’s support
in the chemicals new technology development, and the increasing demand for alternative materials
such as plastics will send the chemicals industry to a new level.
I anticipate an optimistic outlook for the U.S. economy moving forward in 1 to 1.5-‐year
horizon. The lower growth of consumer spending reinforces the stock market as more capital flows
into it. According to a research done by University of Michigan, Consumer Sentiment reading is
only 76.8, lowest since this April. The bad mortgages are the lowest since the 4th quarter of 2007,
works out of labor force are the lowest since the 4th quarter of 2008, stock market capitalization is at
all time high, assets held by the Fed are at all time high; In addition, research has shown that the
corporate earnings gap between Europe and the U.S. just reached 25-year high in September as the
U.S. outperformed Europe by 20 percent; also, the U.S. aging population is the lowest among the top
5 countries by economic scale, which provides U.S. comparative advantage in working capital in the
future; making the U.S. investment opportunities more attractive to foreign investors. Domestically,
tapering is not going to effect therefore short-term interest rates will stay low into the future. The
Fed had debt outstanding of $3.72 trillion as of the first week of September. Prior to the FOMC
meeting, analysts of major banks expected that the Fed would start tapering once the amount of debt
reaches $4.06 trillion. The figure was reassessed right after the FOMC meeting and raised up to
$4.27 trillion, which implies that the potential tapering may come 2.5 months later than the original
estimate. The rule of thumb shows that every $100 billion assets the Fed adds to its balance sheet
will decrease the 10-year bond interest rates by 0.03 percentage points. Consequently, 2.5 months no
tapering will ultimately result in additional $213 billion on the Fed’s balance sheet, therefore 0.0639
percentage points decrease in interests rates if the estimate comes out true.
Sector Overview
Overview
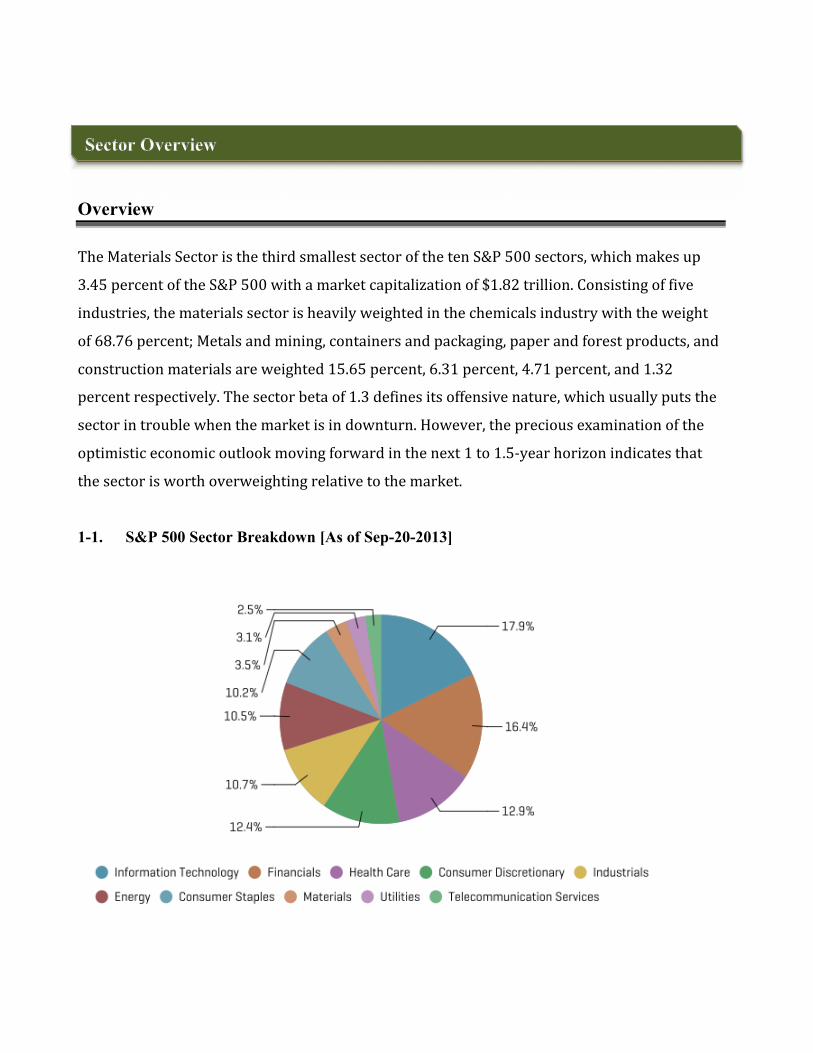
The Materials Sector is the third smallest sector of the ten S&P 500 sectors, which makes up
3.45 percent of the S&P 500 with a market capitalization of $1.82 trillion. Consisting of five
industries, the materials sector is heavily weighted in the chemicals industry with the weight
of 68.76 percent; Metals and mining, containers and packaging, paper and forest products, and
construction materials are weighted 15.65 percent, 6.31 percent, 4.71 percent, and 1.32
percent respectively. The sector beta of 1.3 defines its offensive nature, which usually puts the
sector in trouble when the market is in downturn. However, the precious examination of the
optimistic economic outlook moving forward in the next 1 to 1.5-‐year horizon indicates that
the sector is worth overweighting relative to the market.
1-1. S&P 500 Sector Breakdown [As of Sep-20-2013]
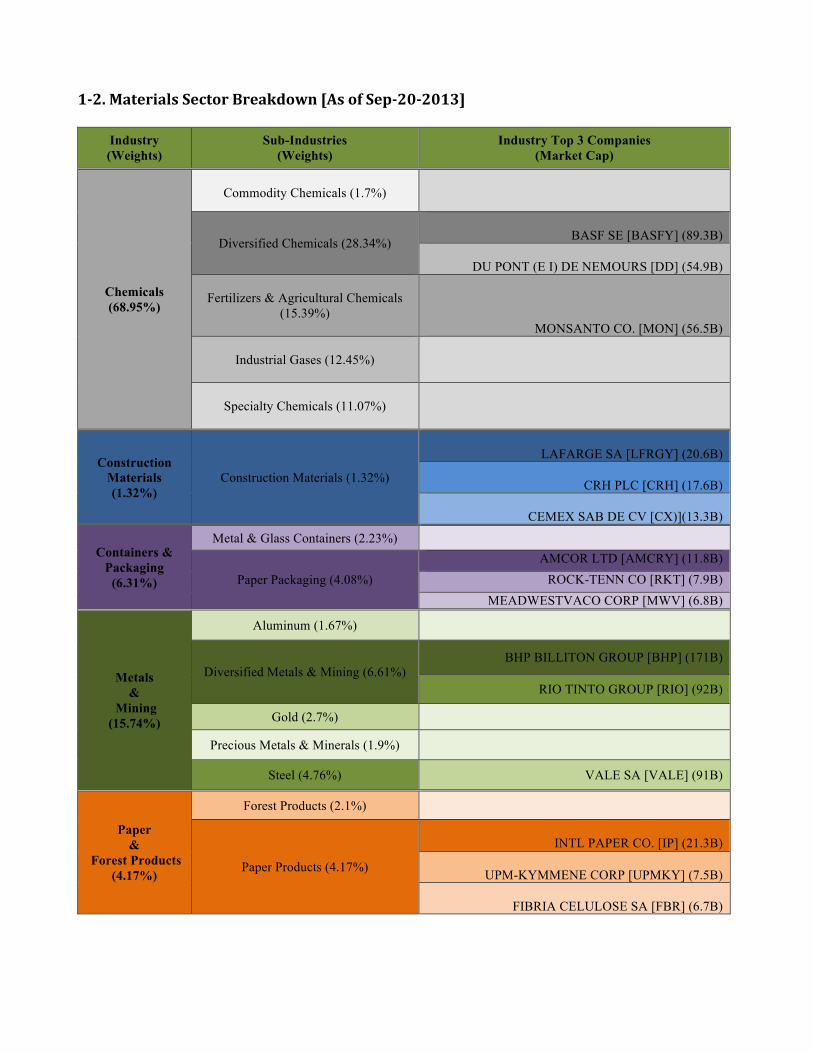
1-‐2. Materials Sector Breakdown [As of Sep-‐20-‐2013]
Industry (Weights)
Sub-Industries (Weights)
Industry Top 3 Companies (Market Cap)
Chemicals (68.95%)
Commodity Chemicals (1.7%)
Diversified Chemicals (28.34%)
BASF SE [BASFY] (89.3B)
DU PONT (E I) DE NEMOURS [DD] (54.9B)
Fertilizers & Agricultural Chemicals
(15.39%)
MONSANTO CO. [MON] (56.5B)
Industrial Gases (12.45%)
Specialty Chemicals (11.07%)
Construction Materials (1.32%)
Construction Materials (1.32%)
LAFARGE SA [LFRGY] (20.6B)
CRH PLC [CRH] (17.6B)
CEMEX SAB DE CV [CX)](13.3B)
Containers & Packaging
(6.31%)
Metal & Glass Containers (2.23%)
Paper Packaging (4.08%) AMCOR LTD [AMCRY] (11.8B)
ROCK-TENN CO [RKT] (7.9B) MEADWESTVACO CORP [MWV] (6.8B)
Metals &
Mining (15.74%)
Aluminum (1.67%)
Diversified Metals & Mining (6.61%) BHP BILLITON GROUP [BHP] (171B)
RIO TINTO GROUP [RIO] (92B)
Gold (2.7%)
Precious Metals & Minerals (1.9%)
Steel (4.76%) VALE SA [VALE] (91B)
Paper &
Forest Products (4.17%)
Forest Products (2.1%)
Paper Products (4.17%)
INTL PAPER CO. [IP] (21.3B)
UPM-KYMMENE CORP [UPMKY] (7.5B)
FIBRIA CELULOSE SA [FBR] (6.7B)

Table 1-2 gives a clear breakdown of the materials sector. Although the chemicals industry makes
up the majority market capitalization of the materials sector, the three largest companies are from the
metals and mining industry. With the total market cap of $354 Billion combined, the three largest
companies in the mining industry are larger than all the 12 largest companies in the other four
industries combined. The capital-intensive nature of their business implies that a solid financial
fundamental is required to support their massive supplies and ongoing projects.
The metals and mining industry provides the building blocks for economic development, meanwhile,
the chemicals industry possesses the potential reserves for materials sector’s turnaround. The
relationship between two industries is quite complicated in terms of they naturally against each other
by consuming the same natural resources and supplying almost the same industries, automotive and
construction industries in particular. On the other hand, they intimately support each other by
hedging against the decline in commodity price and the necessity of importing foreign products.
However, environmental restrictions have put more pressure on the mining industry over the
chemicals industry, shifting its energy consumption from coal to oil, then to natural gas. Cheap
access to steel and other major metals products have worsen the needs of precious metals, making
diversified miners give up their poor performance operations and focus on popular metals such as
steel and aluminum, therefore exaggerating the supply of certain metals, steel in particular. On the
contrary, chemicals products such as plastics are becoming more attainable because of higher cost
efficiency and lower transportation and carrying cost. In addition, return is rewarding for those who
can allocate assets accordingly and maintain operational stability in response to the downturn of the
global economy.
At last, focusing on the APM portfolio’s weight and performance, the materials sector is only
weighted 1.6% of the overall portfolio. Comparing to the other two underweighted sectors, the
utilities sector and the telecom sector, weighted 4% and 4.2% respectively. The materials sector has
delivered over 34% rate of return since November last year, compares to 10 percent from the utilities
sector and 20 percent from the telecom sector. And it has outperformed some highly weighted
sectors such as the consumer staples sector, which has only contributed 10.1% of return to the
portfolio with the weight of 13.5%. All of this real data further proves that the materials sector has
been underweighted. Due to the upcoming great prospects for the chemicals industry, increasing the
weight of the materials sector becomes more valuable and credible. The following two graphs
further demonstrate the strong historical performance of the chemicals industry.

Up close examination, from the beginning of 2012 to August 2013, the performances of industries
within the materials sector has been fluctuated as the poor performance from the metals and mining
industry, and the momentum performance from the chemicals industry. Although the prospect of the
materials sector as a whole is valued underwater, I anticipate the materials sector is in recovery, with
the continuing momentum growth from the chemicals industry and gradual rebound from the metals
and mining industry. I believe the performance of the materials sector will be reshaped in the next 1
to 1.5 year horizon.
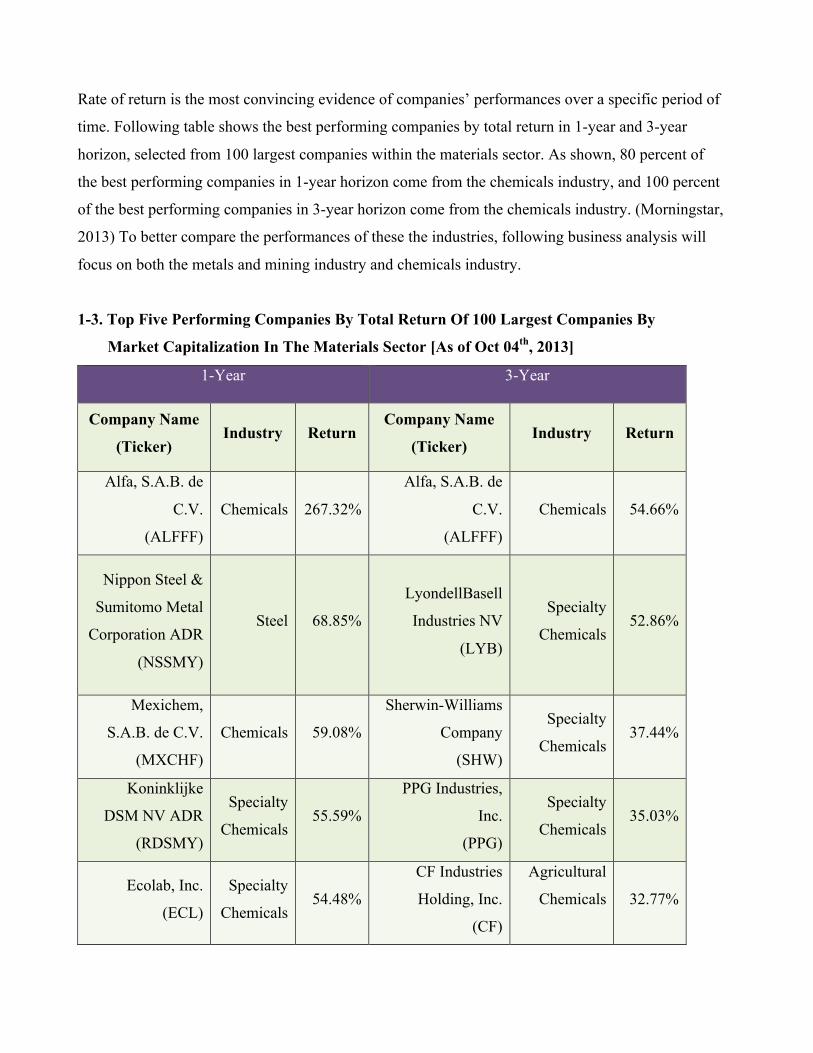
Rate of return is the most convincing evidence of companies’ performances over a specific period of
time. Following table shows the best performing companies by total return in 1-year and 3-year
horizon, selected from 100 largest companies within the materials sector. As shown, 80 percent of
the best performing companies in 1-year horizon come from the chemicals industry, and 100 percent
of the best performing companies in 3-year horizon come from the chemicals industry. (Morningstar,
2013) To better compare the performances of these the industries, following business analysis will
focus on both the metals and mining industry and chemicals industry.
1-3. Top Five Performing Companies By Total Return Of 100 Largest Companies By
Market Capitalization In The Materials Sector [As of Oct 04th, 2013]
1-Year 3-Year
Company Name
(Ticker) Industry Return
Company Name
(Ticker) Industry Return
Alfa, S.A.B. de
C.V.
(ALFFF)
Chemicals 267.32%
Alfa, S.A.B. de
C.V.
(ALFFF)
Chemicals 54.66%
Nippon Steel &
Sumitomo Metal
Corporation ADR
(NSSMY)
Steel 68.85%
LyondellBasell
Industries NV
(LYB)
Specialty
Chemicals 52.86%
Mexichem,
S.A.B. de C.V.
(MXCHF)
Chemicals 59.08%
Sherwin-Williams
Company
(SHW)
Specialty
Chemicals 37.44%
Koninklijke
DSM NV ADR
(RDSMY)
Specialty
Chemicals 55.59%
PPG Industries,
Inc.
(PPG)
Specialty
Chemicals 35.03%
Ecolab, Inc.
(ECL)
Specialty
Chemicals 54.48%
CF Industries
Holding, Inc.
(CF)
Agricultural
Chemicals
32.77%
Business Analysis
Metals and mining Industry Life/Business Cycle
Metals and mining industry is highly cyclical in terms of its performance is highly correlated with
the demand and supply of the raw materials, the commodity price cycle as well as the discovery of
substitutes. Exposing to the fact that resources are scarce, poor demand or oversupply usually leads
to a rapid decline in the industry. I infer that the metals and mining industry is in a mature lifecycle,
because of the rising business risk and cost inflation, driven by a number of factors such as global
economic uncertainties, softening commodity prices and the emergence of substitutes.
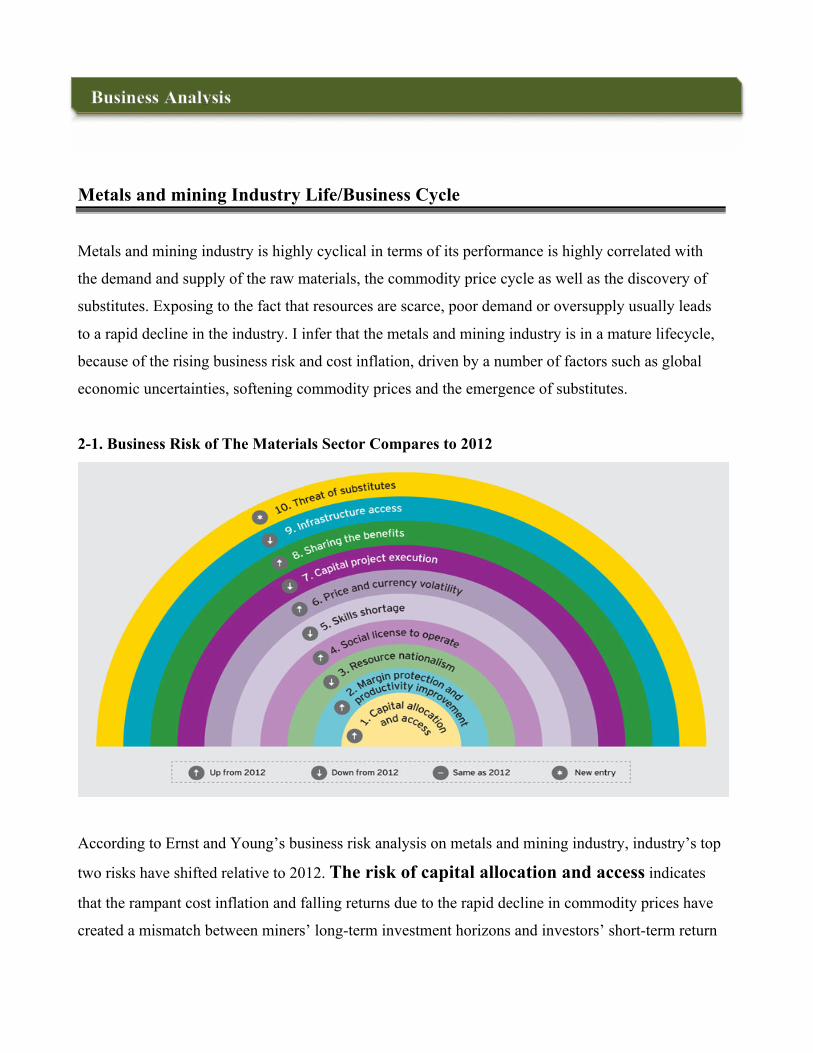
2-1. Business Risk of The Materials Sector Compares to 2012
According to Ernst and Young’s business risk analysis on metals and mining industry, industry’s top
two risks have shifted relative to 2012. The risk of capital allocation and access indicates
that the rampant cost inflation and falling returns due to the rapid decline in commodity prices have
created a mismatch between miners’ long-term investment horizons and investors’ short-term return
horizons. In the other words, the conflicts between short-term investors’ incentives, and the sector’s
longer-term return horizon due to its cyclical nature are very likely to influence miners’ decisions
therefore damaging their growth prospects. The risk of margin protection and
productivity improvement on the other hand, indicates that productivity in the sector has been
declining for nearly a decade, while most miners haven’t realized the directional change from
growth prospect towards long-term capital allocation and operating costs optimization. The long-
term value is rewarding for those who keep their input-to-output ratio in order by optimizing
productivity through their capital structure, on the contrary, expanding territory and taking over
more product lines will result in larger business write-downs. (Mike Elliott, 2013)
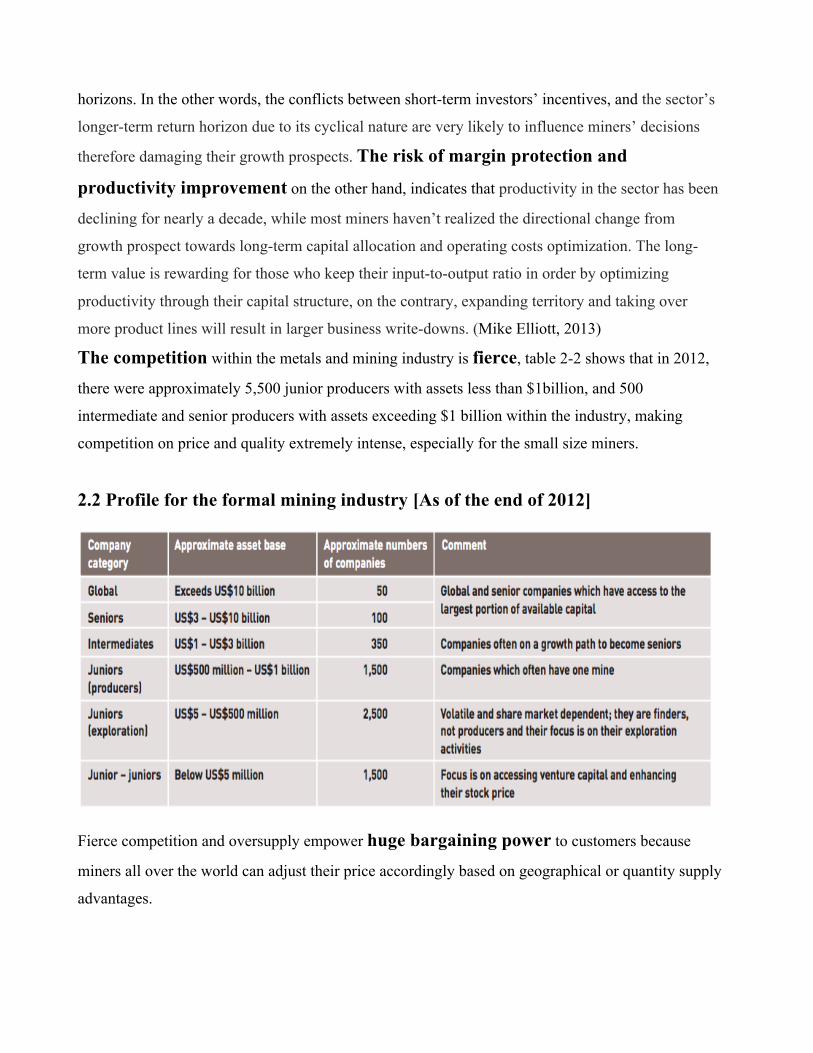
The competition within the metals and mining industry is fierce, table 2-2 shows that in 2012,
there were approximately 5,500 junior producers with assets less than $1billion, and 500
intermediate and senior producers with assets exceeding $1 billion within the industry, making
competition on price and quality extremely intense, especially for the small size miners.
2.2 Profile for the formal mining industry [As of the end of 2012]
Fierce competition and oversupply empower huge bargaining power to customers because
miners all over the world can adjust their price accordingly based on geographical or quantity supply
advantages.
On the other hand, the bargaining power from suppliers is low. First, large volume of
M&As within the mining industry over the past two years have concentrated the mining power
therefore crossing a number of small or medium size customers off of mining equipment suppliers
and energy suppliers’ lists. Second, historical low prices of coal and natural gas have offered miners
an advantage to switch from one to another in order to find the most cost efficient and sustainable
energy product. At last, due to three major oil fields under development in the US: Texas, North
Dakota and California. Oil industry is facing all-time high competition due to the diversification of
the sources of supply, and the threats from substitutes such as LNG, liquefied natural gas, driving
down the price therefore guaranteeing miners lower transportation costs. Studies have shown that the
United States will overtake Saudi Arabia as the world leading oil producer by the year of 2017.
(Elisabeth Rosenthal, 2013)
However, cheap energy price also benefits chemicals industry as the largest energy consumer in the
materials sector. Indicating that the threat of substitute products for metals is emerging as
a large volume of ultra-high strength, temperature resistant and cost-efficient products are being
used in the range from automotive to energy industry. Currently, approximately 16% weight in a
vehicle is plastic, with a growth trend to possibly reach 25% in the next 5 years. At last, internal
rivalry is fierce in terms of aluminum intends to overtake steel to become the most important
metal by volume.
The government’s regulations on emission put high pressure on miners as their profits
squeeze. For example, the Obama administration and the Environmental Protection Agency (EPA)
have introduced strict legislation targeted at the coal industry in an effort to curb harmful emissions
and reduce greenhouse gases. Meanwhile, coal also suffers from multiple secular headwinds,
particularly from competing fuels such as natural gas. With abundant supplies and historically low
prices for U.S. natural gas, many utilities are switching to this cleaner-burning commodity and no
longer using coal. Chemicals industry on the other hand, is benefited from the government by
enjoying lower tax rate and subsidies for new product and technology development. Finally, the
threat of new entrants is minimized since metals and mining industry is very capital
intensive in terms of high cost of patent, low machinery useful life, heavy transportation cost and
increasing labor cost. On the other hand, the decline in metals prices and low equity financings have
given entrepreneurs less incentives to seek the profitable opportunities within the mining industry.
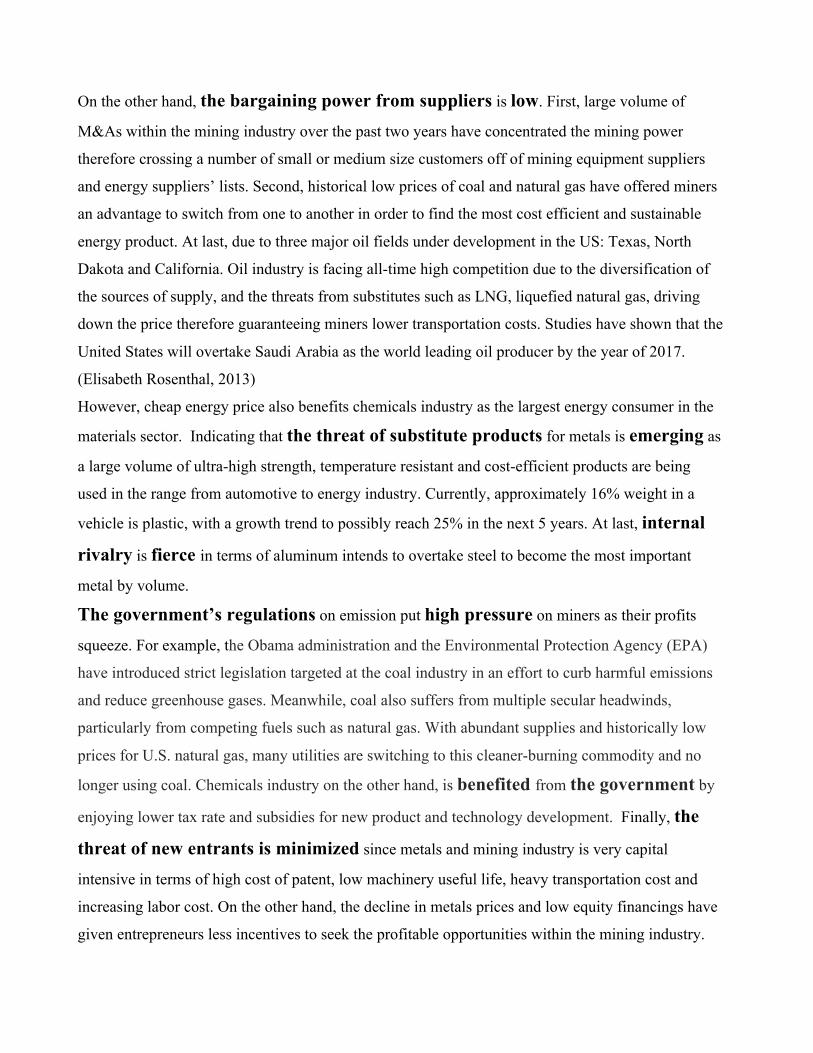
2.3 Equity Financings of all mining companies High equity financing activities are very
appealing to investors by delivering a sense
of stability. However, equity financings in
2012 were way below previous years, raising
concerns regarding miners finance conditions
if the value is not added to M&A transactions.
Following section gives a broad view of the
M&A transactions in 2012.
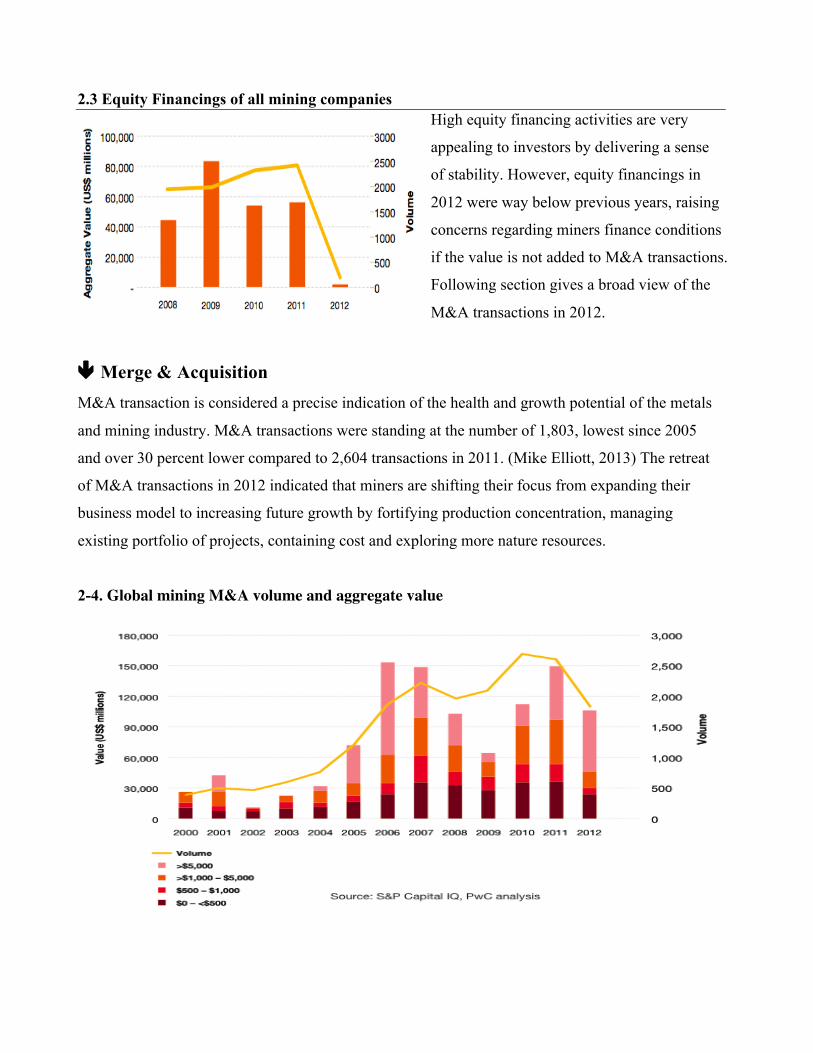
ê Merge & Acquisition M&A transaction is considered a precise indication of the health and growth potential of the metals
and mining industry. M&A transactions were standing at the number of 1,803, lowest since 2005
and over 30 percent lower compared to 2,604 transactions in 2011. (Mike Elliott, 2013) The retreat
of M&A transactions in 2012 indicated that miners are shifting their focus from expanding their
business model to increasing future growth by fortifying production concentration, managing
existing portfolio of projects, containing cost and exploring more nature resources.
2-4. Global mining M&A volume and aggregate value
Lower M&A transactions once again verifies the mature stage of metals and mining
industry, forcing miners to aggregate their resources and reserve capitals in the effort of lowering
operational cost. In this stage, massive pricing competition raises as the large miners acquire most of
the resources, smaller miners become less likely to survive under both pricing and business scale
pressures, but have to be taken over or recognize losses.
With mega-mergers out of the way and the importance of the bottom-line front and centre, 2014 will
be all about asset rationalization. “Deal activity will be driven mainly by two things: senior miners
looking to divest non-core assets and seniors looking to de-risk projects through joint-ventures.”
(Jason Burkitt, 2013) While asset rationalization usually takes a long period of time until it starts
showing profitability to the miners. As for junior miners, it will be extremely hard for them to raise
capital or look for potential buyout opportunities, which may force junior mining executives to
handover their companies at low valuations. To conclude, I expect a slow year for mining M&A
deals in 2014, well below last year’s reduced numbers. Next part elaborates the mining deals in 2012
for comparison.
In 2012, the value of mining deals totaled $110 billion, including the Glencore-Xstrata’s $54 billion
deal in Switzerland. Without this mega-merger deal, total merger value was only $56 billion,
comparing to a total merge value close to $150 billion in 2011.
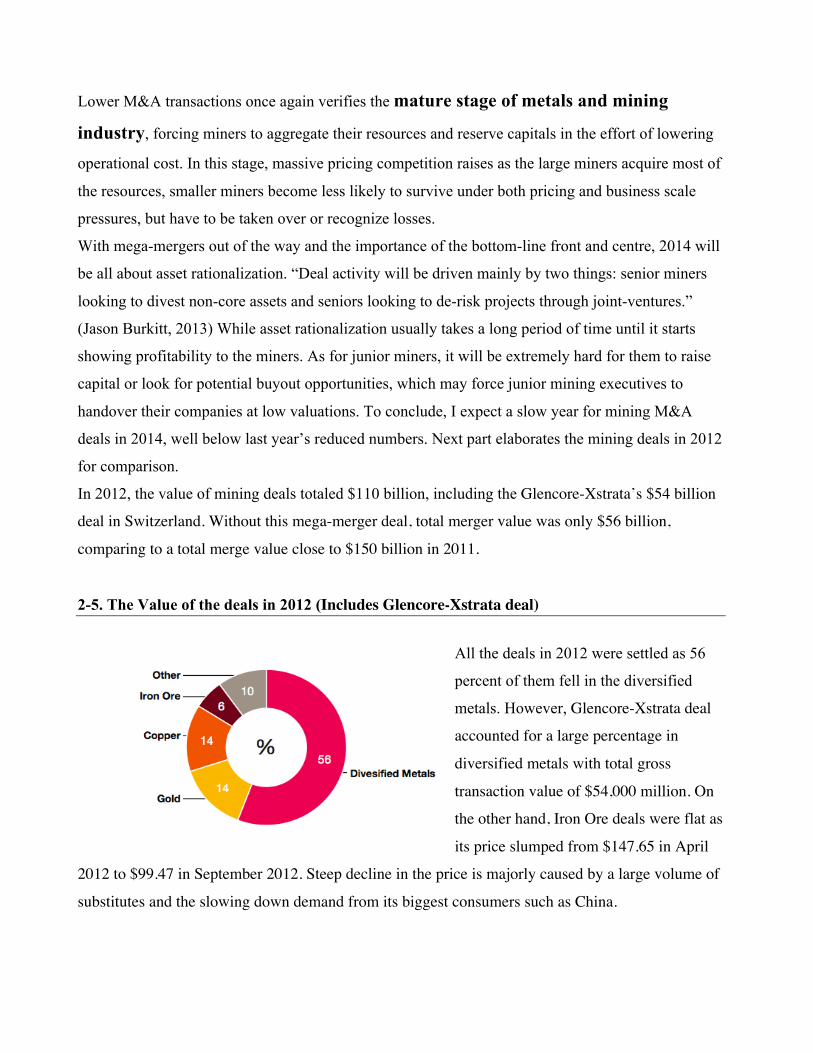
2-5. The Value of the deals in 2012 (Includes Glencore-Xstrata deal)
All the deals in 2012 were settled as 56
percent of them fell in the diversified
metals. However, Glencore-Xstrata deal
accounted for a large percentage in
diversified metals with total gross
transaction value of $54,000 million. On
the other hand, Iron Ore deals were flat as
its price slumped from $147.65 in April
2012 to $99.47 in September 2012. Steep decline in the price is majorly caused by a large volume of
substitutes and the slowing down demand from its biggest consumers such as China.
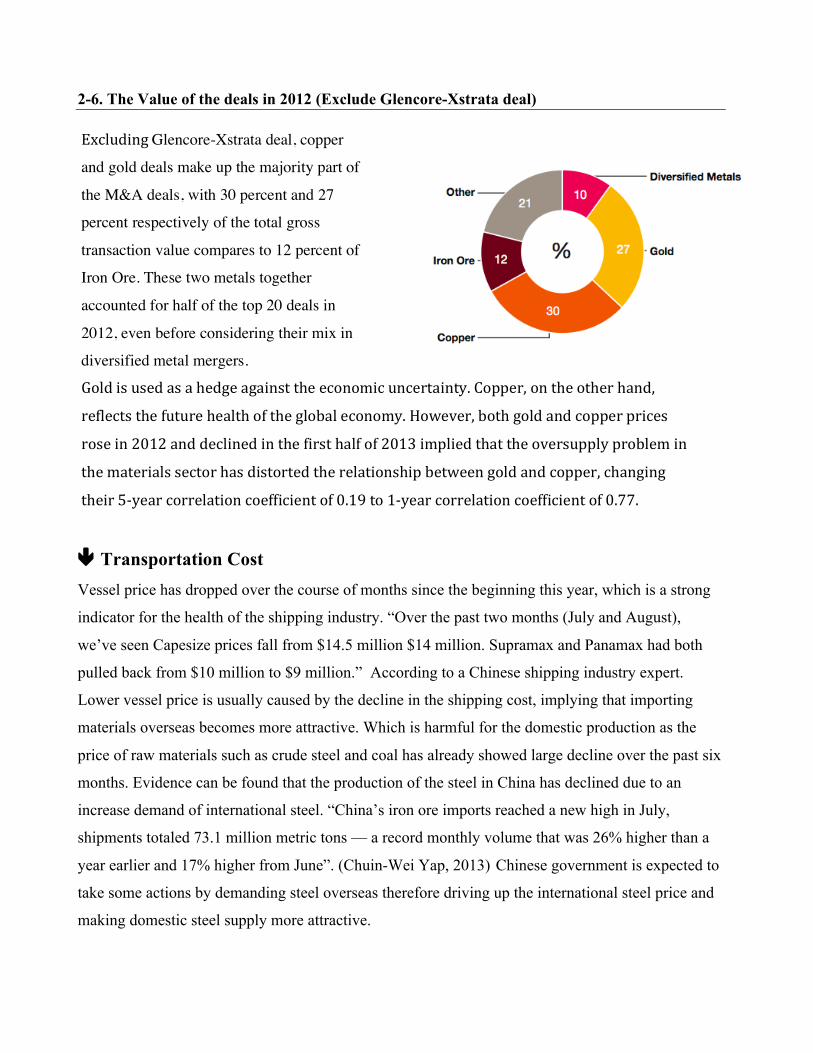
2-6. The Value of the deals in 2012 (Exclude Glencore-Xstrata deal)
ê Transportation Cost
Vessel price has dropped over the course of months since the beginning this year, which is a strong
indicator for the health of the shipping industry. “Over the past two months (July and August),
we’ve seen Capesize prices fall from $14.5 million $14 million. Supramax and Panamax had both
pulled back from $10 million to $9 million.” According to a Chinese shipping industry expert.
Lower vessel price is usually caused by the decline in the shipping cost, implying that importing
materials overseas becomes more attractive. Which is harmful for the domestic production as the
price of raw materials such as crude steel and coal has already showed large decline over the past six
months. Evidence can be found that the production of the steel in China has declined due to an
increase demand of international steel. “China’s iron ore imports reached a new high in July,
shipments totaled 73.1 million metric tons — a record monthly volume that was 26% higher than a
year earlier and 17% higher from June”. (Chuin-Wei Yap, 2013) Chinese government is expected to
take some actions by demanding steel overseas therefore driving up the international steel price and
making domestic steel supply more attractive.
Excluding Glencore-Xstrata deal, copper
and gold deals make up the majority part of
the M&A deals, with 30 percent and 27
percent respectively of the total gross
transaction value compares to 12 percent of
Iron Ore. These two metals together
accounted for half of the top 20 deals in
2012, even before considering their mix in
diversified metal mergers.
Gold is used as a hedge against the economic uncertainty. Copper, on the other hand,
reflects the future health of the global economy. However, both gold and copper prices
rose in 2012 and declined in the first half of 2013 implied that the oversupply problem in
the materials sector has distorted the relationship between gold and copper, changing
their 5-‐year correlation coefficient of 0.19 to 1-‐year correlation coefficient of 0.77.
ê Steel Steel as the most important product in the materials sector by volume, touching every aspect of
human lives. The steel industry directly employs more than 2 million people worldwide, and spends
more than $15 billion per year on process improvements, new product development and future
breakdown technology. However, the massive capital expenditures on innovation are not in line with
the growth rate of the production. Although the amount of energy required to produce a tonne of
steel has been reduced by 50%, the growth rate of the production is slowing down. While the total
steel produced still exceeded the total steel demanded. I assess the life cycle of steel industry is in
the decline phase, and anticipate continuing poor performance in the following 1 to 1.5 year horizon.
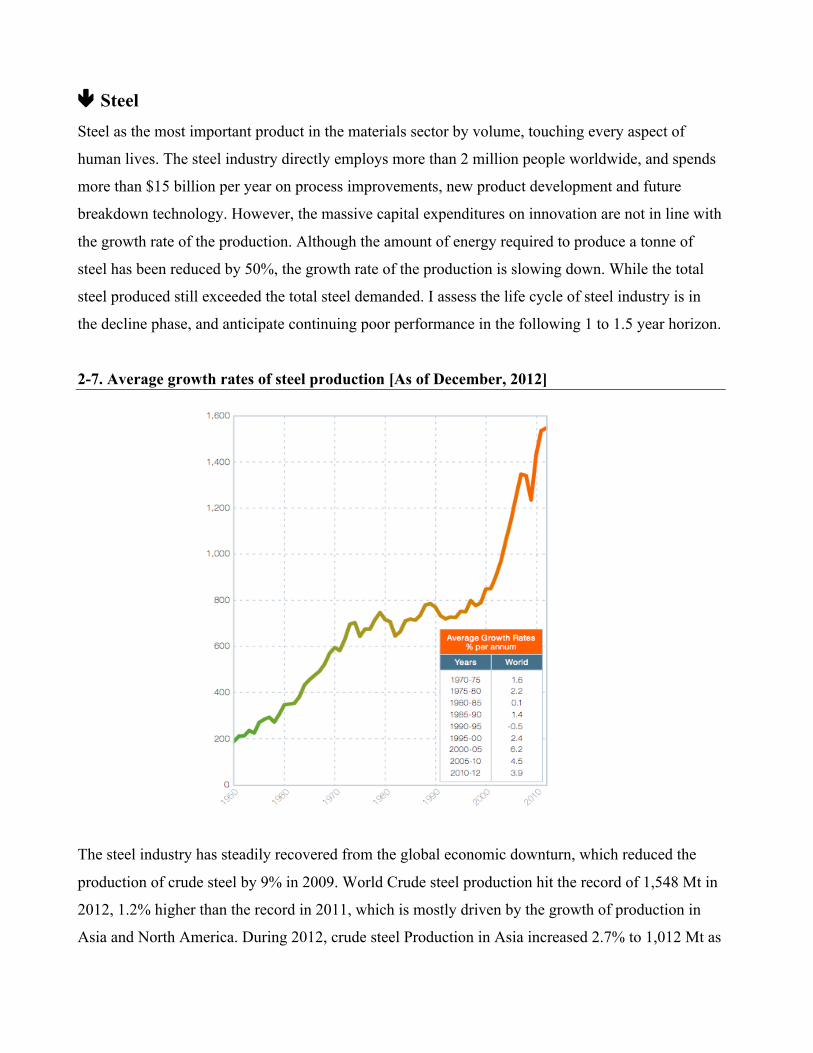
2-7. Average growth rates of steel production [As of December, 2012]
The steel industry has steadily recovered from the global economic downturn, which reduced the
production of crude steel by 9% in 2009. World Crude steel production hit the record of 1,548 Mt in
2012, 1.2% higher than the record in 2011, which is mostly driven by the growth of production in
Asia and North America. During 2012, crude steel Production in Asia increased 2.7% to 1,012 Mt as
China once again leaded the production by yielding over 46% of the global output, up 3.1% year
over year. The United States produced 88.6 Mt of crude steel, up 2.5% year over year, which
accounted for 6% of the global output and hold the third position in 2012. On the contrary,
Production in Japan remained flat, Euro and South America declined 2.7% and 3.1% respectively.
Higher production didn’t harvest more appealing profits. On the contrary, profits in the steel industry
slumped when the price of iron ore was hammered due to the lower demand from big consumers
such as China, and higher competition stemming from substitutes such as copper, aluminum and
chemical products. However, China continues its momentum on consuming commodity and basic
materials even as the economic growth has dropped over the past year.
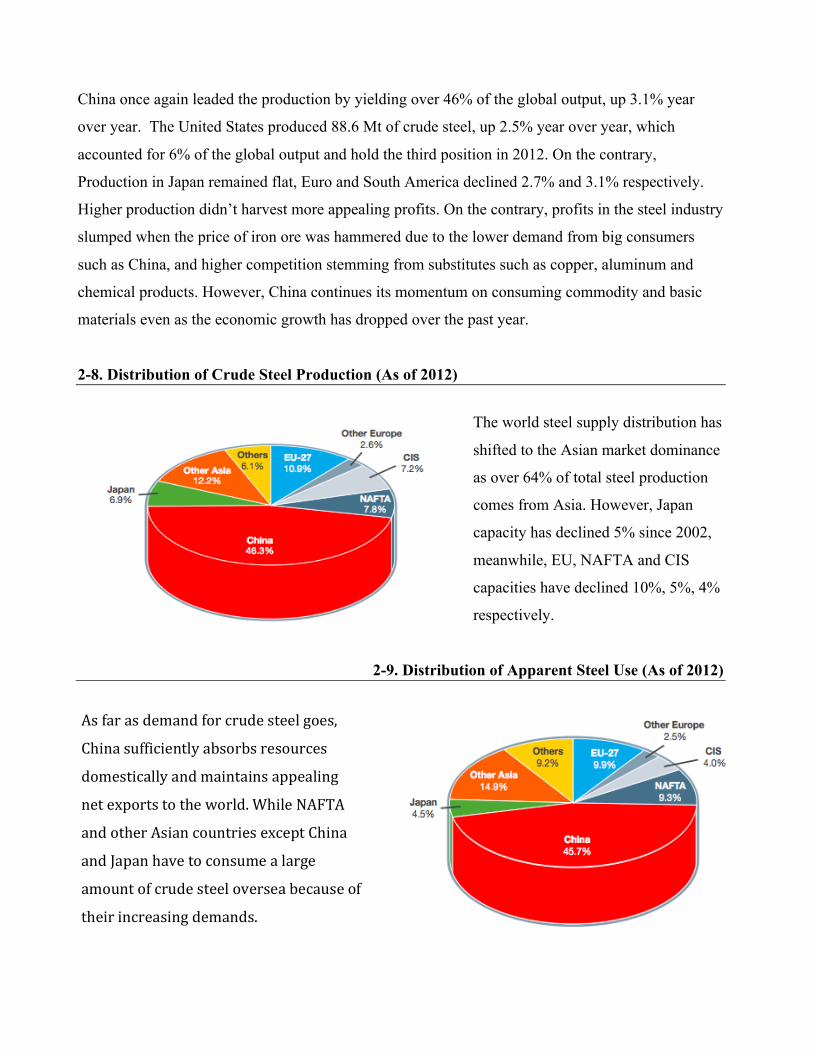
2-8. Distribution of Crude Steel Production (As of 2012)
The world steel supply distribution has
shifted to the Asian market dominance
as over 64% of total steel production
comes from Asia. However, Japan
capacity has declined 5% since 2002,
meanwhile, EU, NAFTA and CIS
capacities have declined 10%, 5%, 4%
respectively.
2-9. Distribution of Apparent Steel Use (As of 2012)
As far as demand for crude steel goes,
China sufficiently absorbs resources
domestically and maintains appealing
net exports to the world. While NAFTA
and other Asian countries except China
and Japan have to consume a large
amount of crude steel oversea because of
their increasing demands.
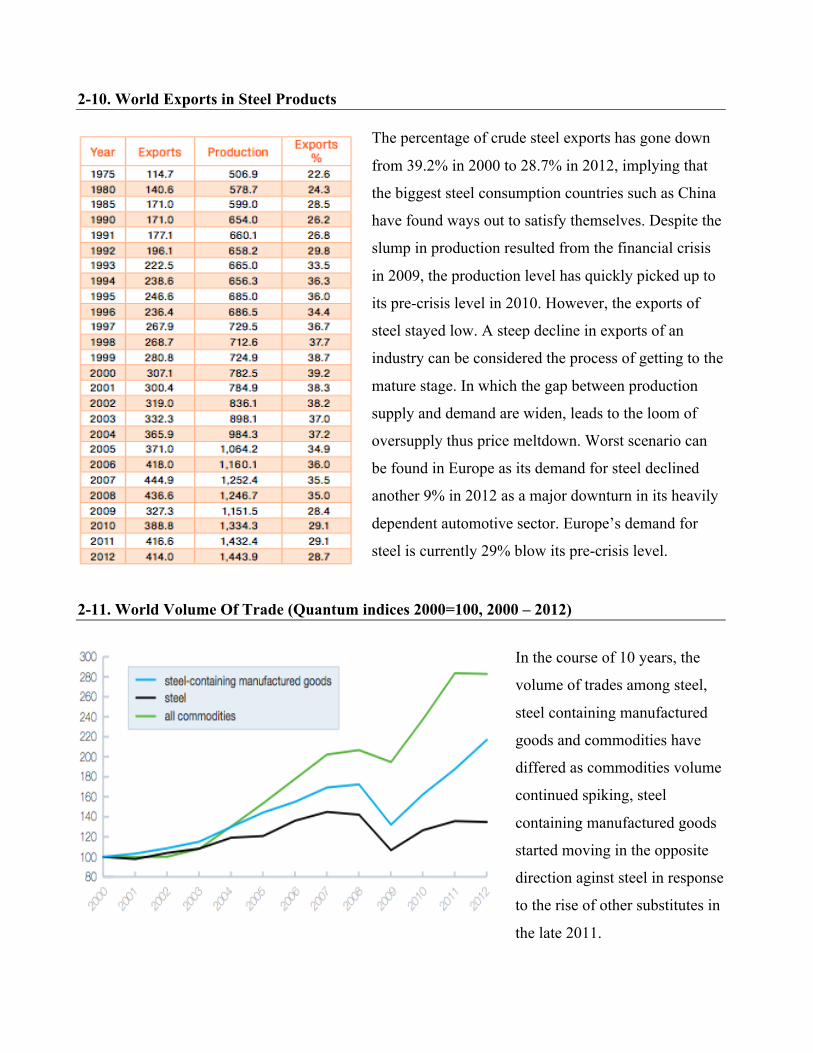
2-10. World Exports in Steel Products
The percentage of crude steel exports has gone down
from 39.2% in 2000 to 28.7% in 2012, implying that
the biggest steel consumption countries such as China
have found ways out to satisfy themselves. Despite the
slump in production resulted from the financial crisis
in 2009, the production level has quickly picked up to
its pre-crisis level in 2010. However, the exports of
steel stayed low. A steep decline in exports of an
industry can be considered the process of getting to the
mature stage. In which the gap between production
supply and demand are widen, leads to the loom of
oversupply thus price meltdown. Worst scenario can
be found in Europe as its demand for steel declined
another 9% in 2012 as a major downturn in its heavily
dependent automotive sector. Europe’s demand for
steel is currently 29% blow its pre-crisis level.
2-11. World Volume Of Trade (Quantum indices 2000=100, 2000 – 2012)
In the course of 10 years, the
volume of trades among steel,
steel containing manufactured
goods and commodities have
differed as commodities volume
continued spiking, steel
containing manufactured goods
started moving in the opposite
direction aginst steel in response
to the rise of other substitutes in
the late 2011.

The automotive and construction sectors, two biggest markets for steel consumption showed
opposite result in 2012. The automotive sector in the US hit the record in five years as auto sales
shot up 13% to 14.5 million vehicles in 2012, driving up a strong demand for steel, mostly
influenced by cheap financing, cheap gas and the launch of fuel-efficient vehicle. However,
intelligent materials concepts are increasingly required in order to achieve energy efficiency and
sustainability. To be specific, lightweight construction is increasingly adopted: according to Green
Car Congress, in March this year, the Advanced Research Project Agency-Energy (ARPA-E)
rewarded 18 projects that could recycle metals to the construction of lightweight cars. Which implies
the likelihood that the steel will be taken over by chemical plastic in the future.
On the other hand, the construction market delivered a sign of slowdown. Globally, according to the
Wall Street Journal, Chinese economy sluggish has over as industrial output accelerated to 10.4%
year-to-year growth in august, up from 9.7% in July, which built up the market confidence regarding
the demand of steel. However, an up close examination indicates that the total social financing
(broad measure of new credit in the economy) in China was 1.6 trillion yuan in August, nearly
doubled the amount of 808 billion yuan in July, raising doubts regarding if the growth in
construction built on debts could truly reflect a comeback of the economic growth.
China’s September HSBC Flash Manufacturing PMI, which is largely viewed as a leading
indicator of the strength of China’s economic activity, rose and beat estimates. More iron ore is
needed to support Chinese growing manufacturing activities, while cheap Iron ore price induces
Chinese corporations to import iron ore overseas instead of absorbing domestically. Due to the
nature of Mixed Capitalist
economic system in China, the
Chinese government is
expected to step up by
demanding iron ore overseas
to increase international steel
price therefore increasing
domestic steel profit, which
may create continuous tension
in global steel competition.
(HSBC, 2013)

2-12. New Housing Units Started in the United States
(U.S. Department of Commerce, 2013)
Since iron and steel make up a majority of the volume in the materials sector, followed by
aluminum, copper and gold. After picking steel industry as a falling sub-industry, following section
introduces gold and copper sub-industries as comparative rising sub-industries to further analyze the
future outlook of the materials industry.
éGold & Copper Gold and copper on the other hand, have shown solid prospects regarding their future demand and
production. I assess both gold and copper industries are in the recovery phase of their lifecycles, and
anticipate steady growth in the following 1 to 1.5 year horizon majorly due to the raising economic
uncertainties and increasing M&A transactions.
The demand of gold has fallen 118.2 tonnes in the second quarter of 2013 compares to the second
quarter of 2012, mostly reflected by a rapid decline in the ETFs and the central bank net purchases.
However, the decline of demand from ETFs and Central bank was mitigated by the large growth of
demand from jewelry, as well as bar and coin. Which delivered an optimistic perspective regarding
the growth of the global economy going forward, driving gold price to the lowest point since the end
of 2010. On the other hand, the abnormal optimism provides more downside risk as the economic
uncertainty rises, which gives gold more upward opportunities.
Demand from technology applications is also promising as the price correction of gold provided a
much needed boost to the sector as manufacturers took advantage of lower prices to replenish
previously liquidated assets.
Domestically, US Construction
sector haven’t seen significant
growth since 2009. With
approximately 891,000 total new
housing units under construction
by September this year. New
construction activities are still
below its pre-‐crisis level.
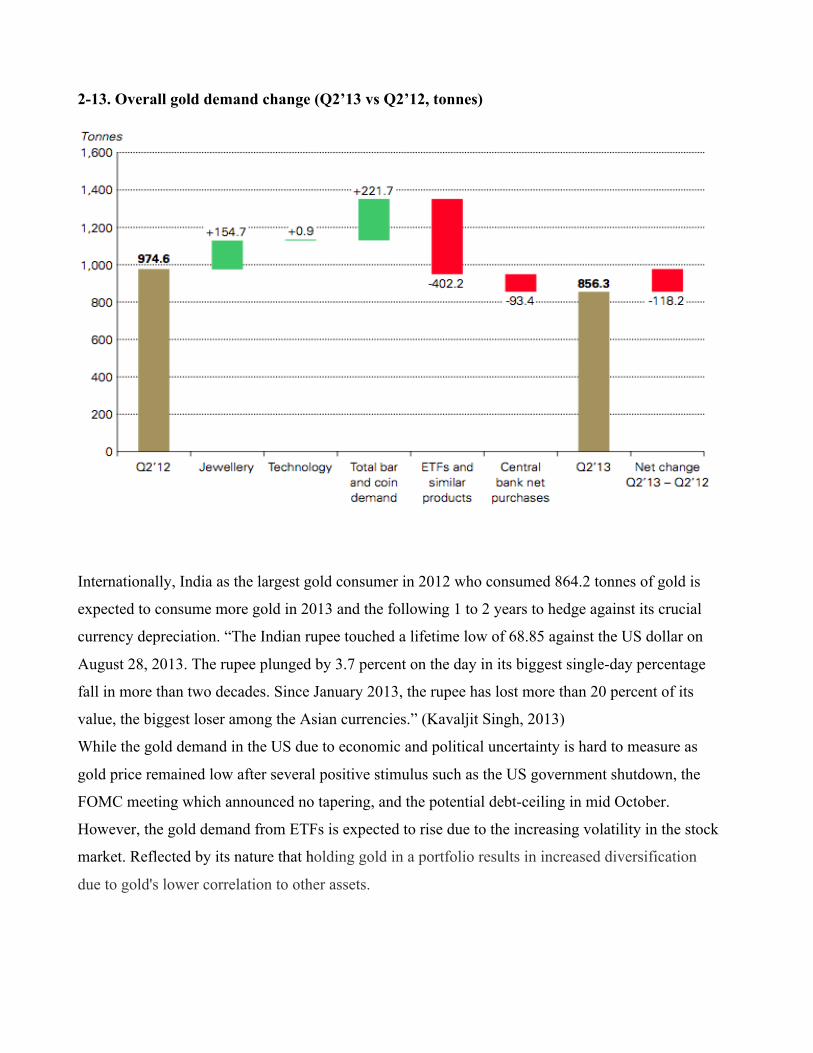
2-13. Overall gold demand change (Q2’13 vs Q2’12, tonnes)
Internationally, India as the largest gold consumer in 2012 who consumed 864.2 tonnes of gold is
expected to consume more gold in 2013 and the following 1 to 2 years to hedge against its crucial
currency depreciation. “The Indian rupee touched a lifetime low of 68.85 against the US dollar on
August 28, 2013. The rupee plunged by 3.7 percent on the day in its biggest single-day percentage
fall in more than two decades. Since January 2013, the rupee has lost more than 20 percent of its
value, the biggest loser among the Asian currencies.” (Kavaljit Singh, 2013)
While the gold demand in the US due to economic and political uncertainty is hard to measure as
gold price remained low after several positive stimulus such as the US government shutdown, the
FOMC meeting which announced no tapering, and the potential debt-ceiling in mid October.
However, the gold demand from ETFs is expected to rise due to the increasing volatility in the stock
market. Reflected by its nature that holding gold in a portfolio results in increased diversification
due to gold's lower correlation to other assets.
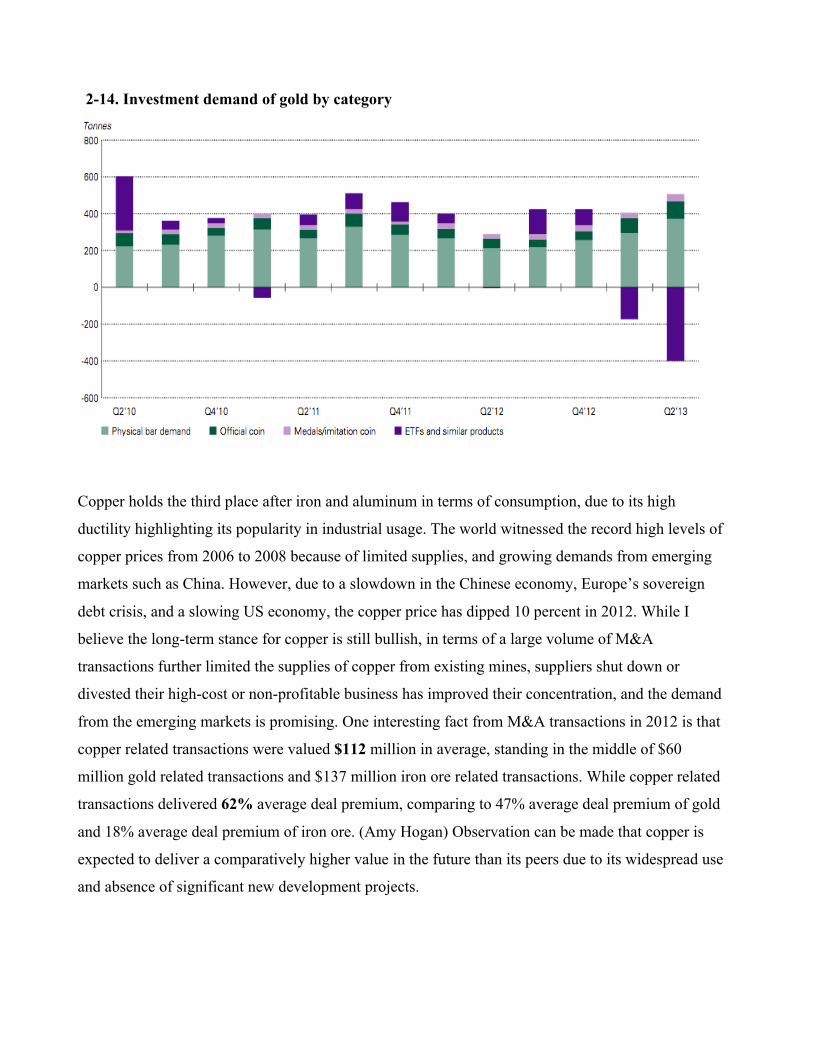
2-14. Investment demand of gold by category
Copper holds the third place after iron and aluminum in terms of consumption, due to its high
ductility highlighting its popularity in industrial usage. The world witnessed the record high levels of
copper prices from 2006 to 2008 because of limited supplies, and growing demands from emerging
markets such as China. However, due to a slowdown in the Chinese economy, Europe’s sovereign
debt crisis, and a slowing US economy, the copper price has dipped 10 percent in 2012. While I
believe the long-term stance for copper is still bullish, in terms of a large volume of M&A
transactions further limited the supplies of copper from existing mines, suppliers shut down or
divested their high-cost or non-profitable business has improved their concentration, and the demand
from the emerging markets is promising. One interesting fact from M&A transactions in 2012 is that
copper related transactions were valued $112 million in average, standing in the middle of $60
million gold related transactions and $137 million iron ore related transactions. While copper related
transactions delivered 62% average deal premium, comparing to 47% average deal premium of gold
and 18% average deal premium of iron ore. (Amy Hogan) Observation can be made that copper is
expected to deliver a comparatively higher value in the future than its peers due to its widespread use
and absence of significant new development projects.
Chemical Industry Life/Business Cycle
The technological advancements in horizontal drilling and fractionation have guaranteed the US to
obtain natural gas from shale domestically. With the increase in natural gas production, the price of
US natural gas has declined from $12.50/MBTU in 2008 to approximately $3.49/MBTU in 2013 (As
of Sep 27). Consequently, chemicals industry will be able to take advantage of low-cost chemicals to
create chemical-based substitutes against other materials such as metal, glass and wood. The
chemicals industry has invested $15 billion in ethylene production, increasing capacity by 33%.
(Anthony, 2012) This estimate is expected to continue growing next year.
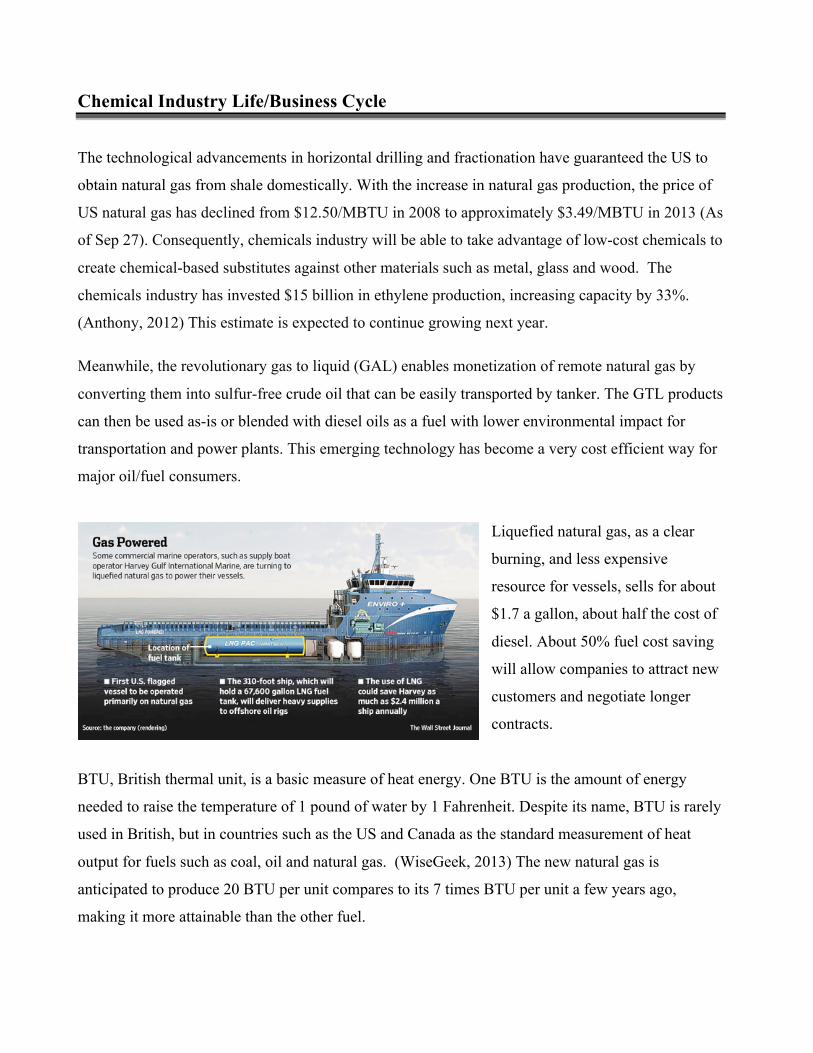
Meanwhile, the revolutionary gas to liquid (GAL) enables monetization of remote natural gas by
converting them into sulfur-free crude oil that can be easily transported by tanker. The GTL products
can then be used as-is or blended with diesel oils as a fuel with lower environmental impact for
transportation and power plants. This emerging technology has become a very cost efficient way for
major oil/fuel consumers.
Liquefied natural gas, as a clear
burning, and less expensive
resource for vessels, sells for about
$1.7 a gallon, about half the cost of
diesel. About 50% fuel cost saving
will allow companies to attract new
customers and negotiate longer
contracts.
BTU, British thermal unit, is a basic measure of heat energy. One BTU is the amount of energy
needed to raise the temperature of 1 pound of water by 1 Fahrenheit. Despite its name, BTU is rarely
used in British, but in countries such as the US and Canada as the standard measurement of heat
output for fuels such as coal, oil and natural gas. (WiseGeek, 2013) The new natural gas is
anticipated to produce 20 BTU per unit compares to its 7 times BTU per unit a few years ago,
making it more attainable than the other fuel.
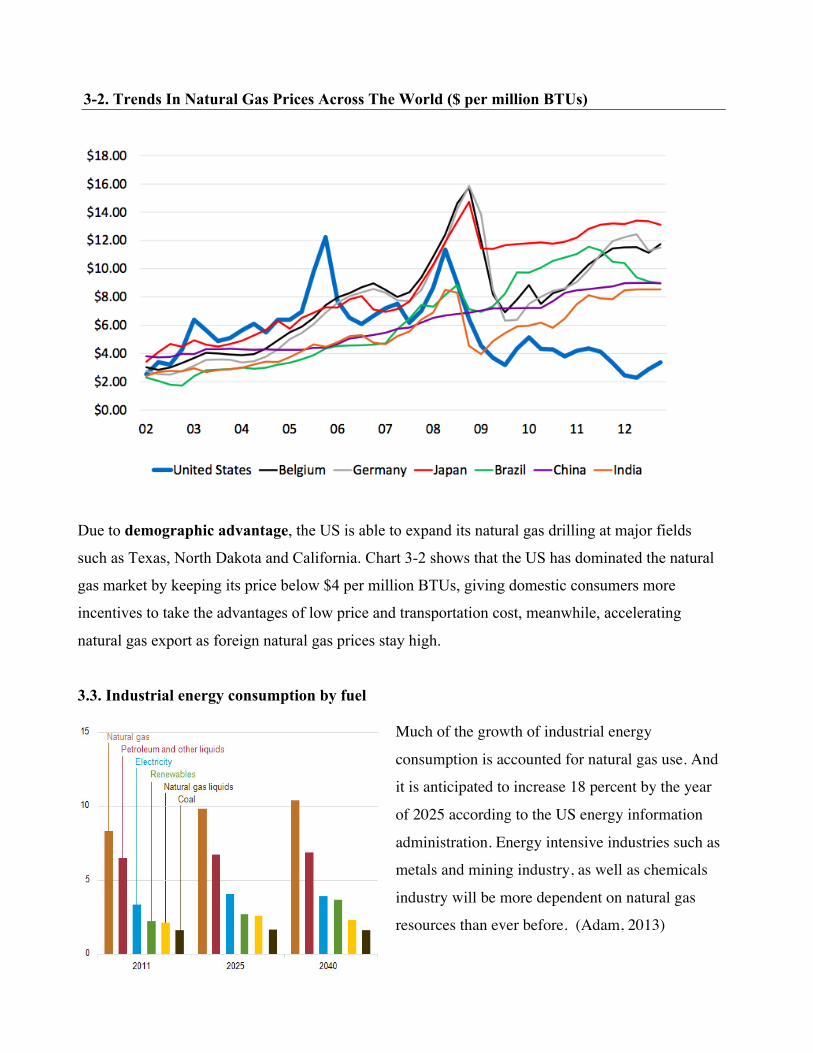
3-2. Trends In Natural Gas Prices Across The World ($ per million BTUs)
Due to demographic advantage, the US is able to expand its natural gas drilling at major fields
such as Texas, North Dakota and California. Chart 3-2 shows that the US has dominated the natural
gas market by keeping its price below $4 per million BTUs, giving domestic consumers more
incentives to take the advantages of low price and transportation cost, meanwhile, accelerating
natural gas export as foreign natural gas prices stay high.
3.3. Industrial energy consumption by fuel
Much of the growth of industrial energy
consumption is accounted for natural gas use. And
it is anticipated to increase 18 percent by the year
of 2025 according to the US energy information
administration. Energy intensive industries such as
metals and mining industry, as well as chemicals
industry will be more dependent on natural gas
resources than ever before. (Adam, 2013)
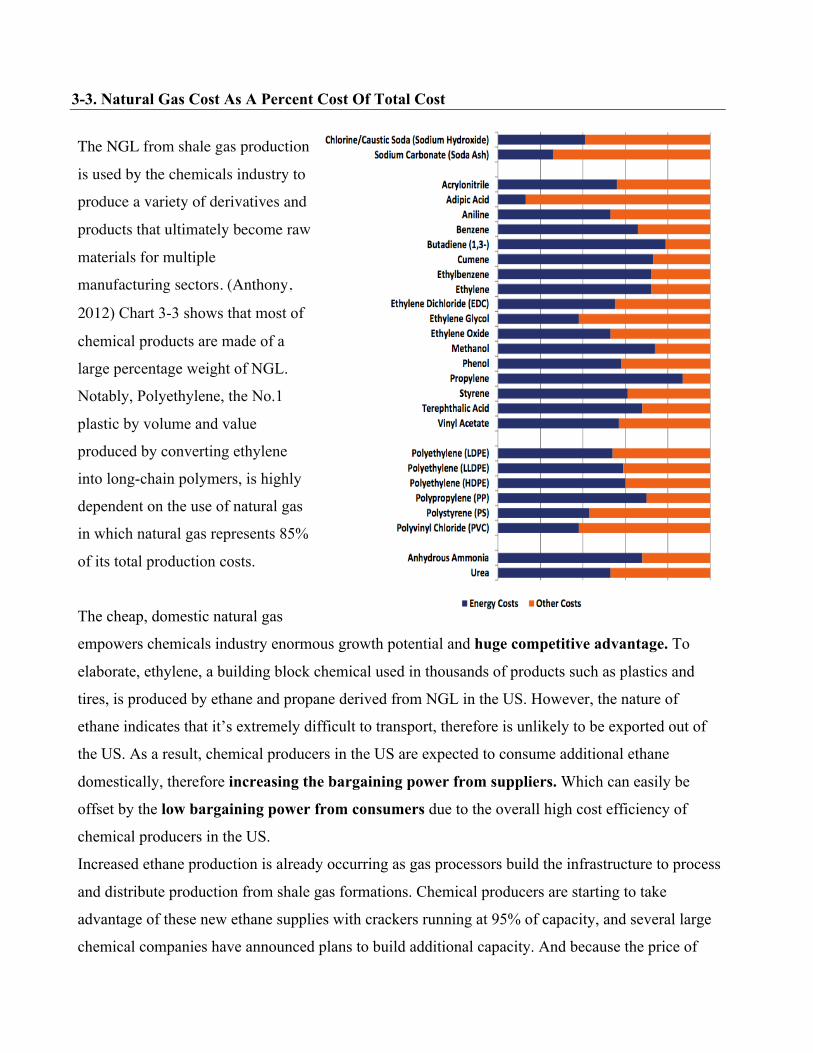
3-3. Natural Gas Cost As A Percent Cost Of Total Cost
The NGL from shale gas production���
is used by the chemicals industry to
produce a variety of derivatives and
products that ultimately become raw
materials for multiple
manufacturing sectors. (Anthony,
2012) Chart 3-3 shows that most of
chemical products are made of a
large percentage weight of NGL.
Notably, Polyethylene, the No.1
plastic by volume and value
produced by converting ethylene
into long-chain polymers, is highly
dependent on the use of natural gas
in which natural gas represents 85%
of its total production costs.
The cheap, domestic natural gas
empowers chemicals industry enormous growth potential and huge competitive advantage. To
elaborate, ethylene, a building block chemical used in thousands of products such as plastics and
tires, is produced by ethane and propane derived from NGL in the US. However, the nature of
ethane indicates that it’s extremely difficult to transport, therefore is unlikely to be exported out of
the US. As a result, chemical producers in the US are expected to consume additional ethane
domestically, therefore increasing the bargaining power from suppliers. Which can easily be
offset by the low bargaining power from consumers due to the overall high cost efficiency of
chemical producers in the US.
Increased ethane production is already occurring as gas processors build the infrastructure to process
and distribute production from shale gas formations. Chemical producers are starting to take
advantage of these new ethane supplies with crackers running at 95% of capacity, and several large
chemical companies have announced plans to build additional capacity. And because the price of
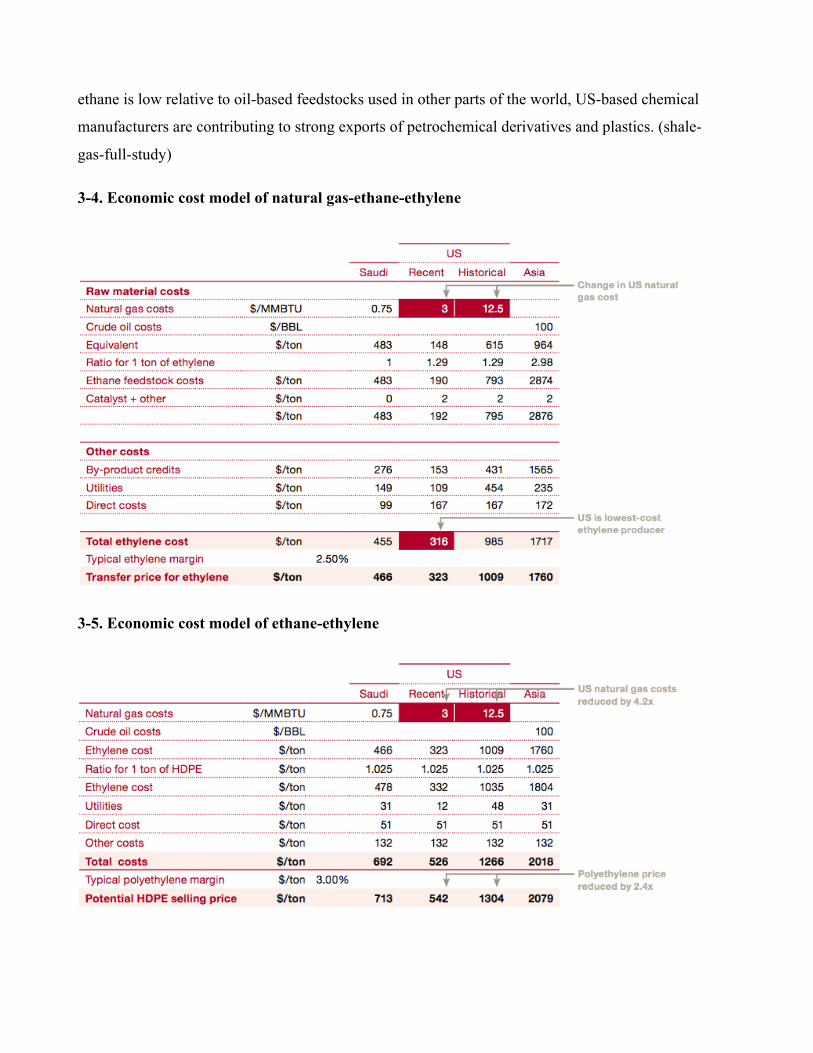
ethane is low relative to oil-based feedstocks used in other parts of the world, US-based chemical
manufacturers are contributing to strong exports of petrochemical derivatives and plastics. (shale-
gas-full-study)
3-4. Economic cost model of natural gas-ethane-ethylene
3-5. Economic cost model of ethane-ethylene
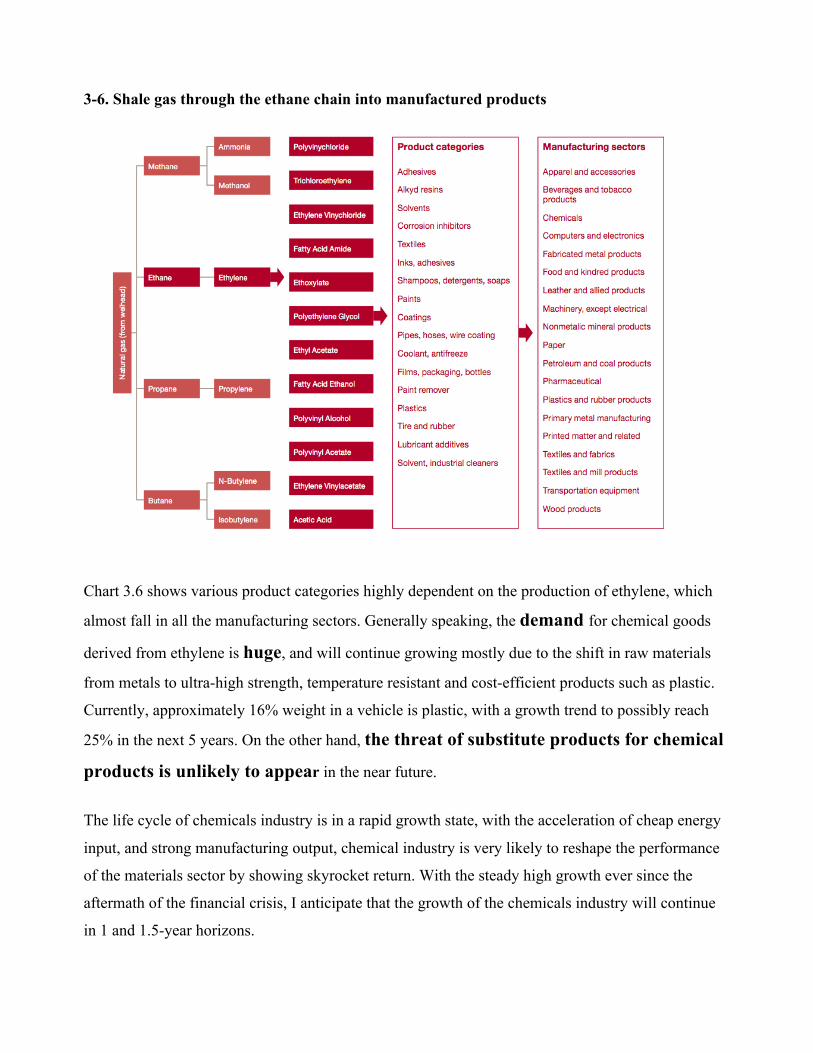
3-6. Shale gas through the ethane chain into manufactured products
Chart 3.6 shows various product categories highly dependent on the production of ethylene, which
almost fall in all the manufacturing sectors. Generally speaking, the demand for chemical goods
derived from ethylene is huge, and will continue growing mostly due to the shift in raw materials
from metals to ultra-high strength, temperature resistant and cost-efficient products such as plastic.
Currently, approximately 16% weight in a vehicle is plastic, with a growth trend to possibly reach
25% in the next 5 years. On the other hand, the threat of substitute products for chemical
products is unlikely to appear in the near future.
The life cycle of chemicals industry is in a rapid growth state, with the acceleration of cheap energy
input, and strong manufacturing output, chemical industry is very likely to reshape the performance
of the materials sector by showing skyrocket return. With the steady high growth ever since the
aftermath of the financial crisis, I anticipate that the growth of the chemicals industry will continue
in 1 and 1.5-year horizons.
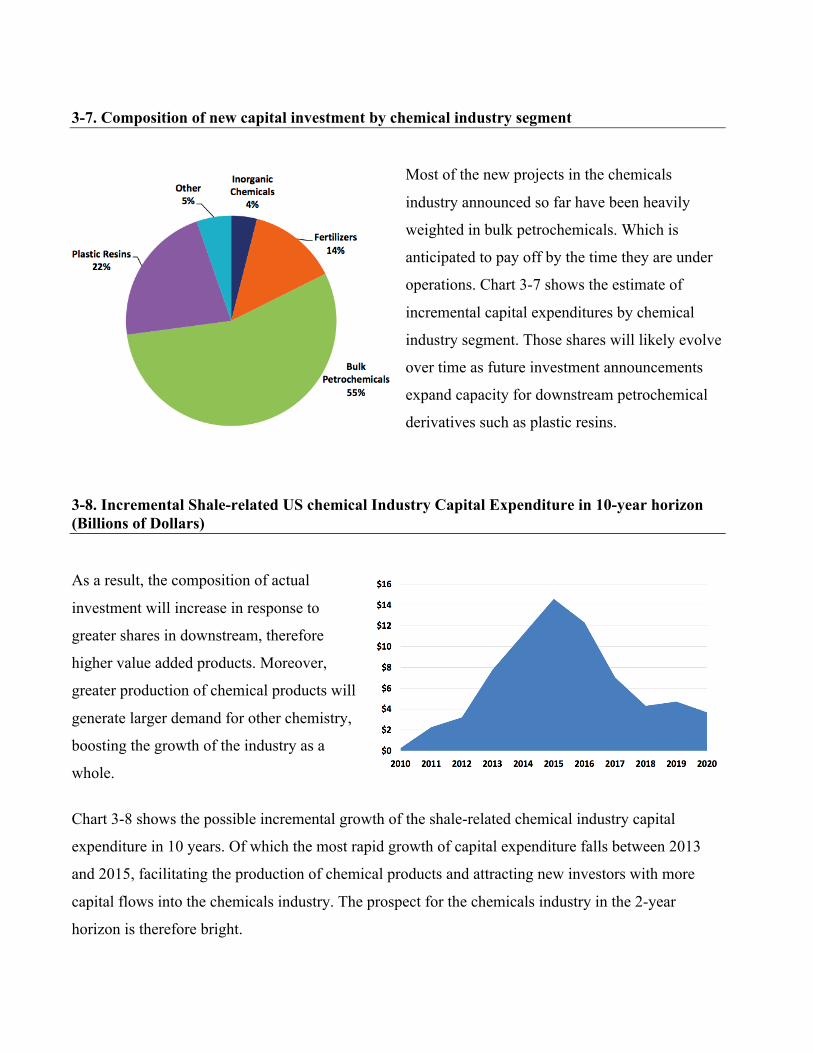
3-7. Composition of new capital investment by chemical industry segment
Most of the new projects in the chemicals
industry announced so far have been heavily
weighted in bulk petrochemicals. Which is
anticipated to pay off by the time they are under
operations. Chart 3-7 shows the estimate of
incremental capital expenditures by chemical
industry segment. Those shares will likely evolve
over time as future investment announcements
expand capacity for downstream petrochemical
derivatives such as plastic resins.
3-8. Incremental Shale-related US chemical Industry Capital Expenditure in 10-year horizon (Billions of Dollars)
As a result, the composition of actual
investment will increase in response to
greater shares in downstream, therefore
higher value added products. Moreover,
greater production of chemical products will
generate larger demand for other chemistry,
boosting the growth of the industry as a
whole.
Chart 3-8 shows the possible incremental growth of the shale-related chemical industry capital
expenditure in 10 years. Of which the most rapid growth of capital expenditure falls between 2013
and 2015, facilitating the production of chemical products and attracting new investors with more
capital flows into the chemicals industry. The prospect for the chemicals industry in the 2-year
horizon is therefore bright.
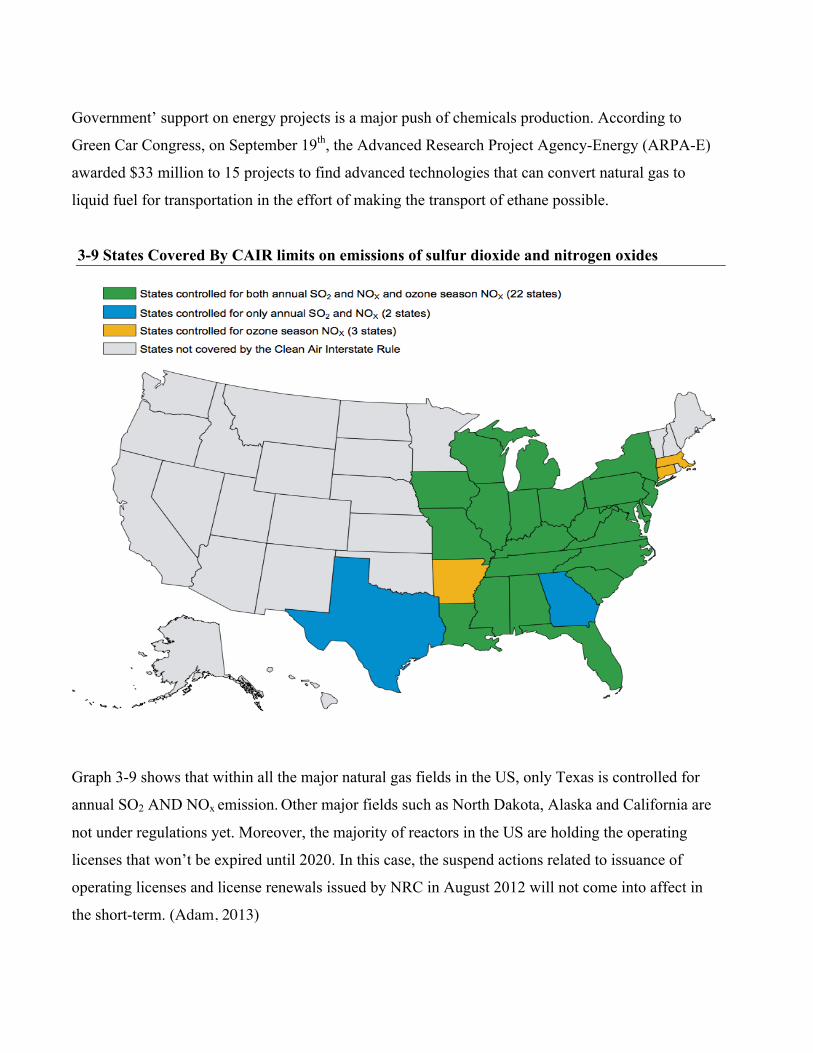
Government’ support on energy projects is a major push of chemicals production. According to
Green Car Congress, on September 19th, the Advanced Research Project Agency-Energy (ARPA-E)
awarded $33 million to 15 projects to find advanced technologies that can convert natural gas to
liquid fuel for transportation in the effort of making the transport of ethane possible.
3-9 States Covered By CAIR limits on emissions of sulfur dioxide and nitrogen oxides
Graph 3-9 shows that within all the major natural gas fields in the US, only Texas is controlled for
annual SO2 AND NOx emission. Other major fields such as North Dakota, Alaska and California are
not under regulations yet. Moreover, the majority of reactors in the US are holding the operating
licenses that won’t be expired until 2020. In this case, the suspend actions related to issuance of
operating licenses and license renewals issued by NRC in August 2012 will not come into affect in
the short-term. (Adam, 2013)
Financial Analysis
After comparing the Chemicals industry with the Metals and Mining industry in terms of life cycle,
business cycle, competition, historical performance, future growth potential and other factors. I observe
that the chemicals industry has significant advantages over the metals and mining industry.
Consequently, my focus on financial analysis section shifts to chemical industry. By using cross
sectional comparison with the overall sector performance and cross time comparison with the historical
performance. Conclusion can be drawn that chemicals industry is momentum, however its lead is
berried by the overall undervaluation of the materials sector.
Revenue Growth & Earning Growth Analysis
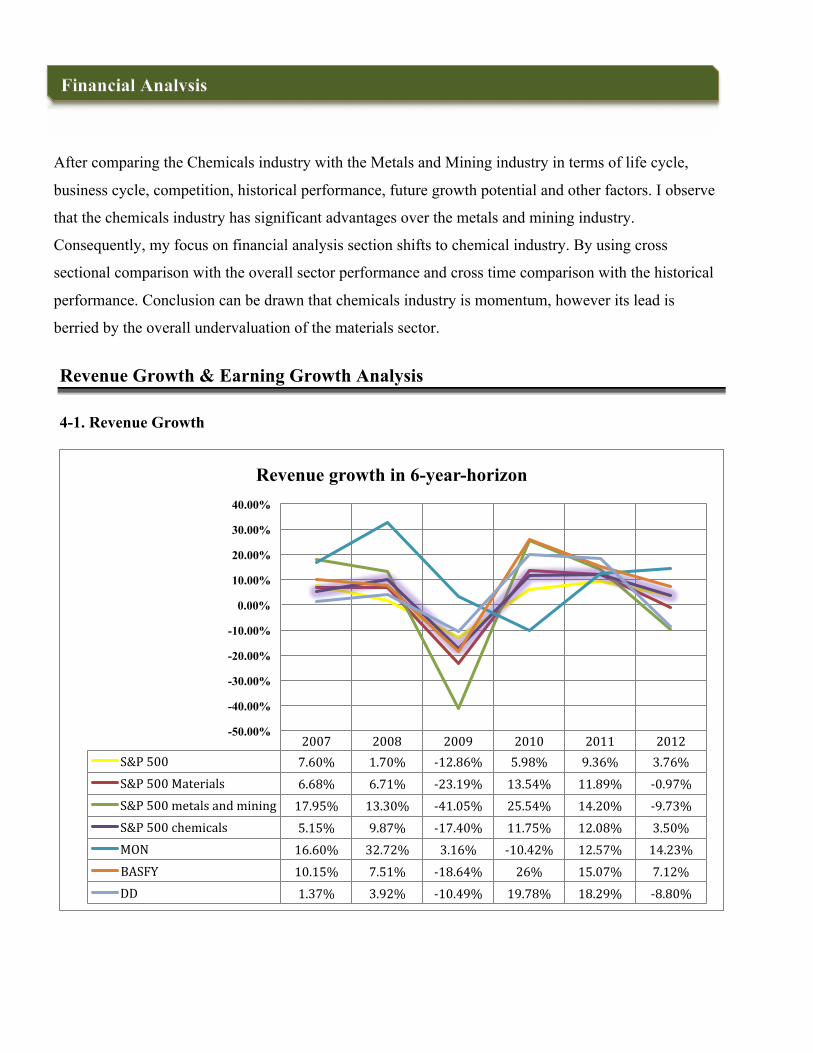
4-1. Revenue Growth
2007 2008 2009 2010 2011 2012 S&P 500 7.60% 1.70% -‐12.86% 5.98% 9.36% 3.76% S&P 500 Materials 6.68% 6.71% -‐23.19% 13.54% 11.89% -‐0.97% S&P 500 metals and mining 17.95% 13.30% -‐41.05% 25.54% 14.20% -‐9.73% S&P 500 chemicals 5.15% 9.87% -‐17.40% 11.75% 12.08% 3.50% MON 16.60% 32.72% 3.16% -‐10.42% 12.57% 14.23% BASFY 10.15% 7.51% -‐18.64% 26% 15.07% 7.12% DD 1.37% 3.92% -‐10.49% 19.78% 18.29% -‐8.80%
-50.00%
-40.00%
-30.00%
-20.00%
-10.00%
0.00%
10.00%
20.00%
30.00%
40.00%
Revenue growth in 6-year-horizon
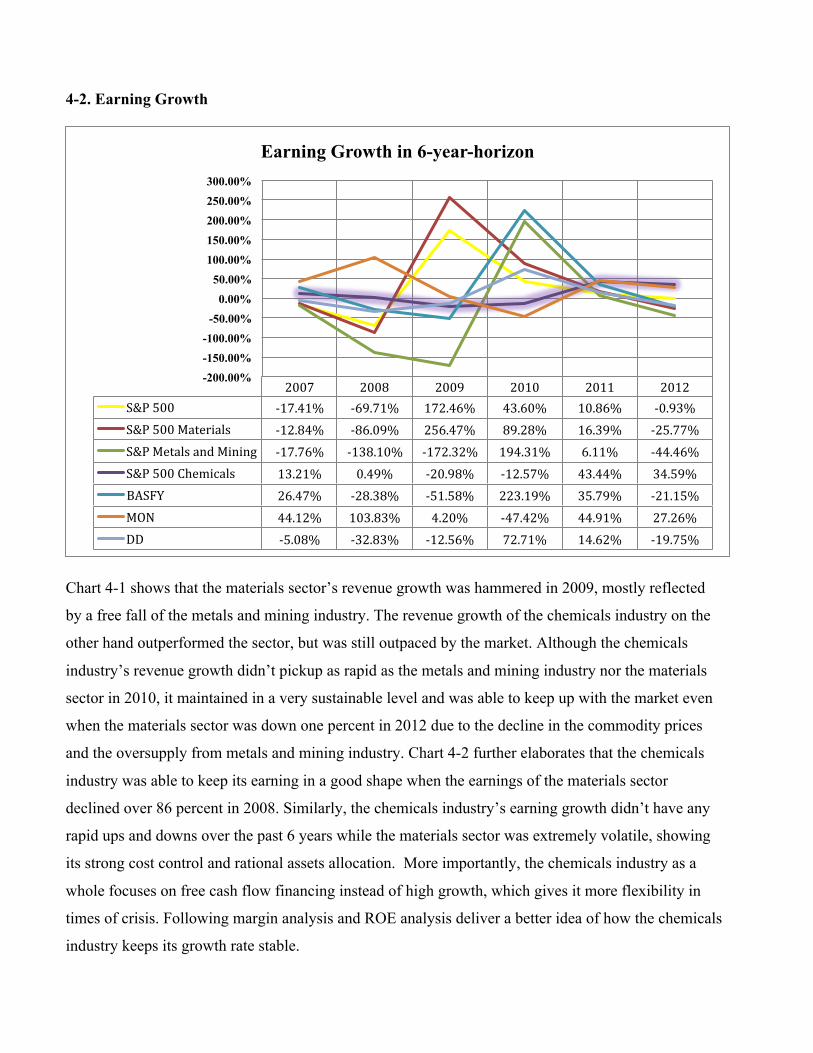
4-2. Earning Growth
Chart 4-1 shows that the materials sector’s revenue growth was hammered in 2009, mostly reflected
by a free fall of the metals and mining industry. The revenue growth of the chemicals industry on the
other hand outperformed the sector, but was still outpaced by the market. Although the chemicals
industry’s revenue growth didn’t pickup as rapid as the metals and mining industry nor the materials
sector in 2010, it maintained in a very sustainable level and was able to keep up with the market even
when the materials sector was down one percent in 2012 due to the decline in the commodity prices
and the oversupply from metals and mining industry. Chart 4-2 further elaborates that the chemicals
industry was able to keep its earning in a good shape when the earnings of the materials sector
declined over 86 percent in 2008. Similarly, the chemicals industry’s earning growth didn’t have any
rapid ups and downs over the past 6 years while the materials sector was extremely volatile, showing
its strong cost control and rational assets allocation. More importantly, the chemicals industry as a
whole focuses on free cash flow financing instead of high growth, which gives it more flexibility in
times of crisis. Following margin analysis and ROE analysis deliver a better idea of how the chemicals
industry keeps its growth rate stable.
2007 2008 2009 2010 2011 2012 S&P 500 -‐17.41% -‐69.71% 172.46% 43.60% 10.86% -‐0.93% S&P 500 Materials -‐12.84% -‐86.09% 256.47% 89.28% 16.39% -‐25.77% S&P Metals and Mining -‐17.76% -‐138.10% -‐172.32% 194.31% 6.11% -‐44.46% S&P 500 Chemicals 13.21% 0.49% -‐20.98% -‐12.57% 43.44% 34.59% BASFY 26.47% -‐28.38% -‐51.58% 223.19% 35.79% -‐21.15% MON 44.12% 103.83% 4.20% -‐47.42% 44.91% 27.26% DD -‐5.08% -‐32.83% -‐12.56% 72.71% 14.62% -‐19.75%
-200.00% -150.00% -100.00%
-50.00% 0.00%
50.00% 100.00% 150.00% 200.00% 250.00% 300.00%
Earning Growth in 6-year-horizon
Margin Analysis
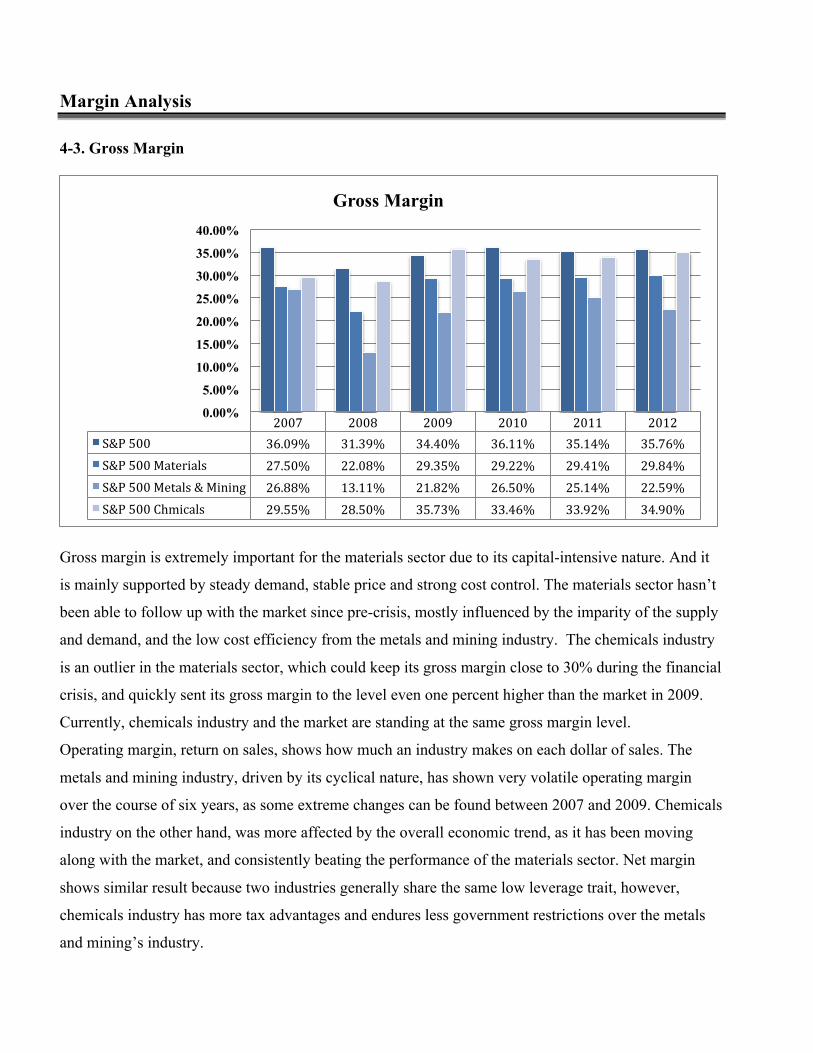
4-3. Gross Margin
Gross margin is extremely important for the materials sector due to its capital-intensive nature. And it
is mainly supported by steady demand, stable price and strong cost control. The materials sector hasn’t
been able to follow up with the market since pre-crisis, mostly influenced by the imparity of the supply
and demand, and the low cost efficiency from the metals and mining industry. The chemicals industry
is an outlier in the materials sector, which could keep its gross margin close to 30% during the financial
crisis, and quickly sent its gross margin to the level even one percent higher than the market in 2009.
Currently, chemicals industry and the market are standing at the same gross margin level.
Operating margin, return on sales, shows how much an industry makes on each dollar of sales. The
metals and mining industry, driven by its cyclical nature, has shown very volatile operating margin
over the course of six years, as some extreme changes can be found between 2007 and 2009. Chemicals
industry on the other hand, was more affected by the overall economic trend, as it has been moving
along with the market, and consistently beating the performance of the materials sector. Net margin
shows similar result because two industries generally share the same low leverage trait, however,
chemicals industry has more tax advantages and endures less government restrictions over the metals
and mining’s industry.
2007 2008 2009 2010 2011 2012 S&P 500 36.09% 31.39% 34.40% 36.11% 35.14% 35.76% S&P 500 Materials 27.50% 22.08% 29.35% 29.22% 29.41% 29.84% S&P 500 Metals & Mining 26.88% 13.11% 21.82% 26.50% 25.14% 22.59% S&P 500 Chmicals 29.55% 28.50% 35.73% 33.46% 33.92% 34.90%
0.00%
5.00%
10.00%
15.00%
20.00%
25.00%
30.00%
35.00%
40.00%
Gross Margin

4-4. Operating Margin (ROS)
4-5. Net Margin
2007 2008 2009 2010 2011 2012 S&P 500 16.02% 8.28% 11.21% 14.10% 14.03% 13.65% S&P 500 Materials 13.07% 3.65% 9.35% 12.80% 13.53% 10.84% S&P 500 Metals & Mining 17.98% -‐2.11% 9.73% 16.55% 15.62% 10.78% S&P 500 Chemicals 11.93% 9.18% 10.01% 12.43% 14.29% 12.86%
-5.00%
0.00%
5.00%
10.00%
15.00%
20.00%
ROS
2007 2008 2009 2010 2011 2012 S&P 500 6.83% 2.04% 6.37% 8.62% 8.74% 8.35% S&P 500 Materials 7.87% 1.03% 4.76% 7.94% 8.26% 6.19% S&P 500 Metals & Mining 10.38% -‐3.49% 4.28% 10.04% 9.33% 5.74% S&P 500 Chemicals 7.92% 5.70% 6.03% 7.74% 9.29% 8.15%
-6.00%
-4.00%
-2.00%
0.00%
2.00%
4.00%
6.00%
8.00%
10.00%
12.00%
Net Margin
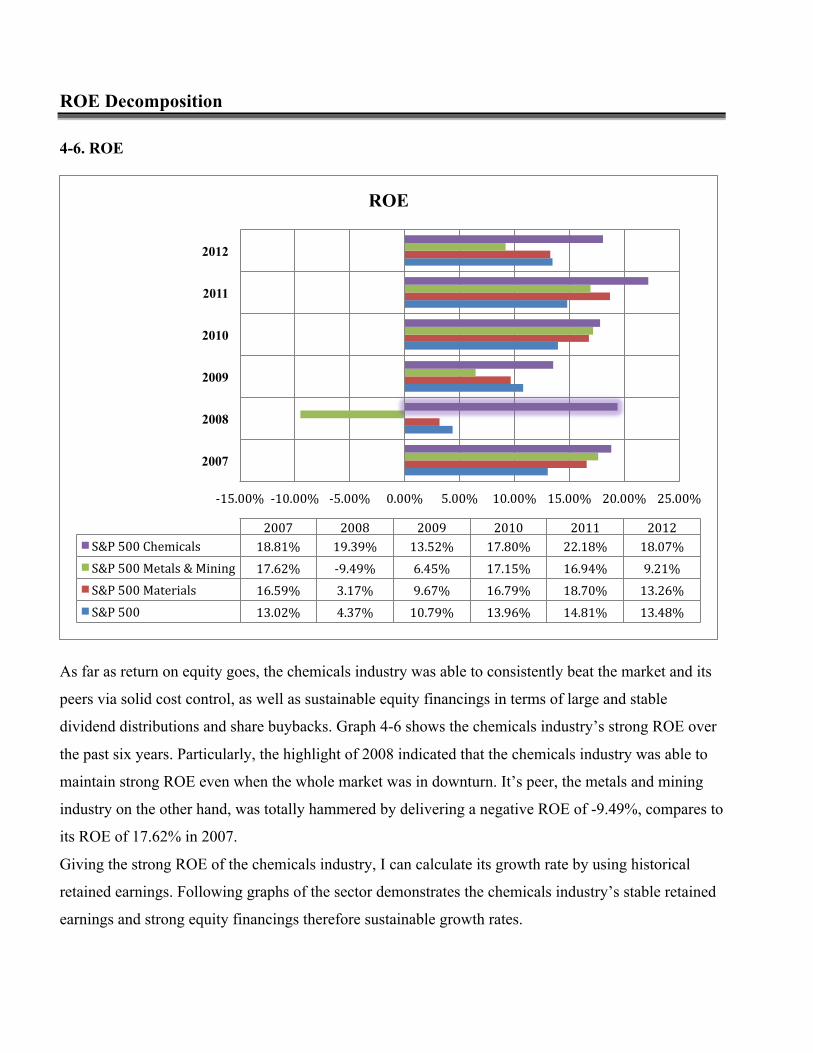
ROE Decomposition 4-6. ROE
As far as return on equity goes, the chemicals industry was able to consistently beat the market and its
peers via solid cost control, as well as sustainable equity financings in terms of large and stable
dividend distributions and share buybacks. Graph 4-6 shows the chemicals industry’s strong ROE over
the past six years. Particularly, the highlight of 2008 indicated that the chemicals industry was able to
maintain strong ROE even when the whole market was in downturn. It’s peer, the metals and mining
industry on the other hand, was totally hammered by delivering a negative ROE of -9.49%, compares to
its ROE of 17.62% in 2007.
Giving the strong ROE of the chemicals industry, I can calculate its growth rate by using historical
retained earnings. Following graphs of the sector demonstrates the chemicals industry’s stable retained
earnings and strong equity financings therefore sustainable growth rates.
-‐15.00% -‐10.00% -‐5.00% 0.00% 5.00% 10.00% 15.00% 20.00% 25.00%
2007
2008
2009
2010
2011
2012
2007 2008 2009 2010 2011 2012 S&P 500 Chemicals 18.81% 19.39% 13.52% 17.80% 22.18% 18.07% S&P 500 Metals & Mining 17.62% -‐9.49% 6.45% 17.15% 16.94% 9.21% S&P 500 Materials 16.59% 3.17% 9.67% 16.79% 18.70% 13.26% S&P 500 13.02% 4.37% 10.79% 13.96% 14.81% 13.48%
ROE
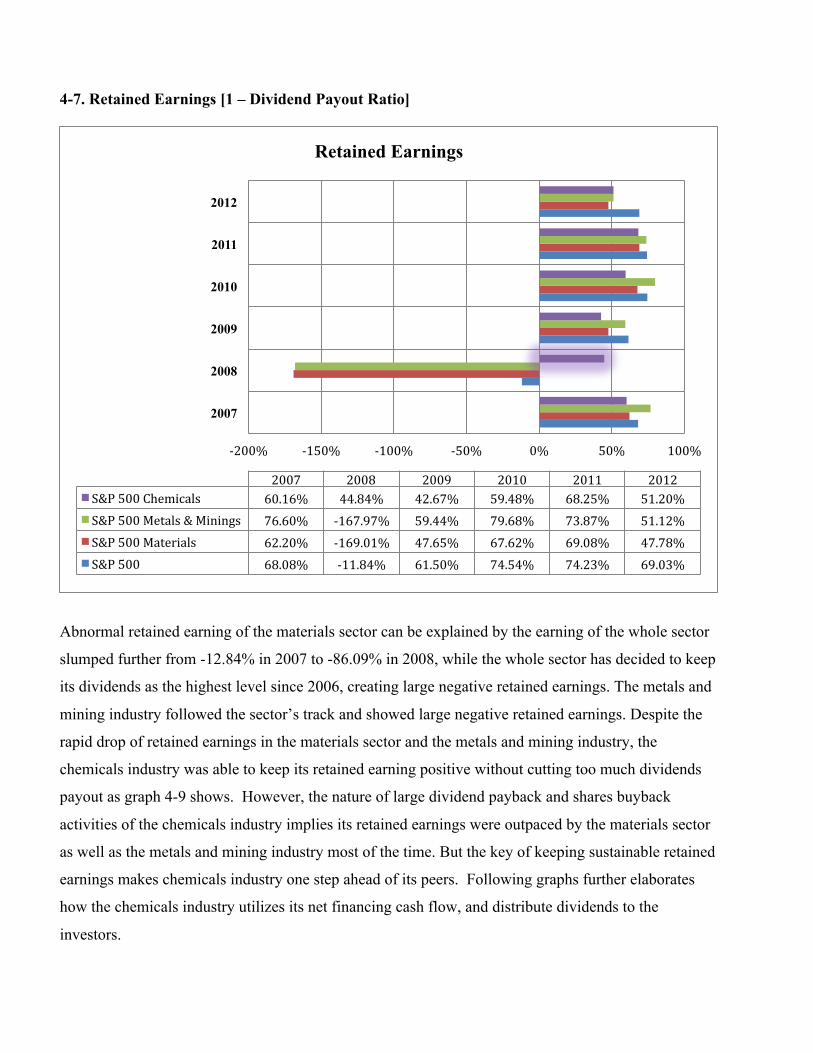
4-7. Retained Earnings [1 – Dividend Payout Ratio]
Abnormal retained earning of the materials sector can be explained by the earning of the whole sector
slumped further from -12.84% in 2007 to -86.09% in 2008, while the whole sector has decided to keep
its dividends as the highest level since 2006, creating large negative retained earnings. The metals and
mining industry followed the sector’s track and showed large negative retained earnings. Despite the
rapid drop of retained earnings in the materials sector and the metals and mining industry, the
chemicals industry was able to keep its retained earning positive without cutting too much dividends
payout as graph 4-9 shows. However, the nature of large dividend payback and shares buyback
activities of the chemicals industry implies its retained earnings were outpaced by the materials sector
as well as the metals and mining industry most of the time. But the key of keeping sustainable retained
earnings makes chemicals industry one step ahead of its peers. Following graphs further elaborates
how the chemicals industry utilizes its net financing cash flow, and distribute dividends to the
investors.
-‐200% -‐150% -‐100% -‐50% 0% 50% 100%
2007
2008
2009
2010
2011
2012
2007 2008 2009 2010 2011 2012 S&P 500 Chemicals 60.16% 44.84% 42.67% 59.48% 68.25% 51.20% S&P 500 Metals & Minings 76.60% -‐167.97% 59.44% 79.68% 73.87% 51.12% S&P 500 Materials 62.20% -‐169.01% 47.65% 67.62% 69.08% 47.78% S&P 500 68.08% -‐11.84% 61.50% 74.54% 74.23% 69.03%
Retained Earnings
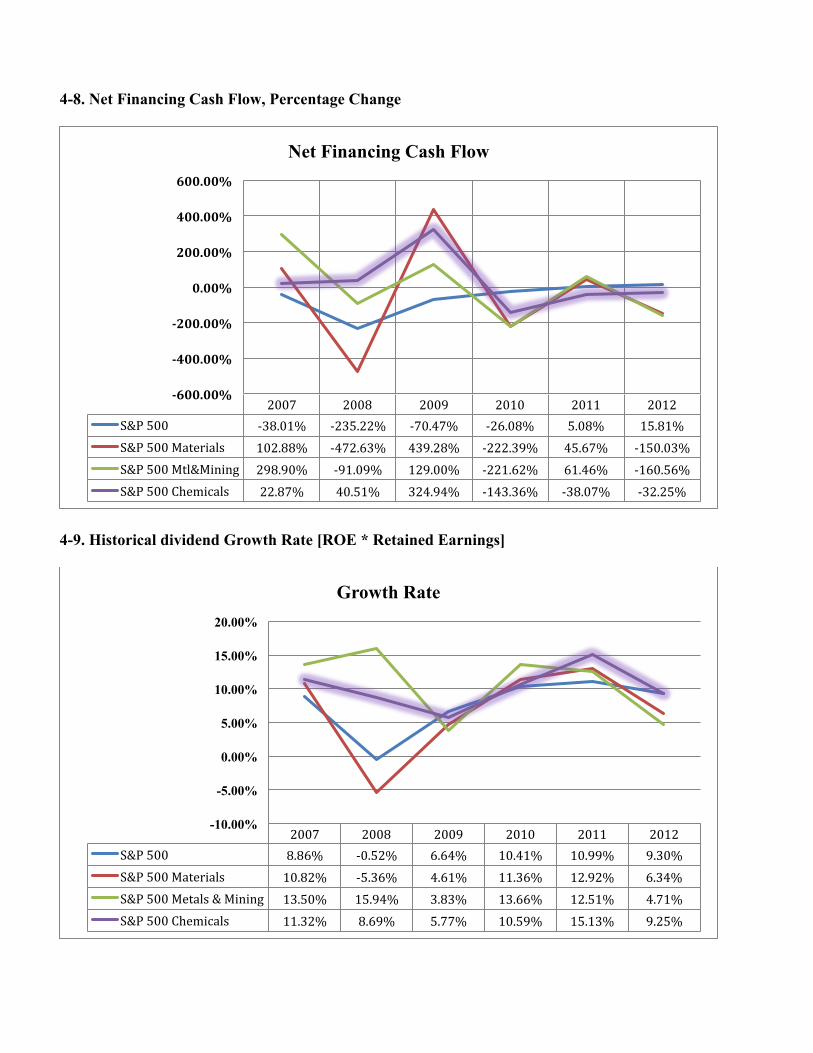
4-8. Net Financing Cash Flow, Percentage Change
4-9. Historical dividend Growth Rate [ROE * Retained Earnings]
2007 2008 2009 2010 2011 2012 S&P 500 -‐38.01% -‐235.22% -‐70.47% -‐26.08% 5.08% 15.81% S&P 500 Materials 102.88% -‐472.63% 439.28% -‐222.39% 45.67% -‐150.03% S&P 500 Mtl&Mining 298.90% -‐91.09% 129.00% -‐221.62% 61.46% -‐160.56% S&P 500 Chemicals 22.87% 40.51% 324.94% -‐143.36% -‐38.07% -‐32.25%
-‐600.00%
-‐400.00%
-‐200.00%
0.00%
200.00%
400.00%
600.00%
Net Financing Cash Flow
2007 2008 2009 2010 2011 2012 S&P 500 8.86% -‐0.52% 6.64% 10.41% 10.99% 9.30% S&P 500 Materials 10.82% -‐5.36% 4.61% 11.36% 12.92% 6.34% S&P 500 Metals & Mining 13.50% 15.94% 3.83% 13.66% 12.51% 4.71% S&P 500 Chemicals 11.32% 8.69% 5.77% 10.59% 15.13% 9.25%
-10.00%
-5.00%
0.00%
5.00%
10.00%
15.00%
20.00%
Growth Rate
As graphs 4-8 and 4-9 have shown, the chemicals industry could keep its net financing cash flow grow
at a faster and more stable rate than the market at the most of the time, and was able to keep its growth
rate close to the market when the materials sector as a whole was taken a large decline. Dividend
growth rate further demonstrates that the chemicals industry could adjust its dividends payout
accordingly without having large fluctuations in its net financing cash flows at the most of the time.
The materials sector and the metals and mining industry on the other hand were extremely volatile. It is
well known that industries able to keep sustainable dividend growth rates without hurting its net
financing cash flow always outpace those who have big up and downs over time.
However, special case can be found between 2009 and 2010, as the whole materials sector just
recovered from the financial crisis, dividend payout and share payback activities were almost doubled
in order to attract more capitals to flow into the sector. The chemicals industry responded by launching
its largest dividend payout and share buyback program in the past 6 years. Consequently, corresponding
large capitals inflow has enabled the chemicals industry to gradually keep its net financing cash flows
in order while maintain strong dividend payout. On the contrary, the materials sector and the metals and
mining industry’s net financing cash flows fell off the cliff after a temporary celebration in 2011,
therefore dragging down their growth. In next section, I will introduce the decomposition of the return
on equity of the materials sector, metals and mining industry, as well as chemicals industry comparing
to the market.
ROE as shown in the last section, is the most important element in comparing the profitability across
sectors and industries, which can be calculated by using Leverage ratio times Asset turnover
ratio times ROS times Interest burden times Tax burden. The ROE of the market was
averaged 11.7% over the past 6 years, relatively, the chemicals industry delivered an average of 18.3%
ROE over the same period, beating the market by 56%. And each of the ROE compositions of the
chemicals industry is significantly superior over its peers’. Given ROS (Operating Margin) in the
margin analysis section, following two sections further breakdown the other four variables into
turnover analysis and leverage analysis to elaborate how the strong ROE of the chemicals industry is
formed.

ROE Decomposition - Turnover Analysis
Materials Industry as a whole is very capital intensive, therefore one firm’s ability to allocate resources
accordingly is the key to maximize their profit and future growth. Comparing to S&P 500 index, the
materials sector has a much higher asset turnover due to widespread demands from all the other sectors,
and its limited ability of preserving its assets. While the Chemicals industry has relative higher asset
turnover compares to the Metals and mining industry and the sector as a whole. However, we can
observe that the asset turnover of the materials sector is in decline. Which is actually due to the
increasing profit margin and the oversupply issue.
4-10. Asset Turnover
2007 2008 2009 2010 2011 2012 S&P 500 30.73% 37.60% 33.93% 33.83% 36.02% 34.80% S&P 500 Materials 83.94% 96.15% 69.59% 75.99% 79.36% 74.96% S&P 500 Metals & Mining 74.83% 95.42% 58.83% 69.84% 74.49% 65.19% S&P 500 Chemicals 92.19% 104.77% 74.29% 78.26% 81.09% 77.85%
0.00%
20.00%
40.00%
60.00%
80.00%
100.00%
120.00%
Asset Turnover
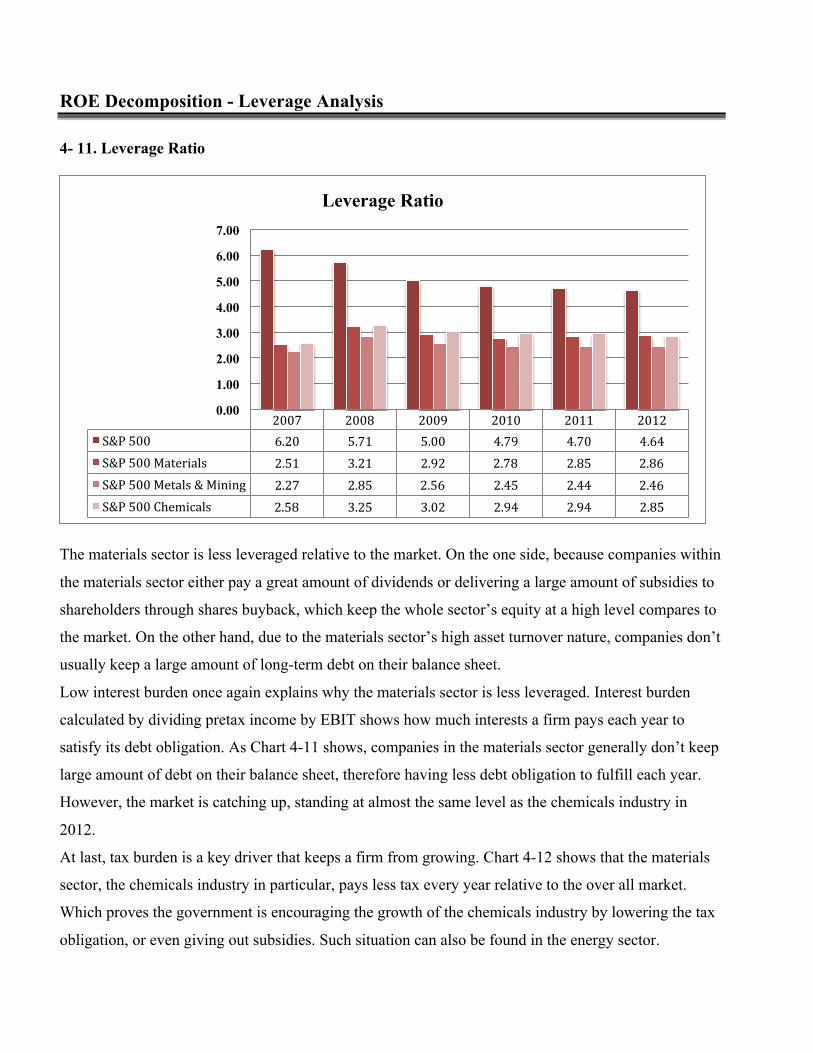
ROE Decomposition - Leverage Analysis 4- 11. Leverage Ratio
The materials sector is less leveraged relative to the market. On the one side, because companies within
the materials sector either pay a great amount of dividends or delivering a large amount of subsidies to
shareholders through shares buyback, which keep the whole sector’s equity at a high level compares to
the market. On the other hand, due to the materials sector’s high asset turnover nature, companies don’t
usually keep a large amount of long-term debt on their balance sheet.
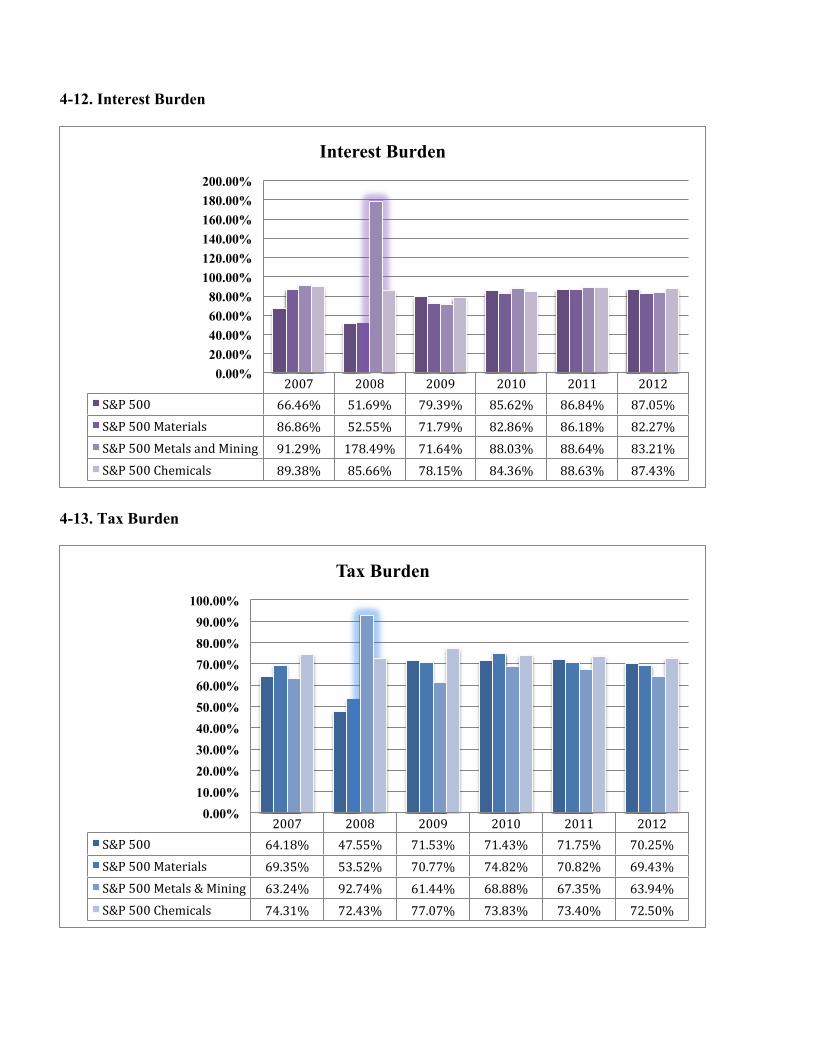
Low interest burden once again explains why the materials sector is less leveraged. Interest burden
calculated by dividing pretax income by EBIT shows how much interests a firm pays each year to
satisfy its debt obligation. As Chart 4-11 shows, companies in the materials sector generally don’t keep
large amount of debt on their balance sheet, therefore having less debt obligation to fulfill each year.
However, the market is catching up, standing at almost the same level as the chemicals industry in
2012.
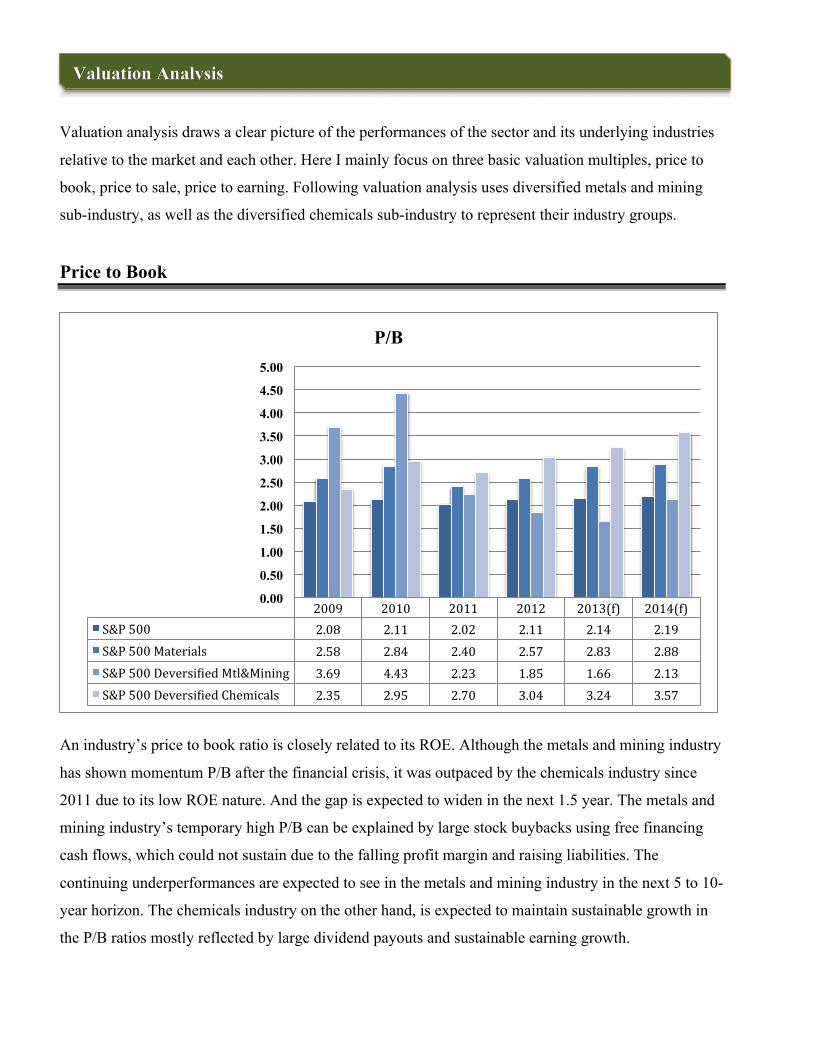
At last, tax burden is a key driver that keeps a firm from growing. Chart 4-12 shows that the materials
sector, the chemicals industry in particular, pays less tax every year relative to the over all market.
Which proves the government is encouraging the growth of the chemicals industry by lowering the tax
obligation, or even giving out subsidies. Such situation can also be found in the energy sector.
2007 2008 2009 2010 2011 2012 S&P 500 6.20 5.71 5.00 4.79 4.70 4.64 S&P 500 Materials 2.51 3.21 2.92 2.78 2.85 2.86 S&P 500 Metals & Mining 2.27 2.85 2.56 2.45 2.44 2.46 S&P 500 Chemicals 2.58 3.25 3.02 2.94 2.94 2.85
0.00
1.00
2.00
3.00
4.00
5.00
6.00
7.00
Leverage Ratio
4-12. Interest Burden
4-13. Tax Burden
2007 2008 2009 2010 2011 2012 S&P 500 66.46% 51.69% 79.39% 85.62% 86.84% 87.05% S&P 500 Materials 86.86% 52.55% 71.79% 82.86% 86.18% 82.27% S&P 500 Metals and Mining 91.29% 178.49% 71.64% 88.03% 88.64% 83.21% S&P 500 Chemicals 89.38% 85.66% 78.15% 84.36% 88.63% 87.43%
0.00% 20.00% 40.00% 60.00% 80.00%
100.00% 120.00% 140.00% 160.00% 180.00% 200.00%
Interest Burden
2007 2008 2009 2010 2011 2012 S&P 500 64.18% 47.55% 71.53% 71.43% 71.75% 70.25% S&P 500 Materials 69.35% 53.52% 70.77% 74.82% 70.82% 69.43% S&P 500 Metals & Mining 63.24% 92.74% 61.44% 68.88% 67.35% 63.94% S&P 500 Chemicals 74.31% 72.43% 77.07% 73.83% 73.40% 72.50%
0.00% 10.00% 20.00% 30.00% 40.00% 50.00% 60.00% 70.00% 80.00% 90.00%
100.00%
Tax Burden
Valuation Analysis
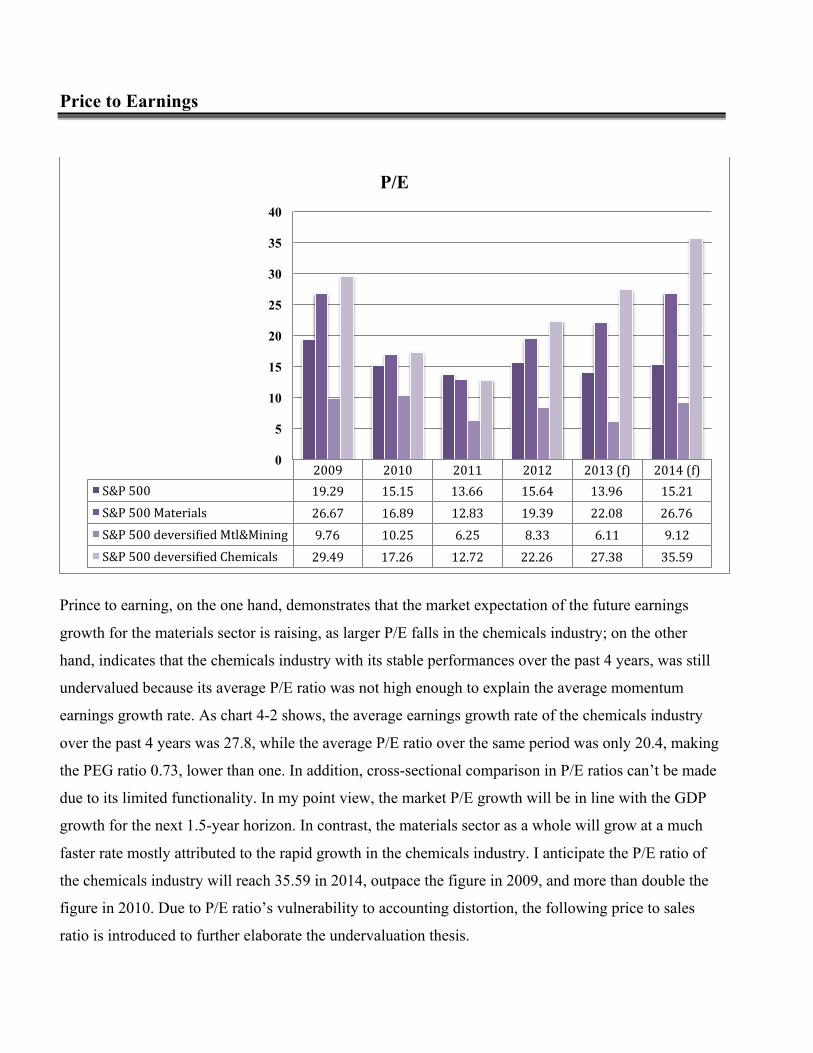
Valuation analysis draws a clear picture of the performances of the sector and its underlying industries
relative to the market and each other. Here I mainly focus on three basic valuation multiples, price to
book, price to sale, price to earning. Following valuation analysis uses diversified metals and mining
sub-industry, as well as the diversified chemicals sub-industry to represent their industry groups.
Price to Book
An industry’s price to book ratio is closely related to its ROE. Although the metals and mining industry
has shown momentum P/B after the financial crisis, it was outpaced by the chemicals industry since
2011 due to its low ROE nature. And the gap is expected to widen in the next 1.5 year. The metals and
mining industry’s temporary high P/B can be explained by large stock buybacks using free financing
cash flows, which could not sustain due to the falling profit margin and raising liabilities. The
continuing underperformances are expected to see in the metals and mining industry in the next 5 to 10-
year horizon. The chemicals industry on the other hand, is expected to maintain sustainable growth in
the P/B ratios mostly reflected by large dividend payouts and sustainable earning growth.
2009 2010 2011 2012 2013(f) 2014(f) S&P 500 2.08 2.11 2.02 2.11 2.14 2.19 S&P 500 Materials 2.58 2.84 2.40 2.57 2.83 2.88 S&P 500 Deversibied Mtl&Mining 3.69 4.43 2.23 1.85 1.66 2.13 S&P 500 Deversibied Chemicals 2.35 2.95 2.70 3.04 3.24 3.57
0.00
0.50
1.00
1.50
2.00
2.50
3.00
3.50
4.00
4.50
5.00
P/B
Price to Earnings
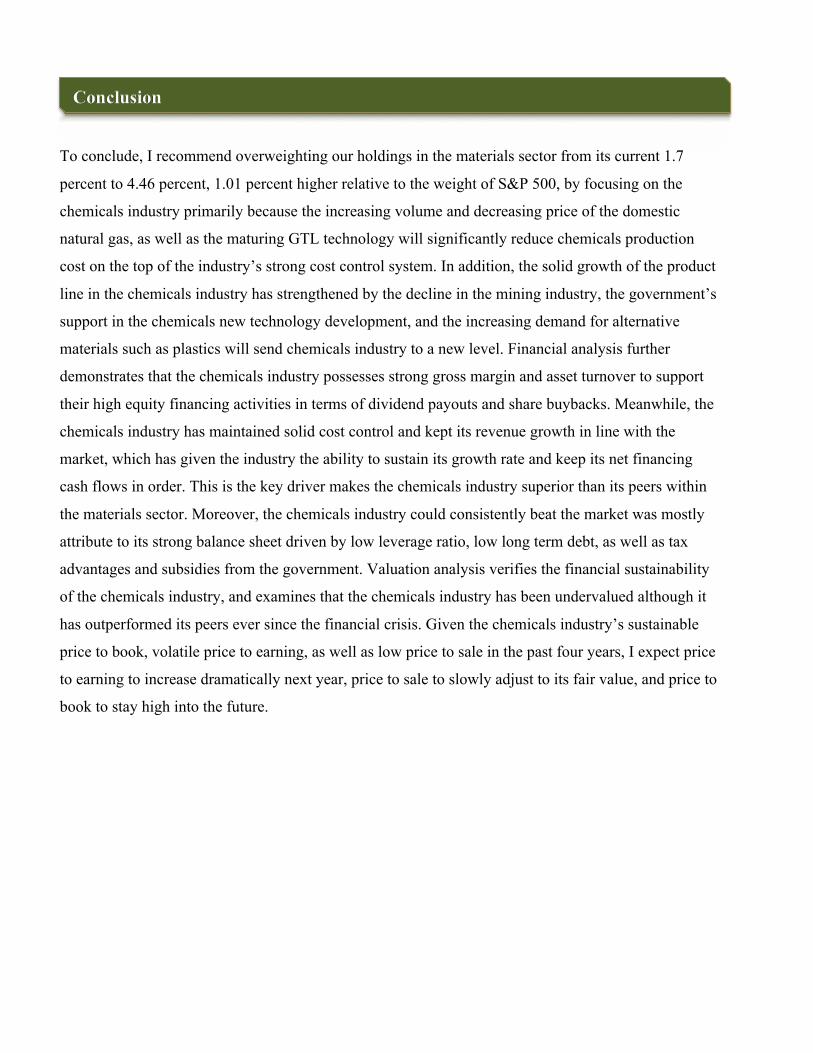
Prince to earning, on the one hand, demonstrates that the market expectation of the future earnings
growth for the materials sector is raising, as larger P/E falls in the chemicals industry; on the other
hand, indicates that the chemicals industry with its stable performances over the past 4 years, was still
undervalued because its average P/E ratio was not high enough to explain the average momentum
earnings growth rate. As chart 4-2 shows, the average earnings growth rate of the chemicals industry
over the past 4 years was 27.8, while the average P/E ratio over the same period was only 20.4, making
the PEG ratio 0.73, lower than one. In addition, cross-sectional comparison in P/E ratios can’t be made
due to its limited functionality. In my point view, the market P/E growth will be in line with the GDP
growth for the next 1.5-year horizon. In contrast, the materials sector as a whole will grow at a much
faster rate mostly attributed to the rapid growth in the chemicals industry. I anticipate the P/E ratio of
the chemicals industry will reach 35.59 in 2014, outpace the figure in 2009, and more than double the
figure in 2010. Due to P/E ratio’s vulnerability to accounting distortion, the following price to sales
ratio is introduced to further elaborate the undervaluation thesis.
2009 2010 2011 2012 2013 (f) 2014 (f) S&P 500 19.29 15.15 13.66 15.64 13.96 15.21 S&P 500 Materials 26.67 16.89 12.83 19.39 22.08 26.76 S&P 500 deversibied Mtl&Mining 9.76 10.25 6.25 8.33 6.11 9.12 S&P 500 deversibied Chemicals 29.49 17.26 12.72 22.26 27.38 35.59
0
5
10
15
20
25
30
35
40
P/E

Price to Sales
The low P/S of the chemicals industry delivers a potent message in telling the attractiveness and the
growth nature of the industry. The chemicals industry’s low leverage nature makes it more attainable
because P/S ratios don’t tell anything about a company’s debt obligation. In contrast, the metals and
mining’s high P/S ratios up until recent resulted from the falling prices have proven the fact that the
industry has been overvalued after the financial crisis. This is extremely true for highly cyclical
industries such as metals and mining industry, because there are years when only a handful of
companies in the industry produce any earnings. I believe P/S is a better measure than P/E to determine
how much investors were paying for a dollar of the industry’s sales rather than its earnings. For the P/S
ratios moving forward in the next 1.5 year, I believe the metals and mining industry will repeat its
cyclical nature with lower P/S in 2013 and higher P/S in 2014. The chemicals industry on the other
hand, I anticipate it to show continuing super-low P/S due to its sustainable cost control and enormous
future profit potential.
2009 2010 2011 2012 2013(f) 2014(f) S&P 500 1.23 1.31 1.19 1.31 1.19 1.12 S&P 500 Materials 1.27 1.34 1.06 1.20 1.09 1.24 S&P 500 Diversibied Mtl & Mining 2.24 2.95 1.69 1.82 1.71 2.01 S&P 500 diversibied Chemicals 0.82 1.02 0.82 0.99 0.94 0.84
0.00
0.50
1.00
1.50
2.00
2.50
3.00
3.50
P/S
Conclusion
To conclude, I recommend overweighting our holdings in the materials sector from its current 1.7
percent to 4.46 percent, 1.01 percent higher relative to the weight of S&P 500, by focusing on the
chemicals industry primarily because the increasing volume and decreasing price of the domestic
natural gas, as well as the maturing GTL technology will significantly reduce chemicals production
cost on the top of the industry’s strong cost control system. In addition, the solid growth of the product
line in the chemicals industry has strengthened by the decline in the mining industry, the government’s
support in the chemicals new technology development, and the increasing demand for alternative
materials such as plastics will send chemicals industry to a new level. Financial analysis further
demonstrates that the chemicals industry possesses strong gross margin and asset turnover to support
their high equity financing activities in terms of dividend payouts and share buybacks. Meanwhile, the
chemicals industry has maintained solid cost control and kept its revenue growth in line with the
market, which has given the industry the ability to sustain its growth rate and keep its net financing
cash flows in order. This is the key driver makes the chemicals industry superior than its peers within
the materials sector. Moreover, the chemicals industry could consistently beat the market was mostly
attribute to its strong balance sheet driven by low leverage ratio, low long term debt, as well as tax
advantages and subsidies from the government. Valuation analysis verifies the financial sustainability
of the chemicals industry, and examines that the chemicals industry has been undervalued although it
has outperformed its peers ever since the financial crisis. Given the chemicals industry’s sustainable
price to book, volatile price to earning, as well as low price to sale in the past four years, I expect price
to earning to increase dramatically next year, price to sale to slowly adjust to its fair value, and price to
book to stay high into the future.

References
John J. Conti, 2013, Annual Energy Outlook 2013 with projections to 2040, U.S. Energy Information
Administration
Mike Elliott, 2013, Business risks facing mining and metals, Ernst & Young
Mehdi Miremadi, 2013, Chemical innovation: An investment for the ages, Mckinsey on chemicals
Anthony Scamuffa, 2012, Shale gas reshaping the US chemicals industry, PWC
Jason Burkitt, 2013, What do investment professionals need from mining company reporting, PWC
Amy Hogan, 2013, Global mining deals 2012 review and 2013 outlook, PWC
Edwin Basson, 2013, World Steel in figures 2013, World Steel Association
Tobias Welo, 2012, 2013 Outlook: Materials, Fidelity
ICMM, 2012, Trends in the mining and metals industry, International Council on Mining & Metals
Louise Street, 2013, Gold Demand Trends, World Gold Council
Economics & Statistics Department, 2013, Shale Gas, Competitiveness, and New US Chemical
Industry Investment: An Analysis Based On Announced Projects, American Chemistry Council
Hongbin Qu, 2013, HSBC China Manufacturing PMI, HSBC
Adam Sieminski, 2013, International Energy Outlook 2013, U.S. Energy Information Administration
Dr. Edward Yardeni, 2013, Performance 2013 S&P 500 Sector & Industries, Yardeni Research
Elisabeth Rosenthal, 2013, U.S. to Be World’s Top Oil Producer in 5 Years, Report Says, The New
York Times
Zacks.com, 2013, Metals & Mining Stock Outlook – Industry Outlook, Nasdaq.com
Housley Carr, 2013, Industrials Say, “I’m a Believer,” But Will They Still Love the U.S. Tomorrow,
RBN Energy LLC
Russell Gold, 2013, U.S. Is Overtaking Russia as Largest Oil-and-Gas Producer, Wall Street Journal
Yajun Zhang, 2013, China’s Steel Industry Gains Steam, Wall Street Journal
Bob Tita, 2013, Natural Gas Powered Ships Arrive, Wall Street Journal
Chuin-Wei Yap, 2013, China’s Iron Ore Imports Surge to Record High, Wall Street Journal
WiseGeek, 2013, What is BTU? Wisegeek.org
U.S. Department of Commerce, 2013, New Housing Units Started in the United States, Census.gov
Kavaljit Singh, 2013, Collapsing Asian Currencies? Why is the Indian Rupee Depreciating, Global
Research
Morningstar, 2013, Stock Returns, Morningstar.com