material homogeneity during a filling operation ... · material homogeneity during a filling...
TRANSCRIPT
Material Homogeneity During a Filling Operation: Retrospective Analysis of
Historical Data, Process Validation and Routine Monitoring
Kedar H. Dave, Brian Johnson,
Joseph Shiminsky and Jeffrey Savard
Bristol - Myers Squibb
IFPAC Annual Meeting
January 27, 2015

Overview
• Introduction
• Objective
• Final Bulk Fill operation
• Retrospective analysis of historical data
• Variance component analysis
• Acceptance criteria for process validation
• Process validation
• Routine monitoring
2
Note: Synthetic (simulation) data are presented here in order to
preserve their proprietary nature and are for illustrative purposes only

Introduction
• Drug Substance (DS) homogeneity (uniformity) is an important consideration for the final step in pharmaceutical manufacturing1
• The final bulk DS fill operation at a biologics manufacturing plant consists of a filling system involving several manifolds that each fills multiple bottles of protein solution
• The objective is to develop a statistical framework for assessing and demonstrating material homogeneity across bottles and manifolds for every batch during filling:
• based on the retrospective analysis of historical data
• for process validation
• for routine monitoring
3
1S. Abraham, E. Rydholm and P. Wagner, “Practical
Considerations for Demonstrating Drug Substance
Uniformity”, BioPharm International, Apr 01 (2011)

Final Bulk DS Fill Operation
4
Every manifold (M)
fills six bottles (T)
Post UF / DF
Bulk DS (B)
M 1
M 2
M 3 M 4
M 5
M 6
T1 T4
T2 T5
T3 T6
Depending upon process
yield, every batch (B) fill uses
four to eight manifolds (M)

A280 (Protein Concentration) Data • DS homogeneity is assessed via A280 (protein concentration)
• Data:
• Historical A280 assay (protein concentration) data from 12 manufacturing batches were considered
• The reported A280 assay result is generated by averaging three replicates
• All data are within specs of 90 to 110
• Sampling:
• Only the bottles from the last manifold are sampled
• For the other manifolds, samples are derived directly from the manifolds and may be referred to as “from bottle zero”
• Existing sampling arrangement cannot be modified without risking DS integrity
5

Random Effects Models
• Batch (B), manifold (M) and bottle (T) are considered to be random effects in ANOVA models. Bottle (T) and manifold (M) effects are nested within batch effect (B)
• Three modeling approaches were considered:
1. Bottle (T) and Manifold (M) samples considered equivalent
2. Bottle (T) and Manifold (M) samples modeled separately
3. Bottle (T) effect nested within Manifold (M) effect
• Variance components are calculated using the Restricted Maximum Likelihood (REML) approach2 in JMP
6
2SAS Institute Inc. “JMP® 10 Modeling and Multivariate
Methods”, Cary, NC (2012)
n(lm)m(l)llmnk(ij)j(i)iijk TBA280 MBA280
k(ij)j(i)j(i)iijk TMBA280
l(ijk)j)k(i,j(i)iijkl TMBA280

Historical data (1): All samples equivalent
7

Historical data (2a): Bottle data
8
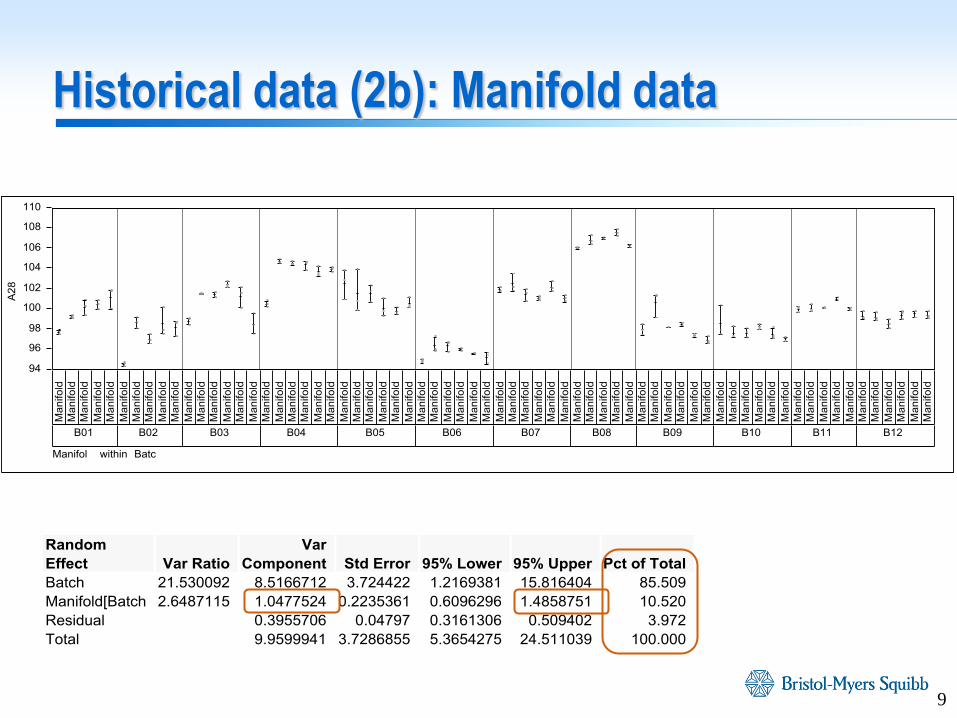
Historical data (2b): Manifold data
9

Historical data (3): Un-balanced hierarchical
10

Result of Retrospective Analysis
• The Residual variation from the Random effects ANOVA models is attributed entirely to analytical variability
• Batch to batch variability is always greater than 85% of the total variability
• Overall, the inter-manifold and inter-bottle variability is of the same order of magnitude as the assay variability
• Hence, the DS can be considered to be practically homogeneous across manifolds and across bottles3
• Process Validation (PV) study will contain three batches – smaller sample size will increase the uncertainty in the calculations
• Acceptance criteria for PV is based on the upper 95% confidence limit of the variance component for the worst case three batches and is a %RSD of 2.1%
11
3H. Schmidli and Y.L. Grize, “Quantification of Batch
Homogeneity”, Quality Engineering, Vol. 10, Iss. 2 (1997)

PV data (1): All samples equivalent
12

PV data (2a): Bottle data
13

PV data (2b): Manifold data
14

PV data (3): Un-balanced hierarchical
15

Assessment of Process Validation
• For the three PV batches, a mean response of 102.939 and a point estimate for the variance component of 1.277 results in 1.098 %RSD
• Hence, it is concluded that the PV study met the previously set acceptance criteria of 2.1 %RSD.
16

Routine monitoring
• Routine monitoring is usually conducted using Statistical Process Control (SPC) charts
• The final bulk DS fill operation is a Multiple Stream Process (MSP) and can be monitored using Group Control Charts (GCCs)4
• Only the largest and smallest observations are plotted on the chart at any time period. If these values are inside the control limits, then all other values will also lie inside the limits
• If a stream consistently gives the largest (or smallest) values several times in a row, that may constitute evidence that this stream is different from the others
17
4D.C. Montgomery, “Introduction to Statistical Quality Control”,
7th edition, John Wiley & Sons, New York, NY (2012)

GCC set up
• Control limits for moving range:
• Control limits for individual measurements
• If the process has s streams and r is the number of consecutive times that a particular stream is the largest (or smallest) value, then the one-sided in-control average run length for this event
18
155516
16
1
1ARL(1)
5
0
s
sr
RM 3.267 RMD UCL0 RMD LCL MR 431i ii xx
1.128
RM3 x
d
RM3 x UCL
1.128
RM3 x
d
RM3 x LCL
2
2

6
5
1
4
6
61
6
1
6
6
1 5
6
0
2
4
6
8
10
12
1 2 3 4 5 6 7 8 9 10 11 12 13 14 15
Ind
ivid
. Ob
s.
Batch
Group Control Chart for Moving Range
MRmax
MRUCL
MRLCL
Example GCC for Bottles
19
6
2 5
5
6
5
2
6
2 2
3 3
13
5
3 1
4
4
4
1
1
3
1 6
22
5
6 2
90
95
100
105
110
1 2 3 4 5 6 7 8 9 10 11 12 13 14 15
Ind
ivid
. Ob
s.
Batch
Group Control Chart for Individual Obs.
Xmax
Xmin
XbUCL
XbLCL

Summary
• Retrospective analysis of historical A280 (protein concentration) data
• shows that the manifold and bottle samples are practically homogeneous - no claim that manifold or bottle samples are exactly the same
• helps set the acceptance criteria for Process Validation
• The fill operation is a Multiple Stream Process (MSP) and is routinely monitored using Group Control Charts (GCCs)
20

Acknowledgments
Ruojia Li
Prof. Doug Montgomery
Maen Qadan
Marcus Boyer
21
Richard Schicho
Susan Abu-Absi
Luis Maranga