material for assessing monetary policy 2006-2008
TRANSCRIPT
Material for assessing monetary
policy2006-2008
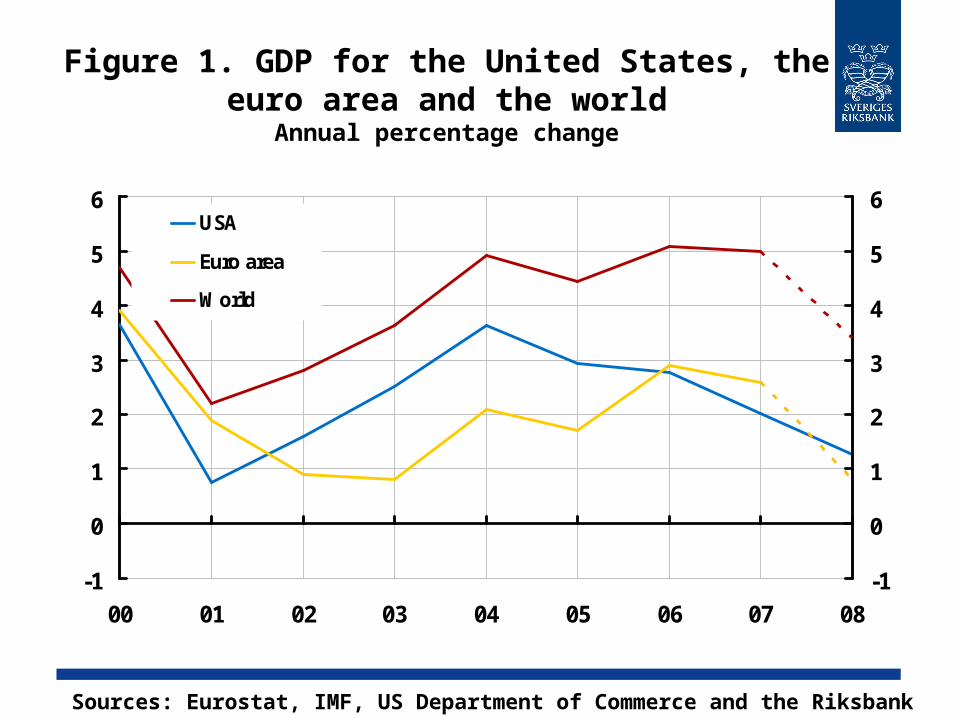
Figure 1. GDP for the United States, the euro area and the world
Annual percentage change
-1
0
1
2
3
4
5
6
00 01 02 03 04 05 06 07 08-1
0
1
2
3
4
5
6USA
Euro area
World
Sources: Eurostat, IMF, US Department of Commerce and the Riksbank
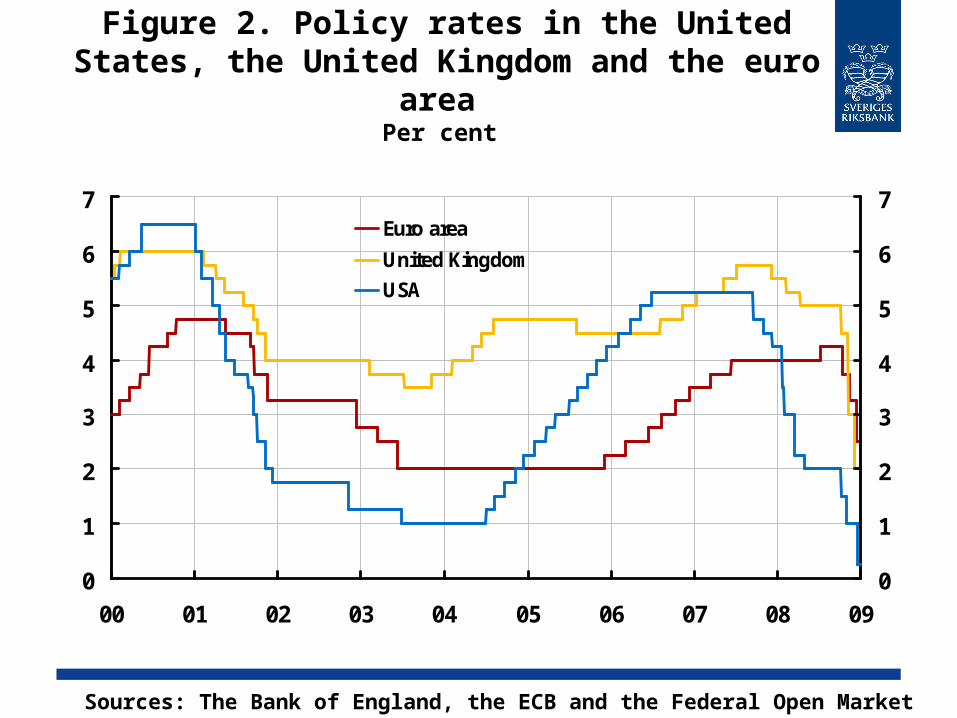
Figure 2. Policy rates in the United States, the United Kingdom and the euro area
Per cent
0
1
2
3
4
5
6
7
00 01 02 03 04 05 06 07 08 090
1
2
3
4
5
6
7Euro area
United Kingdom
USA
Sources: The Bank of England, the ECB and the Federal Open Market Committee
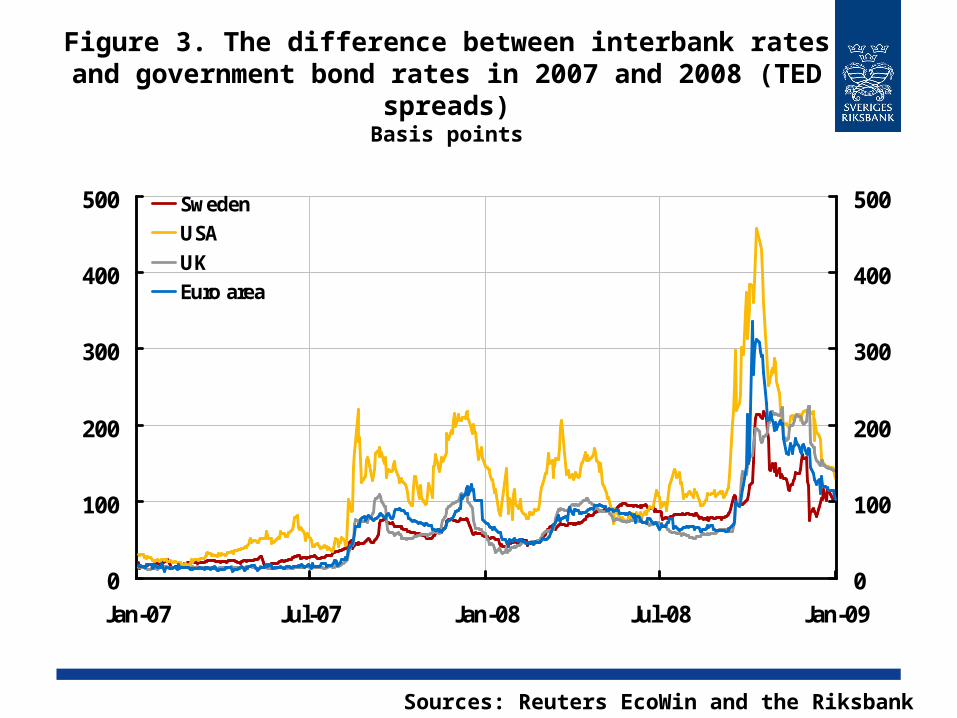
Figure 3. The difference between interbank rates and government bond rates in 2007 and 2008 (TED
spreads)Basis points
0
100
200
300
400
500
Jan-07 Jul-07 Jan-08 Jul-08 Jan-090
100
200
300
400
500SwedenUSAUKEuro area
Sources: Reuters EcoWin and the Riksbank
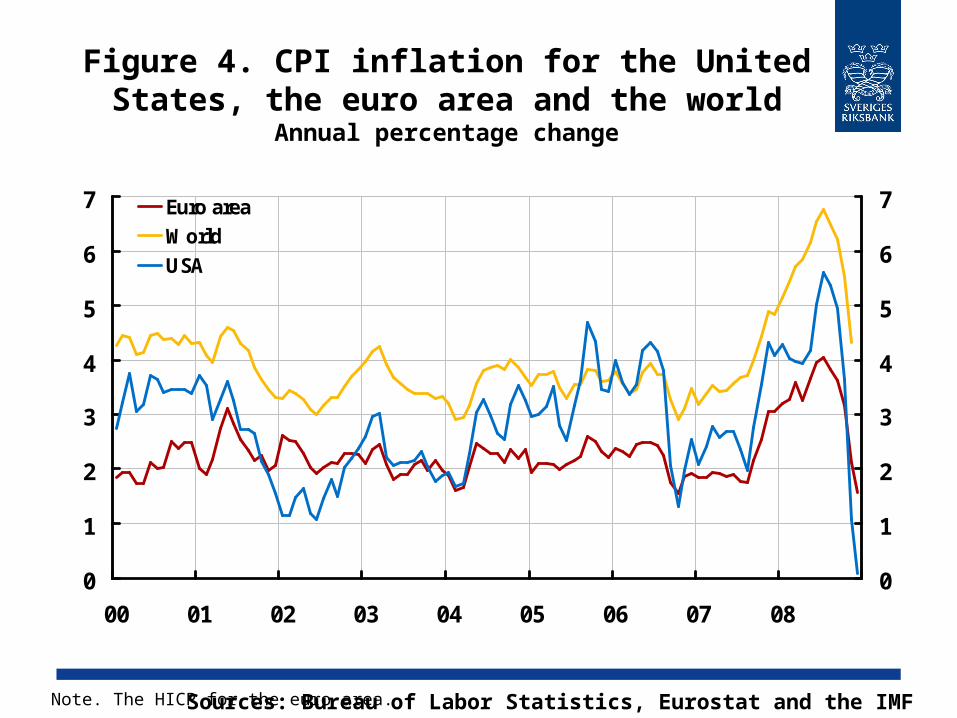
Figure 4. CPI inflation for the United States, the euro area and the world
Annual percentage change
0
1
2
3
4
5
6
7
00 01 02 03 04 05 06 07 080
1
2
3
4
5
6
7Euro areaWorldUSA
Sources: Bureau of Labor Statistics, Eurostat and the IMFNote. The HICP for the euro area.
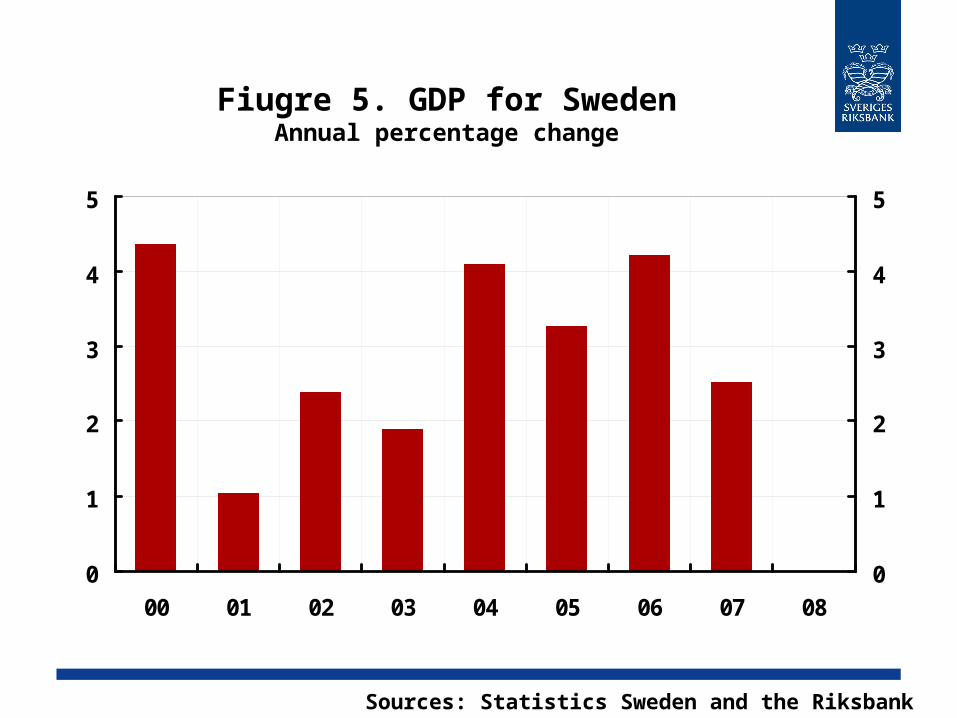
Fiugre 5. GDP for SwedenAnnual percentage change
0
1
2
3
4
5
00 01 02 03 04 05 06 07 080
1
2
3
4
5
Sources: Statistics Sweden and the Riksbank
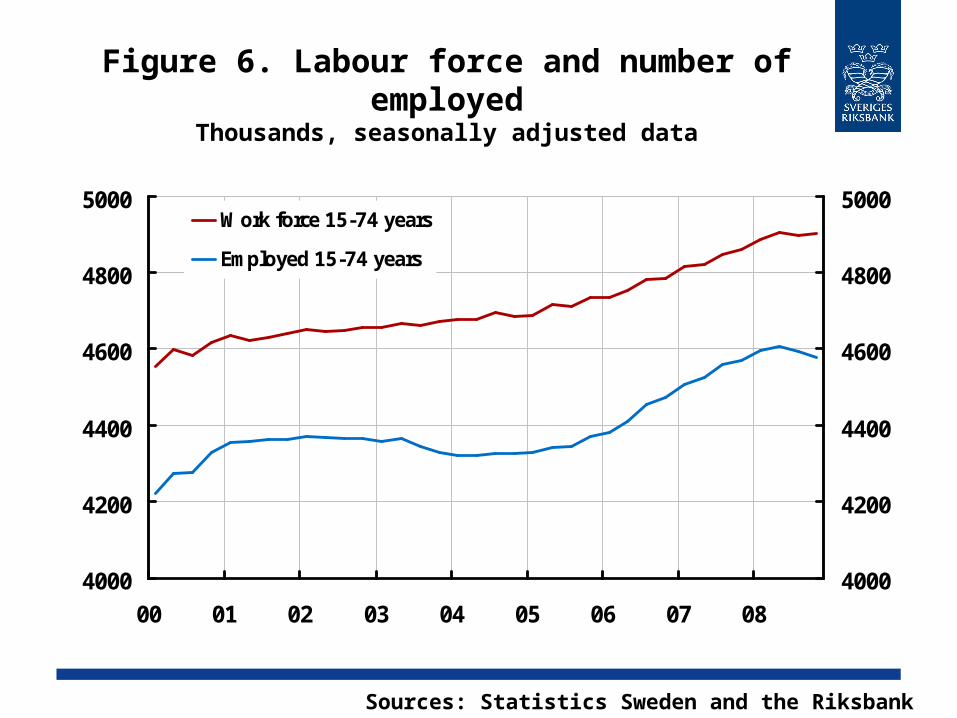
Figure 6. Labour force and number of employed
Thousands, seasonally adjusted data
4000
4200
4400
4600
4800
5000
00 01 02 03 04 05 06 07 084000
4200
4400
4600
4800
5000Work force 15-74 years
Employed 15-74 years
Sources: Statistics Sweden and the Riksbank
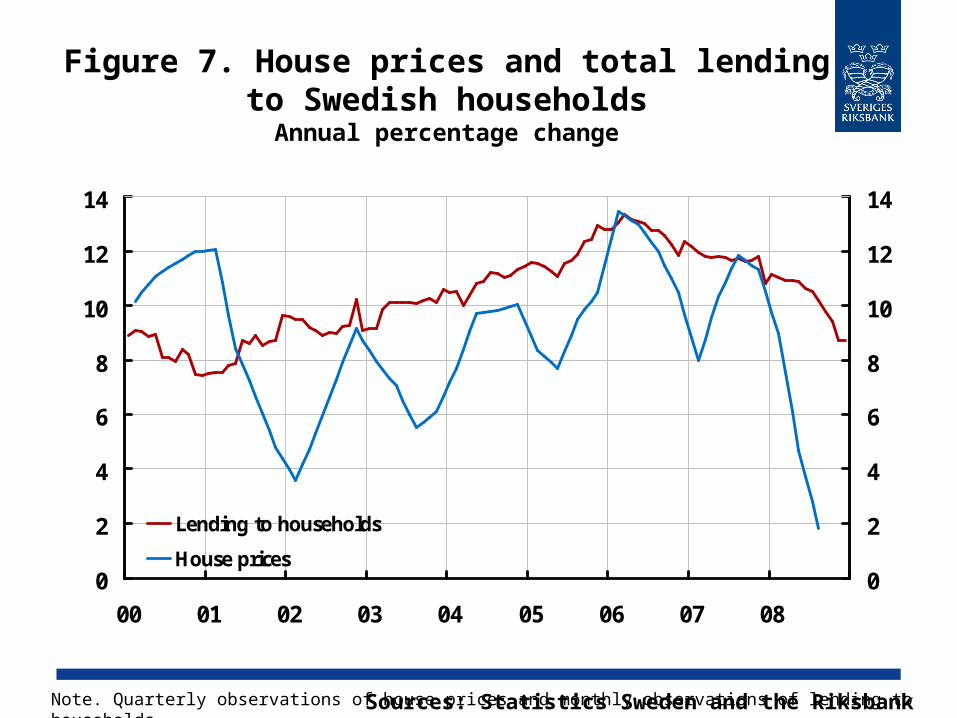
Figure 7. House prices and total lending to Swedish householdsAnnual percentage change
0
2
4
6
8
10
12
14
00 01 02 03 04 05 06 07 080
2
4
6
8
10
12
14
Lending to households
House prices
Sources: Statistics Sweden and the RiksbankNote. Quarterly observations of house prices and monthly observations of lending to households.
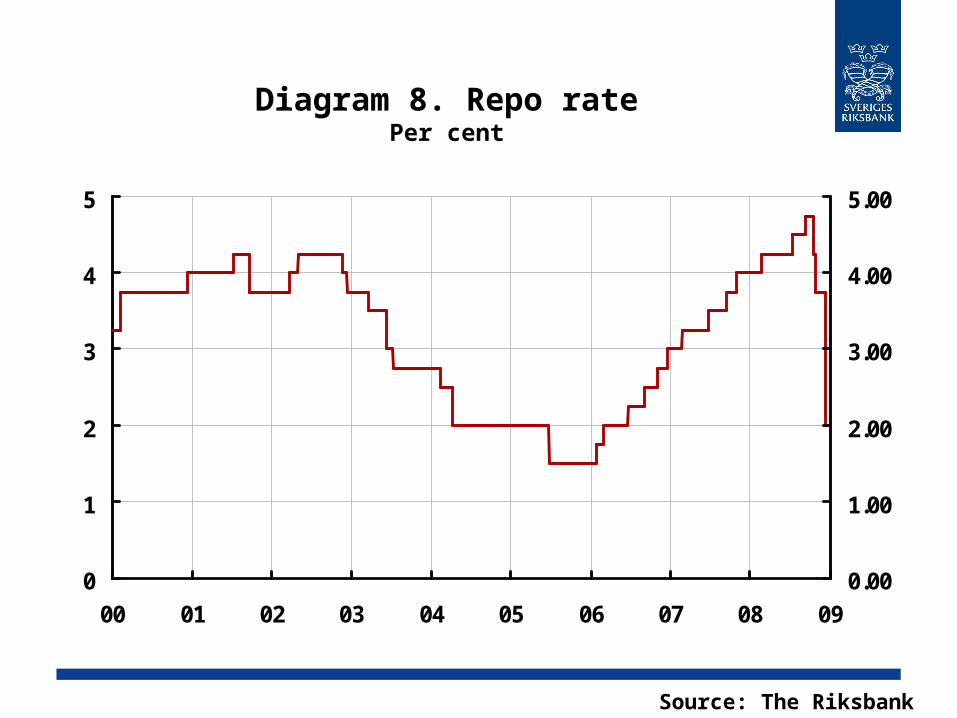
Diagram 8. Repo ratePer cent
0
1
2
3
4
5
00 01 02 03 04 05 06 07 08 090.00
1.00
2.00
3.00
4.00
5.00
Source: The Riksbank
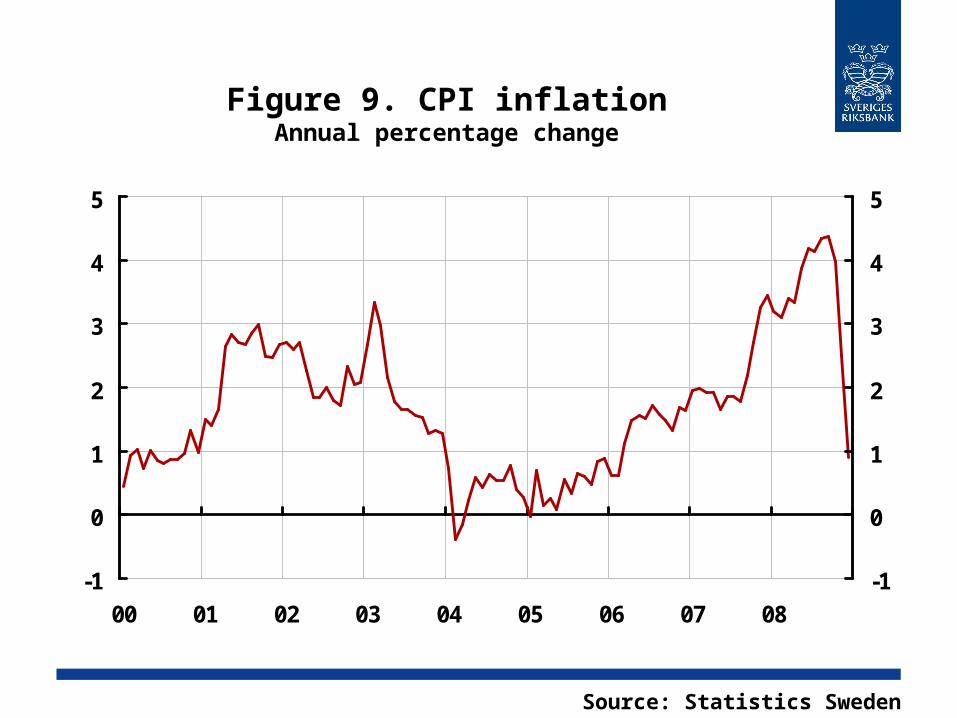
Figure 9. CPI inflationAnnual percentage change
-1
0
1
2
3
4
5
00 01 02 03 04 05 06 07 08-1
0
1
2
3
4
5
Source: Statistics Sweden
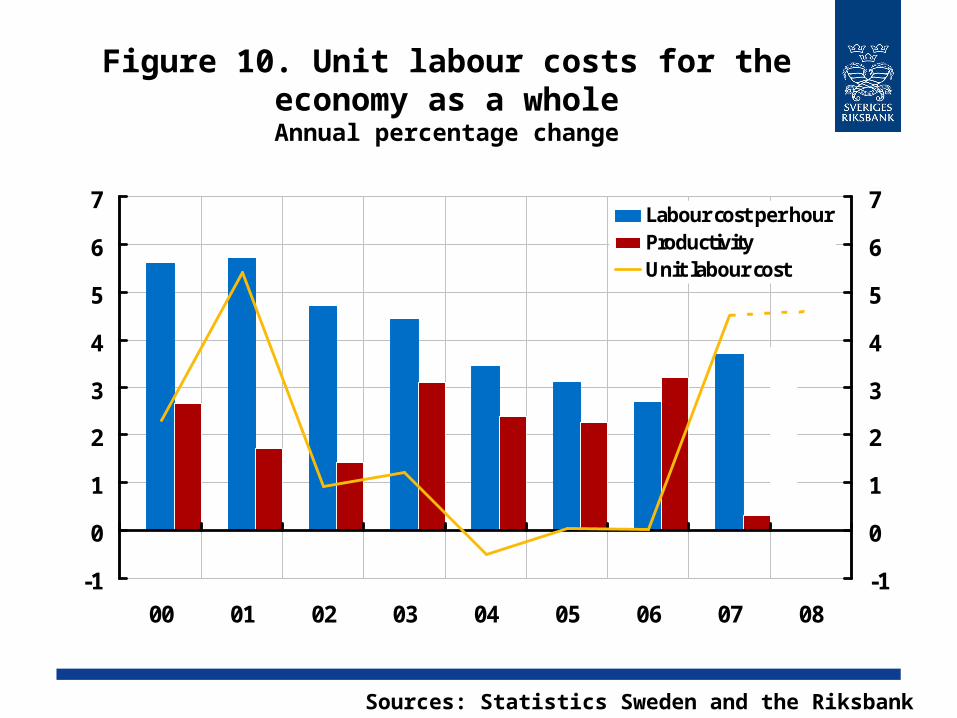
Figure 10. Unit labour costs for the economy as a wholeAnnual percentage change
-1
0
1
2
3
4
5
6
7
00 01 02 03 04 05 06 07 08-1
0
1
2
3
4
5
6
7Labour cost per hourProductivityUnit labour cost
Sources: Statistics Sweden and the Riksbank
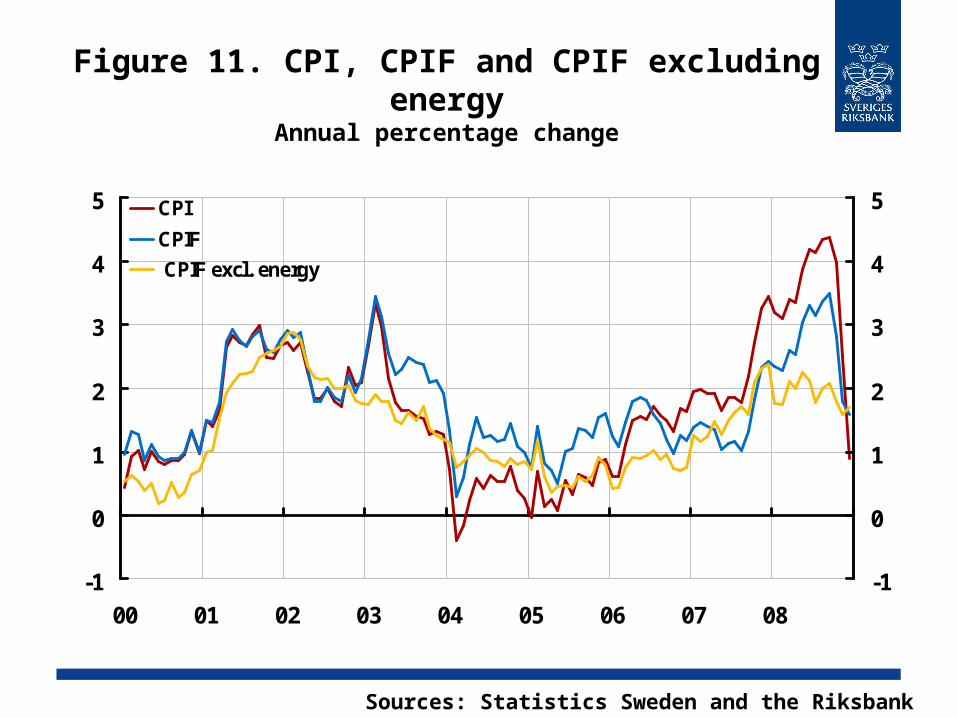
Figure 11. CPI, CPIF and CPIF excluding energy
Annual percentage change
-1
0
1
2
3
4
5
00 01 02 03 04 05 06 07 08-1
0
1
2
3
4
5CPI
CPIF
CPIF excl. energy
Sources: Statistics Sweden and the Riksbank
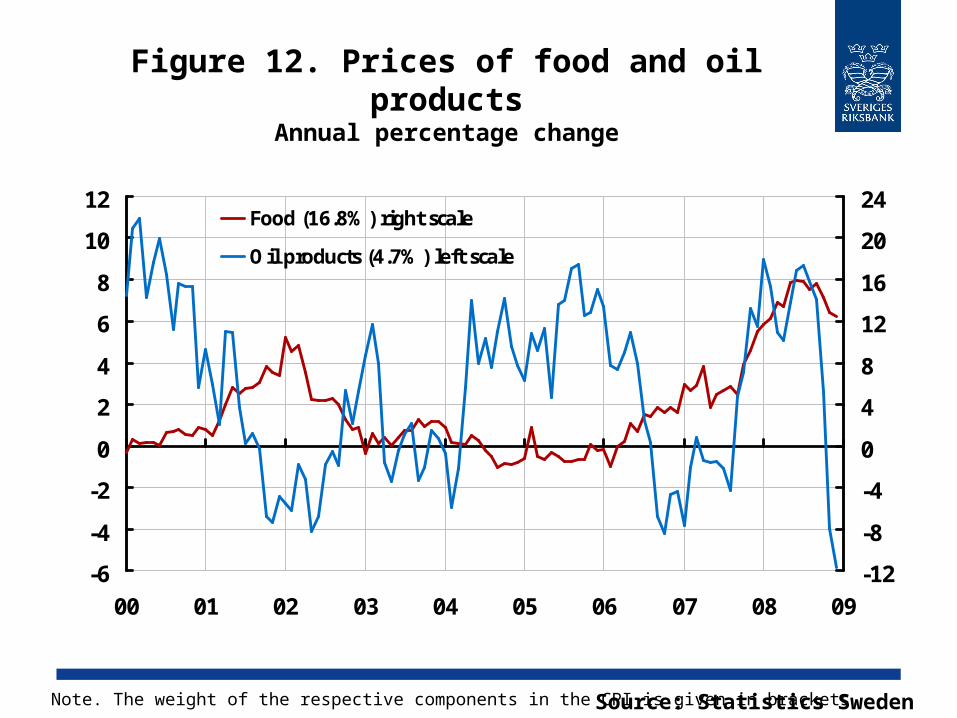
Figure 12. Prices of food and oil productsAnnual percentage change
-6
-4
-2
0
2
4
6
8
10
12
00 01 02 03 04 05 06 07 08 09-12
-8
-4
0
4
8
12
16
20
24Food (16.8%) right scale
Oil products (4.7%) left scale
Source: Statistics SwedenNote. The weight of the respective components in the CPI is given in brackets.
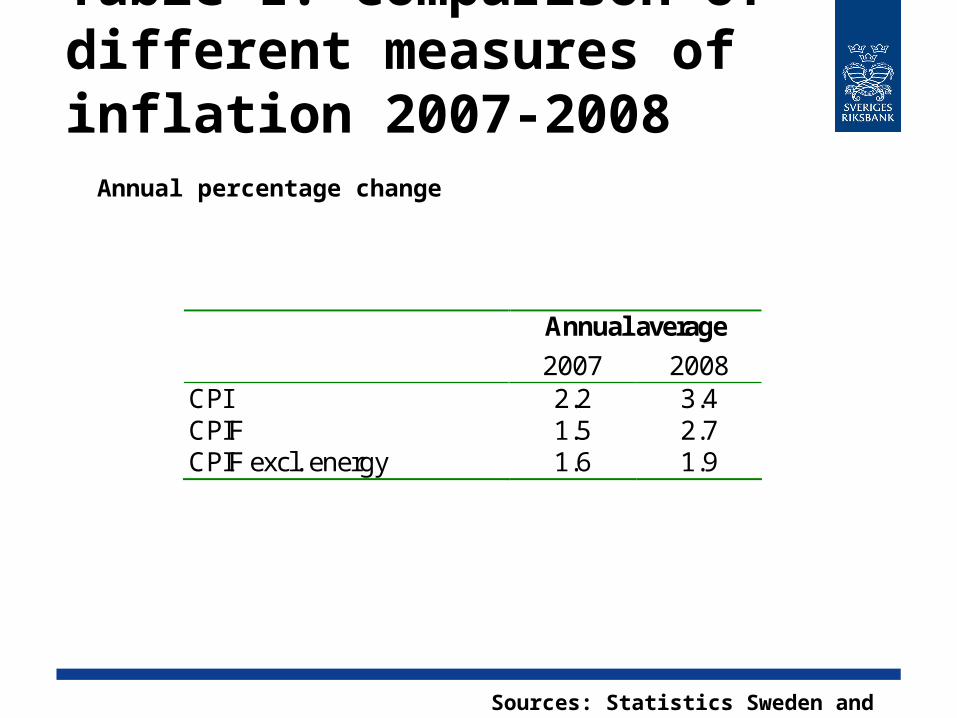
Table 1. Comparison of different measures of inflation 2007-2008 Annual percentage change
Sources: Statistics Sweden and the Riksbank
Annual average
2007 2008 CPI 2.2 3.4 CPIF 1.5 2.7 CPIF excl. energy 1.6 1.9
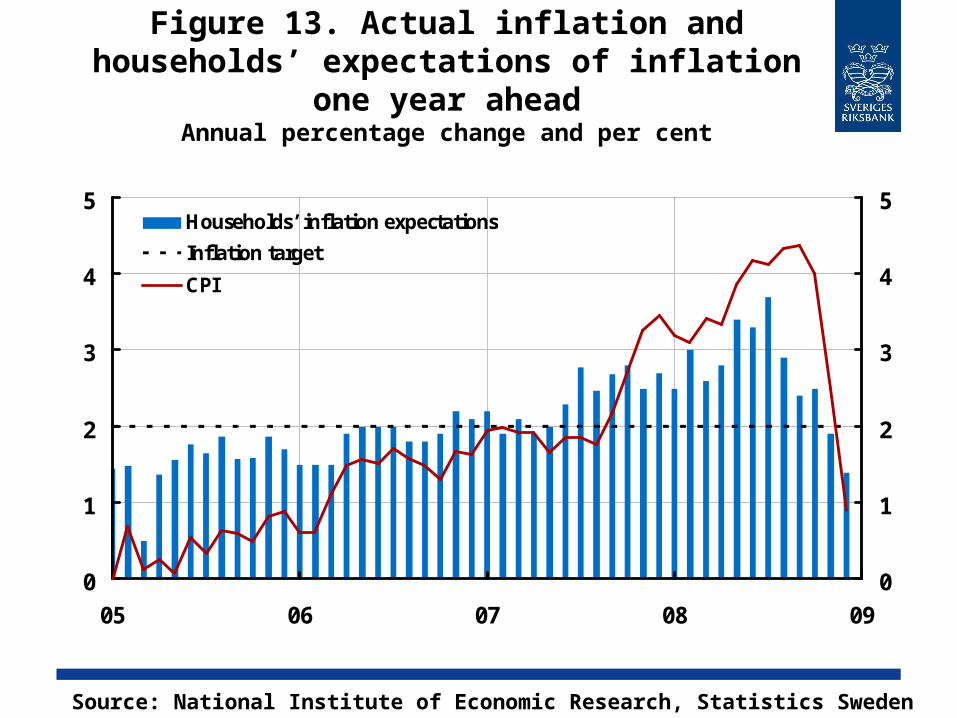
Figure 13. Actual inflation and households’ expectations of inflation one year ahead
Annual percentage change and per cent
0
1
2
3
4
5
05 06 07 08 090
1
2
3
4
5Households’ inflation expectations
Inflation target
CPI
Source: National Institute of Economic Research, Statistics Sweden and the Riksbank
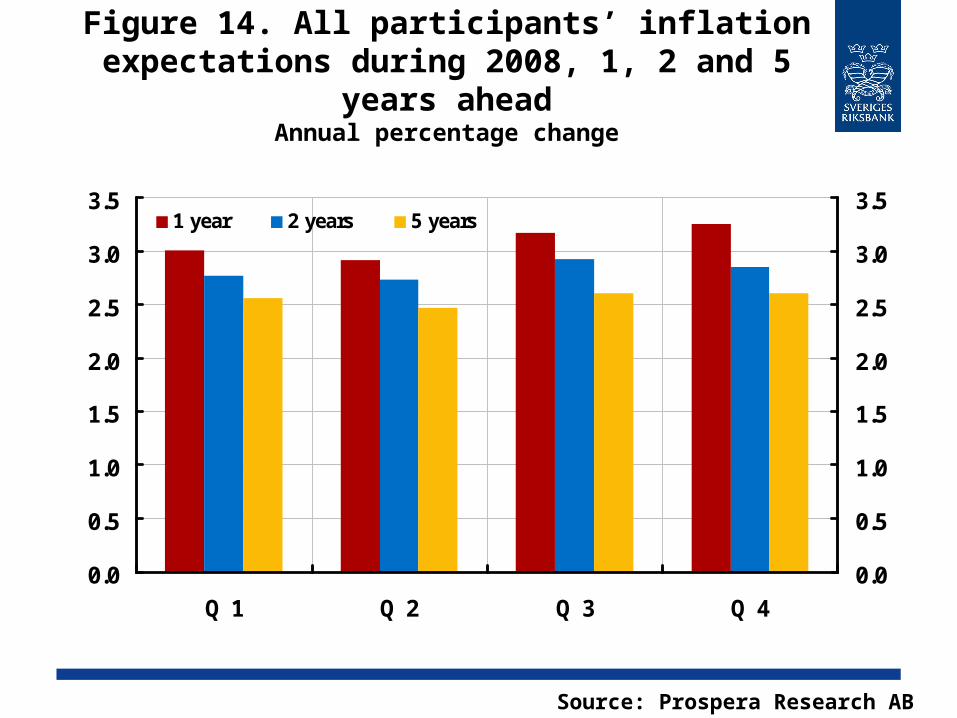
Figure 14. All participants’ inflation expectations during 2008, 1, 2 and 5 years
aheadAnnual percentage change
0.0
0.5
1.0
1.5
2.0
2.5
3.0
3.5
Q 1 Q 2 Q 3 Q 40.0
0.5
1.0
1.5
2.0
2.5
3.0
3.51 year 2 years 5 years
Source: Prospera Research AB
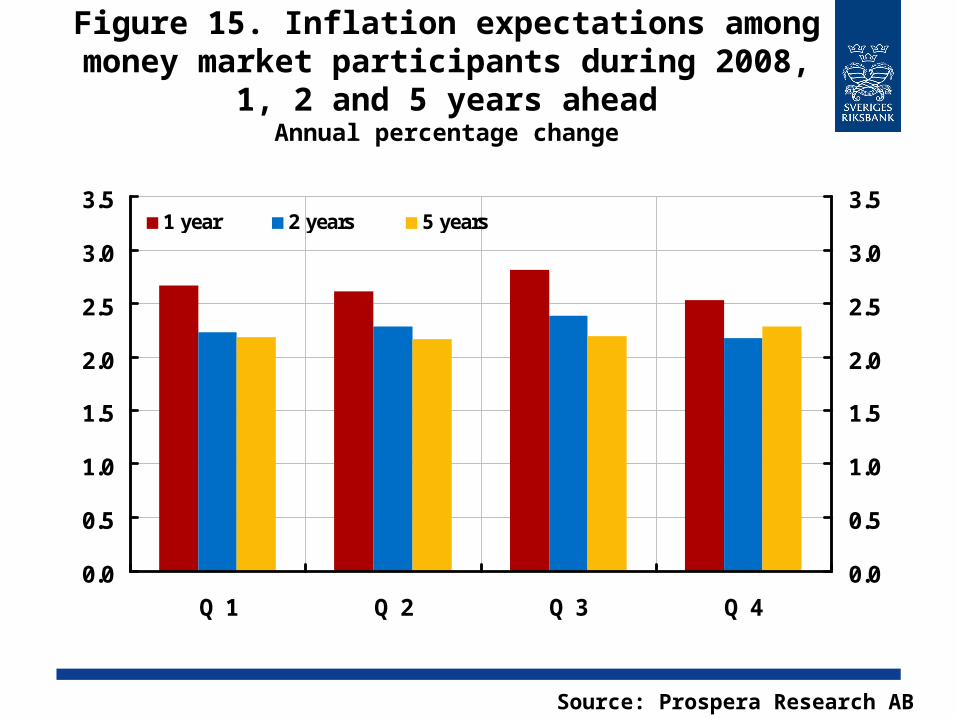
Figure 15. Inflation expectations among money market participants during 2008, 1,
2 and 5 years aheadAnnual percentage change
0.0
0.5
1.0
1.5
2.0
2.5
3.0
3.5
Q 1 Q 2 Q 3 Q 40.0
0.5
1.0
1.5
2.0
2.5
3.0
3.51 year 2 years 5 years
Source: Prospera Research AB
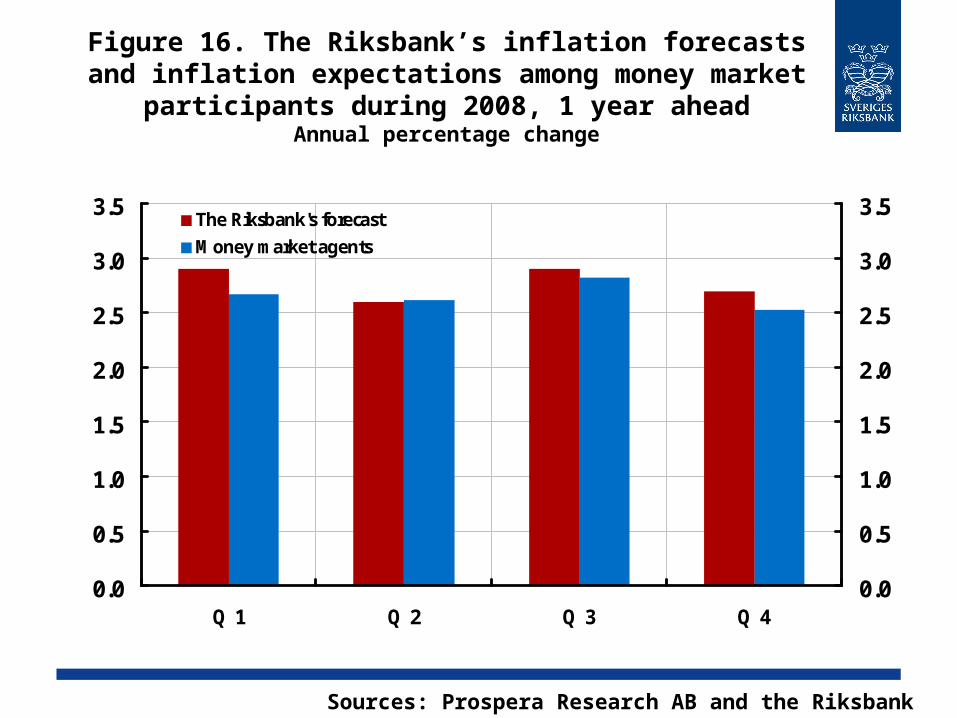
Figure 16. The Riksbank’s inflation forecasts and inflation expectations among money market
participants during 2008, 1 year aheadAnnual percentage change
0.0
0.5
1.0
1.5
2.0
2.5
3.0
3.5
Q 1 Q 2 Q 3 Q 40.0
0.5
1.0
1.5
2.0
2.5
3.0
3.5The Riksbank's forecast
Money market agents
Sources: Prospera Research AB and the Riksbank
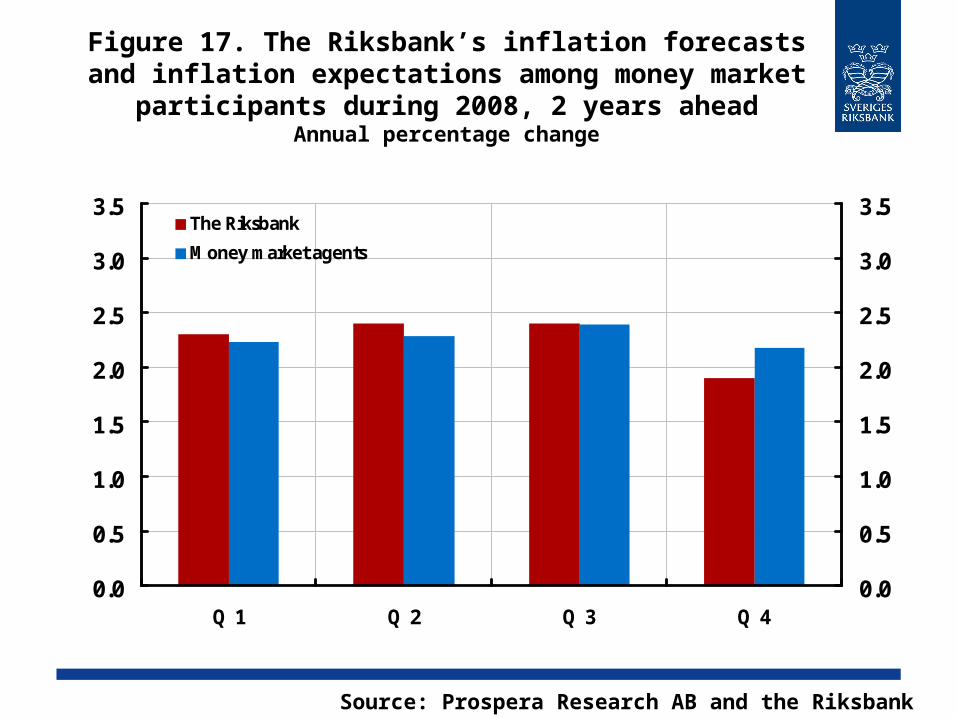
Figure 17. The Riksbank’s inflation forecasts and inflation expectations among money market
participants during 2008, 2 years aheadAnnual percentage change
0.0
0.5
1.0
1.5
2.0
2.5
3.0
3.5
Q 1 Q 2 Q 3 Q 40.0
0.5
1.0
1.5
2.0
2.5
3.0
3.5The Riksbank
Money market agents
Source: Prospera Research AB and the Riksbank
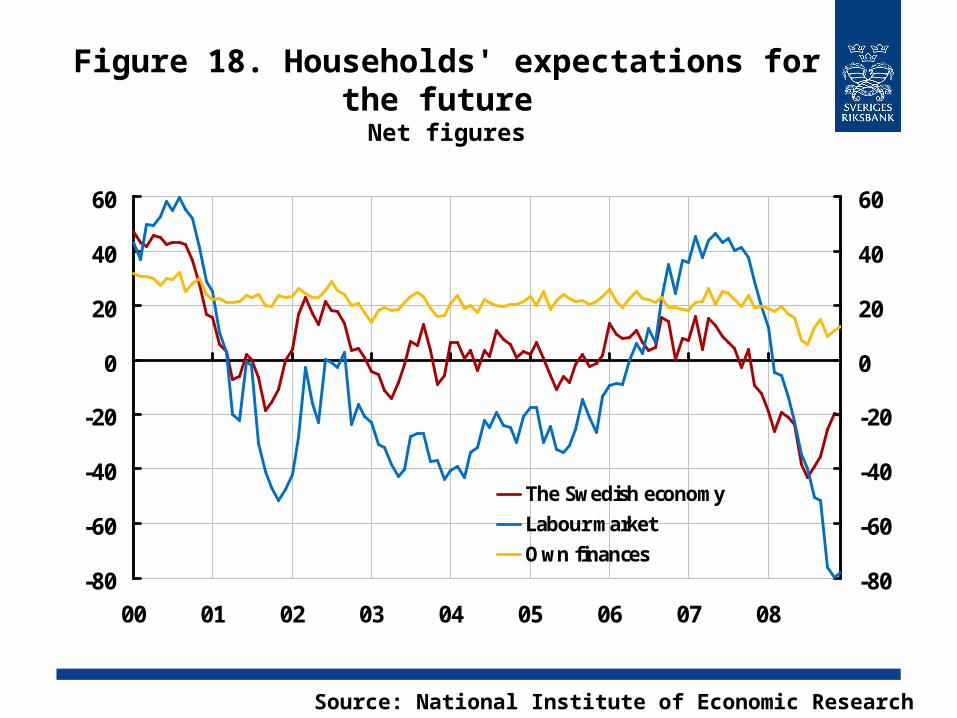
Figure 18. Households' expectations for the future
Net figures
-80
-60
-40
-20
0
20
40
60
00 01 02 03 04 05 06 07 08-80
-60
-40
-20
0
20
40
60
The Swedish economy
Labour market
Own finances
Source: National Institute of Economic Research
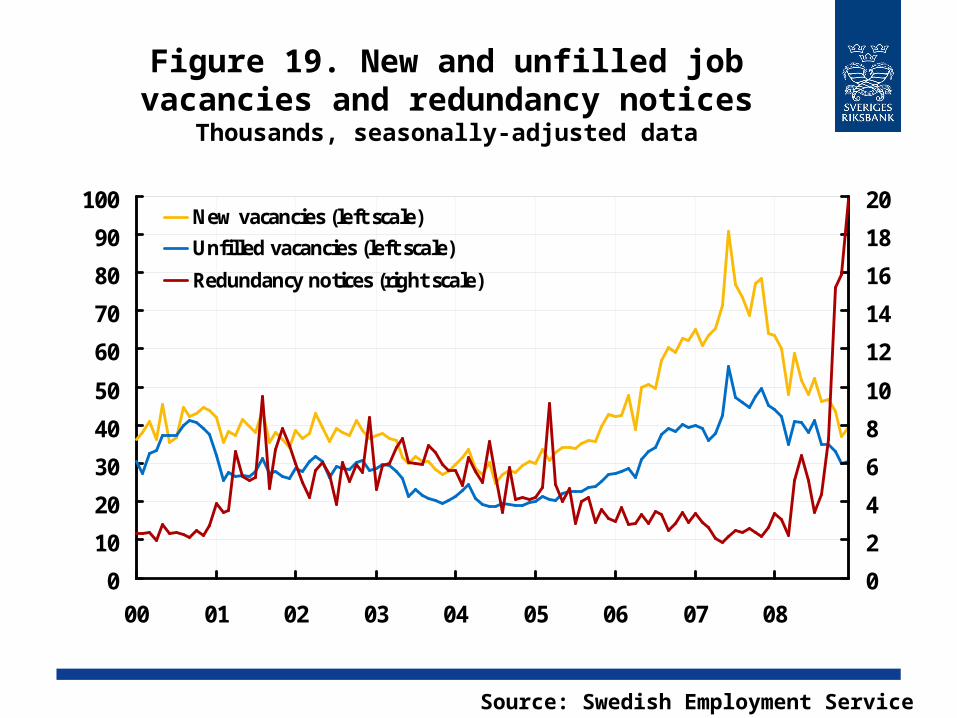
Figure 19. New and unfilled job vacancies and redundancy notices
Thousands, seasonally-adjusted data
0
10
20
30
40
50
60
70
80
90
100
00 01 02 03 04 05 06 07 080
2
4
6
8
10
12
14
16
18
20New vacancies (left scale)
Unfilled vacancies (left scale)
Redundancy notices (right scale)
Source: Swedish Employment Service
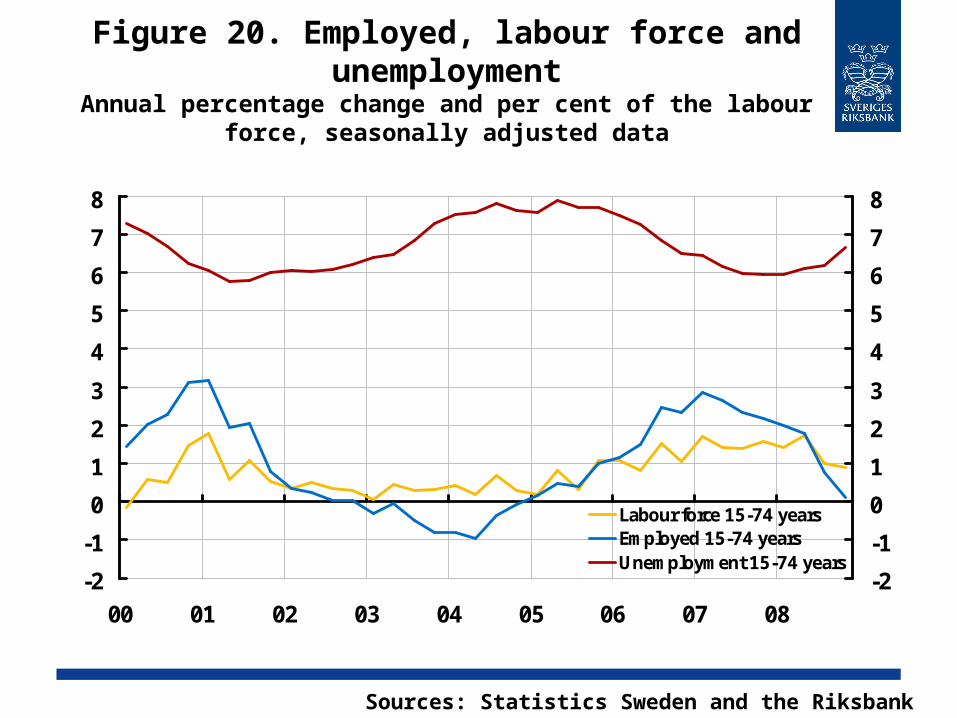
Figure 20. Employed, labour force and unemployment
Annual percentage change and per cent of the labour force, seasonally adjusted data
-2
-1
0
1
2
3
4
5
6
7
8
00 01 02 03 04 05 06 07 08-2
-1
0
1
2
3
4
5
6
7
8
Labour force 15-74 yearsEmployed 15-74 yearsUnemployment 15-74 years
Sources: Statistics Sweden and the Riksbank
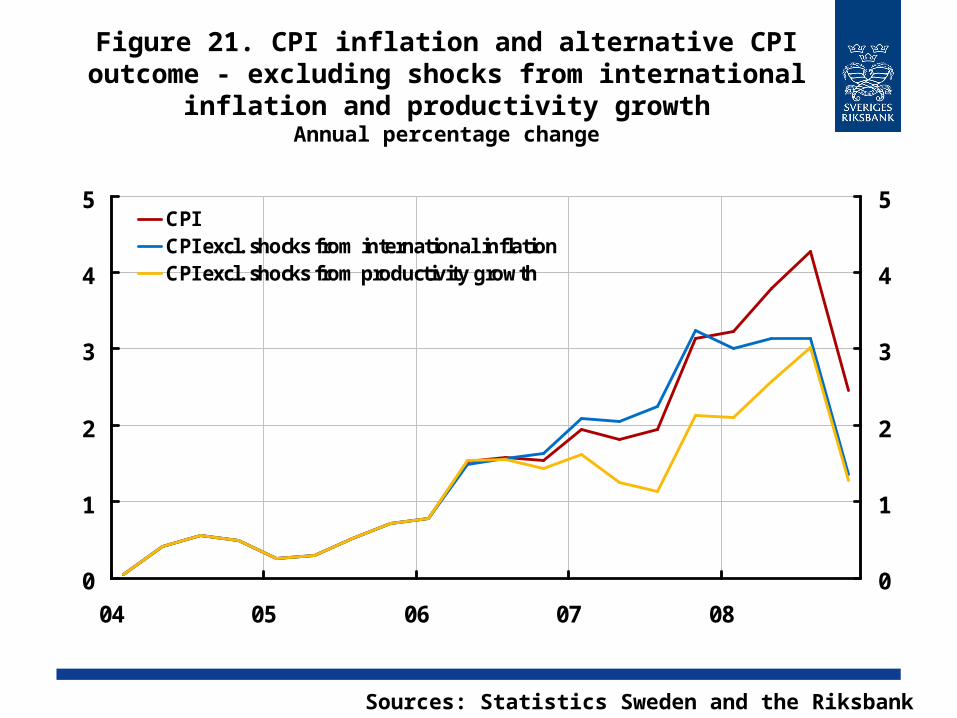
Figure 21. CPI inflation and alternative CPI outcome - excluding shocks from international
inflation and productivity growthAnnual percentage change
0
1
2
3
4
5
04 05 06 07 080
1
2
3
4
5CPICPI excl. shocks from international inflationCPI excl. shocks from productivity growth
Sources: Statistics Sweden and the Riksbank
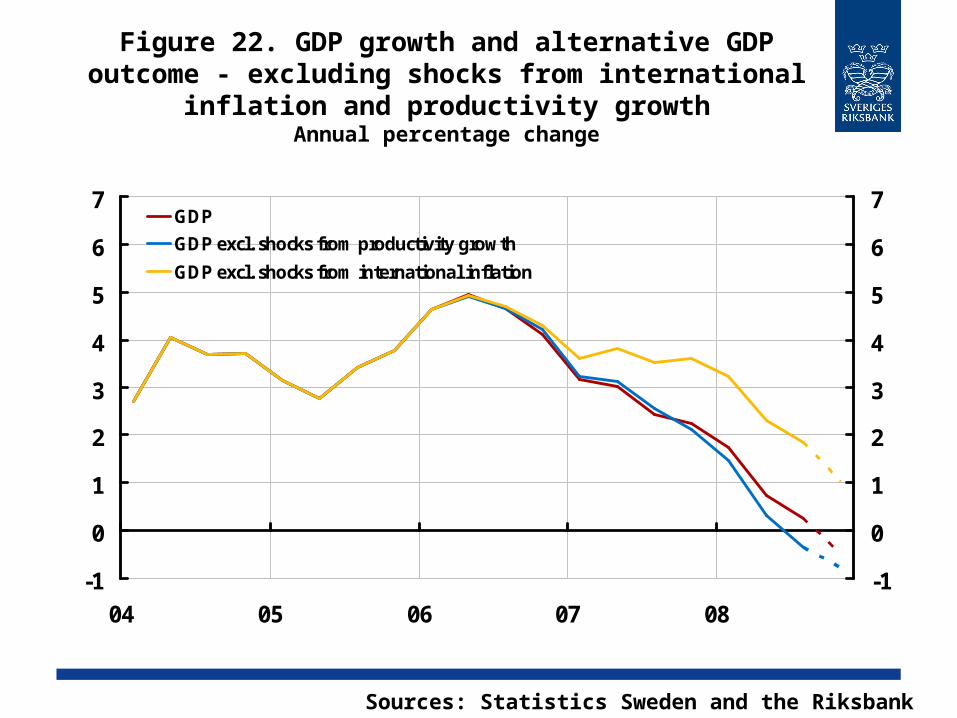
Figure 22. GDP growth and alternative GDP outcome - excluding shocks from international
inflation and productivity growthAnnual percentage change
-1
0
1
2
3
4
5
6
7
04 05 06 07 08-1
0
1
2
3
4
5
6
7GDP
GDP excl. shocks from productivity growth
GDP excl. shocks from international inflation
Sources: Statistics Sweden and the Riksbank
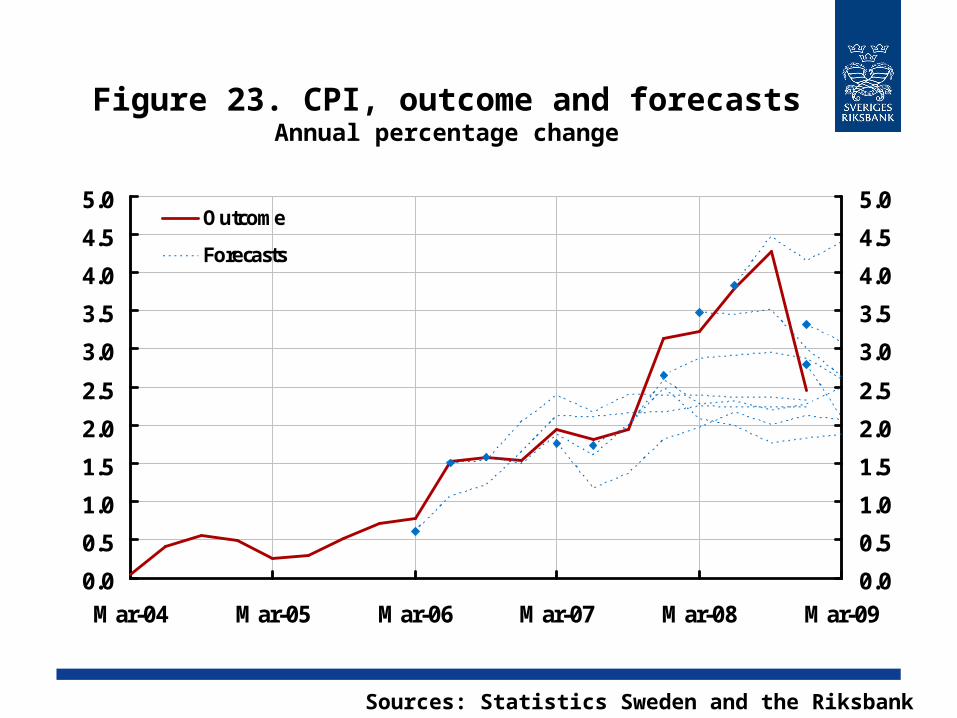
Figure 23. CPI, outcome and forecastsAnnual percentage change
0.0
0.5
1.0
1.5
2.0
2.5
3.0
3.5
4.0
4.5
5.0
Mar-04 Mar-05 Mar-06 Mar-07 Mar-08 Mar-090.0
0.5
1.0
1.5
2.0
2.5
3.0
3.5
4.0
4.5
5.0Outcome
Forecasts
Sources: Statistics Sweden and the Riksbank
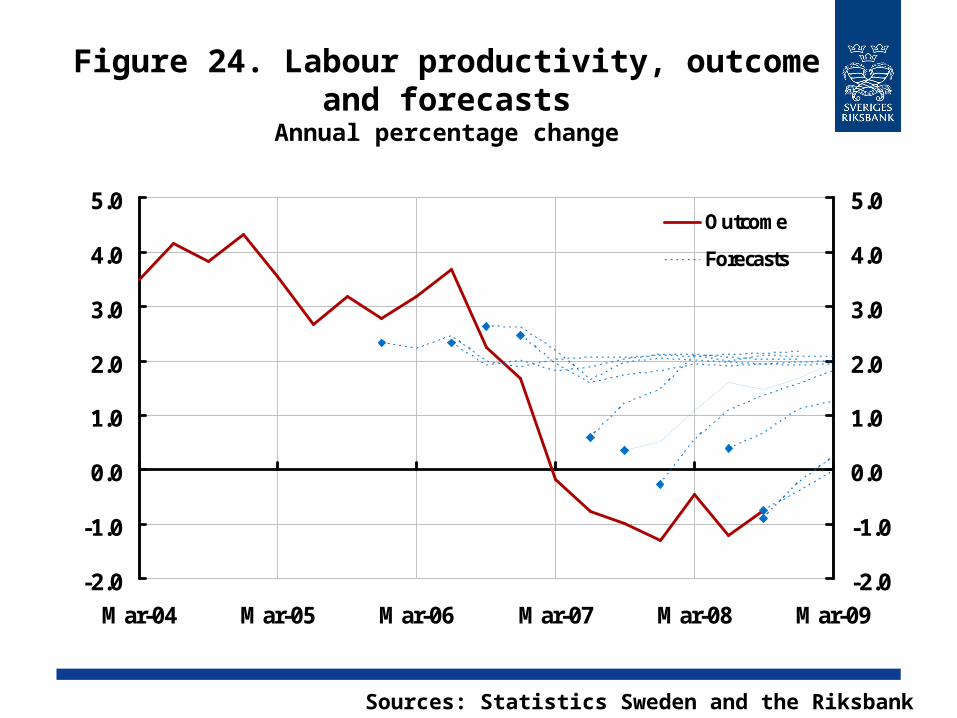
Figure 24. Labour productivity, outcome and forecasts
Annual percentage change
-2.0
-1.0
0.0
1.0
2.0
3.0
4.0
5.0
Mar-04 Mar-05 Mar-06 Mar-07 Mar-08 Mar-09-2.0
-1.0
0.0
1.0
2.0
3.0
4.0
5.0Outcome
Forecasts
Sources: Statistics Sweden and the Riksbank
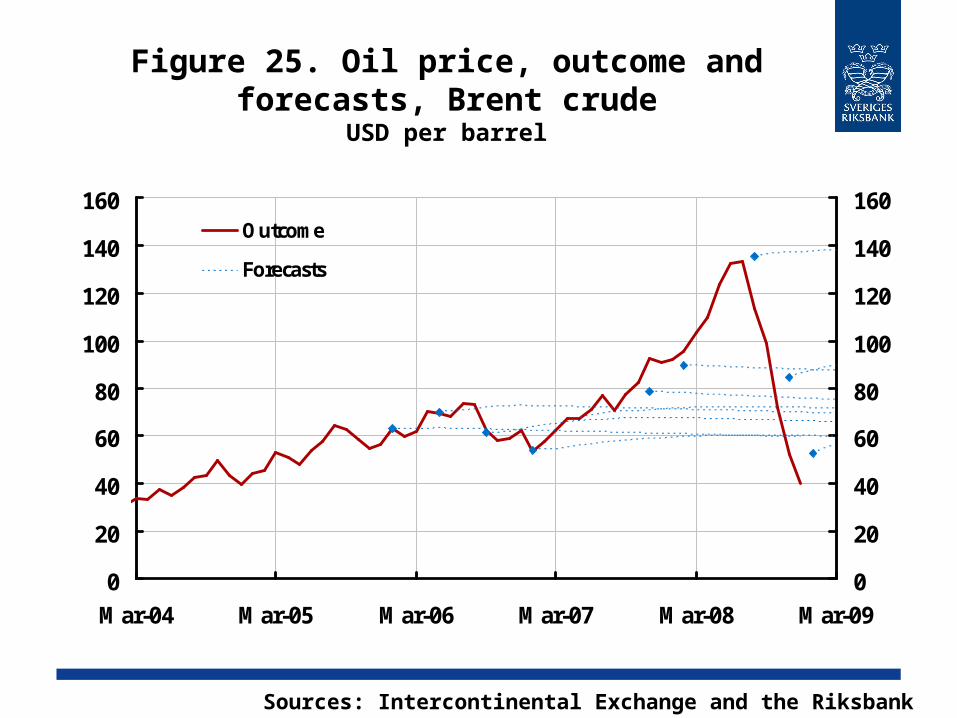
Figure 25. Oil price, outcome and forecasts, Brent crude
USD per barrel
0
20
40
60
80
100
120
140
160
Mar-04 Mar-05 Mar-06 Mar-07 Mar-08 Mar-090
20
40
60
80
100
120
140
160Outcome
Forecasts
Sources: Intercontinental Exchange and the Riksbank
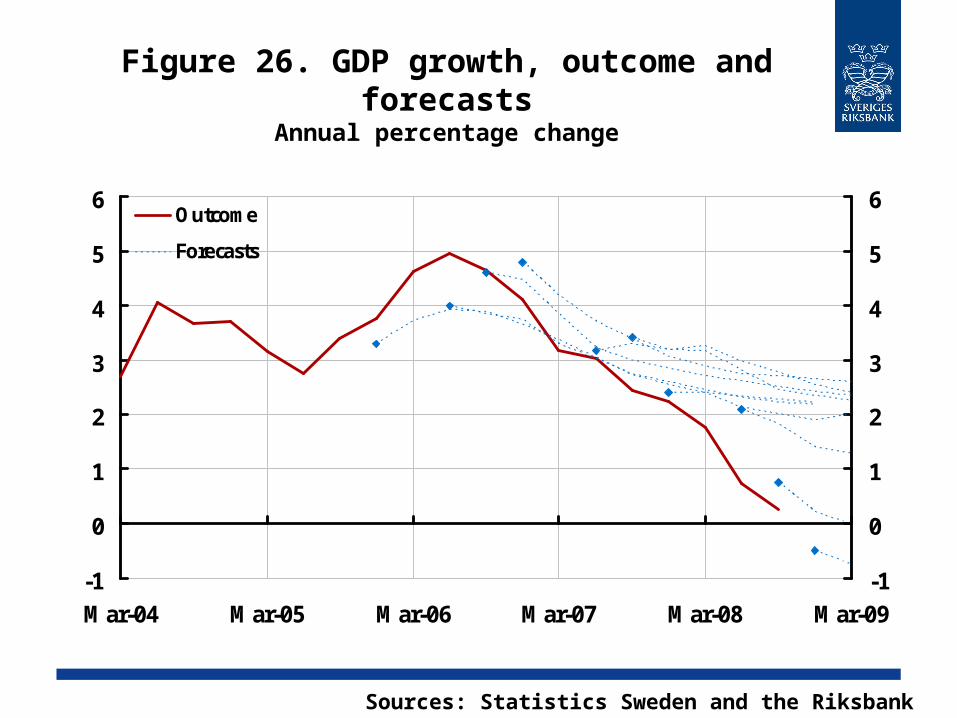
Figure 26. GDP growth, outcome and forecasts
Annual percentage change
-1
0
1
2
3
4
5
6
Mar-04 Mar-05 Mar-06 Mar-07 Mar-08 Mar-09-1
0
1
2
3
4
5
6Outcome
Forecasts
Sources: Statistics Sweden and the Riksbank
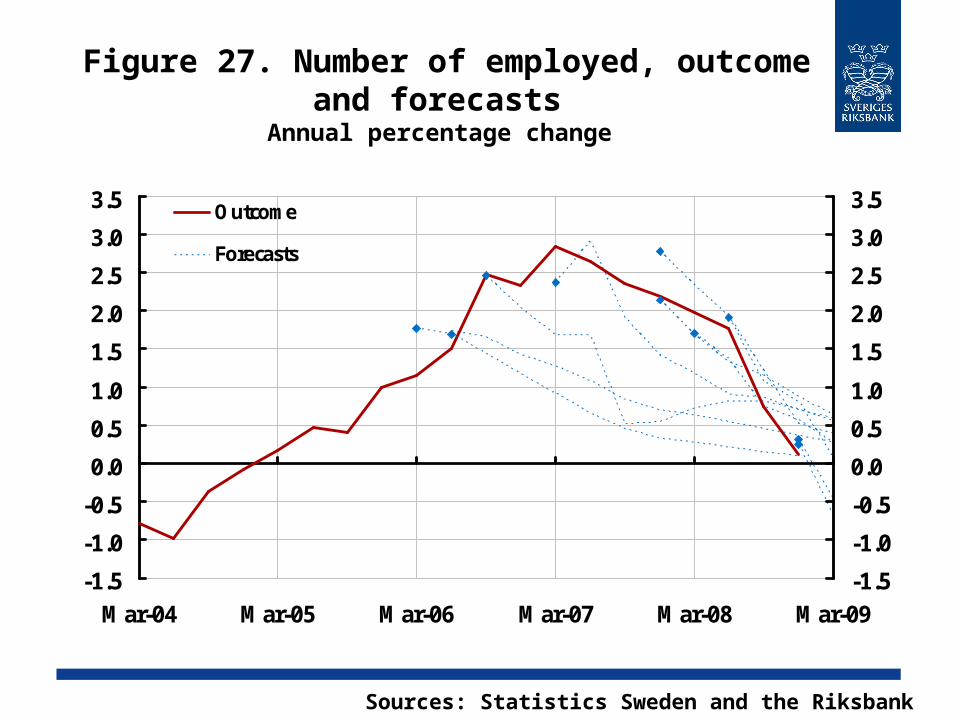
Figure 27. Number of employed, outcome and forecasts
Annual percentage change
-1.5
-1.0
-0.5
0.0
0.5
1.0
1.5
2.0
2.5
3.0
3.5
Mar-04 Mar-05 Mar-06 Mar-07 Mar-08 Mar-09-1.5
-1.0
-0.5
0.0
0.5
1.0
1.5
2.0
2.5
3.0
3.5Outcome
Forecasts
Sources: Statistics Sweden and the Riksbank
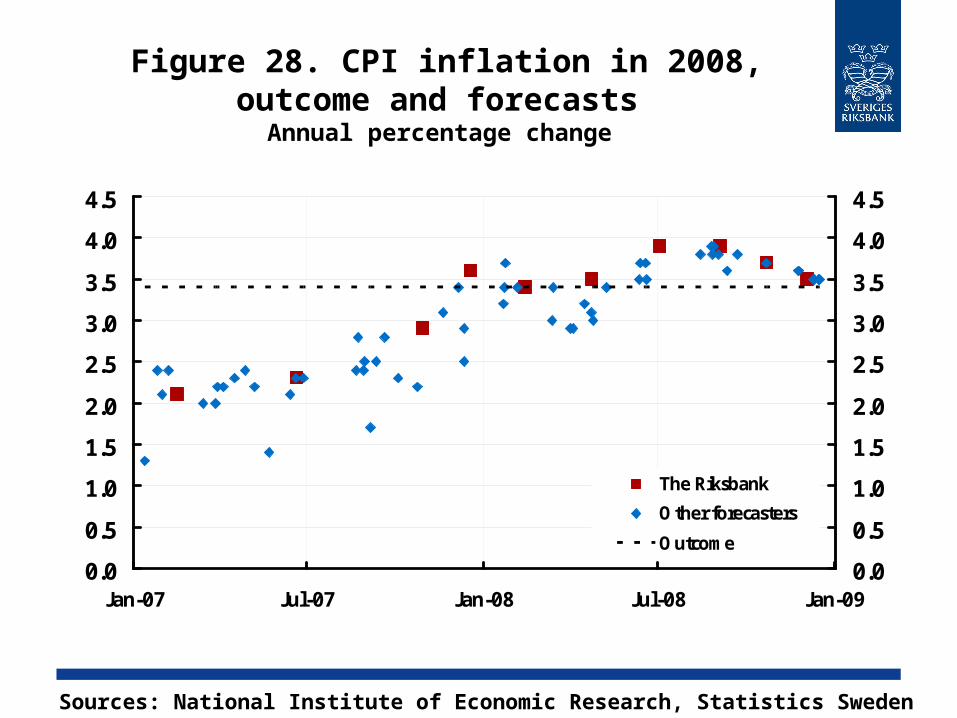
Figure 28. CPI inflation in 2008, outcome and forecasts
Annual percentage change
0.0
0.5
1.0
1.5
2.0
2.5
3.0
3.5
4.0
4.5
Jan-07 Jul-07 Jan-08 Jul-08 Jan-090.0
0.5
1.0
1.5
2.0
2.5
3.0
3.5
4.0
4.5
The Riksbank
Other forecasters
Outcome
Sources: National Institute of Economic Research, Statistics Sweden and the Riksbank
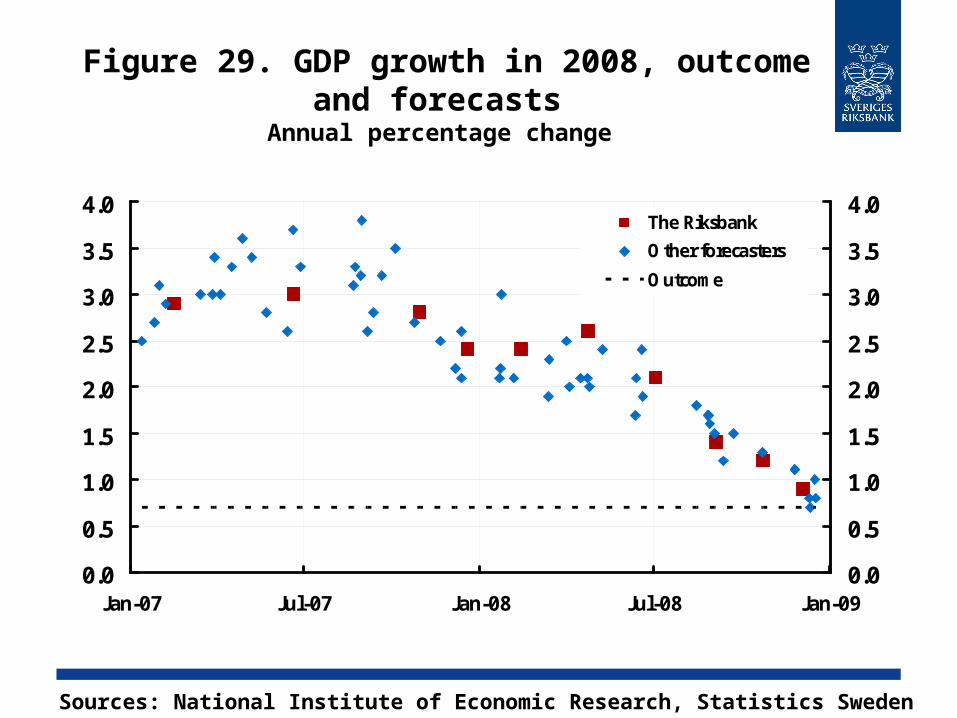
Figure 29. GDP growth in 2008, outcome and forecasts
Annual percentage change
0.0
0.5
1.0
1.5
2.0
2.5
3.0
3.5
4.0
Jan-07 Jul-07 Jan-08 Jul-08 Jan-090.0
0.5
1.0
1.5
2.0
2.5
3.0
3.5
4.0The Riksbank
Other forecasters
Outcome
Sources: National Institute of Economic Research, Statistics Sweden and the Riksbank
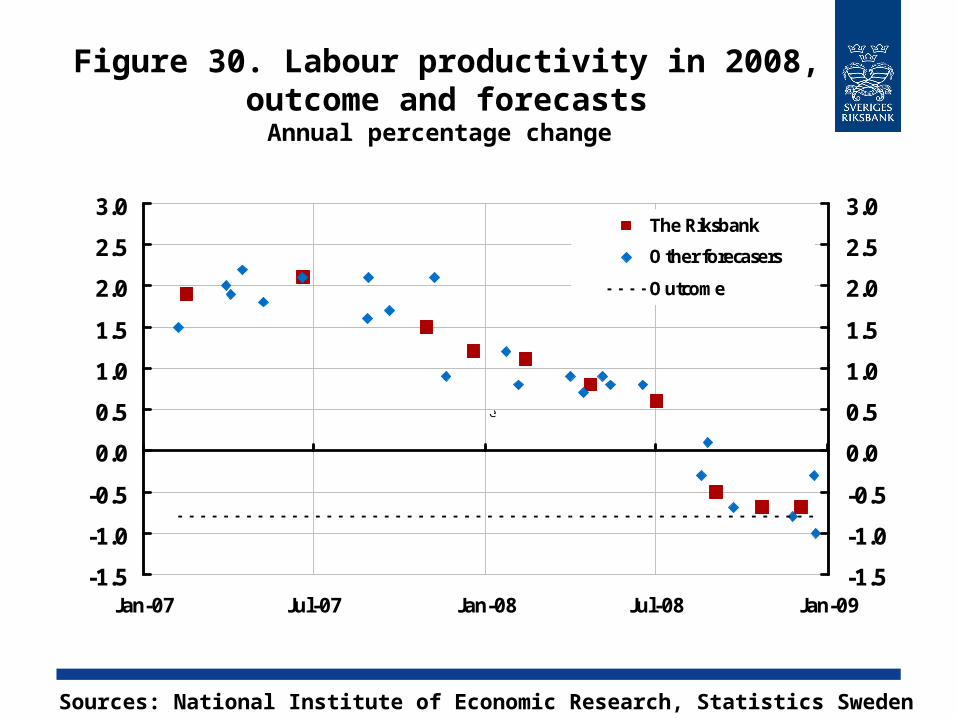
Figure 30. Labour productivity in 2008, outcome and forecasts
Annual percentage change
-1.5
-1.0
-0.5
0.0
0.5
1.0
1.5
2.0
2.5
3.0
Jan-07 Jul-07 Jan-08 Jul-08 Jan-09-1.5
-1.0
-0.5
0.0
0.5
1.0
1.5
2.0
2.5
3.0The Riksbank
Other forecasers
Outcome
e
Sources: National Institute of Economic Research, Statistics Sweden and the Riksbank
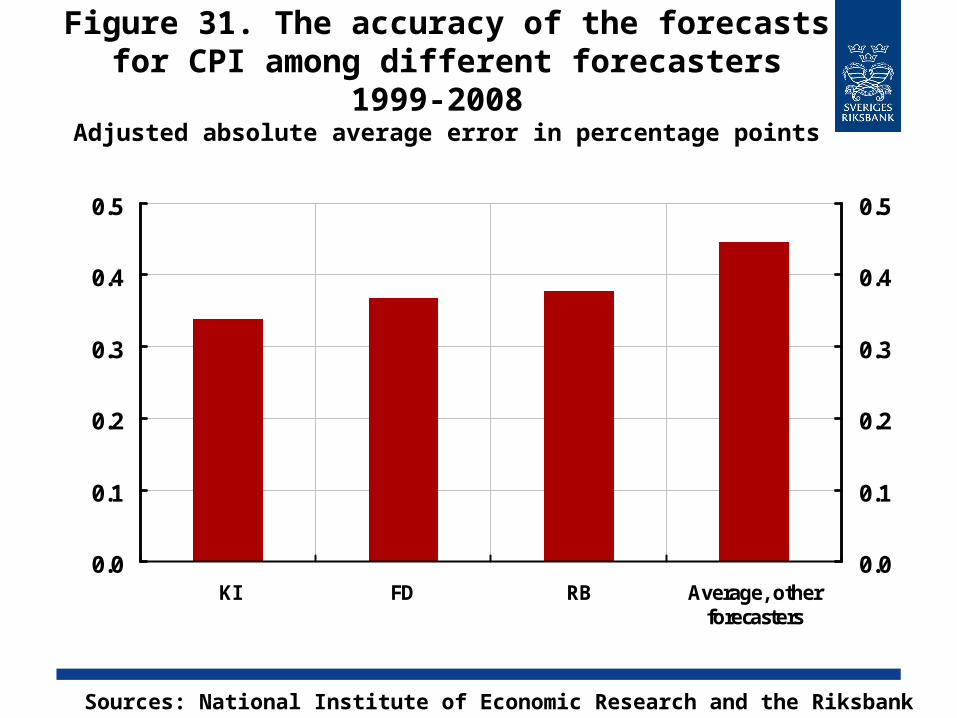
Figure 31. The accuracy of the forecasts for CPI among different forecasters 1999-
2008 Adjusted absolute average error in percentage points
0.0
0.1
0.2
0.3
0.4
0.5
KI FD RB Average, otherforecasters
0.0
0.1
0.2
0.3
0.4
0.5
Sources: National Institute of Economic Research and the Riksbank
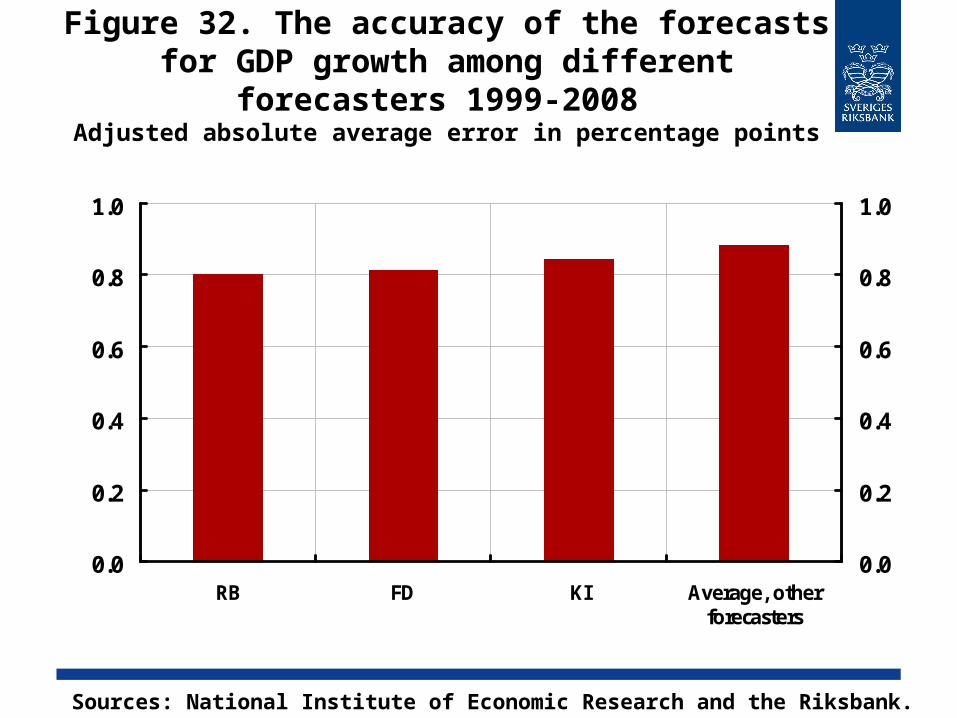
Figure 32. The accuracy of the forecasts for GDP growth among different
forecasters 1999-2008 Adjusted absolute average error in percentage points
0.0
0.2
0.4
0.6
0.8
1.0
RB FD KI Average, otherforecasters
0.0
0.2
0.4
0.6
0.8
1.0
Sources: National Institute of Economic Research and the Riksbank.
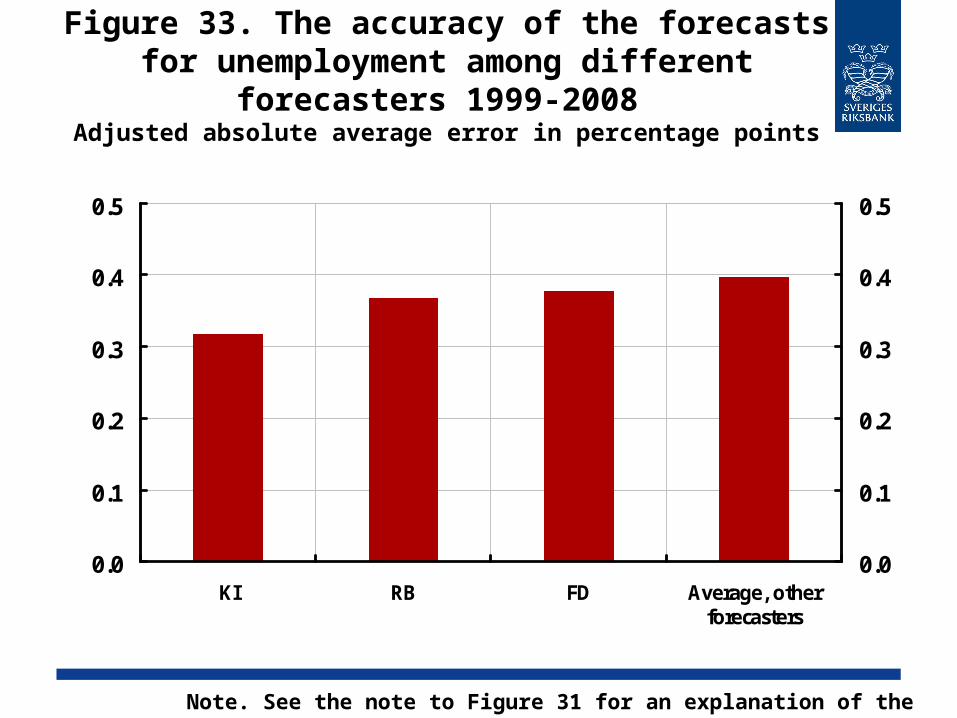
Figure 33. The accuracy of the forecasts for unemployment among different
forecasters 1999-2008 Adjusted absolute average error in percentage points
0.0
0.1
0.2
0.3
0.4
0.5
KI RB FD Average, otherforecasters
0.0
0.1
0.2
0.3
0.4
0.5
Note. See the note to Figure 31 for an explanation of the abbreviations.
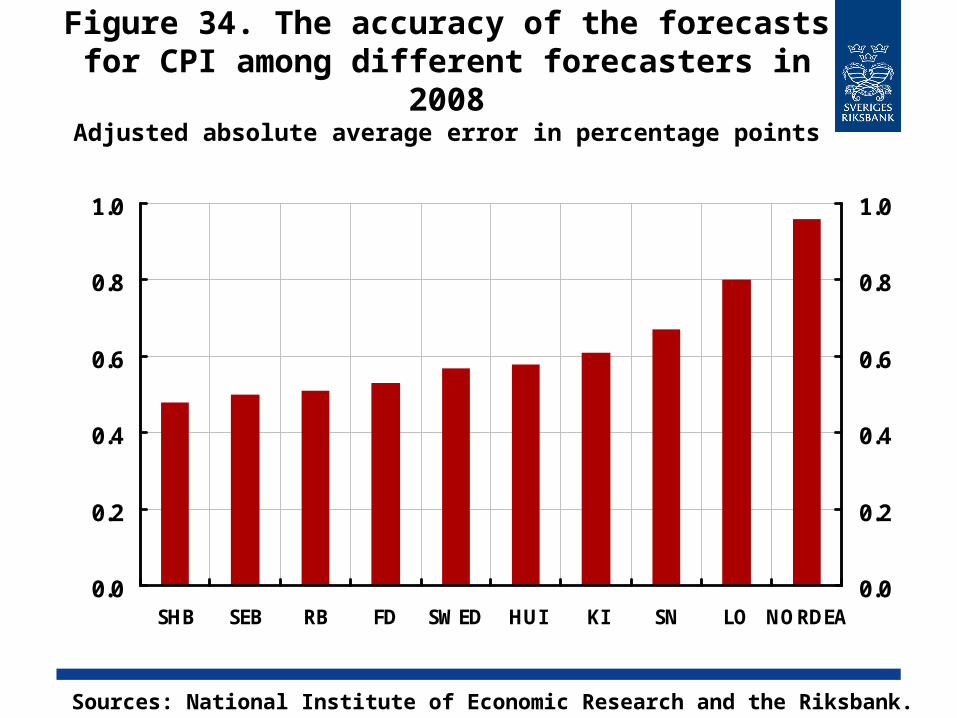
Figure 34. The accuracy of the forecasts for CPI among different forecasters in
2008Adjusted absolute average error in percentage points
0.0
0.2
0.4
0.6
0.8
1.0
SHB SEB RB FD SWED HUI KI SN LO NORDEA0.0
0.2
0.4
0.6
0.8
1.0
Sources: National Institute of Economic Research and the Riksbank.
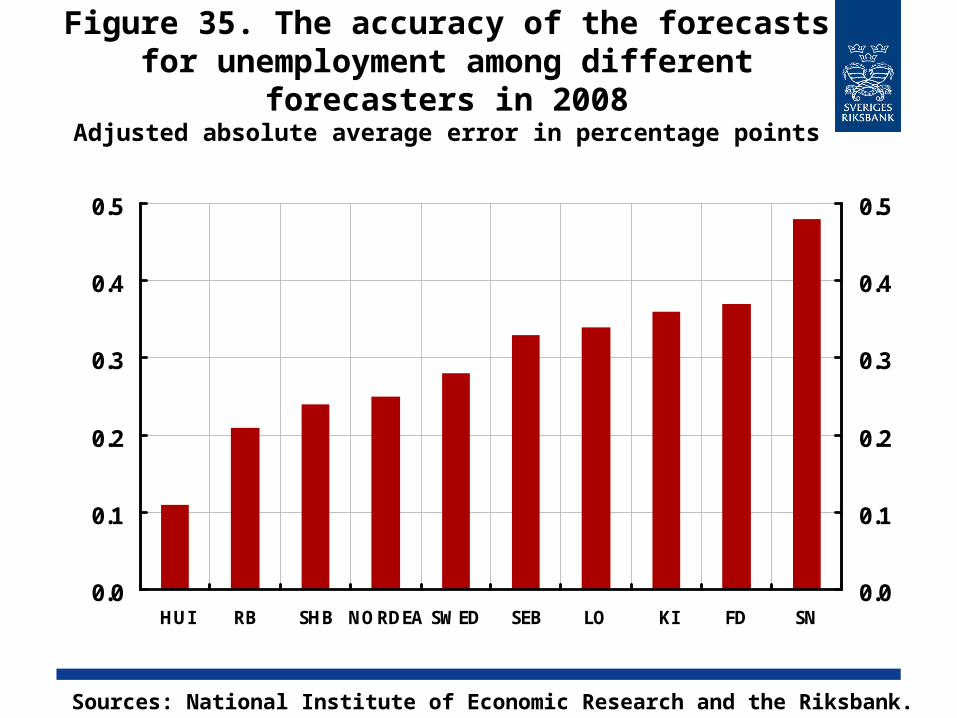
Figure 35. The accuracy of the forecasts for unemployment among different
forecasters in 2008Adjusted absolute average error in percentage points
0.0
0.1
0.2
0.3
0.4
0.5
HUI RB SHB NORDEA SWED SEB LO KI FD SN0.0
0.1
0.2
0.3
0.4
0.5
Sources: National Institute of Economic Research and the Riksbank.
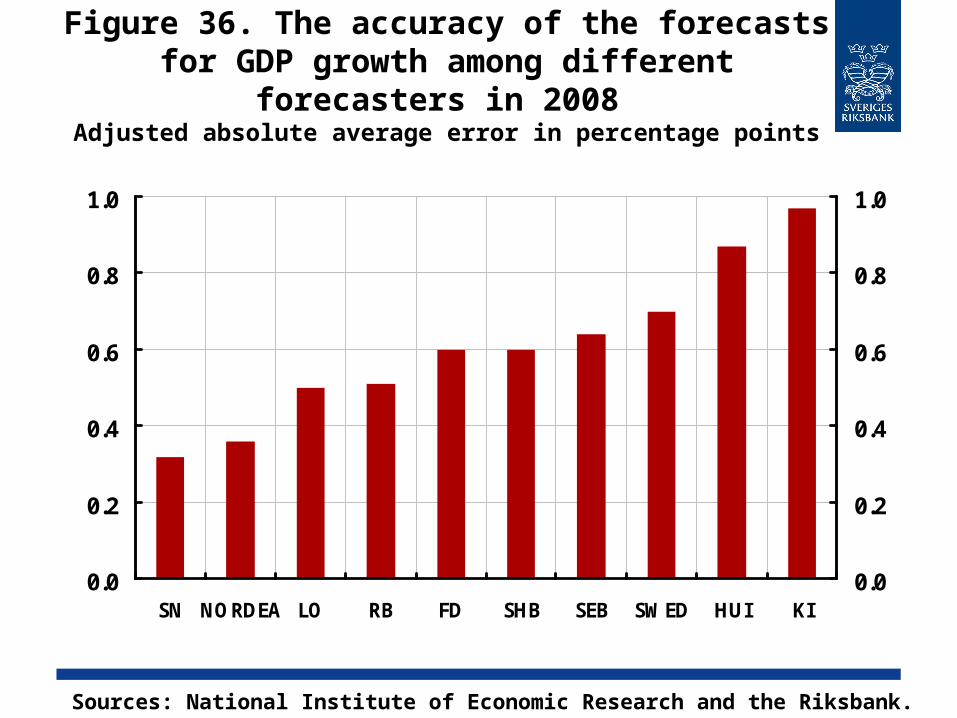
Figure 36. The accuracy of the forecasts for GDP growth among different
forecasters in 2008 Adjusted absolute average error in percentage points
0.0
0.2
0.4
0.6
0.8
1.0
SN NORDEA LO RB FD SHB SEB SWED HUI KI0.0
0.2
0.4
0.6
0.8
1.0
Sources: National Institute of Economic Research and the Riksbank.
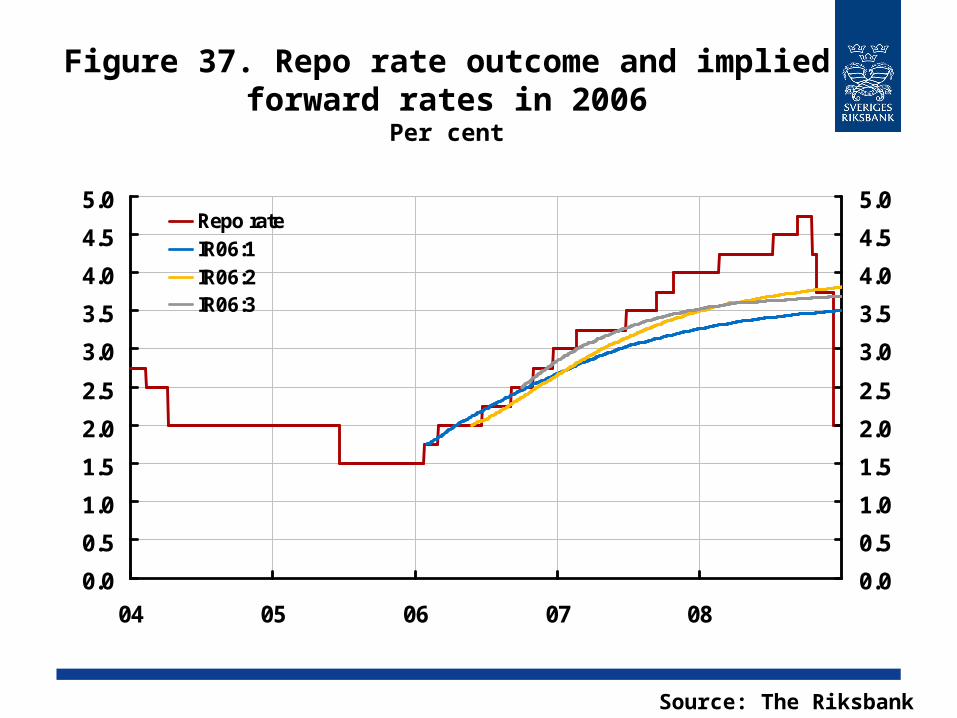
Figure 37. Repo rate outcome and implied forward rates in 2006
Per cent
0.0
0.5
1.0
1.5
2.0
2.5
3.0
3.5
4.0
4.5
5.0
04 05 06 07 080.0
0.5
1.0
1.5
2.0
2.5
3.0
3.5
4.0
4.5
5.0Repo rateIR06:1IR06:2IR06:3
Source: The Riksbank
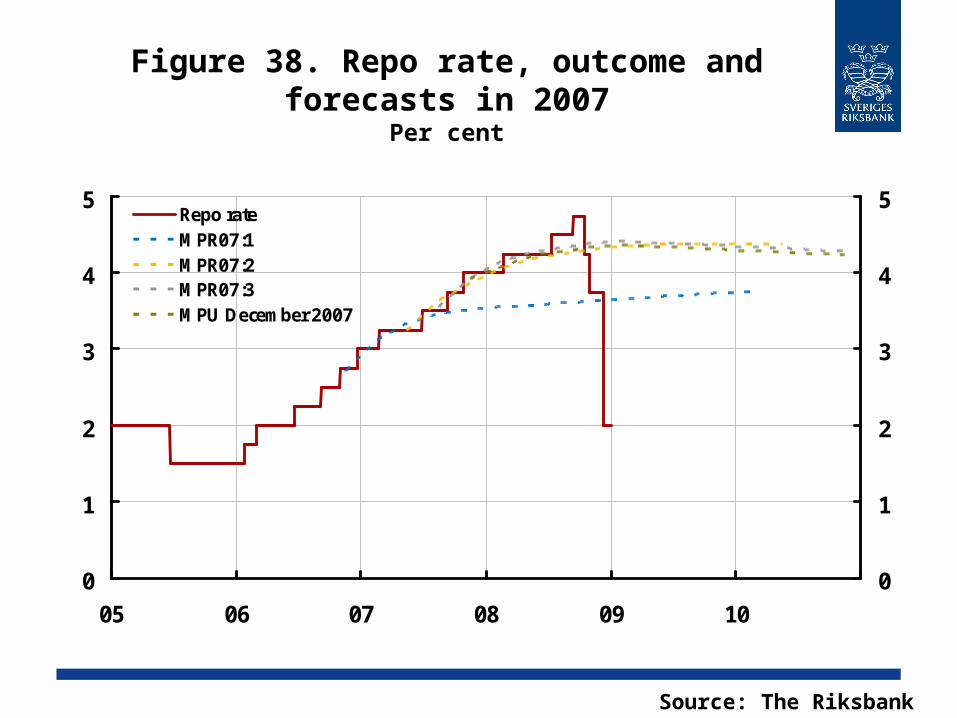
Figure 38. Repo rate, outcome and forecasts in 2007
Per cent
0
1
2
3
4
5
05 06 07 08 09 100
1
2
3
4
5Repo rateMPR07:1MPR07:2MPR07:3MPU December 2007
Source: The Riksbank
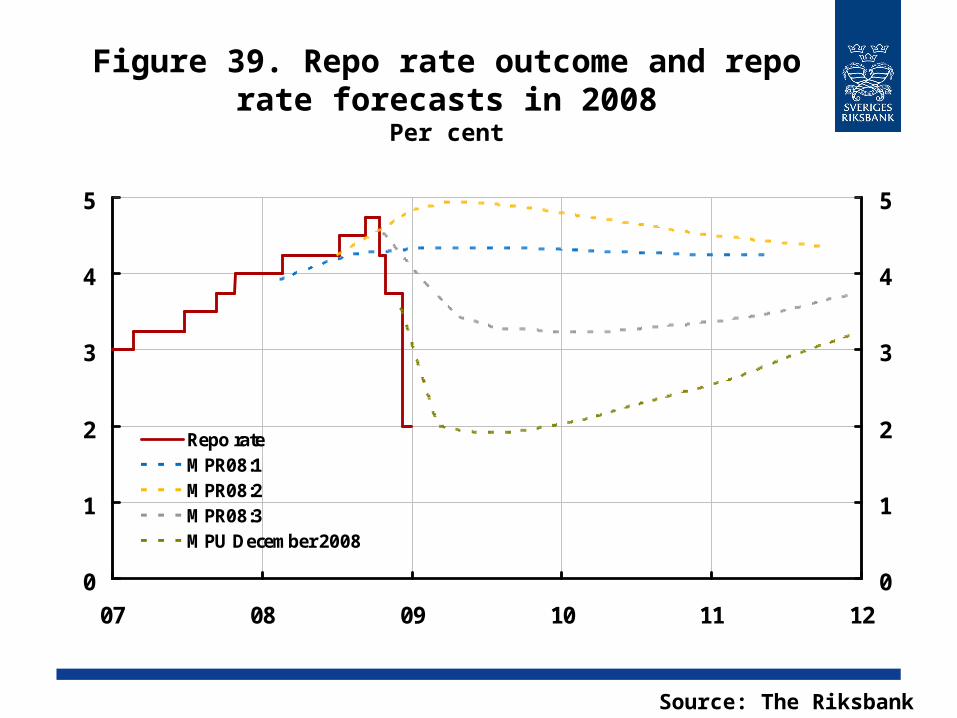
Figure 39. Repo rate outcome and repo rate forecasts in 2008
Per cent
0
1
2
3
4
5
07 08 09 10 11 120
1
2
3
4
5
Repo rateMPR08:1MPR08:2MPR08:3MPU December 2008
Source: The Riksbank
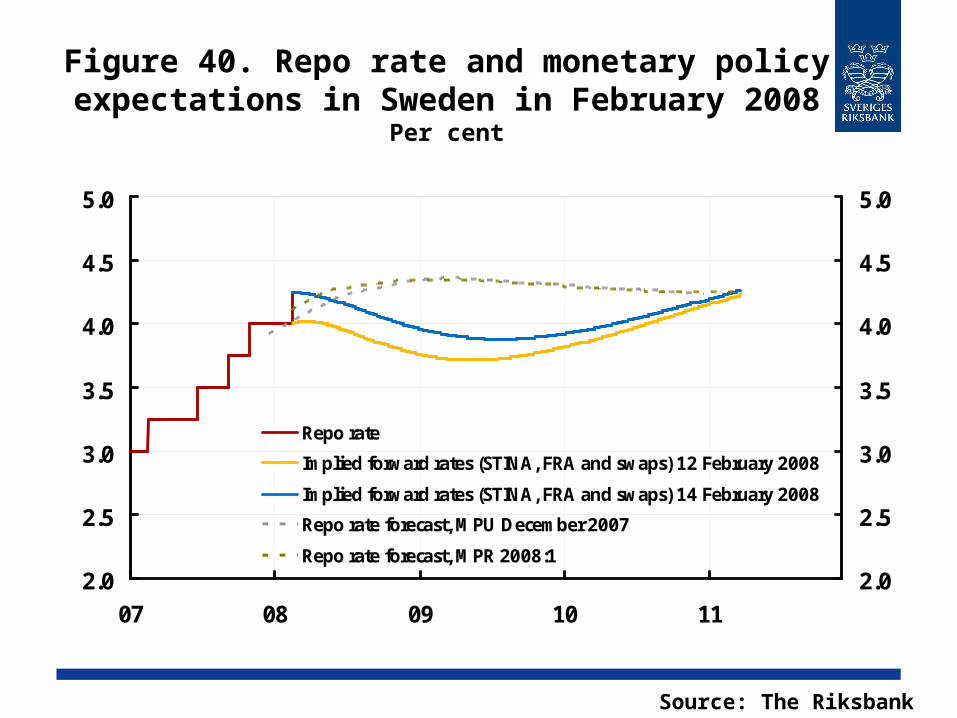
Figure 40. Repo rate and monetary policy expectations in Sweden in February 2008
Per cent
2.0
2.5
3.0
3.5
4.0
4.5
5.0
07 08 09 10 112.0
2.5
3.0
3.5
4.0
4.5
5.0
Repo rate
Implied forward rates (STINA, FRA and swaps) 12 February 2008
Implied forward rates (STINA, FRA and swaps) 14 February 2008
Repo rate forecast, MPU December 2007
Repo rate forecast, MPR 2008:1
Source: The Riksbank
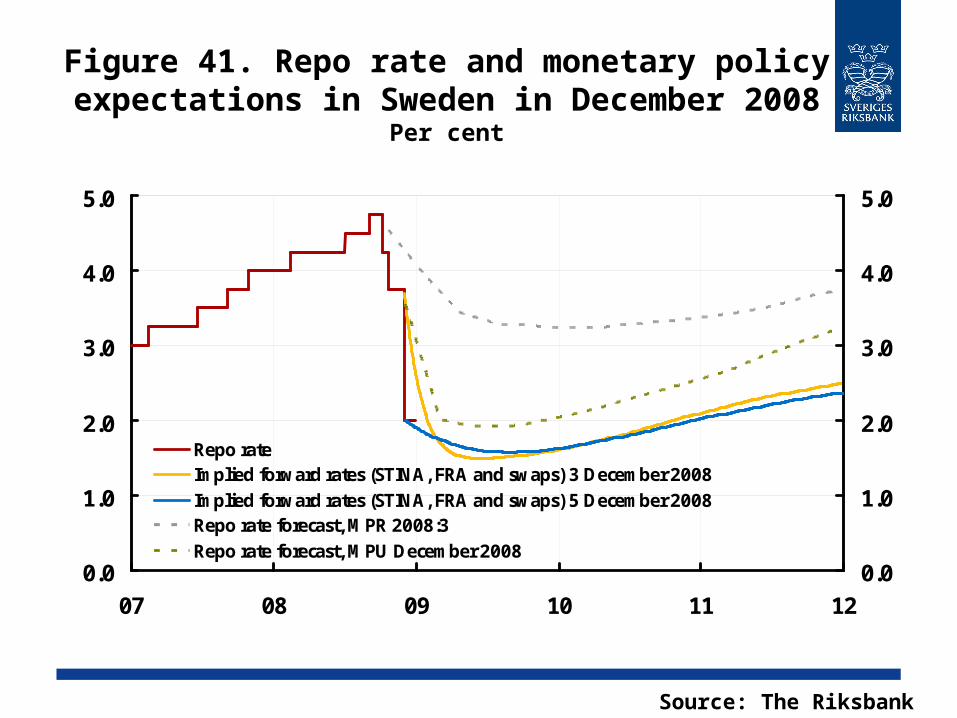
Figure 41. Repo rate and monetary policy expectations in Sweden in December 2008
Per cent
0.0
1.0
2.0
3.0
4.0
5.0
07 08 09 10 11 120.0
1.0
2.0
3.0
4.0
5.0
Repo rateImplied forward rates (STINA, FRA and swaps) 3 December 2008Implied forward rates (STINA, FRA and swaps) 5 December 2008Repo rate forecast, MPR 2008:3Repo rate forecast, MPU December 2008
Source: The Riksbank
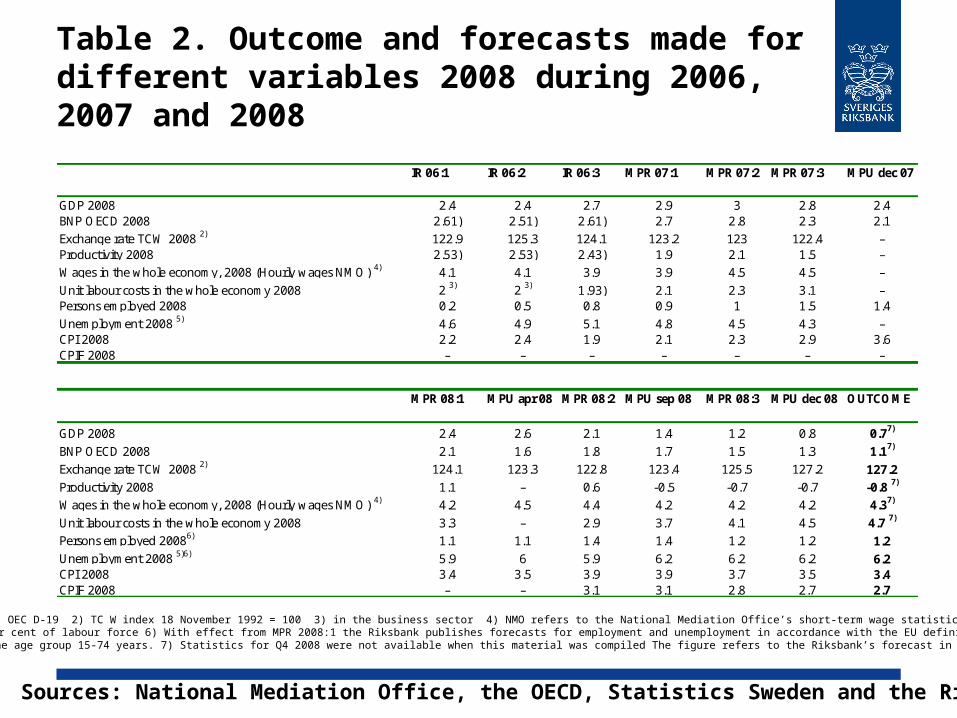
Table 2. Outcome and forecasts made for different variables 2008 during 2006, 2007 and 2008
1) OEC D-19 2) TC W index 18 November 1992 = 100 3) in the business sector 4) NMO refers to the National Mediation Office’s short-term wage statistics.5) per cent of labour force 6) With effect from MPR 2008:1 the Riksbank publishes forecasts for employment and unemployment in accordance with the EU definition,
which refers to the age group 15-74 years. 7) Statistics for Q4 2008 were not available when this material was compiled The figure refers to the Riksbank’s forecast in MPR February 2009.
Sources: National Mediation Office, the OECD, Statistics Sweden and the Riksbank
IR 06:1 IR 06:2 IR 06:3 MPR 07:1 MPR 07:2 MPR 07:3 MPU dec 07
GDP 2008 2.4 2.4 2.7 2.9 3 2.8 2.4BNP OECD 2008 2.61) 2.51) 2.61) 2.7 2.8 2.3 2.1Exchange rate TCW 2008 2) 122.9 125.3 124.1 123.2 123 122.4 –Productivity 2008 2.53) 2.53) 2.43) 1.9 2.1 1.5 –Wages in the whole economy, 2008 (Hourly wages NMO) 4) 4.1 4.1 3.9 3.9 4.5 4.5 –Unit labour costs in the whole economy 2008 2 3) 2 3) 1.93) 2.1 2.3 3.1 –Persons employed 2008 0.2 0.5 0.8 0.9 1 1.5 1.4Unemployment 2008 5) 4.6 4.9 5.1 4.8 4.5 4.3 –CPI 2008 2.2 2.4 1.9 2.1 2.3 2.9 3.6CPIF 2008 – – – – – – –
MPR 08:1 MPU apr 08 MPR 08:2 MPU sep 08 MPR 08:3 MPU dec 08 OUTCOME
GDP 2008 2.4 2.6 2.1 1.4 1.2 0.8 0.77)
BNP OECD 2008 2.1 1.6 1.8 1.7 1.5 1.3 1.17)
Exchange rate TCW 2008 2) 124.1 123.3 122.8 123.4 125.5 127.2 127.2Productivity 2008 1.1 – 0.6 -0.5 -0.7 -0.7 -0.8 7)
Wages in the whole economy, 2008 (Hourly wages NMO) 4) 4.2 4.5 4.4 4.2 4.2 4.2 4.37)
Unit labour costs in the whole economy 2008 3.3 – 2.9 3.7 4.1 4.5 4.7 7)
Persons employed 20086) 1.1 1.1 1.4 1.4 1.2 1.2 1.2Unemployment 2008 5)6) 5.9 6 5.9 6.2 6.2 6.2 6.2CPI 2008 3.4 3.5 3.9 3.9 3.7 3.5 3.4CPIF 2008 – – 3.1 3.1 2.8 2.7 2.7