material flow map and layout optimization: action plan and ... · material flow map and layout...
TRANSCRIPT
Material Flow Map and Layout Optimization: action plan and software validation
Domenico Falcone, Alessandro Silvestri, Vincenzo Duraccio, Gianpaolo Di Bona
Department of Mechanics, Structures, Environment, University of Cassino, Via G. Di Biasio, 43, 03043, Cassino – Italy ([email protected])
Abstract:
During the “life” of an industrial plant, many changes happen. Starting from an initial configuration of production lines, manufacturing and assembly departments, tools and equipment rooms, the plant layout could change because of new and different needs. Often, the above layout modifications are not correctly studied and optimized, causing problems in the management of worker movement and material flow. The main configurations of a firm, closely linked to the production quantity of each component, are: “product” or “process” layouts. In the case of a product layout, we arrange activities in a line according to the sequence of operations for a particular product or service; instead in the case of a process layout, similar activities are grouped together in departments according to the process or function they perform. The “product” configuration (commonly called “flow-shop”) is generally more automated and efficient; while in the other side, the “process” configuration (commonly called “job-shop”) is more flexible and manual. The present work suggests the main steps to verify the layout of an industrial plant organized in departments (“process” layout), in order to improve material flow, reducing production lead time, warehouse and workplace. The work suggests the adoption of different tools, such as: paths chart, product-quantity data sheet, flow process chart, from-to analysis, relationship chart of service and production activities, etc. In particular, we have applied the above tools to a company working in the field of electro-mechanical components. First of all, it is necessary to study the current layout, manufacturing, storage and service areas. Subsequently we need to map the material flow, starting from products information, such as: bill of materials; manufacturing cycles; ordering data. By matching layout and product information, many criticalities are pointed out. The material flow can be visualized on the plant plan, by using right codifications (measurement units and standard symbols). It is possible to value quantities and distances. Thanks to the mapping phase, it is possible to recognize the value stream and consequently the non-value activities. After the construction of the material flow map, it is necessary to draw the relationship chart. In fact, to improve the current layout, not only considerations about materials are required, but also different ones. We need information about exchange of documents rather than equipment and tools between departments. At this point, in order to adopt the right actions, it is important to define our goals: flow linearization, distance and material exchange reduction, workplace and warehouse areas saving, etc. For each goal, we can define a particular index to value the effectiveness of our choices; however it is impossible to find an unique solution able to improve all the defined indexes at the same time. Therefore, the work proposes new approach and criteria able to combine different indexes and goals. Finally, it is interesting to validate the taken choices trough customized or commercial software. In particular we have used the improvement algorithm CRAFT (Computerized Relative Allocation of Facilities Technique), based on the minimization of the transportation cost. It is more widely used than ALDEP and CORELAP, that consider relationships between departments more important. Thanks to that commercial optimizer software, it is possible to verify the goodness of the layout modifications proposed. The present work formalizes an approach for mapping material flow and optimizing plant layout, through the integration of several instruments, less or more complex, and the definition of combined indexes and criteria.
Keywords: process, plant, value, stream, CRAFT.
1. Introduction
Plant Layout is the physical arrangement of equipment and facilities within an industrial plant. The Plant Layout can be indicated on a floor plan, in which many information are shown, such as the distances between
different departments and machineries of the plant (Pareschi, 2002). The optimization of the layout of a plant can improve productivity, safety and quality of products. The layout optimization allows reducing materials handling and storage. In particular, important aspects are:

- Distances for Materials movement;
- Distances for Equipment movements;
- Distances for Operators movements;
- Areas of Workplaces;
- Areas of Warehouses;
- Types of Handling Equipment needed;
- Types of Storage systems;
- Etc.
In order to consider the above aspects, many techniques are available in the specific literature (Vignanti, 2002). The analyst can decide to follow different approaches able to reach one or more goals at the same time. In the following paragraphs many instruments in a logical approach are analysed, suggesting a possible method of work for layout optimization, starting from the study of old and new techniques.
2. Traditional techniques
Generally, the possible layout studies are:
1. partial change of existing layout;
2. total change of existing layout;
3. transfer into a new firm;
4. establishment of a new firm.
While in the third and fourth case, we are more free of making our choices, in the first and second case there are more constraints to take into consideration (Cristopher, 1998).
The main configurations of a firm, closely linked to the production quantity of each component, are: “product” or “process” layouts. In the case of a product layout, we arrange activities in a line according to the sequence of operations for a particular product or service; instead in the case of a process layout, similar activities are grouped together in departments according to the process or function they perform. The “product” configuration (commonly called “flow-shop”, Fig. 1) is generally more automated and efficient; while in the other side, the “process” configuration (commonly called “job-shop”, Fig. 2) is more flexible and manual.
Fig. 1 – “Product” layout configuration
Generally, the “job-shop” configuration is more complex in terms of handling systems and materials flows and
requires more space for warehouses and inter-operational buffers.
Fig. 2 – “Process” layout configuration
In the present work the worst combination has been analysed: layout optimization in the case of “process” configuration.
The traditional design tools adopted are:
- Operation/Assembly process chart;
- Multi product process chart;
- From-To Chart;
- Flow Value Analysis;
- Relationship Chart;
- Transportation Cost Method.
In particular, the last method suggests to minimize a total cost function (Falcone, 2007):
(1) pi,j: number of transports;
ci,j: cost per unit of distance;
di,j: distance per transport.
The minimization can be obtained considering different procedures more or less complex and automatic. Some software support that optimization, see figure n. 3.
Fig. 3 – Software for layout study
We have adopted Craft software to test the layout modifications suggested.
3. Innovative techniques
The traditional techniques, mentioned before, take into consideration static production, fixed mix and quantities of products. Nowadays, the great market variability

suggests the adoption of new design criteria and different layout configurations. That new problem is normally called Dynamic Facility Layout Problem (DFLP), introduced in the '80s by the American Meir J. Rosenblatt. A dynamic layout is a flexible system able to produce current and future mix of products (Tompkins, 2010). Therefore we have to reach different goals: first of all the reconfiguration efficiency. Obviously, configurations based on cell concept are preferred. The most common cell configurations are:
Fractal Layout
The cells are almost identical, so that in them we have an equal number of machines of the same type
Virtual Cell Layout - Virtual Cellular Manufacturing Systems (VCMs)
The virtual cell layout is a combination of cells and departments. It is necessary to duplicate several times the same machine inside the plant, not necessary in the same department.
In a dynamic scenario, the main characteristics of a layout, could be flexibility and applicability to different conditions of work (Flexible Layout). In order to reach that goal and chose the right plant configuration, mathematical and heuristic methods can be used (e.g. Flex Layout software). The layout suggested isn’t optimized for a particular combination of constraints, but it is very flexible and is able to work efficiently in different conditions. In the following, some examples of flexible layouts are given.
1. Distributed Layout
It is a first example of a flexible layout based on the duplication in a strategic way of a specific department layout over the whole area available in the plant, often with the creation of sub-divisions. It is possible to create dynamic and flexible virtual cell (Holographic Layout, figure n. 4). According to this kind of layout, machines seem to be placed randomly and there aren't well-defined paths and optimized flows, but they are created in real time by an intelligent control system.
Fig. 4 – Distributed Layout
2. Modular Layout
The modular layout is designed to combine advantages coming out from the main types of basic layouts: in series, departments and cells, to manage the enormous and complex flow of materials present in multi-product companies. The result is a plant layout characterized by the organization in modules (Fig. 5), with the machines required for the
production, arranged in a specific basic layout, able to minimize transport costs.
Fig. 5 – Modular Layout
3. Reconfigurable Layout
Thanks to the recent technological developments in the use of light materials and compact machineries, these new reconfigurable layouts are possible, especially in the production of electronic devices; in order to achieve a faster and more economic adjustment of production systems.
4. Agile Layout
This layout takes into consideration the accumulation of work in process, waiting times and queues, the utilization rate of machines, which are crucial in calculating the performance of a facility. The main scope is the reduction of the variance of the distances of material flows. Many configurations are possible: Star (Fig. 6), Unidirectional Linear, Loop Layout.
Fig. 6 – Star Layout
5. U-SPAH Layout
This layout has been developed by a pharmaceutical company, based on a “process” type, with a central space for control and supervision (Fig. 7). We can observe a U unidirectional path for materials.
Fig. 7 – U-SPAH Layout

Starting with basic configurations, it is possible to study new layouts, more flexible and suitable for a dynamic market (Mecklenburgh, 1996), where the mix and quantity of production change more quickly than in the past.
4. Case Study
In the present paragraph, the case study of a company working in the electromechanical industry, is analysed. Through the above analysis, the approach for the layout study and the integration of old and new tools are presented. The company produces switches for high, medium and low voltage (about 40.000 different items). Inside the firm, we can recognize many productive areas (job-shop layout) (Tab. 1):
• Tooling room for the construction and maintenance of dies and tools; • Department for punching and bending metals; • Welding department; • Assembly lines for the production of electromechanical components; • Metrological laboratory. The total covered area is about 5.000 square meters.
At the bottom of the figure 8 (first building), the offices of logistics, production and the testing room are located. There is also a second building, principally for materials storage (Fig. 9).
Fig. 8 – First Building, Current Layout
Fig. 9 – Second Building, Current Layout
5. Analysis of materials flows
Starting from Bills of Materials, in order to map the flow of main materials, we have used two techniques:
- Operation process chart (using ASME Codification);
- Spaghetti chart.
These two techniques, closely related to each other, allow to quantify the exchange of material between departments. First of all, we applied Flow Value Analysis, obtaining an initial increase of production takt time. An important aspect is the definition of a unique measure unit of flow (Load Unit). In our case, the unit chosen has been an “Eur-Epal Pallet”.
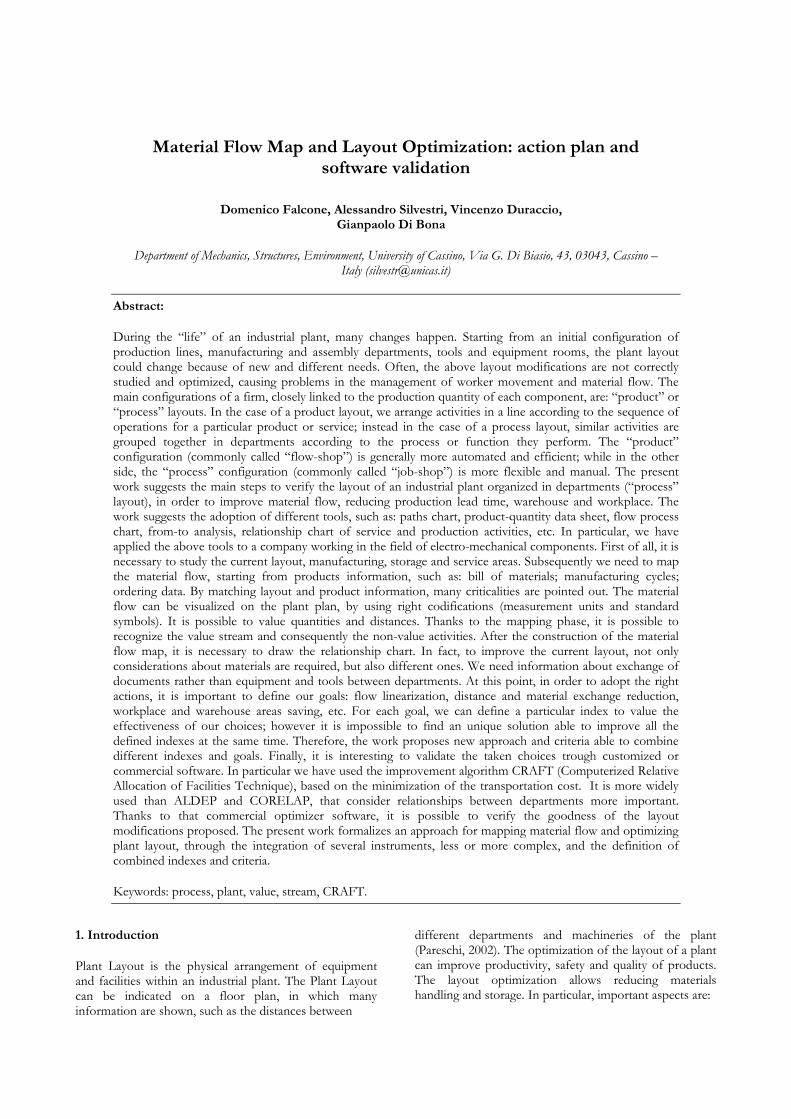
Subsequently, it was possible to create the "spaghetti chart" of the analysed products, mapping the paths of materials and operators, in order to identify the most critical (Fig. 10).
The control of physical flows is a fundamental activity for each company. Handling activities have to be accurate, timely, with value. A wrong flow control might cause a great variability of results and their unpredictability, such as early or late productions or quality problems (Mallick, 1951). A properly management of flows, can reduce weaknesses points in different phases of the process, and support company layout optimization.
TAB. 1 – Firm Areas AREA SM
Acceptance Area 52 Shipment Area 1 39 Shipment Area 2 42,25 Finished Products Warehouse 210 Bending Buffer 45,5 Welding Buffer 97,5 Semi-finished Products Warehouse 1 19,5 Semi-finished Products Warehouse 2 47,25 Semi-finished Products Warehouse 3 49,5 Raw Mat. Warehouse 1 106,25 Raw Mat. Warehouse 2 18,75 Raw Mat. Warehouse 3 465 Department 1 518 Department 2 162 Department 3 166,5 Department 4 157,5 Department 5 221 Department 6 59,5 Welding Department 126 Finishing Department 350 Heat Treatments and Washing 45,5 Tools Room 720 Offices and Services 288 Sub-contractor Assembly Department 237,5 Internal Road 913,20 TOTAL AREA 5157
AREA COLOR SQ
PRODUCTION 2043,5 SERVICES 288 WAREHOUSE 1192,5 MAINTENANCE 720
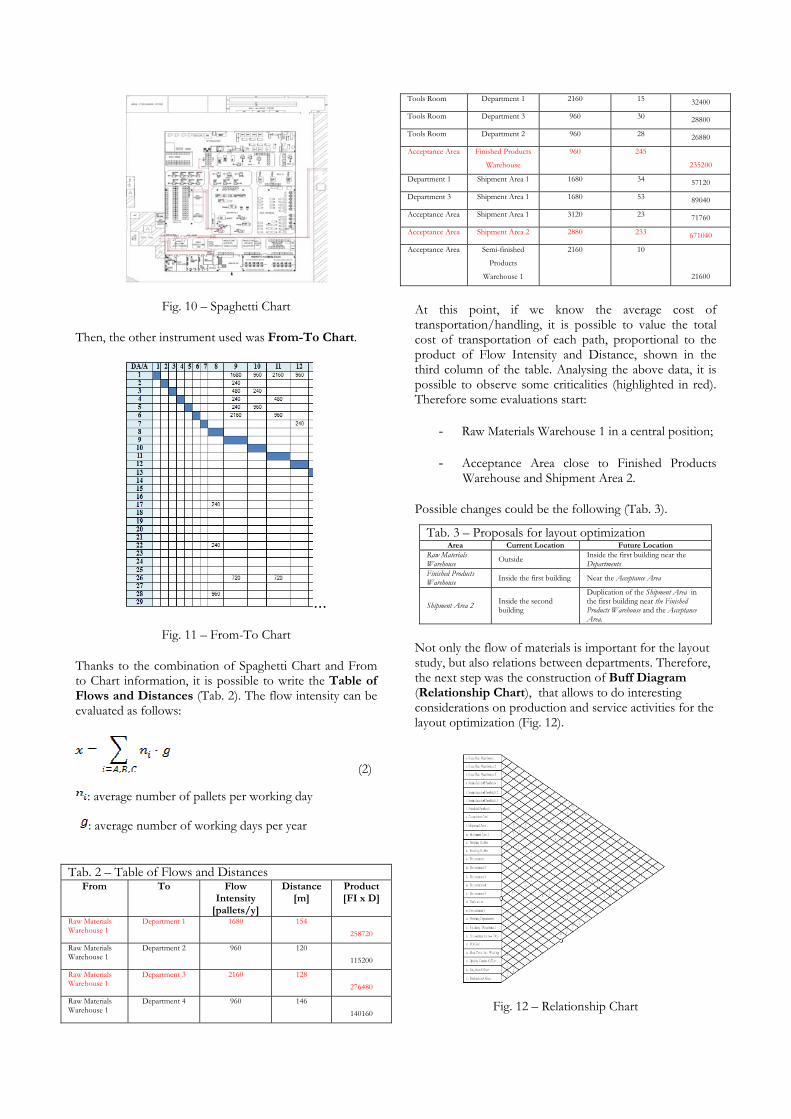
Fig. 10 – Spaghetti Chart
Then, the other instrument used was From-To Chart.
…
Fig. 11 – From-To Chart
Thanks to the combination of Spaghetti Chart and From to Chart information, it is possible to write the Table of Flows and Distances (Tab. 2). The flow intensity can be evaluated as follows:
(2)
: average number of pallets per working day
: average number of working days per year
Tab. 2 – Table of Flows and Distances From To Flow
Intensity [pallets/y]
Distance [m]
Product [FI x D]
Raw Materials Warehouse 1
Department 1 1680 154 258720
Raw Materials Warehouse 1
Department 2 960 120 115200
Raw Materials Warehouse 1
Department 3 2160 128 276480
Raw Materials Warehouse 1
Department 4 960 146 140160
Tools Room Department 1 2160 15 32400
Tools Room Department 3 960 30 28800
Tools Room Department 2 960 28 26880
Acceptance Area Finished Products
Warehouse
960 245
235200
Department 1 Shipment Area 1 1680 34 57120
Department 3 Shipment Area 1 1680 53 89040
Acceptance Area Shipment Area 1 3120 23 71760
Acceptance Area Shipment Area 2 2880 233 671040
Acceptance Area Semi-finished
Products
Warehouse 1
2160 10
21600
At this point, if we know the average cost of transportation/handling, it is possible to value the total cost of transportation of each path, proportional to the product of Flow Intensity and Distance, shown in the third column of the table. Analysing the above data, it is possible to observe some criticalities (highlighted in red). Therefore some evaluations start:
- Raw Materials Warehouse 1 in a central position;
- Acceptance Area close to Finished Products Warehouse and Shipment Area 2.
Possible changes could be the following (Tab. 3).
Tab. 3 – Proposals for layout optimization Area Current Location Future Location
Raw Materials Warehouse Outside Inside the first building near the
Departments Finished Products Warehouse Inside the first building Near the Acceptance Area
Shipment Area 2 Inside the second building
Duplication of the Shipment Area in the first building near the Finished Products Warehouse and the Acceptance Area.
Not only the flow of materials is important for the layout study, but also relations between departments. Therefore, the next step was the construction of Buff Diagram (Relationship Chart), that allows to do interesting considerations on production and service activities for the layout optimization (Fig. 12).
Fig. 12 – Relationship Chart

We can investigate several aspects:
- Management, supervision, control, collaboration;
- Noise, contamination and danger;
- Exchange of documents, devices and tools.
In general, the new conclusions about layout optimization, supported by the extended analysis, might be different from the first ones.
6. Tools Integration: FDR Index
In order to obtain a unique driver for our choices, we developed a new instrument, able to combine few traditional ones. Starting from the qualitative judgment scale of Relationship Chart, it is possible to shift to a quantitative one.
Fig. 13 – Relation Judgment scales Qual.-Quant.ve
At this point it is possible to combine information coming from different tools: Spaghetti, From-to and Relationship Charts. With the Table of Flows and Distances we have just combined the results of Spaghetti Chart and From-To Analysis. Then, we introduce a new index, FDR, to value the need to close two workstations or departments, given by the below product:
FDRi,j Index=Flow Intensity x Distance x Relation Judgment (3) i,j: pair of workstations or department
This new index permits to consider many aspects at the same time. Subsequently, we can rewrite From-To Chart. In each intersection From-To, we can put the relative FDR Index value. For example, FDR Index values for the critical situations previously analyzed, are shown in the table n. 4
Tab. 4 – FDR Indexes Evaluation for the major criticalities From To Product
[FI x D] Relation
Judgment FDR
Raw Materials Warehouse 1
Department 1 258720
0,75 19404
Raw Materials Warehouse 1
Department 3
276480 0,75
20736
Acceptance Area Finished Products
Warehouse 235200
0,25
5880
Acceptance Area Shipment Area 2 671040 0,25 16776
We can immediately recognize a change of priorities. In fact, while before, the most important aspect was the link between Acceptance and Shipment Areas, now the most important aspect is the link between Raw Material Warehouse and Department 3.
7. Validation through CRAFT
Finally, the layout modifications suggested have been compared to CRAFT results. The new layout configuration appears in the figure n. 14.
Fig. 14 – New layout configuration
Comparing the new layout configuration to the layout suggested by CRAFT, there is no difference (Fig. 15).
Fig. 15 – CRAFT layout configuration
8. Conclusion
Many advantages derive from the approach developed:
1. Average transportation time: 83,6’’/-40,39%;
2. Average path distance: 240m/-38,65 %;
3. Annual transport cost: €42800/-48,65%.
The methodological approach suggested and the new FDR Index adoption, allow optimizing layout of an industrial pant, in particular in the case of “process” configurations.
References
Cristopher M., 1998. Logistics and Supply Chain Management. Prentice Hall.
Falcone D., De Felice F., 2007. Progettazione e Gestione degli Impianti Industriali. Hoepli.
Mallick R.M., Gaudreau A.T., 1951. Plant Layout: planning and practice. John Wiley & Sons, Inc.
Mecklenburgh J.C., 1996. Plant Layout: A Guide to the Layout of Process Plant and Sites. Umi Pub.
Pareschi, Ferrari, Persona, Regattieri, 2002. Logistica integrata e flessibili. Progetto Leonardo.
Vignanti G., 2002. Manuale di Logistica. Hoepli.
Tompkins J.A. and others, 2010. Facilities Planning (Fourth Edition). John Wiley & Sons, Inc.
1
0,75
0,5
0,25
-0,5
-1