material design methodology for structural and microwave …
TRANSCRIPT

MATERIAL DESIGN METHODOLOGY FOR STRUCTURAL AND
MICROWAVE MULTIFUNCTIONAL COMPOSITE LAMINATE SYSTEMS
by
Raymond McCauley
A thesis submitted to the Faculty of the University of Delaware in partial
fulfillment of the requirements for the degree of Master of Science in Mechanical
Engineering
Fall 2013
© 2013 Raymond McCauley
All Rights Reserved

MATERIAL DESIGN METHODOLOGY FOR STRUCTURAL AND
MICROWAVE MULTIFUNCTIONAL COMPOSITE LAMINATE SYSTEMS
by
Raymond McCauley
Approved: __________________________________________________________
Michael Keefe, Ph.D.
Co-Advisor in charge of thesis on behalf of the Advisory Committee
Approved: __________________________________________________________
Shridhar Yarlagadda, Ph.D.
Co-Advisor in charge of thesis on behalf of the Advisory Committee
Approved: __________________________________________________________
Suresh G. Advani, Ph.D.
Chair of the Department of Mechanical Engineering
Approved: __________________________________________________________
Babatunde A. Ogunnaike, Ph.D.
Dean of the College of Engineering
Approved: __________________________________________________________
James G. Richards, Ph.D.
Vice Provost for Graduate and Professional Education

iii
ACKNOWLEDGMENTS
I would like to thank you to my advisors who have been excellent in giving me
direction and advice in my work at the Center for Composite Materials.
Support provided by the Office of Naval Research (ONR) under grant
N00014-10-1-0325. Electromagnetic modeling and measurements made by PhD
candidate Peter Pa at University of Delaware, Department of Electrical and Computer
Engineering. Further electrical insight advised from Mark Mirotznik, also Department
of Electrical and Computer Engineering.
To my family and relatives who inspired me in pursuing my career in
engineering. Especially my grandfather, Virgil McDonald , as without his guidance
and early involvement, I would not be where I am today.

iv
TABLE OF CONTENTS
LIST OF TABLES ........................................................................................................ vi
LIST OF FIGURES ...................................................................................................... vii ABSTRACT ................................................................................................................... x
Chapter
1 INTRODUCTION .............................................................................................. 1
1.1 Multifunctional Composite Materials with Radio Frequency
Functionality Applications ........................................................................ 1
1.2 Frequency Selective Surfaces .................................................................... 2 1.3 Structural Composite Laminates and Sandwich Structures ....................... 4
1.4 Thesis Outline ............................................................................................ 6
2 LITERATURE REVIEW AND PRIOR RESEARCH ....................................... 7
2.1 Mechanical Design and Theory ................................................................. 7
2.2 Electromagnetic Design and Current Approaches .................................... 8
2.3 Multifunctional Structural Composites with Electromagnetic
Functionality .............................................................................................. 9 2.4 Synopsis and Key Themes ....................................................................... 13
3 MATERIALS AND PROCESSING ................................................................ 16
3.1 Baseline Structural Composite Materials ................................................ 16 3.2 Frequency Selective Surface Materials and Relevant Substrates ............ 17
3.2.1 Substrate and Material Selection for Electromagnetically
Functionalized Layers ................................................................. 17 3.2.2 Frequency Selective Surface Patch Selection and Design .......... 19
4 LAMINATE SAMPLE FABRICATION AND TESTING PREPARATION . 24
4.1 Baseline Composite Processing ............................................................... 24 4.2 Substrates, Frequency Selective Surface Design, and Processing .......... 26 4.3 Testing Methods and Setup ..................................................................... 29
4.3.1 Adhesion Comparison Testing .................................................... 31

v
4.3.1.1 Floating Roller Peel Sample Fabrication and Testing
Description ................................................................... 32
4.3.1.2 Short Beam Shear Sample Fabrication and Testing
Description ................................................................... 34
4.3.2 Mechanical Property Testing and Measurement ......................... 35
5 LAMINATE MECHANICAL TESTING RESULTS ...................................... 37
5.1 Adhesion Comparison of Baseline Composite and Printed Circuit
Board Substrate Variants ......................................................................... 38
5.1.1 Peel Strength Comparison ........................................................... 38
5.1.2 Short Beam Shear Strength Comparison ..................................... 44
5.2 Mechanical Property Testing and Comparison of Baseline Composite
and Printed Circuit Board Substrate Variants ......................................... 50
5.2.1 Tensile Properties and Failure Discussion .................................. 50 5.2.2 Compressive Properties and Failure Discussion ......................... 54
6 SANDWICH DESIGN AND TESTING FEATUREING AN EMBEDDED
FREQUENCY SELECTIVE SURFACE LAYER .......................................... 60
6.1 Materials and Processing for a Sandwich Panel with Frequency
Selective Layer ........................................................................................ 60
6.2 Core Material Selection and Sandwich Beam Fabrication ...................... 64 6.3 Testing and Results .................................................................................. 66
7 CONCLUSION AND FUTURE WORK ......................................................... 70
7.1 Conclusion ............................................................................................... 70 7.2 Future Work ............................................................................................. 71
7.2.1 Conductive Materials and Substrates .......................................... 71 7.2.2 Improvements in Testing ............................................................. 73 7.2.3 Alternative Electromagnetic Structures ....................................... 75
REFERENCES……………………………………………………………………......77
Appendix
A RADIO FREQUENCY MATERIALS, MODELING, AND TESTING
NOTES ............................................................................................................. 81

vi
LIST OF TABLES
Table 5.1: Fabricated Composite Panel Specifications Used in Testing ...................... 37
Table 5.2: Baseline Substrate Average Peel Strength ± One Standard Deviation ........ 39
Table 5.3: Pyralux™ Peel Strength and Standard Deviation ....................................... 40
Table 5.4: Short Beam Shear Baseline Substrate Strength and Standard Deviation .... 44
Table 5.5: Short Beam Shear Pyralux™ Substrate Strength and Standard Deviation . 46
Table 5.6: Tensile Properties of Baseline Composite and Pyralux™ System .............. 51
Table 5.7: Tensile Properties Normalized by Fiber Volume Fraction ......................... 52
Table 5.8: Compressive Properties and Percent Difference from Baseline ................. 55
Table 6.1: Composite Sandwich Materials List and Thicknesses ................................ 65
Table 6.2: Three Point Bending Stiffness and Failure Loads ....................................... 67

vii
LIST OF FIGURES
Figure 1.1: Frequency Selective Surface with Examples Patterns ............................... 3
Figure 1.2: USS Radford Mast with Frequency Selective Sandwich Structure [1] ..... 4
Figure 1.3: Sandwich Beam in Bending ....................................................................... 5
Figure 2.1: Dual Anechoic Chamber for Measuring Microwave Response with
30x30cm Composite Test Panel ................................................................ 9
Figure 3.1: Constituent Material Design and Testing Flow Working Down From
Baseline Composite, the Pyralux™ Constituent Materials, and then
the Full FSS ............................................................................................. 19
Figure 3.2: Frequency Selective Surface Design Flow .............................................. 20
Figure 3.3: FSS Etching Procedure ............................................................................ 21
Figure 3.4: Etched FSS layer, Composite Test Materials, and Final FSS Sandwich . 23
Figure 4.1: Layup and Bagging Featuring 1.25cm (0.5 inch) Thick Caul Plates ....... 25
Figure 4.2: Prepreg Run Cycle ................................................................................... 26
Figure 4.3: FSS Square Patch Geometry .................................................................... 28
Figure 4.4: Example C-scanned Panels ...................................................................... 30
Figure 4.5: Testing Scheme; First Comparing Adhesion Failure before
Characterizing Mechanical Properties ..................................................... 31
Figure 4.6: Interlaminar Failure Modes with Failure Surface Shown in Red ............ 32
Figure 4.7: Floating Roller Peel Specimen and Setup ................................................ 33
Figure 4.8: Example Floating Roller Peel Failure Surfaces Taken with Camera ...... 34
Figure 4.9: Short Beam Shear Testing Setup ............................................................. 35
Figure 5.1: Baseline Material Peel Strength ............................................................... 39

viii
Figure 5.2: Baseline Floating Roller Peel Failure Surface ......................................... 41
Figure 5.3: Copper Peel Failure Surface Comparison ................................................ 42
Figure 5.4: Kapton® Peel Failure Surface Comparison ............................................. 43
Figure 5.5: FSS Floating Roller Peel Failure Surface ................................................ 43
Figure 5.6: Short Beam Shear Strength Comparison ................................................. 45
Figure 5.7: Short Beam Shear Baseline Failure Imaging ........................................... 47
Figure 5.8: Short Beam Shear Failure Imaging Pyralux ............................................ 48
Figure 5.9: Baseline Short Beam Shear Failure Micrograph 10X .............................. 48
Figure 5.10: Untreated Copper and Kapton Short Beam Shear Micrographs 10X ...... 49
Figure 5.11: FSS Short Beam Shear Micrograph 10X ................................................. 50
Figure 5.12: Failed 8 Layer Tension Specimens .......................................................... 53
Figure 5.13: Failed 2 Layer Tension Specimens .......................................................... 54
Figure 5.14: Compressive Strength .............................................................................. 56
Figure 5.15: Compressive Modulus ............................................................................. 57
Figure 5.16: Failed Baseline Compression Samples .................................................... 58
Figure 5.17: Compression Baseline Failure Comparison ............................................. 59
Figure 5.18: Compression FSS Failure Comparison (in order of decreasing patch
area) ......................................................................................................... 59
Figure 6.1: Sandwich Structure and Cross-Section Geometry ................................... 61
Figure 6.2: Three Point Bend Setup ........................................................................... 65
Figure 6.3: Load vs. Extension Response of Sandwich Beams ................................. 68
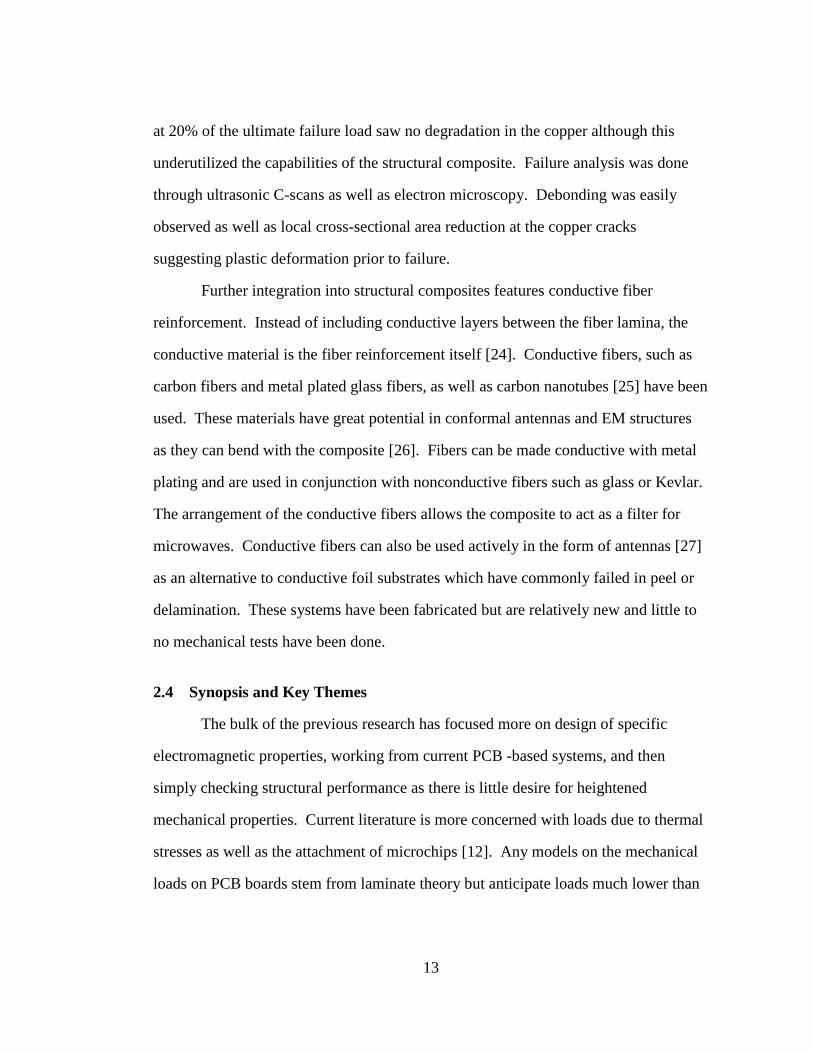
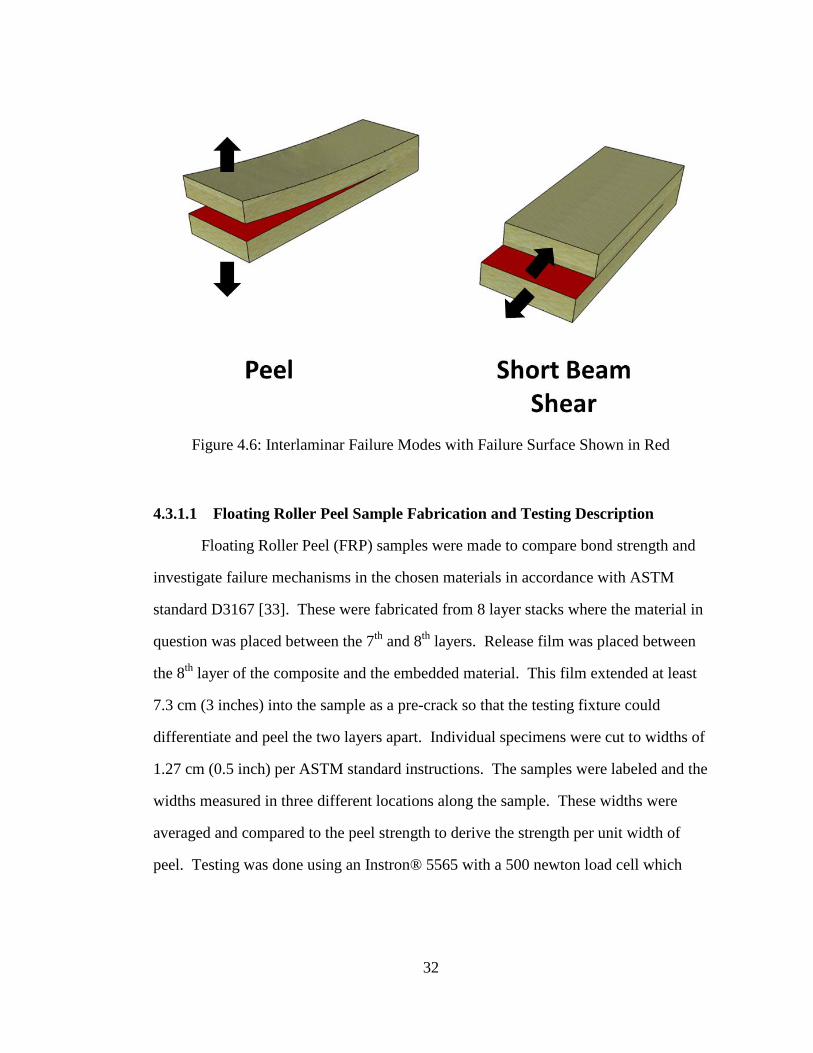
Figure 6.4: Three Point Bend Failure Images ............................................................ 69
Figure 6.5: Sandwich Specimen Failure Viewed from Side ...................................... 69
Figure 7.1: Methods of Conductive Ink Printing ........................................................ 73

ix
Figure 7.2: Composite Cross Section Schematic with Asymmetric FSS Placement . 74
Figure 7.3: High Impedance Surface with Drilled Vias ............................................. 76
Figure A.1: Printed Circuit Board Materials and Composite System, Signal Loss
and Tensile Strength ................................................................................ 81
Figure A.2: HFSS Model FSS Unit Cell .................................................................... 82
Figure A.3: HFSS Simulation Result of Transmission Varying Frequency .............. 83
Figure A.4: FSS Simulation Sweep Results ............................................................... 85

x
ABSTRACT
Composite multifunctional materials are one way of hybridizing two material
functions into one. One such application is in composite structures with
electromagnetic (EM) functionality. Independently, mechanical and EM design
methodologies exist, but there are limited design methodologies for making systems
that combine both functionalities.
This research focuses on a design methodology for material selection
involving a laminate-composite system with both structural and electromagnetic
functionalities. One such application is for antenna radomes and composite
deckhouses of naval structures that protect microwave equipment from external loads
as well as provide electromagnetic functionality. These are typically sandwich
structures which are optimized for high stiffness and low weight. This work shows,
through systematic testing and characterization of failure, that the inclusion of an
electromagnetically tuned layer in this system does not adversely affect the
mechanical properties. Design and fabrication can be done with appropriate
consideration of both regimes to produce a multifunctional material that is structurally
sound and electromagnetically functional.

1
Chapter 1
INTRODUCTION
Multifunctional materials offer a means of hybridizing two or more
performance regimes into one material with the added functionality of both into a
single system. Particular attention has been devoted to structural materials with
electromagnetic (EM) functionality. Currently, the design of composite sandwich
structures [1] [2] [3] [4]and their mechanical characterization [1] [4] is well studied.
The design of EM functionalized materials is also a mature field. Embedding layers
within the laminate material imparts electromagnetic functionality, allowing it to
behave differently when exposed to microwave radiation [6] [7] [8]. Although
standards exist to separately design and test the structural and electrical [8] aspects of
laminates, there are few design methodologies combining the two. This research
provides a design and testing methodology to aid in a material selection for a certain
class of laminate-composite structures by demonstrating that, for the system studied,
the addition of an EM functionalized layer within the composite does not seriously
degrade the structural performance.
1.1 Multifunctional Composite Materials with Radio Frequency Functionality
Applications
Composite materials are commonly used in high strength, low weight
applications. Their various weaves and fiber alignments can be tailored to generate
the desired mechanical properties for the given application. Such applications include
radomes and deckhouses for naval structures. Another benefit over traditional metal

2
materials for naval structures is that composite materials consisting of fiber-reinforced
plastic laminates do not suffer corrosion in the marine environment as quickly or as
aggressively as do traditional metal materials. This could translate to less maintenance
on these structures and further motivate the use of composites for naval structures.
1.2 Frequency Selective Surfaces
Multifunctional composite materials with electromagnetic functionality can be
made with the addition of various conductive layers within the laminate. Electrical
pathways can operate much like circuits to provide active sensing and embedded
electronics. Other applications are passive, giving composite panels a unique
electromagnetic profile over the microwave spectrum. An example of a passive
application is a Frequency Selective Surfaces (FSS) which can be tuned to filter out
specific frequencies by use of periodic conductive patches. Figure 1.1 shows an
example of this surface including an embedded conductive pattern. When intercepted
by electromagnetic waves, the conductive patches obtain a minute electrical current.
This induces a polarity to the patches that resonates depending on the frequency of the
wave. Patch geometry and spacing can be varied to tune this resonant frequency
where the patches behave more like a ground plane and can reflect incoming
electromagnetic waves [5]. How well this is done depends on patch shape as well as
its size and periodicity. The included research can be applied to a wide range of FSS
designs and tuned frequencies. The theory for predicting the electromagnetic response
of these surfaces is well known and a variety of computer modeling programs are
available [5] [9]. Research in this field stems mostly from traditional methods using
Printed Circuit Boards (PCB). However these methods are typically not well
optimized for structural properties. A greater emphasis on the structural regime is

3
critical when designing these multifunctional systems that must be able to function
electromagnetically as well as structurally.
Figure 1.1: Frequency Selective Surface with Examples Patterns
Materials, such as the glass fiber reinforced composite materials, can be
transparent to microwave signals and thus function well as radomes. Carefully
designed composite materials allow the desired signals to reach antennas and radar
equipment as well as protecting them against mechanical loads such as wind and blast
loads from ship weapons. An example of this can be seen in Figure 1.2 showing a
schematic of the mast of the USS Radford. Laminate construction allows the addition
of layers that can be tuned to affect the transmittance of radio frequencies. High
strength materials, coupled with unique EM signatures, can be used to make
multifunctional composites to improve the efficiency of radomes.

4
Figure 1.2: USS Radford Mast with Frequency Selective Sandwich Structure [1]
1.3 Structural Composite Laminates and Sandwich Structures
This work focuses on composite laminates that are used in making sandwich
structures. Testing focus in this thesis relates to studying the adverse effects on the
mechanical properties caused by embedding an FSS layer within the composite face
sheets of a sandwich structure. Through characterizing the mechanical effect of
including an electromagnetically functionalized substrate layer in the laminate-
composite system, one can compare materials for selection. Investigating relevant
mechanical effects caused by modifying various parameters of the PCB processing
used to create the FSS material, should also give insight into failure modes.
Sandwich composite beams for structural applications are typically designed to
be able to support high bending loads while being extremely light. How well they do

5
this depends on the materials used as well as the geometry of the sandwich. Figure 1.3
shows a typical sandwich cross section loaded in bending. Here the face sheets are
loaded in tension and compression while the core transfers the load to each using
shear. Adding an FSS layer will affect the material properties of the composite face
sheets; thus the need to focus on face sheet mechanical properties. Tests first focus on
adhesion between the composite laminate with added FSS materials versus the
baseline without FSS materials. This leads into compressive and tensile properties
which are used in predicting the sandwich structure’s mechanical properties.
Figure 1.3: Sandwich Beam in Bending
where:
= face sheet modulus
= core shear modulus
= face sheet strength
= core shear strength
= area moment of inertia

6
1.4 Thesis Outline
This work discusses the material-selection design and testing of passive
electromagnetic application, created by embedding an FSS within a composite
laminate sandwich structure. In Chapter 2 both the mechanical and the
electromagnetic regimes are investigated. Then work in relevant multifunctional
design for composites is presented. A candidate FSS substrate layer is chosen in
Chapter 3 and mechanical properties are inspected after the PCB processing used to
make it into an FSS. Chapter 4 describes the actual laminate fabrication and testing
with Chapter 5 focusing on summarizing the test results. Particular attention was paid
to adhesion and shear testing to look at the bond between the substrate and the
surrounding structural composite. Mechanical properties are measured comparing the
baseline composite to a few substrate cases as well as a variety of FSS patch
configurations. Chapter 6 describes how the data was used to make a multifunctional
composite sandwich beam with test results compared to a purely composite baseline
without an FSS layer. Chapter 7 summarizes the test data and shows that the inclusion
of this particular FSS layer into the designed multifunctional system does not seriously
degrade the structural performance. Understanding layer-to-layer adhesion can give
much insight into how these substrates interact within a given composite system. This
is critical for as a design methodology for this and other multifunctional laminate
material systems.
7
Chapter 2
LITERATURE REVIEW AND PRIOR RESEARCH
Design of multifunctional composite materials stems from previous work in
electrical design and structural composites. These two methodologies are well
understood independently and there is extensive literature on their design. However,
little work has been done hybridizing the two and providing a design methodology that
results in little or no loss in mechanical and electromagnetic properties. Current
research focus has been on simple model systems looking at specific applications or
attributes in an attempt to characterize and measure electrical and structural properties.
2.1 Mechanical Design and Theory
Composite sandwich structures are a typical means of attaining high stiffness
with reduced weight. The theory and methodology for the design and fabrication of
composite sandwich panels is well developed [1] [3] [4] [10]. Yet some applications
are not only mechanically driven but also electrically driven. Good examples of these
are radomes for naval vessels which protect antennas and electrical hardware from
wind and blast loads from ship artillery [11]. Structural radome design is well known
but limited to radio transparent composite surfaces without embedded tuned EM
layers. A design and testing methodology is necessary to effectively hybridize these
design paradigms in order to more effectively make these multifunctional composite
materials.

8
2.2 Electromagnetic Design and Current Approaches
Much of FSS work stems from traditional PCB board fabrication. The
electromagnetic theory is mature for the design of these and fabrication methods are
done with high consistency. Conductive pathways, or in this case patches, are made
through etching away conductive copper layers [5]. Materials used in making PCB’s
are tuned specifically for EM response and are readily available in the market. Most
designs are for flat boards with little concern for structural properties other than
thermal loads due to heat dissipation of microchips [12].
Design criteria for electromagnetic properties depend on geometry and
materials used. For geometry the patch shape can dictate how effective the FSS is at
resonating with a given frequency. Patch size, spacing, and orientation are varied to
tune the materials to specific frequencies. The patches must also be conductive and
the dielectric properties of the surrounding composite known in order to make
accurate models. The electromagnetic response for these can be predicted
theoretically [5] [9] as well as simulated using Finite Element Analysis (FEA)
software. Once such FEA software package for this is HFSS developed by Ansys®
which is used for designing the FSS geometries studied in this work. Experimentally,
the electromagnetic response of a board can be measured using an anechoic chamber
capable of measuring transmittance as well as reflectance as seen in Figure 2.1. This
is often used to confirm EM theory which is very sensitive to material properties and
geometry.

9
Figure 2.1: Dual Anechoic Chamber for Measuring Microwave Response with
30x30cm Composite Test Panel
2.3 Multifunctional Structural Composites with Electromagnetic Functionality
Conductive layers have been added to composite materials to give added
electrical functionality. One such application has been for active sensing. Stanford
University produced a SMART layer featuring the same conductive pathways and
polymer film with piezo-electric sensors [13]. Here a flexible copper-clad Kapton was
etched with the desired circuit and placed within the laminate stack. This material is
commonly used in PCB fabrication. The composite laminate featured a prepreg
system which was processed within autoclave conditions. Extensive tests were done
to measure structural properties focusing on interlaminar strength including short
beam shear, lap shear, and flatwise tension. These preliminary tests were done to look
at bond effects before the actual SMART layer was tested in compression and tension.

10
It was found that there was no reduction in structural properties and that embedding
surface treated layers slightly improved interlaminar properties. This emphasizes that
attention to interlaminar bonding when adding these layers are critical to maintaining
mechanical properties.
Additional active electromagnetic applications are antennas. These are
extensively used by aircraft and vehicles for communication as well as sensory
applications. With the weight reduction and improved strength that accompanies
composite fabrication, a means of integrating antennas into composites have been
developed. One such composite system is cyanate ester resin coupled with glass fiber
reinforcement to produce a strong composite system that is low loss when placed in
front of a radiating element such as an antenna [14]. Common mechanical failure is
noted to be within the interlaminar region due to adhesion issues and stress
concentrations from embedded materials. Structural design usually revolves around
sandwich and multi-layered construction [15] [16]. Inner layers function structurally
while outer, radio permeable, layers are coupled with antennas.
The core material, within a composite sandwich structure, is one such location
to embed an electromagnetically tuned layer. Some guidelines for this design, from an
EM standpoint, exist in literature although focus has only been on electrical design
[17]. Choi designed a low-observable radome prototype with a microwave filter layer
placed in the mid-plane of the sandwich within the core [18]. The filter was made
from etched aluminum foil bonded to a polyimide film to filter out a specific
microwave frequency. This layer was bonded to the foam core using an epoxy
adhesive before adhering the composite face sheets which were made from either E-
glass or aramid fiber reinforced epoxy prepreg. Mechanical testing focused on impact

11
(ASTM D7136). Sandwich panels were compared structurally as well as
electromagnetically by comparing the microwave response of the panel before and
after impact. Response was measured using antennas to find microwave transmittance
and absorbance. Samples failed similar to the baseline composite and measurements
focused more on the impact’s effect on EM properties. Similar work was done with
the electromagnetically tuned layer placed within the core-to-face sheet region with
similar focus on testing impact effects [19].
Other than impact, composite sandwich structures are also loaded in bending
during their lifetime. One such scenario added a nano-clay material to tailor dielectric
properties [20]. Mechanical testing was done through 3-point bend. Strength was
related to the amount of nano-clay used as well as a comparison of the baseline
sandwich panel to the one with the added layer. Results found that the flexural
strength does diminish with the addition of this specific electromagnetic material
within the sandwich panel.
Conductive printable ink has been used to produce an FSS within structural
composite material [21]. Periodic conductive patches were screen printed directly
onto a composite glass prepreg before being placed within the composite stack and
bagged for cure. The microwave response was measured before doing short beam
shear testing (ASTM D2344). A slight decrease in properties was measured versus the
pure composite baseline without the FSS pattern. Failure was observed as cracks and
debonding within the embedded layer and the surrounding composite.
There has been some research focusing on the structural properties of copper
foil patches placed within composite laminates [22]. These patches are analogous to
FSS design although, in this case, were not arranged with EM properties in mind but

12
rather mechanical properties. This study was done to observe the mechanical effects
of having an embedded copper patch with various surface treatments. Here the
laminate stack was made using Vacuum Assisted Resin Transfer Molding (VARTM)
to infuse a vinyl ester resin into a woven E-glass stack containing the copper patches.
The copper patches were placed midplane and a variety of tests were done including
tension, compression, and flexural. Only a small reduction in modulus occurred but a
large reduction in strength was observed. Strength reduction was most noticeable in
compression and flexural testing. This can be related to the size of the patches as well
as the surface treatment used on the copper relating directly to bond strength. Here, a
strong correlation exists between how well the added material bonds, the size of the
inclusion, and how it performs in strength.
Within composite loading regimes, the strain to failure of the composite is
often much higher than that of the embedded conductive substrate. This becomes a
concern as the loads the composite experiences in service can detrimentally deform a
conductive substrate such as copper. This can lead to premature failure, both
electrically and to the copper-to-composite bond. In one study, a glass fiber composite
specimen contained an embedded electrical grade copper strip within the midplane
[23]. Electrical contacts were placed on either end of the copper and the sample was
tested in static failure as well as tensile cyclic loading. The sample was then loaded
statically and failed in tension as well as cyclical loading at loads lower than failure
load of the composite. For static loading, the composite failed first but the ductile
copper stayed intact and maintained a conductive pathway. However, under cyclic
loading, the copper failed first and caused debonding from the surrounding composite
as well as cracks in the copper. This resulted in a loss of conductivity. Samples tested
13
at 20% of the ultimate failure load saw no degradation in the copper although this
underutilized the capabilities of the structural composite. Failure analysis was done
through ultrasonic C-scans as well as electron microscopy. Debonding was easily
observed as well as local cross-sectional area reduction at the copper cracks
suggesting plastic deformation prior to failure.
Further integration into structural composites features conductive fiber
reinforcement. Instead of including conductive layers between the fiber lamina, the
conductive material is the fiber reinforcement itself [24]. Conductive fibers, such as
carbon fibers and metal plated glass fibers, as well as carbon nanotubes [25] have been
used. These materials have great potential in conformal antennas and EM structures
as they can bend with the composite [26]. Fibers can be made conductive with metal
plating and are used in conjunction with nonconductive fibers such as glass or Kevlar.
The arrangement of the conductive fibers allows the composite to act as a filter for
microwaves. Conductive fibers can also be used actively in the form of antennas [27]
as an alternative to conductive foil substrates which have commonly failed in peel or
delamination. These systems have been fabricated but are relatively new and little to
no mechanical tests have been done.
2.4 Synopsis and Key Themes
The bulk of the previous research has focused more on design of specific
electromagnetic properties, working from current PCB -based systems, and then
simply checking structural performance as there is little desire for heightened
mechanical properties. Current literature is more concerned with loads due to thermal
stresses as well as the attachment of microchips [12]. Any models on the mechanical
loads on PCB boards stem from laminate theory but anticipate loads much lower than

14
those experienced in structural composites. In order to apply the same processing of
PCB materials to structural composites, materials need to be reexamined in higher
strength structural regimes.
It can be seen from literature that poor adhesion degrades shear properties as
well as compression properties. This is critical for composite sandwich structures as
loads often transfer through the composite lamina through shear. The face sheets of
the sandwich structure also experience tension and compressive loads when the
sandwich experiences bending loads. These loading regimes are rarely studied in PCB
materials and must be revisited for structural composites. Through focusing on these
mechanical effects, one can develop a design methodology appropriate for both EM
and structural regimes. This motivates a hybrid approach stemming from both PCB
and mechanical design approaches.
Materials used in this research stems from both structural composites and PCB
materials. The composite system must be non-conductive and allow microwave
radiation to pass freely. This motivates the use of glass fiber reinforced composites
with low loss resins systems such as cyanate ester. Conductive substrates must also be
chosen. Copper-clad films are commonly used in multilayer PCB boards and are
made to be easily etched and bonded to surrounding lamina. As seen from the
literature, copper-clad Kapton films are commonly used in fabricating
electromagnetically functional layers. Mechanical adhesion of the EM layer to the
surrounding composite layers greatly depends on surface treatment and processing of
the film and foil substrates. Since the core in a multifunctional composite sandwich
structure must have low loss in the electromagnetic regime, this motivates the use of a

15
honeycomb structure; this type of core material is commonly used in aircraft structures
featuring antennas and radomes.

16
Chapter 3
MATERIALS AND PROCESSING
Design of multifunctional structures starts with materials that must satisfy both
structural and electromagnetic requirements. A variety of materials exist for use in
structural composites as well as PCB boards. The approach in this work focuses on
one such suitable composite system and PCB material.
3.1 Baseline Structural Composite Materials
Composite material selection was driven by design requirements, both
electrical and mechanical. The prepreg system chosen for this research was the
Tencate™ BTCy-1 featuring a cyanate ester resin and a 6781 8-harness satin S-glass
woven fabric. This system performs well structurally and is designed for use in
radomes [28]. This system is preimpregnated with resin and thus does not require
resin infusion. This is beneficial as the FSS layer used is impermeable to resin flow
and would interfere with infusing the dry fiber. Prepregs can also be processed within
autoclaves where the high pressures can minimize the size of any voids that may occur
within the part.
To be utilized for electrical applications, the composite system must also have
an established dielectric constant and low loss. Each material has its own dielectric
property which can affect the electromagnetic response of the designed FSS. Loss
refers to the signal strength lost as an electromagnetic wave passes through the
material due to impedance mismatch and signal reflection. Fiber Volume Fraction

17
(FVF) content is also a concern as varying percentages of resin to fiber content can
change the dielectric constant. This has been seen in EM measurements and models
have been adapted to feature fiber volume fraction to calculate dielectric properties
[5], [29]. Autoclave processing assists in keeping the FVF and in turn the mechanical
properties and dielectric properties consistent.
3.2 Frequency Selective Surface Materials and Relevant Substrates
The substrate on which the FSS is made must serve various purposes. As
mentioned before, it provides conductive patches which are electrically isolated from
each other and thus tuned to the desired microwave frequency. They must also be
fixed relative to each other and maintain a constant spacing. Finally, the substrate
needs to show good structural properties and not be mechanically isolated from the
surrounding composite. Industry offers many materials that fit this criteria and the
material chosen for this work is described in the following sections.
3.2.1 Substrate and Material Selection for Electromagnetically Functionalized
Layers
In order to tune and give electromagnetic functionality, the material needs a
conductive layer or patches of a conductive material. There are a variety of metals
available with good electrical conductivity. Traditional PCB fabrication uses copper
foil due to ease of etching and surface treatments. This material is extremely
conductive and readily available. Copper foil comes on a variety of substrates
including polymer films.
In order to be properly etched the copper must be bonded to another substrate.
This fixes the patches in position relative to each other. For this purpose standard
polyimide film Kapton bonded to a copper foil was used. Dupont® produces a system

18
known as Pyralux™ which also features treatment to improve bonding for both the
copper as well as the Kapton. The Pyralux™ LF9110D was chosen for this research
and consists of a 28.4 gram (1 oz.) weight copper bonded to cm (1 mil.)
thick Kapton. The copper is electrodeposited to produce a roughened surface,
increasing surface area and allowing it to adhere well mechanically to most adhesives
and resins. The Kapton surface is corona treated by use of plasma to improve surface
activation energy shown to provide excellent chemical adhesion.
Before working with the actual Pyralux® film, an assessment was made of the
constituent materials. This included copper and Kapton without the surface treatments
for adhesion. For this, a 1oz. copper foil made by Oak Mitsui was chosen featuring a
drum side with lower surface roughness, as well as a matte finish side with higher
surface roughness. This copper foil system is marketed for applications where
adhesion is not a concern for one of the surfaces. Kapton film made by Richmond
Aircraft Products®, model UHT-750, was used as the untreated Kapton variant. Oak
Mitsui also makes a treated copper foil, DBT-III, similar to the copper featured on the
Pyralux®. Dupont™ also makes a corona treated Kapton, FPC200, which is the same
Kapton film used in the Pyralux™. From these baseline materials, bond properties
can be assessed working from the ground up emphasizing surface treatments. Figure
3.1 lists the material testing steps used in this work, proceeding from the baseline pure
materials to those used in the FSS layer.

19
Figure 3.1: Constituent Material Design and Testing Flow Working Down From
Baseline Composite, the Pyralux™ Constituent Materials, and the Full FSS
3.2.2 Frequency Selective Surface Patch Selection and Design
Design criteria for electrical properties depend on geometry and materials
used. Patch size, spacing, and orientation can be tuned to specific microwave
frequencies. The patches must also be conductive and the dielectric properties of the
composite known in order to make accurate models. Electromagnetic properties are

20
taken into account during material selection as well as measured in the anechoic
chamber for use in modeling.
The effect of the FSS pattern chosen on the mechanical properties needs to be
easily tested, and the FSS pattern chosen needs to be measured electrically within a
relevant microwave frequency range. Solid square patches function well as an FSS
and are geometrically orthogonal as is the woven glass reinforcement of the
composite. The sizes of the patch and spacing also are suited for K-band microwave
signals. A simulation sweep was done varying the patch sizes and spacings. This was
done using the Finite Element Analysis software HFSS at the University of Delaware
Department of Electrical and Computer Engineering. The quality as an FSS was then
determined based on the ability to filter out a measurable frequency as well as having
low loss when out of frequency. Representative patch geometries were then chosen to
be fabricated and tested. This procedure is outlined in Figure 3.2.
Figure 3.2: Frequency Selective Surface Design Flow
Processing for the Pyralux® film to make an FSS layer followed standard
industry practices for PCB materials. This was outsourced to Fineline Circuits Inc.
who specialize in PCB etching. First the copper side of the film was coated with a

21
photoresist. This photoresist reacts when exposed to UV light and then can be
dissolved off. A transparent filter with the FSS design in opaque ink was placed over
the photoresist allowed only the light to reach portions of the resist to be removed.
Once this was completed the film was placed in an etchant solution that easily
dissolves copper. Here the copper not covered by the resist was removed leaving only
the copper for the FSS design behind. Remaining resist was then removed leaving
behind the complete FSS film. Diagrams for this methodology can be seen in Figure
3.3. The FSS layer was then placed within composite laminate stacks and cured under
autoclave pressure. Final manufactured samples are shown in Figure 3.4 featuring the
FSS layer, FSS embedded in multilayer composite, and final sandwich structure.
Figure 3.3: FSS Etching Procedure

22
Geometric design for the FSS was split into two parameters; the size of the
patches and how they were spaced within the gage section. For these tests 2, 3, and 4
mm patch sizes were selected. Spacing was designated by the largest unit cell which
fit within the 2.54 cm (1 inch) gage section to be used in mechanical tests. Spacings
chosen allow for the thickness of the diamond saw blade used to cut the composite.
This makes sure that the patches are aligned with the samples and are the same
distance from the cut edges after each sample is cut. Each patch size and spacing
scenario was modeled using HFSS™ to predict the EM properties and how well it
operates as an FSS. The data for this is available in the Appendix. Some of the
scenarios were also selected so that they would both have the same area of copper but
represent different sizes and spacing of patches.
The final FSS designs were tested and used in a composite sandwich design.
Having two face sheets means there can be two FSS surfaces making the sandwich
stack symmetric. In electrical applications, one can use two different FSS’s to be able
to filter out two frequencies [5]. Here the FSS was placed within the midplane of each
face sheet. Two layer face sheets were chosen because they could contain the FSS
layer within the midplane as well as fail at a lower load then the chosen core material.
The core must also be low loss, motivating the choice of a honeycomb core which was
measured in the anechoic chamber. Figure 3.4 shows the final etched FSS layer as
well as composite panels with the layer embedded.

23
Figure 3.4: Etched FSS layer, Composite Test Materials, and Final FSS Sandwich

24
Chapter 4
LAMINATE SAMPLE FABRICATION AND TESTING PREPARATION
Composite fabrication and handling followed procedures specified by the
material supplier. All properties were measured in the warp direction of the fiber and
plies were flipped to make each composite panel midplane symmetric. Composite
samples, featuring EM substrate layers, proceeded from the pure composite baseline
testing. Due to the laminate construction of PCB materials, the EM substrates were
added to the composite stack within the interlaminar regions.
4.1 Baseline Composite Processing
Composite processing for this research followed the standard procedures on
the datasheet supplied by Tencate® [30]. The prepreg was handled and cut to size
after reaching room temperature to eliminate water condensation on the prepreg
surface. Laminate stacks were consolidated using a roller to remove large air pockets.
It is at this stage that the electromagnetically functionalized substrate to be tested was
placed within the lamina. Since the 6781 8 harness satin weave is not balanced, the
warp and weft directions were aligned for each lamina. Plies were also flipped about
the mid-plane of the complete stack to prevent any warping that could be caused from
asymmetry. Mechanical testing focused on properties in the warp direction for
consistency. For the thick panels, every 8 layers of the prepreg were debulked under
vacuum before being combined into the complete laminate stacks.

25
Processing for cure featured elevated temperature and pressure from an
autoclave made by Thermal Equipment Corporation (TEC). On the the autoclave
table surface was placed a release film before laying up the prepreg layers. Once the
composite prepreg was placed, another layer of release film was used to cover the
entire part followed by glass fiber tows placed at each corner of the prepreg to allow
air flow out of the release film pocket. To produce a smooth and consistent surface
finish, 1.27 cm (0.5 inch) thick aluminum caul plates are placed over the top layer of
release film. A layer of polyester breather fabric was placed over the entire part to
allow a pressure differential between the autoclave environment and the part below.
This breather was in contact with the vacuum line, pressure transducer, and the glass
tows at the corners for full vacuum flow. A diagram of the bagging procedure can be
seen in Figure 4.1 as well as the actual layup before adding the bagging film. Once
this was completed the vacuum bag was placed over the entire part before being leak-
checked.
Figure 4.1: Layup and Bagging Featuring 1.25cm (0.5 inch) Thick Caul Plates
The autoclave run follows the cycle shown in Figure 4.2. Once leak-checked,
the part was sealed and pressure ramp up began using nitrogen gas. Full pressure of

26
344 kPa (50 psi) was reached before bringing temperature up to 176.7 °C (350°F). A
thermocouple measured and logged the temperature of the part directly. Vacuum to
the part was applied for the duration of the run. Following a 90 minute dwell to cure,
the temperature is brought to 71 °C (160°F) before pressure was released. All parts
were allowed to cool before being removed and processed for testing.
Figure 4.2: Prepreg Run Cycle
4.2 Substrates, Frequency Selective Surface Design, and Processing
Electromagnetic substrates tested were placed within the composite laminates
at specific locations based on FSS design. These came in the form of films and foils
which were easily placed between the prepreg layers. Care was taken to preserve
surface cleanliness before being applied to the composite prepreg. In the case of bi-

27
layered substrates such as the Pyralux™, care had to be taken to differentiate the
copper side from the Kapton side. This was most important to adhesion testing as
failure initiation and orientation of the test sample for these bi-layered substrates
affected mechanical properties and failure location.
The FSS designs in this study were primarily made with the objective of
mechanical testing although design had to start with electromagnetic performance as
the motivation. Square patch patterns were chosen since they are geometrically
orthotropic and perform moderately well in the K-band [5]. Patch sizes and spacing
were driven by the ASTM standards to give a good range of scenarios while keeping
patch location in the gage length consistent. The spacing between patches was chosen
to account for the blade width used for cutting the samples. After each cut there would
be the same number and alignment of patches in each sample. For a 0.18 cm (0.07
inch) diamond wet-saw this accounted for spacings of 13.59, 9.07, 6.79, and 5.44
millimeters. A schematic of the geometry can be seen in Figure 4.3. This geometry
both satisfies the requirement of the mechanical testing standard as well as the
frequency range in which we are interested. The K-band ranges from 12-40 Ghz and
corresponds to a wavelength that is small enough to be measured within the lab
through use of an anechoic chamber.

28
Figure 4.3: FSS Square Patch Geometry
Once the patch sizes and spacing were chosen, they were analyzed using the
simulation software HFSS which was used to predict the quality of the FSSs and their
resonant frequencies. These are later confirmed with measured results from an
anechoic chamber. The anechoic chamber contains two antennas which can be
focused and used to measure transmitted waves and reflected waves. The distance of
the antennas limits the frequency range of which can be measured thus the FSS
designs were chosen to fit within the K-band range, 12-40 GHz. This means of testing
and verification is non-destructive and was done before sample preparation and
cutting.1
1 Electromagnetic simulation work and testing done in conjunction with Peter Pa,
University of Delaware Electrical and Computer Engineering Department.

29
4.3 Testing Methods and Setup
Testing of these multifunctional materials was both electromagnetic and
mechanical. Microwave testing and measurement is nondestructive and was done
before mechanical tests. The mechanical tests failed the samples completely to find
structural properties both in the elastic and failure regime. This methodology allowed
the use of the same sample for both testing regimes.
Test sample preparation of the composite panels is as follows: first excess resin
and fabric were cut from the edges of samples using a diamond-bladed wet saw.
Thickness measurements and weights of each panel were recorded. An ultrasonic C-
scan was performed to check for any large voids or inconsistencies in the composite.
The panels were immersed in water and scanned with a 5 MHz transducer. An
example of this can be seen in Figure 4.4 showing a panel with a wrinkle in the
embedded copper film beside a proper panel. Wrinkles were uncommon and samples
were cut from locations in the panel devoid of such blemishes. These cuts were
aligned with the fiber warp direction as best as possible keeping lines parallel with the
factory edge of the pepreg roll. Additional samples were cut and used for measuring
fiber content via burn-off testing. This was done in accordance to standards that
measured FVF, ASTM D2584 [31], and void content, ASTM D2734 [32].

30
Figure 4.4: Example C-scanned Panels
The testing scheme and order for component testing can be found in Figure
4.5. The process of material selection by looking at bonding helps reduce the number
of mechanical tests that need to be done later. In this research, these tests were used to
characterize the chosen system of Pyralux™ as much as possible before it was sent out
to be etched into the FSS. Once good bond strength was confirmed, tests continued
into the mechanical regime ultimately used to predict the mechanical properties,
modulus and strength, of a composite sandwich structure.

31
Figure 4.5: Testing Scheme; First Comparing Adhesion and Shear Failure before
Characterizing Mechanical Properties
4.3.1 Adhesion Comparison Testing
For mechanical properties, interest was focused on what the effect the FSS will
have on the surrounding composite layers. Initial focus was on substrate adhesion in
peel and shear compared to the pure composite baseline. Bonding is the means
through which the FSS layer interacted with the surrounding composite. For this, peel
and shear failure were of most interest. Figure 4.6 shows the potential modes with the
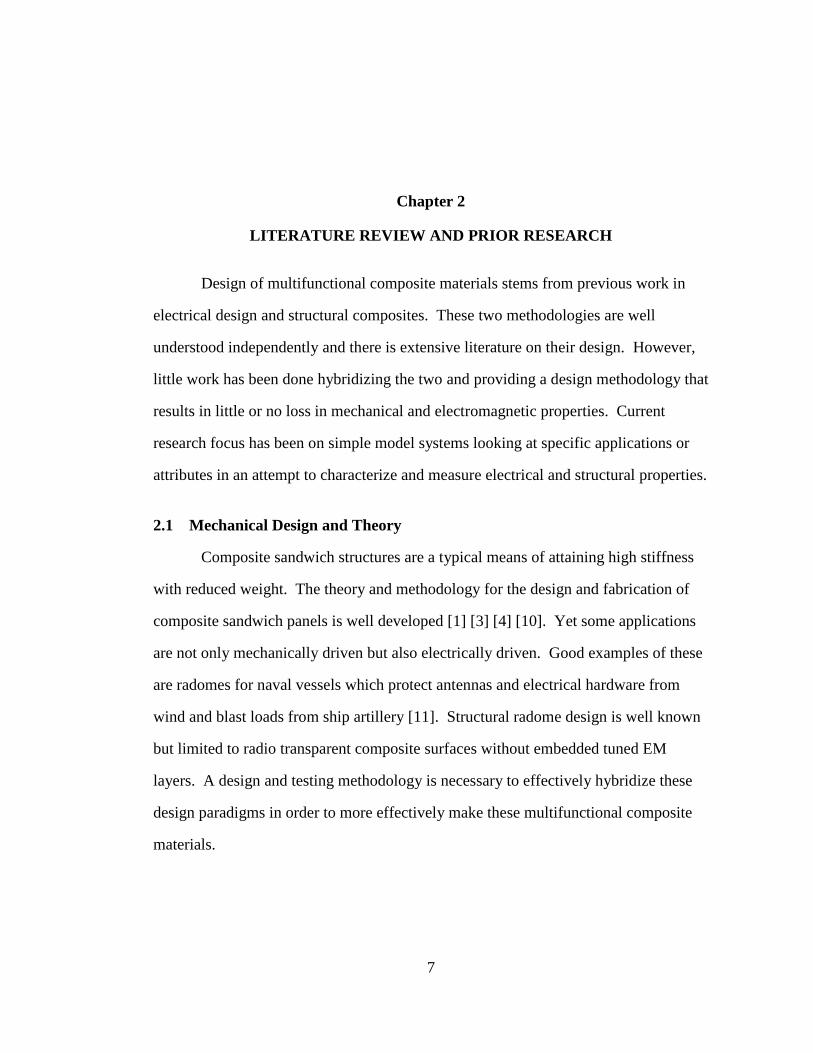
failure bond surfaces in red. Bond properties were compared for baseline composite
and the composite with added FSS materials. Floating roller peel testing was chosen
as a comparative means of measuring bond strength and locating failure interfaces
following ASTM D3167 [33]. In addition, ASTM D2344 [30], was used to compare
short beam shear strength of the composite with the embedded substrates and FSS
layer. These tests function as preliminary tests to compare materials used as well as
give insight on where failure may occur in the laminate.
Adhesion Comparison Tests
•Floating Roller Peel (Peel)
•Short Beam Shear (Shear)
Mechanical Tests
•Tension
•Compression
32
Figure 4.6: Interlaminar Failure Modes with Failure Surface Shown in Red
4.3.1.1 Floating Roller Peel Sample Fabrication and Testing Description
Floating Roller Peel (FRP) samples were made to compare bond strength and
investigate failure mechanisms in the chosen materials in accordance with ASTM
standard D3167 [33]. These were fabricated from 8 layer stacks where the material in
question was placed between the 7th
and 8th
layers. Release film was placed between
the 8th
layer of the composite and the embedded material. This film extended at least
7.3 cm (3 inches) into the sample as a pre-crack so that the testing fixture could
differentiate and peel the two layers apart. Individual specimens were cut to widths of
1.27 cm (0.5 inch) per ASTM standard instructions. The samples were labeled and the
widths measured in three different locations along the sample. These widths were
averaged and compared to the peel strength to derive the strength per unit width of
peel. Testing was done using an Instron® 5565 with a 500 newton load cell which

33
was first calibrated using a known weight. Figure 4.7 shows the 1.27 cm (0.5 inch)
wide peel sample loaded within the test fixture.
Figure 4.7: Floating Roller Peel Specimen and Setup
Once tested, the failure surfaces of each sample were imaged. At least two
representative samples from each set were photographed from a location mid-way in
the peel. For imaging, a Keyence™ VK-X200 series microscope was used with a 10X
optical lens. Both surfaces were imaged with the bottom 7 layer portion of the peel
sample still containing the tested material. Figure 4.8 shows example photos of the
bottom peel surfaces taken with a camera. Further discussion of failure from imaging
is located in Chapter 5.1.1.

34
Figure 4.8: Example Floating Roller Peel Failure Surfaces Taken with Camera
4.3.1.2 Short Beam Shear Sample Fabrication and Testing Description
Short beam shear was done to compare the shear strength and failures of our
materials within the midplane of a composite laminate stack according to ASTM
D2344. [34] Composite stacks were made to be 24 layers thick yielding a 0.64 cm
(1/4 inch) thick composite. Every eight layers were debulked as mentioned earlier,
before being placed together. The layer or material to be tested was placed within the
midplane of the stack. Following the ASTM standard, the samples were cut to be six
times the thickness in length and twice the thickness in width. A diamond saw slot
grinder was used to cut these samples with automated feed cutting 0.025 cm every
other pass to ensure surface smoothness. Samples were tested using a 5567 Instron™
and the span of the lower point contacts set to four times the sample thickness. A
layer of thick Kevlar followed by rubber was used on the upper contact to reduce
premature failure due to crushing locally. This cradled a 1.27 cm (0.5 inch) diameter
steel pin versus the 0.64 cm (0.25 inch) pin recommended in the standard. This setup
was found after a few trial tests to reduce local crushing failure best, forcing samples
to fail in shear.
Figure 4.9 shows a schematic and the actual test setup of the SBS test
including the larger top pin.

35
Figure 4.9: Short Beam Shear Testing Setup
Once tested, samples were then photographed with a camera. Failure crack
location and orientation in the sample were noted. The sides of the samples were dyed
to give better contrast between failed and unfailed regions. For this a blue dye was
diluted with water and applied using a cotton swab. Once the dye soaked into the
cracks it was then cleaned off of the surface with a damp paper towel. From here the
failure location could be seen and compared between sample materials.
4.3.2 Mechanical Property Testing and Measurement
Once the interlaminar failure modes were determined, mechanical properties
were measured which then can be used to predict the response of the completed
sandwich structure. Tension testing followed the ASTM D3039 standard [35].
Tension samples featured a 2.54 cm (1 inch) sample gage width adequate to fit a
representative area of FSS patches. Compression values were measured using ASTM
D3410 [36]. This property is most susceptible to loss due to the inclusion of the FSS
film. Failure in compression often occurs due to buckling. This is greatly affected by
the interlaminar bond of the composite and the location where the FSS was placed.

36
A 2.54 cm (1 inch) square gage length was chosen for the compression test, to
maximize available area for FSS patches. For both tension and compression testing,
the substrate tested was placed within the midplane to keep loads symmetric although
there is motivation for asymmetrical placement in electromagnetic design.

37
Chapter 5
LAMINATE MECHANICAL TESTING RESULTS
Testing began with ultrasonic C-scanning to look for large voids and
inconsistencies. This was followed by burn-off of random samples within each panel
to measure Fiber Volume Fraction. Below, in Table 5.1, are each of the mechanical
tests with average dimensions, substrate location, and number of test scenarios.
Results of mechanical testing reported with one standard deviation.
Table 5.1: Fabricated Composite Panel Specifications Used in Testing
Name Number
of Layers
Average
Thickness
(cm)
Average
FVF (%)
Substrate
Location
Number
of
Scenarios
Floating
Roller Peel 8 layers 0.21 cm 44.2 %
Between 7th
and 8th
layer 9
Short Beam
Shear 24 layers 0.67 cm 44.3 % Midplane 9
Tension 8 layers
2 layers
0.22 cm
0.06 cm
46.7 %
51.4% Midplane 4
Compression 16 layers 0.44 cm 46.3% Midplane 8

38
5.1 Adhesion Comparison of Baseline Composite and Printed Circuit Board
Substrate Variants
Adhesion testing is a direct means of looking at how the embedded substrate
interacts with the surrounding composite and was compared to the baseline composite
without embedded material. From here the proposed substrate, on which to etch the
FSS designs, can be thoroughly compared through every step in PCB processing. This
proceeds from constituent materials used in the Pyralux™ to treatments used in
improving bond strength, all the way through etching, and the final FSS layer.
5.1.1 Peel Strength Comparison
Average peel strength was measured for the baseline composite and then
compared to the samples with added films and materials. First, the copper foils and
Kapton films were compared with peel strength, results in Table 5.2 and Figure 5.1.
The copper foils were made by Oak-Mitsui featuring untreated copper and the treated
copper DBT-III. As mentioned earlier, the DBT-III features a surface treatment on the
outside and inside of the roll. Untreated copper as well as the treated copper foils had
bond strength just as high as the baseline. Although the drum side is smooth, it does
have a slight roughness which can be attributed to higher bond strength. The datasheet
reports a surface roughness value (Ra) of 0.245 microns (10 µ inch) while the treated
side is 0.762 micron (30 µ inch). For this composite system and processing, this
surface roughness was sufficient to give good peel strength. The plain Kapton film
did not bond very well failing at nearly ¼ the baseline strength. However the corona
plasma treated Kapton FPC bond strength was nearly that of the baseline. The failure
of crack opening appears to happen easily along the untreated Kapton bond to the
composite. Higher surface energy of the Kapton, due to the corona treatment

39
improves this bond and increases the energy needed break it. This emphasizes the
need for chemical treatment to improve peel strength of the Kapton films.
Table 5.2: Baseline Substrate Average Peel Strength
Material Strength (N/cm)
Baseline Composite 20.7 ±1.1
Copper Substrate
Untreated Drum Side Copper 21.2 ±1.3
DBT-III Outer 20.6 ±1.0
DBT_III Inner 24.1 ±1.1
Kapton Substrate Kapton 6.3 ±0.4
Kapton FPC 19.4 ±1.7
Figure 5.1: Baseline Material Peel Strength
0.0
5.0
10.0
15.0
20.0
25.0
30.0
Avg
Pe
el S
tre
ngt
h (
Ne
wto
ns/
cm)
Baseline Peel Comparison
Baseline Shiny Side Copper DBT-III Outer DBT-III Inner Kapton Kapton FPCUntreated Copper

40
Next the copper-clad system of Pyralux LF was tested in peel, with the results
in Table 5.3. This film features both treated copper and Kapton film which from the
baseline tests proved well for bonding. First the film was tested as received and the
bond strength was slightly less but similar to the composite baseline. Since the
etching procedure used to make the FSS exposes the film to a chemical bath, another
set of peel samples were made. These samples of the Pyralux® film that had been
exposed to the etchant solution much like the final FSS except the copper side was not
etched. Average bond strength was the same as the baseline and slightly higher than
the fresh Pyralux® film. Knowing that the etching solution will not adversely affect
peel strength, we tested one of the FSS cases. This case had 4mm patches spaced 9.06
mm apart which corresponds to a 22.3% copper patch area on the fail surface. The
peel strength was just as high as the baseline although with a slight increase in
standard deviation.
Table 5.3: Pyralux™ Average Peel Strength ± One Standard Deviation
Material Strength (N/cm)
Baseline Composite 20.7 ±1.1
Pyralux™
Kapton Side 17.9 ±1.1
Copper Side 18.8 ±1.0
Kapton Side After Etch 20.5 ±1.2
Copper Side After Etch 21.4 ±1.1
FSS 4mm-9.0mm 23.1 ±2.0

41
Failure surfaces were imaged and the bond interfaces noted. Failure regimes
can be split into two categories; adhesive failure and cohesive failure. Adhesive
failure occurs within the bond between two different materials. Cohesive failure
occurs within two similar materials such as resin to resin. The baseline composite
failed cohesively within the interlaminar resin region.
Figure 5.2: Baseline Floating Roller Peel Failure Surface
Figure 5.2 shows an image of the baseline failure surface. The copper foils
failed similarly to the baseline, leaving resin residue on both surfaces. The untreated
copper surface bonded well, failing mainly in the resin-to-resin region, which can be
seen as the darker patches on the left image in Figure 5.3 with adhesive failure
showing up as a lighter color. Surface roughness proved high enough such that the
surrounding resin was able to bond to the copper surface. The amount of cohesive
failure was enough to give this untreated drum side copper peel strength comparable to
the baseline. The treated copper foil surfaces featured a very high surface area and
gave very good mechanical bonding to the cyanate ester resin system. The right image

42
in Figure 5.3 shows the peel fail surface of the treated copper drum side. This was
much like the failure region for the baseline composite showing no adhesive failure
between the resin and the copper.
Figure 5.3: Copper Peel Failure Surface Comparison
In the case of the Kapton, films chemical treatments are needed to improve
surface energy for adhesives. The untreated Kapton showed extremely poor bonding
and failing adhesively between the resin and film surface. This was compared to
Kapton FPC which was chemically treated and bond strength reached nearly that of
the baseline yet still not as good as copper. Failure region was similar as the copper
failing cohesively within the resin region although a few areas of exposed Kapton can
be seen. All cohesive failures left resin on the actual test material as seen from the
peel surface Figure 5.4.

43
Figure 5.4: Kapton Peel Failure Surface Comparison
Bonding of the FSS case was also comparable to what was seen in the baseline
composite. Failure was primarily cohesive in the resin region much like the other
materials with good bond strength although some debonding was seen on the patches.
In Figure 5.5 there were areas of exposed copper similar to the bond surfaces of the
rolled copper. This difference in bond failure happened due to the etching procedure
changing the surface characteristics of the electrodeposited copper on the Pyralux®.
Figure 5.5: FSS Floating Roller Peel Failure Surface

44
5.1.2 Short Beam Shear Strength Comparison
Short beam shear test was used to compare the mode II shear strength in the
materials studied. The same materials as used in the peel testing were tested here.
Starting with the pure composite baseline we moved on to copper and Kapton
followed by their surface treated derivatives and finally to one case of the FSS. Their
relative strengths can be seen explicitly in Table 5.4 and graphically in Figure 5.6.
There was a large decrease in strength for the untreated copper which earlier proved
moderately well in peel bonding. The Kapton, which performed badly in peel, did
much better in shear.
Table 5.4: Short Beam Shear Baseline Substrate Average Strength and ± One Standard
Deviation
Material Strength (MPa)
Baseline 12.1 ±0.2
Copper
Untreated Drum Side Copper 7.2 ±0.7
DBT-III Outside 12.9 ±0.1
DBT-II Inside 13.2 ±0.3
Kapton Kapton 11.7 ±0.3
Kapton FPC 12.2 ±0.3

45
Figure 5.6: Short Beam Shear Strength Comparison
The Pyralux film, featuring both treated Kapton and copper, was tested by
flipping the short beam shear samples to the other side. Short beam shear strength was
very good and either met or exceeded the baseline strength seen in Table 5.5. The
etched FSS sample’s strength was very close to that of the baseline and confirmed that
the etching process used on PCB materials as well as this FSS did not compromise
short beam shear strength.
0.00
2.00
4.00
6.00
8.00
10.00
12.00
14.00
16.00
SBS
Stre
ngt
h (
Mp
a)
Baseline Short Beam Shear Comparison
Baseline Shiny Side Copper DBT-III outside
DBT-II Inside Kapton Kapton FPC
Untreated Copper

46
Table 5.5: Short Beam Shear Pyralux™ Substrate Strength and Standard Deviation
Material Strength (MPa)
Baseline Composite 12.2 ±0.2
Pyralux™
Copper Side Up 12.6 ±0.2
Kapton Side Up 13.0 ±0.2
FSS 4mm – 9.06mm 12.6 ±0.3
Failure for these can be divided between bond failure at the mid-plane material
interface and failure within the composite. Figure 5.7 lists materials, failure mode,
and images of the failure. Blue dye was used to increase the contrast and make failure
regions more apparent. Imaging was done macroscopically with a camera and further
with a microscope. Microscope images focused mainly on comparing samples that
had high short beam strength to the one that did not. Failure location is not easily
apparent in Figure 5.7 for samples that failed in the midplane within the composite
thus requiring further micrscopy. Samples were promptly removed from load once
failure occurred. Under the same loading regime, the samples showed both failure
within the midplane region as well as above and below the substrate. Samples that
had high short beam shear strength showed failure that tracked away from the
embedded substrate and into the surrounding composite.

47
Figure 5.7: Short Beam Shear Baseline Failure Imaging
Failure locations for the Pyralux®-based materials can easily be seen. They
occur within the actual composite which indicates they failed at strengths similar to
the baseline. Figure 5.8 clearly shows the dyed cracks forming in the composite layers
above and below the embedded film mid-plane. This failure tracking, from the
measured strengths, can be attributed to good bond quality.

48
Figure 5.8: Short Beam Shear Failure Imaging Pyralux
Further failure damage was imaged using a microscope once the edges of the
samples were polished. Blue ink was applied again to the samples to make cracks
more apparent. The baseline sample failed within the midplane. A micrograph can be
seen in Figure 5.9 with the crack tracking within the resin region between the fill
direction tows of fiber seen coming out of the page. This failure is indicative of good
bond with the other substrate’s short beam shear damage compared to that of the
composite baseline.
Figure 5.9: Baseline Short Beam Shear Failure Micrograph 10X
In comparison, the short beam shear sample failures with the embedded
substrates primarily showed failure within the composite except for the untreated

49
copper, drum side. Untreated drum had lower strength compared to the composite
baseline. A failure crack can be seen in the top image of Figure 5.10 extending along
the interface between the composite and the copper foil. The bottom image shows the
untreated Kapton case which had good short beam shear strength and the failure crack
can be seen within the composite surrounding the substrate yet not along the bond of
the substrate.
Figure 5.10: Untreated Copper and Kapton Short Beam Shear Micrographs 10X
All materials that showed good short beam strength failed within the composite
region. Treated substrates, as well as the Pyralux™ system, failed in this manner
within the midplane. The final FSS was no exception and can be seen Figure 5.11.
Here the crack tracked within the composite, paralleling the embedded layer although
not forming within the bond interface. The short beam shear failure regimes for the

50
Pyralux™ system as well as the surface treated substrates failed similarly to the
baseline within the midplane. This emphasizes the need for surface treatments and
confirms no loss in structural integrity when using these embedded systems.
Figure 5.11: FSS Short Beam Shear Micrograph 10X
5.2 Mechanical Property Testing and Comparison of Baseline Composite and
Printed Circuit Board Substrate Variants
From adhesion testing one can move on to mechanical testing. The results of
this can then be used for predicting the properties of a completed sandwich beam. The
Pyralux™ showed good adhesive strength compared to the baseline composite and the
next mechanical tests of tension and compression focus mainly on this system and the
etched FSS layers.
5.2.1 Tensile Properties and Failure Discussion
Tension was less of a concern than compression due to the lack of failures
attributed to debonding within the laminate but needed to be done to confirm the effect
of the embedded FSS on tensile strength and stiffness. First the 8 layer case was
tested comparing the baseline to the Pyralux® embedded in the composite mid-plane.
As mentioned earlier, these samples often exhibited failure near the grips. This was
also noted to happen through communication with Tencate® so a set of 2 layer

51
samples were also tested. Table 5.6 shows the average strength and modulus of the
tested samples with ± one standard deviation. The difference in mechanical properties
versus the baselines was less than 7% with the inclusion of both the Pyralux™ and the
Kapton. Thus adding the FSS layer within the composite laminate does not
substantially deteriorate the mechanical properties.
Table 5.6: Average Tensile Properties of Baseline Composite and Pyralux™ System
with Standard Deviation
Material Strength (MPa) Modulus (GPa)
Baseline 8 Layer 550.1 ±9.2 27.3 ±0.5
Pyralux™ 8 Layer 543.4 ±28.5 26.4 ±1.4
Baseline 2 Layer 597.2 ±22.4 29.8 ±1.6
FSS 3mm-6mm 2 Layer 555.5 ±16.0 28.8 ±1.9
Ultimate tensile strength for the 2 layer specimens was slightly higher than that
of the 8 layer. There was a noticeable reduction in the thickness per lamina of the 2
layer meaning a higher fiber content which would result in a higher modulus and
strength. Fiber volume content was measured via burn-off [31] to be 46.1% and
51.3% for the 8 layer and the 2 layer composite respectively. To better compare
properties, the tensile strength and modulus was normalized by 50% fiber volume
content using formula 5.1
.

52
(5.1)
where:
= Property to be normalized
= Common fiber volume fraction (50%)
= Actual average fiber volume fraction measured
Table 5.7 shows the tensile strength normalized by the fiber volume content.
The baselines and the Pyralux® strengths were very similar but a reduction could be
seen for the FSS variant. For the same amount of composite material, the FSS did not
reduce the strength greatly nor did the failure track the inclusion of the FSS.
Modulus faired similarly to the ultimate strength. The average modulus was
still very near the range of one standard deviation of the baseline for the 8 layer and 2
layer samples respectively. The modulus normalized by fiber content, seen in Table
5.7, was very consistent showing nearly the same properties across the board.
Altogether, the inclusion of the FSS layer did not greatly change the modulus of the
composite.
Table 5.7: Tensile Properties Normalized by Fiber Volume Fraction
Material Normalized Strength
(MPa)
Normalized Modulus
(MPa)
Baseline 8 Layer 588.9 ±6.5 58.5 ±1.0
Pyralux™ 8 Layer 585.5 ±30.7 58.2 ±3.1
Baseline 2 Layer 582.1 ±21.8 56.9 ±2.9
FSS 3mm-6mm 2 Layer 539.4 ±15.6 56.5 ±3.4

53
The failure damage in the tensile samples occurred independently of the
inclusion of the FSS layer. Delamination of the embedded material did not occur as a
result of failure. Failure occurred in the Pyralux and the FSS samples in the same
manner as their baselines. In the end, none of the damage in the failure regions
tracked the layer with the embedded FSS.
Most of the failures for these happened near the grips as seen in Figure 5.12.
As for the 8 layer samples, failures near the grip were accompanied by some
debonding of the outside layers of the composite. This can be seen in the bottom of the
baseline samples #3 and #5.
Figure 5.12: Failed 8 Layer Tension Specimens

54
The two layer test was found to produce failures more consistently within the
gage length versus the eight layer samples. The baseline, as well as one of the FSS
scenarios, was tested this way as seen in Figure 5.13. For this case the FSS with 3mm
patch size and a spacing of 6.8mm was chosen as it had the larger percent area of
copper patches of 22.3%.
Figure 5.13: Failed 2 Layer Tension Specimens
5.2.2 Compressive Properties and Failure Discussion
Compression properties were measured in accordance with ASTM D 3410. All
samples failed within the 2.54 cm (1 inch) gage length although many showed some
bending (a percent difference between the strain gages). Reported values of strength
and modulus come only from the samples that kept below 10% bending within the

55
strain region outlined in the ASTM, 1000-3000 µstrain. Additional samples, other
than the original 6, were made and tested for batches that exhibited bending. Fiber
volume content was consistent for these samples and found to be 46.4% through burn-
off measurements. Table 5.8 contains the average strengths and moduli as well as the
percent difference compared to the baseline composite ± one standard deviation. Both
properties were no more than 9% of the baseline composite.
Table 5.8: Average Compressive Properties and Standard Deviation
Material Strength (MPa) Modulus (MPa)
Baseline 553.8 ±31.3 26.4 ±2.2
Kapton 567.1 ±10.0 27.3 ±0.4
Pyralux® 565.1 ±16.4 27.9 ±0.3
FSS 3mm-6mm 567.9 ±7.5 26.5 ±0.3
FSS 4mm-9mm 540.2 ±26.3 27.3 ±0.9
FSS 3mm-9mm 577.3 ±25.1 28.3 ±0.8
FSS 2mm-9mm 554.9 ±20.0 27.5 ±0.6
FSS 3mm-13mm 599.0 ±27.0 28.7 ±0.9
Compressive strength of the FSS samples were compared to that of the
baseline composite, Kapton, and the Pyralux™ cases. Figure 5.14 compares the
strength values as well as standard deviation. Here the three baseline materials are
shown first, followed by the FSS’s in order of decreasing area percentage of patches.
For the range of area percentages tested there was not a large decrease in strength
versus the baseline. The FSS samples exhibited a slightly higher standard deviation

56
with a decrease in copper. With a reduction in copper there was an increase in the
surface of the Kapton that was etched off which may cause a higher variation in bond
strength. This increase in standard deviation could also be seen in the FSS peel test.
Figure 5.14: Compressive Strength
Modulus properties of the Kapton film, Pyralux™, and the FSS’s were similar
to that of the baseline as seen on Figure 5.15. The inclusion of a material within the
midplane does not affect modulus. The average properties were still within the
standard deviation of the baseline and there was very little trend based on the area
percentage of copper patches in the FSS.
350.00
400.00
450.00
500.00
550.00
600.00
650.00
Stre
ngt
h (
MP
a)
Compressive Strength
Baseline Kapton Pyralux FSS 3mm-6mm
FSS 4mm-9mm FSS 3mm-9mm FSS 2mm-9mm FSS 3mm-13mm
0
22.3 % Copper
12.6 % Copper
5.6 % Copper

57
Figure 5.15: Compressive Modulus
The failure of each case of specimen was imaged. All samples failed properly
within the 2.54 cm (1 inch) gage length with few or no failures close to the end tabbed
regions. Focus was on the failure within the lamina which was best viewed right after
failure before releasing the load on the sample.
16.00
18.00
20.00
22.00
24.00
26.00
28.00
30.00
32.00M
od
ulu
s (G
Pa)
Compressive Modulus
Baseline Kapton Pyralux FSS 3mm-6mm
FSS 4mm-9mm FSS 3mm-9mm FSS 2mm-9mm FSS 3mm-13mm
0
22.3% Copper
12.6% Copper
5.6% Copper

58
Figure 5.16: Failed Baseline Compression Samples
First the baseline composite was tested, shown in Figure 5.16, and compared to
the untreated Kapton™ film. They both failed at similar strengths but the Kapton
samples showed delamination within the Kapton film interlayer upon failure. This can
be seen in Figure 5.17 where the Kapton case in the middle shows a large
delamination in the film to composite bond region while the baseline showed
debonding in the composite regions away from the midplane. While the location of
the film in the midplane minimizes this effect, asymmetric designs may show
reductions in properties due to premature delaminations. Next, the Pyralux™ film was
tested. Once again, for the materials that bonded well in previous tests, most
delaminations due to failure occurred within the composite versus the materials with
poor bonding where delaminations were most likely to occur along the bond region.

59
Figure 5.17: Compression Baseline Failure Comparison
Next the FSS compression samples were tested featuring the etched Pyralux™.
Failure damage can be seen in Figure 5.18 where the images are in order of decreasing
copper patch area percentage. The failure regions were similar to the Baseline and the
Pyralux™ samples. Damage from delamination in failure occurred within the
composite region for all of the FSS samples.
Figure 5.18: Compression FSS Failure Comparison (in order of decreasing patch area)

60
Chapter 6
SANDWICH DESIGN AND TESTING FEATUREING AN EMBEDDED
FREQUENCY SELECTIVE SURFACE LAYER
Once the mechanical properties were measured, a complete sandwich structure
was designed. This design features the FSS layer within the composite face sheets of
the sandwich. Design focused on failing the sandwich in the face sheet to compare a
baseline composite versus one of the FSS scenarios. Testing of this structure followed
ASTM C393 using a three point bend [37] . Mechanical properties, such as bending
stiffness and strength were predicted and then compared to the actual measured values.
6.1 Materials and Processing for a Sandwich Panel with Frequency Selective
Layer
The mechanical properties of a composite sandwich beam can be predicted
using the properties of the constituents. These include the mechanical properties of
the face sheets and the core as well as the area moment inertia of the sandwich’s cross-
section. The face sheet properties are well known from the testing in the previous
chapter. It is this location where the FSS layer is placed and the comparison made
versus the purely composite baseline.

61
Figure 6.1: Sandwich Structure and Cross-Section Geometry
From beam theory, bending stiffness as well as the failure load of the beam can
be predicted. Dimensions used in these calculations can be seen labeled in Figure 6.1.
It is assumed that the face sheets carry the entire load. This is a common assumption
made for sandwich beams with the criteria that the core to face sheet thickness ratio is
greater than 5.35 [1] [10]. The area moment of inertia can be coupled with parallel
axis theorem to calculate the area moment of inertia in Equation 6.1.
(6.1)
where:
= area moment of inertia
= sandwich width
= face sheet thickness
= core thickness

62
From here the bending stiffness ( can be calculated. This is useful in
comparing the stiffness response of the composite sandwich within the linear elastic
regime. It is in this regime that the sandwich structure is loaded during actual service.
Bending stiffness can be calculated by knowing the load and displacement of the beam
in testing in Equation 6.2.
(6.2)
where:
= bending stiffness
= load
= span
= displacement at mid-span
Failure loads can also be predicted using beam theory. ASTM standard C393
for flexural testing of sandwich beams provides expressions for beam theory focusing
on face sheet and core stresses [37]. As mentioned earlier, the top and bottom face
sheets are assumed to carry the bending load in compression and tension respectively.
The stress in the face sheets can be found in Equation 6.3. Knowing the ultimate
stress of the composite face sheets, one can solve for the failure load P.

63
( (6.3)
where:
= stress
= load
= sandwich thickness
= area moment of inertia of the beam
The core functions to spread the load from face sheet to facesheet via shear.
Core failure load was predicted using the equation provided in the ASTM standard for
core shear stress, Equation 6.4.
( (6.4)
where:
= core shear stress
= load
= sandwich thickness
From these two expressions for face sheet and core stress, criteria can be made
in beam design. To compare the effects of the added FSS layer, the face sheets must
fail before the core. Knowing the failure stress, one can solve for the failure load for
shear as well as tension and compression in the face sheets. Beam geometry can be
iterated until predicted failure load of the core is much higher than the face sheet. This
can be done by varying core thickness as well as beam span.

64
6.2 Core Material Selection and Sandwich Beam Fabrication
Materials chosen must also provide the necessary electromagnetic properties.
This means the electromagnetic waves must be able to freely pass through the core as
well as the composite with minimal loss. The two face sheets have the potential for
placing two FSS layers within the sandwich structure. This is relevant in
electromagnetic applications where multiple FSS layers can be used to filter out more
than one frequency [5]. Here the FSS was placed within the midplane of each face
sheet much like the previous tension and compression samples. Two layer face sheets
were chosen because they could contain the FSS layer within the midplane as well as
fail at a lower load then the chosen core material. The core must also be low loss,
motivating the choice of a Nomex™ honeycomb core made by M.C. Gill Corp model
HK-1/8-3.0.
Face sheets were made separately and then bonded to the core. These were
made from the same prepreg system and following the same processing procedures as
the previous test samples as stated in Section 4.1. Average fiber volume fraction for
the face sheets was found to be 48.5% via burn-off, ASTM D2584. The surface of the
face sheets were sanded using a 180 grit sand paper. Rymplecloth was then used to
dry wipe the surface free of dust and debris. These sheets were then bonded to the
core using Scotch-Weld™ AF563 film adhesive. The entire stack was placed under
vacuum and cured at 121˚C (250˚F) for 120 minutes in an oven. Table 6.1 lists the
materials used in the sandwich construction as well as thicknesses.

65
Table 6.1: Composite Sandwich Materials List and Thicknesses
Material Thickness Notes
Facesheets BTCy-1 Cyanate Ester S-glass 0.49 mm FVF: 48.5%
Core Gilcore HK-1/8-3.0 21.48 mm
Film Adhesive Scotch-Weld AF 563 0.432 mm
Final Sandwich 23.24 mm
The final sandwich panel was measured to be 2.31 cm thick. Sample width
was chosen to be 5.08 cm (2 inches) to be at least twice the sandwich thickness. A
span of 40.6 cm was chosen with 2.54 cm (1 inch) of beam overhang. This resulted in
the overall sample length to be 45.72 cm (18 inches) long. This geometry reached the
proper criteria to achieve face sheet failure before core failure. Samples were then cut
using the diamond tipped wet saw cutting 0.025 mm each pass.
Figure 6.2: Three Point Bend Setup

66
Once the samples were let dry at room temperature, they were then measured
and prepared for testing. Strain gages were placed on the bottom of each sample. For
this, Vishay CEA-06-125UE-350 gages were used and aligned in the direction of the
sample span. An LVDT was added and contacted a point next to the strain gage. The
LVDT was made by RDP Group model DCTH300AG. This was used to measure the
extension and removed before ultimate failure of the sample. The entire setup can be
seen in Figure 6.2 with wires going to the bottom strain gage and the fixed LVDT in
contact with the bottom of the sample. The FSS patches were aligned so that the line
of patches was symmetric with the loading point and support span.
Samples were tested in three point bend at a crosshead rate of 1.27 cm/min (0.5
inch/min). The contact supports were 1.27 cm (0.5 in) diameter steel cylinders. These
were found to cause premature failure in the core due to load concentration so 2.54 cm
(1 inch) wide steel pads were used with a rubber pad contacting the sample. The latter
configuration was found to fail samples consistently in the face sheets without any
premature failure in the core. A total of three samples were made of the baseline and
the FSS scenario. The number of samples was limited to three due to limitations in the
FSS layer size.
6.3 Testing and Results
Both the baseline and the FSS sandwiches failed within the face sheets. 6.2
shows the bending stiffness and failure load of the composite sandwich samples as
well as the predicted values within one standard deviation. Bending stiffness followed
theory well resulting in a percent difference no greater than 7%. The beam bending
failure loads, as well as the face sheet stresses at failure, were lower than the
predicted. Predicted values were calculated from failure stresses of the before

67
mentioned compression tests. Yet the failure loads and stresses of the baseline and the
FSS sandwich are very similar proving that the inclusion of the FSS layer did not
detrimentally affect failure load versus the baseline.
Table 6.2: Three Point Bending Stiffness and Failure Loads
Scenario
Bending Stiffness
( )
Failure Load (N)
Face Sheet Failure
Stress (MPa)
Predicted 168.5 3045.3 553.0
Baseline 176.9 ±2.0 2214.9 ±65.7 396.5 ±11.2
FSS 179.2 ±1.6 2284.6 ±11.1 416.0 ±2.7
Deflection of the beam was measured using the Instron crosshead displacement
as well as LVDT. These two values correlated well so crosshead displacement was
used in comparing the baseline against the FSS sandwich beam. Load and crosshead
extension from representative samples was compared between the two within the
linear elastic region in Figure 6.3. The beam with the embedded FSS layer responded
nearly identically to the baseline composite.

68
Figure 6.3: Load vs. Extension Response of Sandwich Beams
Failure occurred at a lower load than the theory predicts. The failure location
was closer to the ends of the steel pads than it was to the actual center of the beam.
This prematurely concentrated the stress there and failed the beams. Figure 6.4 shows
the failure locations. Damage appears similar between the Baseline and the FSS.
Delamination did occur during failure but both shared the same extent of damage.
Representative side images of the sandwich failures can be seen in Figure 6.5 for both
the baseline and the FSS sandwich beam. Face sheet failure is obvious with little
distortion in the core.
-500
0
500
1000
1500
2000
2500
0 5 10 15 20 25
Load
(N
)
Displacement (mm)
Load vs. Mid-span Displacement Comparison
Baseline
FSS
69
Figure 6.4: Three Point Bend Failure Images
Figure 6.5: Sandwich Specimen Failure Viewed from Side

70
Chapter 7
CONCLUSION AND FUTURE WORK
7.1 Conclusion
For this specific multifunctional material with FSS geometry there was no
measurable loss in mechanical properties compared to the baseline structure without
embedded substrates, within statistical bounds. The FSS materials chosen were
commonly used in PCB fabrication and had been proven to perform well for adhesion
in the composite system. Emphasis was placed on surface treatments of the FSS
materials; in this case Kapton film and the copper foil. Preliminary tests on these
materials showed how important surface treatments are to bonding in both peel and
shear modes. The mechanical properties measured in tension and compression did not
change compared to the baseline. The Kapton compression samples did show a large
delamination between the composite region and the embedded Kapton film shortly
after failure. However this did not affect the mechanical properties. In the case of
sandwich structures, given this specific FSS design and substrate, this works shows
that one can design in the same manner that one would have used if there were no
embedded FSS layer.
Presented here is a testing methodology starting with bond strength and failure
mechanisms before proceeding to mechanical properties used in the design of
composite sandwich structures. This methodology was applied to design of a
sandwich featuring an embedded FSS layer. For the inclusion of a new material
within a composite laminate, bond strength is a big concern. The proposed

71
methodology in this work focuses on comparing adhesion failure characteristics to
validate and improve material selection before mechanical tests are done. Tests can be
done, such as peel and short beam shear, to compare the bond strengths of various
materials. After that work, one can more easily determine which materials should be
used in the final tests of tension and compression to ultimately predict the composite
sandwich structure’s mechanical response.
7.2 Future Work
There are many ways to expand on this research. Here the focus was on one
variety of electromagnetically functionalized material for use in a specific application
of sandwich structures for use in naval application. Further research could expand on
different applications as well as other candidate materials. In this work, a standard
PCB material performed comparably to the baseline composite. However, other
material options exist possibly at lower cost and more scalable means of
manufacturing.
7.2.1 Conductive Materials and Substrates
The conductive copper foils have very different mechanical properties than the
surrounding composite. Loads encountered by the composite sandwich panel may be
greater than the failure loads of the embedded copper causing delamination between
the composite and the copper as well as ultimate failure of the copper. Previous
research has been done for simple direct current conductivity along an embedded
copper strip [23] but not for discrete patches. Here, cyclic loading testing of tensile
and compressive regimes as well as the complete sandwich structure need to be done.
Damage can be periodically measured using ultrasonic C-scans and in the anechoic

72
chamber for changes in electromagnetic response. From these, internal adhesion
failure can be observed as well as any degradation in EM response as a result of cyclic
loading. Testing results shown in this work show good adhesion between the
conductive FSS substrate and the surrounding composite. Cyclic testing would
provide insight in adhesion strength to cyclic-induced bond failure as well as its role in
any ductile failure in the copper which was observed in literature.
For these FSS layers a conductive substrate is needed. Copper etching is one
method which can be done very well with high accuracy although there are other
means of providing these conductive pathways. Conductive inks and powders can be
used in the place of metal foils [38] [39]. These methods are additive versus the
subtractive methods used in etching. They are still new to the science of
electromagnetically functionalized materials as well as structural composites. The
same extensive testing regime would be needed to confirm that they too do not
adversely affect structural properties. Screen printing, shown in Figure 7.1, is one
such way of applying conductive ink to either a film or fabric substrate. This method
is common for making discrete patterns on textiles such as T-shirts although there are
continuous ways to inking as well. Other benefits stem from processing as printing
could be done through a roll-to-roll means of continuously applying the conductive
pattern such as gravure printing. This would increase manufacturing efficiency versus
etching discrete panels and laying them up piece by piece.

73
Figure 7.1: Methods of Conductive Ink Printing
Regardless of what conductive material is used, there must be a substrate to
hold them in place. For the FSS design in this research a polymer Kapton film was
used but there are other alternatives. An additive process, such as printing, could be
coupled with other films, dry fiber, or even the prepreg itself.
7.2.2 Improvements in Testing
There are further mechanical tests that could be done for this specific
application. The effect of the embedded FSS on shear could be studied with ±45˚
oriented tension samples. This means of off-axis loading is also relevant to sandwich
structures though this study has only looked at the properties in the warp direction.

74
Mechanical testing done in this work has focused on symmetric substrate
placement as well as loading. In the electrical regime, there are advantages to
asymmetric electromagnetically functional layers. For the design of FSS materials,
multiple layers can be combined in order to increase bandwidth filtering or to filter
more than one discrete frequency [1] [5]. Figure 7.2 shows a cross section schematic
of a composite with two FSS layers asymmetrically placed in reference to the
centerline. Asymmetric interlaminar substrate placement may have detrimental
effects to compressive strength where failure is susceptible to buckling failure.
Thicker composite face sheets with multiple FSS layers placed asymmetrically would
require additional testing in order to examine the effects this layup would have on the
completed sandwich.
Figure 7.2: Composite Cross Section Schematic with Asymmetric FSS Placement
Corresponding to Unique Resonant Frequencies

75
The emphasis of this research was on sandwich structures primarily for use in
radomes. Other mechanical properties besides tension and compression may also be
important. For example, panels made to withstand ballistic impacts would have an
entirely different design criteria and set of tests to confirm the effects of an embedded
electrometrically functionalized material.
7.2.3 Alternative Electromagnetic Structures
There are many structures used in making FSS materials. Solid square patches
were just one geometry that were orthotropic and thus more conducive for testing
mechanically. Other patch geometries could also be studied; for example tripoles and
Jerusalem crosses, which perform very well as FSS’s and takes up much less surface
area then solid squares [5].
Other options include multilayer materials and asymmetric designs including
through-thickness conductivity. Further 3D designs include High Impedance Surfaces
(HIS) first studied by Sievenpiper [40]. An example of one of these can be seen in
Figure 7.3. These surfaces have amplifying effects when coupled with an antenna and
have traditionally been made from PCB materials. In the case of composite laminates,
the conductive patches and ground planes can be coupled with through-thickness
conductivity. This can be facilitated using drilled holes plated with copper or the
structural composite analog of Z-pinning [41]. Drilled holes and through-thickness
conductivity are common in PCB fabrication but have yet to be expanded to structural
composites.

76
Figure 7.3: High Impedance Surface with Drilled Vias

77
REFERENCES
[1] L. Carlsson and G. Kardomateas, Structural and Failure Mechanics of Sandwich
Composites, New York: Springer, 2011.
[2] J. R. Vinson, The Behavior of Sandwich Structures of Isotropic and Composite
Materials, Lancaster, PA: Technomic Publishing Company, Inc., 1999.
[3] I. M. Daniel and J. L. Abot, "Fabrication, testing and analysis of composite
sandwich beams," Composites Science and Technology, vol. 60, pp. 2455-2463,
2000.
[4] J. Tomblin, T. Lacy, B. Smith, S. Hooper, A. Vizzini and S. Lee, "Review of
Damage Tolerance for Composite Sandwich Airframe Structures," U.S.
Department of Transportation Federal Aviation Administration Office of
Aviation Research, Washington, DC, 1999.
[5] B. A. Munk, Frequency Selective Surfaces Theory and Design, Danvers, MA:
John Wiley & Sons Inc., 2000.
[6] R. Mittra, C. H. Chan and T. Cwik, "Techniques for Analyzing Frequency
Selective Surfaces - A Review," IEEE, vol. 76, no. 12, 1988.
[7] R. Mittra, C. Tsao and W. Ko, "Frequency Selective Surfaces with Applications
in Microwaves and Optics," in IEEE MTT-S International, Washington, DC,
1980.
[8] M. I. Montrose, Printed Circuit Board Design Techniques for EMC Compliance,
Piscataway, NJ: IEEE Press, 1996.
[9] C. H. T. C. Raj Mittra, "Techniques for Analyzing Frequency Slective Surfaces -
A Review," Proceedings of the IEEE, vol. 76, no. 12, pp. 1593-165, 1988.
[10] J. R. Vinson, Plate and Panel Structures of Isotropic, Composite, and
Piezoelectric Materials, Including Sandwich Construction, Norwell MA:
Springer, 2005.
[11] J. B. Birks, "Dielectric Housings for Centimetre-Wave Antennae Part: 2," The
Journal of the Institution of Electrical Engineers, vol. 93, no. 4, pp. 653-657,
1946.
[12] P. A. Engel, Structural Analysis of Printed Circuit Board Systems, New York:
Springer-Verlag New York Inc. , 1993.
[13] M. Lin and F.-K. Chang, "The manufacture of composite structures with a built-
in network of piezoceramics," Composites Science and Technology, pp. 919-939,
2002.

78
[14] S. Nemat-Nasser, S. Nemat-Nasser, T. Plaisted, A. Starr and A. V. Amirkhizi,
"Multifunctional Materials," BIOMIMETICS: Biologically Inspired
Technologies, pp. 309-341, 2005.
[15] P. J. Callus, "Novel Concepts for Conformal Load-bearing Antenna Structure,"
DSTO, Fishermans Bend, Victoria 3207, 2008.
[16] A. Lockyer, K. H. Alt, D. Coughlin, M. D. Durham and J. N. Kudva, "Design and
development of a conformal load-bearing smart-skin antenna: overview of the
AFRL Smart Skin Structures Technology Demonstration," Northrop Grumman
Corporation, Hawthorne, CA, 1999.
[17] K. Park, S. Lee and C. Kim, "Fabrication and electromagnetic characteristics of
electromagnetic wave absorbing sandwich structures," Composites Science and
Technology, vol. 66, no. 3-4, pp. 576-584, 2006.
[18] I. Choi, J. G. Kim, D. G. Lee and I. S. Seo, "Effects of a damaged composite face
to the electromagnetic wave transmission characteristics of low-observable
radomes," Composite Structures, 2011.
[19] T.-K. Wu, "Four-Band Frequency Selective Surface with Double-Square-Loop
Patch Elements," IEEE Transactions on Antennas and Propagation, vol. 42, no.
12, pp. 1659-1663, 1994.
[20] P. C. Kim, D. G. Lee, I. S. Seo and G. H. Kim, "Nanocomposite stealth radomes
with frequency selective surfaces," Composite Structures, pp. 299-305, 2008.
[21] W.-J. Lee, J.-W. Lee and C.-G. Kim, "Characteristics of an electromagnetic wave
absorbing composite structure with a conductive polymer electromagnetic
bandgap (EBG) in the X-band," Composites Science and Technology, vol. 68, pp.
2485-2489, 2008.
[22] A. A. Obaid and S. Yarlagadda, "Structural Performance of the glass fiber–vinyl
ester composites with interlaminar copper inserts," Composites Part A: Applied
Science and Manufacturing, vol. 39, no. 2, pp. 195-203, 2008.
[23] H. Kim, M. Park and K.Hsieh, "Fatigue Fracture of Embedded Copper
Conductors in Multifunctional Composite Structures," Composites Science and
Technology, vol. 66, no. 7-8, pp. 1010-1021, 2006.
[24] S. Lee, K. Oh and C. Kim, "Electromagnetic characteristics of frequency
selective fabric composites," Electronic Letters, vol. 42, no. 8, pp. 12-14, 2006.
[25] Y. Zhou, Y. Bayram and S. Member, "Polymer-Carbon Nanotube Sheets for
Conformal Load Bearing Antennas," IEEE Transactions on Antennas and
Propagation, vol. 58, no. 7, pp. 2169-2175, 2010.
[26] Y. Zhou, Y. Bayram, F. Du, L. Dai and J. L. Volakis, "Polymer-Carbon
Nanotube Sheets for Conformal Load Bearing Antennas," IEE Transactions on
Antennas and Propagation, vol. 58, no. 7, pp. 2169-2175, 2010.
[27] L. Yao and Y. Qiu, "Design and Fabrication of Microstrip Antennas Integrated in
Three Dimensional Orthogonal Woven Composites," Composites Science and
79
Technology, vol. 69, pp. 1004-1008, 2009.
[28] Tencate Advanced Composites Inc., "http://www.tencate.com," [Online].
Available:
http://www.tencate.com/amer/Images/TCAC_Radomes%26AntennasGuide_Web
_tcm29-23025.pdf. [Accessed 12 June 2013].
[29] K. Naito, Y. Kagawa and K. Kurihara, "Dielectric properties and noncontact
damage detection of plain-woven fabric glass fiber reinforced epoxy matrix
composites using millimeter wavelength microwave," Composite Structures, vol.
94, pp. 695-701, 2011.
[30] Tencate Advanced Composites Inc., "http://www.tencate.com," 3 2009. [Online].
Available:
http://www.tencate.com/TenCate/Aerospace_composites/documents/TCAC%20
USA%20docs/TCAC%20USA%20Datasheets/DataSheet/DS%20BTCY1%20We
b.pdf. [Accessed 2012].
[31] ASTM D2584-02, Standard Test Method for Ignition Loss of Cured Reinforced
Resins, West Conshocken, PA: ASTM International, 2002.
[32] ASTM D2734-94, Standard Test Methods for Void Contest of Reinforced
Plastics, West Conschocken, PA: ASTM International, 2003.
[33] ASTM D3167-03a, Standard Test Method for Floating Roller Peel Resistance of
Adhesives, West Conshocken, PA, 2004.
[34] ASTM D2344, Standard Test Method for Short-Beam Strength of Polymer
Matrix Composite Materials and Their Laminates, West Conshocken, PA, 2006.
[35] ASTM D3039, Standard Test Method for Tensile Properties of Polymer Matrix
Composite Materials, West Conshocken, PA, 2006.
[36] ASTM D3410D, Standard Test Methods of Compressive Properties of Polymer
Matrix Composite Materials with Unsupported Gage Section by Shear Loading,
West Conshocken, 2003.
[37] ASTM C393, Standard Test Method for Flexural Properties of Sandwich
Constructions, West Conshohocken, PA: American Society for Testing and
Materials International, 2000.
[38] M. Pudas, N. Halonen, P. Granat and J. Vahakangas, "Gravure printing of
conductive particulate polymer inks on flexible substrates," Progress in Organic
Coatings, vol. 54, no. 4, pp. 310-316, 2005.
[39] D. Sung, A. d. l. F. Vornbrock and V. Subramanian, "Scaling and Optimization
of Graver-Printed Silver Nanoparticle Lines for Printed Electronics," IEEE
Transactions on Components and Packaging Technologies, vol. 33, no. 1, pp.
105-114, 2010.
[40] D. Sievenpiper, High-Impedence Electromagnetic Surfaces, University of
California Department of Electrical Engineering, 1999.
[41] R. McCauley, S. Yarlagadda, P. Pa, M. Mirotznik and M. Keefe, "Mechanical

80
Behavior of Composites Laminates with Electronic High Impedence Surfaces," in
Society for the Advancement of Materials and Process Engineering, Newark DE,
2012.

81
Appendix A
RADIO FREQUENCY MATERIALS, MODELING, AND TESTING NOTES
Material selection stems from both the mechanical and the electrical regimes.
In the case of the structural composite, traditional PCB materials can be used as a
baseline, comparing the structural properties as well as the electromagnetic loss.
Figure A.1 compares various PCB board materials versus the composite system
studied in this research. The PCB boards are produced and measured by Rogers
Corp.® and show very low loss as well as much lower strength compared to the
cyanate ester/ S-glass composite system. This composite system was chosen for its
high strength as well as low loss, comparable to the PCB materials.
Figure A.1: Printed Circuit Board Materials and Composite System, Signal Loss and
Tensile Strength

82
Figure A.2: HFSS Model FSS Unit Cell
FSS models were first simulated using the software HFSS developed by
Ansys®. They were simulated as though they were part of a composite laminate stack
much like the panels which where mechanically tested earlier. Figure A.2 shows an
example of a unit cell model which would then be arranged periodically to model the
entire FSS panel. Some alterations had to be made to the model after FSS fabrication
as subtle changes in the thickness of the composite affected the dielectric properties of
the FSS. All FSS panels made were measured in the anechoic chamber before
mechanical testing.

83
Figure A.3: HFSS Simulation Result of Transmission Varying Frequency
An example of the simulation and measurement results can be seen in Figure
A.3. Here the transmission through the FSS panel was measured as a function of the
frequency. As mentioned before the FSS has very low loss when out-of-frequency but
much higher loss when in-frequency. For this example that happens to be at 29.7 GHz
where the FSS panel acts much like a ground plane blocking the microwave signal.
There was a slight deviation between the model and the actual measured FSS made.
This was due to variation in the thickness of the composite laminate on either side of
the FSS layer. More accurate models could be made knowing the statistics of the
thickness variation in the final laminates although this is not the focus of the paper.

84
The actual pattern geometry, size and spacing, were chosen through iterating
designs in HFSS. First, patch spacings were calculated such that when each sample
was cut, there would be proper alignment of the patches on each sample. This was
done assuming cuts were made with a 1.78 mm (0.07 inch) blade width and
corresponds to the number of patches that can fit in a 2.54 cm (1 inch) square. The
results of these simulations can be seen in Figure A.4. Resonant frequencies were
recorded as well as the amount of loss at those frequencies. The cells marked in red
were ruled out as they did not behave well as FSS’s. This gave us a grid of applicable
configurations to choose from shown in blue and green. The graphs below show the
actual simulation output with frequency sweep.

85
Figure A.4: FSS Simulation Sweep Results