material comparators for end-of-waste decisions
TRANSCRIPT
Material comparators for end-of-waste decisions
Materials applied to land: soil improver
Report – SC130040/R2
Version 2

ii Product comparators for materials applied to land: soil improver
The Environment Agency is the leading public body protecting and improving the environment in England.
It’s our job to make sure that air, land and water are looked after by everyone in today’s society, so that tomorrow’s generations inherit a cleaner, healthier world.
Our work includes tackling flooding and pollution incidents, reducing industry’s impacts on the environment, cleaning up rivers, coastal waters and contaminated land, and improving wildlife habitats.
This report is the result of research commissioned and funded by the Environment Agency.
Published by: Environment Agency, Horizon House, Deanery Road, Bristol, BS1 5AH www.gov.uk/government/organisations/environment-agency ISBN: 978-1-84911-321-2 © Environment Agency – August 2016 All rights reserved. This document may be reproduced with prior permission of the Environment Agency. The views and statements expressed in this report are those of the author alone. The views or statements expressed in this publication do not necessarily represent the views of the Environment Agency and the Environment Agency cannot accept any responsibility for such views or statements. Further copies of this report are available from our publications catalogue: www.gov.uk/government/publications or our National Customer Contact Centre: T: 03708 506506 Email: [email protected]
Author(s): Mike Bains, Bob Barnes, Annette Hill and Lucy Robinson Dissemination Status: Publicly available Keywords: End-of-waste, soil improver, lime, gypsum, anaerobic digestate, laboratory analysis Research Contractor: URS Infrastructure & Environment UK Limited, 12 Regan Way, Chetwynd Business Park, Nottingham NG9 6RZ Tel: 0115 907 7000 Environment Agency’s Project Manager: Bob Barnes, Evidence Directorate Project Number:
SC130040/R2

Product comparators for materials applied to land: soil improver iii
Executive summary This report details work carried out to characterise certain soil improvers, a key non-waste comparator. This information will inform end-of-waste assessments for waste-derived materials intended to replace soil improvers that are applied to land.
The Waste Framework Directive (Article 6) provides criteria for identifying when a waste material has become a product and no longer needs to be regulated as a waste. Through Article 6 the case law requires us to consider the environmental and human health impacts from materials in comparison with their non-waste material alternatives.
... "It should be enough that the holder has converted the waste material into a distinct, marketable product, which can be used in exactly the same way as a [non-waste material], and with no worse environmental effects...”
Market research was used to define soil improver as an ordinary comparator and a literature review was used to identify any existing published data.
A limited number of suitable pre-existing datasets were found during the literature review.
Twenty-two samples of soil improver were collected from various suppliers across England. Analytical data from these samples are presented in this report.
We recommend comparing the concentrations of analytes in the comparators dataset to the concentrations in the waste-derived material, paying attention to the higher values. This comparison does not constitute a pass/fail test or an end of waste view. It will provide an indication of whether the waste material contains similar levels of analytes to non-waste materials and whether an end-of-waste application may be appropriate or that further analysis or improved treatment processes may be warranted.

iv Product comparators for materials applied to land: soil improver
Acknowledgements The authors would like to thank the following individuals and organisations for their assistance in producing this report:
Paul Murray, Environment Agency, Advisor, Environment and Business
Sue Hornby, Environment Agency, Senior Advisor, Environment and Business
Jenny Scott, Environment Agency, Legal Advisor
Bianca Prince, National Laboratory Service, Key Account Manager
Will Fardon, National Laboratory Service
Saint-Gobain Formula
Roy Hatfield Ltd
Mid UK Recycling Ltd
Product comparators for materials applied to land: soil improver v
Contents
1 Introduction 7
2 Definition 7
2.1 Definition and uses 7
2.2 Properties 8
3 Comparator sub-types 9
4 Material sources 10
4.1 Whole digestate 10
4.2 Primary gypsum 10
4.3 Liming materials 10
5 Sampling procedure 10
5.1 Whole digestate 11
5.2 Primary gypsum 11
5.3 Liming materials 11
6 Analytical parameters 11
7 Existing data 16
7.1 Whole digestate 16
7.2 Primary and recycled gypsum 16
7.3 Liming materials 17
8 Primary data 17
8.1 Statistical analysis of data 17
8.2 Using the data tables 18
8.3 Primary data tables 19
9 Conclusions 35
References 36
List of abbreviations 37
Table 6.1 Analysis: beneficial properties 11 Table 6.2 Analysis: primary nutrients 12 Table 6.3 Analysis: secondary nutrients 12 Table 6.4 Analysis: trace nutrients 13 Table 6.5 Analysis: other elements found in plants which may not be essential for growth 13 Table 6.6 Analysis: Potentially Toxic Elements (PTEs) 13 Table 6.7 Analysis: other potential contaminants 14 Table 6.8 Analysis: metals 14 Table 6.9 Analysis: other analytes 15 Table 6.10 Analysis: GCMS semi-volatile screen 15 Table 7.1 Minimum whole digestate quality 1,2 16 Table 7.2 Example nutrient content of selected digestate products 16
vi Product comparators for materials applied to land: soil improver
Table 7.3 PTEs analysis of agricultural gypsum 16 Table 7.4 Neutralising value 17 Table 8.1 Primary data for whole digestate: beneficial properties 20 Table 8.2 Primary data for whole digestate: primary, secondary and trace nutrients 1 21 Table 8.3 Primary data for whole digestate: other elements found in plants which may not be essential for growth,
Potentially Toxic Elements (PTEs) and other potential contaminants 1 22 Table 8.4 Primary data for whole digestate: other metals and analytes 1 23 Table 8.5 Primary data for whole digestate: GCMS semi-volatile screen 1,2 24 Table 8.6 Primary data for primary gypsum: beneficial properties 25 Table 8.7 Primary data for primary gypsum: primary, secondary and trace nutrients 1 26 Table 8.8 Primary data for primary gypsum: other elements found in plants which may not be essential for growth,
Potentially Toxic Elements (PTEs) and other potential contaminants 1 27 Table 8.9 Primary data for primary gypsum: other metals and analytes 1 28 Table 8.10 Primary data for primary gypsum: GCMS semi-volatile screen 1,2 29 Table 8.11 Primary data for liming materials: beneficial properties 30 Table 8.12 Primary data for liming materials: primary, secondary and trace nutrients 1 31 Table 8.13 Primary data for liming materials: other elements found in plants which may not be essential for growth,
Potentially Toxic Elements (PTEs) and other potential contaminants 1 32 Table 8.14 Primary data for liming materials: other metals and analytes 1 33 Table 8.15 Primary data for liming materials: GCMS semi-volatile screen 1,2 34 Figure 3.1 Soil improver sub-types 9 Figure 3.2 Liming material sub-types 10 Figure 8.1 Box plot of manganese concentration in lime 18

Product comparators for materials applied to land: soil improver 7
1 Introduction To define end-of-waste criteria, the Environment Agency requires a set of ordinary material comparator data for use as a benchmark against which to assess other materials and wastes.
Article 6 of the Waste Framework Directive provides criteria for identifying when a waste material has become a product and no longer needs to be regulated as a waste. Through Article 6 the case law requires the environmental and human health impacts from materials to be considered in comparison with their non-waste material alternatives. In particular the Court of Appeal judgement in OSS Group Ltd v Environment Agency (2007) contained the statement:
‘It should be enough that the holder has converted the waste material into a distinct, marketable product, which can be used in exactly the same way as a [non-waste material], and with no worse environmental effects.’
The purpose of this report is to provide an evidence base of the composition and characteristics (beneficial and potentially unbeneficial) of soil improver which is defined as an ordinary material comparator that is currently permitted for beneficial application to land. The report presents the results from the primary analysis of 22 soil improver samples.
Six other reports cover ordinary material comparators applied to land:
manufactured fertilisers
non-waste biochar
non-waste wood
PAS 100 compost
peat
straw
2 Definition
2.1 Definition and uses
2.1.1 Whole digestate
Whole digestate is defined as whole digestate that is compliant with PAS 110 and the Quality Protocol for anaerobic digestate (WRAP and BSI 2010a, WRAP and Environment Agency 2009a). Whole digestate can be used in the following designated market sectors:
agriculture

8 Product comparators for materials applied to land: soil improver
forestry
soil/field-grown horticulture as a fertiliser or soil improver
The whole digestate can only be used where it does not pose a risk to the environment and does not compromise the future sustainability of the soil.
2.1.2 Primary gypsum
Primary gypsum is defined as gypsum from natural sources. Primary gypsum in the form of agricultural gypsum is applied to land.
2.1.3 Liming materials
An agricultural liming material is defined as a material that contains calcium and magnesium compounds that are capable of neutralising soil acidity. These materials include limestone, chalk, quicklime, hydrated lime, marl, shells and by-products such as slag.
2.2 Properties
2.2.1 Whole digestate
Whole digestate contains substantial quantities of readily available plant nutrients, especially nitrogen, and can improve soil organic matter content. Test parameters and upper limit values for use on land are detailed in PAS 110 and the Quality Protocol for anaerobic digestate. Seven Potentially Toxic Elements (PTEs) are identified with upper limits specified. Other undesirable properties include the potential presence of high levels of Salmonella and Escherichia coli, volatile fatty acids, residual biogas potential and physical contaminants.
2.2.2 Primary gypsum
Gypsum corrects soil acidity in highly acidic soils, improves soil organic matter stability and can be used to reclaim saline soils. Gypsum can be used as a soil conditioner – improving structure and tilth. It can re-flocculate clay particles and is a source of calcium and slow-release sulphur. Gypsum has a small liming effect (around 10% neutralising value) and is very effective at neutralising subsoil acidity.
2.2.3 Liming materials
The effectiveness of a liming material depends on its neutralising value, the fineness of grinding, reactivity and the relative hardness of the parent rock. The effective neutralising value of a lime is the ability for a unit mass of lime to change soil pH. This value takes into account the chemical composition, particle size distribution (percentage by weight) and the solubility of the lime.
Agricultural lime increases the availability of major nutrients nitrogen, phosphate and potassium by:
Product comparators for materials applied to land: soil improver 9
increasing nitrogen fixing in legumes and free-living bacteria
increasing nitrogen, potassium and phosphorous release from organic matter through higher microbial activity
releasing phosphate from iron and aluminium
reducing potassium loss from leaching
Agricultural lime increases the availability of minor nutrients (sulphur, calcium and magnesium) by:
increasing sulphur, calcium and magnesium release from organic matter through higher microbial activity
reducing calcium and magnesium loss by reducing leaching
supplying calcium and magnesium
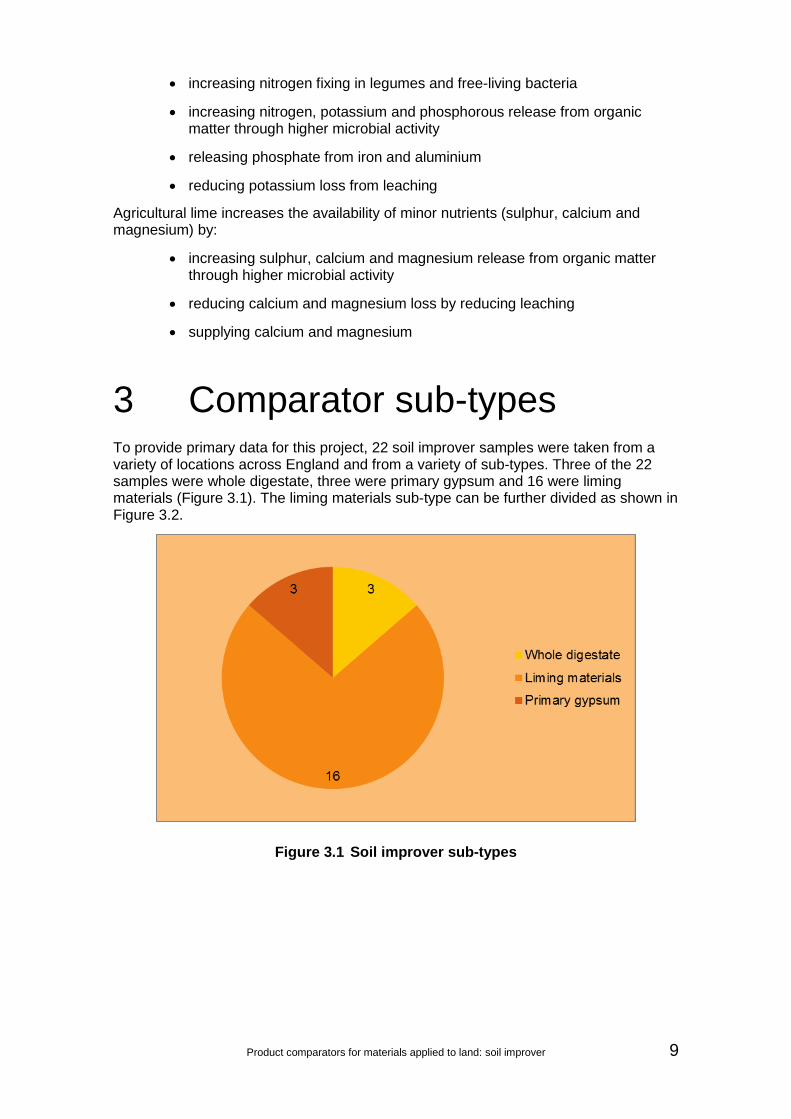
3 Comparator sub-types To provide primary data for this project, 22 soil improver samples were taken from a variety of locations across England and from a variety of sub-types. Three of the 22 samples were whole digestate, three were primary gypsum and 16 were liming materials (Figure 3.1). The liming materials sub-type can be further divided as shown in Figure 3.2.
Figure 3.1 Soil improver sub-types

10 Product comparators for materials applied to land: soil improver
Figure 3.2 Liming material sub-types
4 Material sources
4.1 Whole digestate
Whole digestate samples were requested from a number of facilities listed in the directory of members of the Biofertiliser Certification Scheme (http://www.biofertiliser.org.uk/members).
4.2 Primary gypsum
Primary gypsum suppliers were identified from the Directory of Mines and Quarries (BGS 2010). Primary gypsum samples were requested from quarries listed in the directory.
4.3 Liming materials
Lime samples were requested from a number of lime producers listed in a directory published by the Agricultural Lime Association (http://www.aglime.org.uk/suppliers/index.php).
5 Sampling procedure Samples were taken from a variety of producers across England and to provide a geographical spread.

Product comparators for materials applied to land: soil improver 11
5.1 Whole digestate
Whole digestate was sampled in accordance with PAS 110 (WRAP and BSI 2010a).
5.2 Primary gypsum
Primary gypsum was sampled in accordance with BS EN 1482-1:2007 (BSI 2007).
5.3 Liming materials
Liming materials were sampled in accordance with BS EN 1482-1:2007 (BSI 2007).
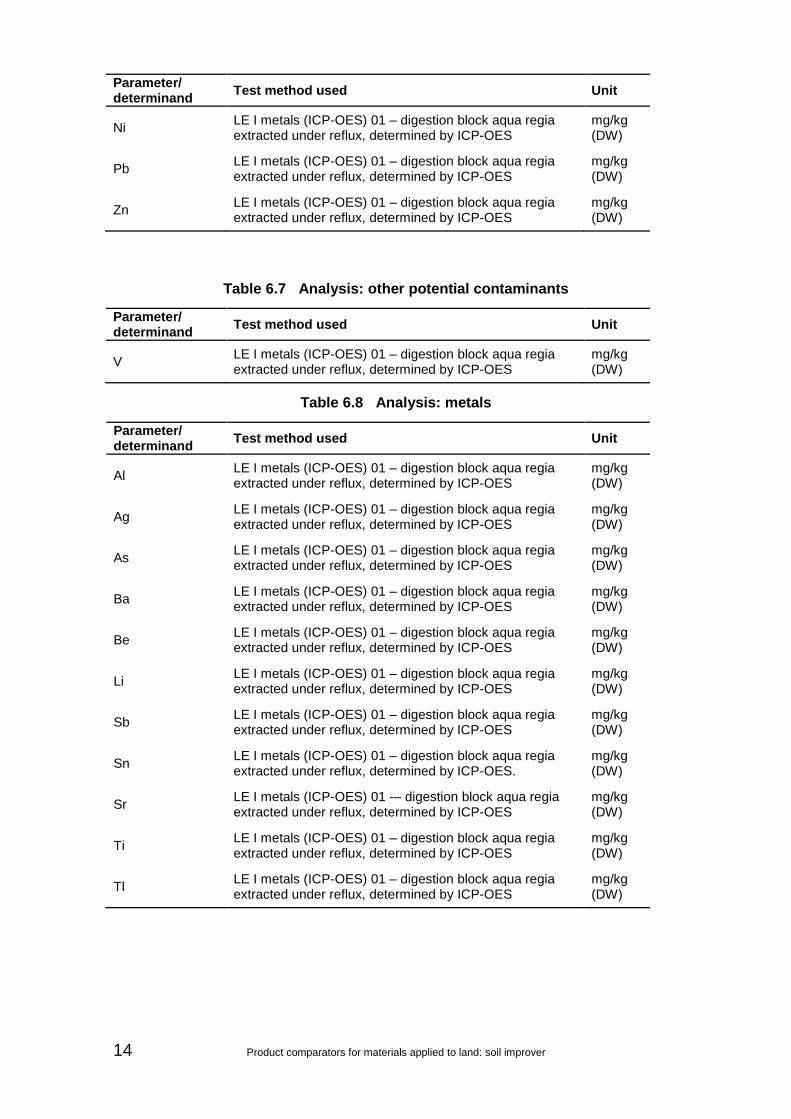
6 Analytical parameters The main parameters determined are summarised in Tables 6.1 to 6.10. All laboratory work was carried out by the Environment Agency’s National Laboratory Service (NLS).
Testing was carried out in accordance with relevant NLS documented in-house methods which meet the requirements of the performance standards of the Environment Agency’s monitoring certification scheme (MCERTS). Specific tests used are outlined in the tables. Other test methods are available.
In the tables, ‘LE’ refers to the NLS Leeds laboratory and SAL refers to Scientific Analysis Laboratories Ltd.
Table 6.1 Analysis: beneficial properties
Parameter/ determinand
Test method used Unit
pH LE I pH and EC 01 pH and conductivity – water extracted, determined by specific electrode from ‘as received’ sample
–
Conductivity LE I pH and EC 01 pH and conductivity – water extracted, determined by specific electrode from ‘‘as received’ sample
µS/cm
Dry solids @ 30°C LE P soil preparation 01 – sample air dried at <30ºC in a controlled environment until constant weight is achieved
%
Dry solids @ 105°C LE I dry solids and LoI 01 dry solids (105ºC) and loss on ignition (500ºC) – thermally treated, determined by gravimetry
%
Loss on ignition (LoI) @ 500°C (organic matter content)
LE I dry solids and LoI 01 dry solids (105ºC) and loss on ignition (500ºC) – thermally treated, determined by gravimetry
%
Carbon, organic as C LE I TOC 01 – combusted with oxygen, thermal conductivity detection
%
Nitrogen as N LE I nutrients (Kone) 01 NH4, TON, NO2 – 2M KCl extraction, determined colorimetrically by discrete analyser on ‘as received’ sample
mg/kg (DW)
Carbon LE I TOC 01 TC % TN – combusted with oxygen, thermal conductivity detection
mg/kg (DW)

12 Product comparators for materials applied to land: soil improver
Parameter/ determinand
Test method used Unit
C:N Calculated value, carbon divided by nitrogen as N n/a
Neutralising value as calcium oxide
SAL determination of neutralising value – sample is dried and ground. Material is extracted with known volume of hydrochloric acid. A test aliquot from the extraction is titrated against phenolphthalein to the endpoint. The result is calculated from the difference in titres against a blank where the same sample has been extracted without acid.
%
EC = electrical conductivity; TOC = total organic carbon; TON = total organic nitrogen; TN = total nitrogen; DW = dry weight
Table 6.2 Analysis: primary nutrients
Parameter/ determinand
Test method used Unit
Total nitrogen (N) Kjeldahl test
Parameter by calculation mg/kg (DW)
Total P LE I metals (ICP-OES) 01 – digestion block aqua regia extracted under reflux, determined by ICP-OES
mg/kg (DW)
Total K LE I metals (ICP-OES) 01 – digestion block aqua regia extracted under reflux, determined by ICP-OES
mg/kg (DW)
Ammoniacal nitrogen as N
LE I nutrients (Kone) 01 NH4, TON, NO2 – 2M KCl extraction, determined colorimetrically by discrete analyser on ‘as received’ sample
mg/kg (DW)
Nitrate as N Parameter by calculation mg/kg (DW)
ICP-OES = inductively coupled plasma optical emission spectrometry
Table 6.3 Analysis: secondary nutrients
Parameter/ determinand
Test method used Unit
Ca LE I metals (ICP-OES) 01 – digestion block aqua regia extracted under reflux, determined by ICP-OES
mg/kg (DW)
Mg LE I metals (ICP-OES) 01 – digestion block aqua regia extracted under reflux, determined by ICP-OES
mg/kg (DW)
Total sulphur
SAL determination of total sulphur – dried and ground aliquot of the sample is weighed into a ceramic crucible. The sample is then oxidised in the analyser’s combustion chamber and any organic sulphur present is converted to sulphur dioxide. The sulphur dioxide in the combustion gases is measured by an infra-red detector.
%

Product comparators for materials applied to land: soil improver 13
Table 6.4 Analysis: trace nutrients
Parameter/ determinand
Test method used Unit
B LE I metals (ICP-OES) 01 – digestion block aqua regia extracted under reflux, determined by ICP-OES
mg/kg (DW)
Cu LE I metals (ICP-OES) 01 – digestion block aqua regia extracted under reflux, determined by ICP-OES
mg/kg (DW)
Fe LE I metals (ICP-OES) 01 – digestion block aqua regia extracted under reflux, determined by ICP-OES
mg/kg (DW)
Mn LE I metals (ICP-OES) 01 – digestion block aqua regia extracted under reflux, determined by ICP-OES
mg/kg (DW)
Mo LE I metals (ICP-OES) 01 – digestion block aqua regia extracted under reflux, determined by ICP-OES
mg/kg (DW)
Zn LE I metals (ICP-OES) 01 – digestion block aqua regia extracted under reflux, determined by ICP-OES
mg/kg (DW)
Chloride LE I halides chloride, bromide and sulphate – water extracted determined directly by ion chromatography on ‘‘as received’ sample
mg/kg (DW)
Table 6.5 Analysis: other elements found in plants which may not be essential for growth
Parameter/ determinand
Test method used Unit
Co LE I metals (ICP-OES) 01 – digestion block aqua regia extracted under reflux, determined by ICP-OES
mg/kg (DW)
Na LE I metals (ICP-OES) 01 – digestion block aqua regia extracted under reflux, determined by ICP-OES
mg/kg (DW)
Ni LE I metals (ICP-OES) 01 – digestion block aqua regia extracted under reflux, determined by ICP-OES
mg/kg (DW)
Se LE I metals (ICP-OES) 01 – digestion block aqua regia extracted under reflux, determined by ICP-OES
mg/kg (DW)
Table 6.6 Analysis: Potentially Toxic Elements (PTEs)
Parameter/ determinand
Test method used Unit
Cd LE I metals (ICP-OES) 01 – digestion block aqua regia extracted under reflux, determined by ICP-OES
mg/kg (DW)
Cr LE I metals (ICP-OES) 01 – digestion block aqua regia extracted under reflux, determined by ICP-OES
mg/kg (DW)
Cu LE I metals (ICP-OES) 01 – digestion block aqua regia extracted under reflux, determined by ICP-OES
mg/kg (DW)
Hg LE I metals (ICP-OES) 01 – digestion block aqua regia extracted under reflux, determined by ICP-OES
mg/kg (DW)
14 Product comparators for materials applied to land: soil improver
Parameter/ determinand
Test method used Unit
Ni LE I metals (ICP-OES) 01 – digestion block aqua regia extracted under reflux, determined by ICP-OES
mg/kg (DW)
Pb LE I metals (ICP-OES) 01 – digestion block aqua regia extracted under reflux, determined by ICP-OES
mg/kg (DW)
Zn LE I metals (ICP-OES) 01 – digestion block aqua regia extracted under reflux, determined by ICP-OES
mg/kg (DW)
Table 6.7 Analysis: other potential contaminants
Parameter/ determinand
Test method used Unit
V LE I metals (ICP-OES) 01 – digestion block aqua regia extracted under reflux, determined by ICP-OES
mg/kg (DW)
Table 6.8 Analysis: metals
Parameter/ determinand
Test method used Unit
Al LE I metals (ICP-OES) 01 – digestion block aqua regia extracted under reflux, determined by ICP-OES
mg/kg (DW)
Ag LE I metals (ICP-OES) 01 – digestion block aqua regia extracted under reflux, determined by ICP-OES
mg/kg (DW)
As LE I metals (ICP-OES) 01 – digestion block aqua regia extracted under reflux, determined by ICP-OES
mg/kg (DW)
Ba LE I metals (ICP-OES) 01 – digestion block aqua regia extracted under reflux, determined by ICP-OES
mg/kg (DW)
Be LE I metals (ICP-OES) 01 – digestion block aqua regia extracted under reflux, determined by ICP-OES
mg/kg (DW)
Li LE I metals (ICP-OES) 01 – digestion block aqua regia extracted under reflux, determined by ICP-OES
mg/kg (DW)
Sb LE I metals (ICP-OES) 01 – digestion block aqua regia extracted under reflux, determined by ICP-OES
mg/kg (DW)
Sn LE I metals (ICP-OES) 01 – digestion block aqua regia extracted under reflux, determined by ICP-OES.
mg/kg (DW)
Sr LE I metals (ICP-OES) 01 -– digestion block aqua regia extracted under reflux, determined by ICP-OES
mg/kg (DW)
Ti LE I metals (ICP-OES) 01 – digestion block aqua regia extracted under reflux, determined by ICP-OES
mg/kg (DW)
Tl LE I metals (ICP-OES) 01 – digestion block aqua regia extracted under reflux, determined by ICP-OES
mg/kg (DW)

Product comparators for materials applied to land: soil improver 15
Table 6.9 Analysis: other analytes
Parameter/ determinand
Test method used Unit
Bromide LE I halides chloride, bromide and sulphate – water extracted determined directly by ion chromatography on ‘as received’ sample
mg/kg (DW)
Cr VI LE I Cr (VI) 01 chromate – alkaline extracted determined by comparator disc colorimetry on ‘as received’ sample
mg/kg (DW)
Fluoride LE I fluoride – 1M H2SO4 extraction, determined by ion selective electrode on ‘as received’ sample.
mg/kg (DW)
Nitrite as N LE I nutrients (Kone) 01 NH4, TON, NO2 – 2M KCl extraction, determined colorimetrically by discrete analyser on ‘as received’ sample.
mg/kg (DW)
Sulphate LE I halides chloride, bromide and sulphate - water extracted determined directly by Ion Chromatography on ‘as received’ sample.
mg/kg (DW)
Total oxidised nitrogen as N
LE I nutrients (Kone) 01 NH4, TON, NO2 – 2M KCl extraction, determined colorimetrically by discrete analyser on ‘as received’ sample.
mg/kg (DW)
Visible contaminants (>2 mm)
SAL determination of percentage stones – the % >2 mm fraction of the soil sample (that is, the fraction of the sample which does not pass through the 2 mm sieve)
%
Table 6.10 Analysis: GCMS semi-volatile screen
Parameter/ determinand
Test method used Unit
Various NLS O SV screens – solvent extracted, determined by GCMS (scan mode)
mg/kg (DW)
O SV = organic semi-volatile; GCMS = gas chromatography–mass spectrometry

16 Product comparators for materials applied to land: soil improver
7 Existing data A limited number of the existing datasets related to soil improvers identified during the literature review had sufficient provenance to be included in this project.
Some data were found on other online sources. However, these data did not meet the quality assurance criteria required for this project and are not reproduced here.
7.1 Whole digestate
Data from PAS 110 for whole digestate are given in Table 7.1. Table 7.2 gives the nutrient content of various digestate products taken from a partial financial assessment for the introduction of the Quality Protocol for anaerobic digestate (WRAP and Environment Agency (2009b).
Table 7.1 Minimum whole digestate quality 1,2
Cd Cr Cu Pb Hg Ni Zn
Upper limit 1.5 100 200 200 1 50 400
Notes: 1 All units mg/kg (DW) 2 Test parameters, upper limit values and declaration parameters for validation Source: WRAP and BSI (2010a)
Table 7.2 Example nutrient content of selected digestate products
Analyte Dry
matter %
Total nitrogen
(kg/tonne)
Available nitrogen
(kg/tonne)
Organic nitrogen left
(kg/tonne)
Phosphate (kg/tonne)
Digested cow slurry 7 5.47 3.29 2.18 1.02
Digested pig slurry 5 5.05 3.78 1.27 1.21
Mixed digester output
4 5.15 4.12 1.03 1.16
Source: WRAP and Environment Agency (2009b)
7.2 Primary and recycled gypsum
Table 7.3 shows values for Potentially Toxic Elements in primary gypsum taken from a WRAP research report (WRAP 2007).
Table 7.3 PTEs analysis of agricultural gypsum
Analyte Units Value
Ca %w/w 18.5
S %w/w 16
Sulphate %w/w 48.1
As mg/kg 1.2

Product comparators for materials applied to land: soil improver 17
Analyte Units Value
Cd mg/kg 0.1
Cr mg/kg 3.9
Cu mg/kg 2
Pb mg/kg 4.2
Mg mg/kg 0.1
Mo mg/kg 0.4
Ni mg/kg 2.2
Se mg/kg 1.6
Zn mg/kg 18.5
Source: WRAP (2007)
7.3 Liming materials
Neutralising values of selected fertiliser and liming materials are given in Table 7.4.
Table 7.4 Neutralising value
Neutralising value (%)
Ground chalk or limestone 50–55
Magnesian limestone 50–-55
Hydrated lime 70
Burnt lime 80
Sugar beet lime 22–32
Source: Defra (2010)
8 Primary data
8.1 Statistical analysis of data
The mean, median, minimum and maximum values for each analyte were calculated. When the sample size was sufficient (that is, ≥10), the 90th percentile was also calculated. All analytical values determined as ‘less than (<)’ values were taken as the values themselves.
Box plots are used to graphically represent groups of quantitative data (Figure 8.1). The sample minimum, lower quartile (Q1), median (Q2), upper quartile (Q3) and sample maximum are used. The median is indicated by the horizontal line that runs across the box (Figure 8.1). The top of the box is the 75th percentile (upper quartile or Q3). The bottom of the box is the 25th percentile (lower quartile or Q1). The interquartile range is represented by the height of the box (Q3 – Q1). A smaller interquartile range indicates less variability in the dataset while a larger interquartile range indicates a variable dataset. Whiskers extend out of the box to represent the sample minimum and maximum. Outliers are plotted as asterisks and are defined as
data points that are 1.5 the interquartile range. The box and whisker plot of

18 Product comparators for materials applied to land: soil improver
manganese concentration in lime shown in Figure 8.1 demonstrates the issue of outliers in the dataset.
2500
2000
1500
1000
500
0
Ma
ng
an
ese
(m
g/k
g)
2310
Boxplot of Manganese, Lime
Figure 8.1 Box plot of manganese concentration in lime
Outliers can adversely affect the statistical analysis by:
giving serious bias or influence to estimates that may be of less interest
increasing the error variance and reducing the power of statistical tests
decreasing normality (if non-random) and altering the odds of type I and II errors
8.2 Using the data tables
The analytical data are provided for:
beneficial properties
primary, secondary and trace nutrients
other elements found in plants which may not be essential for growth, Potentially Toxic Elements (PTEs) and other potential contaminants
other metals and analytes
GCMS semi-volatile screen
We recommend comparing the concentrations of analytes in the comparators dataset to the concentrations in the waste-derived material, paying attention to the higher values. This comparison does not constitute a pass/fail test or an end of waste view. It will provide an indication of whether the waste material contains similar levels of

Product comparators for materials applied to land: soil improver 19
analytes to non-waste materials and whether an end-of-waste application may be appropriate or that further analysis or improved treatment processes may be warranted.
Due to difficulties encountered during sample preparation the limit of detection for some analytes was higher than the target limit of detection.
8.3 Primary data tables
8.3.1 Whole digestate
Primary data are shown in Tables 8.1 to 8.5.
8.3.2 Primary gypsum
Primary data are shown in Tables 8.6 to 8.10.
8.3.3 Liming materials
Primary data are shown in Tables 8.11 to 8.15.

20 Product comparators for materials applied to land: soil improver
Table 8.1 Primary data for whole digestate: beneficial properties
Sample ID pH Conductivity
Dry solids @ 30°C
Dry solids @ 105°C
LoI @ 500°C (organic matter content)
Carbon, organic as C
Nitrogen as N Carbon C:N 1
µS/cm % % % % mg/kg (DW) mg/kg (DW)
Whole digestate 01 7.93 0.01 1.83 18.6 95.1 26.0 54,200 378,000 6.97
Whole digestate 02 8.12 8.24 3.37 2.36 69.8 34.0 46,800 370,000 7.91
Whole digestate 03 7.98 9.46 3.78 27.8 96.4 31.0 51,600 339,000 6.57
Mean 8.01 5.90 2.99 16.3 87.1 30.3 50,867 362,333 7.15
Median 7.98 8.24 3.37 18.6 95.1 31.0 51,600 370,000 6.97
Minimum 7.93 0.01 1.83 2.36 69.8 26.0 46,800 339,000 6.57
Maximum 8.12 9.46 3.78 27.8 96.4 34.0 54,200 378,000 7.91
No. of samples 3 3 3 3 3 3 3 3 3
90th percentile n/a n/a n/a n/a n/a n/a n/a n/a n/a
LOD 0.2 10 0.5 0.5 0.5 0.3 200 1,000 n/a
Notes: 1 Calculated value n/a = not applicable

Product comparators for materials applied to land: soil improver 21
Table 8.2 Primary data for whole digestate: primary, secondary and trace nutrients 1
Sample ID
Primary nutrients Secondary nutrients Trace nutrients
Total nitrogen (N) Kjeldahl
test
Total P
Total K NH3
as N Nitrate
as N Ca Mg
Total sulphur
B Cu Fe Mn Mo Zn Chloride
Whole digestate 01 <54,200 14,700 32,600 405 <3.00 30,200 2,200 0.29 19.1 36.0 2,210 130 6.33 197 79,800
Whole digestate 02 <46,800 10,500 51,000 140 <90.0 24,800 1,550 <0.05 23.9 29.1 1,630 143 2.85 147 38,500
Whole digestate 03 51,600 9,770 76,100 130 <18.5 35,200 1,990 <0.05 24.9 25.8 6,340 206 4.19 98.4 47,400
Mean 50,867 11,657 53,233 225 37.2 30,067 1,913 0.13 22.6 30.3 3,393 160 4.46 147 55,233
Median 51,600 10,500 51,000 140 18.5 30,200 1,990 0.05 23.9 29.1 2,210 143 4.19 147 47,400
Minimum 46,800 9,770 32,600 130 3.00 24,800 1,550 0.05 19.1 25.8 1,630 130 2.85 98.4 38,500
Maximum 54,200 14,700 76,100 405 90.0 35,200 2,200 0.29 24.9 36.0 6,340 206 6.33 197 79,800
No. of samples 3 3 3 3 3 3 3 3 3 3 3 3 3 3 3
90th percentile n/a n/a n/a n/a n/a n/a n/a n/a n/a n/a n/a n/a n/a n/a n/a
LOD n/a 10 50 2 n/a 60 20 0.05 1.0 0.1 1 2 1 2 3
Notes: 1 All units mg/kg (DW) apart from total sulphur for which the units are % (DW).
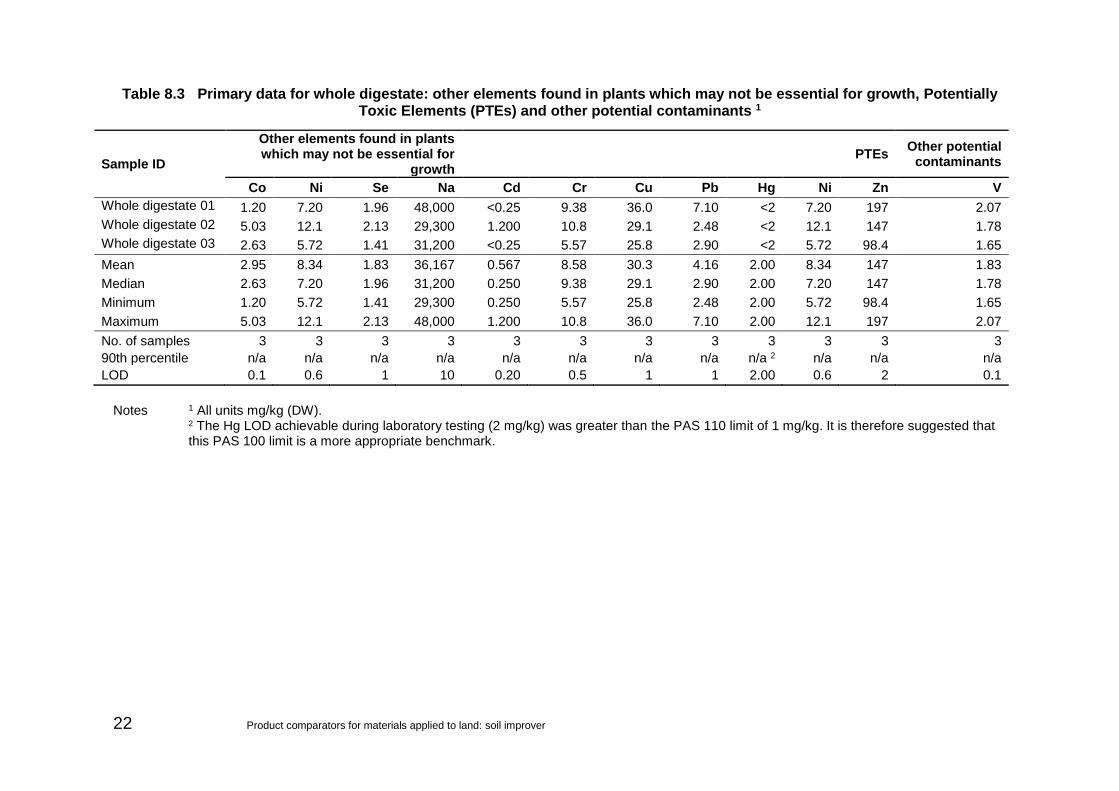
22 Product comparators for materials applied to land: soil improver
Table 8.3 Primary data for whole digestate: other elements found in plants which may not be essential for growth, Potentially Toxic Elements (PTEs) and other potential contaminants 1
Sample ID
Other elements found in plants which may not be essential for
growth PTEs
Other potential contaminants
Co Ni Se Na Cd Cr Cu Pb Hg Ni Zn V
Whole digestate 01 1.20 7.20 1.96 48,000 <0.25 9.38 36.0 7.10 <2 7.20 197 2.07
Whole digestate 02 5.03 12.1 2.13 29,300 1.200 10.8 29.1 2.48 <2 12.1 147 1.78
Whole digestate 03 2.63 5.72 1.41 31,200 <0.25 5.57 25.8 2.90 <2 5.72 98.4 1.65
Mean 2.95 8.34 1.83 36,167 0.567 8.58 30.3 4.16 2.00 8.34 147 1.83
Median 2.63 7.20 1.96 31,200 0.250 9.38 29.1 2.90 2.00 7.20 147 1.78
Minimum 1.20 5.72 1.41 29,300 0.250 5.57 25.8 2.48 2.00 5.72 98.4 1.65
Maximum 5.03 12.1 2.13 48,000 1.200 10.8 36.0 7.10 2.00 12.1 197 2.07
No. of samples 3 3 3 3 3 3 3 3 3 3 3 3
90th percentile n/a n/a n/a n/a n/a n/a n/a n/a n/a 2 n/a n/a n/a
LOD 0.1 0.6 1 10 0.20 0.5 1 1 2.00 0.6 2 0.1
Notes 1 All units mg/kg (DW). 2 The Hg LOD achievable during laboratory testing (2 mg/kg) was greater than the PAS 110 limit of 1 mg/kg. It is therefore suggested that
this PAS 100 limit is a more appropriate benchmark.

Product comparators for materials applied to land: soil improver 23
Table 8.4 Primary data for whole digestate: other metals and analytes 1
Sample ID
Metals Other analytes
Al Sb As Ba Be Li Ag Sr Tl Sn Ti Cr VI Fluoride Bromide Sulphate Nitrite
as N TON as N
Whole digestate 01
2,060 <10 1.54 23.6 <0.01 <6 <10 50.0 <3 <20 17.5 <20 <1000 <3 11,200 <0.1 <3
Whole digestate 02
921 <10 1.18 17.1 <0.01 <6 <10 41.8 <3 <20 9.74 <60 <20 <9 2,640 <3 <90
Whole digestate 03
586 <10 1.28 26.2 <0.01 <6 <10 53.3 <3 <20 9.22 <10 659 <3 3,380 <3 18.5
Mean 1,189 10.0 1.33 22.3 0.01 6 10.0 48.4 3.00 20.0 12.2 12.0 560 5.00 5,740 2.03 37.2
Median 921 10.0 1.28 23.6 0.01 6 10.0 50.0 3.00 20.0 9.74 10.0 659 3.00 3,380 3.00 18.5
Minimum 586 10.0 1.18 17.1 0.01 6 10.0 41.8 3.00 20.0 9.22 6.0 20.0 3.00 2,640 0.10 3.00
Maximum 2,060 10.0 1.54 26.2 0.01 6 10.0 53.3 3.00 20.0 17.5 20.0 1,000 9.00 11,200 3.00 90.0
No. of samples 3 3 3 3 3 3 3 3 3 3 3 3 3 3 3 3 3
90th percentile n/a n/a n/a n/a n/a n/a n/a n/a n/a n/a n/a n/a n/a n/a n/a n/a n/a
LOD 50 1 0.5 0.5 0.1 1 1 1 1 1 3 0.3 20 0.3 5 0.1 3.00
Notes 1 All units mg/kg (DW).

24 Product comparators for materials applied to land: soil improver
Table 8.5 Primary data for whole digestate: GCMS semi-volatile screen 1,2
Sample ID
(3.a
lph
a,5
.beta
) ch
ole
sta
n-3
-ol
2-m
eth
yl b
uta
no
ic a
cid
2,6
-dim
eth
ylp
hen
yl is
ocy
an
ate
3-m
eth
yl b
uta
no
ic a
cid
7- m
eth
yl 1
H-in
do
le
ben
zen
eacetic
acid
s
itoste
rol
bu
tan
oic
acid
ch
ole
sta
no
l
d-lim
on
en
e
n-h
exad
ec
an
oic
acid
p-c
reso
l
ph
en
ol
sq
uale
ne
stig
masta
no
l
Whole digestate 01 37 44 120 21 87 13
Whole digestate 02 40 13 13 21 14 130 16 20 11 10 46 20 30 14
Whole digestate 03 14
Notes: 1 Analytes >10 mg/kg (DW) only; analytes not detected or those with <10mg/kg (DW) have not been reported. 2 The full GCMS screen data with <10 mg/kg values will be included in the comparator spreadsheet tool. The compounds identified at
concentrations greater than the detection level during the GCMS screen are believed to be, in the vast majority of cases, naturally occurring substances within the sample matrix, rather than pollutants.
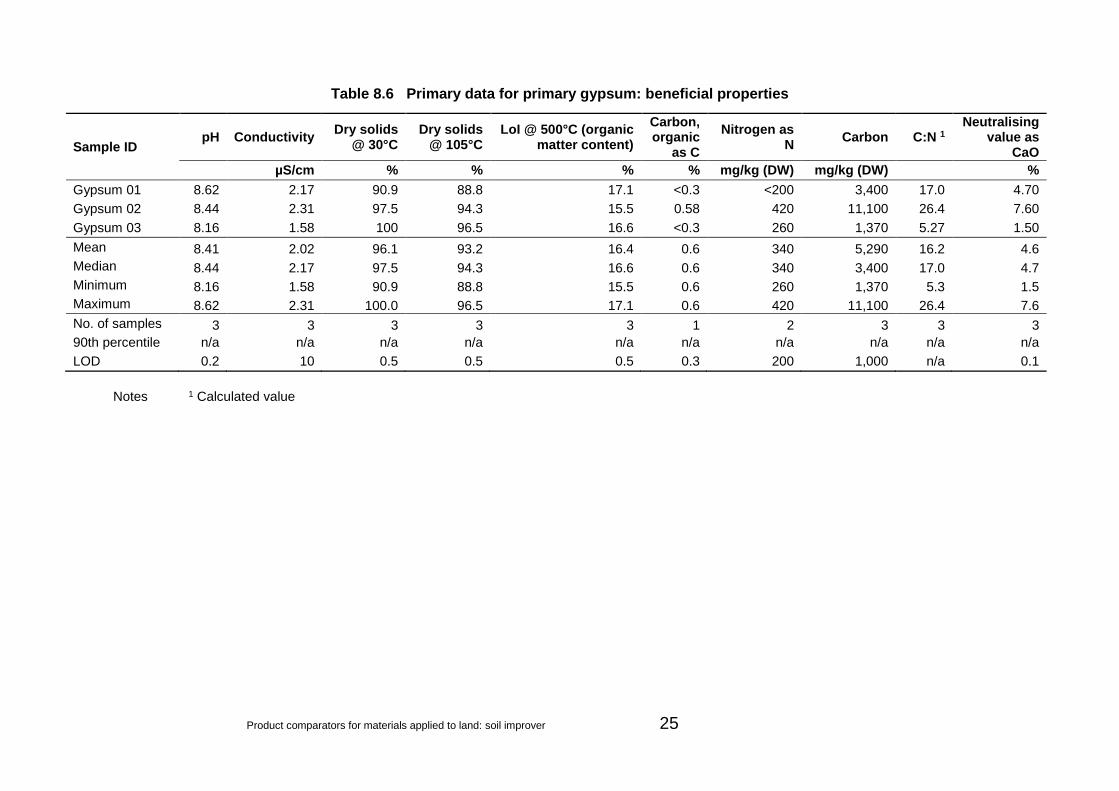
Product comparators for materials applied to land: soil improver 25
Table 8.6 Primary data for primary gypsum: beneficial properties
Sample ID pH Conductivity
Dry solids @ 30°C
Dry solids @ 105°C
LoI @ 500°C (organic matter content)
Carbon, organic
as C
Nitrogen as N
Carbon C:N 1 Neutralising
value as CaO
µS/cm % % % % mg/kg (DW) mg/kg (DW)
%
Gypsum 01 8.62 2.17 90.9 88.8 17.1 <0.3 <200 3,400 17.0 4.70
Gypsum 02 8.44 2.31 97.5 94.3 15.5 0.58 420 11,100 26.4 7.60
Gypsum 03 8.16 1.58 100 96.5 16.6 <0.3 260 1,370 5.27 1.50
Mean 8.41 2.02 96.1 93.2 16.4 0.6 340 5,290 16.2 4.6
Median 8.44 2.17 97.5 94.3 16.6 0.6 340 3,400 17.0 4.7
Minimum 8.16 1.58 90.9 88.8 15.5 0.6 260 1,370 5.3 1.5
Maximum 8.62 2.31 100.0 96.5 17.1 0.6 420 11,100 26.4 7.6
No. of samples 3 3 3 3 3 1 2 3 3 3
90th percentile n/a n/a n/a n/a n/a n/a n/a n/a n/a n/a
LOD 0.2 10 0.5 0.5 0.5 0.3 200 1,000 n/a 0.1
Notes 1 Calculated value
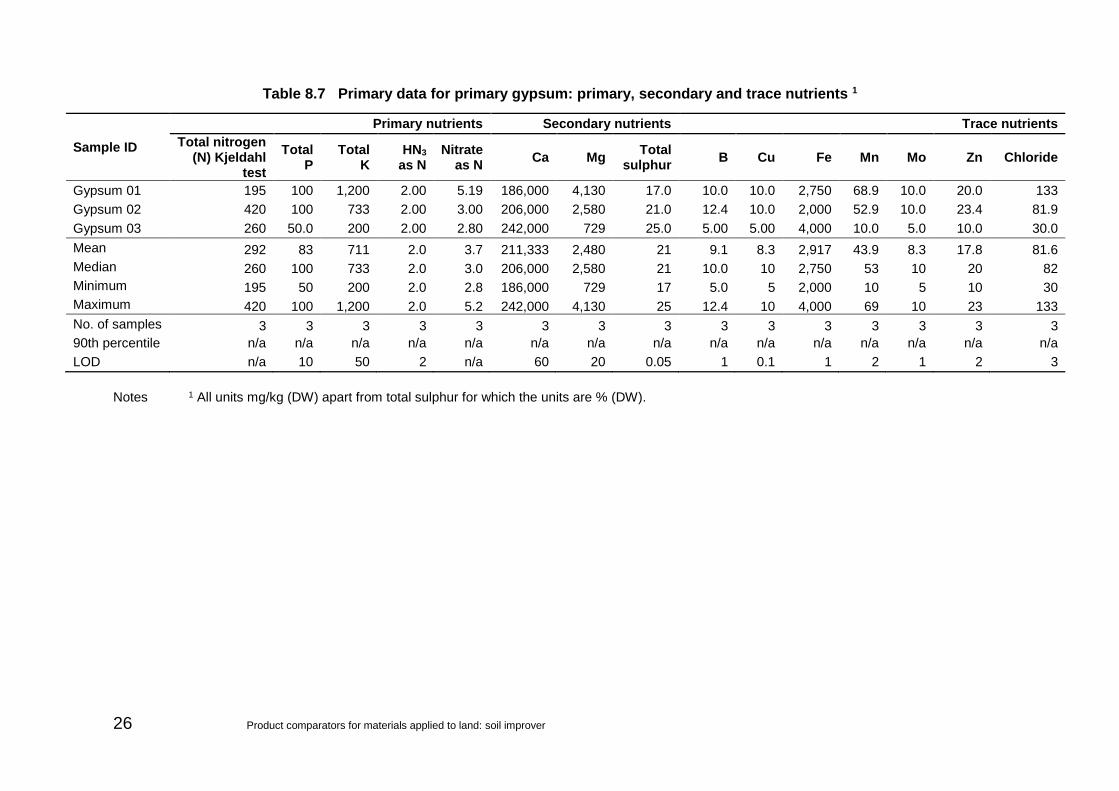
26 Product comparators for materials applied to land: soil improver
Table 8.7 Primary data for primary gypsum: primary, secondary and trace nutrients 1
Sample ID
Primary nutrients Secondary nutrients Trace nutrients
Total nitrogen (N) Kjeldahl
test
Total P
Total K
HN3 as N
Nitrate as N
Ca Mg Total
sulphur B Cu Fe Mn Mo Zn Chloride
Gypsum 01 195 100 1,200 2.00 5.19 186,000 4,130 17.0 10.0 10.0 2,750 68.9 10.0 20.0 133
Gypsum 02 420 100 733 2.00 3.00 206,000 2,580 21.0 12.4 10.0 2,000 52.9 10.0 23.4 81.9
Gypsum 03 260 50.0 200 2.00 2.80 242,000 729 25.0 5.00 5.00 4,000 10.0 5.0 10.0 30.0
Mean 292 83 711 2.0 3.7 211,333 2,480 21 9.1 8.3 2,917 43.9 8.3 17.8 81.6
Median 260 100 733 2.0 3.0 206,000 2,580 21 10.0 10 2,750 53 10 20 82
Minimum 195 50 200 2.0 2.8 186,000 729 17 5.0 5 2,000 10 5 10 30
Maximum 420 100 1,200 2.0 5.2 242,000 4,130 25 12.4 10 4,000 69 10 23 133
No. of samples 3 3 3 3 3 3 3 3 3 3 3 3 3 3 3
90th percentile n/a n/a n/a n/a n/a n/a n/a n/a n/a n/a n/a n/a n/a n/a n/a
LOD n/a 10 50 2 n/a 60 20 0.05 1 0.1 1 2 1 2 3
Notes 1 All units mg/kg (DW) apart from total sulphur for which the units are % (DW).

Product comparators for materials applied to land: soil improver 27
Table 8.8 Primary data for primary gypsum: other elements found in plants which may not be essential for growth, Potentially Toxic Elements (PTEs) and other potential contaminants 1
Sample ID
Other elements found in plants which may not be
essential for growth PTEs
Other potential contaminants
Co Se Na Cd Cr Cu Pb Hg Ni Zn V
Gypsum 01 1.24 <10 <100 <2 <5 <10 <10 <2 <6 <20 10.9
Gypsum 02 <1 <10 252 <2 <5 <10 <10 <2 <6 23.4 5.98
Gypsum 03 <0.5 <5 <50 <1 <2 <5 <5 <1 <3 <10 3.91
Mean 0.9 8.3 134 1.7 4.0 8.3 8.3 1.7 5 17.8 6.9
Median 1.0 10 100 2 5 10 10 2 6 20.0 6.0
Minimum 0.5 5 50 1 2 5 5 1 3 10.0 3.9
Maximum 1.2 10 252 2 5 10 10 2 6 23.4 10.9
No. of samples 3 3 3 3 3 3 3 3 3 3 3
90th percentile n/a n/a n/a n/a n/a n/a n/a n/a n/a n/a n/a
LOD 0.1 1 10 0.2 0.5 1 1 0.2 0.6 2 0.1
Notes 1 All units mg/kg (DW).

28 Product comparators for materials applied to land: soil improver
Table 8.9 Primary data for primary gypsum: other metals and analytes 1
Sample ID
Metals Other analytes
Al Sb As Ba Be Li Ag Sr Tl Sn Ti Cr VI Fluoride Bromide Sulphate Nitrite
as N TON as N
Gypsum 01 2,810 <10 <5 40.8 <1 <10 <10 1,190 <10 <10 <30 <0.4 24.8 <0.3 3,210 <0.1 5.19
Gypsum 02 1,990 <10 <5 38.9 <1 <10 <10 645 <10 <10 38.5 <0.3 313 1.16 47.2 <0.1 <3
Gypsum 03 395 <5 <2 41.6 <0.5 <5 <5 1,620 <5 <5 <10 <0.3 <20 3.42 3,070 0.20 <3
Mean 1,732 8 4 40.4 1 8 8 1,152 8 8 26 0.3 119 1.63 2,109 0.13 4
Median 1,990 10 5 40.8 1 10 10 1,190 10 10 30 0.3 25 1.16 3,070 0.1 3
Minimum 395 5 2 38.9 1 5 5 645 5 5 10 0.3 20 0.30 47.2 0.1 3
Maximum 2,810 10 5 41.6 1 10 10 1,620 10 10 38.5 0.4 313 3.42 3,210 0.2 5
No. of samples 3 3 3 3 3 3 3 3 3 3 3 3 3 3 3 3 3
90th percentile n/a n/a n/a n/a n/a n/a n/a n/a n/a n/a n/a n/a n/a n/a n/a n/a n/a
LOD 50 1 0.5 0.5 0.1 1 1 1 1 1 3 0.3 20 0.3 5 0.1 3
Notes 1 All units mg/kg (DW).

Product comparators for materials applied to land: soil improver 29
Table 8.10 Primary data for primary gypsum: GCMS semi-volatile screen 1,2
Sample ID
hyd
roca
rbo
ns in
dic
atin
g a
refin
ed
, h
eavy, s
pe
cia
lised
oil
di(2
-eth
ylh
ex
yl) p
hth
ala
te
(DE
HP
)
di-n
-bu
tyl p
hth
ala
te
stig
masta
ne
-3,5
-dio
ne (5
.alp
ha)
Gypsum 01 Yes
Gypsum 02 Yes
Gypsum 03 13
Notes: 1 Analytes >10 mg/kg (DW) only; analytes not detected or those with <10mg/kg (DW) have not been reported. 2 The full GCMS screen data with <10 mg/kg values will be included in the comparator spreadsheet tool. The compounds identified at
concentrations greater than the detection level during the GCMS screen are believed to be, in the vast majority of cases, naturally occurring substances within the sample matrix, rather than pollutants.

30 Product comparators for materials applied to land: soil improver
Table 8.11 Primary data for liming materials: beneficial properties
Sample ID pH Conductivity
Dry solids @ 30°C
Dry solids @ 105°C
LoI @ 500°C (organic matter content)
Carbon, organic
as C
Nitrogen as N
Carbon C:N 1 Neutralising
value as CaO
µS/cm % % % % mg/kg (DW) mg/kg (DW)
%
Lime 01 9.37 0.08 97.4 97.6 0.50 <0.3 200 12,600 63.0 94.9
Lime 02 9.41 0.05 98.0 98.6 1.41 <0.3 200 120,000 600 94.6
Lime 03 9.21 0.46 97.3 97.2 2.68 1.74 200 120,000 600 85.2
Lime 04 9.51 0.12 99.6 99.6 0.60 <0.3 760 120,000 158 91.3
Lime 05 9.59 0.08 95.4 95.8 0.50 <0.3 430 121,000 281 93.5
Lime 06 7.95 1.69 99.4 99.5 3.51 1.72 200 133,000 665 95.1
Lime 07 8.79 0.07 87.8 88.0 0.68 <0.3 440 114,000 259 91.5
Lime 08 8.88 0.05 84.8 84.5 0.69 <0.3 200 119,000 595 95.1
Lime 09 8.99 0.04 89.7 89.7 0.50 <0.3 200 119,000 595 96.9
Lime 10 8.79 0.05 84.2 83.6 0.68 <0.3 200 117,000 585 95.9
Lime 11 8.73 0.14 94.2 94.1 0.50 <0.3 200 117,000 585 94.3
Lime 12 8.58 0.19 99.5 99.4 1.01 <0.3 200 87,800 439 75.9
Lime 13 9.42 0.14 96.6 96.8 2.24 3.81 230 127,000 552 93.6
Lime 14 9.45 0.26 96.5 96.8 3.05 4.08 210 128,000 610 87.3
Lime 15 7.54 4.18 81.3 74.6 12.6 6.46 4770 132,000 27.7 56.2
Lime 16 8.06 1.81 82.8 59.6 11.6 3.47 4730 99,200 21.0 43.5
Mean 8.89 0.59 92.8 91.0 2.67 1.52 835.6 111,663 415 86.6
Median 8.94 0.13 96.0 96.3 0.85 0.30 200 119,500 569 93.6
Minimum 7.54 0.04 81.3 59.6 0.50 0.30 200 12,600 21.0 43.5
Maximum 9.59 4.18 99.6 99.6 12.6 6.46 4770 133,000 665 96.9
No. of samples 16 16 16 16 16 16 16 16 16 16
90th percentile 9.48 1.75 99.5 99.5 7.56 3.95 2745 130,000 605 95.5
LOD 0.2 10 0.5 0.5 0.5 0.3 200 1,000 n/a 0.1
Notes 1 Calculated value

Product comparators for materials applied to land: soil improver 31
Table 8.12 Primary data for liming materials: primary, secondary and trace nutrients 1
Sample ID
Primary nutrients Secondary nutrients Trace nutrients
Total nitrogen (N)
Kjeldahl test
Total P
Total K
NH3 as N
Nitrate as N
Ca Mg Total
sulphur B Cu Fe Mn Mo Zn Chloride
Lime 01 <195 <60.0 296 <2 4.48 389,000 1,440 0.05 <1 1.44 597 241 <2 27.5 <30
Lime 02 <200 <60.0 355 <2 <3.00 369,000 1,320 0.15 <1 2.92 1,100 290 <2 48.6 <30
Lime 03 <195 1260 858 <2 <5.13 212,000 97,900 0.12 3.65 9.71 12,700 2,310 <2 22.8 344
Lime 04 <760 <200 <1,000 <2 <3.00 414,000 1,660 <0.05 <20 <20 <4,000 110 <20 50.8 <30
Lime 05 <430 <200 <1,000 <2 <3.00 405,000 4,210 <0.05 <20 <20 <4,000 711 <20 <40 <30
Lime 06 <200 <200 <1,000 <2 <3.00 384,000 1,600 0.17 <20 <20 <4,000 178 <20 <40 <30
Lime 07 <440 637 <1,000 <2 <3.00 384,000 1,290 <0.05 <20 <20 <4,000 418 <20 <40 <30
Lime 08 <200 336 <1,000 <2 <3.00 402,000 1,170 <0.05 2.81 2.87 <4,000 329 <2 12.3 <40
Lime 09 <200 367 <1,000 <2 <3.00 413,000 1,070 <0.05 1.85 2.06 <4,000 387 <2 10.6 <30
Lime 10 * 657 <1,000 <2 * 400,000 1,110 <0.05 2.03 1.31 <4,000 411 <2 12.7 <40
Lime 11 <200 443 <1,000 <2 <2.28 396,000 1,090 0.05 3.62 1.50 <4,000 328 <2 17.3 <30
Lime 12 <200 113 1,050 <2 <3.00 306,000 1,940 <0.05 4.06 2.30 6,290 113 <1 23.4 19.9
Lime 13 <230 18.7 140 <2 <3.00 301,000 65,400 <0.05 <1 2.60 2,720 960 <1 56.7 123
Lime 14 <210 44.9 340 <2 <3.00 219,000 131,000 <0.05 <5 <5 4,620 865 <5 28.2 196
Lime 15 <4,770 7,310 1,340 9.69 <4.00 310,000 6,670 0.09 <5 13.8 <4,000 281 <5 58.3 13.9
Lime 16 <4,730 6,740 704 461 <4.00 246,000 3,870 0.18 <5 15.5 <4,000 214 <5 42.7 11.3
Mean 877 1,165 818 31.2 3.33 346,875 20,171 0.08 7.25 8.81 4,252 509 6.94 33.2 64.3
Median 200 268 1,000 2.00 3.00 384,000 1,630 0.05 3.86 3.96 4,000 329 2.00 34.1 30.0
Minimum 195 18.7 140 2.00 2.28 212,000 1,070 0.05 1.00 1.31 597 110 1.00 10.6 11.3
Maximum 4,770 7,310 1,340 461 5.13 414,000 131,000 0.18 20.0 20.0 12,700 2,310 20.0 58.3 344
No. of samples 15 16 16 16 15 16 16 16 16 16 16 16 16 16 16
90th percentile 3,142 4,000 1,025 5.85 4.29 409,000 81,650 0.16 20.0 20.0 5,455 913 20.0 53.8 160
LOD n/a 10 50 2 n/a 60 20 0.05 1 0.1 1 2 1 2 3
Notes 1 All units mg/kg (DW) apart from total sulphur for which the units are % (DW). * Sample unsuitable

32 Product comparators for materials applied to land: soil improver
Table 8.13 Primary data for liming materials: other elements found in plants which may not be essential for growth, Potentially Toxic Elements (PTEs) and other potential contaminants 1
Sample ID
Other elements found in plants which may not be
essential for growth PTEs
Other potential contaminants
Co Se Na Cd Cr Cu Pb Hg Ni Zn V
Lime 01 <0.3 <1 68.9 1.640 4.49 1.44 33.7 <2 1.64 27.5 3.73
Lime 02 0.75 <1 57.4 2.030 4.61 2.92 58.6 <2 4.14 48.6 5.07
Lime 03 1.11 <1 377 <0.25 4.98 9.71 13.0 <2 9.25 22.8 10.6
Lime 04 <2 <20 <200 <4 11.4 <20 41.5 <4 <10 50.8 6.94
Lime 05 <2 <20 <200 <4 10.6 <20 <20 <4 <10 <40 5.54
Lime 06 <2 <20 425 <4 <10 <20 32.4 <4 <10 <40 4.96
Lime 07 <2 <20 226 <4 <10 <20 <20 <4 <10 <40 7.88
Lime 08 1.00 <1 <200 <0.25 0.67 2.87 <1 <2 3.04 12.3 1.06
Lime 09 1.39 <1 <200 <0.3 0.62 2.06 <1 <2 3.05 10.6 1.62
Lime 10 0.88 <1 242 0.469 1.26 1.31 <1 <2 2.31 12.7 3.69
Lime 11 0.75 <1 258 0.313 1.53 1.50 <1 <2 1.96 17.3 3.51
Lime 12 1.15 <1 144 <0.2 8.30 2.30 2.23 <0.2 6.46 23.4 12.5
Lime 13 0.22 <1 158 0.713 5.24 2.60 4.34 <0.2 3.03 56.7 4.75
Lime 14 1.80 <5 409 <1 <3 <5 8.40 <1 <3 28.2 1.06
Lime 15 0.55 <5 189 <1 9.38 13.8 10.3 <1 <3 58.3 9.85
Lime 16 <0.5 <5 169 <1 6.42 15.5 7.96 <1 <3 42.7 5.96
Mean 1.15 6.50 220 1.573 5.78 8.81 16.0 2.09 5.24 33.2 5.55
Median 1.05 1.00 200 1 5.11 3.96 9.35 2 3.05 34.1 5.02
Minimum 0.22 1.00 57.4 0.2 0.62 1.31 1.00 0.20 1.64 10.6 1.06
Maximum 2.00 20.0 425 4 11.4 20.0 58.6 4 10.0 58.3 12.5
No. of samples 16 16 16 16 16 16 16 16 16 16 16
90th percentile 2 20 393 4 10.3 20 37.6 12 10.0 53.8 10.2
LOD 0.1 1 10 0.2 0.5 1 1 0.2 0.6 2 0.1
Notes 1 All units mg/kg (DW). 2 The PAS 100 limit for Hg has been used due to sample clean-up problems
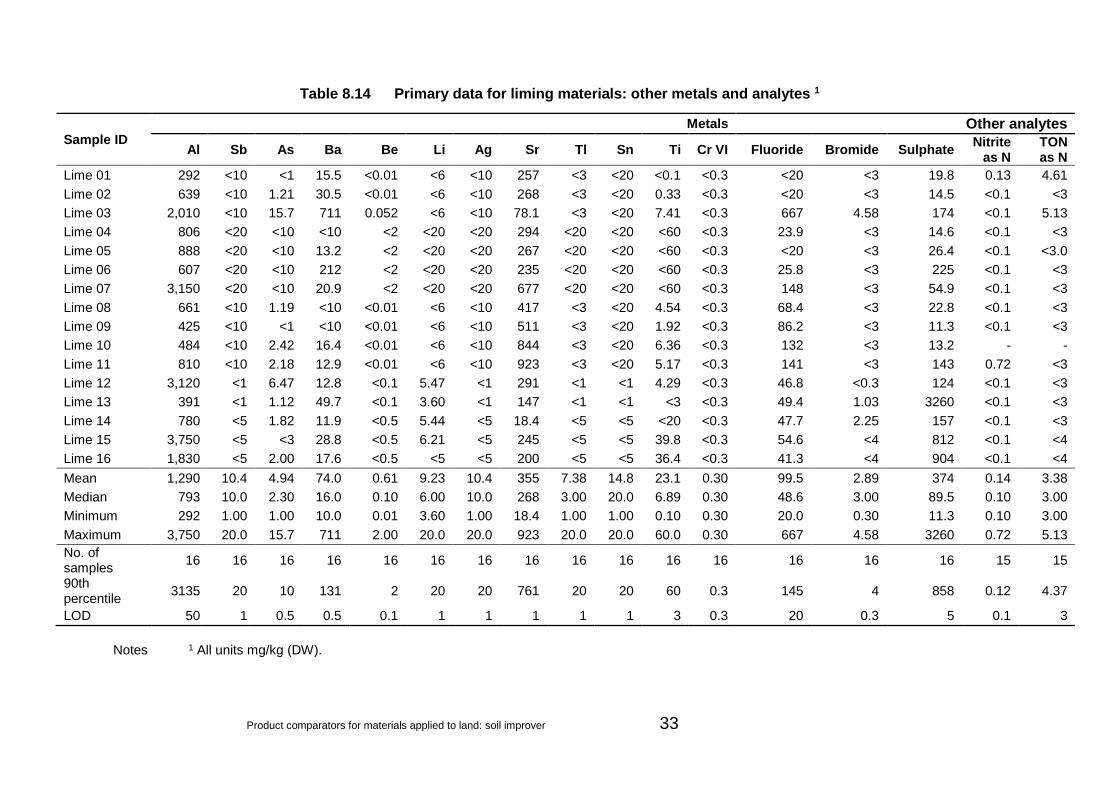
Product comparators for materials applied to land: soil improver 33
Table 8.14 Primary data for liming materials: other metals and analytes 1
Sample ID
Metals Other analytes
Al Sb As Ba Be Li Ag Sr Tl Sn Ti Cr VI Fluoride Bromide Sulphate Nitrite
as N TON as N
Lime 01 292 <10 <1 15.5 <0.01 <6 <10 257 <3 <20 <0.1 <0.3 <20 <3 19.8 0.13 4.61
Lime 02 639 <10 1.21 30.5 <0.01 <6 <10 268 <3 <20 0.33 <0.3 <20 <3 14.5 <0.1 <3
Lime 03 2,010 <10 15.7 711 0.052 <6 <10 78.1 <3 <20 7.41 <0.3 667 4.58 174 <0.1 5.13
Lime 04 806 <20 <10 <10 <2 <20 <20 294 <20 <20 <60 <0.3 23.9 <3 14.6 <0.1 <3
Lime 05 888 <20 <10 13.2 <2 <20 <20 267 <20 <20 <60 <0.3 <20 <3 26.4 <0.1 <3.0
Lime 06 607 <20 <10 212 <2 <20 <20 235 <20 <20 <60 <0.3 25.8 <3 225 <0.1 <3
Lime 07 3,150 <20 <10 20.9 <2 <20 <20 677 <20 <20 <60 <0.3 148 <3 54.9 <0.1 <3
Lime 08 661 <10 1.19 <10 <0.01 <6 <10 417 <3 <20 4.54 <0.3 68.4 <3 22.8 <0.1 <3
Lime 09 425 <10 <1 <10 <0.01 <6 <10 511 <3 <20 1.92 <0.3 86.2 <3 11.3 <0.1 <3
Lime 10 484 <10 2.42 16.4 <0.01 <6 <10 844 <3 <20 6.36 <0.3 132 <3 13.2 - -
Lime 11 810 <10 2.18 12.9 <0.01 <6 <10 923 <3 <20 5.17 <0.3 141 <3 143 0.72 <3
Lime 12 3,120 <1 6.47 12.8 <0.1 5.47 <1 291 <1 <1 4.29 <0.3 46.8 <0.3 124 <0.1 <3
Lime 13 391 <1 1.12 49.7 <0.1 3.60 <1 147 <1 <1 <3 <0.3 49.4 1.03 3260 <0.1 <3
Lime 14 780 <5 1.82 11.9 <0.5 5.44 <5 18.4 <5 <5 <20 <0.3 47.7 2.25 157 <0.1 <3
Lime 15 3,750 <5 <3 28.8 <0.5 6.21 <5 245 <5 <5 39.8 <0.3 54.6 <4 812 <0.1 <4
Lime 16 1,830 <5 2.00 17.6 <0.5 <5 <5 200 <5 <5 36.4 <0.3 41.3 <4 904 <0.1 <4
Mean 1,290 10.4 4.94 74.0 0.61 9.23 10.4 355 7.38 14.8 23.1 0.30 99.5 2.89 374 0.14 3.38
Median 793 10.0 2.30 16.0 0.10 6.00 10.0 268 3.00 20.0 6.89 0.30 48.6 3.00 89.5 0.10 3.00
Minimum 292 1.00 1.00 10.0 0.01 3.60 1.00 18.4 1.00 1.00 0.10 0.30 20.0 0.30 11.3 0.10 3.00
Maximum 3,750 20.0 15.7 711 2.00 20.0 20.0 923 20.0 20.0 60.0 0.30 667 4.58 3260 0.72 5.13
No. of samples
16 16 16 16 16 16 16 16 16 16 16 16 16 16 16 15 15
90th percentile
3135 20 10 131 2 20 20 761 20 20 60 0.3 145 4 858 0.12 4.37
LOD 50 1 0.5 0.5 0.1 1 1 1 1 1 3 0.3 20 0.3 5 0.1 3
Notes 1 All units mg/kg (DW).

34 Product comparators for materials applied to land: soil improver
Table 8.15 Primary data for liming materials: GCMS semi-volatile screen 1,2
Sample ID
pre
sen
ce o
f
die
sel/h
eatin
g o
il or,
sp
ecia
lised
heav
y
refin
ed
oil
no
thin
g u
nu
su
al fo
un
d
p-c
reso
l (4-
meth
ylp
hen
ol)
ph
en
ol
stig
mast-7
,25-d
ien
-3-o
l, (3
.beta
.,5.a
lph
a.)
stig
mast-7
-en
-3-o
l,
(3.b
eta
,5.a
lph
a) Lime 01
Lime 02 Yes
Lime 03
Lime 04
Lime 05
Lime 06
Lime 07 Yes
Lime 08
Lime 09 Yes
Lime 10
Lime 11
Lime 12
Lime 13
Lime 14 Yes
Lime 15
Lime 16
Notes: 1 Analytes >10 mg/kg (DW) only; analytes not detected or those with <10mg/kg (DW) have not been reported. 2 The full GCMS screen data with <10 mg/kg values will be included in the comparator spreadsheet tool. The compounds identified at
concentrations greater than the detection level during the GCMS screen are believed to be, in the vast majority of cases, naturally occurring substances within the sample matrix, rather than pollutants.

Product comparators for materials applied to land: soil improver 35
9 Conclusions Data are presented for 22 samples of non-waste soil improver. Physical properties and chemical analyses are provided. These data can be used by companies and individuals to assist in the process of applying for end-of-waste status for their products, either by confirming their product’s comparable composition or identifying problems to be rectified before such status can be achieved.
Whilst published data were identified and collected, they were not in a form that could be added to these data.

36 Product comparators for materials applied to land: soil improver
References BGS, 2010. Directory of Mines and Quarries, 9th edition. Keyworth, Nottingham: British Geological Society.
BSI, 2007. BS EN 1482-1:2007. Fertilisers and Liming Materials. Sampling and Sample Preparation – Part 1: Sampling. London: British Standards Institution.
DEFRA, 2010. Fertiliser Manual (RB209), 9th edition. London: The Stationary Office.
WRAP, 2007. Plasterboard Technical Report: Recycled Gypsum as a Soil Treatment In Potato Production. Banbury: WRAP.
WRAP AND BSI, 2010. PAS 110:2010. Specification for Whole Digestate, Separated Liquor and Separated Fibre Derived from the Anaerobic Digestion of Source-segregated Biodegradable Materials. London: British Standards Institution.
WRAP AND ENVIRONMENT AGENCY, 2009a. Quality Protocol. Anaerobic Digestate. End of waste criteria for the production and use of quality outputs from anaerobic digestion of source-separated biodegradable waste. Banbury: WRAP.
WRAP AND ENVIRONMENT AGENCY, 2009b. Waste Protocols Project. Anaerobic Digestate. Partial financial impact assessment for the introduction of a quality protocol for the introduction and use of anaerobic digestate. Bristol: Environment Agency.

Product comparators for materials applied to land: soil improver 37
List of abbreviations AAS atomic absorption spectrometry
1M 1 molar
2M 2 molar
Ag Silver
Al Aluminium
As Arsenic
B Boron
Ba Barium
Be Beryllium
C Carbon
Ca Calcium
CaO Calcium oxide
Cd Cadmium
Chromium VI Chromium Hexavalent
Co Cobalt
Cr Chromium
Cu Copper
DW dry weight
EC electrical conductivity
Fe Iron
GCMS gas chromatography–mass spectrometry
H2SO4 Sulphuric acid
Hg Mercury
ICP-AES inductively coupled plasma atomic emission spectroscopy
ICP-OES inductively coupled plasma optical emission spectrometry
K Potassium
KCL Potassium chloride
LE Leeds laboratory of NLS
Li Lithium
LOD limit of detection
LoI loss on ignition

38 Product comparators for materials applied to land: soil improver
Mg Magnesium
Mn Manganese
Mo Molybdenum
N Nitrogen
Na Sodium
NH3 as N Ammoniacal nitrogen
NH4 Ammonium
Ni Nickel
NLS National Laboratory Service [Environment Agency]
NO2 Nitrogen dioxide
O SV Organic semi volatile
P Phosphorus
PAS Publically Available Standard
Pb Lead
PTEs Potentially Toxic Elements
SAL Scientific Analysis Laboratories Limited
Sb Antimony
Se Selenium
Sn Tin
Sr Strontium
TC total carbon
Ti Titanium
Tl Thallium
TN total nitrogen
TOC total organic carbon
TON total organic nitrogen
V Vanadium
Zn Zinc

15 of 15
www.gov.uk/environment-agency