master’s thesis supervisors: prof.dr.ir. f.p.t. baaijens ... · pdf filemaster’s...
TRANSCRIPT

Caries lesion structure related tothe rate of demineralisation
K.M.P. Wishaupt
BMTE 06.16
Master’s Thesis
Supervisors: Prof.dr.ir. F.P.T. BaaijensDr.ir. D. BrokkenDr. B. GottenbosDr.ir. C.W.J. Oomens
Eindhoven University of TechnologyDepartment of Biomedical EngineeringMaterials Technology
Eindhoven, March 2006


Preface
Well, here it is then: my master’s thesis. Writing a preface gives me the opportunityto share a few words about the past year. It has been some fifteen months ago thatI started my graduation project. My project basically started from scratch and endedwith a submission for a conference, the project being accelerated by an old PhD-thesisI found hidden on a dusty bookshelf.
However, there also was a factor that delayed my project. A little something calledRSI granted me an extra two-months holiday over the summer and a relaxed final twomonths. I would like to thank my physiotherapist, Willem van de Bungelaar, for hishelp and support.
Now that I started acknowledging people, I of course would like to thank my super-visors. So Dirk Brokken (Philips), Bart Gottenbos (Philips), Cees Oomens (TU/e) andFrank Baaijens (TU/e): thanks! I owe a special thanks to Bart, who was always keento help me and has been my most enthousiastic and my most critical coach.
Furthermore, I would like to acknowledge Bob ten Cate (ACTA), Rob Extercate(ACTA) and Jac Tournoij (Philips) whose expertise, enthousiasm and assistance havebeen very valuable. Also thanks to Peter for reviewing my report and to my fellowstudents at Philips, without whom it would have been very silent indeed...
This leaves me to the last two people I would like to say thank you to. Daan, youwere horrible and you know it, but you were also one of the best. Eddy... thanks foralways being there for me and for never letting me down.
i

ii

Abstract
Dental caries is a process in which a tooth demineralises (loses mineral) under theinfluence of acids produced by bacteria. It is relevant for treatment decisions to knowthe rate at which the tooth demineralises. The research question was stated whetherthe rate of demineralisation is related to the three zones of the caries lesion, being thesurface layer, the lesion body and the lesion front.
Data from literature, an experiment and a numerical model were used to study thisquestion. In the experiment, buffered solutions of different pH were used to createlesions at a different rate. Afterwards, the lesions were evaluated with scanning electronmicroscopy (SEM) and transverse microradiography (TMR). In the numerical modelcaries was simulated by modelling dissolution of mineral at a variable pH and diffusionof ions in 1-dimension.
Characteristic points of the mineral content vs. depth graph were used to characteriselesion structure: the amount of mineral and location of the maximum in the surface andthe minimum in the lesion body and the depth of the lesion. These characteristics werecorrelated to the rate of demineralisation which was calculated using the total mineralloss of the lesion and the demineralisation time.
Analysis of literature and experimental data [1] learned that the surface layer wasrelatively unaffected by the demineralisation rate. This could be explained by thepresence of fluoride which renders the surface less acid-soluble. The results of thenumerical simulation supported this explanation as they showed that the presence of agradient in solubility is essential for surface layer formation.
In both the experimental and literature data, the depth at which the minimum in thelesion body was found and the lesion depth correlated with the rate of demineralisa-tion: the higher the rate of demineralisation, the faster the lesion body and front movedinward. The minimum mineral content in the lesion body also correlated with the dem-ineralisation rate. This could be explained by solubility differences within the enamel.
iii

iv
Once a certain proportion of the enamel has dissolved, a fraction remains that is lesssoluble and does not dissolve at the given demineralisation challenge. The dissolutionprocess then proceeds in the deeper layers of the enamel.
Due to the assumptions made, the numerical simulation did not give a realistic ac-count of the the events in the lesion body and front. Before these assumptions canbe omitted and the theory of solubility differences can be tested, the conditions underwhich the model is stable should be analysed.
For caries diagnostics, the ability to measure the rate of demineralisation in-vivo isdesirable. Investigation learned that it will be difficult to use lesion characteristics as anin-vivo measure of the rate of demineralisation. Monitoring the amount of mineral lossover time may be a better approach to measure the rate of demineralisation in-vivo. Aspolarisation sensitive optical coherence tomography (PS-OCT) is a technique capableof measuring mineral loss in-vivo, this technique may be applicable as a tool to assessdemineralisation rate in-vivo.

Samenvatting
Caries is een proces waarin een tand demineraliseert (mineraal verliest) onder invloedvan zuur geproduceerd door bacterien. Voor de behandeling van caries is het van belangom de snelheid te weten waarmee de tand demineraliseert. De onderzoeksvraag werdgeformuleerd of de demineralisatiesnelheid gerelateerd is aan de drie zones in de carieslesie, te weten de oppervlaktelaag, de kern van de lesie en het lesie front.
Data uit de literatuur, een experiment en een numeriek model zijn benut om dezevraag te onderzoeken. In het experiment zijn bufferoplossingen van verschillende pHgebruikt om lesies te creeren met een verschillende snelheid. Daarna zijn de lesiesbekeken met scanning-electronenmicroscopie (SEM) en gemeten met transversale mi-croradiografie (TMR). In het numerieke model is caries gesimuleerd door het oplossenvan mineraal bij een variabele pH en de diffusie van ionen te modelleren in 1 dimensie.
Karakteristieke punten in de mineraalgehalte vs. diepte grafiek zijn bepaald om delesie structuur te karakteriseren: de hoeveelheid mineraal en de plaats van het maximumin de oppervlaktelaag en het minimum in de lesie kern en de diepte van de lesie. Dezekarakteristieken zijn gecorreleerd aan de demineralisatiesnelheid die werd berekend uitde totale hoeveelheid mineraal verlies van de lesie en de demineralisatie tijd.
Uit analyse van data uit de literatuur [1] en een experiment bleek dat de opper-vlaktelaag nauwelijks beınvloed werd door de demineralisatiesnelheid. Dit kon wordenverklaard door de aanwezigheid van fluoride, aangezien fluoride ervoor zorgt dat hetoppervlak minder oplosbaar wordt voor zuur. De resultaten van de numerieke simulatieondersteunden deze verklaring door aan te tonen dat de aanwezigheid van een gradientin oplosbaarheid essentieel is voor de vorming van een oppervlaktelaag.
Zowel in de literatuur als in de experimentele data correleerden de plaats waarop hetminimum in de lesie kern werd gevonden en de lesie diepte met de demineralisatiesnel-heid: des te hoger de demineralisatiesnelheid, des te sneller de lesie kern en het frontzich dieper in het glazuur verplaatsten. De minimale hoeveelheid mineraal in de lesie
v

vi
kern correleerde ook met de demineralisatiesnelheid. Oplosbaarheidsverschillen in hetglazuur kunnen dit verklaren. Het minder oplosbare deel van het glazuur blijft namelijkover nadat het meest oplosbare deel is opgelost. Hierdoor verplaatst het demineral-isatieproces zich naar de diepere lagen van het glazuur.
Door de gemaakte aannames gaf de numerieke simulatie geen realistische weergavevan de gebeurtenissen in de lesie kern en het front. Voordat deze aannames weggelatenkunnen worden en de theorie van oplosbaarheidsverschillen getoetst kan worden, zaleerst geanalyseerd moeten worden onder welke condities het model stabiel is.
Voor de cariesdiagnostiek is het wenselijk om de demineralisatiesnelheid in-vivo tekunnen meten. Uit onderzoek bleek dat het moeilijk zal zijn om de lesiekarakteristiekente gebruiken als een in-vivo maat voor de demineralisatiesnelheid. Een betere aan-pak zou zijn om de hoeveelheid mineraal in de tijd te volgen. Aangezien polarisatiegevoelige optische coherentie tomografie (PS-OCT) een techniek is die in staat is min-eraal verlies in-vivo te meten, is deze techniek mogelijk toepasbaar als methode om dedemineralisatiesnelheid in-vivo te meten.

List of symbols and abbreviations
[ ] concentration1− α confidence coefficientC conversionCLSM confocal laser scanning microscopyD diffusionDB depth of the lesion bodyDBL depth at which the minimum mineral content of the lesion body is reachedDL depth of the lesionDSL depth at which the maximum mineral content of the surface layer is reachedDw diffusion coefficient in waterε enamel porosity
vii

viii
e errorE averagef forecastf frequency (appendix B)FAP fluorapatite (Ca5(PO4)3F )HAP hydroxyapatite (Ca5(PO4)3OH)i observationIP ionic productK solubility product of HAPKA equilibrium constant of chemical reaction aA ⇐⇒ bB + cCkdis dissolution constantM molar massMBL minimum mineral content of the lesion bodyMBL average MBLMSL maximum mineral content of the surface layerm measuredn number of observationspH −log(H+)pI −log(IP )pK −log(K)PLM polarised light microscopyPS-OCT polarisation sensitive optical coherence tomographyPtot total amount of phosphater realρ densitySEM scanning electron microscopys standard deviationt timet t-distribution (appendix C)TMR transverse microradiographyvdem rate of demineralisationx distancez depth

Contents
Preface i
Abstract iii
Samenvatting v
List of symbols and abbreviations vii
Contents ix
1 Introduction 1
2 Literature study of the relation between lesion structure and the rateof demineralisation 3
2.1 Introduction . . . . . . . . . . . . . . . . . . . . . . . . . . . . . . . . . . 3
2.2 Materials and methods . . . . . . . . . . . . . . . . . . . . . . . . . . . . 4
2.3 Results . . . . . . . . . . . . . . . . . . . . . . . . . . . . . . . . . . . . . 6
2.4 Discussion . . . . . . . . . . . . . . . . . . . . . . . . . . . . . . . . . . . 6
3 In-vitro study of the relation between lesion structure and the rate ofdemineralisation 11
3.1 Materials and methods . . . . . . . . . . . . . . . . . . . . . . . . . . . . 11
3.2 Results . . . . . . . . . . . . . . . . . . . . . . . . . . . . . . . . . . . . . 15
3.3 Discussion . . . . . . . . . . . . . . . . . . . . . . . . . . . . . . . . . . . 21
3.3.1 In-vivo determination of the rate of demineralisation . . . . . . . 23
ix

x Contents
4 Numerical study of the relation between lesion structure and the rateof demineralisation 27
4.1 Introduction to chemical equilibrium and solubility . . . . . . . . . . . . 27
4.2 Materials and methods . . . . . . . . . . . . . . . . . . . . . . . . . . . . 28
4.3 Results . . . . . . . . . . . . . . . . . . . . . . . . . . . . . . . . . . . . . 33
4.4 Discussion . . . . . . . . . . . . . . . . . . . . . . . . . . . . . . . . . . . 34
5 Conclusions and recommendations 39
Bibliography 41
A Dental caries 45
A.1 Enamel structure . . . . . . . . . . . . . . . . . . . . . . . . . . . . . . . 45
A.2 The caries process . . . . . . . . . . . . . . . . . . . . . . . . . . . . . . 47
A.3 The caries lesion . . . . . . . . . . . . . . . . . . . . . . . . . . . . . . . 49
B In-vitro techniques studied 53
B.1 Raman spectroscopy . . . . . . . . . . . . . . . . . . . . . . . . . . . . . 53
B.1.1 Materials and methods . . . . . . . . . . . . . . . . . . . . . . . . 54
B.1.2 Results and discussion . . . . . . . . . . . . . . . . . . . . . . . . 54
B.2 CLSM . . . . . . . . . . . . . . . . . . . . . . . . . . . . . . . . . . . . . 56
B.2.1 Materials and methods . . . . . . . . . . . . . . . . . . . . . . . . 57
B.2.2 Results . . . . . . . . . . . . . . . . . . . . . . . . . . . . . . . . 58
B.2.3 Discussion and conclusion . . . . . . . . . . . . . . . . . . . . . . 59
C Prediction intervals 61

Chapter 1
Introduction
Dental caries is a process in which tooth mineral is lost (demineralisation) under theinfluence of acids produced by bacteria [2]. It is one of the most prevalent diseases toafflict mankind. Its incidence increased dramatically with the introduction of refinedcarbohydrates in the diet in the 18th century [3]. During the past century the natureof caries has changed markedly due to the application of fluoride. Nevertheless, dentaldecay remains the leading cause of tooth loss in the USA. By the age of 17, 80 percentof all children have experienced at least one cavity. In addition, two thirds of adultsaged 35 to 44 have lost at least one permanent tooth to caries. Older adults suffer fromtooth loss due to root caries [4].
A significant amount of research is directed toward an earlier and better caries detec-tion. Next to the question of caries lesion size, it is relevant for treatment decisions toknow how fast a tooth loses mineral. It is important to know whether a lesion progressesfast and needs intervention, progresses slowly and can be arrested or is arrested or re-versed and can be left alone [4, 5]. In contrast to the attention given to the assessmentof lesion size, almost no research has been conducted into the rate of demineralisation.
Three distinct zones can be distinguished in the caries lesion: the surface layer, thelesion body and the lesion front (appendix A). Hicks [6] stated that in fast demineralis-ing lesions the lesion body would be heavily demineralised and the surface layer wouldbe thin. Hence, we hypothesised that the rate of demineralisation is reflected in thelesion structure.
Therefore the central research question of this study was:
Can lesion structure be related to the rate of demineralisation?
1

2 Chapter 1. Introduction
This question was investigated using data from literature (chapter 2), an experiment(chapter 3) and a numerical model (chapter 4). Chapter 3 also covered the questionwhether these relations can be used in caries diagnositics. Conclusions and recommen-dations can be found in chapter 5.

Chapter 2
Literature study of the relationbetween lesion structure and therate of demineralisation
As was mentioned in the introduction, the hypothesis was formed that lesion structureis related to demineralisation rate. This chapter presents an analysis of literature data.For those unfamiliar with the dental caries process, it is advised to read appendix Afirst.
2.1 Introduction
We have defined demineralisation rate (vdem) as a difference in total mineral loss perunit of time (pmol/mm2s or pmol/cm2s). Mineral loss will lead to a higher porosityof the existing lesion and/or the extension of the lesion deeper into the tooth. Ademineralisation rate of 0 is indicative of an arrested lesion, whereas a negative rateis indicative of a reversed lesion (figure 2.1). This study will focus on slow and fastprogressing lesions.
A previous study on demineralisation rate indicated that saliva buffer capacity, amountof cariogenic bacteria and presence of fluoride alone were poorly indicative for deminer-alisation rate [7]. A different study mentioned the use of DIAGNOdent as a possiblemeasure [8]. The DIAGNOdent measures the fluorescence of bacterial products in thelesion and is therefore primarily a measure of bacterial activity and diffusion rate. Al-ternative approaches would be to monitor the change in the amount of demineralisationover time or to examine the structure of the lesion.
3

4Chapter 2. Literature study of the relation between lesion structure and the rate of demineralisation
Figure 2.1: Demineralisation rates of progressing, arrested and reversed lesions.
A first indication for a relationship between lesion structure and demineralisationrate was found by Ekstrand [9] who described the differences between arrested and pro-gressing lesions. Surfaces of arrested lesions are typically hard and shiny with less lightscattering, in contrast to the soft and chalky surface of progressing lesions; a distinctionwhich is probably caused by differences in porosity. Clinicians have attempted to assessdemineralisation rate based on these criteria. However, they have not reached consensus[9].
A further classification of lesions into fast and slow progressing, was derived fromHicks [6]. If lesion formation is over a short period of time, there will be a large, heavilydemineralised body of the lesion and a surface zone of minimal thickness.
This suggestion of distinct structural features was investigated using data from astudy by Theuns [1]. In his thesis, Theuns investigated several demineralising conditionsto get information about the mechanisms which are involved in artificial and in-vivolesion formation. In this study he involved the rate of demineralisation and severallesion characteristics.
2.2 Materials and methods
Theuns demineralised extracted human premolars in buffered solutions. From quanti-tative microradiography, he calculated the resulting demineralisation rates (vdem) usingthe area of dissolved mineral and the demineralisation time (figure 2.2). In addition,he studied the structure of the lesions using the lesion characteristics defined in figure2.2b.
We used Theuns’ data find correlations between the lesion characteristics and therate of demineralisation (vdem). The original data for vdem were multiplied by two to

2.2. Materials and methods 5
Figure 2.2: The area representing the total mineral loss (shaded part) which is used inthe calculation of vdem [1].
Figure 2.3: Lesion characteristics as defined by Theuns [1]: the maximum mineralcontent of the surface layer (MSL) and the point at which this maximum is reached(DSL), the minimum mineral content of the lesion body (MBL) and the point at whichthis minimum is reached (DBL) and the depth of the lesion (DL).

6Chapter 2. Literature study of the relation between lesion structure and the rate of demineralisation
account for the more common chemical formula and molar mass for hydroxyapatite(HAP) used here (M= 503 g/mol for Ca5(PO4)3OH rather than M=1006 g/mol forCa10(PO4)6(OH)2).
2.3 Results
The resulting correlations are shown in figure 2.4. With increasing rate of deminer-alisation:
- The maximum amount of mineral in the surface layer (MSL) decreased slightly.
- No change was observed in the depth at which this maximum was found (DSL).
- The minimum amount of mineral in the body of the lesion (MBL) decreased.
- The depth at which this minimum was found (DBL) increased (assuming equaldemineralisation times (= t)). The DBL was dependent on the demineralisationtime.
- The lesion depth (DL) increased (assuming equal demineralisation times (=t)).The DL was dependent on the demineralisation time.
2.4 Discussion
The maximum mineral content in the surface (MSL) and the location at which thismaximum was found (DSL) were rather constant. This could be attributed to thepreferential accumulation of fluoride at the enamel surface and the decrease in fluoridecontent when moving inward [10, 11, 12, 13]. As fluoride renders the enamel less acid-soluble, the surface layer is affected less by an increased force for dissolution.
The lesion body, however, contains less fluoride and therefore the minimum mineralcontent in the body (MBL) decreased with incrasing demineralisation rate. This couldbe explained by solubility differences within the enamel. At all depths in the enamelmore and less soluble apatites are present, with the overall solubility increasing withincreasing depth [10]. Once a certain proportion of the enamel has dissolved, a fractionremains that is less soluble and does not dissolve at the given demineralisation challenge.The demineralisation process then proceeds in the deeper layers of the enamel.
The depth at which the minimum in the lesion body was found (DBL) and thelesion depth (DL) correlated with the rate of demineralisation: the higher the rate ofdemineralisation, the faster the lesion body and front moved inward.

2.4. Discussion 7
In summary, only the most soluble mineral is lost in the lesion body of slow progressinglesions, while in fast progressing lesions, also less soluble mineral is lost. The locationand mineral content of the surface remain (rather) constant, while the depth of the lesionand the depth of the body increase with time and with increasing demineralisation rate(figure 2.5).
When comparing these data to the literature described earlier (p.4)[6], it was notedthat the heavy demineralised body was indeed found, but that no decrease in surfacelayer thickness was observed. This may have been caused by the lack of a reminerali-sation stage in Theuns’ experiment, as surface layer thickness may be a feature of theremineralisation process [14].

8Chapter 2. Literature study of the relation between lesion structure and the rate of demineralisation
(a) MSL vs vdem (b) DSL vs vdem
(c) MBL vs vdem (d) DBL vs vdem
(e) DL vs vdem
Figure 2.4: Lesion characteristics vs the rate of demineralisation (vdem) with: (MSL) themaximum mineral content of the surface layer, (DSL) the point at which this maximumis reached, (MBL) the minimum mineral content of the lesion body, (DBL) the pointat which this minimum is reached and (DL) the depth of the lesion.

2.4. Discussion 9
(a) Mineral vs. depth graph for equal deminerali-sation time and increasing vdem
(b) Mineral vs. depth graph for equal vdem andincreasing demineralisation time
Figure 2.5: Summary of experimental findings: the minimum mineral content in thelesion body (MBL) decreases with increasing rate of demineralisation (vdem) and thedepth at which this minimum is found (DBL) and the lesion depth (DL) increase withincreasing demineralisation rate (vdem) and with increasing demineralisation time.

10Chapter 2. Literature study of the relation between lesion structure and the rate of demineralisation

Chapter 3
In-vitro study of the relationbetween lesion structure and therate of demineralisation
To verify the relations found in the previous chapter, an in-vitro experiment wasperformed. The setup and outcome of this experiment are covered in this chapter. Thequestion whether lesion structure can be used in caries diagnostics is also adressed.
3.1 Materials and methods
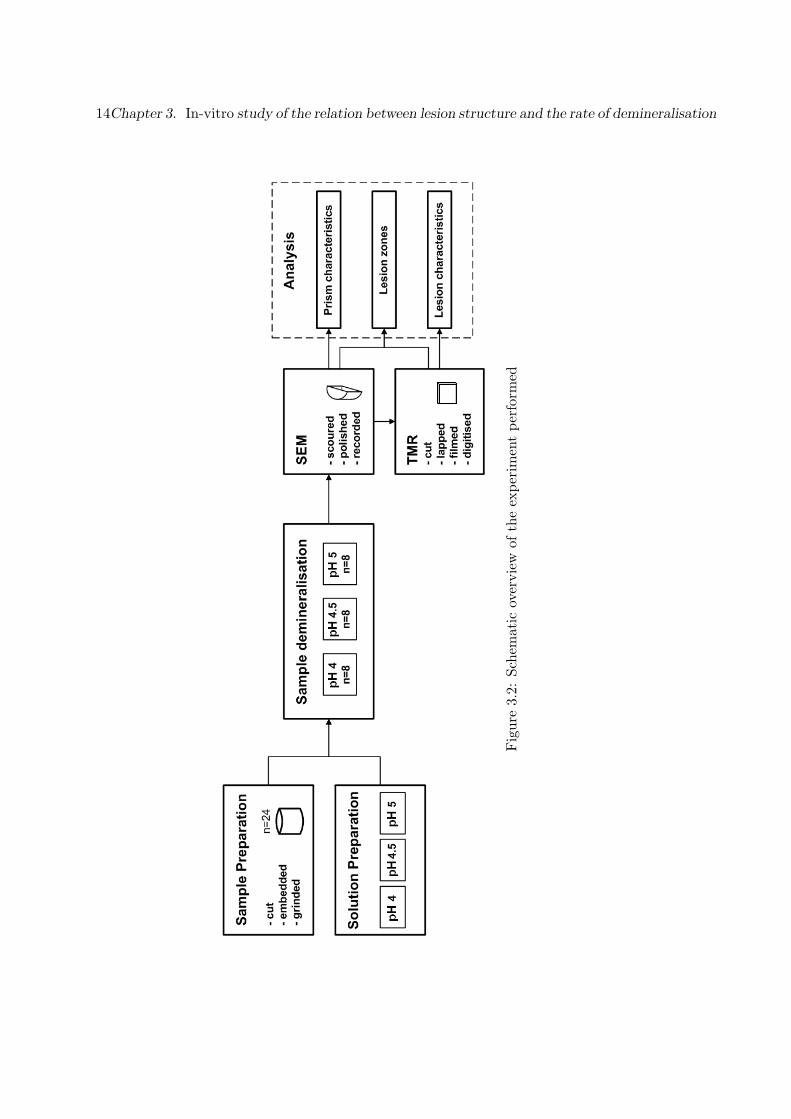
Circular specimens (n=24) with a diameter of 6mm were cut from bovine enamel,embedded in vertex and grinded up to 600 grid to remove dirt and impurities at thesurface and enhance reproducibility. The quality of the remaining surface was checkedunder a microscope, in order to ensure that this surface was non-caries and did notshow anatomical anomalities. The specimens were stored in tap water since demi-watermay cause some demineralisation. Prior to demineralisation, part of the enamel surfacewas covered with nail varnish to retain a sound surface as a reference.
To create caries lesions, buffered solutions were used. Extensive literature is availableon the use of buffered solutions [15, 16, 17, 18, 19, 20], but normally one of two basicprotocols is applied [15, 19]. Solutions should have known calcium, phosphate, fluo-ride and organic acid concentrations, as well as a carefully adjusted pH. In this study,buffered solutions containing 50 mmol/l acetic acid, 2.2 mmol/l CaHPO4 and 0.3 ppmF were used. To obtain different rates of demineralisation, three conditions were tested:pH 4.0, 4.5 and 5.0. Eight samples per pH-group were demineralised for 16 days at37◦C, using 100 ml buffered solution per sample. The solution was refreshed twice aweek.
11

12Chapter 3. In-vitro study of the relation between lesion structure and the rate of demineralisation
The ability of confocal micro-Raman spectroscopy, confocal laser scanning microscopy(CLSM), scannning electron microscopy (SEM) and transverse micro-radiography (TMR)to provide information about lesion structure was investigated. SEM and TMR ap-peared to be suitable for the purpose. TMR is the golden standard in caries researchand was used by Theuns [1] to determine the lesion characteristics. Using SEM, in-formation on prism structure and the depth of the lesion zones can be obtained. Thecreated lesions were evaluated using these two methods; the other methods are describedin appendix B.
For viewing the lesion with an environmental scanning electron microscope (XL40TMPESEM from FEI with EDS software from EDAX), cross-sections of the samples wereobtained by scouring away 1.5-2 mm and smooth surfaces were created by subsequentpolishing with diamond. The SEM was used in backscattered electron (BSE) mode. Foreach lesion, an overview picture was made with 625x magnification and zone-specificpictures were made at 5000x. Images were compared for their prism characteristics andthe depths of the different lesion zones were determined (figure 3.1).
To perform transverse micro-radiography (TMR), a Well diamond-wire saw was usedto cut enamel sections with a thickness of 500 µm. The sections were subsequentlymounted on microscope slides with nail-varnish. The nail-varnish was left to dryovernight at room temperature. To obtain a surface parallel to the slide, sections werelapped on the Logitech lapping device at 12 rpm using 3µm Al2O3-particles. After thefirst lapping phase, the sections were removed from the slides by dissolving the nailvarnish with acetone. They were mounted on new microscope slides with the lappedside facing down. After overnight drying, the sections were lapped again to createplanoparallel sections at a final thickness of approximately 100 µm.
To produce microradiograms, the X-ray generator (Philips PW1729) was adjustedto 20 kV and 20 mA. The sections were placed in a sample holder with an aluminiumwedge as a reference. The sample holder was put in a film holder with an aluminiumwedge and a film was placed on the samples. The film holder was mounted on the X-raygenerator and exposed to X-rays for 10 minutes. Afterwards, the film was developedby subsequently placing the film in developer solution (200 ml demi-water and 50 mldeveloper) for 5 minutes, in stopper solution (200 ml demi-water and 20 ml stopper)for 10 seconds and in fixer solution (200 ml demi-water and 40 ml fixer) for 5 minutes.Finally, the film was rinsed in tap water for 30 minutes, rinsed with demi-water and leftto dry overnight.
The microradiogram was viewed under a microscope (10x objective) with constantlight intensity. The calibration line was determined by measuring the intensity of thesubsequent steps of the aluminium wedge. Images of the sections were digitised and

3.1. Materials and methods 13
(a) SEM image (b) TMR image
Figure 3.1: Determination of the depth of the body (DB) and the lesion depth (DL) inthe SEM and TMR images of the same sample.
the lesions were analysed for their mineral content as a function of depth and theirtotal mineral loss (figure 2.2) using TMR2000 v2.0.27.13 (Inspector Research SystemsAmsterdam). The rate of demineralisation was calculated from the total mineral loss(figure 2.2). The depth of the lesion body (DB) (figure 3.1) and the lesion characteristicsas defined by Theuns (figure 2.3) [1] were derived from the graphs using Microsoft Excel.
An overview of the experiment is shown in figure 3.2.
14Chapter 3. In-vitro study of the relation between lesion structure and the rate of demineralisation
Fig
ure
3.2:
Sche
mat
icov
ervi
ewof
the
expe
rim
ent
perf
orm
ed

3.2. Results 15
3.2 Results
Twelve of the original 24 samples could be analysed (completely). Of the other twelve,five were excluded from both SEM and TMR analysis as they appeared to be dentinrather than enamel. Four were analysed by SEM but could not be completely analysedwith TMR since the vulnerable lesion area broke during preparation. This left the lesiondepth as the only parameter that could be determined with TMR for these samples. Afurther three samples were only analysed by SEM, two because they had broken duringpreparation for TMR and one because its TMR-image was blurred.
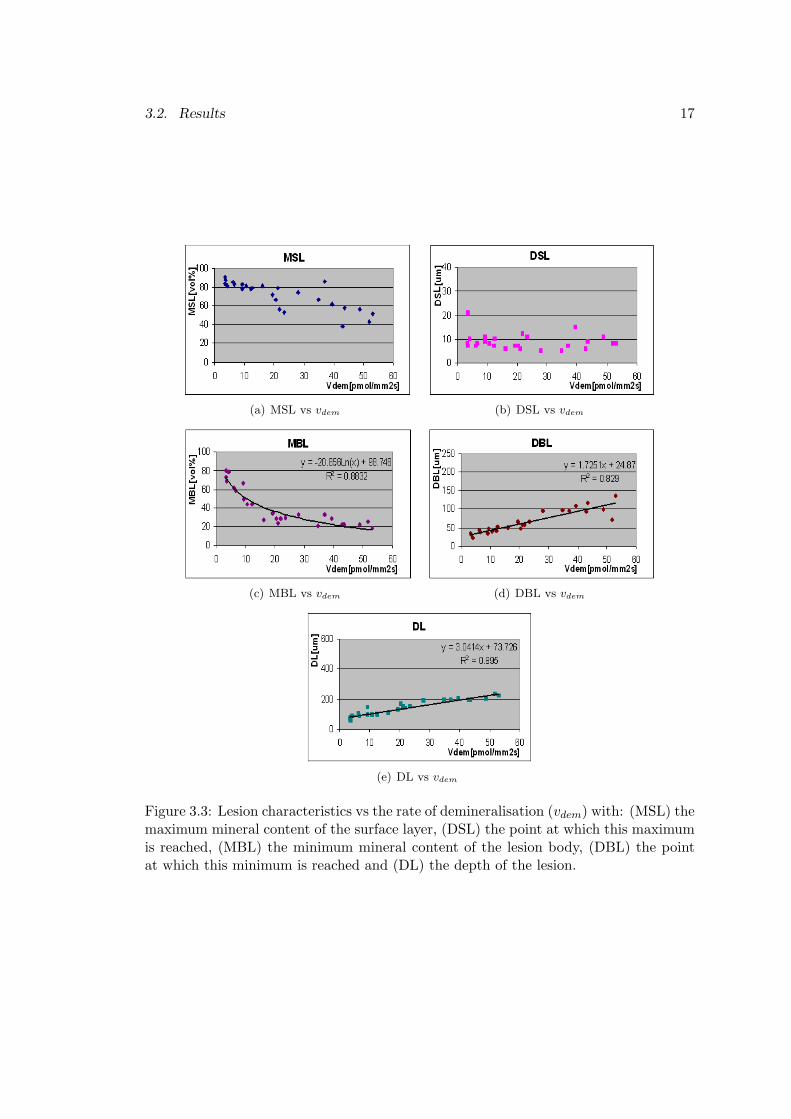
Figures 3.3 and 3.4 show the relationship between the rate of demineralisation andthe lesion characteristics. With increasing rate of demineralisation:
- The maximum amount of mineral in the surface layer (MSL) decreased.
- No change was observed in the depth at which this maximum was found (DSL).
- The minimum amount of mineral in the body of the lesion (MBL) decreased.
- The depth at which this minimum was found (DBL) increased.
- The lesion depth (DL) increased.
- The depth of the lesion body (DB) increased.
In the SEM images (figure 3.5 and 3.6) sound enamel appeared in the lightest grey,with little or no contrast. In the front of the caries lesion, little mineral loss led toa greyer and ’woolly’ appearance (figure 3.6c and 3.6d). The lesion body (figure 3.6aand 3.6b) clearly showed the enamel prisms in grey with black areas of lost mineralinbetween. Surface layers were not observed for moderate and high demineralisationrates. In initial lesions (figure 3.5c and 3.5f), a surface layer was seen to overlay a smallarea with demineralisation in the prism cores. Underneath this area, sound enamelcould be seen.
As can be seen in figure 3.5 and 3.6, a distinction could be made between high,moderate and low demineralisation rates. Both the amount of mineral loss from theprisms and the depth of the lesion increased with increasing demineralisation rate. Acorrect prediction could be made in 80% of the cases.

16Chapter 3. In-vitro study of the relation between lesion structure and the rate of demineralisation
Dissolution was found mainly at the prism junctions (e.g. figure 3.5e) and at theprism cores (figure 3.5f). In fast demineralising lesions, complete loss of prisms and/orthe formation of cracks were more likely to occur (see figure 3.5d and 3.6a), whereasfor the low demineralisation rate only some initial dissolution at the prims cores (figure3.5f) was observed. The black spots observed in figure 3.5c could be caused by eitherthe drying process or dirt.
3.2. Results 17
(a) MSL vs vdem (b) DSL vs vdem
(c) MBL vs vdem (d) DBL vs vdem
(e) DL vs vdem
Figure 3.3: Lesion characteristics vs the rate of demineralisation (vdem) with: (MSL) themaximum mineral content of the surface layer, (DSL) the point at which this maximumis reached, (MBL) the minimum mineral content of the lesion body, (DBL) the pointat which this minimum is reached and (DL) the depth of the lesion.

18Chapter 3. In-vitro study of the relation between lesion structure and the rate of demineralisation
Figure 3.4: Depth of the body (DB) vs the rate of demineralisation (vdem)

3.2. Results 19
(a)
Over
vie
wofle
sion
wit
ha
hig
hdem
iner
ali-
sati
on
rate
(2000
pm
ol/
cm2s)
(b)
Over
vie
wof
lesi
on
wit
ha
moder
ate
dem
-in
eralisa
tion
rate
(1200
pm
ol/
cm2s)
(c)
Over
vie
wofle
sion
wit
ha
low
dem
iner
alisa
-ti
on
rate
(250
pm
ol/
cm2s)
(d)
Surf
ace
ofle
sion
wit
ha
hig
hdem
iner
alisa
-ti
on
rate
(2000
pm
ol/
cm2s)
(e)
Surf
ace
ofle
sion
wit
ha
moder
ate
dem
iner
-alisa
tion
rate
(1200
pm
ol/
cm2s)
(f)
Zones
ofle
sion
wit
ha
low
dem
iner
alisa
tion
rate
(250
pm
ol/
cm2s)
Fig
ure
3.5:
SEM
pict
ures
ofdi
ffere
ntle
sion
s,w
ith:
(SL)
surf
ace
laye
r,(B
)le
sion
body
,(F
)le
sion
fron
t,(S
)so
und
enam
el,
(BS)
blac
ksp
ot,(L
)to
talpr
ism
loss
and
(D)
diss
olut
ion

20Chapter 3. In-vitro study of the relation between lesion structure and the rate of demineralisation
(a)
Body
ofle
sion
wit
ha
hig
hdem
iner
alisa
tion
rate
(2000
pm
ol/
cm2s)
(b)
Body
ofle
sion
wit
ha
moder
ate
dem
iner
al-
isati
on
rate
(1200
pm
ol/
cm2s)
(c)
Fro
ntofle
sion
wit
ha
hig
hdem
iner
alisa
tion
rate
(2000
pm
ol/
cm2s)
(d)
Fro
nt
ofle
sion
wit
ha
moder
ate
dem
iner
al-
isati
on
rate
(1200
pm
ol/
cm2s)
Fig
ure
3.6:
SEM
pict
ures
ofdi
ffere
ntle
sion
s(co
ntin
ued)
,w
ith:
(C)
crac
k,(B
)le
sion
body
,(F
)le
sion
fron
tan
d(S
)so
und
enam
el

3.3. Discussion 21
(a) Depth of the body (DB) (b) Depth of the lesion (DL)
Figure 3.7: Correlation between SEM and TMR1
In general, of the three zones in the lesion that can be seen with TMR (surface, body,front), only the body and front of the lesion could be distinguished in the SEM image.An exception was formed by lesions with very little mineral loss (figure 3.5c and 3.5f),in which a surface and body were observed, but no front. The end of the body showedthe lowest mineral content, which was consistent with TMR graphs (figure 3.1). Thedepth of the body and the depth of the lesion both correlated well with the TMR data(figure 3.7).1
3.3 Discussion
To enhance comparability with the experiments of Theuns, a similar experimentaldesign was chosen. Different demineralisation rates were created using buffered solutionsof different pH because of its direct link to the natural situation and because it couldbe easily incorporated into a numerical model (chapter 4). Bovine enamel was usedinstead of human enamel for its greater availability. The concentrations of the differentcompounds used are within the range reported to occur in vivo (table 3.1). An excessivebuffer volume was used to prevent buffer exhaustion and/or calcium and phosphatebuild-up.
The demineralising conditions chosen resulted in heavy demineralisation for the pH4 samples, moderate demineralisation for the pH 4.5 samples and almost no deminer-alisation for the pH 5 samples. In four pH 4 samples the lesion area was so vulnerablethat it broke during preparation for TMR. It may also have lead to fracture of heavily
1The correlation for the depth of the body was obtained by exclusion of a data point that showeda high deviation from the regression line (140,225). Inspection of the TMR-data learned that a greatvariety was present within this sample. The depth found in SEM was close to one of the TMR-measurements, but not close to the average. Therefore, plotting the average TMR-value did not givea realistic account of the relation between SEM and TMR in this specific case. Hence, the data pointwas excluded.

22Chapter 3. In-vitro study of the relation between lesion structure and the rate of demineralisation
Table 3.1: Choice of parameters compared to their natural range during demineralisa-tion.
Compound Natural range [1, 2] Value used in experimentAcetic acid 25-100 mmol/l 50 mmol/l
pH 4.0-5.5 4.0-5.0Ca 0.3-8.3 mmol/l 2.2 mmol/lP 1.9-23.2 mmol/l 2.2 mmol/l
Ca/P ratio 0.5-1.6 1.0F 0.05-1.20 ppm 0.30 ppm
demineralised prisms during polishing for SEM. Therefore, it may have been better touse a smaller pH-range, e.g. pH 4.2, 4.5 and 4.8.
When comparing the lesion characteristics found in this experiment (figure 3.3) toTheuns’ experimental data (figure 2.4), it was noted that:
- The rate of demineralisation was a factor 100 higher. Theuns’ data should bemultiplied by a factor 100 since close inspection of his data suggests that hemiscalculated the demineralisation rate and expressed it in pmol/mm2s ratherthan pmol/cm2s.
- The maximum amount of mineral in the surface layer (MSL) decreased more. Thiscan be explained by the higher fluoride content of human teeth when comparedto (abraded) bovine enamel [21].
- The depth at which this maximum was found (DSL) was consistently found around10 µm, which can be attributed to the fluoride profile found in enamel as wasexplained in section 2.4.
- The minimum amount of mineral in the body of the lesion (MBL), the depth atwhich this minimum was found (DBL) and the depth of the lesion (DL) showeda trend similar to Theuns’ data. Regression lines obtained from Theuns data for 16days demineralisation yielded DBL=1.5841vdem+34.382 and DL=2.6319vdem+132.59.The depth of the lesion in bovine enamel was expected to be a factor two greaterthan in human enamel, since previous publications had reported a two times fasterlesion progression in bovine enamel [22], but this was not observed.
The amount of mineral loss from the prisms in the lesion body as seen by SEM was aqualitative measure of the demineralisation rate as a correct prediction could be madein most of the cases (80%). For at least some of the incorrect predictions could beaccounted for, because as differences exist within the lesion, and TMR sections weredifferent from the SEM cross-section measured, the demineralisation rate measured inTMR may not be the same as the demineralisation rate in the SEM cross-section.

3.3. Discussion 23
Differences in the site of enamel dissolution as seen between figure 3.5e and figure3.5f could be explained from the initial fluoride content of the enamel. It is known thatfluoridated enamel shows dissolution in the prism cores, while non-fluoridated enamelshows interprismatic dissolution [23]. This therefore suggests a higher fluoride contentin the enamel sample of figure 3.5f.
The loss of prisms as observed in fast demineralising samples (figure 3.5d) may haveresulted from the demineralisation process. However, the loss observed could also orig-inate from the preparation process, as polishing may have caused fracture of heavilydemineralised prisms.
The dark grey area observed in the lesion front (figure 3.6c and 3.6d) may be thesame as the dark zone seen in polarised light microscopy (PLM). However, as PLM wasnot performed, this possibility could not be investigated.
No surface layers were observed in the SEM images, while they were clearly visible inthe TMR images (figure 3.1). Probably the surface layer was lost during polishing forSEM, as during the polishing process, the edges of the sample round off a little. Withthe exception of initial lesions and the surface layers, SEM and TMR corresponded well,even while the R2-values as presented in figure 3.7 may have been compromised due tothe different cross-sections measured.
3.3.1 In-vivo determination of the rate of demineralisation
Now that the minimum in the lesion body (DBL, MBL) and the depth of the lesion(DL) were found to correlate with the rate of demineralisation, it was investigatedwhether these relations could be used in caries diagnostics.
First it was noted that the correlations found do not necessarily exist in-vivo. Thein-vitro situation may not resemble the in-vivo situation, as for example, no remineral-isation stage and no plaque or saliva component were present. However, in this inves-tigation the relations were assumed to be valid in-vivo.
Ideally the dentist would be able to measure the rate of demineralisation in a singlemeasurement. In this case the measure used needs to be independent on demineralisa-tion time. As can be seen in figure 2.4d and e, the depth of the minimum in the body(DBL) and the depth of the lesion (DL) are time-dependent and hence could not be usedas a measure of the rate of demineralisation. Figure 3.8 shows the time-dependence ofthe minimum mineral content in the lesion body (MBL). In this graph, MBL is relativelyindependent on treatment time and therefore MBL was investigated further.

24Chapter 3. In-vitro study of the relation between lesion structure and the rate of demineralisation
Figure 3.8: Time dependence of the minimum mineral content in the body (MBL) vsthe rate of demineralisation (vdem)
Table 3.2: Prediction intervals for vdem, with f=forecast and 1-α = confidence coefficientMBL [vol%] 20 30 40 50 60 70 80 90vdem,f [pmol/mm2s] 34 22 14 9 6 4 2 1vdem,range,α=0.05 14-83 9-52 6-33 4-21 2-14 2-9 1-6 1-4vdem,range,α=0.20 19-61 12-39 8-25 5-16 3-10 2-6 1-4 1-3
Another important question is how well a measured mimimum mineral content inthe body (MBL) predicts the rate of demineralisation for an individual lesion. Foran individual value of MBL, a prediction interval can be constructed for the rate ofdemineralisation (vdem), providing the range within which vdem is expected.
A prediction interval was constructed for the combined data of Theuns’ experimentand the data presented in this chapter (n=75) (see appendix C). Results for thiscalculation using two-tailed confidence intervals of 80 %(α = 0.2) and 95% (α = 0.05)are presented in table 3.2. Based on the MBL and using a 80% confidence interval, adistinction could be made between high and low demineralisation rates (MBL=20-30vs MBL=70-90), but the range of demineralisation rates was rather high. Hence, it isapparent that the rate of demineralisation cannot be predicted accurately using MBL.This led to the conclusion that it will be difficult to use lesion characteristics as anin-vivo measure of the rate of demineralisation.
A different approach to measure demineralisation rate would be to monitor the changein the amount of mineral over time. In this approach the availability of an in-vivo de-tection method capable of measuring mineral loss quantitatively is critical. Polarisationsensitive optical coherence tomography (PS-OCT) may have this potential, as it corre-lates rather well with microradiographic measurements (figure 3.9).
PS-OCT is a non-invasive technique for creating cross-sectional images of internalbiological structure. The intensity of single-backscattered light is measured as a function

3.3. Discussion 25
Figure 3.9: Caries lesion. (A) Polarised light microscopic (PLM) image of a 200 µmslice with water imbibition with higher porosity shown in black, (B) PS-OCT imagewith high reflectivity shown in red, (C) digital microradiograph of a 200 µm sectionwith mineral loss shown in black. The surface is indicated by the white arrow [5].

26Chapter 3. In-vitro study of the relation between lesion structure and the rate of demineralisation
of depth, resulting in high resolution images (<15 µm) [5]. Figure 3.9 shows that a PS-OCT image corresponds well with the PLM and microradiographic image. This canbe understood because a high scattering corresponds to a high porosity, which in turncorresponds to a lower mineral density [5, 9].
The correlation between TMR and PS-OCT is promising, however, the resolvingpower of PS-OCT for changes in the degree of mineralisation still needs to be established.Therefore, further research will be needed before the rate of demineralisation can bemeasured in-vivo.

Chapter 4
Numerical study of the relationbetween lesion structure and therate of demineralisation
The use of a mathematical model can improve the understanding of the processmodelled. As it was desired to gain more insight in the relations between lesion char-acteristics and the rate of demineralisation, a model of the caries process is presentedin this chapter. The theory of chemical equilibrium and solubility is frequently usedthroughout this chapter; therefore an introduction to these terms is covered first.
4.1 Introduction to chemical equilibrium and solubility
Chemical equilibrium is reached when in a reaction aA ⇐⇒ bB + cC the rate of Alost equals the rate of A formation. The equilibrium constant K can then be calculatedusing K = ([B]b)([C]c)
[A]a .
A special case is a sparingly soluble salt such as hydroxyapatite (HAP) in equilib-rium with its ions, in which the amount dissolving is balanced by the same amountprecipitating:
Ca5(PO4)3OH ⇐⇒ 5Ca2+ + 3PO3−4 + OH− (4.1)
In equilibrium, the solution is said to be saturated with respect to HAP and theconcentration of the salt can be treated as a constant. K is then defined as K =
27

28Chapter 4. Numerical study of the relation between lesion structure and the rate of demineralisation
([B]b)([C]c) and called the solubility product.1
In the case of HAP in equilibrium:
K = (([Ca2+]eq)5([PO3−4 ]eq)3([OH−]eq)) (4.2)
As a reaction is not always in equilibrium, the ionic product (IP) is used to qualifythe state of the system. The ionic product (IP) is a measure of the amount of dissolvedions. In the case of HAP:
IP = (([Ca2+])5([PO3−4 ])3([OH−])) (4.3)
When the system is saturated, then the ion product is equal to the solubility product(K). If the ionic product (IP) is greater than the solubility product (K), the solutionis supersaturated, leading to precipitation of ions. In the reverse case, the solution isundersaturated, leading to dissolution of the salt.
As the values for K and IP are very small, their negative logarithms are used (pKand pI) in this chapter.
4.2 Materials and methods
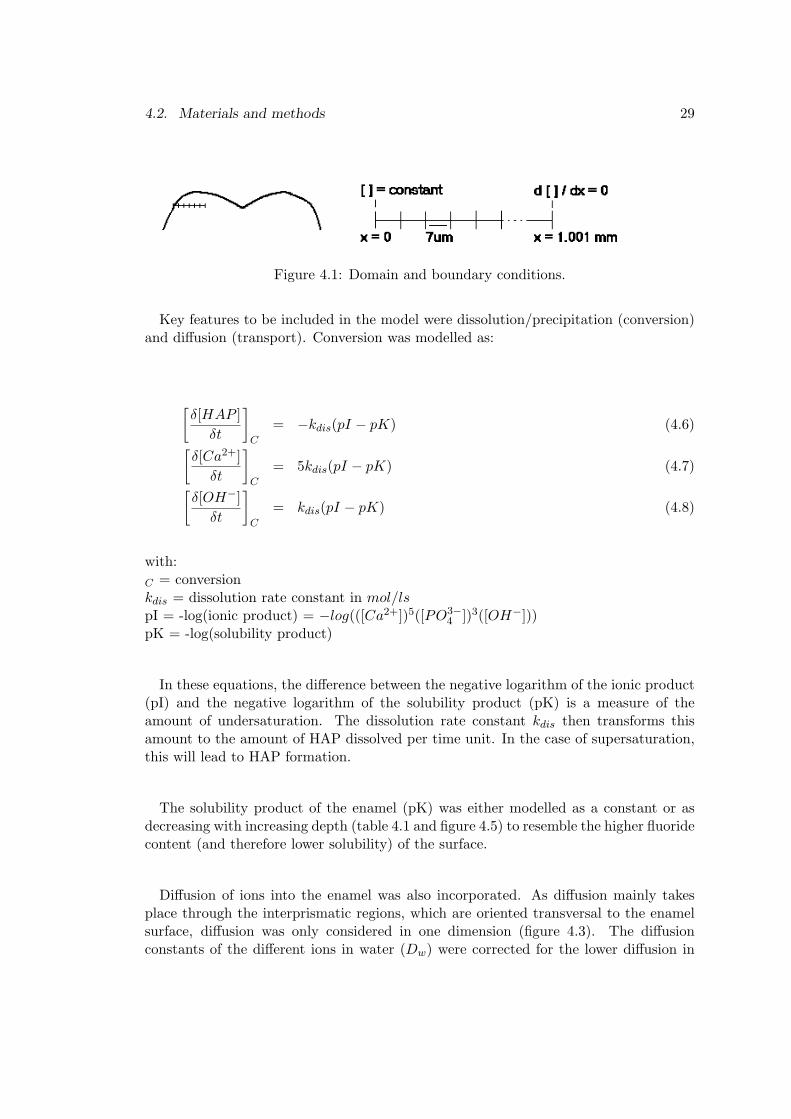
The mathematical model developed in this chapter was restricted to the physiochem-ical processes that occur in the enamel, thereby excluding other compartments such assaliva, plaque and dentin. The domain was a 1.001 mm deep line of enamel, dividedinto 7 µm long linear line elements (figure 4.1). The minimal requirements for a carieslesion were modelled, being the pH dependent dissolution of hydroxyapatite (HAP).Therefore, the equilibrium of HAP was considered (eq. 4.1) treating the concentrationsof HAP, Ca2+ and OH− (in mol/l) as variables and the concentration of PO3−
4 as aconstant. The pH (pH = −log([H+])) was reflected in the concentration OH−, as theseamounts are interrelated via the water equilibrium:
H2O ⇐⇒ H+ + OH− (4.4)Kw = (H+)(OH−) = 10−14 (4.5)
1This definition is also used in the water equilibrium H2O ⇐⇒ H+ + OH− in which only a smallproportion of the water is present in the ionic form. For water, K is therefore equal to ([H+])([OH−]).
4.2. Materials and methods 29
Figure 4.1: Domain and boundary conditions.
Key features to be included in the model were dissolution/precipitation (conversion)and diffusion (transport). Conversion was modelled as:
[δ[HAP ]
δt
]C
= −kdis(pI − pK) (4.6)[δ[Ca2+]
δt
]C
= 5kdis(pI − pK) (4.7)[δ[OH−]
δt
]C
= kdis(pI − pK) (4.8)
with:C = conversionkdis = dissolution rate constant in mol/lspI = -log(ionic product) = −log(([Ca2+])5([PO3−
4 ])3([OH−]))pK = -log(solubility product)
In these equations, the difference between the negative logarithm of the ionic product(pI) and the negative logarithm of the solubility product (pK) is a measure of theamount of undersaturation. The dissolution rate constant kdis then transforms thisamount to the amount of HAP dissolved per time unit. In the case of supersaturation,this will lead to HAP formation.
The solubility product of the enamel (pK) was either modelled as a constant or asdecreasing with increasing depth (table 4.1 and figure 4.5) to resemble the higher fluoridecontent (and therefore lower solubility) of the surface.
Diffusion of ions into the enamel was also incorporated. As diffusion mainly takesplace through the interprismatic regions, which are oriented transversal to the enamelsurface, diffusion was only considered in one dimension (figure 4.3). The diffusionconstants of the different ions in water (Dw) were corrected for the lower diffusion in

30Chapter 4. Numerical study of the relation between lesion structure and the rate of demineralisation
Figure 4.2: The prescribed enamel solubility (pK) as a function of depth.
Figure 4.3: Diffusion in enamel (left) and in the model (right)
enamel using the porosity (ε) of sound enamel [10]. This led to the following expressionsfor diffusion:
[δ[Ca2+]
δt
]D
= εDw,Ca2+
δ2[Ca2+]δx2
(4.9)[δ[OH−]
δt
]D
= εDw,OH−δ2[OH−]
δx2(4.10)
with:D = diffusionDw = diffusion constant in water in mm2/sε = enamel porosity
Just like in the in-vitro model, pressure and temperature were assumed constant.Combining conversion and diffusion led to the following set of equations:

4.2. Materials and methods 31
[δ[HAP ]
δt
]TOT
=[δ[HAP ]
δt
]C
= −kdis(pI − pK) (4.11)
[δ[Ca2+]
δt
]TOT
=[δ[Ca2+]
δt
]D
+[δ[Ca2+]
δt
]C
= εDw,Ca2+
δ2[Ca2+]δx2
+ kdis(pI − pK) (4.12)
[δ[OH−]
δt
]TOT
=[δ[OH−]
δt
]D
+[δ[OH−]
δt
]C
= εDw,OH−δ2[OH−]
δx2+ kdis(pI − pK) (4.13)
with:pI = −log(([Ca2+])5([PO3−
4 ])3([OH−]))
The parameter values needed are summarised in table 4.1. The amount of PO3−4 in
the enamel was derived from 2.2 mmol/l total phosphate (from the experiment (chapter3)) in equilibrium with the pH set:
[Ptot] = [PO3−4 ] + [HPO2−
4 ] + [H2PO−4 ] (4.14)
with:
[HPO2−4 ] =
([H+])([PO3−4 ])
KHPO2−4
(4.15)
[H2PO−4 ] =
([H+])([HPO2−4 ])
KH2PO−4
(4.16)
with:KHPO2−
4= equilibrium constant of HPO2−
4 ⇐⇒ H+ + PO3−4
KH2PO−4= equilibrium constant of H2PO−
4 ⇐⇒ H+ + HPO2−4
This assumes that all phosphate has diffused from the buffer into the enamel and thatthis amount of phosphate is in equilibrium with the outer pH.

32Chapter 4. Numerical study of the relation between lesion structure and the rate of demineralisation
Table 4.1: Parameter valuesParameter Value Reference
ε 0.01 [10]ρ 3.15 ∗ 10−3 g/l [24]M 503 g/mol calculated
kdis 5 ∗ 10−8 mol/ls [25]pK 56.6 or [26]
-31.2x + 58.5 for x ≤ 0.125 estimated from [12, 26]and 54.6 for x > 0.1256.54 ∗ 10−15 (pH 4.0)
[PO3−4 ] 6.53 ∗ 10−14 (pH 4.5) calculated
4.11 ∗ 10−13 (pH 4.9) from eq. 4.14 - 4.16Dw,Ca2+ 1.6 ∗ 10−3 mm2/s [27]Dw,OH− 5.3 ∗ 10−3 mm2/s [27]
Table 4.2: Initial and boundary conditionsComponent Left boundary condition Initial condition Right boundary condition
[ ] in buffer solution [ ] in enamel δ[]/δx at x=1.001mm[HAP] 0 calculated from eq. 4.17 0[Ca2+] 2.20 ∗ 10−3 mol/l calculated from eq. 4.18 0
1.00 ∗ 10−10 mol/l (pH 4.0)[OH−] 3.16 ∗ 10−10 mol/l (pH 4.5) calculated from eq. 4.18 0
7.94 ∗ 10−10 mol/l (pH 4.9)
At the left boundary of the domain (x=0), simulating the demineralising solution, theconditions of the experiment (chapter 3) were used (table 4.2). The concentration ofCa2+ and OH− was modelled as a constant, reflecting the large and frequently refreshedbuffer volume in the experiment. At a depth of 1.001 mm, the right boundary, theconcentrations of Ca2+ and OH− were assumed to be constant in depth ( δ[]
δx |x=1.001 = 0)(figure 4.1).
The initial condition is 88 vol% HAP in equilibrium with its surrounding fluid. Theconcentration HAP (mol/l) was calculated using:
[HAP ] = 0.88(ρ
M) (4.17)
with:M = molar mass of HAP in g/molρ = the density of enamel in g/l

4.3. Results 33
The initial amounts of Ca2+ and OH− could be calculated using the equilibriumcondition:
K = IP = (5[Ca2+])5(3[PO3−4 ])3[OH−] = (5y)5(3y)3y (4.18)
with:IP = ionic productK = solubility product of HAP
The model described above was implemented in Matlab v7.14 using the routine pdepe.Pdepe solves initial-boundary value problems for systems of partial differential equations(PDE) in space x and time t. The pdepe solver converts PDE to an ordinary differen-tial equation (ODE) using spatial discretisation based on the domain specified. Timeintegration is then performed with the differential equation solver ode15s.
4.3 Results
The results for different pH values are shown in figure 4.4. As calculation for pH5.0 led to numerical problems, the results for pH 4.9 are presented. With increasingpH, the mineral loss decreased, as was reflected in higher values for the maximummineral content in the surface (MSL) and the minimum mineral content of the body(MBL). At pH 4.9, the total mineral loss was less than 0, so the net result was mineralgained. With increasing time, more mineral was lost and MBL decreased with increasingdemineralisation time.
The depth of the maximum in the surface (DSL) decreased slightly with increasingpH. The depth of the minimum in the body (DBL) was determined by the pK and wastherefore independent of pH and time. In some cases the lesion depth (DL) could notbe determined since the amount of mineral did not increase to the sound value. Despitethis we could state that lesion depth increased with time and with lower pH.
In the cases in which no lesion depth could be determined, the rate of demineralisationcould not be calculated. Estimates showed that the minimum mineral content in thelesion body (MBL) was lower for lower demineralisation rates. For example, the graphfor pH 4.0 had a mineral loss after 16 days similar to the pH 4.5 graph after 64 days.The MBL was lower in the pH 4.5 graph while the demineralisation rate was estimatedto be a factor 4 lower (equal mineral loss, 4x longer demineralisation time). The sameresult was found when comparing pH 4.0 day 8 with pH 4.5 day 32 or pH 4.0 day 32with pH 4.5 day 128.

34Chapter 4. Numerical study of the relation between lesion structure and the rate of demineralisation
Investigation of the parameters learned that the total mineral loss increased withincreasing porosity (ε), increasing dissolution rate constant (kdis), increasing enamelsolubility (K) and/or a decreasing concentration of Ca2+, Ptot or OH−.
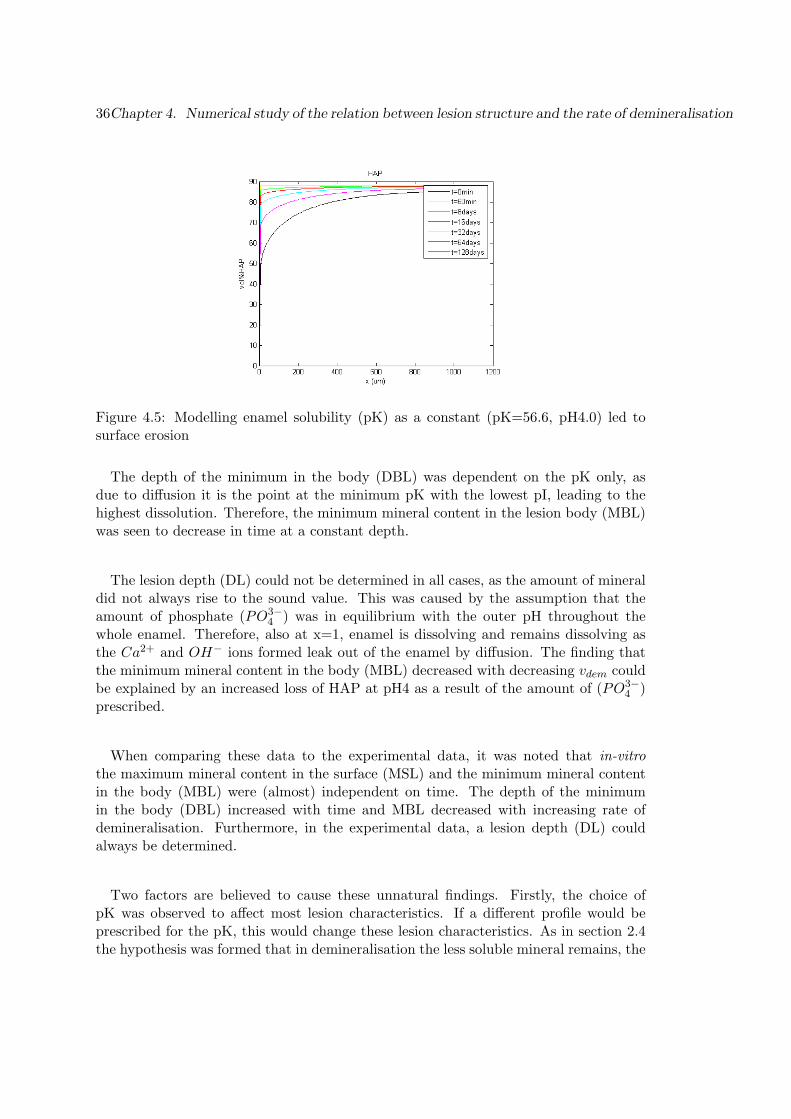
The pK appeared to be an important factor in determining the shape of the lesion.When applying a gradient in enamel solubility while keeping all other variables constant,the initial pK determined the maximum mineral content in the surface layer (MSL) andthe minimum pK determined the minimum mineral content of the lesion body (MBL).If no gradient in pK was present, this led to surface erosion instead of a subsurfacelesion (figure 4.5).
4.4 Discussion
The results of the model showed that a surface layer was formed if a gradient insolubility was present. This supports the hypothesis discussed in appendix A.3 that thepresence of fluoride is critical for surface layer formation, since the gradient in solubility(pK) modelled reflected the gradient in fluoride in enamel. As the model did not includethe equilibrium with fluorapatite (FAP), the influence of fluoride in the outer solutioncould not be determined.
These results are in line with Van Dijk [25], who concluded that that subsurfacelesions will only form if either a gradient in solubility (pK), dissolution rate constant(kdis) or porosity (ε) is present. Since no proof was found in-vivo for a gradient inporosity or dissolution rate constant, the gradient in solubility remains the most likelyreason for surface layer formation [28].
The amount of total mineral loss and the maximum mineral content in the surfacelayer (MSL) followed the expected course. The mineral loss decreased with increasingpH and the MSL increased, as the force for dissolution was smaller for higher pH values.For pH 4.5 and 4.9 this led to an increased mineral content in the surface layer (MSL)as the combination of pI and pK led to net precipitation of mineral. At pH 4.9, eventhe net total mineral loss was less than 0. The mineral loss (or gain) increased withincreasing time as the buffer conditions and therefore the forces were constant in time.
The depth of the maximum in the surface (DSL) decreased slightly with increasingpH. This can be understood as at low pH, the rate of dissolution is faster than the rateof diffusion, and therefore, also less soluble enamel (high pK) at the enamel surfacedissolves. For higher pH values, the rate of dissolution is smaller, and therefore, lessenamel is dissolved at the surface.

4.4. Discussion 35
(a) pH4.0
(b) pH4.5
(c) pH4.9
Figure 4.4: Influence of pH on mineral content vs. depth graph
36Chapter 4. Numerical study of the relation between lesion structure and the rate of demineralisation
Figure 4.5: Modelling enamel solubility (pK) as a constant (pK=56.6, pH4.0) led tosurface erosion
The depth of the minimum in the body (DBL) was dependent on the pK only, asdue to diffusion it is the point at the minimum pK with the lowest pI, leading to thehighest dissolution. Therefore, the minimum mineral content in the lesion body (MBL)was seen to decrease in time at a constant depth.
The lesion depth (DL) could not be determined in all cases, as the amount of mineraldid not always rise to the sound value. This was caused by the assumption that theamount of phosphate (PO3−
4 ) was in equilibrium with the outer pH throughout thewhole enamel. Therefore, also at x=1, enamel is dissolving and remains dissolving asthe Ca2+ and OH− ions formed leak out of the enamel by diffusion. The finding thatthe minimum mineral content in the body (MBL) decreased with decreasing vdem couldbe explained by an increased loss of HAP at pH4 as a result of the amount of (PO3−
4 )prescribed.
When comparing these data to the experimental data, it was noted that in-vitrothe maximum mineral content in the surface (MSL) and the minimum mineral contentin the body (MBL) were (almost) independent on time. The depth of the minimumin the body (DBL) increased with time and MBL decreased with increasing rate ofdemineralisation. Furthermore, in the experimental data, a lesion depth (DL) couldalways be determined.
Two factors are believed to cause these unnatural findings. Firstly, the choice ofpK was observed to affect most lesion characteristics. If a different profile would beprescribed for the pK, this would change these lesion characteristics. As in section 2.4the hypothesis was formed that in demineralisation the less soluble mineral remains, the

4.4. Discussion 37
pK should be modelled as a HAP-dependent variable. This would cause the dissolutionprocess to proceed in the deeper layers of the enamel once the most soluble mineral hasbeen lost, thus causing the depth of the minimum in the body (DBL) to increase intime.
Secondly, the amount of PO3−4 was believed to negatively influence the results. As
can be seen from the ionic product, the amount of phosphate is critical in the cariesprocess. If the pH changes from 4 to 5 the amount of PO3−
4 increases a factor 100(table 4.1), resulting in a change in ionic product of 1003 (as compared to OH− causinga change in ionic product of a factor 101).
As was described above, both the incorporation of PO3−4 as a variable and modelling
the pK as a HAP-dependent variable will be essential to obtain more realistic results.However, when PO3−
4 was incorporated in pdepe, no solution could be found to the setof equations.
As pH 5.0 led to numerical problems and as the incorporation of PO3−4 led to a system
that could not be solved, it was concluded that the set of equations was very sensitiveto changes in concentration. This can be understood when one realises that they rangefrom 10−7 − 10−15. It therefore is advised to try a log-transformation on the equationsin order to remove this large range and to analyse under which conditions the set ofequations (eq. 4.11 - 4.13) is stable. Furthermore, estimates should be made on theinfluence of the assumptions made and the parameter values chosen.
In order to further investigate the hypotheses on surface layer formation (appendixA.3), the model should be extended to include the equilibrium with fluorapatite (FAP),an electrical field and a chemical potential.

38Chapter 4. Numerical study of the relation between lesion structure and the rate of demineralisation

Chapter 5
Conclusions andrecommendations
This thesis was dedicated to the relation between lesion structure and the rate ofdemineralisation. Data from literature and an experiment were analysed to obtaininformation on the relation between lesion structure and the demineralisation rate. Anattempt was made to explain the results obtained using a numerical simulation. Inaddition, the possibility to apply the relations in-vivo were investigated.
Analysis of literature and experimental data [1] learned that the surface layer (DSL,MSL) was relatively unaffected by the demineralisation rate. This could be attributed tothe presence of fluoride rendering the surface less soluble. The results of the numericalsimulation supported this explanation as they showed that the presence of a gradientin solubility is essential for surface layer formation.
In both the experimental and literature data, the depth at which the minimum inthe lesion body was found (DBL) and the lesion depth (DL) correlated with the rate ofdemineralisation: the higher the rate of demineralisation, the faster the lesion body andfront moved. The minimum mineral content in the lesion body (MBL) also correlatedwith the demineralisation rate. This could be explained by solubility differences withinthe enamel. Once a certain proportion of the enamel has dissolved, a fraction remainsthat is less soluble and does not dissolve at the given demineralisation challenge. Thedemineralisation process then proceeds in the deeper layers of the enamel.
Due to the assumptions made, the numerical simulation did not give a realistic ac-count of the the events in the lesion body and front. Before these assumptions canbe omitted, the conditions under which the model is stable should be analysed. Then,
39

40 Chapter 5. Conclusions and recommendations
the simulation can be extended to include phosphate as a variable and to test sev-eral hypotheses. The most important hypothesis to be tested would be that solubilitydifferences within the enamel cause the relation found between the minimum in thelesion body and the demineralisation rate. In addition, the hypotheses on surface layerformation could be investigated further.
For caries diagnostics it is desirable to be able to measure the rate of demineralisationin-vivo. In the ideal situation this can be performed in a single measurement. For asingle measurement the characteristic measured needs to be independent on deminer-alisation time and should have a good predictive value. The minimum in the lesionbody (DBL, MBL) and the lesion depth (DL) did not fulfil these requirements. There-fore, it will be hard to use lesion characteristics as an in-vivo measure of the rate ofdemineralisation.
Monitoring the amount of mineral loss over time may be a better approach to mea-sure the rate of demineralisation in-vivo. As polarisation sensitive optical coherencetomography (PS-OCT) is a technique capable of measuring mineral loss in-vivo, thistechnique may be applicable as a tool to assess demineralisation rate in-vivo. To thisaim, the resolving power of PS-OCT for changes in the mineral content needs to bebetter established.
Further research should better establish the relations found between the rate of dem-ineralisation and structural features of the lesion. Lesions with an equal total amountof mineral loss created at a different rate should be compared on their lesion charac-teristics. A way to do this would be to demineralise samples at pH4.2, 4.5 and 4.8and to measure to amount of calcium lost from the enamel to estimate the amount ofmineral lost. In addition, the time dependence of the lesion characteristics should beinvestigated further to ensure that the relations found are also valid for longer timeperiods (e.g. t=32, 64 and 128 days).
After that, demineralising regimes including a remineralisation stage should be em-ployed, since remineralisation may affect the relation between the lesion characteristicsand the demineralisation rate. For one, surface layer thickness is expected to increasewith the amount of remineralisation [6, 14]. Possible regimes would be 16h demineral-isation combined with 8h remineralisation and 8h demineralisation combined with 16hremineralisation [15].

Bibliography
[1] H.M. Theuns. The influence of in-vitro and in-vivo demineralzing conditions ondental enamel. PhD thesis, Nederlands instituut voor Praeventieve Gezondheid-szorg TNO, 1987.
[2] J.D. Featherstone. Modelling the caries-inhibitory effects of dental materials. Den-tal Materials, 12:194–197, 1996.
[3] J. Hicks, F. Garcia-Godoy, and C. Flaitz. Biological factors in dental caries: roleof saliva and dental plaque in the dynamic process of demineralization and rem-ineralizatio (part1). Journal of Clinical Pediatric Dentistry, 28:47–52, 2003.
[4] D. Fried. Biomedical Photonics Handbook, chapter Optical methods for cariesdetection, diagnosis and therapeutic intervention, pages 50–1 – 50–27. CRC Press,2003.
[5] P. Ngaotheppitak, C. L. Darling, and D. Fried. Measurement of the severity ofnatural smooth surface (interproximal) caries lesions with polarization sensitiveoptical coherence tomography. Lasers in Surgery and Medicine, 37:78–88, 2005.
[6] J. Hicks, F. Garcia-Godoy, and C. Flaitz. Biological factors in dental caries enamelstructure and the caries process in the dynamic process of demineralization andremineralization (part2). Journal of Clinical Pediatric Dentistry, 28:119–124, 2004.
[7] J.M. ten Cate and C. van Looveren. Speeksel, caries en diagnostiek. NederlandsTijdschrift voor Tandheelkunde, 99:85–88, 1992.
[8] A. Lussi, R. Hibst, and R. Paulus. Diagnodent: an optical method for cariesdetection. Journal of Dental Research, 83C:C80–C83, 2004.
[9] K.R. Ekstrand. Improving clinical visual detection - potential for caries clinicaltrials. Journal of Dental Research, 83C:C67–C71, 2004.
[10] C. Robinson, R.C. Shore, S.J. Brookes, S. Strafford, S.R. Wood, and J. Kirkham.The chemistry of enamel caries. Crit Rev Oral Biol Med, 11:481–495, 2000.
41

42 Bibliography
[11] C. Robinson, J.A. Weatherell, and A.S. Hallsworth. Demineralisation and reminer-alisation of the teeth, chapter Alterations in the composition of permanent humanenamel during carious attack, pages 209–223. IRL Press, 1983.
[12] M.F. Little, F.S. Casciani, and J. Rowley. Site of fluoride accumulation in intacterupted human enamel. Archives of Oral Biology, 12:839–847, 1967.
[13] M.F. Little and K. Barrett. Trace element content of surface and subsurface enamelrelative to caries prevalence on the west coast of the united states of america.Archives of Oral Biology, 21:651–657, 1976.
[14] J.M. ten Cate and C. van Looveren. Fluoride mechanisms. Cariology, 43:713–742,1999.
[15] J.M. ten Cate. Alternating demineralization and remineralization of artificialenamel lesions. Caries Research, 16:201–210, 1982.
[16] H.M. Almqvist and F. Lagerlof. Effect of intermittent delivery of fluoride to solutionon root hard-tissue de- and remineralization measured by 125-i absorptiometry.Journal of Dental Research, 72:1593–1598, 1993.
[17] C.-Y.S. Hsu, T.H. Jordan, D.N. Dederich, and J.S. Wefel. Effects of low-energy co2laser irradiation and the organic matrix on inhibition of enamel demineralization.Journal of Dental Research, 79:1725–1730, 2000.
[18] K. Kawasaki and J.D.B. Featherstone. Effects of collagenese on root demineralisa-tion. Journal of Dental Research, 76:588–595, 1997.
[19] J.D.B. Featherstone, N.A. Barrett-Vespone, D. Fried, Z. Kantorowitz, and W. Seka.Co2 laser inhibition of artificial caries-like lesion progression in dental enamel.Journal of Dental Research, 77:1397–1403, 1998.
[20] A.T. Hara, C. Silami de Magalhaes, M. Campos Serra, and A. Luiz RodriguesJr. Cariostatic effect of fluoride-containing restorative systems associated withdentrifices on root dentin. Journal of Dentistry, 30:205–212, 2002.
[21] J. Arends and T.B.F.M. Gelhard. Demineralisation and remineralisation of theteeth, chapter In vivo remineralisation of human enamel, pages 1–16. IRL Press,1983.
[22] J.D.B. Featherstone. Relative rates of progress of artificial carious lesions in bovine,ovine and human enamel. Caries Research, 15:109–114, 1981.
[23] L.M. Silverstone, C.A. Saxton, I.L. Dogon, and O. Fejerskov. Variation in thepattern of acid etching of human dental enamel examined by scanning electronmicroscopy. Caries Research, 9:373–387, 1975.
[24] C.L. Davidson. Ontharding van glazuur- Een fysisch-chemisch model van carieusglazuur. PhD thesis, Rijksuniversiteit Groningen, 1973.

Bibliography 43
[25] J.W.E. van Dijk. The electrochemistry of dental enamel and caries. PhD thesis,Katholieke Universiteit Nijmegen, 1978.
[26] M.J. Larsen and E.I.F. Pearce. A program for correlating dental plaque ph values,ch+, plaque titration, critical ph, resting ph and the solubility of enamel apatite.Archives of Oral Biology, 42:475–480, 1997.
[27] D.R. Lide, editor. CRC Handbook of chemistry and physics. CRC Press LLC, 2001.
[28] F.C.M.Driessens. Mineral aspects of dentistry. S. Karger, 1982.
[29] J. Arends and J.M. ten Cate. Tooth enamel remineralisation. Journal of CrystalGrowth, 53:135–147, 1981.
[30] J.D. Featherstone. The continuum of dental caries- evidence for a dynamic diseaseprocess. Journal of Dental Research, 83C:C39–C42, 2004.
[31] E. Pearce. Plaque minerals and dental caries. N.Z. Dent. J., 94:12–15, 1998.
[32] J. Hicks, F. Garcia-Godoy, and C. Flaitz. Biological factors in dental caries: roleof remineralization and fluoride in the dynamic process of demineralization andremineralization (part3). Journal of Clinical Pediatric Dentistry, 28:203–214, 2004.
[33] http://www.uic.edu/classes/peri/peri343/whtesptd3sum03/whtspt03-4.htm, jan2006.
[34] D.J. Langdon, J.C. Elliott, and R.W. Fearnhead. Microradiographic observation ofacidic subsurface decalcification in synthetic apatite aggregates. Caries Research,14:359–366, 1980.
[35] J.M. ten Cate. In vitro studies on the effects of fluoride on de- and remineralization.Journal of Dental Research, 69:614–619, 1990.
[36] H. Tsuda. Micro-raman spectroscopy in dental research. PhD thesis, 1996.
[37] B. Ogaard, H. Duschner, J. Ruben, and J. Arends. Microradiography and confocallaser scanning microscopy applied to enamel lesions formed in vivo with and with-out fluoride varnish treatment. European Journal of Oral Sciences, 104:378–383,1996.
[38] H. Duschner, A.B. Sonju-Clasen, and B. Ogaard. Early detection of dental caries,chapter Detection of early caries by confocal laser scanning microscopy, pages 145–155. 1996.
[39] Y. Ijima, O. Tagaki, H. Duschner, J. Ruben, and J. Arends. Influence of nail varnishon the remineralization of enamel single sections assessed by microradiography andconfocal laser scanning microscopy. Caries Research, 32:393–400, 1998.

44 Bibliography
[40] A.B. Sonju-Clasen, B. Ogaard, H. Duschner, J. Ruben, J. Arends, and T. Sonju.Caries development in fluoridated and non-fluoridated deciduous and permanentenamel in situ examined by microradiography and confocal laser scanning mi-croscopy. Advances in Dental Research, 11:442–447, 1997.
[41] D.J. White, K.M. Kozak, J.R. Zoladz, H. Duschner, and H. Gotz. Peroxide in-teractions with hard tissues: effects on surface hardness and surface/subsurfaceultrastructural properties. Compendium, 23:42–48, 2002.
[42] D.J. White, K.M. Kozak, J.R. Zoladz, H.J. Duschner, and H. Gotz. Effects oftooth-whitening gels on enamel and dentin ultrastructure - a confocal laser scanningmicroscopy pilot study. Compendium, 21:S29–S34, 2000.
[43] D.C. Montgomery and G.C. Runger. Applied statistics and probability for engineers.John Wiley and Sons, 1999.

Appendix A
Dental caries
Each tooth is composed of four tissues: pulp, dentin, cementum and enamel (figureA.1). Enamel is normally the only part of the tooth exposed to the environment andtherefore the site where most caries lesions initiate. As an understanding of toothstructure is essential for the understanding of caries, this chapter first describes enamelstructure before continuing with the primary caries process. The processes in dentinal,secondary and root caries are rather similar to the primary caries process and are notincluded in this overview.
A.1 Enamel structure
Human dental enamel is a unique mineralised substance that is composed of hydrox-yapatite (87%), water (11%) and organic material (2%) [24]. Low amounts of traceelements are also present [3]. The structure of enamel is unique in its low organic con-tent (35-50% less than bone) and in that it has no residual cellular components thatcan affect repair when the enamel is damaged. In contrast, both cementum and dentinhave cellular components that assist in maintenance and repair [3].
Enamel is organized into rodlike structures referred to as enamel prisms, that beginat junction between enamel and dentin (the dentinoenamel junction) and end at theexposed enamel surface (figure A.2). The enamel prisms are interlocked with eachother in a keyhole configuration. Between each of the keyhole-shaped enamel prisms isa minute portion of organic matrix, which determines the permeability of the enamelstructure. The enamel prisms range from 4 to 6 µm in width [3].
Each enamel prism is composed of numerous crystals of hydroxyapatite Ca5(PO4)3OH(HAP) [3]. However, most mineral crystals have a certain proportion of substitutionsfor calcium, phosphate and hydroxyl groups. Fluoride can replace hydroxyl groups,
45

46 Appendix A. Dental caries
Figure A.1: Schematic view of the tooth and its supporting tissues
(a) Enamel prisms as seen at the enamel surface. (b) Enamel prisms cut roughly parallel to theprism axis.
Figure A.2: The enamel prisms. The enamel was etched with HCl for 10s in order toenhance contrast by removal of some of the crystals [29].

A.2. The caries process 47
Table A.1: Overview of enamel composition [3, 10, 12, 24].Enamel
Size:- apatite crystal 25x40x160nm- prism diameter 4-6µmContents:- hydroxyapatite 87%- water 11%- organic material 2%Chemical composition:- calcium 37%- phosphor 18.5%- carbonate 2-4%- magnesium 0.2-0.4%- fluoride 40-400 ppm
leading to the more stable crystal structure of fluorapatite (Ca5(PO4)3F (FAP). A lessstable apatite can also be formed, e.g. when carbonate substitutes for hydroxyl or whenphosphate and magnesium substitute for calcium [10].
An overview of the enamel composition is given in table A.1.
A.2 The caries process
Caries is a pathological process leading to mineral loss (demineralisation) under theinfluence of acids produced by bacteria (figure A.3). Carbohydrates in our food aremetabolised by cariogenic bacteria in plaque, producing organic acids (acetic, lacticand propionic acid) as by-products and thereby lowering the oral pH. The acids diffuseinto the enamel subsurface, dissolving apatite into calcium and phosphate when the pHhas fallen below the critical level of 5.5 [2]. Calcium and phosphate ions diffuse out ofthe tooth, leading eventually to cavitation if the process continues [30]. Partial deminer-alisation is routinely reversed in the mouth when the pH rises above acid challenge, andcalcium and phosphate, together with fluoride, diffuse into the tooth and remineralisethe tooth [2].
The process of demineralisation and remineralisation normally occurs numerous timesa day. Which process dominates is dependent on several factors such as the frequencyand amount of carbohydrate ingestion and the amount of cariogenic bacteria (such asmutans streptococci and lactobacilli) present.

48 Appendix A. Dental caries
Figure A.3: Schematic summary of the caries process.
Salivary function plays an important role in enhancing remineralisation by providingcalcium, phosphate and fluoride and by buffering the oral pH [30]. We recognise theimportance of saliva and plaque, but focus this report on the processes occurring inenamel.
Chemically, the process of HAP dissolution can be understood as follows: hydroxya-patite (HAP) is a sparingly soluble salt. If the fluid surrounding the crystals becomesundersaturated, the crystal will breakdown, whereas the reverse case: supersaturation,is associated with crystal growth [31]. Partial dissolution of dental hydroxyapatite oc-curs with diffusion of acids into the tooth, as it is generally accepted that the protonsassociated with acid remove some of the PO3−
4 and OH−, leading to undersaturation[3, 30]:
HAP ⇐⇒ 5Ca2+ + 3PO3−4 + OH−
PO3−4 + H+ ⇐⇒ HPO2−
4
HPO2−4 + H+ ⇐⇒ H2PO−
4
OH− + H+ ⇐⇒ H2O
During periods of remineralisation, Ca2+, PO3−4 and F− are replenished from plaque
and saliva. Enamel lesions preferentially absorb fluoride ions onto the partially dem-ineralised crystals, leading to the formation of fluorapatite. This results in an increasedresistance to further acid attacks and a reduction in the critical pH [32].

A.3. The caries lesion 49
(a) Intact block of enamel. (b) Crystal dissolution cre-ates visible pores in theenamel.
(c) As demineralisation pro-gresses, the pores increase insize.
(d) The final stage is a cavi-tated lesion, resulting from acollapse of the surface layer.
Figure A.4: The different stages of the caries lesion [33].
A.3 The caries lesion
Histological examination of caries lesions of enamel has consistently suggested thatthe earliest mineral is removed from the periphery of the prisms, i.e. the most accessibleand/or most soluble mineral. The lower crystal packing seen at the periphery wouldpermit easier diffusion of acids and protons into the tissue and mineral ions out of it.Subsequent dissolution then tracks across the prisms leading to dissolution of the prismbodies [10]. The first mineral loss is known as surface softening, leading to what iscalled the initial lesion.
With ongoing demineralisation, a subsurface lesion is formed. The different stagesof enamel demineralisation are shown in figure A.4. Several authors studied natu-ral caries lesions by polarised light microscopy (PLM) and microradiography. Fourporosity-related zones are described in the caries lesion when assessed by PLM, whereasmicroradiography distinguishes three zones (figure A.5) [10].
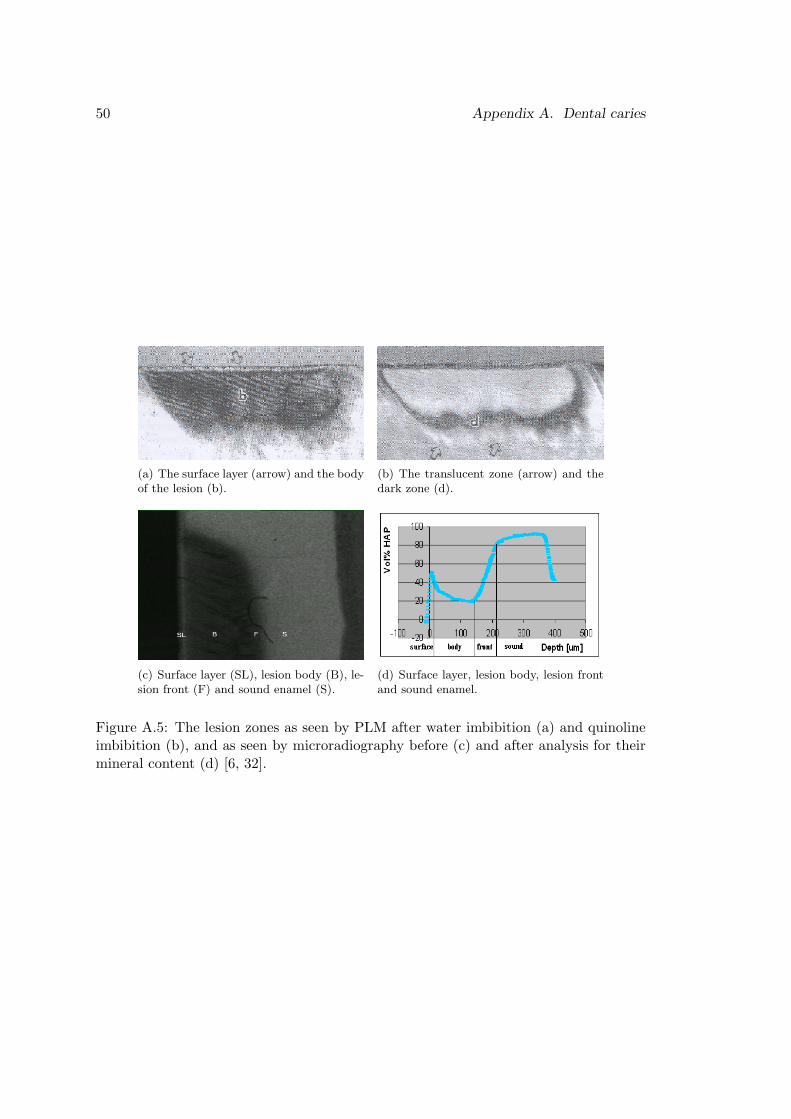
50 Appendix A. Dental caries
(a) The surface layer (arrow) and the bodyof the lesion (b).
(b) The translucent zone (arrow) and thedark zone (d).
(c) Surface layer (SL), lesion body (B), le-sion front (F) and sound enamel (S).
(d) Surface layer, lesion body, lesion frontand sound enamel.
Figure A.5: The lesion zones as seen by PLM after water imbibition (a) and quinolineimbibition (b), and as seen by microradiography before (c) and after analysis for theirmineral content (d) [6, 32].

A.3. The caries lesion 51
1. The lesion front
[a] Translucent zoneThe first visible change in the enamel, corresponding to a loss of about 1-2% min-eral, is composed of a small number of relatively large pores [10]. The translucentzone along the advancing front of the lesion is a demineralisation zone [6] .
[b] Positively birefringent (dark) zoneIf lesion development occurs over a relatively long period of time, a zone of reminer-alisation (the dark zone) with reprecipitation of mineral phases from the translu-cent zone will occur, with porosity increasing to 5-10% [6].
2. Body of the lesionFurther demineralisation produces the body of the lesion (25-50% porosity), thepores of which enlarge until cavitation occurs (figure A.4) [10]. Most lesion bodiesdo not show a mineral content below 20 vol% [1].
3. Surface layerShortly after the initial attack, an apparently intact surface layer develops. Subse-quent demineralisation then proceeds in the immediate sub-adjacent tissue. The-uns [1] found that most surface layers (≈ 90%) had a mineral content between 75and 90% reaching a maximum between 5 and 20 µm. Lesions of different depthsshowed an equal mineral content in the surface layer. Porosity of this surface zoneamounts to 1-2%, which is (almost) similar to that of sound tissue.
Remineralisation mostly occurs in the dark zone and the surface zone, often involvingthe formation of the more acid resistant fluorapatite (FAP) as is shown in figure A.6. Thenumber of pores increases from sound enamel to the body of the lesion. In the surfacezone, the number of pores is only slightly higher than in sound enamel (not shown).The concentrations of important ions in the different lesion zones are also shown infigure A.6. With increasing depth, the amount of fluoride and protons decreases andthe amount of carbonate and magnesium increases.
The underlying mechanism for the persistence of a surface layer is still a matter ofsome controversy. Several hypotheses have been put forward. First of all, the protectivechemistry of the surface renders it less susceptible to acid attack. It contains, forexample, high concentrations of fluoride, which stabilises apatite, low carbonate andlow magnesium, which have a reverse, destabilising effect. Moving inward, the fluoridecontent decreases, while carbonate and magnesium contents increase (see also figureA.6) , leading to an increased solubility [10].
However, experiments with enamel pellets show that a surface layer can also be formedwith no such gradients present [34]. The availability of fluoride seems to determinewhether a surface layer is formed [35]. The interface with plaque fluid enables the

52 Appendix A. Dental caries
Figure A.6: Diagrammic summary of the characteristics of and the events within thezones of a caries lesion(adapted from [10]).
surface to take up fluoride, which enables the conversion of (partially dissolved) apatiteto fluorapatite. For this conversion, calcium and phosphate are used both from thedeeper layers and from the plaque fluid [10].
Next to the existence of a gradient in solubility and the influence of fluoride, otherprocesses have been mentioned. These include the setup of an electrical field by thediffusing protons, leading to an enhanced diffusion of calcium toward the tooth surface,and the existence of a gradient in chemical potential, leading to a flux of acid inwardand calcium and hydroxyl outward [25].

Appendix B
In-vitro techniques studied
This is great: you are interested enough to even turn to this appendix. I owe you.Just tell me you read Appendix B and I will get you an apple turnover (appelflap). Thischapter covers the in-vitro techniques that were investigated for use in the experiment(chapter 3), but appeared unable to provide the desired information on lesion structure.
B.1 Raman spectroscopy
Spectroscopic measurements are able to provide chemical information on dental tis-sue. Micro-Raman spectroscopy is a technique, which enables us to obtain vibrational(Raman) spectra of molecules or compounds in materials. Localised molecules or com-ponents concentrated in a small volume of a few µm3 can be identified and quantified[36]. Other types of spectroscopy such as fluorescence, breakdown, reflection, transmis-sion and NIR-absorption spectroscopy can also be used to detect caries but generallyhave a lower resolving power.
The Raman effect can be understood as a result of the change of an excitation waveby vibrations and rotations of a molecule. When an excitation wave with frequency f0
is incident on a molecule, a vibration or rotation with frequency f1 will shift the waveto mixed frequencies of f0 and f1. The resulted wave will have two side-bands (f0− f1,f0 + f1) in addition to the central band (f0). The band with less energy is called Stokesband and the band with greater energy anti-Stokes band. The central band is referredto as the Rayleigh band (figure B.1) [36]. In Raman spectroscopy, only the Stokes bandis measured.
53

54 Appendix B. In-vitro techniques studied
Figure B.1: Raman scattering (Stokes and anti-Stokes) and Rayleigh scattering [36].
B.1.1 Materials and methods
In the experimental setup, laser light (785 nm, 60 mW) incident on the sample wasfocussed by a 40x (NA 0.8) water-immersion objective. Raman scattered light wasfiltered from the returned light beam and transmitted through an optical fibre to aCCD-camera, which records the Raman spectrum. The 100-µm core of the optical fibreserved as a pinhole, rendering the system confocal as it only admits in-focus light. Priorto measurements, the CCD-camera was cooled to -70◦C with liquid nitrogen and thealignment was optimised using a cyclohexane measurement. The equipment could beadjusted to the enamel surface with a z-screw using the change in spectrum and theoptical image as a guidance.
Raman spectra have been measured in a 3D-volume of 750x750x240µm with thesurface located at z=100µm. Z-scans were performed with dz=10 µm; the x- andy-coordinate were increased with 250µm. The phosphate v1 peak was selected as ameasure of the amount of hydroxyapatite. Results for demineralised and sound tissuewere compared. For determination of the axial resolution of the system, dz=5µm wasused over a 1mm range.
B.1.2 Results and discussion
Raman spectra (figure B.2) revealed differences between sound and demineralisedregions in the phosphate band intensity, which is likely to have arisen from the loss ofmineral. The intensity of the Raman shifted peak was lower in the demineralised tissueand the loss of intensity was faster (figure B.3). This is probably due to an increasedscattering, resulting from an increased porosity in demineralised tissue. The second

B.1. Raman spectroscopy 55
Figure B.2: Raman spectrum of enamel
peak observed in the depth profile of demineralised enamel was probably caused by thetransition to dentin. In order to determine the amount of mineral as a function of depth,the results need to be corrected for the normal scattering induced intensity loss. Tothis aim a peak was selected that was not affected by demineralisation. Investigationrevealed that the Rayleigh scattered peak could not be used for correction, but possiblya compound not affected by demineralisation can be used.
The axial resolution was around 8µm in the case of a non-scattering medium, buthigher for a scattering medium. As enamel is a scattering tissue, the axial resolutionwas determined and appeared to be in the order of 30µm, making it impossible to obtainaccurate depth profiles. Resolution would need to be improved by at least a factor 5 togain enough information for depth profiling. This could be achieved by using a differentobjective and/or pinhole.
The study of Raman spectroscopy as a method to measure caries was carried on usinga different setup with 633nm laser excitation, a 100x water immersion objective and apinhole of 300 µm. Depth resolution was in the order of 1µm for non-scattering mediaand around 10µm in the case of enamel. Imbibition in quinoline was applied to reducescattering and resulted in a greater penetration depth with again a decrease in intensityof the PO4 v1 peak for demineralised enamel. Raman was not applied in the in-vitrostudy because the technique has not been developed far enough to provide useful depthprofiles. However, Raman has the potential to become an in-vitro instrument in cariesdetection.

56 Appendix B. In-vitro techniques studied
Figure B.3: Intensity of PO4 v1 peak as a function of depth for sound and demineralisedenamel. The second peak observed for demineralised enamel was attributed to thetransition to dentin.
B.2 CLSM
Confocal laser scanning microscopy (CLSM) is a non-destructive, 3-dimensional tech-nique of microscopic tomography, mainly used in cell biology. CLSM allows the studyof unsectioned, natural teeth and shows good correlation with TMR measurements [37].
Previous studies have used CLSM in reflection mode while operating the laser at 488nm and using an oil immersion objective (40x NA1.3) [37, 38, 39, 40, 41, 42]. FigureB.4 shows some characteristic images. In the optical section parallel to the surface, thepattern of the remitted laser light appears as a honey-comb structure. Interprismaticareas appear in red colours as relatively sharp contours. The prisms appear as darkzones of poor light remittance. The optical section through sound enamel perpendicularto the surface shows a translucent area, which can reach up to 100 µm down into thetissue. A banded structure can be observed in the subsurface enamel, resulting fromthe prism boundaries [38].
In the confocal image, a demineralised region is characterised by a more diffuse re-mittance of laser light from the interprismatic areas. A surface zone characterised bythe light coloured band is still visible. With decreasing mineral density the translucencyof the lesion body increases, extended areas of subsurface enamel appear dark and donot remit the incoming light. The remaining reflections are totally diffuse and seem tooriginate from scattered light. Interpretations on the prism structure are speculative in

B.2. CLSM 57
Figure B.4: Images of sound and demineralised tissue imaged using CLSM in reflectionmode found in literature(bar 10µm), with: (SL) surface layer, (B) lesion body and (S)sound enamel. Blue spots in the image are caused by detector overflow [40].
this mode. Beneath this non-remittant zone, resembling the body of the lesion, soundtissue can still be observed [38, 40].
The ability of CLSM to visualise lesion zones was investigated further, as will bepresented next. Both reflection and fluorescence mode were used, but the latter did notgain satisfying results. The final aim would be to correlate the lesion zones to TMRdata of the same lesion.
B.2.1 Materials and methods
CLSM (Zeiss LSM510) was used in reflection mode, using a 40x (NA 0.95) objectiveand an 8x zoom (total magnification 200x). An optimum pinhole (1 Airy) was chosento gain an optimum balance between S/N-ratio and resolution. At all sites, xz-stackswere made with constant settings. Xy-frames were made twice: once using constantsettings (detector gain 581, amplifier offset -0.127) and once by adjusting detector gainand amplifier offset to obtain the best contrast. Amplifier gain was kept constant at1.42 and refractive index was set to 1.62 (equal to enamel) in all measurements. Depthprofiles were created by calculation of the mean intensity of each line in the xz-frame.Identical results were obtained when the mean intensity was calculated of each xy-frame.

58 Appendix B. In-vitro techniques studied
Figure B.5: Images of sound and demineralised enamel created using CLSM in reflectionmode. In the upper left corner, a typical xz-cross section of sound enamel is shown (bar10µm). In the upper right corner, the mean intensity vs depth (µm) plot is shown withthe accompanying xy-images. The bottom row shows these images for demineralisedtissue of the same sample.
B.2.2 Results
The first intensity peak seen in the images (figure B.5) originated from a reflectionfrom the glass slide- water transition. The second peak was caused by the water-enameltransition. In demineralised enamel, part of the surface had eroded, so more waterwas present between the glass slide and the surface. More light was remitted fromdemineralised tissue as can be seen from the height and width of the second peak. Thiswas due to an increased diffuse scattering.1 For the same reason, structural featuresdisappeared in demineralised tissue. The same pattern was observed for other samples(n=3) and therefore, a distinction could be made between sound and demineralisedenamel. However, no information was obtained about prism structure or lesion zones,nor could the depth of the lesion be determined.
1So the increased scattering found in demineralised enamel led to more backscattering (detected inCLSM) and to less Raman-shifted light.

B.2. CLSM 59
B.2.3 Discussion and conclusion
Duschner [38] reported that light from demineralised enamel appeared more diffuse,which was also observed in this experiment. He also found that the subsurface zoneilluminated by the laser was less in caries tissue when compared to sound tissue; afinding that could not be confirmed. The most notable outcome of this study was thatthe characteristic honeycomb structure, the banded subsurface and the lesion zones werenot observed.
This may have been caused by the choice of immersion medium. Oil immersion couldimprove the results as it would reduce distortions of the image in the optical axis dueto better refractive index matching of the lens immersion medium (n=1.5 for oil, n=1.3for water) and the enamel (n=1.62). Using oil immersion, visualisation depths up to100 µm were reported [38] as compared to ≤50 µm here. Therefore, further researchshould use oil immersion and then apply TMR as a reference method to investigate theability of CLSM to visualise lesion structure.

60 Appendix B. In-vitro techniques studied

Appendix C
Prediction intervals
To calculate the predictive value of the minimum mineral content in the body (MBL),a regression line was established between ln(vdem) and MBL for the combined data ofTheuns’ experiment and the data presented in the experimental chapter (chapter 3)(n=75). For the natural range of MBL, 20 ≤ MBL ≤ 90, the following relationship wasfound (R2 = 0.8048) (figure C.1):
vdem,f = 84.26(e−0.04MBL) (C.1)
with:f = forecast.
This is equal to:
ln(vdem)f = ln(84.26)− 0.04MBL (C.2)
(a) MBL vs vdem (b) MBL vs ln(vdem)
Figure C.1: Relation between MBL and the rate of demineralisation
61

62 Appendix C. Prediction intervals
For prediction of a specific value of MBL, three factors need to be included. First ofall, the predicted value from the regression line (ln(vdem)f ). Secondly, the uncertaintyregarding the position of the regression line and thirdly, the standard deviation of theerror (se) which causes an individual value to deviate from the regression line. The lasttwo factors are combined in the standard deviation of the forecast (sf ), which can becalculated using [43]:
sf = se
√1 +
1n
+(MBLm −MBL)2∑ni=1 (MBLi −MBL)2
(C.3)
(C.4)
with:i = observationm = measuredMBL = average MBLn = number of observationsr = real
and with:s2e =
∑ni=1 e2
in−2 , the mean square error of the least squares method, in which:
e = error
To construct a prediction interval, a t-distribution with n-2 degrees of freedom isused. The certainty that the true value lies within the range found, is determined bythe (two-tailed) 100(1− α) confidence interval applied [43]:
ln(vdem)f + (tα/2,n−2)(sf ) ≤ ln(vdem)r ≤ ln(vdem)f + (tα/2,n−2)(sf ) (C.5)
with:1-α = confidence coefficientf = forecastn = number of observationsr = realsf = standard deviation of the forecastt = t-distribution with n-2 degrees of freedom