masters thesis. conrem.adonis musta
TRANSCRIPT

1
Impact of risk analysis related to time, quality
and cost in construction projects
Master thesis
International Master of Science in Construction and Real Estate Management
Joint Study Programme of Metropolia UAS and HTW Berlin
Submitted on 14.08.2018 from
Adonis Musta
S0557531
First Supervisor: Prof. Dr. Ing. Dieter Bunte
Second Supervisor: Eric Pollock

[Acknowledgement]
I would like to express my deepest gratitude to my supervisor Prof. Dr. Ing. Dieter
Bunte for his patience, guidance, consultations, and support during this period of
completing this master’s thesis. His valuable advice and comments make it easier
the entire process of thesis writing and always to go in the right direction during the
research.
Many thanks go to my second supervisor Mr. Eric Pollock for his support during this
master’s thesis also during the entire period of 2 years of the master program.
To my lovely fiancé Benuarda for motivating and inspiring me during the entire Mas-
ter program, thank you very much for being on my side during this journey.
A special thanks and gratitude go for my parents Behar& Shpresa, my sister Arjola
and my brother Roland, thank you very much for your dedication, emotional and fi-
nancial support for all this period.
Finally, I would like to thank everyone that was part of this research or support during
this time, thank you to all people that accepted to help with valuable information and
advice for completing this master’s thesis.

3


5
Abstract
This master thesis deals with risk management and their impact during the imple-
mentation of the construction projects. It illustrates the risk management process and
how the risk impact analyzes can affect the mitigation process of risks without affect-
ing the scope of the project composed of three main components such as costs, time
and quality.
It is well known the relationships between costs, time and quality and how they can
influence each other during the realization of the construction projects, many con-
struction projects have faced the accomplishment of one or two objectives but could
not achieve all of them, for instance there are many construction project that are de-
livered according to the predetermined quality but in same time they face scheduling
problems, delays or costs problems.
The main aim of this thesis is to find a relationship between risk impact analysis and
the settled objectives of the project and how the understanding of this relationship
can help to improve to determine the priorities among several objectives during the
implantation of the project.
This thesis aims to emphasize the recognition of Risk assessment and management
as a powerful tool for improving the process of delivering construction projects, mini-
mizing the uncertainties and maximizing the opportunities that might be developed
under certain circumstances.
A case study methodology approach was adopted to be able to achieve significant
results that support the aim of this thesis, by elaborating two case studies and explor-
ing the risk management techniques used by two companies in Albania, to under-
stand how is defined the accurate strategy to support the accomplishment of the ob-
jective of the project.
A simple numerical method for risk impact quantitative approach is proposed, a
method that easily can be applied during the risk management process, that might
improve the techniques and the process of risk analysis and giving a proper weight to
the expected impact that each identified risk might have on the scope of the project.
The focus of proposed method to define the weight of risk impact and risk probability
of risks and expressing their impact on the possibility or ability to influence or change

7
the settled objectives such as costs, time and quality. A huge attention is paid to risk
identification and analyze as the two main phases of the risk management, due to the
outcome of these two phases is determined and developed the entire strategy of
dealing, monitoring and controlling the risks.

Table of Contents
Abstract ..................................................................................................................... 6
Table of Contents ..................................................................................................... 8
Table of Figures ...................................................................................................... 12
List of Tabulations .................................................................................................. 13
List of Abbreviations .............................................................................................. 15
1. Introduction........................................................................................................ 16
1.1 Background................................................................................................... 17
1.2 Problem statement ........................................................................................ 18
1.3 Aim and Objectives, research questions ....................................................... 20
1.3.1 Aim ....................................................................................................... 20
1.3.2 Objectives ............................................................................................ 20
1.3.3 Research questions .............................................................................. 20
1.4 Significance of Study ..................................................................................... 21
1.5 Methodology .................................................................................................. 21
1.6 Limitations of the study .................................................................................. 22
1.7 Structure of the report .................................................................................... 22
2 Project Management theoretical background ................................................. 24
2.1 Project .......................................................................................................... 24
2.2 Project management ..................................................................................... 24
2.3 Project performance scope ........................................................................... 25
2.3.1 Cost management ................................................................................ 28
2.3.2 Time management ............................................................................... 30
2.3.3 Quality management ............................................................................ 31
2.4 Delays in construction projects ..................................................................... 32
2.4.1 Basic classification of delays ................................................................ 33

9
2.4.2 Methods of calculation of delays .......................................................... 34
2.5 Identification of Risk Factors Causing Cost Overruns, Time Overruns and
Quality Problems in Construction Projects .................................................... 34
3. Risk Management theoretical background...................................................... 35
3.1 Introduction ................................................................................................... 35
3.2 Definition of risks .......................................................................................... 36
3.3 Risks, Uncertainties, Opportunities ............................................................... 38
3.4 Project Risk Management ............................................................................. 38
3.5 Construction risk management ..................................................................... 39
3.5.1 Risk probability in construction projects ............................................... 40
3.6 Benefits of construction risk management .................................................... 41
3.6 Risk Identification .......................................................................................... 42
3.7 Risk Assessment and analysis ...................................................................... 45
3.7.1 Qualitative methods ............................................................................. 47
3.7.2 Quantitative methods ........................................................................... 47
3.8 Risk response and monitoring ....................................................................... 49
3.8.1 Risk response ...................................................................................... 49
3.8.2 Monitoring ............................................................................................ 50
3.9 Developing a Risk Breakdown Structure ....................................................... 50
4 Research Methodology ..................................................................................... 51
4.1 Research Strategy and Design ...................................................................... 52
4.2 Research Process ......................................................................................... 53
4.3 Literature Review ........................................................................................... 53
4.4 Design and Administration of the Case Studies ............................................ 54
4.6 Data Collection .............................................................................................. 55
4.7 Data Analysis ................................................................................................. 56

4.8 Validation and Reliability ............................................................................... 56
5 Case study ......................................................................................................... 57
5.1 Case Study A ................................................................................................. 57
5.1.1 Company profile and project details ..................................................... 57
5.1.2 Risk Management Process .................................................................. 59
5.1.3 Risk Identification, Checklist technique ................................................ 60
5.1.4 Risk Analysis, Impact assessment technique ...................................... 62
5.1.5 Risk Response strategy ....................................................................... 64
5.2 Case Study B ................................................................................................ 67
5.2.1 Company profile and project details ..................................................... 67
5.2.2 Risk Management Process .................................................................. 69
5.2.3 Risk identification ................................................................................. 70
5.2.4 Risk analysis ........................................................................................ 72
5.2.5 Risk response strategy ......................................................................... 76
5.3 Results .......................................................................................................... 77
5.4 Discussion and comparison of Case studies ................................................. 81
5.5 Conclusion ..................................................................................................... 82
6 Risk analyze, Risk Impact method ................................................................... 83
6.1 Absolute and normalized probabilities of risks ............................................... 84
6.2 Risk Impact- Quantitative approach ............................................................... 86
6.3 Risk Exposure-Quantitative Approach ........................................................... 92
6.2 Conclusion .................................................................................................... 94
7 Conclusion and recommendations .................................................................. 95
7.1 Introduction ................................................................................................... 95
7.2 Conclusions .................................................................................................. 96
7.3 Recommendations ........................................................................................ 98

11
Declaration of Authorship ...................................................................................... 99
References ............................................................................................................ 100

Table of Figures
Figure 1.7 1 The outline of the master thesis........................................................... 23
Figure 2.3 1 Costs, time and quality three main components of the scope of the project
................................................................................................................................. 26
Figure 2.3 2 Framework to measure the success of construction projects .............. 27
Figure 2.3.1 1 Stages of cost valuation ................................................................... 28
Figure 2.3.1 2 Difference of cost estimation in different phase of the project .......... 29
Figure 2.3.1 3 Cost control during the implantation of the project ............................ 30
Figure 3.2 1 Relationship between the probability and magnitude of the impact of the
risks Source Kerzner 2009 ....................................................................................... 37
Figure 3.7.1 1 Probability Impact Matrix .................................................................. 47
Figure 5.1.2 1 Risk management process in case study A ....................................... 59
Figure 5.2.2 1 Risk management Process for the case study B ............................... 70
Figure 5.3 1 Percentage of risks affecting the scope of the project, Case study A ... 78
Figure 5.3 2 Expected level of Impact for identified risks, Case study A .................. 78
Figure 5.3 3 Impact of identified risks related to costs, time and quality, Case study A
................................................................................................................................. 79
Figure 5.3 4 Level of Risk Impact for identified risks, Case study B ......................... 80
Figure 5.3 5 Impact of identified risks related to costs, time and quality, Case study B
................................................................................................................................. 81

13
List of Tabulations
Table 1 1 Economical components of Albania’s GDP .............................................. 17
Table 3.6 1 Categories of risks ................................................................................ 44
Table 5.1 1 Company profile Case study A ............................................................ 57
Table 5.1 2 Ambassodor 3 project profile ................................................................ 58
Table 5.1 3 Information of Project management team involved on Project .............. 59
Table 5.1 4 List of risks faced during the realization of the project .......................... 61
Table 5.1 5 Impact Assessment of identified risks ................................................... 63
Table 5.1 6 Risk management strategy to mitigate the influence of the risks .......... 64
Table 5.2 1 Company profile Case study B ............................................................. 67
Table 5.2 2 Basic descriptive data of Magnet project .............................................. 68
Table 5.2 3 Descriptive data of the project management team involved in Case B . 68
Table 5.2 4 Categorizing risks based on the phase of the occurrence .................... 70
Table 5.2 5 Categorizing risks according to the probability of the occurrence ......... 73
Table 5.2 6 Categorizing risks based on the impact in the scope of the project ...... 73
Table 5.2 7 Risk Probability-Impact Matrix .............................................................. 74
Table 5.2 8 Risk probability and Impact on costs, time and quality ......................... 74
Table 5.2 9 Risk response strategy ......................................................................... 76
Table 6.1 1 Identified risks and their respective probability of occurrence ............... 84
Table 6.1 2 Normalized Probability of risks.............................................................. 85
Table 6.2 1 Normalized Impact, costs has the priority ............................................. 86
Table 6.2 2 Normalized Impact of risks, time has the priority .................................. 87
Table 6.2 3 Normalized Impact of risks, Quality has the priority .............................. 87
Table 6.2 4 Normalized Impact of risks, Cost, time, quality share same level of priority
................................................................................................................................. 87

Table 6.2 5 Absolute impact and Normalized probability of risks related to costs of the
project ....................................................................................................................... 88
Table 6.2 6 Absolute impact and Normalized probability of risks related to time of the
project ....................................................................................................................... 88
Table 6.2 7 Absolute impact and Normalized probability of risks related to quality of
the project ................................................................................................................. 89
Table 6.2 8 Normalized Risk impact of risks related to costs of the project ............. 90
Table 6.2 9 Normalized Risk impact of risks related to time of the project .............. 90
Table 6.2 10 Normalized Risk impact of risks related to quality of the project ......... 90
Table 6.2 11 Normalized Risk impact of risks related to costs, time, quality on same
level of priority .......................................................................................................... 91
Table 6.3 1 Risk Exposure, Priority list of Risks when priority is given to Costs ....... 92
Table 6.3 2 Risk Exposure, Priority list of Risks when priority is given to Time ........ 93
Table 6.3 3 Risk Exposure, Priority list of Risks when priority is given to Quality ..... 93
Table 6.3 4 Risk Exposure, Priority list of Risks when Costs, time, quality share same
level of priority .......................................................................................................... 94

15
List of Abbreviations
CPM Critical Path Method
GDP Gross Domestic Product
PM Project management
RBS Risk Breakdown structure
RM Risk Management

1. Introduction
Nowadays the dynamic of the economy in every sector is becoming more than ever
demanding, the level of competition is very high, and the construction industry is not
part of an exception. The construction industry is adapting to the changes and de-
manding of the economy, clients and organization approach to delivering a construc-
tion project is changing over time.
Private or public organizations, owners, clients are asking more than ever for a guar-
anteed success before deciding to invest or fund a project. This specific request is
related to the past and gained experience in the construction industry, where the
relationship between success and failure is extremely close. There is a difficult process
to deliver a successful project in construction and in the other part, it is easy to list a
project as a failure, because of the amount of the objectives and goal that a project
should meet at the end.
A successful project, independently the type of the project or organization, is consid-
ered when is delivered according to predetermined budget, time and quality. The
accomplishment of these three aspects, that compose the scope of the project, is a
complex process because of the amount of the risks associated with any of these three
components.
Construction projects are associated with risks, typology and the source can differ from
country to country or organization to organization but there is a high probability that
every type of project in construction has its own risks during the development.
The motivation for pursuing this study is to give an overview of how different risk affects
a different aspect of the project by leading to unexpected changes to the scope and
objectives of the project. Through different statistical analysis, it is easy to understand
that companies which apply a proper risk management have a better performance than
the organization who do not have an accurate strategy in dealing with and managing
the risks.

17
Many organizations struggle to deliver their project according to the schedule, causing
delays, which usually are associated with a cost overrun or other undesired actions
such as claims, penalties, legal and technical problems etc.
This work will focus on treating a problematic approach that private organizations usu-
ally face when they create the risk management process, many cases not efficient,
leading to delays and cost overrun. It is well known that construction projects involve
different organizations, people and in many cases the participants do not share the
same objectives or same approach to risks.
There is an increasing need to build an integrated risk management process, involving
every stakeholder, to maintain the same approach and scope during the development
of the project.
Organization for other industries such as manufacturing has embraced before the role
and the importance of risk management, have created and established a fluid process
and strategy on dealing and managing the risks by giving a specific focus to risk man-
agement team. Construction industry should improve the approach because the focus
is on a budget, time, quality without trying to understand the sources of the risks that
affect the accomplishment of the project scope.
1.1 Background
The construction sector has been the leader of the economy for many countries and
giving a huge impact on the society such as being a sector that offers a great oppor-
tunity for jobs, for skilled and unskilled labors contributing in decreasing the level of
unemployment.
According to INSTAT (2015), in Albania, the contribution and the impact of the
construction sector is more crucial because of the weight of this sector in the overall
GDP (Gross Domestic Product) being the third after service sector and agriculture.
Based on INSTANT the construction sector composes 14,9 % of GDP.
Table 1 1 Economical components of Albania’s GDP
Economy GDP
Service Sector 47.3%
Agriculture Sector 18.3%

Construction 15.2%
Industry 9.8 %
Transport 9.4 %
Although the development and role of the construction sector in Albania’s economy,
the industry performance according to many experts is very poor, for many reasons
such as political, legal and technical etc.
According to (KEÇI, 2017) reasons that many projects, specifically infrastructure pro-
ject funded by the government, fail to achieve their scope because of the high political
influence, limited funds and lack of experience to establish a risk management process
to define accurate tool or technique that it fit the objectives of the project.
(Kartam N.A and Kartam S.A , 2001) report that the construction industry is exposed
not only to the risks associated with construction process but also is exposed to the
external risks such as political, economic (inflation) etc.
It is widely accepted that every construction project has a certain level of risk and un-
certainty, independently the size of the project or the structure of the organization, but
the impact that risk is somehow in a proportional relationship with the size of the pro-
ject, for example in a large-scale project risks and their impact are higher than a small-
scale project.
According to (PMBOK, 2008) the project management team should be able that
through different tools, a technique to fulfill the demands and objectives of the project.
Risk management is considered as an important phase during the project management
process, to identify, analyze and to prepare a risk response plan for potential risks.
(Kerzner, 2009) believes that improving the process of risk management can lead to
an optimization of delivering the project and in the same time can help to build a stable
process without avoiding or changing the scope of the project, avoiding time and cost
overrun or low quality.
1.2 Problem statement
It is not realistic to consider a construction project with no risk. The risk is present in
most of the type of activities that comprehend a construction project. Based on

19
(Loosemore M, Raftery J, Reilly C and Higgon D, 2006) it is the presence of the risks
that influence the non-accomplishment of objectives of the project leading to a poor
performance regarding the triple constraint of cost, time and quality.
(Kerzner, 2009) enforce this idea that the presence of risks and uncertainties during
the development of the project affect the objectives of the project, creating a complex
situation and the decision-making process very difficult.
According to (DERVISHI, 2015), there is a considerable number of projects in Albania
that are listed as a failure or they face different changes of the project objectives, re-
sulting with time and cost overrun low quality. (DERVISHI, 2015) emphasizes that
among many reasons of project scope failure can be listed as important the lack or
poor experience on building a stable risk management process, many cases it is no-
ticeable that risk response plan is based on reactive actions and decisions and not
proactive.
This systematic approach of dealing with risks and uncertainties in a reactive way lead
to cost and budget, time overrun, low quality and in the overall low performance of
delivering the project.
(PMBOK, 2008) give the recommendation that risk management should be an integral
part of project management process, as the only technique or tool that can help to
identify, analyze and to prepare an accurate risk response plan to manage the risks.
Construction industry involves many risks and uncertainties comparing to other indus-
tries because of large number of people involved in the project, the number of funds
required to be completed, legal and technical restrictions etc.
Although the higher probability of the presence of risks, construction industry it seems
to a step behind other industries on the approach of dealing the risks, for example,
manufacturing industry has already a risk management more efficient.
It is the duty of the participants in the construction industry such as client, contractors,
designers and project managers to develop a risk management process that is led by
the proactive approach, to avoid the changes or non-accomplishment of the project
scope, avoiding cost and time overrun. According to (Kerzner, 2009) a risk manage-
ment process can be improved only once the project management and other stake-
holders face new challenges, by changing the approach, building a stable process, and
involving all participant in this process.
This study will focus on this challenge, to identify the practices of risk management in
the construction industry in Albania and to understand how is modeled in practice risk
management and what are potential consequences related to cost, time and quality.
1.3 Aim and Objectives, research questions
1.3.1 Aim
The main aim of this study is to assess the impact of risk analysis and risk management
practices in Albania to create a critical approach of the way of managing risks, to illus-
trate the benefits or consequences of risk management process related cost, time and
quality.
1.3.2 Objectives
The settled objectives for this study are:
1- To give a clear explanation of how the implementation of risk assessment and
analyze can affect the balance of three main objectives of a construction
projects such as cost, time and quality.
2- To illustrate if risk analyzes can improve the process of finding the proper bal-
ance between costs, time and quality.
3- To illustrate the importance of associating the potential risks with the accurate
impact and probability, risk exposure and how this influence on defining the right
risk management strategy.
1.3.3 Research questions
To achieve the aim of this research were drawn the below questions:
1- Which are the most dominant factors that affect the balance of construction pro-
ject objectives?
2- How the risk management methods and risk analysis affect project duration,
quality, and total costs?
3- Who is the most common risks identification and assessment techniques and
how they affect or change the determination of the objectives of the project?

21
4- How to minimize the uncertainties and maximize the opportunities during the
realization of the construction projects.
1.4 Significance of Study
The scope of the project composed by triple constraints such as cost, time, quality can
be achieved more efficiently with the implementation of an accurate risk management
process. Risk and uncertainties are the main causes of the deviation from the objec-
tives of the projects for that reason there is a need to provide a critical approach to
various risk management practices.
This work seeks to provide practical cases of risk management, how efficient different
techniques are, and what it will be an optimization technique that leads to a better
result regarding costs, time and quality.
This work will help to understand how it developed a risk management strategy on
construction projects in Albania, what is the impact of risk analyses in a construction
project. To determine the weak points of the risk assessment and to define a clear
relationship between these defects and the consequences that are applied in such
cases.
This study can be a motivation for another researcher to focus on this area, to develop
a clear strategy, to minimize the gap between theoretical and practical construction
risk management.
1.5 Methodology
The methodology in conducting this study will consist in the quantitative method. Data
will be collected through different textbooks, previous research work, internet, research
paper also through interviews with project managers for practical case studies.
It will be gathered a specific information related to the scope of the project and the
relationship between risk management and costs, time and quality. Through this theo-
retical part will lead in understanding the gap between theoretical and practical part of
applying risk assessment.

1.6 Limitations of the study
Although the desire it is unrealistic to study and to focus on everything, for that reasons
this work will consider as main objectives of the construction project only three aspects
such as costs, time and quality. The other goals such as environmental and sustaina-
bility requirements, safety, technological such as the application of different software
will not be considered during the development of this study.
Also, this study will not take in consideration the maintenance and operational phase
of a construction project as it is considered a phase free of risks, or the level of risks is
approximately is nearly zero and do not have an impact of pre-determined budget,
schedule or quality of the project.
1.7 Structure of the report
This report of the research is conducted in 7 chapters as it is explained below:
Chapter 1: Introduction chapter contains general information about the problem state-
ment, background, aim of the research and explain which the objectives and questions
are respectively to be achieved and to be answered during the conduction of the re-
search.
Chapter 2: This chapter provides an outlook of the literature review and theoretical
background regarding the Project Management, explaining the definitions and con-
cepts of project management and more in details focused on the scope of the project
such as costs, time and quality.
Chapter 3: This chapter also is focused on providing a literature review and theoretical
background regarding the Risk Management, explaining the most known and used tech-
niques and methods of risks assessment, focusing more on the technique for risks identi-
fication and risk analysis as main phases of the risk management process.
Chapter 4: Provides information on the methodology used for completing the research,
giving scientific support for the chosen approach, case study, and the significance of
the case study methodology in research.
Chapter 5: This chapter contains information about the chosen case studies, detailed
analysis of the case studies and the detailed explanation of the risk management pro-
cess followed by the 2 companies, contain a summary of the findings and discussions

23
and comparison between the cases to find the differences and the similarities between
them.
Chapter 6: Provides information about the Risk Impact Method proposed a technique
that might improve the process of determining the proper weight of the impact or the
risks exposure as key elements of defining the risk management strategy on keeping
costs, time and quality under the predefined levels.
Chapter 7: This chapter contains information about the conclusions achieved from
this research, containing future recommendations and limitations of the study.
The below Fig. 1.7 1 illustrates the stages that have been followed to conduct this
research.
Figure 1.7 1 The outline of the master thesis
Source: Author’s work

2 Project Management theoretical background
2.1 Project
According to (DIN 69 901, 2009)(German building standard and regulation), the
project is defined as an intention, which his basic are extremely unique (anti-cyclical),
his configuration is composed by a certain level of complexity, it has a definite point
such as start and end, a predetermined budget and involves different organizations
and people.
According to (PMBOK, 2008) “a project is a temporary endeavor undertaken to cre-
ate e a unique product or service “, basically it represents the same idea that a project
in construction industry is unique for several reasons, it has a specific period of imple-
mentations from initial point to the end, to the realization of the product or service.
(Kerzner, 2009) goes more deeply and believes that a project is a sum of different
activities and tasks to be performed to achieve the objectives of the project and any
activity or specifications has its own limitations such as time (start and end), limitations
on human and non-human resources (people, money, equipment) etc.
Based on (Turner, 1992), a project should as an endeavor, to complete a unique goal
or objective should be integrated in an efficient way people, economic resources, and
materials within predetermined limitations such time and budget.
2.2 Project management
(PMBOK, 2008) defines project management as a process in which should be applied
knowledge, leadership, and technical skills, usage of proper techniques for the accom-
plishment the scope of the project. (PMBOK, 2008) clearly distinguish different phases
for this management such as imitation, plan, execution, control, and closing.
According to (DIN 69 901, 2009) (German building standard and regulation), project
management is the collectivity of administrative tasks, administrative activities, tech-
niques and instruments for the development of the project.

25
(Garold D, 2000) stated that project management is “the art and science of coordinat-
ing people, equipment, materials, money. and schedules to complete a specified pro-
ject on time and within approved cost “.
A project to be successful or to deliver his final scope as desired requires a manage-
ment process so-called “project management” and tasks for this process are com-
pleted by a specific team in the organization named Project management department.
Furthermore, every author believes that project management is a process of planning,
organizing, supervising and following step by step through controlling and correcting
(taking actions when something is not according to the plan) for a given time in order
to complete objectives and the scope of the project.
2.3 Project performance scope
According to (Parvan, K, Rahmandad H and Haghani A, 2015), the most suitable def-
inition for project performance is to measure the level of accomplishment of objectives
settled, and this process involves a certain number of activities and tasks that should
be satisfied during the development of the project.
(Chan P.C.A and Chan A.P.L , 2004) defines a successful project when are settled
several standards during the feasibility and planning phase and the outcome of deliv-
eries is according to the specification fixed at the beginning of the project.
(Kerzner, 2009) defines project success as the process of the accomplishment of any
activities and tasks by following the fixed constraints of costs, time and quality. Also,
(Kerzner, 2009) develops his idea that this definition has evolved nowadays, and other
requirements should be taken in consideration such as acceptance of the provided
service by the customer or end user, no changes of the workflow of the organizations
and no changes of the corporate culture.
It is obvious that the level of success can differ for different organizations or people
involved in the project, different participants in this process try to define and to set
standards according to their needs or their possibilities. Success expectations for the
project of the client are different from those of the contractor, and usually, it is created
a gap between the level of required service and that provided.

(Chan P.C.A and Chan A.P.L , 2004) emphasize that it is not unknown situations when
different participants in this process settle their own project object goals, and same
time they develop they own strategy to measure the level of success or accomplish-
ment for such objectives.
For example, the client usually is more interested in the allocated time and cost of the
project, so they can have revenue as soon as possible, general contractor is interested
to maximize his profit in a shorter time for the given price by providing the minimum
level of agreed quality, architects and engineers are more concerned about the level
of the quality paying less attention to time and budget.
According to (DIN 69 901, 2009) (German building standard and regulation) for each
participant, there are different priorities for the objectives of the project.
Figure 2.3 1 Costs, time and quality three main components of the scope of the project
Source DIN 69 901
In the fig.2.3.1 is illustrated the relationship between three main components of the
scope of the project cost, time and quality, also it mentions the priority that three par-
ticipants such as the client, contractor, and architects settle for the accomplishment of
the project scope.
It is clearly defined that project scope cannot be realized in case that one of those
components is not completely fulfilled. It is the duty of the project management team
to build a proper balance between the level of the requirements and level of construc-
tability or possibility, so in that way to find a medium way to understand difficulties and

27
demands of the contractor without neglecting the requests, possibilities, and desires
of the client. Project success it depends on several factors, obviously the three main
component are cost, time and budget but depending on type of the project, size, and
type of the organization they can adopt the scope of the project according to their
needs by adding extra elements such as the legal and technical requirements (most of
the time such requirement are considered granted because they are mandatory by
governmental authorities and national building codes), environmental performance or
level of satisfaction of the end user.
Figure 2.3.2 presents a consolidated framework for measuring the success of construc-
tion projects.
Figure 2.3 2 Framework to measure the success of construction projects
Although the number of factors that can be added for project scope and success, for time
limitations and to realize the purpose of the research, project scope will be considered as
an integration of three main components such cost, time and quality. The other possible
requirements or goals are not taken into consideration during the development of this re-
search.
Based on (Navarre C and Schaan J.L, 1990)that support the idea that the level of success
for construction projects should be measured only by the level of these 3 main compo-
nents:

1. Cost
2. Time
3. Quality
These three elements should be the main concern for the project management team for
creating a proper balance during the development of the project because from this balance
or relation it depends if a project will be successful or it will be listed as a failure.
2.3.1 Cost management
From first idea or feasibility study, the main consideration that defines the project or
even that most of the decision to run a project or not it depends on the possible cost
and budget that the project requires.
According to (Wysocki, 2009), the first decision that is made on the project is related
to the cost or budget, and this consideration will be present during all the life cycle of
the building.
According to (DIN 276 (06/93, 2009) cost planning is the entirety of all activities for cost
valuation, cost control, and cost regulation. Cost planning accompanies continuously
all the phases of the project realization including design and construction. It deals sys-
tematically with cause and effects of the costs.
A cost management plan or strategy is needed through all the phases of the project,
only in that way the risk related to the cost can be avoided or minimized as much as
possible, otherwise without a strict cost management process or strategy from win sit-
uations it can convert in a failure for the realization of the project.
Figure 2.3.1 1 Stages of cost valuation

29
Estimation cost is a process that should be done simultaneously and continuously dur-
ing the development of the project, from the first idea to the end of the construction,
the main reason is that risks are associated with the money. The main reason why it is
needed a detailed plan and execution regarding the cost is that the amount of required
budget for the completion of the project can easily increase and will lead to non-ac-
complishment of the project scope and in many cases even to failure.
Estimation of the costs is the initial phase and it is a crucial importance because this is
determined the required budget for the development of the project, also it is helpful in
the cost control phase. Although, based on (DIN 276 (06/93, 2009), there is a
difference of approximately 40% of the total costs in the estimation phase and cost
detection phase as is illustrated in the Fig. 6
Figure 2.3.1 2 Difference of cost estimation in different phase of the project
(PMBOK, 2008) Estimation phase is crucial because this phase is made the decision
to run the project or not and trying to find if it is profitable to run the project.
(Kerzner, 2009) believes that in cost management process a specific attention should
go to the cost control regardless the size of the organization or companies, or regard-
less the size of the project because a failure in cost control automatically will lead to a
failure on the project and in the case of large-scale projects it can lead even to the
failure of the company.
According to (Kerzner, 2009)cost control is not only “monitoring”, but it is a more com-
plex process, such as identifying possible deviations on cost, analyzing also keeping
a record for cost data, also taking corrective actions can be made in this phase. Cost

control is the main phase in all cost management and control system (CMCS). Fig n7
illustrates the process of cost control during the operating phase when the project al-
ready started to run, and this process can be done even during the design phase.
Figure 2.3.1 3 Cost control during the implantation of the project
According to (Nicholas J.M and Steyn H, 2008) cost estimation and cost control is a
complicated process because of the information available in a different phase of the
project. For that reason, the focus of project management team in cost management
should be in the higher level, otherwise, cost overrun it will be unavoidable leading to
non-accomplishment of project scope or to the failure of the project.
2.3.2 Time management
According to (Wysocki, 2009) setting time and a deadline or project duration is not an
easy task, project duration can be specified by the client according to his needs and a
change on that time frame, to reduce or increase this given period will affect other
components of project scope such cost.
For example, a reduced time frame of the project by using more resources than needed
will lead to an increase in the cost. On the other way, time extension also will lead to
changes in project scope because usually, time extension happens because of non-
proper management, leading to the contractual penalties.
(Turner, 2014) support the idea that time schedule is a process of defining what will be
done and when will be done, also keeping record and monitoring when is done. This
statement supports the importance of time management, to respect the dynamic of the
project, which is composed by many activities and tasks and one delay in one specific
task can lead to a domino effect for the next activity or task.

31
For that reason, (Turner, 2014) develop his idea more deeply by suggesting that time
controlling, and time recording is crucial because only in that way the project manage-
ment team will be able to find out any possible delay, or changes regarding planned
schedule.
(Haidar, 2016) insist that time schedule should be accurate and realistic, also they
need to meet the specific requirements of the client or to the other stakeholders such
as contractors, or designer etc.
According to (Haidar, 2016) the scheduling should identify a clear logic and structure
of sequences of activities, by creating a program delivery program and providing in the
same time the right tool to manage this delivery program.
Based on (PMBOK, 2008) from the planning phase to control and monitor phase two
are the most common tools for time management:
1- Critical Path Method
2- Float analysis
The Critical Path Method (CPM) can be defined as a tool that determines the depend-
encies between activities, determines their logical sequence and interrelationships.
The main goal of the CPM is to determine the longest or shortest path for the comple-
tion of those activities.
For that reason, based on (Haidar, 2016) CPM is extremely useful for monitoring the
progress and identifying the possible potential delays, which can affect the time deliv-
ery for the entire project.
2.3.3 Quality management
It is acceptable by everyone that definition and meaning of quality are different for dif-
ferent people. Generally, that is understood as a balance between the level of expec-
tation and level of satisfaction accomplished after the service or product is delivered.
According to (Lester, 2014), the general definition of quality for activities such as man-
ufacturing, processes, and services is the fulfillment of these aspects:
1- fulfilling the customer needs
2- appropriateness for use
3- fulfill the requirements

According to (Lester, 2014) in the construction industry, the definition of quality differs
from manufacturing industry because in manufacturing the level of quality is spread on
series of activities, on the other hand in the construction industry the level of quality
delivered it is strictly related to the control management process. The quality in con-
struction is a more complicated process and more difficult to be achieved because of
nonrepetitive activities, the product is unique and the involvement of different organi-
zations and people.
(Wysocki, 2009) in the construction industry, are expected to be delivered two types of
quality:
1. Quality of the product: the quality deliverables from the project.
2. Quality of the process: the quality of the project management process itself.
Based on (Wysocki, 2009) the quality of a construction project is determined by the
final product which should satisfy several aspects such as:
• fulfill the requirements and specification: the final product is according to the plan; the
project is delivered according to predetermined budget and cost.
• fulfill the customer’s requirements: the project output meets the requirements the
customers had of it.
• Satisfies the customer or the end user: the project output and the outcome make
customers feel satisfied.
2.4 Delays in construction projects
According to (Enshassi A, Al-Hallaq K and Mohamed S, 2006), the construction indus-
try is becoming extremely demanding and complex for a certain number of reasons
such as the complexity of construction process in itself, large number of people and
organizations involved, and the dynamic of construction processes etc.
Based on (Hancher D.E and Rowings I.E, 1981) the completion of one construction
project within the predetermined budget and cost, with the agreed level of quality re-
quires a critical engineering judgment. (Odeh A.M and Battaineh H.T, 2002) reports
that although all participants in a construction such as clients, contractors, or designer
probably do not like or do not want to admit they have faced delays on their projects

33
leading to time extension of delivering or commissioning the project, and the conse-
quences will be the increase in time and costs.
(Lester, 2014) emphasize that delays in the construction industry are the source for
other complex problems such as cost overrun, time overrun and often is accompanied
with extra problems such as claims for compensations, legal issues, liquidity problems.
The Construction delay may be defined as ―the time overrun either beyond comple-
tion date specified in a contract or beyond the project delivery date as agreed by par-
ties‖ (Assaf A.S and Al-Heijji S , 2006).
In construction projects, delays are described as the time overruns either beyond com-
pletion date specified in a contract or beyond the date that the parties agreed upon for
delivery of a given project (Assaf A.S and Al-Heijji S , 2006) .It is a project slipping over
its planned schedule and is considered as a common issue in construction projects.
Consequently, it is reported by (Assaf A.S and Al-Heijji S , 2006) that delays could be
to a client as a loss of revenue through lack of production facilities and rent-able space
or a dependence on present facilities. In some cases, to the contractor, delay means
higher overhead cost because of the longer work period, higher material cost through
inflation, and due to labor cost increases.
2.4.1 Basic classification of delays
There are many reasons and factors that can lead to a delay in a construction project,
but according to (Kerzner, 2009) these factors can be assembled in two main groups,
by understanding the causes of affecting these delays if are internal or external.
Internal causes are to be considered those that are derived from participants of con-
struction projects such as client, contractor, designers or consultants.
External causes are to be considered those that are derived from other parts, that are
not in control by participants such as natural disasters, political actions, material sup-
pliers etc.

2.4.2 Methods of calculation of delays
According to (Haidar, 2016) there are two suitable methods for calculating or having a
plan to manage the delays in a construction project, the first one is called the Gross
Method and the second Net Method.
Figure 2.4.2 1 Methods of calculating the delays in construction projects
Gross Method according is most preferred for many academics because it gives an
extension of time, which covers that period one event occurred caused the delay, and
the extension should run from the beginning of that event. Basically, the management
team should establish a new date for the completion of that activity.
Net Method is not considered to be fair enough according to many academics because
it gives the contractor an extension of time equal to the time required to cover the
additional work. Effectively, this means that if the contractor is six months in delay and
is delayed by one further month due to a relevant event, the completion date would be
extended from the original completion date to a month later, still leaving the contractor
with five months of culpable delay and the threat of liquidated damages.
2.5 Identification of Risk Factors Causing Cost Overruns, Time Overruns
and Quality Problems in Construction Projects
Referred to (Lock, 2013) there is a high probability that some of activities or tasks will
not be completed according to their estimated duration or budget. Always based on
35
(Lock, 2013), to enforce his idea, the construction project is exposed to risks and they
can affect the scope of the project. The nature of risks can be different from a different
source, and the variety of risks factors can be classified as accidental, unexpected or
unusual.
(Kerzner, 2009) believes that project risks are complex because of a large amount of
relationship created during the development of the project, contractual and financial
relationship, managerial, political and planning risks. But Kerzner (2009) support the
importance of an accurate scheduling and cost management, and risk management
plan based on the pre-estimation of possible risks can be extremely useful to minimize
and to manage the risks. Risk identification is a process that cannot be stopped only
in the planning process but should be done continuously and should accompany the
project during the development of all phases, for only one simple reason such as risk
presence can be in every task or activities of the project.
3. Risk Management theoretical background
3.1 Introduction
In this chapter will be given basic definitions about the risks that should be considered
in construction projects, what are the possible risks that can be involved in construction
and what might the right procedure to manage possible risks or to minimize their im-
pact, or how decision-making procedure change when taking risks in consideration.
The procedure of making the right decision through different phases of one projects it
is a stressful process, because in construction projects are involved different people
with different scope during the project, such as the client usually seems to be more
interested in time and the cost, the general contractor is more interested to maximize
the profit in a shorter time for the given price by providing the minimum level of the
quality and finally the designer (architect, engineers) are focused on the level of the
quality provided.
Taking a decision is a process that requires a large information and techniques which
should be implemented, in different scenarios that might occur during the phases of
the project. It is the duty of project management team to develop a proper risk

management plan, to be able to minimize uncertainties and undesirable surprises on
the project, to build a specific plan for a specific project because there are a certain
plans and tools in general, need to be adapted according the scope of the specific
project. It is well known that projects in the construction industry are unique because
of the location, structure of the building, people involved in etc.
3.2 Definition of risks
Many authors and researchers tried to give a unified definition of risk and most of them
agreed on that risk is the occurrence of uncertainties or unknown thinks during the
realization of the project.
According to (PMBOK, 2008) , a risk is an uncertain event or condition, the occurrence
of this event can have two possible effects negative or positive, in both cases, an iden-
tification of them should be planned.
Based on (Loosemore M, Raftery J, Reilly C and Higgon D, 2006) risk should be con-
sidered in many dimensions not only as uncertainty but the complexity of the risks
should include other dimensions such as physical, social or economic.
(Oztas A and Okmen O, 2004) describe risk as a situation for which there are existing
records and experience and based on that decision and prediction are made answering
the question for the possible probability of occurring that risk.
However, (Kartam N.A and Kartam S.A , 2001) simplify this idea, by defining risk as
the probability of occurrence of uncertainties and unplanned, or undesired events that
might change the scope of the project.
(Kerzner, 2009) support the idea that risk should be defined as the probability of oc-
currence of one event, and the main consequence if this event happens, would not
achieving the goals or lack of completeness of the project’s scope.
(Kerzner, 2009) develop also the idea of giving a mathematical function of risk, his
probability of occurring and what will be the impact if that risk occurs.
- The probability of that event to happen
- Impact in case of that event happening

37
So, risk can be mathematically modeled as a function of the probability of one event
related also with the effect or impact, consequences.
R=f (probability, impact).
By defining this function, it gives a clear a relationship that bigger the probability or
impact, increase the risk.
This type of relationship is illustrated in the Fig. 3.2 1, the higher the probability of
occurring in one event and the larger is the impact a result of these two conditions the
higher the risk will be for the realization of the project’s scope.
Figure 3.2 1 Relationship between the probability and magnitude of the impact of the risks Source Kerzner 2009
Based on the typology of consequences that might happen on the project, after risk
occurring 2 main situations can be classified:
1. In case of positive effects on the project, these consequences are categorized
as “opportunities”.
2. In case of negative effects on the projects, these are categorized as “threats” or
risks for the realization of the project. Their occurrence should be prevented,
presence should be avoided or minimized as much as possible.
3.3 Risks, Uncertainties, Opportunities
According to (Hillson, 2002) the idea of dealing and managing in the same process
threats and opportunities has derived from the idea to embrace certain positive effects
of the risks and use them in favor of scope of the project.
(Hillson, 2002) has embraced the idea of grouping the risks in two main categories
based on the expected effects on the scope of the project:
1 – opportunity is the group of those risks which is expected to have a positive
impact on the overall objective of the project
2- threat is the second group of those risks which the expected impact or influence
on the objective of the project is believed to be negative.
(PMBOK, 2008) has given an original definition for the risk, describing the risk as un-
certain event or condition and this type of the event or condition might have a positive
or negative impact or influence on the scope of the project.
On the other hand (Hillson, 2002) enforce the idea by explaining that there is no sig-
nificant and qualitative difference between opportunities and risks because of the un-
known nature and element of surprises that contain both of them, the 2 concepts are
accompanied with certain level of uncertainty and both of them have the potential to
influence and to cause changes to the scope of the project positively or negatively
3.4 Project Risk Management
According to (PMBOK, 2008) risk management is one of the main processes, that
should be performed continuously from the feasibility study of the project to the end of
the construction. The maintenance phase, part of the life cycle of the project, are ex-
cluded because the risks are determined very less.
(PMBOK, 2008) defined risk management as a process, which should be consistent
and systematic and inside this process, there are several steps or phases that should
be completed in a logical sequence such as identifying risks, analyzing the risks, and
taking preventive or corrective actions for those risks, called risk response phase.
(Kerzner, 2009) support the idea that risk management team should not be separated
from other project teams but should be involved and integrated with other teams and

39
processes such as design teams, cost and budget estimators, contractors and legal
departments and other important issues for the realization of the scope.
The main idea is that more knowledge about the project and process this team pos-
sess it will result in a better risk management plan.
(Zou P.X.W, Zhang G and Wang J, 2007) represent risk management in the construc-
tion as a systematic method to be used for the identification, analysis and proper re-
sponse plan to deal with consequences related with risk, only in that way the scope or
goals of the projects can be achieved.
According to (Smith, N. J, Merna, T, and Jobling, P, 2006), every stakeholder of the
projects should be aware of possible risks might be associated with the project, and
risk management plan should be developed and reported in strategic documents, and
what possible effects might occur to time, budget or quality of the projects.
Based on (PMBOK, 2008) risk management process can be divided into these phases:
1- Risk Identification considered as the phase where are determined what are the
possible types of risks and when they can affect the development of the project.
2- Risk Quantification considered as the phase when an estimation or evaluation
is done based on the qualitative and quantitative approach of several possible
risks.
3- Risk Response Development is the following step after an accurate analysis is
done, by determining a proper strategy on the way how to handle or deal in case
of possible occurrence of the undesired event so-called risks.
4- Risk Response Control is the final phase of risk management by establishing a
clear strategy and a protocol of responding and dealing the risks during the de-
velopment of the project.
3.5 Construction risk management
According to (Garold D, 2000) in the construction industry, generally, the risk is defined
as an unpredicted event that will influence the scope of the project, more specifically
the three main aspects of the projects such as budget, time and quality.

Based on (Haidar, 2016) the construction industry is not having a good performance
for dealing with risks and the risks management system has not been properly efficient
because many projects are not able to achieve their target such budget and time, lead-
ing to time and cost overrun. This deviation in achieving the objectives of the project
will lead to dissatisfaction of all participants involved in the project for example clients,
contractors, public authorities or the end user.
Referring to (Smith, N. J, Merna, T, and Jobling, P, 2006) all participants involved in
the project should have an overall risk management plan and a policy should be in-
cluded in the strategic documents and illustrated also to the quality management sys-
tem. According to (Smith, N. J, Merna, T, and Jobling, P, 2006) for the owners of the
project risks are related to ownership and risk financing, client and contractor risks are
associated more with the development of the project and the types of risks that can
affect this process.
It is the nature and the complexity of construction project that define the importance of
RM strategy, more types of possible risks or uncertainties are involved during the pro-
cess of creating RM more protected will be the development of the project.
(Lester, 2014) report that the process of identifying and analyzing it becomes easier
and more accurate if the experience, portfolio risk associated with all participants, a
critical thinking on the objectives of the project are taken in consideration. Based on
(Lester, 2014) many risks can be identified in construction projects independently the
size and scope of the projects.
According to (Zou P.X.W, Zhang G and Wang J, 2007), to create a proper RM plan is
needed to create and to keep a balance of time, cost quality, and based on that to
determine which are the risks that can affect that balance, only in that way the RM can
be efficient.
3.5.1 Risk probability in construction projects
Dealing with the risks is an important process that cannot be understood or completed
if the mathematical concepts of probability are not involved. (Smith, N. J, Merna, T,
and Jobling, P, 2006) believe that implementations of probability concepts are a ne-
cessity during the development of risk assessment of risks in construction projects.

41
According to (Nicholas J.M and Steyn H, 2008) estimating the probability of risks and
their effects specifically those related to costs and time are subject of more complex
process, because an estimation of the consequences is needed in case of occurrence
of the risks. (Kerzner, 2009) report that many times estimation of those consequences
is not subject of only mathematical and statistical calculation but is more of a logic
consequences analysis such as “if this happens, then…”.
According to (Kerzner, 2009) for defining the probability of potential risks in construc-
tion projects is needed accurate combination between objective and subjective judge-
ment and intuitive estimation with numerical and mathematical estimations, only in this
way the output will be realistic and profitable for improving the process and helpful on
achieving the objectives and scope of the project.
3.6 Benefits of construction risk management
According to (Smith, N. J, Merna, T, and Jobling, P, 2006), RMP should not be rigid
but should have the ability to be modified, adapted and developed during entire the
project, in that way the identification and response for the risks will be efficient in max-
imum. Benefits from RM are not only to protect the scope of the project from the pos-
sible deviation but also to protect all participants such as owner, client, contractor etc.
(Turner, 2014) believes risk management give a large effort of understanding the pos-
sible consequences and creating a plan how to eliminate or avoid them, or creating a
consequence logic “if this happens, then this should be done”
RM is another useful tool which can help to increase the level of control over the pro-
ject, should be a problem solver for many processes during the development of the
project, (Garold D, 2000)
According to (Garold D, 2000) and (Kerzner, 2009), the main benefits of RM are;
Maximize the efficiency: participants and project management team can easily iden-
tify the risks and manage them, to avoid their influence during the development of the
project.
Risk analysis applied during tendering and warding phase can lead to a realistic
price for both parts such as the client and the general contractor.

Application of RM plan or strategies increase the probabilities of listing the project to
a successful one.
Application of RM improves the decision-making process leading to an optimal de-
cision that can support the scope of the project.
Recognizing the possible risks or problems is the first step of resolving those, so RM
is useful in creating a proactive management, avoiding reactive decisions or actions.
A good RM and keeping records will be useful creating a sufficient experience for
future projects for the organization
RM can be a good tool to improve communication and coordination between different
teams and actors on the project, many times it helps to create a proper equilibrium
between requirements and demands.
3.6 Risk Identification
(Loosemore M, Raftery J, Reilly C and Higgon D, 2006) believes that the initial action
that is taken during risk management goes through informality which can be performed
in many ways, which mostly depend on the type of organization and the project man-
agement team. Initially, there is no need to determine a strict method for determining
to pursue risk identification, it is the phase of gathering information as much as possi-
ble.
According to (PMBOK, 2008) risk management can be more effective if there is a de-
tailed information about the causes of the risks, and an allocation before facing the
problems will result in a more efficient way of dealing those risks. Based on (PMBOK,
2008) an RM plan should not be considered only as a problem solver in advance but
should contain information on how to deal with unexpected problems or threats during
the development of the project.
Based on (Kerzner, 2009) risk identification should contain elements such as the
source of the risk, hazard and peril probability also the exposure to the risk and for any
of those concern should compile a plan how to avoid them.
(Haidar, 2016) support the idea that an accurate RM strategy can lead not only to avoid
or eliminate the possible risks, by protecting the scope of the project, can lead also to

43
a possible profitability by transferring the risk in opportunities such as economic or
environmental.
According to (PMBOK, 2008) main goal of identifying the risks is to create a ranking
list with possible risk and ranking them based on the level of the influence or impact
on the scope of the project. (PMBOK, 2008) gives the recommendation that the suita-
ble method for risk identification should be based on the knowledge and experience of
project management team for that specific method also should be a benefit for improv-
ing the processes of the project. The risk identification should end with a list that
contains information with potential problems also all the project management team
should be conscious of possible problems.
Most common and efficient techniques of risk identifications are:
1- Brainstorming: According to APM (2004), this is a most commonly used
method for risk identification. The practicality of this technique consists in gath-
ering together all participants of the project, to identify and to analyze the pos-
sible risk on the project.
2- The Delphi Technique: This technique consists in doing several question-
naires, the target is qualified and experienced individuals on risk management.
Through this questionnaire, these individuals are asked to list and identify po-
tential risks also to calculate the possible effect on the project. The answer will
be examined and through them, a list of possible risks should be created.
According to (Haidar, 2016), this procedure should be consistent until the risk
management team reach a final opinion and strategy. (Chapman, 1997) does
not consider this technique efficient because of the time needed to develop the
questionnaire also it results to be more expensive than the Brainstorming.
3- Interviews: According to this technique interviews are needed to be completed,
the target to interview will be individuals within a considerable experience on
dealing risks, how to list the potential risks for a specific project and what type
of strategy should be appropriate to be implemented. Many academics find this
technique as time-consuming, the questions should be structured to have a pro-
fessional output. According to (Chapman, 1997) confusion on the questions
should be avoided otherwise it will lead on wrong directions, and for
consequence, the list of potential risks will not be appropriate.
4- Outputs from Risk-oriented Analysis: For this techniques fault tree analysis
and event tree analysis can be used, starting from top to down to identify and
determine the possible threats, risks, an event that can have an impact during
the development of the project.
5- Risk Register: It consists in creating a document where to record all the needed information gathered with one of the above techniques.
According to (Smith, N. J, Merna, T, and Jobling, P, 2006), the document contains information for each possible risk, potential causes and their impacts on the scope of the project.
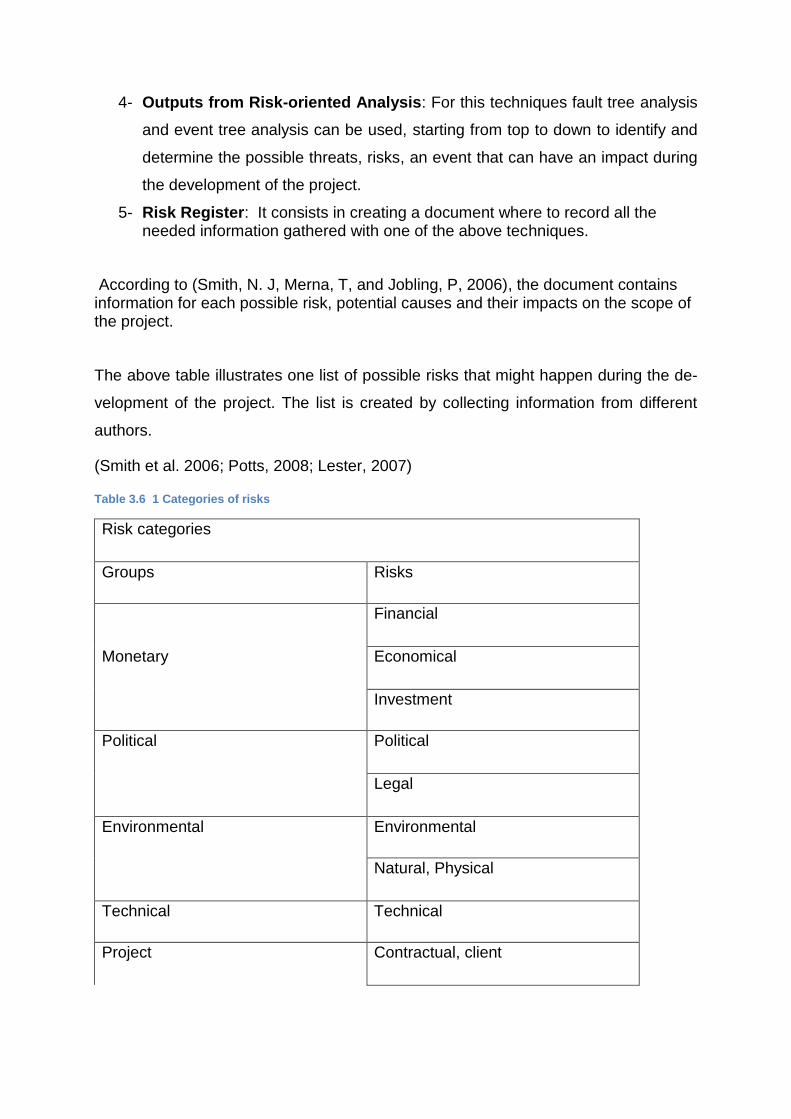
The above table illustrates one list of possible risks that might happen during the de-
velopment of the project. The list is created by collecting information from different
authors.
(Smith et al. 2006; Potts, 2008; Lester, 2007)
Table 3.6 1 Categories of risks
Risk categories
Groups Risks
Financial
Monetary Economical
Investment
Political Political
Legal
Environmental Environmental
Natural, Physical
Technical Technical
Project Contractual, client

45
Project Objectives
Planning, Scheduling
Construction
Design
Quality
Project Operational
Organizational
Human Labor, Stakeholder
Human factors
Cultural
Market Market
Safety Safety
Security, crime
Materials Resources
Logistics
3.7 Risk Assessment and analysis
Risk identification is followed by the Risk Analysis, this is the phase where the collected
information should be examined and will be the subject of a critical analysis.
(Kerzner, 2009) describes risk analysis as a selection process of risks that are sup-
posed to have the highest level of influence or impact on all the risks listed in the
identification phase.
According to (Loosemore M, Raftery J, Reilly C and Higgon D, 2006), there is no need
to distinguish or to separate risk assessment and risk analysis, but to have an accurate

result and flow process those should be done on the same time by considering as a
unique process.
Risk analysis can be developed based on two methods:
1- Qualitative approach
2- Quantitative approach
Based on (Wysocki, 2009) the qualitative method is a descriptive way to list the poten-
tial risks and the ranking start from the highest level of impact to the scope of the project
to the lowest level of impact. Regarding the quantitative method is based on empirical
data, numerical estimations to determine the identified risks that can have the highest
influence on the objectives of the project.
Referring to (Turner, 1992) the organizations use more the qualitative approach be-
cause if it is quite easier, also contain descriptive information that is supposed to be
more flexible versus the complexity of the quantitative approach.
According to (Zou P.X.W, Zhang G and Wang J, 2007) there are experiences where
semi-quantitative analysis is applied, this method consists of mixing the numerical es-
timation with descriptive information of identified risks.
(Kerzner, 2009) believes that selecting the appropriate method, should not be prob-
lematic, the organizations should select that method in which the project management
team has gained some experience and the output should be reliable no matter of the
scope of the project or type of the risks. The selection of the right technique should be
based on experience, expertise and the availability of proper computer software to
have reliable process and outputs (Kerzner, 2009)
Based on a survey conducted by (Lock, 2013)there are many reasons that should be
taken into consideration before deciding on the appropriate method to implement for
risk assessment. (Lock, 2013) concluded his idea within a list of potential reasons to
be considered before selecting the method, some of them are:
the level of the cost required to implement the method.
the number of resources and time required to apply a specific method
the level of adaption that method can offer regarding the needs of the organization
level of simplicity or complexity of the method

47
level of experience or expertise of the staff with that specific method
Reliability and credibility
3.7.1 Qualitative methods
This method is the most common and useful method for risk analysis of the identified
risks. According to Smith (1999), this method contains important information such as
the probability of the occurrence, causes of the risk, risk ownership.
1. Probability-Impact (P-I) Grids - is a technique used to conduct a qualitative
approach of the risk assessment, the technique takes in consideration two
main aspects on the risk assessment process such as the probability of oc-
currence and the level of risk impact on the project
Very High
High
Medium
Low
Very Low
Imp
act
Very Low Low Medium High V High
Probability
Figure 3.7.1 1 Probability Impact Matrix
3.7.2 Quantitative methods
The quantitative method requires more complex data and experience to be performed,
and a balance between the effort required and benefits should be conducted before
selecting the right method.
According to (PMBOK, 2008), the quantitative method is usually needed for the
medium and large-scale project because of a large number of numerical estimations
needed to have a reliable output, and the main goal of this method is to estimate the
impact of risks related to the scope of the project. Based on (Kerzner, 2009) to conduct
a quantitative analysis the most suitable techniques are:
1. Scenario technique - Monte Carlo simulation

Monte Carlo is a statistical method based on simulation to estimate the risks and their
impacts. Based on (Kerzner, 2009) this method is useful because of the ability to gen-
erate different scenarios based on different estimations of risks. (Kerzner, 2009) ex-
plains that main goal of the Monte Carlo simulation is to create different scenarios of
probability distributions for potential risks, transforming this series of probabilities in
realistic and information in a final numerical result that represents the impacts of risks
related to time, cost and performance of the project. Based on (Kerzner, 2009) the
Monte Carlo can be more efficient if it is performed through a software such as Risk
Simulator software, also by Microsoft Excel but the reliability of the output will be lim-
ited.
2. Modeling technique - Sensitivity analysis
Sensitivity analysis consists in establishing a detailed list of risk events which are sup-
posed to have the highest level of impact. Based on (Kerzner, 2009) the listed events
and their impact should be measured according to their impact on the objectives of the
project. This technique requires to create a relationship based on the level of uncer-
tainty of a specific risk the higher is the level of sensitivity regarding the scope and
objectives of the project.
According to (Smith, N. J, Merna, T, and Jobling, P, 2006), this technique requires
repetitive calculation of the possible effect on the scope of the project, the outcome
should be examined several times until the result is realistic and it fit the objectives of
the project. (Smith, N. J, Merna, T, and Jobling, P, 2006) enforce his idea that the
results will be more accurate in case that this technique is carried out from the initial
phases so critical issues can be solved during the development of the project.
3. Diagramming technique/Decision tree
According to Heldman (2005), this technique is recommended to be used when some
among the identified risks have extremely impacts on two main aspects of the scope
of a project such as time and cost. Based on the nature of decisions the decisions trees
can be divided into two types: 1. Fault Tree Analysis 2. Event Tree Analysis
According to (Kerzner, 2009), the difference between them is that the first one deals
with the probability of potential risks and their impact based on numerical estimation,
the second deals more with uncertainties or undesired events and their impacts on the
objectives of the projects, on descriptive ways.

49
3.8 Risk response and monitoring
3.8.1 Risk response
According to (PMBOK, 2008), risk response plan is a crucial phase on RMP, and the
bases of risk response consist in defining corrective actions how to manage or deal
the identified and assessed potential risks, by acting according to a strict protocol.
(PMBOK, 2008) defines three main components of risk response: avoidance, mitiga-
tion, acceptance. (Kerzner, 2009) reports that risk response is described in a better
and efficient way when it is composed by 4 elements:
1- Avoidance is the process of eliminating the risks or mainly to eliminate the
causes or to avoid the causes of that specific risk. Once the cause is avoided
the probability of that threat to be present during the development of the project
is on the lowest level. In this approach, according to (Kerzner, 2009), different
types of alternatives or scenarios should be taken into consideration after avoid-
ing one specific risk. (Kerzner, 2009) reports that this approach may require
changing in planning or design concepts, or changes related to the require-
ments or demands, or practicalities that may reduce or avoid the impact of that
specific risk.
2- Mitigation/Control is the process of reducing the monetary value of a risk by
eliminating the occurrence of the event that can cause problems. Based on
(Kerzner, 2009) in this approach transferring the risk ownership is a known pro-
cess, to reduce the probability or impact of that specific risk.
3- Acceptance is the process of accepting the consequences of the occurrence of
the risks, the project management team after a critical analysis of risks define
that the occurrence of such risks does not have a huge impact on the objectives
of the project. According to (Kerzner, 2009) on the acceptance approach should
embrace a situation of adaption and wait to see the result. In this approach re-
serves on a budget, time and other resources should be available.
4- The transfer is the process of transferring the risk ownership to the third parties
by reducing the probability or impact of the project scope. Based on (Lock, 2013)
the risk should be transferred to other parties that are able or have some expe-
rience in dealing with or managing those types of risks.

3.8.2 Monitoring
According to (Chapman, 1997), monitoring is the final phase of RMP, in this phase all
information about identified risk is collected and monitored. Based on (PMBOK, 2008)
a critical thinking and professional behavior during this phase helps in finding new pos-
sible risks, keeping records and creating an experience for the organization in dealing
and managing risks.
Referring to (PMBOK, 2008) that the main goal of monitoring and controlling phase to
monitor the status of the risks and corrective actions are to be taken, in case of occur-
rence the events, according to the predetermined protocol on risk response plan.
Based on (PMBOK, 2008) to process an accurate monitoring phase the proper tools
or techniques to be taken into consideration for usage are:
Risk reassessment – this is the process of reidentification of new possible risks.
Monitoring the status of the risks and their effect on achieving the objectives of the
project
Updating continuously the register of risks
3.9 Developing a Risk Breakdown Structure
According to (Haidar, 2016), Risk Breakdown structure is a useful technique for the
project management team to manage and to control the status of the risks and the
status of the objectives of the project. The main goal of Risk Breakdown Structure is
creating a list with potential risk sources, and this list is ranked from a higher level of
potential to the lowest, to create an accurate structure and guideline of risk manage-
ment process.
Based on (Garold D, 2000) WBS van be very useful during the planning and estimation
of activities for the project management team, also he defines RBS as a technique of
listing the potential risks based on their source, by understanding the source of the
risks the probability of solving or avoiding the impact of the risk.
(Kerzner, 2009), to enforce the need for developing a Risk Breakdown structure, gives
a list of many reasons for the benefits of developing RBS. These reasons are listed
below:

51
RBS improve the controlling process
It gives coherence and consistency to the risk management process, by structuring
the process and giving specific information for specific activities by assigning also the
responsibility of each participant.
Improve the process of estimation and control for each risk
4 Research Methodology
In this chapter will be a description of data collection and research methodology expla-
nation about the process of conducting this study.
Being able to define the objective of the study, setting the initial goal, is the first phase
of this process, in the second phases there is a need to explain the methodology
adopted to have some important findings and to fit according to the scope or objectives
of this study.
According to Oxford Dictionary research is defined as a systematic investigation to
reach new facts and new conclusions for a specific topic.
Based on (Bryman, 1989) research is a systematic process of investigation to improve
and fill the old knowledge also to generate new facts and conclusions.
(Naoum, 1998) defines two types of strategy for developing a research, these two types
are qualitative and quantitative methods. Quantitative methods consist in gathering
facts and collecting data and trying to create a relationship how these facts are repre-
sented in the theoretical background or previously executed.
Regarding the Qualitative method (Naoum, 1998) explain that this method is more
subjective because it depends on gathering facts based on the previous and practical
experience of the people, developed through questionnaire and the answers provided
are based on personal feelings or experience.
This research will embrace the quantitative method to define which are more potential
risks that affect the scope of the construction project, through the real case in Albania.
After gathering all available facts and relevant information related to the risk manage-
ment approach, a discussion of the consequences of this approach will be developed
to understand the impact of those risks into triple constraints of the project.

4.1 Research Strategy and Design
(Robson, 2002) explain that research design is the process of transforming the hy-
pothesis and the research questions into a research process or projects.
(Robson, 2002) enforce this idea that to be able to answer the research questions
should be developed a clear strategy or process of adapting and organizing the facts,
developing a critical analysis to achieve realistic and significant findings.
As already mentioned this research will adopt a quantitative method, the research will
be conducted according to the following phases:
1- A critical review of the theoretical part to determine the possible gaps between
theoretical knowledge and practice.
2- The next phase will consist of gathering information and facts related to specific
real case studies and potential issues and the current situation in a construction
project in Albania and especially for the risk management process.
3- The validation of a real case study in Albania, gathering facts and important
data related to the specific project by conducting interviews with project manag-
ers and consultants.
Development of the case studies will be based on understanding the practice and
experience of risk management, defining the main goal of the stakeholders from
the risk analysis.
This research will be based on defining the difference, attitude, and experience of the
expectation and the interests of the client, contractors and project managers from risk
analysis and how the chosen technique affects the triple constraints of the project.
(Naoum, 1998)) explain that the research design should be structured in that way to
be helpful to the main goal, to be able to answer the research questions. Naomi (1998)
report that conducting the research through individual interviews have these ad-
vantages:
a- The answer can be more structured and appropriate related to the research
b- The response rate is expected to be relatively high
c- The content of the answer can be more realistic and helpful

53
4.2 Research Process
The initial phase of this process is composed by an observation, with some data to
understand different causes or sources that have a huge impact on the objectives of
the project, for example, delays, causes and reasons of cost overrun etc.
Gathering those data from the observation will allow generating the hypothesis to direct
the research and to develop a structured process of defining possible reasons that
cause this phenomenon.
Generating hypothesis will be followed by the process of collecting relevant data, to be
able to support the phenomenon with concrete facts, to emphasize the critical situation
and the important need that this phenomenon must be studied and developed.
The consecutive phase will consist in analyzing the gathered data in more details, to
identify potential causes or sources that have an impact on developing the phenome-
non and eliminating the irrelevant data, which do not have a real impact.
In this research practice will be linked with the theoretical part, to understand the dif-
ference or gaps between theoretical recommendations and real practices.
4.3 Literature Review
The first phase of the research will be composed of a critical literature review to under-
stand the differences and gaps between existing knowledge and practices, this phase
will help also to create a comparison between the theoretical part and how realistic and
reasonable the proposed research can be, to control the viability (thus avoiding repe-
tition). According to (Naoum, 1998), this critical review helps to develop a structured
process and an appropriate research methodology that can be helpful to answer or to
have some important findings at the end of the research.
First part of Literature review is helpful to understand the project management theory,
by understanding the main objectives of the construction project, main three aspects
that compose the scope of the project and the second part is related to risk manage-
ment methods and techniques, to understand how this aspect is correlated and linked
together during the development of project management strategy.
A literature review is developed after a careful review of textbooks, guidelines, re-
search articles, previous research on this subject, journals, or electronically and these

theoretical data gives the opportunity to a create a comparison process between the-
oretical knowledge and the data gathered from the implementation of real cases.
4.4 Design and Administration of the Case Studies
Based on (Mark Saunders, 2009) case study technique can be very helpful and lead
the research on that direction to have realistic findings and in many cases require a
combination of different data such as interviews and documentary reviews. Case study
technique allows the combination of many data and to compare such data with the
theoretical background.
(Mark Saunders, 2009) explain that a case study is a valid form of research and the
intention of the case study it is not to explore and to study the entire organization but
the focus of should be on a specific topic or a specific problem to be discussed and
analyzed.
The decision of conducting the research through case study technique requires a spe-
cific consideration and validation of these elements:
1- Available time to conduct the investigation
2- The reliability and accessibility of documentation and information
3- Possibility to conduct interviews and gathering feedback from the participants
4- The number of cases taken into consideration
To conduct a research with case study there is a need for an explanation for the se-
lection of the case studies and arguments to support the choices and how they will
help to develop the research.
Related to the statement above mentioned, it was selected two cases study, two large-
scale projects from two organization that are considered relatively large in size in Al-
bania. A comparison of two cases will be developed, to understand the benefits and
weak points of each method or approach applied from this organizations.
To support the data collection and to increase the reliability of the research interviews
with project managers of the organizations are developed. The project's managers are
directly involved in the projects taken as case studies, so based on their experience
and strategy and the information provided will be structured the process of analyzing
the data. The interviews are very important because they give an essential feedback

55
related to the approach or behavior of project managers related to risk management
also this approach help to achieve the scope of the project.
Interviews were structured on that way to emphasize which are most present risks
during the development of the project, and what is their effect on construction project
related time, costs and quality. During the interviews the project managers explained
the method of dealing or managing with different risks, controlling and monitoring tech-
nique applied to minimize the effects and decision-making process of the owner based
on different situations and how this process affects the entire development of the pro-
ject.
The interviews were helpful to understand the approach of client and owners related
to the scope of the project by defining the main goals desired to be achieved and is
this reflected on the risk management strategy or not.
The selection of the projects and companies was made based on the accessibility and
availability of the information and documentation, the reputation of the companies in
the market, turnover, management team and mainly operation to this organizations is
in the national market also another important reason was the willingness to provide all
the information and support needed to conduct this part of the research.
4.6 Data Collection
Referring to (Naoum, 1998) a researcher should be able to use and to understand
accurate data and to measure the liability of those data in that way the findings and
conclusion can be realistic.
As already mentioned above, the data used for conducting this research was collected
from textbooks, journals, publications and via the internet and those theoretical data
were compared and analyzed with the factual data provided from the project managers
of the two case studies.
Even the amounts of theoretical potential risks or uncertainties related to cost and time
overrun during the development of the project, the interviewers were invited to answer
specifically based on their experience and to mention and list only the potential risks
or issue really faced during the development of the project, or problems that might have
been faced during the development and implementation of risks management strategy.

After the interviews, with a list of potential risks, list of objectives asked to achieve for
the project and list of real problems that might have been present during the develop-
ment of the project was given to the project managers.
4.7 Data Analysis
This phase of study consists of the ability of the researcher to organize the data, to
create a professional and critical analysis to explain and to achieve important findings.
The organization of analyzing should be clear, easy to understand and giving a conse-
quent approach to the readers relating to the research. During the development of the
data analysis should be avoided the presentation with many empirical data without a
strong and clear linkage or relationship, the amount of data should support the idea of
a relationship and not vice versa. Based on (Mark Saunders, 2009) there is a need to
create a process of reevaluation of the results so during the analysis should be the
conduct of a review of results to understand and to define the optimal result.
The basis of the data analysis in this research consists in ranking the severity of causes
and risks that cause changes to the scope of the project of two cases, ranking several
fact and reasons that led the extension to the schedule or delays, and through this
ranking to create a relationship between causes and consequences.
4.8 Validation and Reliability
According to (Naoum, 1998) demonstration of the validity of the research and outcome,
it is a crucial process during the development of the research and the readers should
have a clear impact that approach and the method used is appropriate to achieve re-
alistic conclusions and findings.
In case that is guaranteed and proved a certain level of validity of the research method
than the findings and conclusion can describe the current situation or the reality in a
better way, and the findings will have a higher impact in improving the knowledge.
For that reason, to secure the validity the interviews were conducted through meetings
face to face with two project managers of the organizations to receive a realistic feed-
back and that it is suitable to the goal of the research.

57
(Bryman, 1989)report that reliability is another important aspect of the research and
this is accomplished when the research is repeated many times in the same conditions
the results would be the same. In this research, reliability is accomplished because the
people involved in the interviews were involved in the development of projects, which
were taken in consideration as case studies, specifically in the role of project manager
within the responsibility to develop the risk management strategy.
5 Case study
Presentation of these two case studies will be helpful to develop a deep knowledge
related to the practice with dealing and managing the risks in real construction projects
in Albania, to list the major risks that affect the performance of the project and what
are the strategies that project managers apply before and during the construction
phase to reduce the impact of risks, and how efficient results these strategies on pre-
venting time and cost overrun or low level of provided quality.
5.1 Case Study A
5.1.1 Company profile and project details
This case study is related with the construction of a multi-story residential building by
Mane TCI, a leading company in the construction market in Albania.
Table 5.1 1 Company profile Case study A
Name of the Company Mane TCI
Founded 2002, Part of Balfin Group
Core business Construction& Real Estate Development
Nr of employee
Administration& Technical Department
121
Commercial Buildings projects TEG (shopping mall), QTU (Shopping
mall)
Residential Buildings projects Rolling Hills Luxury Residences, Ambas-
sador 1, Ambassador 2, Ambassador 3

Affiliation Street “Dervish Hima” Floor 8, Ap.61, Ti-
rana,
Albania
Ambassador 3 is the project that is taken as a case study for this thesis, this project
includes the development of residential buildings located in the center of the capital
city, Tirana, Albania. The project consists in the construction of 20 floors for residential
purpose, 1 floor for commercial activities and 4 underground floors for parking purpose.
The estimated time of construction was 30 months but, it took 36 months to be con-
structed, so overall this project faced a delay of 6 months, below table, contain some
descriptive data of the projects.
Ambassador 3 is a reinforced concrete structure and structural and seismic analysis
are made according to the National Building Code and Eurocode, EC-2
Table 5.1 2 Ambassodor 3 Project description
Project Ambassador 3
Typology Residential
Investment cost 17,390,832 Euro
Gross Construction Area 32,300 m2
Residential 20 floors
Commercial 1 floor
Parking 4 underground floors
Construction Time 2006-2009
Project management team involved in this project was compound by 6 people, sharing
the responsibilities in different levels such as strategic, technical and periodic inspec-
tions and progress reports assessments, to achieve technical and financial objectives
of the project.
According to the information provided from the interviewer, the electrical engineer and
site manager were not involved for this project during the feasibility study and design
process because they were integrated into another project of the company, their in-
volvement for this specific project start with the beginning of the construction phase.

59
Table 5.1 3 Information of Project management team involved on Project
5.1.2 Risk Management Process
For this research is taken into consideration only the risks developed, created or man-
aged during three phases of the project such as 1. Design phase 2. Tendering and
awarding phase 3.
Figure 5.1.2 1 Risk management process in case study A
Source, Author’s work
The design phase was developed in-house, construction phase was outsourced to a
general contractor that according to the Project Manager, the general contractor was
No Position Responsibility Work
experi-
ence
Education Background
1 Project Manager Running the project 7 years MSc. Civil Engineering
2 Quantity surveyor Cost and quantity 4 years MSc. Civil Engineering
3 Site manager Daily work on site 8 years BSc. Civil Engineering
4 Structural Engineer Update possible
structural changes
2 years MSc. Structural Engineer-
ing
5 Architect Update possible ar-
chitectural changes
3 years MSc. Architecture
6 Electric Engineer Electric system 4 years MSc. Electrical Engineer-
ing

chosen based on the experience because of proven and gained trust on previous pro-
jects or contractual relationships.
Based on the feedback from the Project Manager, for important projects that total
amount of investment is relatively high the contractors and suppliers appointed should
have experienced with the company at least one contractual relationship in previous
projects and have a good evaluation record on the database of the company.
Project manager explains that the reason behind this choice is to avoid as much as
possible uncertainties and negative surprises during the construction phase, also to
avoid having contractual relationships with not known companies that do not have a
stable liquidity during the run of the project. It is important to mention also that this rule
also improve the tendering and awarding process because both parties already have
knowledge and experience in what might be the general requirements and duties.
The negative impact of this rule is that the price to be expected is more expensive than
open tendering and awarding process where unknown companies might offer a lower
tendering price, but the risks and uncertainties can be in a higher level
5.1.3 Risk Identification, Checklist technique
According to the feedback received during the interview, the techniques used for risk
identification in this project was Checklist technique is used as a technique for risk
identification and assessment.
This procedure consists in creating a list with potential risks that might have a signifi-
cant impact during the development of the project. Initially, this Checklist is created by
the Project Manager based on his experience, an examination and discussion related
to this Checklist was conducted by the Project Management team, to eliminate the
risks considered with the lowest impact.
Final Checklist is developed and containing a response plan during the implementation
of the project, this Checklist should be approved before starting the implementation by
CEO of the company. Draft risk management strategy is supposed to have an attach-
ment also with risk analysis and steps to be followed in the case of occurrence of one
specific risk and the impact expected to have on the total budget of the project.
According to this procedure mainly is given focus to the impact related to the budget
that those risks might have, and there is no a detailed procedure of risks analysis but
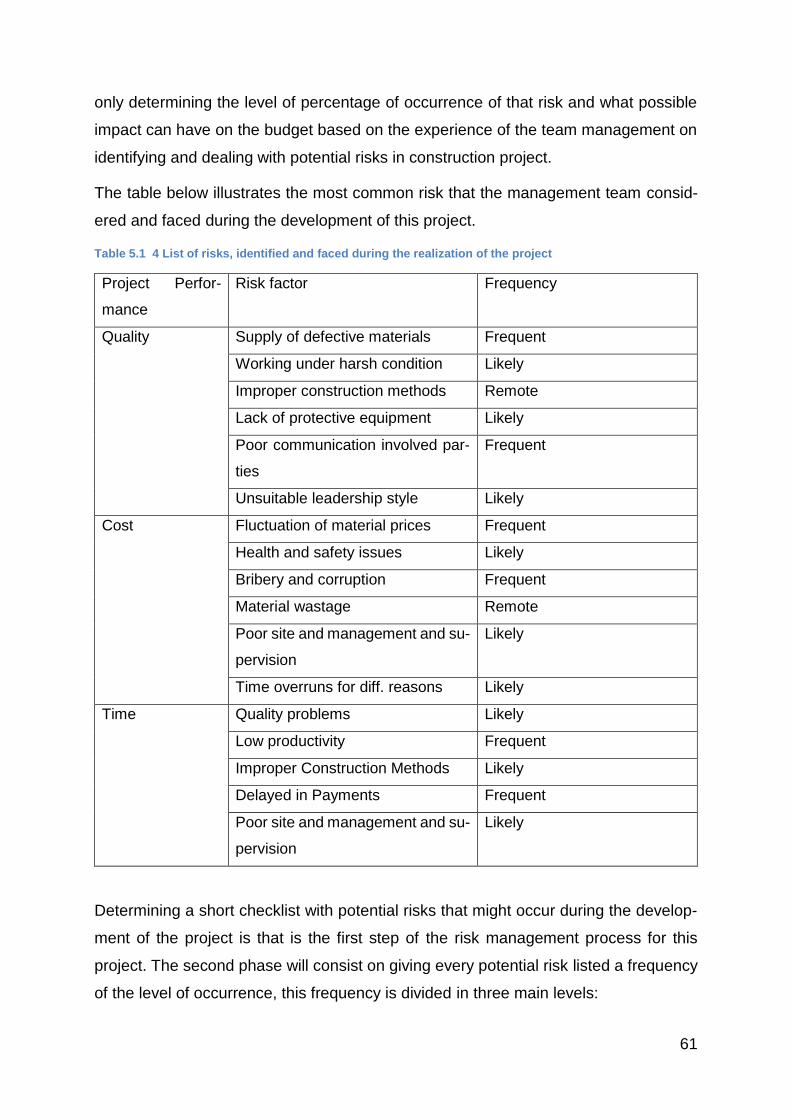
61
only determining the level of percentage of occurrence of that risk and what possible
impact can have on the budget based on the experience of the team management on
identifying and dealing with potential risks in construction project.
The table below illustrates the most common risk that the management team consid-
ered and faced during the development of this project.
Table 5.1 4 List of risks, identified and faced during the realization of the project
Project Perfor-
mance
Risk factor Frequency
Quality Supply of defective materials Frequent
Working under harsh condition Likely
Improper construction methods Remote
Lack of protective equipment Likely
Poor communication involved par-
ties
Frequent
Unsuitable leadership style Likely
Cost Fluctuation of material prices Frequent
Health and safety issues Likely
Bribery and corruption Frequent
Material wastage Remote
Poor site and management and su-
pervision
Likely
Time overruns for diff. reasons Likely
Time Quality problems Likely
Low productivity Frequent
Improper Construction Methods Likely
Delayed in Payments Frequent
Poor site and management and su-
pervision
Likely
Determining a short checklist with potential risks that might occur during the develop-
ment of the project is that is the first step of the risk management process for this
project. The second phase will consist on giving every potential risk listed a frequency
of the level of occurrence, this frequency is divided in three main levels:

a- Frequent-meaning that there is a high probability of occurrence of the risk. If the
risk is recorded to be present on the recorded similar projects within the value
of 51-100% than that specific risk is appointed as Frequent risk.
b- Likely, meaning that there is a medium probability of occurrence of the risk. If
the risk is recorded to be present on the recorded similar projects within the
value of 21-50% than that specific risk is appointed as Likely risk
c- Remote, meaning that there is a small probability of occurrence of the risk. If
the risk is recorded to be present on the recorded similar projects within the
value of 0-20% than that specific risk is appointed as Remote risk.
5.1.4 Risk Analysis, Impact assessment technique
Appointing the frequency of each potential risk is the first phase of risk management
process, the Project Manager explain that this shorten list also will face some more
detailed analysis by trying to give a weight of their impact related to time, cost, quality
and overall scope of the project.
Reason of conducting this analysis is to divide the risk based on their possible potential
on affecting the objectives of the project, also this analysis improves of estimation cost
process specifically improving the calculation of added budget needed to deal and to
manage those risks.
This analysis also improves the level of knowledges and responsibility of each parties
involved on the development of the project, by sharing the information and giving spe-
cific focus to high potential risks.
Impact assessment technique consist in grouping every potential risk listed on the
above shorten Checklist, and each risk will face an analysis based on the impact that
might have on the scope, cost, time.
The impact of each risk is categorized in three levels:
a- High, are appointed those risks which are considered that might have a high
impact on the objective of the project, this strong influence of this risk might
change the scope, cost, time or quality of the project. In case that risk also is
associated with a frequency level, Frequent, this is the most undesired scenario
that the project Management team try to avoid or to minimize because the
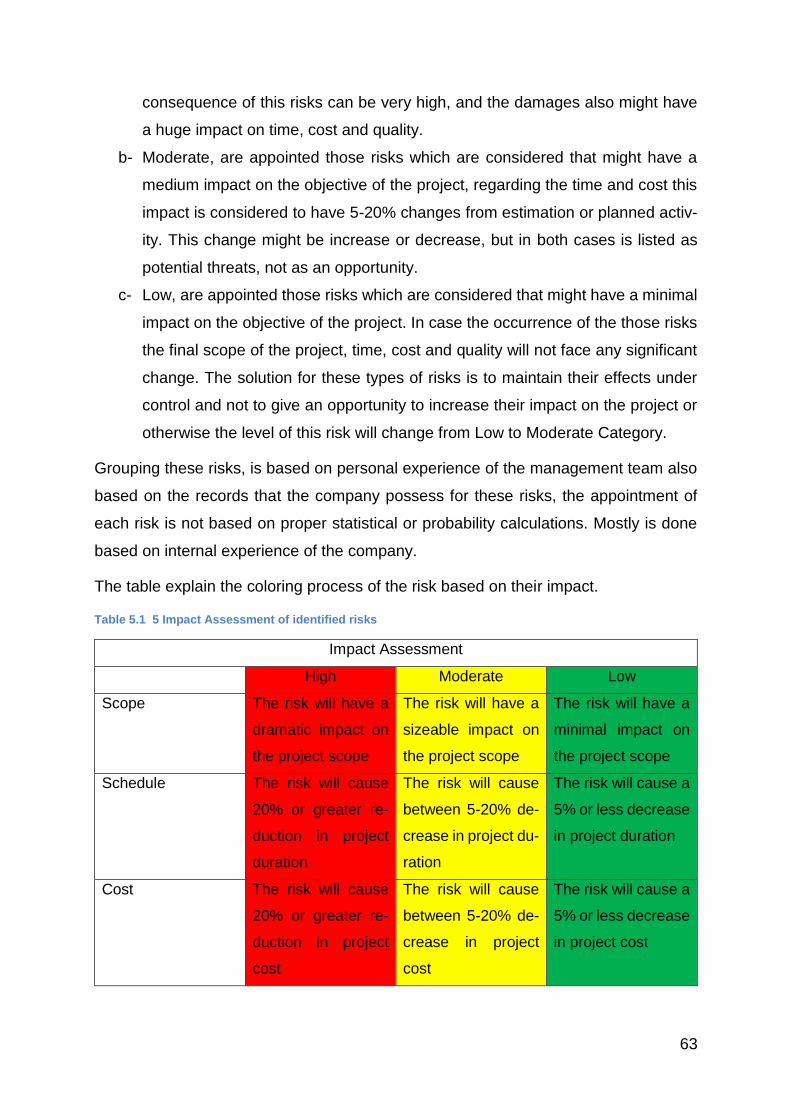
63
consequence of this risks can be very high, and the damages also might have
a huge impact on time, cost and quality.
b- Moderate, are appointed those risks which are considered that might have a
medium impact on the objective of the project, regarding the time and cost this
impact is considered to have 5-20% changes from estimation or planned activ-
ity. This change might be increase or decrease, but in both cases is listed as
potential threats, not as an opportunity.
c- Low, are appointed those risks which are considered that might have a minimal
impact on the objective of the project. In case the occurrence of the those risks
the final scope of the project, time, cost and quality will not face any significant
change. The solution for these types of risks is to maintain their effects under
control and not to give an opportunity to increase their impact on the project or
otherwise the level of this risk will change from Low to Moderate Category.
Grouping these risks, is based on personal experience of the management team also
based on the records that the company possess for these risks, the appointment of
each risk is not based on proper statistical or probability calculations. Mostly is done
based on internal experience of the company.
The table explain the coloring process of the risk based on their impact.
Table 5.1 5 Impact Assessment of identified risks
Impact Assessment
High Moderate Low
Scope The risk will have a
dramatic impact on
the project scope
The risk will have a
sizeable impact on
the project scope
The risk will have a
minimal impact on
the project scope
Schedule The risk will cause
20% or greater re-
duction in project
duration
The risk will cause
between 5-20% de-
crease in project du-
ration
The risk will cause a
5% or less decrease
in project duration
Cost The risk will cause
20% or greater re-
duction in project
cost
The risk will cause
between 5-20% de-
crease in project
cost
The risk will cause a
5% or less decrease
in project cost

Quality The risk will have a
dramatic impact on
the quality of prod-
uct delivered
The risk will have a
slight impact on the
quality of the prod-
uct delivered
The risk will have a
minimal impact on
the quality of the
project
5.1.5 Risk Response strategy
Risk analysis and categorizing the risks based on their frequency and the possible
impact that is believed to have on the objective of the project, the final step in risk
management analysis will consist in creating on Risk response strategy.
Risk response strategy will consist on creating a guideline for actions required to be
taken before and during the occurrence of the risks, this guideline is accompanied with
an attachment that have detailed recommendations for each member of the manage-
ment team how to deal or who to delegate the responsibilities in case of not having
enough confidence for actions or measures needed to be taken.
Table 5.1 6 Risk management strategy to mitigate the influence of the risks
Pro-ject Per-for-mance
Risk fac-tor F
req
uen
cy
Imp
ac
t
Acti
on
Description
Qu
alit
y
Supply of defective materials F
req
uen
t
Hig
h
Avo
id Ensure trusted are engaged in the supply of
the materials. Periodic review of suppliers to enable the company, select good suppliers
Qu
alit
y
Working under harsh con-dition
Lik
ely
Mo
de
rate
Mitig
ate
Proper planning taken in consideration weather conditions to ensure the most ap-propriate conditions are provided for the work. This requires regular assessment of the conditions under which site teams work to ensure maximum performance is achieved always.

65
Qu
alit
y
Improper construc-tion meth-ods
Rem
ote
Lo
w
Mitig
ate
To avoid the problem of improper construc-tion methods, site managers and foreman should be given regular training to enable them to have current knowledge of practices in the industry and grant them the ability to identify wrong methods used by site man-agement.
Qu
alit
y
Lack of protective equipment
Lik
ely
Hig
h
Mitig
ate
Construction companies should ensure ade-quate PPE is made available to workers at all times and also workers are given the re-quired training on-site safety and the need to use protective equipment
Qu
alit
y
Poor com-munication involved parties
Fre
qu
en
t
Hig
h
Mitig
ate
Good collaborations between involved par-ties (from clients, consultants, and contrac-tors) should be encouraged on all projects to ensure a common good is pursued the pro-ject
Qu
alit
y
Unsuitable leadership style
Lik
ely
mo
de
rate
Mitig
ate
People put in charge of managing projects or sites should be given the required leadership training to ensure building construction pro-jects precede based on good leadership. This has to take into account local specific factors likely to affect project performance
Cost
Fluctuation of material prices
Fre
qu
en
t
mo
de
rate
Tra
nsfe
r
As the problem of price fluctuation is outside the control of the project teams, procurement of materials for projects should be made well in advance of their use periods to prevent in-creased costs from material price increases.
Cost
Health and safety is-sues
Lik
ely
Hig
h
Avo
id
Health and safety issues should be given the needed consideration on projects as it has a high influence on project performance. Man-agement teams on site should have appro-priate training in health and safety which will help them pass on health and safety guides on site to workers. There should be periodic toolbox talks on health and safety at the pro-ject sites to ensure site teams are well equipped on health and safety issues

Cost
Bribery and cor-ruption
Fre
qu
en
t
Hig
h
Avo
id
Often the risks to construction organizations stem from the corrupt practices of which it has no knowledge, undertaken by its suppli-ers and customers. Due diligence and care-ful negotiations should be required to insu-late construction organizations from the wrongdoing of others.
Cost
Material wastage
Rem
ote
mo
de
rate
Mitig
ate
The issue of material wastage on projects can be managed by ensuring proper plan-ning of material usage and also using the most appropriate methods of construction which will lead to low waste generation. This can also be checked by having good supervi-sion of the activities of site workers.
Cost
Poor site and man-agement and super-vision
Lik
ely
mo
de
rate
Mitig
ate
The issue of poor site management and su-pervision can be managed by ensuring man-agement team on site are given the required training and also have the required technical know-how on the construction methods and technologies used on projects.
Cost
Time over-runs for diff. rea-sons
Lik
ely
mo
de
rate
Mitig
ate
As explained above
Tim
e
Quality problems
Lik
ely
mo
de
rate
Tra
nsfe
r
The issue of productivity at the construction site can be improved through the motivation of site teams and also instituting a very effec-tive management team and style on projects.
Tim
e
Low productivity
Fre
qu
en
t
Hig
h
Tra
nsfe
r
The issue of productivity at the construction site can be improved through the motivation of site teams and also instituting a very effec-tive management team and style on projects.
Tim
e
Improper Construc-tion Meth-ods
Rem
ote
Lo
w
Mitig
ate
To avoid the problem of improper construc-tion methods, site managers and foreman should be given regular training to enable them to have current knowledge of practices in the industry and grant them the ability to identify wrong methods used by site man-agement.

67
Tim
e
Delayed in Payments
Fre
qu
en
t
Hig
h
Avo
id
The influence of delayed payments can be managed by ensuring issues of payment are well documented at the start of projects. Cli-ents should be encouraged to ensure pay-ments arrangements made are executed ac-cording to plan. Contractors may also want to put in place a backup plan to ensure the cash flow of projects is not negatively af-fected by delayed payments.
Tim
e Poor site
and man-agement and super-vision
Lik
ely
mo
de
rate
Mitig
ate
The issue of poor site management and su-pervision can be managed by ensuring man-agement team on site are given the required training and also have the required technical know-how on the construction methods and technologies used on projects
5.2 Case Study B
Case study B will consist on analyzing the Risk Management process implemented by
Kontakt shpk, during the development of the Magnet project. This project consists in
developing and constructing residential buildings located in Ndre Mjeda street, near
center of Tirana, Albania.
5.2.1 Company profile and project details
Kontakt shpk is founded by the cooperation of two friends Fatmir Bekteshi and Avenir
Kika, where they developed the first residential project in 1999 on the land owned by
Kika’s family. Nowadays, the company is owned only by Fatmir Bekteshi, and the com-
pany is specialized in developing and constructing residential buildings, developing
and revitalizing the entire urban area in the capital city of Albania, Tirana.
Magnet is a successful example of implementing ambitious projects and taking a huge
risk and developing a large area, with only one purpose creating residential space and
units for service.
Table 5.2 1 Company profile Case study B
Name of the Company Kontakt shpk
Founded 1999
Core business Construction& Real Estate Development

Nr of employee
Administration& Technical Department
94
Residential Buildings projects Magnet, Ana, Siri, Mangalemi 21 etc
Affiliation Frosina Plaku Str 40, 1023 Tirana,
Albania
Magnet is a successful example of implementing ambitious projects and taking a huge
risk and developing a large area, with only one purpose creating residential space and
units for service.
The below table are some basic details of the project
Table 5.2 2 Basic descriptive data of Magnet project
Project Magnet
Typology Residential
Investment cost 47,260,134
Gross Construction Area 120,000 m2
Residential 7 buildings, 13 floors each building
Parking Each building 1 underground parking
floor
Construction Time 2011-2014
Project management team is compound with 8 people coming from different back-
grounds, mostly with a Civil Engineering backgrounds but also architects are involved.
Besides the Project Manager is involved the Financial Manager coming with a financial
background and his responsibility consist of any potential development of the project
that affects the budget of the project. According to the Project Manager, the presence
of the Financial Manager in the team is helpful because allow the project manager to
focus more on technical issues during the development of the project and mostly the
cost controlling is completed by the Financial Manager.
Project management team involved on this project is explained in the table below
Table 5.2 3 Descriptive data of the project management team involved in Case B

69
5.2.2 Risk Management Process
Similarly, to Case study A, the identification of risks is conducting by Checklist tech-
nique, the Project Manager explains that is the most common technique used in Alba-
nia and somehow is the technique that gives confidence to the project managers that
identified risks are relevant to the project. The reason, why is difficult to conduct other
technique such as Brainstorming or Delphi technique, is the lack of historical data, lack
of reliable database and lack of the proper infrastructure to conduct a questionnaire or
survey. Project manager explains that experience gained through years becomes a
powerful tool for improving and increasing the intuition on identifying the risks before
and during the implementation of the projects.
The process of risk management is illustrated in the below Fig. 5.2.2.1
No Position Responsibility Work
experi-
ence
Education Background
1 Project Manager Running the project 12
years
MSc. Structural Engineer-
ing
2 Quantity surveyor Cost and quantity 8 years MSc. Civil Engineering
3 Financial Manager Cost controlling 4 years MSc. Finance and Admin-
istration
4 HSE manager HSE rules implemen-
tations
3 years MSc. Environmental and
Resource Management
5 Site manager 2 Daily work on site 2 years BSc. Civil Engineering
6 Structural Engineer Update possible
structural changes
5 years MSc. Structural Engineer-
ing
7 Architect Update possible ar-
chitectural changes
3 years MSc. Architecture
8 Draftsman Update teams with ar-
chitectural changes
2 years MSc. Architecture

Figure 5.2.2 1 Risk management Process for the case study B
5.2.3 Risk identification
The project manager claims that the strategy of the company on focusing only in one
typology of real estate development, mainly residential buildings is extremely helpful
because it allows the teams to gain experience on the same typology of the projects
and the risks faced on the previous project are monitored and controlled in a progres-
sive way by achieving better results on the next project.
The company is positioned most of the cases in the position of the main developer for
the project so according to the Project Manager is needed to define different risks in
different phases of implementation of the project because on the potential of the oc-
currence of the risk the decisions might change.
Initially, based on the experience the management team possesses a Detailed list of
potential risk, this list is generated based on the previous project completed by the
company.
The table below explains the way that Project management is dividing potential risks
based on the phase of their occurrence
Table 5.2 4 Categorizing risks based on the phase of the occurrence
The
phase
Objec-
tives
Type of risks Description /Reasons of
risk occurrence

71
of the
pro-
ject
Desig
n P
ha
se
Decide
project
objec-
tive
Lack of coordination, communi-
cation, cooperation between
parties
Parties involved do not share
the same motivation, desire,
and responsibilities
Not enough resource Number of people involved in-
appropriate
Design Not efficient solutions Coming as a result of lack of
communication, No clear un-
derstanding of the objectives
of the project
Periodic changes of design Expected change because of
the client
Leadership do not take deci-
sions on time
Decision process take more
time than estimated
Te
nd
ering
an
d A
ward
ing
Contract
docu-
ments
prepara-
tions
Legal gap knowledge legal department not being
active in the design phase of
the project
Tender-
ing pro-
cess
Not finding the right contractor the offers are not according to
the expectations
The contractor is not reliable there is a need to check up all
companies
Selec-
tion
Negotiation process take more
time
Negotiation between parties
should be based on deter-
mined deadlines
Con
str
uction
Ph
ase
Monitor
and con-
trol
The contractor has no proper
experience and knowledge
Lack of experience on dealing
certain level of complexity of
the project
Re-
source
Losing the control over the pro-
ject
Not the right experience or
tools on project controlling

Man-
agement
Delays in the construction
schedule
Corrective actions not taken
in time
Contractors have a problem
with payments
contractor does not have li-
quidity
Docu-
menta-
tion and
man-
agement
Errors in documentation contractor should prepare the
documents from the
beginning
Com
mis
sio
nin
g
Ph
ase
Final in-
spection
and
Possible errors/ take more time
to fix it
Possible errors or malfunction
of the equipment and it take
more time to fix it
5.2.4 Risk analysis
Regarding the risk analysis, the Project Manager explains that through the Probability-
Impact matrix is given a specific weight to the potential of the risks mentioned in the
above table. Through this technique, the management team can understand the impact
and the consequence of a certain risk occurring.
Project Manager supports the idea that eliminating as much as possible problems and
eliminating uncertainties will improve the monitoring and controlling process, the basis
of this idea is trying to deliver a project with no errors.
This type of approach helps to increase the pressure on Project Management team
and this pressure will be transferred to the contractor in the same time, in that way
each member of parties involved will be more concerned related to the risks and acting
on the proper time when a risk is affecting the scope of the project.
Based on the probability of occurrence of the risks, they will be divided in the group as
the below Table 5.2 5 shows

73
Table 5.2 5 Categorizing risks according to the probability of the occurrence
Probability Very Low Low Medium High Very High
Risk 0.1 0.3 0.5 0.7 0.9
According to the above table, each identified risk will be associated within a probability
of occurrence, this it will be based on the experience, probability of occurrence of cer-
tain risk in the previous project and based on the estimation that the management team
believes that risk can happen.
Determining the probability of each risk is the first step on risk analysis phase, the
second step of risk analyze will consist that each identified risk will be given the esti-
mated rate of the impact that might have on the final project scope such time, cost and
quality.
Table 5.2 6 Categorizing risks based on the impact in the scope of the project
Identi-
fied
Risk
Project
Objec-
tive
Very low
0.05
Low
0.1
Moderate
0.2
High
0.4
Very High
0.8
Ris
k
Cost Cost in-
crease no
signifi-
cance
<10% cost
increase
10-20%
cost in-
crease
20-40%
cost in-
crease
>40% cost
increase
Time Time in-
crease no
signifi-
cance
<5% time
increase
5-10% time
increase
10-20%
time in-
crease
>20% time
increase
Quality Quality
degrada-
tion barely
noticeable
Only very
demanding
applications
are affected
Quality re-
duction re-
quires
sponsor
approval
Quality
reduction
unac-
ceptable
to spon-
sor
Project end
item is ef-
fectively
useless

The rate of impact is divided into 5 levels such as Very low (0.05), Low (0.10), Medium
(0.02), High (0.4), Very High (0.8), this type of grouping is made for three main com-
ponents of Cost, Time and Quality.
The above table contains and explains all information how is categorized each risk
based on the expected rate of impact during implantation of the project.
To get a result, the process is not concluded with the Rate of the Impact table, but
there are needed further calculations.
The rate of the Impact materialized in empirical numbers must be multiplied by the
associated probability of occurrence for each respective risk. This will give a result that
describes and materialize the potential of each risk
Table 5.2 7 Risk Probability-Impact Matrix
0.8 0.8 0.24 0.4 0.56 0.72
0.4 0.04 0.12 0.2 0.28 0.36
0.2 0.02 0.06 0.1 0.14 0.18
0.1 0.01 0.03 0.05 0.07 0.9
0.05
0.005 0.015 0.025 0.035 0.045
IMPACT
PROBABILITY
0.1 0.3 0.5 0.7 0.9
The result after multiplication of probability of occurrence within the respective rate of
impact, the final output of risk analysis is organized on the table below.
Table 5.2 8 Risk probability and Impact on costs, time and quality
Identified Risk Project Ob-
jective
Probability Impact Ma-
trix
Lack of coordination, commu-
nication, cooperation between
parties
Cost 0.7 0.2 0.14
Time 0.2 0.14
Quality 0.1 0.07

75
Not enough resource Cost 0.5 0.1 0.05
Time 0.4 0.2
Quality 0.05 0.025
Not efficient solutions Cost 0.7 0.8 0.56
Time 0.8 0.56
Quality 0.1 0.07
Periodic changes of design Cost 0.5 0.1 0.05
Time 0.8 0.4
Quality 0.05 0.025
Leadership do not take deci-
sions on time
Cost 0.5 0.2 0.1
Time 0.8 0.4
Quality 0.8 0.4
Legal gap knowledge Cost 0.5 0.1 0.05
Time 0.2 0.1
Quality 0.05 0.025
Not finding the right contractor Cost 0.5 0.2 0.1
Time 0.4 0.2
Quality 0.8 0.4
Reliability of contractor Cost 0.1 0.4 0.04
Time 0.8 0.08
Quality 0.4 0.04
Negotiation process take
more time
Cost 0.5 0.2 0.1
Time 0.8 0.4
Quality 0.1 0.05
Contractor has no proper ex-
perience and knowledge
Cost 0.1 0.4 0.04
Time 0.8 0.08
Quality 0.4 0.04
Losing the control over the
project
Cost 0.1 0.4 0.04
Time 0.4 0.04
Quality 0.8 0.08
Delays in construction sched-
ule
Cost 0.5 0.05 0.025
Time 0.4 0.2
Quality 0.2 0.1

Contractors has problem with
payments
Cost 0.3 0.05 0.015
Time 0.8 0.24
Quality 0.4 0.12
Errors in documentation Cost 0.1 0.05 0.005
Time 0.8 0.08
Quality 0.05 0.005
Possible errors/ take more
time to fix it
Cost 0.3 0.2 0.06
Time 0.8 0.24
Quality 0.4 0.12
5.2.5 Risk response strategy
Risk response strategy consists of a simple plan of categorizing the risks in three main
groups, 1. Unacceptable 2. Moderate 3. Acceptable. Based on the category in which a
certain risk is situated there is a clear action to be taken and how to prevent the devel-
opment of risk the rate of the impact during the implementation of the project.
The project manager believes that this grouping of risks has been relatively effective,
and it fits more in practice than developing a complex matrix with certain rules to be
strictly followed.
The below table explains based on the level of risk everyone knows the procedure,
how to transfer the responsibility of taking a decision regarding the reaction to be pro-
vided to minimize the impact of the risk. It is meaningful to mention that for risks cate-
gorized as Unacceptable, those that have a huge impact on the scope of the project,
even the Project Manager has no full power of decision making but must ask for a
confirmation from Leadership of the company, such as the executive department lo-
cated and situated more closely to the CEO of the company
Table 5.2 9 Risk response strategy
Risk response strategy
Type of Risk Type of
Action
Emergency
level
Decision Description

77
Acceptable Acceptable Low Project Manager The solution and deci-
sion of this risks can
be provided by PM
Moderate Mitigate Medium Project Manager The solution and deci-
sion of this risks can
be provided by PM
Unaccepta-
ble
Avoid High CEO of Com-
pany
The decision for a
proposed solution is
to the CEO of Com-
pany
Project manager explains that this helpful also because reduce the pressure on him of
taking important final decisions is up to the leadership of the company.
As final step to be conducted during the management of a certain risk is to register
that risk on Risk Register of the Project, which is updated every time with typology of
the risk, his final impact on the project, related to time, cost and quality and what type
of action were taken in that time.
This procedure is very important for the company and the project management team
because it is an important database, it improves the process of risk identification and
analysis, entire risk management process will be on progress for the upcoming pro-
jects.
5.3 Results
In case A, it can be distinguished that the analyze of the risks have as a result an
equilibrium between Cost and Quality, on the level of 35%, meaning that 35% of total
risks will have an impact on Cost and Quality and less than 30% of the total amount of
risks will have an impact on Time during the development of the project.
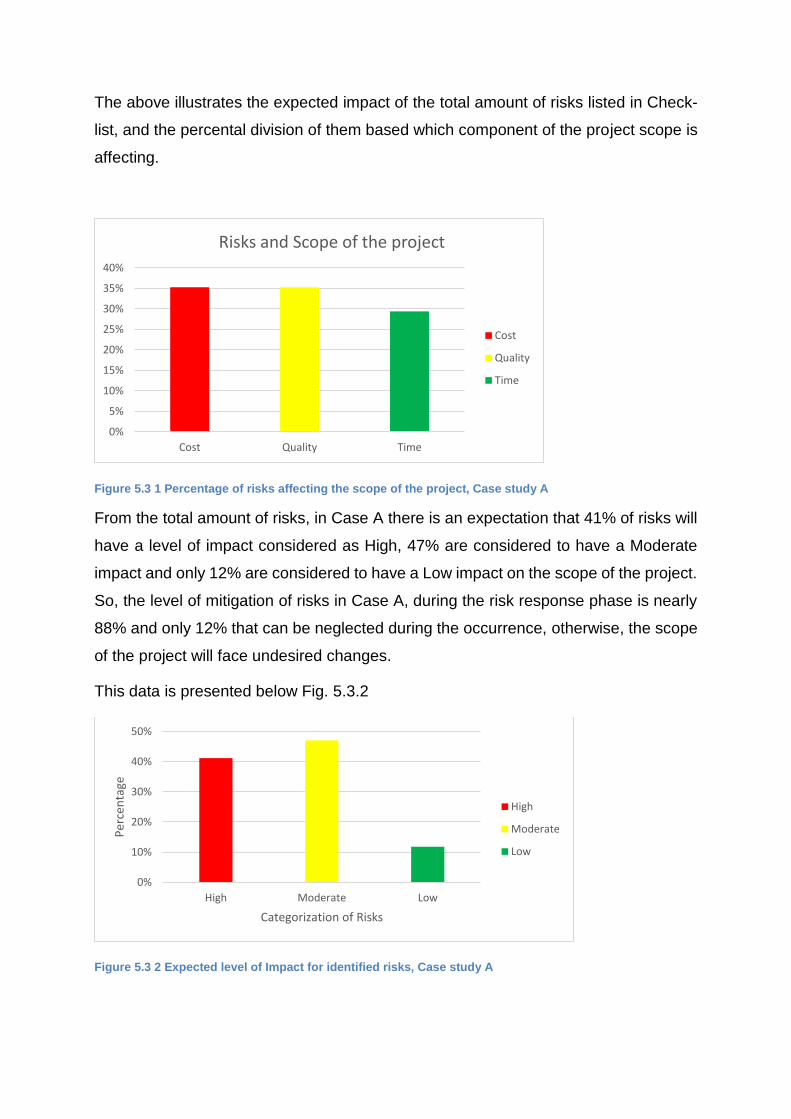
The above illustrates the expected impact of the total amount of risks listed in Check-
list, and the percental division of them based which component of the project scope is
affecting.
Figure 5.3 1 Percentage of risks affecting the scope of the project, Case study A
From the total amount of risks, in Case A there is an expectation that 41% of risks will
have a level of impact considered as High, 47% are considered to have a Moderate
impact and only 12% are considered to have a Low impact on the scope of the project.
So, the level of mitigation of risks in Case A, during the risk response phase is nearly
88% and only 12% that can be neglected during the occurrence, otherwise, the scope
of the project will face undesired changes.
This data is presented below Fig. 5.3.2
Figure 5.3 2 Expected level of Impact for identified risks, Case study A
0%
5%
10%
15%
20%
25%
30%
35%
40%
Cost Quality Time
Risks and Scope of the project
Cost
Quality
Time
0%
10%
20%
30%
40%
50%
High Moderate Low
Per
cen
tage
Categorization of Risks
High
Moderate
Low

79
As is it is shown in the below Fig. 5.3. 3 approximately 60% out 35% of total risks that
are expected to affect the Cost the level of impact will be Moderate and the other 40
% will have a level of Impact considered High, leaving with 0% level of Impact consid-
ered as Low.
This show that regarding the Costs are no risks that can be neglected otherwise the
project will face changes regarding this objective.
From 35% of total risks that affect the Quality of the project, it is expected that 50% of
them will have a level of impact considered High, 33% will be on the Moderate Level
and 17% on the Low Level.
Related to Time, the results are quite different from two other components, for instance
regarding risks with the Low level of Impact there is an increase, reaching 20%, and
there is a balance in 40% regarding the Moderate and High level of impact that might
affect the time of the project.
This result enforces the idea the project management team is focused to not tolerate
any risk that might affect Cost versus Time that is more predisposed to tolerate certain
risk.
These results are presented in the below Fig. 5.3. 3
Figure 5.3 3 Impact of identified risks related to costs, time and quality, Case study A
Regarding the Case B, from the total amount of risks listed in Checklist 40% of them
are resulting as risks with level of impact as Acceptable, 33% are considered as risks
that might have a Moderate impact and 27% are list as risks with level of impact Un-
acceptable, as it is organized on the Fig. 5.3.4
0%
10%
20%
30%
40%
50%
60%
70%
Moderate High Low Moderate High Low Moderate High
cost quality Time
Per
cen
tage
Project scope and risks
risk and project scope
cost Moderate
cost High
quality Low
quality Moderate
quality High
Time Low
Time Moderate
Time High

Figure 5.3 4 Level of Risk Impact for identified risks, Case study B
From total amount of risks expected to face the project, regarding the Cost, 50% of the
risks are evaluated as Acceptable, with no impact on Cost, 30% is evaluated as Mod-
erate, 20% are evaluated with a level of Impact as Unacceptable, this 20 % of risks
have a huge potential to change the cost of the project.
The scenario is quite different regarding the Quality, there is a considerable increase
of risks considered with a level of impact Acceptable reaching 60 %, and there is a
balance between Moderate and Unacceptable risks 20%.
Only 10% is listed as Acceptable risks regarding the time of the project, 40 % of those
risks are categorized as risks with the level of impact Moderate, and 50% are Unac-
ceptable for the schedule of the project.
0%
5%
10%
15%
20%
25%
30%
35%
40%
45%
Moderate Unacceptable Acceptable
Percentage
0%
10%
20%
30%
40%
50%
60%
70%
Acc
epta
ble
Mo
der
ate
Un
acce
pta
ble
Acc
epta
ble
Mo
der
ate
Un
acce
pta
ble
Acc
epta
ble
Mo
der
ate
Un
acce
pta
ble
Cost Quality Time
Per
cen
tage
Risks and scope of the project
Levels of the risks for the objectives of the project
Cost Acceptable
Cost Moderate
Cost Unacceptable
Quality Acceptable
Quality Moderate
Quality Unacceptable
Time Acceptable
Time Moderate
Time Unacceptable
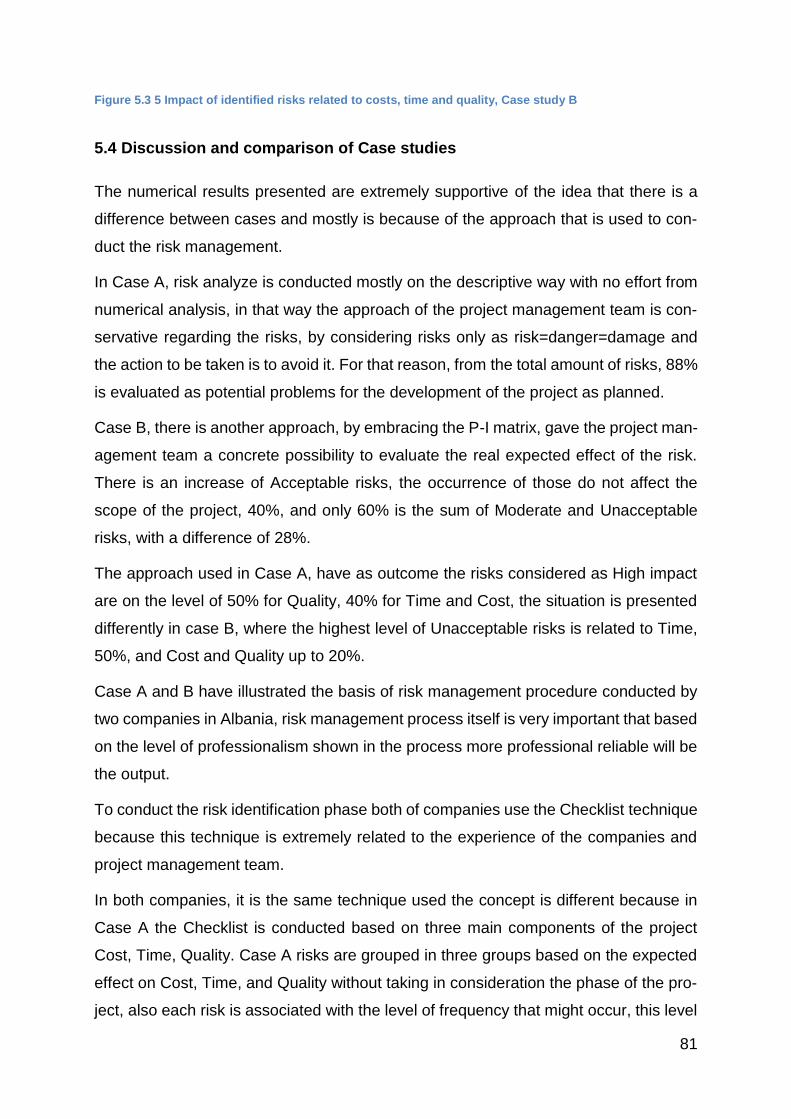
81
Figure 5.3 5 Impact of identified risks related to costs, time and quality, Case study B
5.4 Discussion and comparison of Case studies
The numerical results presented are extremely supportive of the idea that there is a
difference between cases and mostly is because of the approach that is used to con-
duct the risk management.
In Case A, risk analyze is conducted mostly on the descriptive way with no effort from
numerical analysis, in that way the approach of the project management team is con-
servative regarding the risks, by considering risks only as risk=danger=damage and
the action to be taken is to avoid it. For that reason, from the total amount of risks, 88%
is evaluated as potential problems for the development of the project as planned.
Case B, there is another approach, by embracing the P-I matrix, gave the project man-
agement team a concrete possibility to evaluate the real expected effect of the risk.
There is an increase of Acceptable risks, the occurrence of those do not affect the
scope of the project, 40%, and only 60% is the sum of Moderate and Unacceptable
risks, with a difference of 28%.
The approach used in Case A, have as outcome the risks considered as High impact
are on the level of 50% for Quality, 40% for Time and Cost, the situation is presented
differently in case B, where the highest level of Unacceptable risks is related to Time,
50%, and Cost and Quality up to 20%.
Case A and B have illustrated the basis of risk management procedure conducted by
two companies in Albania, risk management process itself is very important that based
on the level of professionalism shown in the process more professional reliable will be
the output.
To conduct the risk identification phase both of companies use the Checklist technique
because this technique is extremely related to the experience of the companies and
project management team.
In both companies, it is the same technique used the concept is different because in
Case A the Checklist is conducted based on three main components of the project
Cost, Time, Quality. Case A risks are grouped in three groups based on the expected
effect on Cost, Time, and Quality without taking in consideration the phase of the pro-
ject, also each risk is associated with the level of frequency that might occur, this level

of frequency is estimated based on the experience of the project management team
and the internal database of the company.
Case B, on the other hand, it shows a detailed usage of Checklist, by listing each
potential risk that the project might face during the development, and in this case, the
risks are listed according to the phase of the project that might occur.
In case of B, there is no attempt to support the risks with other important inputs, but
only the identification of the risk, identification of the phase that might occur during the
development of the project.
Same as Case A, the Checklist is conducted based on the experience of the project
management team and the internal database of the organization. Advantageous in
Case B is that the company mainly operate with the same typology of projects, resi-
dential buildings.
Risk assessment in Case A is conducted by the technique known as Impact Assess-
ment, where each listed risk is associated with the level of the impact. Based on the
level of influence that is believed or expected to have on the project scope the levels
of impact are divided Low, Moderate, High.
Case B, for risk analysis, embraced the technique of Probability-Impact Matrix, each
listed risk is given a weight of probability of occurrence and one level of impact related
to time, cost and quality. This procedure requires also numerical calculations and the
final output for each risk is expressed on empirical data.
Regarding the Risk, the response strategy is very similar in both cases, by defining
strict rules to be followed and assigning the responsibilities to everyone involved in the
management of the project. Both cases show the importance of keeping a risk register
because it is helpful for future projects.
5.5 Conclusion
The study of the above two case studies emphasises the importance of risk manage-
ment during the development of the project management. The chosen approach to
analyzing the risk affects the entire process of risk management and the solutions will
depend on the risk analyze results.

83
Embracing a descriptive and intuitive approach on risk analyze will lead in the
management of the risks in a conservative way by entitling the risks with their maximal
potential and maximizing their effect, leading to an artificial increase of the pressure of
the project management team.
This extra pressure will lead the project management team in a wrong direction by
evaluating the risks with the high potential to damage the scope of the project.
Conducting the analyze of the case studies illustrates a gap between theoretical
knowledge and practical application of the risk management process.
Risk identification is compiled mainly based on the internal database, without taking
into consideration the external force that can drive the development of new external
potential risk. The fact that Checklist is done mainly on the internal database and the
weight of probability or impact is given according to the experience limits the integration
of risk management process and create the opportunity to expose the project under
new external risks that might occur because of actual political, economic and environ-
mental situation of the country or changes to the construction companies.
There is a strong concept or mentality of defining the risks only as a danger than cause
difficulties on the implementation of the project and there is no approach to certain
risks an opportunity to improve the implementation process and maximizing the ac-
complishment of the objectives.
Risk management process is mostly considered as a process of controlling and moni-
toring during the construction phase, by considering zero risks or very few risks in de-
sign or tendering phase. This concept leads to an approach in a reactive way in case
of occurrence of risks before construction phase, project management team should
embrace the proactive approach for the entire life cycle of the project, specifically de-
sign, tendering and construction phase.
6 Risk analyze, Risk Impact method
This chapter will deal with analyzing a proposed method to define properly the impact
of each risk that might occur during the development of the project. The analyze of
cases studies in chapter 5 shows that there is a significant gap in associating the
proper impact of listed risks during the risk qualitative and quantitative analysis. This

chapter will deal with a simple and efficient method of defining risk probability and risk
impact based on numerical and statistical calculations.
6.1 Absolute and normalized probabilities of risks
During the development of the project the risks can affect the project by creating an
unfavorable situation and the consequences can be with a high impact on the settled
objectives for the project. The analyze of two cases studies gave the idea that on reality
in practice there is no a conduction of a detailed analysis of the impact that identified
risks might have on the project.
Risk analyze process was conducting but somehow there was no clear answer about
what the impact on costs might be, what can be the potential risks to the scheduling
and quality and most important the risk analyze conducting on two case studies was
not able to express the supposed impact in concrete numbers or probabilities calcula-
tions.
To conduct this phase of the study and illustrates with numerical applications the us-
age of this numerical approach will be selected 5 risks discussed in the Case B, listed
during the risk identification process. The method can be used for each risk identified
no matter the phase of project implementation. The risk chosen for developing this
numerical approach are:
1. Lack of coordination, communication, cooperation between parties
2. Not efficient solutions
3. Periodic changes of design
4. Delays in the construction schedule
5. Contractors have a problem with payments
For the probability of the occurrence will be used the same numerical value identified
in the Case B, as the probability of occurrence of the risks is mainly based on the
experience and it varies from project to project, and it needs a large database to ap-
point a realistic value.
Table 6.1 1 Identified risks and their respective probability of occurrence

85
Risk Probability of
occurrence
Lack of coordination, communication, cooperation between parties 0.7
Not efficient solutions 0.7
Periodic changes of design 0.5
Delays in construction schedule 0.5
Contractors have a problem with payments 0.3
Determining the probability of each risk for the above risks is the first step of this ana-
lyze, to be able to emphasize the real impact and the real weight of each risk it is
needed to conduct the normalization of the probability.
The sum of absolute probability for the listed risks is the sum of the probability of each
risk: 0.7+0.7+0.5+0.5+0.3=2.7
Table 6.1 2 Normalized Probability of risks
Risk Absolute probability Normalized Probability
Lack of coordination, communication,
cooperation between parties
0.7 0.259259259
Not efficient solutions 0.7 0.259259259
Periodic changes of design 0.5 0.185185185
Delays in construction schedule 0.5 0.185185185
Contractors has problem with pay-
ments
0.3 0.111111111
∑ 2.7 ∑ 1
Normalized probabilities can be achieved by the process of dividing the associated
probability of the risks with the total sum of the absolute probabilities of all risks listed
(see the above table)
As can notice the sum of all normalized probabilities is 1, and the normalized probabil-
ities are needed to calculate the risk exposure.

6.2 Risk Impact- Quantitative approach
Three main objectives to achieve during the accomplishment of the project such as
costs, time and quality are strongly correlated together and the non-accomplishment
of one can affect the other component.
The priority of those is settled mainly by needs and requirements of the clients, the
purpose of the project and other extra factors, for conducting a proper risk impact there
is a necessity to define the priority of these components from start to the end of the
project, settling of the priorities will help the process of giving an accurate impact of
each risk related to time, costs and quality.
For this study, the priorities of costs, time, quality will be divided into 4 main variants,
but this can vary and change according to the needs of each project phase or organi-
zation.
The listing process of the priorities needs a long process of discussion with every
stakeholder engaged in the development of the project because these priorities reflect
directly the interest and requirement of the stakeholders. Although a priority s given
on the objectives of the project is not recommended to define a certain objective within
the level of 0%, so to not to be taken in consideration, because of the interrelation that
exists between these objectives and the neglection of one objective can lead to new
potential unknown effects.
Variant 1
In this variant, it is given priority of the costs, expressed in percentage (50%) and time
and quality share the same level of priority (25%).
Table 6.2 1 Normalized Impact, costs has the priority
Project objective Priority (Abs %) Normalized Influence
Cost 50% 0.5
Time 25% 0.25
Quality 25% 0.25
∑ 100% ∑ 1
Variant 2

87
In this variant, it is given priority of the time, expressed in percentage (50%) and cost
and quality share the same level of priority (25%).
Table 6.2 2 Normalized Impact of risks, time has the priority
Project objective Priority (Abs %) Normalized Influence
Cost 25% 0.25
Time 50% 0.50
Quality 25% 0.25
∑ 100% ∑ 1
Variant 3
In this variant, it is given priority of the quality, expressed in percentage (50%) and cost
and time share the same level of priority (25%).
Table 6.2 3 Normalized Impact of risks, Quality has the priority
Project objective Priority (Abs %) Normalized Influence
Cost 25% 0.25
Time 25% 0.25
Quality 50% 0.50
∑ 100% ∑ 1
Variant 4
In this variant all three components costs, time and quality share the same level of
priority 1/3 or 33, (33%). This variant avoids any preference between time, costs, and
quality and they share the same level of impact on the achievement of the scope of the
project, meaning that stakeholders have the same interest all components to be
achieved in the same level.
Table 6.2 4 Normalized Impact of risks, Cost, time, quality share same level of priority
Project objective Priority (Abs %) Normalized Influence
Cost 33,33 % 0.33
Time 33,33 % 0.33
Quality 33,33 % 0.33
∑ 100% ∑ 1

Defining the priority and finding the interdependency among the objectives of the projects,
cost, time and quality for each of these three components there is a need to determine the
impact of each identified risk. After defining the absolute impact of each risk, and the units
regarding the time can be expressed in days, weeks or months or for the quality in per-
centage the successive step will consist in finding the normalized impact same procedure
used for the normalization of the probability.
Impact on Costs
Giving the weight of the absolute impact is done based on the experience, database of the
previous project, situations of the construction market of the country and other external
factors.
Table 6.2 5 Absolute impact and Normalized probability of risks related to costs of the project
No Risk Absolute Impact
(Euro)
Normalized Probability
R01 Lack of coordination, communication, coop-
eration between parties
€ 10,000 0.12987013
R02 Not efficient solutions € 25,000 0.324675325
R03 Periodic changes of design € 12,000 0.155844156
R04 Delays in construction schedule € 8,000 0.103896104
R05 Contractors has problem with payments € 22,000 0.285714286
∑ 77000 € ∑ 1
Impact on Time
Giving the weight of the absolute impact is done based on the experience, database of the
previous project, situations of the construction market of the country and other external
factors.
Table 6.2 6 Absolute impact and Normalized probability of risks related to time of the project
No Risk Absolute Impact (Days) Normalized Probability
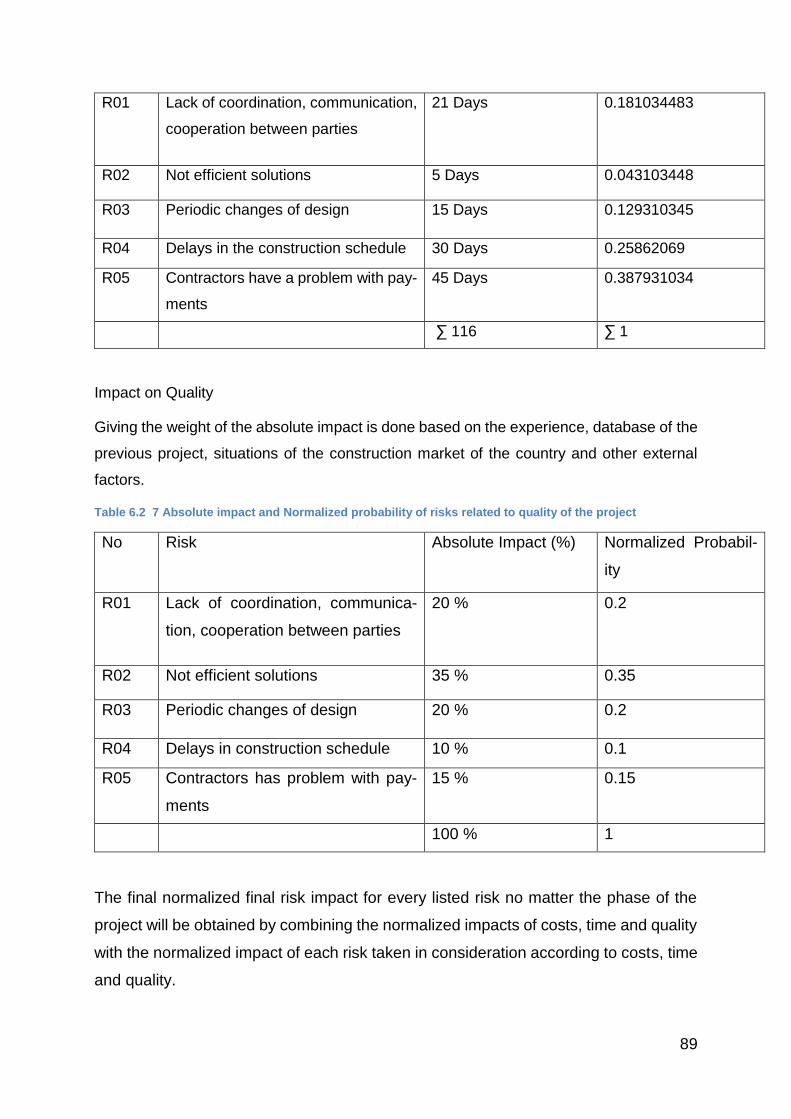
89
R01 Lack of coordination, communication,
cooperation between parties
21 Days 0.181034483
R02 Not efficient solutions 5 Days 0.043103448
R03 Periodic changes of design 15 Days 0.129310345
R04 Delays in the construction schedule 30 Days 0.25862069
R05 Contractors have a problem with pay-
ments
45 Days 0.387931034
∑ 116 ∑ 1
Impact on Quality
Giving the weight of the absolute impact is done based on the experience, database of the
previous project, situations of the construction market of the country and other external
factors.
Table 6.2 7 Absolute impact and Normalized probability of risks related to quality of the project
No Risk Absolute Impact (%) Normalized Probabil-
ity
R01 Lack of coordination, communica-
tion, cooperation between parties
20 % 0.2
R02 Not efficient solutions 35 % 0.35
R03 Periodic changes of design 20 % 0.2
R04 Delays in construction schedule 10 % 0.1
R05 Contractors has problem with pay-
ments
15 % 0.15
100 % 1
The final normalized final risk impact for every listed risk no matter the phase of the
project will be obtained by combining the normalized impacts of costs, time and quality
with the normalized impact of each risk taken in consideration according to costs, time
and quality.

Calculating normalized risk impact, Variant 1, where the priority is given to the costs (50%)
and the time and quality share the same level of impact 25%.
Table 6.2 8 Normalized Risk impact of risks related to costs of the project
No Risk Costs Time Quality Risk Impact
R01 Lack of coordination, communi-
cation, cooperation between
parties
0.1289x0.5 + 0.1810x0.25 + 0.20x0.25 0.16019369
R02 Not efficient solutions 0.3246x0.5 + 0.0431x0.25 + 0.35x0.25 0.26061352
R03 Periodic changes of design 0.1558x0.5 + 0.1293x0.25 + 0.20x0.25 0.16024966
R04 Delays in construction schedule 0.1038x0.5 + 0.2586x0.25 + 0.10x0.25 0.14160322
R05 Contractors has problem with
payments
0.2857x0.5 + 0.3879x0.25 + 0.15x0.25 0.2773399
∑ 1
Normalized risk impact for Variant 2, where the priority is given to the time (50%) and the
costs and quality share the same level of impact 25%.
Table 6.2 9 Normalized Risk impact of risks related to time of the project
No Risk Costs Time Quality Risk Impact
R01 Lack of coordination, communi-
cation, cooperation between
parties
0.1289x0.5 + 0.1810x0.5 + 0.20x0.25 0.17298477
R02 Not efficient solutions 0.3246x0.5 + 0.0431x0.5 + 0.35x0.25 0.19022056
R03 Periodic changes of design 0.1558x0.5 + 0.1293x0.5 + 0.20x0.25 0.15361621
R04 Delays in construction schedule 0.1038x0.5 + 0.2586x0.5 + 0.10x0.25 0.18028437
R05 Contractors has problem with
payments
0.2857x0.5 + 0.3879x0.5 + 0.15x0.25 0.30289409
∑ 1
Normalized risk impact for Variant3, where the priority is given to the quality (50%), the
costs and time share the same level of impact 25%.
Table 6.2 10 Normalized Risk impact of risks related to quality of the project

91
No Risk Costs Time Quality Risk Impact
R01 Lack of coordination, communi-
cation, cooperation between
parties
0.1289x0.25 + 0.1810x0.25 + 0.20x0.5 0.17772615
R02 Not efficient solutions 0.3246x0.25 + 0.0431x0.25 + 0.35x0.5 0.26694469
R03 Periodic changes of design 0.1558x0.25 + 0.1293x0.25 + 0.20x0.5 0.17128863
R04 Delays in construction schedule 0.1038x0.25 + 0.2586x0.25 + 0.10x0.5 0.1406292
R05 Contractors has problem with
payments
0.2857x0.5 + 0.3879x0.25 + 0.15x0.5 0.24341133
∑ 1
Normalized Risk Impact for variant 4, where there is no preference about the priority and
costs, time and quality share the same level of priority (33%)
Table 6.2 11 Normalized Risk impact of risks related to costs, time, quality on same level of priority
No Risk Costs Time Quality Risk Im-
pact
R0
1
Lack of coordination,
communication, coopera-
tion between parties
0.1289x0.
333
+
0.1810x0.
333
+
0.20x0.3
33
0.170284
51
R0
2
Not efficient solutions 0.3246x0.
333
+
0.0431x0.
333
+
0.35x0.3
33
0.239235
67
R0
3
Periodic changes of de-
sign
0.1558x0.
333
+
0.1293x0.
333
+
0.20x0.3
33
0.161702
R0
4
Delays in construction
schedule
0.1038x0.
333
+
0.2586x0.
333
+
0.10x0.3
33
0.154156
85
R0
5
Contractors has problem
with payments
0.2857x0.
333
+
0.3879x0.
333
+
0.15x0.3
33
0.274520
99
∑ 1

6.3 Risk Exposure-Quantitative Approach
Calculating the risk probability and risk impact for each identified risk combined within
the priorities settled to be achieved will lead to the possibility of calculating risk expo-
sure. Risk exposure is calculated as a product of risk probability with the respective
risk impact. The determination of the risk exposure and placing them to the right inter-
relationships among the phases of the project or settled priorities of the project can
make possible of creating a list of risk priority.
Ranking risks according to the risk exposure is extremely helpful in identifying the right
strategy of mitigation of risks, to minimize the risks and so-called dangerous conse-
quences or to maximize the possible opportunities that might be developed under cer-
tain circumstances.
Table 6.3 1 Risk Exposure, Priority list of Risks when priority is given to Costs
Priority to Costs
No Risk Risk Im-
pact
Risk
Proba-
bility
Risk Ex-
posure
Priority
list
Ranked
Risks
Impact
R01 Lack of coordination, communi-
cation, cooperation between
parties
0.16 0.25926 0.042 2 5
R02 Not efficient solutions 0.261 0.25926 0.068 1 2
R03 Periodic changes of design 0.16 0.18519 0.03 4 3
R04 Delays in construction schedule 0.142 0.18519 0.026 5 4
R05 Contractors has problem with
payments
0.277 0.11111 0.031 3 1
The above table illustrates that there is a significant difference between the ranked risk
impact and ranked risk exposure and mainly this is due to the risk probability which
has a significant influence on the overall exposure of the risks. According to the calcu-
lations when the costs are set as the priority the risk, not efficient solutions is ranked
as first in the risks exposure but regarding his impact is ranked second.

93
The risk R01 is ranked in the position 5 in the ranked list of risk impact but on the risk,
exposure list is ranked the position 2 due to the high probability of occurrence, even
his impact is low related to the costs.
Table 6.3 2 Risk Exposure, Priority list of Risks when priority is given to Time
Priority to Time
No Risk Risk Im-
pact
Risk
Proba-
bility
Risk ex-
posure
Priority
list
Ranked
Risks
Impact
R01 Lack of coordination, communi-
cation, cooperation between
parties
0.173 0.25926 0.045 2 4
R02 Not efficient solutions 0.19 0.25926 0.049 1 2
R03 Periodic changes of design 0.154 0.18519 0.028 5 5
R04 Delays in construction schedule 0.18 0.18519 0.033 4 3
R05 Contractors has problem with
payments
0.303 0.11111 0.034 3 1
In the Variant 2, where Time has the priority among the objectives of the project there
is change on the priority list of risks, specifically R03 and R04 have changed the posi-
tion with each other, where the R04 (Delays in construction schedule) has more influ-
ence on the accomplishment of Time objective during the implementation of the pro-
ject.
Table 6.3 3 Risk Exposure, Priority list of Risks when priority is given to Quality
Priority to Quality
No Risk Risk Im-
pact
Risk
Proba-
bility
Risk Ex-
posure
Priority
list
Ranked
risk im-
pact
R01 Lack of coordination, communi-
cation, cooperation between
parties
0.178 0.25926 0.046 2 3
R02 Not efficient solutionns 0.267 0.25926 0.069 1 1
R03 Periodic changes of design 0.171 0.18519 0.032 3 4

R04 Delays in construction schedule 0.141 0.18519 0.026 5 5
R05 Contractors has problem with
payments
0.243 0.11111 0.027 4 2
In the Variant 3, where Quality has the priority among the objectives of the project,
there is a significant change in the priority list of the risks and the risks listed on 3 first
positions are related more to phases before the construction phase in design and con-
ceptual development, risks which are more related coordination, communication and
providing the best solution that fits the needs of the client.
Table 6.3 4 Risk Exposure, Priority list of Risks when Costs, time, quality share same level of priority
Costs, time, Quality same level of priority
No Risk Risk Im-
pact
Risk
Proba-
bility
Risk Ex-
posure
Priority
list
Ranked
risk Im-
pact
R01 Lack of coordination, communi-
cation, cooperation between
parties
0.17 0.25926 0.044 2 3
R02 Not efficient solutions 0.239 0.25926 0.062 1 2
R03 Periodic changes of design 0.162 0.18519 0.03 4 4
R04 Delays in construction schedule 0.154 0.18519 0.029 5 5
R05 Contractors has problem with
payments
0.275 0.11111 0.031 3 1
In the Variant 4, where the priority is shared on the same level 33% for each component
the priority list of risk is led by R02, Not efficient solutions, which has the higher risk
and risk probability in the same time. When there is a balance of priorities of objective
the importance of risk probability becomes more determinative on ranking the risks.
6.2 Conclusion
Numerical application of Risk Impact Method was extremely useful to understand sev-
eral concepts and how the entire process is affected by using this approach.

95
Firstly, is important to mention that using this technique give the project management
team a powerful tool to associates the identified risks within the accurate weight of risk
impact not only to decide about the level of expected impact based on the experience.
The proposed Risk Impact method require a specific and clear process of identifying
and setting the objective of the project from the first phase of the project and based on
the settled priorities will be developed the risk management process.
Through the numerical application of this method was clearly identified the priority list
which is conducted based on the estimation of risk exposure of each identified and
analyzed risk, it changes dramatically according to the priorities settled to be achieved
on the accomplishment of the project.
It cannot be expected the same priority list of risks when is settled a specific priority
and the level of satisfaction for a project for instance, in case that is settled that priority
as main objective of the project will be the cost the priority list of risks will change and
differ from the case that is settled as objective a balance between three main compo-
nents such as costs, time and quality.
Creating and developing a priority list of identified risks is helpful because it will affect
the process of developing the risk management process and influence the entire pro-
cess and the approach to be embraced for managing, monitoring and controlling the
risks.
7 Conclusion and recommendations
7.1 Introduction
The purpose of this research was to investigate how the implementation of risk impact
analyze can affect the balance of the objective of the project such as costs, time and
quality. This study gives a critical overview of theoretical knowledge and illustrate the
practical usage and application of risks management techniques in Albania through
the analyze of the 2 case studies.
The analysis and the illustration of 2 case studies shows the gap between theoretical
knowledge and practical applications, for that reason a simple Risk Impact Method
based on the quantitative approach is proposed to give the proper weight of risk impact
during the risk assessment process.
7.2 Conclusions
Developing and conducting this study was useful to achieve significant conclusions
and ideas for the construction industry, scope of the project, risk management process
and relationships created between risk analysis and scope of the projects such as time,
costs, and quality.
Completing this study, it helped to enforce some ideas, concepts also to have more
detailed and scientific observation and investigation to the construction industry in Al-
bania and risks management processes applied in practice, a summary of conclusions
achieved are:
There is significant gap between theoretical knowledge and practical applications.
From the beginning it was expected to have a gap between theory and practice, but
the illustration from the cases studies it shows that theoretical recommendations are
applied in a low level, by choosing a reactive approach in the risk management pro-
cess.
During the process of dealing with potential risks, is always present the idea of consid-
ering the risks only as threats, excluding the idea that effect of a certain risk can be a
good opportunity to improve and to maximize the achievement of the scope of the
project. Project Management team have a conservative approach, mainly to minimize
and to keep under control the damages and not embracing the proactive approach to
enhance an opportunity that might be developed during the realization of the project.
Risk identification and risk impact analysis process is conducted more based on the
personal experience of the project management team and the first input of risks iden-
tification is based on the internal databases of the companies, not reflecting the real
situation of the construction industry, the real situations of the construction market or
potential rate of inflation that the economy is facing.
Using the experience and the internal database as main and the only tool to identify
the potential risks keep the project exposed to the external drive force that might

97
develop the new, unpredicted risks that might influence the accomplishment of the
scope of the project, or might change the balance between costs, time and quality.
The reality shows that there is an insufficient attention on the risk analysis process,
risk probability and risk impact to define proper weight of influence that a certain risk
might have on costs, time, quality. This lack of attention or decision to not conduct a
proper statistical and probability analysis led to the conservative approach, by giving
an artificial increase of risk probability and risk impact of each identified risks, this arti-
ficial increasement will not reflect the reality in same time will increase artificially the
pressure on the project management team during the daily tasks of managing the pro-
ject.
There is a specific focus given to the costs, as main priority of the projects and neglect-
ing other objectives such as time and quality, specifically in Albania, this approach is
more developed due to low costs of resources, but there is a necessity to change this
approach and to embrace the idea that should be defined a proper balance of objec-
tives to deliver a successful project.
Risk impact method is extremely helpful on giving the proper weight regarding the risk
impact and risk exposure of each identified and analyzed risk and this technique can
be applied to forecast a realistic impact and this impact can be expressed in numerical
value. The possibility of having reliable numerical values to estimate the risk exposure
for different scenarios based on the settled priorities of the scope of the project can led
to better approach and strategies to manage the risks.
Priority list of risk impact it changes significantly related to the priority that is decided
from start of the project, meaning that in case that costs is dominant as priority among
the objectives of the projects will have different priority list of risk impact when time or
quality is dominant as priority, or there is a shared equal balance of priority among
costs, time and quality.
Priority list of risks is helpful to understand the impact of each risks, related to costs,
time and quality and give the possibility to conduct the analysis of different scenarios
and choosing the appropriate one based on priority given to the objective of the project.
Defining the dominance or balance between components such costs, time and quality
must be conducted from the start and must be consistent during the entire implemen-
tation phase of the project because the decision made on the priorities among the

objectives affect the risks management process, the strategy and the approach of mon-
itoring and controlling risks and the accomplishment of scope of the project.
7.3 Recommendations
Through this sub-chapter some recommendations are given to improve the Construc-
tion Risk management practice to achieve better results regarding the scope of the
project:
1- Risks Management process should be developed under proactive approach and
not only in a reactive way to deal with potential risks
2- The concept for risks should change, risks can be opportunity in same time that
might have positive effects on the scope of the project. Differently from theory
in practice risks are always considered as danger, that can damage the project
and this conservative way should change.
3- Risk assessment is extremely important on building a strategy of dealing and
managing the risks, that affect the strategy of delivering the project for that rea-
son that process needs a specific attention and the outcome should be based
on reliable mathematical data.
4- Higher is the percentage of security and confidence on assessing a certain risk,
more accurate and secure it will be solution to mitigate that risk and lower will
be the pressure on the project management team regarding the accomplish-
ment of the objectives of the projects.
5- Defining clearly and in advance the priorities among objectives such as costs,
time, quality it helps and improves the process of risks identification and analy-
sis and affect the process of choosing the right strategy on mitigating the poten-
tial risks.

99
Declaration of Authorship
I hereby declare that the attached Master’s thesis was completed independently and
without the prohibited assistance of third parties, and that no sources or assistance
were used other than those listed. All passages whose content or wording originates
from another publication have been marked as such. Neither this thesis nor any variant
of it has previously been submitted to an examining authority or published.
Date Signature of the student

References
APM , 2006. Body of Knowledge. Buckinghamshire: Association of Project
Management .
Assaf A.S and Al-Heijji S , 2006. Causes of delay in large construction projects;; Vol.
24; pp. 349-357. International Journal of Project Management, Volume 24, pp. 349-
357.
Assaf, S. A, Al-Khalil, M and Al-Hazmi, M , 1995. Causes of Delay in Large Building
Construction Projects. Journal of Management in Engineering, Volume 11, pp. 45-50.
Bryman, A., 1989. Research Methods and Organizational Studies. 1st ed. s.l.:Urwin
Hyman, Ltd..
Chan P.C.A and Chan A.P.L , 2004. Key performance indicators for measuring
construction success. International Journal, Volume 2, pp. 201-220.
Chapman, C., 1997. Project Risk Analysis and Management - PRAM the Generic
Process;. International Journal of Project Management, Volume 15, pp. 273-281.
DERVISHI, I., 2015. MENAXHIMI I AVANCUAR, ANALIZA E CILËSISË DHE
VLERËSIMI I RISKUT TË PROJEKTEVE INXHINIERIKE, PhD. Tiranë: UPT AL.
DIN 276 (06/93, 2009. DIN 276 (06/93. Berlin: German Institute for standartization.
DIN 69 901, 2009. DIN 69 901. Berlin: German Institute for Standardization.
Enshassi A, Al-Hallaq K and Mohamed S, 2006. Causes of contractor’s business
failure in developing countries the case of Palestine;. Journal of Construction in
Developing Countries, Volume 11, pp. 1-14.
Garold D, O., 2000. Project management and construction. New York: McGraw-Hill
Companies,.
Haidar, A. D., 2016. Construction Program Management–DecisionMaking and
OptimizationTechniques. Heidelberg New York Dordrecht London: Springer
International Publishing Switzerland .
Hancher D.E and Rowings I.E, 1981. Setting highway construction contract duration;.
Journal of construction engineering and management, Volume 107, pp. 169-179.

Hillson, D., 2002. Extending the risk process to manage opportunity. International
Journal of Project Management, Volume 20, pp. 235-240.
Kartam N.A and Kartam S.A , 2001. Risk and its management in Kuwaiti construction
industry: a Contractor’s perspective. International Journal of Project Management,
Volume 19, pp. 325-335.
Kerzner, H., 2009. Project Management, A Systems Approach to Planning, Scheduling
and Controlling. 10th ed. New Jersey: John Wiley & Sons.
K. J., 2017. MODEL PËR MENAXHIMIN E RISKUT NË PROJEKTET E MËDHA, PhD.
Tiranë: UPT AL.
Lester, A., 2014. Project Management, Planning, Managing Engineering, Construction,
and Manufacturing. AMSTERDAM: Elsevier Ltd.
Lock, D., 2013. Project Management. 10th Edition ed. s.l.:Gower.
Loosemore M, Raftery J, Reilly C and Higgon D, 2006. Risk management in projects.
2and ed. s.l.:Taylor and Francis.
Mark Saunders, P. L. A. T., 2009. Research methods for business students. 5 ed.
Harlow: Pearson Education Limited.
Naoum, S., 1998. Dissertation research and writing for construction student. s.l.:Reed
Educational and Professional Publishing ltd.
Navarre C and Schaan J.L, 1990. Design of project management system from top
management’s perspective. project management jour, Vol. 21(2), pp. 19-27.
Nicholas J.M and Steyn H, 2008. Project Management for business, engineering and
technology; Principles and practice. 3rd ed. s.l.:Butterworth-Heinemann.
Odeh A.M and Battaineh H.T, 2002. Causes of construction delay; Vol. 67-73; available
online at http://ac.els-cdn.com/S02. International journal of project Management;,
Volume 67-73.
Oztas A and Okmen O, 2004. Risk analysis in fixed-price design-build construction
projects. Building and Environment, Volume 39, pp. 229-237.
Parvan, K, Rahmandad H and Haghani A, 2015. Inter-phase feedbacks in construction
projects; Journal of operational management;. [Online]
Available at:

https://www.sciencedirect.com/science/article/abs/pii/S0272696315000637
[Accessed 12 may 2018].
PMBOK, 2008. A Guide of Project Management Body of Knowledge. 4th ed.
Pensylvania: Project Management Institute.
Robson, C., 2002. Real World Research: A Resource for Social Scientists and
Practitioner Researchers. Oxford: Blackwell.
Smith, N. J, Merna, T, and Jobling, P, 2006. Managing Risk in Construction Projects.
Oxford: Blackwell Science,.
Turner, R. J., 1992. The Handbook of Project-based Management: Improving the
Processes for Achieving Strategic Objectives. London: McGraw-Hill.
Turner, R. J., 2014. The handbook of project-based management; Leading strategic
change in organizations. 4th edition ed. s.l.:Mc Graw Hill Education..
Wysocki, R. K., 2009. Effective Project Management: Traditional, Agile, Extreme. 5th
edition ed. Indiana: Wiley Publishing, Inc., Indianapolis,.
Zou P.X.W, Zhang G and Wang J, 2007. understanding the key risk in construction
projects in China. International Journal of Project Management, Volume 25, pp. 601-
614.