masters in science of pharmacy school of pharmacy · 2017-08-11 · chapter 2: diabetes and the ......
TRANSCRIPT

Association Between Diabetes And Infection
by
© Waseem Abu-Ashour
A Thesis submitted to the
School of Graduate Studies
in partial fulfillment of the requirements for the degree of
Masters In Science Of Pharmacy
School Of Pharmacy
Memorial University of Newfoundland
May, 2016
St. John’s Newfoundland and Labrador

ii
ABSTRACT Background:
The objective of the study was to assess the association between diabetes and infection.
Methods:
A systematic review and meta-analysis was conducted to summarize and quantify the
association between diabetes and the risk of infections in the existing literature. Second, a
cohort study was done to estimate the association between diabetes and infections
occurring in primary care.
Results:
The systematic review and meta-analysis demonstrated that diabetes is associated with an
increased risk of infection. Results were generally consistent across types of infections.
Findings from the cohort study suggest that patients with diabetes have a small increased
risk of developing certain infections compared to patients without diabetes in primary
care.
Conclusion:
Diabetes is associated with an increased risk of infections. The relationship varies
according to type of infection present. However, more research is needed to determine the
implications of patient characteristics such as BMI and glycemic control on the risk of
infections.

iii
ACKNOWLEDGEMENTS I would first like to thank my supervisor Dr. John-Michael Gamble of the School of
Pharmacy here at Memorial University of Newfoundland. The door to Dr. Gamble’s
office was always open whenever I ran into a trouble or had a question about my research
or writing. He consistently allowed this paper to be my own work, but steered me in the
right the direction whenever he thought I needed it.
I would also like to thank my supervisory committee who were involved in my research
project: Dr. Laurie Twells of School of Pharmacy/Faculty of Medicine, and Dr. James
Valcour of Faculty of Medicine here at Memorial University of Newfoundland. Without
their guidance and input, this project could not have been successfully conducted.
Finally, I must express my very profound gratitude to my parents Dr. Mohammed Abu-
Ashour and Mrs. Heyam Abu-Ashour for providing me with unfailing support and
continuous encouragement throughout my years of study and through the process of
researching and writing this thesis. I would also like to mention my sisters for their
continuing support; Wesam, Raneem, Salam, Leen and Rand. This accomplishment
would not have been possible without all of them. Thank you.
Waseem Abu-Ashour.

iv
Table of Contents
Abstract.…………………………………………………………………………………...ii
Acknowledgements.………………………………………………………………………iii
Table of Contents…………………………………………………………………………iv
List of Tables……………………………………………………………………………...vi
List of Figures…………………………………………………………………………...viii
List of Symbols, Nomenclatures and Abbreviations……………………………………...ix
List of Appendices………………………………………………………………………..xi
Chapter 1: Introduction……………………………………………………………………1
1.1 Background……………………………………………………………………1
1.2 Objectives…………………………………………………………………….11
References………………………………………………………………………..14
Chapter 2: Diabetes and the Association of Infection: A Systematic Review and Meta-
Analysis of Observational Studies……………………………………………………….26
2.1 Introduction…………………………………………………………………..26
2.2 Methods………………………………………………………………………28
2.3 Results………………………………………………………………………..32
2.4 Discussion……………………………………………………………………37
2.5 Conclusion……………………………………………………………………41
References………………………………………………………………………..42
Chapter 3: Diabetes and the Occurrence of Infection in Primary Care: A Matched Cohort
Study………………………...............................................................................................70

v
3.1 Introduction…………………………………………………………………..70
3.2 Methods………………………………………………………………………72
3.3 Results………………………………………………………………………..76
3.4 Discussion……………………………………………………………………79
3.5 Conclusion……………………………………………………………………84
References………………………………………………………………………..85
Chapter 4: Summary …………………………………………………………………...104
4.1 Bradford Hill Considerations……………………………………………….105
4.2 Research and Clinical Implications…………………………………………110
4.3 Conclusion…………………………………………………………………..112
References………………………………………………………………………113

vi
List of Tables
Table 2.1: Study Characteristics of Observational Studies Evaluating the Association
Between Diabetes and Infection………………………………………………………….51
Table 2.2: Reported Infections in Included Studies ……………………………………..55
Table 2.3: Skin and Soft Tissue Infections……………………………………………….62
Table 2.4: Respiratory Tract Infections…………………………………………………..64
Table 2.5: Genitourinary Infections……………………………………………………...65
Table 2.6: Blood Infections………………………………………………………………66
Table 2.7: Viral Infections………………………………………………………………..67
Table 2.8: Head and Neck Infections…………………………………………………….67
Table 2.9: Gastrointestinal Infections……………………………………………………68
Table 2.10: Unspecified Infections………………………………………………………68
Table 3.1: Baseline Characteristics for 12,845 Patients With and Without Diabetes Over
4-year Period……………………………………………………………………………..96
Table 3.2: Proportion of New Infections in Patients with and without Diabetes Over 2
Follow-up Periods ……………………………………………………………………….98
Table 3.3: New Infections Per 100 Person-Years in Patients With and Without Diabetes
Over 2 Follow-up Periods ……………………………………………………………...100
Table 3.4: Odds Ratio (OR) Between Diabetes and Infection: Crude and Covariate-
Adjusted Results ……………………………………………………………………….101
Table 3.5: Odds Ratio (OR) Between Diabetes and Infection Over 1-Year Period: Crude
and Covariate-Adjusted Results ……..…………………………………………………102

vii
Table 3.6: Odds Ratio (OR) Between Diabetes and Any Infection Recurrence: Crude and
Covariate-Adjusted Results …………………….............................................................103

viii
List of Figures
Figure 2.1: Study Selection Process……………………………………………………...50
Figure 2.2 (A): Cohort Studies Crude Results Odds Ratio (OR) by Infection Type…….58
Figure 2.2 (B): Cohort Studies Adjusted Results Odds Ratio (OR) by Infection Type….59
Figure 2.2 (C): Case-Control Studies Crude Results Odds Ratio (OR) by Infection
Type………………………………………………………………………………………60
Figure 2.2 (D): Case-Control Studies Adjusted Results Odds Ratio (OR) by Infection
Type………………………………………………………………………………………61

ix
List of Symbols, Nomenclature or Abbreviations
aOR: Adjusted Odds Ratio
CCS: Case-Control Study
CI: Confidence Interval
cOR: Crude Odds Ratio
CPCSSN: Canadian Primary Care Sentinel Surveillance Network
CS: Cohort study
EMR: Electronic Medical Record
GI: Gastrointestinal
GU: Genitourinary
H&N: Head and Neck
HIV: Human Immunodeficiency Virus
I2: I-squared
ICD-9: International Classification Disease
IPA: International Pharmaceutical abstracts
IRR: Incidence Rate Ratio
MeSH: Medical Subject Heading
MOOSE: Meta-analysis in Observational Studies in Epidemiology
NL-CPCSSN: Newfoundland and Labrador Canadian Primary Care Sentinel Surveillance
Network
NOS: Newcastle-Ottawa Scale
PRISMA : Preferred Reporting Items for Systematic Reviews and Meta-analysis.

x
PY: Person-Year
RTI: Respiratory Tract Infection
SD: Standard Deviation
SSTI: Skin and Soft Tissue Infection

xi
List of Appendices
Appendix 2.A: Search Strategy ………………………………………………………...124
Appendix 2.B: Individual Study Characteristics ……………………………………….131
Appendix 2.C: Publication Bias Funnel Plots (1-8).……………………………………139
Appendix 3.A: Exposure and Outcome Case Definitions………………………………147
Appendix 3.B: Diagnostic Codes for Exclusions……………………………………….150
Appendix 3.C: Timeline for Subject Recruitment and Follow-up ……………………..151
Appendix 3.D: Case Definitions for Potential Confounders and Effect Modifiers …….152
Appendix 3.E: Odds Ratio (OR) of All Covariates for All Types of Infection………...155
Appendix 3.F: Odds Ratio (OR) of All Covariates for All Types of Infection 1-Year
Period……………………………………………………………………………………171

1
Chapter 1
Introduction
1.1 Background:
1.1.1 Burden of Diabetes Mellitus:
Diabetes mellitus is a serious chronic condition with potentially devastating
complications that affects all age groups worldwide. In the year 2015 more than 415
million people were diagnosed with diabetes mellitus globally. According to the
International Diabetes Federation (IDF) this number is expected to rise to more than 640
million people by the year 2040 (1). Canada is one of the countries that will be
significantly affected by this change. As of 2014, the estimated prevalence of diabetes in
Canada was 6.7% of the population reflecting over 2 million Canadians living with
diabetes (2).
Diabetes and its complications increase costs and service pressures on the healthcare
system. Among adults aged 20 to 49 years, those who had diabetes were 2 to 3 times
more likely to see a family physician or a specialist (2). Also, people with diabetes were 3

2
times more likely to require hospital admission in the preceding year with longer lengths
of stay compared to those without diabetes (2). People with diabetes are over 3 times
more likely to be hospitalized with cardiovascular disease, 12 times more likely to be
hospitalized with end stage renal disease(ESRD) and over 20 times more likely to be
hospitalized for a nontraumatic lower limb amputation compared to the general
population (2). Obesity, hypertension, and dyslipidemia are the most commonly
distinctive comorbidities associated with diabetes. However, there are other conditions
found at higher rates in people with diabetes; depression, obstructive sleep apnea, fatty
liver disease, cancer, fractures, cognitive impairment, low testosterone in men,
periodontal disease and hearing impairment (3). Diabetes is the sixth leading cause of
death in Canada (4). By 2050, the number of deaths directly attributable to diabetes in
Canada is likely to increase to almost 17,500 deaths annually (5).
1.1.2 Definition:
Diabetes mellitus is a metabolic disorder characterized by the presence of hyperglycemia
due to defective insulin secretion, defective insulin action or both (6). Diabetes is
associated with relatively specific long-term complications, due to persistence of
hyperglycemia, affecting several body organs mainly the nerves, kidneys, eyes, as well as
an increased risk for cardiovascular disease. Diabetes can be diagnosed based on glycated
hemoglobin (A1C) criteria, fasting plasma glucose, random plasma glucose, or a 2-hour
plasma glucose value after a 75 g oral glucose tolerance test (7,8).

3
1.1.3 Classification:
Diabetes can be classified into several categories. Type 1 diabetes encompasses diabetes
that is primarily a result of pancreatic beta cell destruction and is prone to ketoacidosis
(6). This form, previously called “insulin-dependent diabetes” or “juvenile-onset
diabetes,” accounts for 5–10% of diabetes (9). It includes cases due to an autoimmune
process and those for which the etiology of beta cell destruction is unknown.
Type 2 diabetes, previously referred to as “noninsulin- dependent diabetes” or “adult
onset diabetes,” accounts for 90–95% of all diabetes (9). Type 2 diabetes may range from
predominant insulin resistance with relative (rather than absolute) insulin deficiency to a
predominant secretory defect with insulin resistance (6). At least initially, and often
throughout their lifetime, these individuals may not need insulin treatment to survive.
Distinguishing between type 1 and type 2 diabetes is important because management
strategies differ, but it may be difficult at the time of diagnosis in certain situations.
Clinical judgment with safe management and ongoing follow-up is a prudent approach.
In the past, gestational diabetes was defined as any degree of glucose intolerance that was
first recognized during pregnancy (10), regardless of whether the condition may have
predated the pregnancy or persisted after the pregnancy. A more accurate definition was
undertaken. Gestational diabetes is diabetes diagnosed in the second or third trimester of
pregnancy that is not clearly overt diabetes. Women with diabetes in the first trimester
would be classified as having type 2 diabetes (9).
Other specific types include a wide variety of relatively uncommon conditions, primarily
specific genetically defined forms of diabetes or diabetes associated with other diseases or
drug use (6,9).

4
In 1997 and 2003, the Expert Committee on Diagnosis and Classification of Diabetes
Mellitus (10,11) recognized a group of individuals whose glucose levels did not meet the
criteria for diabetes but were too high to be considered normal. “Prediabetes” is a
practical and convenient term referring to impaired fasting glucose, impaired glucose
tolerance (12) or an A1C of 6.0% to 6.4%, each of which indicates an increased risk for
the future development of diabetes and its complications. Impaired fasting glucose and
impaired glucose tolerance should not be viewed as clinical entities in their own right but
rather risk factors for diabetes and cardiovascular disease. Impaired fasting glucose and
impaired glucose tolerance are associated with obesity (especially abdominal or visceral
obesity) (13), dyslipidemia with high triglycerides and/or low HDL cholesterol, and
hypertension.
1.1.4 Management Strategies:
People with type 1 diabetes require insulin for their survival. Standard treattment should
be treated with multiple injections (three to four injections per day of different types of
insulin) or a continuous subcutaneous insulin infusion system (14). Type 2 diabetes has
traditionally been treated in a stepwise manner, starting with lifestyle modifications (such
as diet and exercise) and later with pharmacotherapy. Several classes of oral agents are
available for clinical use. These mainly include insulin seceratgogues, insulin sensitizers,
and drugs that delay the absorption of carbohydrates from the gastrointestinal tract. Over
time, many patients with type 2 diabetes will require insulin therapy. There are currently

5
seven broad classes of antidiabetic drugs currently approved for use in Canada: Insulin,
Metformin, Sulfonylureas, Meglinides, α-Glucosidase Inhibitors, Thiazolidinediones,
Incretins and Sodium Glucose Cotransporter 2 Inhibitors (14,15).
1.1.5 Complications:
Diabetes is associated with significant dysfunction of numerous metabolic pathways,
which in the long run, will lead to complications that involve multiple systems of the
body. Cardiovascular disease is the major cause of morbidity and mortality for
individuals with diabetes. In fact, cardiovascular disease is the primary cause of death
among people with type 1 and type 2 diabetes (16-18).
Hypertension affects the vast majority of individuals with type 2 diabetes and many of
those with type 1 diabetes. (19) Diabetes is a considerable independent risk factors for
myocardial infarction. Compared to individuals without diabetes, patients with diabetes
have a 3-fold increased risk of acute coronary syndrome (20), and a 2-fold increased short
and long-term mortality (21-24). Estimates of risk of ischemic stroke in people with
diabetes range from a 2- to 3-fold increase in men and a 2- to 5-fold increase in women
(25,26). Diabetes also doubles the risk of stroke recurrence, and stroke outcomes are
significantly worse among patients with diabetes, with increased hospital and long-term
stroke mortality, more residual neurological and functional disability, and longer hospital
stays (27).
Heart failure, both systolic and diastolic, is also more prevalent in people with diabetes. It
is recognized that diabetes can cause heart failure independently of ischemic heart disease

6
by causing a diabetic cardiomyopathy (28). Epidemiological studies have shown that the
incidence of heart failure is 2- to 4-fold higher in people with diabetes compared to those
without diabetes (29,30).
Another common finding in people with diabetes is kidney disease. Up to half of patients
with diabetes demonstrate signs of kidney damage in their lifetime (31-33). Diabetes is
the leading cause of kidney disease in Canada (34). Diabetic retinopathy is the most
common cause of new cases of legal blindness in people of working age (35). Glaucoma,
cataracts, and other disorders of the eye occur earlier and more frequently in people with
diabetes. Previous data showed the prevalence rate of proliferative retinopathy to be 23%
in people with type 1 diabetes, 14% in people with type 2 diabetes and on insulin therapy,
and 3% in people receiving oral antihyperglycemic therapies (36). Neuropathy is yet
another common complication with diabetes. Detectable sensorimotor polyneuropathy
will develop within 10 years of the onset of diabetes in 40% to 50% of people with type 1
or type 2 diabetes (37). While clinical neuropathy is uncommon in people with type 1
diabetes within the first 5 years after the onset of diabetes, people with type 2 diabetes
may have neuropathy at the time of diagnosis (38). Foot complications are a major cause
of morbidity and mortality in persons with diabetes and contribute to increased healthcare
utilization and costs (39-41).
In addition to these comorbidities, diabetes is also associated with other diseases or
conditions at rates higher than those in people without diabetes (14). Erectile dysfunction
affects approximately 34% to 45% of men with diabetes(42). Recent reports describe up
to one-third of newly diagnosed men with diabetes have erectile dysfunction at
presentation (43), with upward of 50% of men having erectile dysfunction by year 6 after

7
diagnosis (44). Diabetes is associated with increased risk of cancers of the liver, pancreas,
endometrium, colon/rectum, breast, and bladder (45). Hip fracture risk is significantly
increased in both type 1 and type 2 diabetes in both sexes (46). Type 1 diabetes is
associated with osteoporosis, but in type 2 diabetes an increased risk of hip fracture is
seen despite higher bone mineral density (47). Other conditions have been reported to
occur more often in people with diabetes compared to people without, such as hearing
impairment (48), obstructive sleep apnea (49-51), fatty liver disease (52,53), cognitive
decline and dementia (54,55), as well as low testosterone levels in men (56). Such
coexisting conditions and dysglycemia associated with diabetes, and the various
treatments associated with these diseases, may also impact the susceptibility to infections
in patients with diabetes.
Diabetes not only increases an individual’s risk of numerous complications, it also
decreases their quality of life and life expectancy (5-10 years) (57). Furthermore, the
impact of living with diabetes extends to their families through economical and emotional
burden, and society as a whole which reflects in an increase in healthcare system
expidenture with 12% of global expidenture is spent on diabetes (>670 billion dollars)
(1,58).
1.1.6 Diabetes and Infection:
Infection is a significant complication in patients with diabetes, hence it contributes to the
morbidity, mortality and financial burden associated with the disease. For example, a
cohort study conducted in the United States that examined diabetes and risk related

8
mortality, found infection related deaths in patients with diabetes to be almost 3 times
higher than in patients without diabetes (59). Another study in Northern California,
compared one year medical care costs for people with diabetes to those without and found
that there was almost an excess cost of 5 million dollars spent due to infections (60).
In addition to an increased risk of infection-related morbidy and mortality, it has been
suggested that people with diabetes may be more susceptible to developing infections
compared to those without diabetes. Although some rare infections have been shown to
be more prevalent in people with diabetes, (e.g., pyelonephritis, malignant otitis externa,
mucormycosis, etc.) (61), the association between diabetes and incident common
infections is less clear.
Immunologic research has demonstrated several defects in host immune defense
mechanisms in people with diabetes. Phagocytic capabilities of neutrophils are adversely
affected by hyperglycemia, including impaired migration, phagocytosis, intracellular
killing, and chemotaxis (62,63). Besides generalized impairments of immunity, other
nonimmunologic, anatomically specific factors may contribute to an increased infection
risk. For example, macrovascular disease and microvascular dysfunction may result in
compromised local circulation leading to delayed response to infection and impaired
wound healing (64). Unawareness of lower extremity trauma due to sensory neuropathy
may result in inadequate attention to minor wounds and subsequent increased infection
risk. Incomplete bladder emptying due to autonomic neuropathy permits urinary
colonization by microorganisms, where high glucose concentration in the urine promotes
the growth of some microorganisms (65).

9
The difficulties associated with estimating the actual risk of infection in diabetic patients
are mainly due to the fact that diabetes is not solely a disturbance of glucose metabolism
but instead a chronic inflammatory condition characterized by multiple alterations in lipid
profiles and neuropathy as well as chronic vascular and renal diseases, with each of these
changes altering the response to pathogens (66,67). The biological mechanisms described
above are likely similar irrespective of the type of diabetes, especially in those with long
standing disease; however, it is possible that the association between diabetes and
infection may vary by etiology of diabetes.
Several studies have suggested that people with diabetes are at an increased risk of
infection-related mortality (68,69,70), however very few studies have explored the
relationship between diabetes and susceptibility to infections. Muller et al., conducted a
12 month cohort study measuring the increased risk of infections in adults with diabetes
compared to those without (71). The study concluded there was an increased risk of
infections (respiratory tract infection, urinary tract infection, skin and mucous membrane
infection) in patients with diabetes,. However, there are several limitations worth
mentioning. First the comparator group was patients without diabetes but with
hypertension. They argued that these patients formed a good comparator group due to the
need of regular check ups, providing regular follow up data compared to patients with
diabetes. Moreover, they state that there is no known link between hypertension and
infection. However, there is some evidence between cardiovascular disease and infection
(72-75). Second, the age cut-off for diabetes diagnosis was 35 years arguing that it’s 1-

10
2% in type diabetes potentially excluding younger patients with diabetes. Finally their
outcome only included 3 types of infections; urinary tract, respiratory tract, and skin and
mucous membrane infections.
Similarly Shah and Hux examined the association between diabetes and infection (68).
They quantified the risk of infections and the mortality attributed to infectious disease in
patients with diabetes. The risk ratio for infection in diabetics versus non-diabetics for
infections was 1.21 (99% CI 1.20 –1.22). However, the study used an administrative
dataset not primarily collected for research purposes and therefore missing critical
information on confounders (glycemic control, comorbidities, life style factors, body max
index, etc.). Also the study duration was only 1 year long.
Yet, not all studies agree on the presence of a relationship between diabetes and infection
(76-78). In a case-control study Lipsky et al studied risk factors for acquiring
pneumococcal infections in a general medical clinic. Diabetes was not shown to be
among the risk factors for pneumococcal infections (76). However, the authors do state
that the study population was not ideal considering them to be presumably high risk;
elderly, from lower socioeconomic strata, and having several chronic medical conditions.
Moreover, due to reliance on medical records, the study may have missed cases of
pneumococcal infections, and undetectable pneumococcal vaccinations because of poor
documentation. In another observational study, Dunkel et al examined risk factors for
stump infection after lower limb amputation (77). Similarly, diabetes was not considered
a risk factor for infection. However, what limits the extrapolation of the findings is that
the study population was taken from a single institution in high income country. In

11
addition, all patients were given a single dose of prophylaxis antibiotic before surgery.
The choice of antibiotic might differ between surgeons and if they treated patients with
diabetes differently. This may have affected the occurrence of the outcome.
Although previous studies suggest that certain infections are more common in patients
with diabetes, there still seems to be lack of current knowledge with regards to the
association of diabetes with certain types of infections, presence in primary care, and the
magnitude of this relationship. The focus of the current thesis is to address these
important points.
1.2 Objectives:
The aim of this thesis is to address the current knowledge gap described above
surrounding the relationship between diabetes (all types) and the risk of infection.
Infection will be classified according to anatomical location of infection (local or
generalized) and infectious agent (viral or bacterla/parasites). This will be achieved
through two studies. The first study will summarize the literature describing the
relationship between diabetes and the risk of infection using standard systematic review.
Furthermore, the findings from published studies will be pooled into a summary risk
estimate using standard meta-analysis techniques. The second study will estimate the

12
association between diabetes and the occurrence of infection within a primary care setting
using a cohort study design. It will focus on common infections within primary care
settings. Specific questions include:
Primary research question: What is the association between a new or current diagnosis of
diabetes and common infectious diseases compared to those without diabetes?
Secondary research questions: In a primary care setting, compared to non-diabetics, what
is the association between a new or current diagnosis of diabetes and the following
infectious diseases?
1. Head and neck infections
2. Respiratory tract infections
3. Gastrointestinal infections
4. Genitourinary tract infections
5. Skin and soft tissue infections
6. Musculoskeletal infections
7. Viral infections
Determining a relationship between exposure and outcome to be causal or non-causal is
crucial in epidemiological research. A group of conditions necessary to be present to
provide the evidence of a causal relationship from non-causal are known as Hill’s criteria

13
(79). The criteria are as follows; strength, consistency, specificity, temporality, biological
gradient, plausibility, coherence, experimental evidence and analogy. At the end of this
thesis, it will be determined if and how the results of both studies meet these criteria.

14
References:
1) International Diabetes Federation. IDF Diabetes Atlas. 5th ed. Brussels: International
Diabetes Federation, www.idf.org/diabetesatlas
2) Statistics Canada. CANSIM, table 105-0501 and Catalogue no. 82-221-X. Last
modified: 2015-06-17. http://www.statcan.gc.ca/tables-tableaux/sum-
som/l01/cst01/health53a-eng.htm
3) American Diabetes Association. Initial evaluation and diabetes management planning.
Sec. 3. In Standards of Medical Care in Diabetesd2015. Diabetes Care 2015;38
(Suppl.1):S17-S19.
4) Statistics Canada. Leading causes of death in Canada 2009;Catalogue no. 84-215-X.
http://www.statcan.gc.ca/pub/84-215-x/2012001/tbl/T001-eng.pdf .
5) Canadian Agency for Drugs and Technologies in Health. Optimal therapy report:
Current utilization of insulin products in Canada. Compus 2008;2:1-16.
6) Canadian Diabetes Association Clinical Practice Guidelines Expert Committee.
Goldenberg R, Punthakee Z. Definition, Classification and Diagnosis of Diabetes,
Prediabetes and Metabolic Syndrome. Can J Diabetes 2013;37:S8-S11.

15
7) American Diabetes Association. Diagnosis and classification of diabetes mellitus.
Diabetes Care 2014;37(Suppl.1):S81-S90.
8) The International Expert Committee. International Expert Committee report on the role
of the A1C assay in the diagnosis of diabetes. Diabetes Care 2009;32:1327-1334.
9) American Diabetes Association. Classification and diagnosis of diabetes. Sec. 2. In
Standards of Medical Care in Diabetesd2015. Diabetes Care 2015;38(Suppl.1):S8-S16.
10) The Expert Committee on the Diagnosis and Classification of Diabetes Mellitus.
Report of the Expert Committee on the Diagnosis and Classification of Diabetes Mellitus.
Diabetes Care 1997;20:1183-1197.
11) Genuth S, Alberti KG, Bennett P, et al. Expert Committee on the Diagnosis and
Classification of Diabetes Mellitus. Follow-up report on the diagnosis of diabetes
mellitus. Diabetes Care 2003;26:3160-3167.
12) American Diabetes Association. Diagnosis and classification of diabetes mellitus.
Diabetes Care 2012;35(Suppl.1):S64-71.
13) American Diabetes Association. Classification and diagnosis of diabetes. Diabetes
care 2015; 38(Suppl.1):S8-16.

16
14) Executive summary: Standards of medical care in diabetes--2013. Diabetes Care
2013;36(Suppl.1):S4-10.
15) Canadian Diabetes Association Clinical Practice Guidelines Expert Committee.
Harper W, Clement M, Goldenberg R et al. Pharmacologic Management of Type 2
Diabetes. Can J Diabetes 2013;S61-S68.
16) Roglic G, Unwin N, Bennett PH et al. The burden of mortality attributable to
diabetes: realistic estimates for the year 2000. Diabetes Care 2005;28:2130-2135.
17) Morrish N, Wang S, Stevens L et al. Mortality and causes of death in the WHO
Multinational Study of Vascular Disease in Diabetes. Diabetologia
2001;44(Suppl.2):S14-21.
18) Booth G, Rothwell D, Fung K et al. Diabetes and cardiac disease. In: Hux JE, Booth
G, Laupacis A. Diabetes in Ontario: An ICES Practice Atlas: Institute for Clinical
Evaluative Sciences; 2002;5.95-5.127.
19) Campbell N, Gilbert R, Leiter L, et al. Hypertension in people with type 2 diabetes:
update on pharmacologic management. Can Fam Physician 2011;57:997-1002.
20) Booth G, Kapral M, Fung K et al. Relation between age and cardiovascular disease in
men and women with diabetes compared with non-diabetic people: a population-based

17
retrospective cohort study. Lancet 2006;368:29-36.
21) Donahoe S, Stewart G, McCabe C, et al. Diabetes and mortality following acute
coronary syndromes. JAMA 2007;298:765-775.
22) Behar S, Boyko V, Reicher-Reiss H et al. Ten-year survival after acute myocardial
infarction: comparison of patients with and without diabetes. SPRINT Study Group.
Secondary Prevention Reinfarction Israeli Nifedipine Trial. Am Heart J 1997;133:290-
296.
23) Kumler T, Gislason GH, Kober L et al. Diabetes is an independent predictor of
survival 17 years after myocardial infarction: follow-up of the TRACE registry.
Cardiovasc Diabetol 2010;9:22.
24) Malmberg K, Yusuf S, Gerstein HC et al. Impact of diabetes on long-term prognosis
in patients with unstable angina and non-Q-wave myocardial infarction: results of the
OASIS (Organization to Assess Strategies for Ischemic Syndromes) Registry. Circulation
2000;102:1014-1019.
25) Karapanayiotides T, Piechowski-Jozwiak B, van Melle G et al. Stroke patterns,
etiology, and prognosis in patients with diabetes mellitus. Neurology 2004;62:1558e62.
26) Lehto S, Ronnemaa T, Pyorala K et al. Predictors of stroke in middle-aged patients

18
with non-insulin-dependent diabetes. Stroke 1996;27:63-68.
27) Idris I, Thomson GA, Sharma JC. Diabetes mellitus and stroke. Int J Clin Pract
2006;60:48e56.
28) Valle R, Bagolin E, Canali C et al. The BNP assay does not identify mild left
ventricular diastolic dysfunction in asymptomatic diabetic patients. Eur J Echocardiogr
2006;7:40-44.
29) Shimabukuro M, Higa N, Oshiro Y et al. Diagnostic utility of brain-natriuretic
peptide for left ventricular diastolic dysfunction in asymptomatic type 2 diabetic patients.
Diabetes Obes Metab 2007;9:323-329.
30) Galderisi M. Diastolic dysfunction and diabetic cardiomyopathy: evaluation by
Doppler echocardiography. J Am Coll Cardiol 2006;48:1548-1551.
31) Warram J, Gearin G, Laffel L et al. Effect of duration of type I diabetes on the
prevalence of stages of diabetic nephropathy defined by urinary albumin/creatinine ratio.
J Am Soc Nephrol 1996;7:930-937.
32) Reenders K, Nobel E, Hoogen H et al. Diabetes and its long-term complications in
general practice: a survey in a well-defined population. Fam Pract 1993;10:169-172.

19
33) Weir MR. Albuminuria predicting outcome in diabetes: incidence of
microalbuminuria in Asia-Pacific Rim. Kidney Int 2004;66:S38-39.
34) Canadian Institute for Health Information. Canadian Organ Replacement Register
Annual Report: Treatment of End-Stage Organ Failure in Canada, 2000 to 2009. Ottawa,
ON: Canada; 2011.
35) Kempen J, O’Colmain B, Leske M et al. The prevalence of diabetic retinopathy
among adults in the United States. Arch Ophthalmol 2004;122:552-563.
36) Klein R, Klein BE, Moss SE. Epidemiology of proliferative diabetic retinopathy.
Diabetes Care 1992;15:1875-1891.
37) Dyck P, Kratz K, Karnes J et al. The prevalence by staged severity of various types of
diabetic neuropathy, retinopathy, and nephropathy in a population based cohort: the
Rochester Diabetic Neuropathy Study. Neurology 1993;43: 817-824.
38) Singleton J, Smith A, Bromberg M. Increased prevalence of impaired glucose
tolerance in patients with painful sensory neuropathy. Diabetes Care 2001;24:1448-1453.
39) Boulton A, Armstrong D, Albert S et al. American Diabetes Association, American
Association of Clinical Endocrinologists. Comprehensive foot examination and risk
assessment: a report of the task force of the foot care interest group of the American

20
Diabetes Association, with endorsement by the American Association of Clinical
Endocrinologists. Diabetes Care 2008;31:1679-1685.
40) Davis W, Norman P, Bruce D et al. Predictors, consequences and costs of diabetes-
related lower extremity amputations complicating type 2 diabetes: the Freemantle
Diabetes Study. Diabetologia 2006;49:2634-2641.
41) O’Brien J, Patrick A, Caro J. Cost of managing complications resulting from type 2
diabetes mellitus in Canada. BMC Health Serv Res 2003;3:7.
42) Eardley I, Fisher W, Rosen RC et al. The multinational Men’s Attitudes to Life
Events and Sexuality study: the influence of diabetes on self-reported erectile function,
attitudes and treatment-seeking patterns in men with erectile dysfunction. Int J Clin Pract
2007;61:1446-1453.
43) Al-Hunayan A, Al-Mutar M, Kehinde EO et al. The prevalence and predictors of
erectile dysfunction in men with newly diagnosed with type 2 diabetes mellitus. BJU Int
2007;99:130-134.
44) Aversa A, Bruzziches R, Vitale C et al. Chronic sildenafil in men with diabetes and
erectile dysfunction. Expert Opin Drug Metab Toxicol 2007;3:451-464.
45) Suh S, Kim KW. Diabetes and cancer: is diabetes causally related to cancer? Diabetes

21
Metab J 2011;35:193-198.
46) Janghorbani M, Van Dam R, Willett W et al. Systematic review of type 1 and type 2
diabetes mellitus and risk of fracture. Am J Epidemiol 2007;166:495-505
47) Vestergaard P. Discrepancies in bone mineral density and fracture risk in patients
with type 1 and type 2 diabetes meta-analysis. Osteoporos Int 2007;18:427-444.
48) Bainbridge K, Hoffman H, Cowie C. Diabetes and hearing impairment in the United
States: audiometric evidence from the National Health and Nutrition Examination Survey,
1999 to 2004. Ann Intern Med 2008;149:1-10.
49) Li C, Ford ES, Zhao G et al. Prevalence of self reported clinically diagnosed sleep
apnea according to obesity status in men and women: National Health and Nutrition
Examination Survey, 2005-2006. Prev Med 2010;51:18-23.
50) West S, Nicoll D, Stradling J. Prevalence of obstructive sleep apnoea in men with
type 2 diabetes. Thorax 2006;61:945-950.
51) Foster G, Sanders M, Millman R et al. Sleep AHEAD Research Group. Obstructive
sleep apnea among obese patients with type 2 diabetes. Diabetes Care 2009;32:1017-
1019.

22
52) Clark J, Brancati F, Diehl A. The prevalence and etiology of elevated
aminotransferase levels in the United States. Am J Gastroenterol 2003;98: 960-967.
53) El-Serag H, Tran T, Everhart J. Diabetes increases the risk of chronic liver disease
and hepatocellular carcinoma. Gastroenterology 2004;126:460-468.
54) Cukierman T, Gerstein H, Williamson J. Cognitive decline and dementia in
diabetesdsystematic overview of prospective observational studies. Diabetologia
2005;48:2460-2469.
55) Biessels G, Staekenborg S, Brunner E et al. Risk of dementia in diabetes mellitus: a
systematic review. Lancet Neurol 2006;5:64-74.
56) Dhindsa S, Miller M, McWhirter C et al. Testosterone concentrations in diabetic and
nondiabetic obese men. Diabetes Care 2010;33:1186-1192.
57) Leal J, Gray A, Clarke P. Development of life-expectancy tables for people with type
2 diabetes. Eur Heart J 2009;30:834-839.
58) Zhang P, Zhang X, Brown J et al. Global healthcare expidenture on diabetes fro 2010
and 2030. Diabetes Res Clin Pract 2010;87:293-301.
59) Bertoni A, Saydah S, Brancati F. Diabetes and the risk of infection related mortality

23
in the U.S. Diabetes Care 2001;24:1044-1049.
60) Selby J, Ray G, Zhang D et al. Excess costs of medical care for patients with diabetes
in a managed care population. Diabetes Care 1997;20:1396-1402.
61) Knapp S. Diabetes and infection. Is There a link? A mini review. Gerontology
2013;59:99-104.
62) Valerius N, Eff C, Hansen N et al. Neutrophil and lymphocyte function in patients
with diabetes mellitus. Acta Med Scand 1982;211:463-467.
63) Delamaire M, Maugendre D, Moreno M et al. Impaired leucocyte functions in
diabetic patients. Diabet Med 1997;14:29-34.
64) Pecoraro R, Ahroni J, Boyko E et al. Chronology and determinants of tissue repair in
diabetic lower-extremity ulcers. Diabetes 1991;40:1305-1313.
65) Ellenberg M, Weber H. The incipient asymptomatic diabetic bladder. Diabetes
1967;16:331-335.
66) Donath M, Shoelson S. Type 2 Diabetes as an inflammatory disease. Nat Rev
Immunol 2011;11:98-107.

24
67) Wellen K, Hotamisligil G. Inflammation, stress and diabetes. J Clin Ivest
2005;115:1111-1119.
68) Shah B, Hux J. Quantifying the risk of infectious diseases for people with diabetes.
Diabetes Care 2003;26:510-513.
69) Emerging risk factors collaboration, Seshasai S, Kaptoge S et al. Diabetes mellitus,
fasting glucose, and risk of cause-specific death. N Engl J Med 2011;364;829-841.
70) Bertoni A, Saydah S, Brancati F. Diabetes and the risk of infection-related mortality
in the U.S. Diabetes Care 2001;24:1044-1049.
71) Muller L, Gorter K, Hak E et al. Increased risk of common infections in patients with
type 1 and type 2 diabetes mellitus. Clin Infect Dis 2005;41:281-288.
72) Libby P, Ridker P, Maseri A. Inflammation and atherosclerosis. Circulation
2002;105:1135-1143.
73) Ridker P. C-Reactive Protien and the risk of cardiovascular events among those at
intermediate risk. J Am Coll Cardiol 2007;49:2129-2138.
74) Zhu J, Nieto F, Horne B et al. Prospective Study of Pathogen Burden and Risk of

25
Myocardial Infarction or Death. Circulation 2001;103:45-51.
75) Desvarieux M, Demmer R, Jacobs D et al. Periodontal bacteria and hypertension: the
oral infections and vascular disease epidemiology study (INVEST). J Hypertens
2010;28:1413-1421.
76) Lipsky B, Boyko E, Inui T et al. Risk factors for acquiring pneumococcal infections.
Arch Intern Med 1986;146:2179-2185.
77) Dunkel N, Belaieff W, Assal M et al. Wound dehiscence and stump infection after
lower limb amputation: risk factors and association with antibiotic use. J Orthop Sci
2012;17:588-594.
78) Antonio N, Prieto D, Providencia L et al. Diabetes mellitus does not affect one-year
outcome after heart transplantation. Rev Port Cardiol 2010;29:205-220.
79) Hill AB. The environment and disease: association or causation? Proc R Soc Med
1965;58:295-300.

26
Chapter 2:
Diabetes and the Association of Infection: A Systematic Review
and Meta-Analysis of Observational Studies
2.1 Introduction
The International Diabetes Federation estimates that there were almost 400 million people
living with diabetes through out the world in 2014. The prevalence of diabetes is expected
to increase to more than 590 million people by the year 2035 (1). Well-known
complications of diabetes include microvascular (retinopathy, neuropathy, nephropathy)
and macrovascular (coronary heart disease, cerebrovascular disease, and peripheral
vascular disease) complications (2); however, there are numerous lesser-known
complications. For example, diabetes is associated with increased rates of certain
infection (3-5). Impairment of the immune system in people with diabetes such as
impaired phagocytic function may be responsible for this increased risk of infection,
although there is still some controversy around this relationship (4-8). Certain infections
are more prevalent in people with diabetes (9). Studies have indeed suggested that
individuals living with diabetes are at an increased risk of infection-related mortality

27
(10,11); this could explain why some physicians believe that patients with diabetes are
more susceptible to infections, and tend to admit these patients to the hospital (3).
However, not all studies support this association (12,13).
Although previous studies suggest that certain infections are more common in patients
with diabetes, there is still a lack of substantive evidence to document the magnitude of
this association. It is unclear whether diabetes is associated with an increase in the
incidence of infections. To our knowledge, there has not been an attempt to summarize
the existing evidence of the association between diabetes and infections, through a
systematic review and meta-analysis. The justification for this review is as follows; it will
help clarify the magnitude and precision of the effect; it will address gaps with regards to
the current state of knowledge about the association between diabetes and certain types of
infections; it will quanitify the heterogeneity among studies; and it will measure the
quality of existing evidence on this association. Therefore, we aimed to to provide a
rigourous summary of the evidence on the incidence of different types of infection (head
and neck, respiratory, gastrointestinal, genitourinary, skin and soft tissue, musculoskeletal
and viral) in patients with and without diabetes through conducting a comprehensive
systematic review and meta-analysis.

28
2.2 Methods
2.2.1 Study Design:
We evaluated the relationship between diabetes and incident infections by conducting a
systematic review and meta-analysis. The review was conducted according to Preferred
Reporting Items for Systematic Reviews and Meta-Analyses (PRISMA) and Meta-
analysis of Observational Studies in Epidemiology (MOOSE) guidelines during all stages
of design, implementation and reporting (14,15).
2.2.2 Eligibility Criteria:
This review included observational studies assessing the association between diabetes and
incident infections up to May 2014. Study designs that were eligible for inclusion were
cohort studies, case-control studies, nested case-control or case-cohort studies. Other
study designs such as systematic reviews and meta-analyses, case series, case reports, or
cross-sectional studies were excluded from this review. Studies were included if the
population studied was 18 years and older. Younger populations were excluded due to the
fact that the immune system of this category is still developing, and this could affect our
outcome of interest (16,17). Studies were required to report the number of incident
infections in patients with diabetes and in patients without diabetes. Classification of the
type of diabetes was based on the definition used in each study. Studies including any

29
type of diabetes were eligible including type 1 diabetes, type 2 diabetes, gestational
diabetes, other, and unspecified diabetes.
2.2.3 Outcomes:
Outcomes were categorized in the following categories: infection (non specific),
respiratory tract infections (RTI) (upper and lower), genitourinary tract infections (GU),
skin and soft tissue infections (SSTI), gastrointestinal infections (GI), head and neck
infections (H&N), viral infections, and any other infections not classified here. An
outcome was placed into one of these body system categories, unless was specified by the
study to be viral it was placed in the viral infection category.
2.2.4 Search Strategy:
The search strategy was carried out in collaboration with a research librarian experienced
in systematic reviews. The following biomedical databases were searched from inception
to December 31, 2013; PubMed, EMBASE, The Cochrane Library, International
Pharmaceutical Science, and Web of Science. MeSH and free-text terms were used to
search PubMed. EMTREE and free-text terms were used to search EMBASE. In
searching the Cochrane Library, MeSH terms were used as well as free-text terms to
capture items not indexed with MeSH. The remaining databases were searched using
free-text terms. The search was restricted to English language. See Appendix 2.A for a
sample of the search strategy.

30
2.2.5 Study Selection and Data Extraction:
Two independent reviewers screened titles and abstracts, and then went on to screen full
texts. Identification of relevant studies was through use of a standardized study
eligibility/relevance form. Discrepancies were resolved by consensus. If consensus was
not achieved, a third reviewer was consulted. Data was extracted by one reviewer using a
predesigned form information that included first author, contact details, journal citation,
year of publication, study design, funding, sample size, data set used, study location and
duration, duration of follow up, study population characteristics, statistical analysis used,
the study specific measure of association, and the type of exposure (Appendix 2.B). An
independent reviewer verified the accuracy of the extracted data.
2.2.6 Assessment of Risk of Bias:
The quality of the observational studies was appraised using the Newcastle-Ottawa
Quality Assessment Scale (NOS) (18) according to the procedures recommended in the
Cochrane Handbook of Systematic Reviews. One author assessed the methodological
quality of all the selected studies. The NOS includes a “star system” in which a study is
judged on three domains: selection of the study groups (four items); comparability of the
groups (two items); and ascertainment of either the exposure or outcome (three items). If
any item of NOS (for example, case definition or exposure ascertainment) is not reported,
a zero score is given. Studies score one star for each area addressed, with scores between
0 and 9 (the highest level of quality). As per the NOS scale, study quality was classified
according to the study score into poor (score 0-3), moderate (score 4-6) and high quality

31
(score 7-9).
2.2.7 Data Analysis:
For dichotomous outcome data, the results are expressed as odds ratio (OR) with
corresponding 95% confidence intervals (CI). For continuous outcome data, the results
are expressed as weighted mean difference (WMD) with 95% CIs, or as standardized
weighted mean difference if outcomes are conceptually the same but measured in
different ways.
As this review included only observational studies, we expected heterogeneity between
studies, results were pooled across these studies using a random effects model.
Heterogeneity was tested using the Chi-squared test and measured using the I-squared
test. The Chi-squared test evaluates the observed differences in the results and whether
they are compatible with chance alone. The I-squared test is used to quantify the
inconsistency across studies. Sensitivity analyses were undertaken to explore the
influence of different variables on the overall estimate of effect and as potential sources
of heterogeneity including: study design (cohort versus case-control studies), quality of
the study (low, moderate, high), sample size, patient characteristics, and exposure and
outcome. Moreover, funnel plots were generated to assess the potential for publication
bias. Analysis was conducted using Stata software (version 12.0).

32
2.3 Results
The study selection process is shown in Figure 1. There were a total of 345 studies: 243
cohort studies and 102 case-control studies. Most of the studies were conducted in North
America (55%) followed by Europe (29%). The mean age of the participants was 61
years and ranged from 26 to 80 years. Specific and unspecified infections were identified
from the included articles. Some studies reported a specific infection, while others
reported multiple infections. Of all infections measured in the analysis, almost 45% were
skin and soft tissue infections, followed by respiratory tract infections (9%) and
genitourinary infections (8%).
According to the Newcastle-Ottawa Quality Assessment Scale (NOS), most of the studies
(80.9%) included were of moderate quality (score 4-6). Other infections identified and
characteristics of the studies are provided in Table 1. Table 2 clarifies specific infections
reported by included studies. Types of infection with the odds ratio and 95%CIs found in
this review are presented in Figure 2 (A-D). Funnel plots to express publication bias are
shown in Appendix 2.C (1-8).
2.3.1 Skin and Soft Tissue Infections:
Our review found 176 studies (140 cohort studies, 36 case-control studies) that evaluated
the association between diabetes and skin and soft tissue infections (SSTI). The pooled
crude odds ratio (cOR) for an SSTI from cohort studies was 2.09 (95% CI 1.92-2.29),

33
with a comparable pooled adjusted odds ratio (aOR) of 2.16 (95% CI 1.95-2.39).
Substantial between-study heterogeneity as indicated by high I2 values was observed for
both crude and adjusted results (I2 = 91.8%, I2 = 95.3% respectively). As for case-control
studies, the cOR was 2.89 (95% CI 2.24-3.75), and the aOR was 2.61 (95% CI 2.17-3.13).
Heterogeneity was less for the crude result (I2 = 74.8%), and was not present for the
adjusted result (I2 = 0%). To decrease the heterogeneity between results, since skin and
soft tissue infections is a relatively broad category and based on the studies found, these
infections were categorized into surgical site infections (SSI) and other skin and soft
tissue infections. As shown in Table 2, the results showed a positive association with
diabetes, but heterogeneity was not decreased for the cohort studies for both groups (SSI:
cOR 2.09, 95% CI 1.90-2.31, I2 = 91.4%, aOR 2.33, 95% CI 2.03-2.67, I2 = 93.9%; Other
SSTI: cOR 2.22, 95% CI 1.67-2.95, I2 = 91.8%), and was less for the case-control studies
(SSI: cOR 3.12, 95% CI 2.37-4.11, I2 = 0%, aOR 2.62, 95% CI 2.15-3.20, I2 = 0%; Other
SSTI: cOR 1.69, 95% CI 1.05-2.72, I2 = 55.8%). Moreover, to lessen the marked
heterogeneity, the 2 subgroups were further divided. SSI was categorized according to
type of surgery into 9 categories. The results of each of these categories are shown in
Table 3.
2.3.2 Respiratory Tract Infections:
Meta-analyses of the 49 study results of respiratory tract infections (RTI) (cohort
studies=35, case-control studies=14) showed a positive association with diabetes. For
cohort studies the (cOR) was 1.46 (95% CI 1.32-1.61) with considerable heterogeneity (I2

34
= 84.9%), and the (aOR) was 1.35 (95% CI 1.28-1.43) with even higher heterogeneity (I2
= 97.8%). Case-Control studies showed a (cOR) 2.06 (95% CI 1.71-2.48), and (aOR)
1.62 (95% CI 1.37-1.92). Heterogeneity was high as well for crude and adjusted results
(I2 = 95%, and I2 = 85.9% respectively). Those infections were categorized into 3
subgroups; upper respiratory tract, lower respiratory tract and unspecified. Lower
respiratory tract infections were further classified into tuberculosis and pneumonia to
decrease the degree of heterogeneity between the studies. Details are shown in Table 4.
2.3.3 Genitourinary Tract Infections:
33 cohort studies found a cOR of 2.05 (95% CI 1.83-2.31, I2 = 92.4%) and an aOR of
1.61 (95% CI 1.42-1.83, I2 = 99.2%). Results of 11 case-control studies reported a cOR of
3.06 (95% CI 2.21-4.23, I2 = 81.2%), and an aOR of 2.42 (95% CI 1.61-3.66, I2 = 83.7%).
This group was divided into urinary and genital. Each of these categories was further
classified into subgroups (Table 5).
2.3.4 Blood-Stream Infections:
An association was apparent after adjustment between blood-stream infections and
diabetes. 31 cohort studies reported a cOR of 1.75 (95% CI 0.84-3.65, I2 = 99.7%) and an
aOR of 1.73 (95% CI 1.49-2.01, I2 = 94.2%). 10 case-control studies demonstrated a
higher association with a cOR of 2.77 (95% CI 2.24-3.42, I2 = 49.7%) and an aOR was
2.40 (95% CI 1.68-3.42, I2 = 71.7%). Blood stream infections were also grouped

35
according to type of patients (Table 6).
2.3.5 Viral Infections:
Viral infections included 14 studies (cohort studies=10, case-control studies=4). The
analysis of cohort studies revealed a cOR of 1.45 (95% CI 1.29-1.64, I2 = 66.9%) and an
aOR of 1.29 (95% CI 1.13-1.46, I2 = 97.7%). Case-control studies showed a cOR of 1.13
(95% CI 0.43-2.93, I2 = 99.9%) (Table 7).
2.3.6 Head and Neck Infections:
5 studies (cohort studies=3, case-control studies=2) reported head and neck infections
(H&NI). Cohort studies gave a cOR of 1.33 (95% CI 1.08-1.65, I2 = 29.9%), and an aOR
of 1.17 (95% CI 1.13-1.22, I2 = 45.4%). Case-control studies showed a cOR of 1.55 (95%
CI 0.22-11.10, I2 = 80.7%) (Table 8).
2.3.7 Gastrointestinal Infections:
There were 4 cohort studies and 6 case-control studies that reported a gastrointestinal
infection. Cohort studies suggested an inverse relationship with a cOR of 0.79 (95% CI
0.66-0.94, I2 = 0%), but the aOR was 1.48 (95% CI 1.40-1.57, I2 = 64.5%). However,
case-control studies showed a stronger association with a cOR of 2.44 (95% CI 1.26-4.71,
I2 = 89.9%) and an aOR of 3.61 (95% CI 2.94-4.43, I2 = 0%) (Table 9).

36
2.3.8 Bone Infections:
7 studies (cohort studies=5, case-control studies=2) reported bone infections. Cohort
studies gave a cOR of 2.43 (95% CI 1.48-3.99, I2 = 0%). There was insufficient data to
pool results for the case-control studies here.
2.3.9 Unspecified Infections:
There were 67 studies (cohort studies=52 studies, case-control=15 studies) that reported
infections with no specification of type as the outcome. The cOR was 1.91 (95% CI 1.64-
2.23, I2 = 90.3%) and aOR was 1.81 (95% CI 1.64-2.00, I2 = 99.6%) for cohort studies. As
for case-control, the cOR was 2.66 (95% CI 1.84-3.83, I2 = 73.7%) and aOR was 3.81
(95% CI 2.88-5.04, I2 = 0%). This was further analyzed according to types of patients
(Table 10).
2.3.10 Other infections:
The pooled cOR for the 2 case-control studies that reported zygomycosis was 8.21 (95%
CI 3.45-19.57, I2 = 0%).

37
2.4 Discussion
This quantitiative systematic review examined the association between diabetes and
different types of infections. A total of 345 observational studies were identified that
presented the existing evidence on the relationship between the diabetes and development
of an infection. A persistent positive association was found when examining various
classfications of infections and diabetes. The results from individual studies were
heterogeneous, which might reflect differences in study quality, the populations studied
and how diabetes and infection were measured.
Although the association between diabetes and the risk of developing different types of
infections has long been postulated (9,19-21), convincing quantitative evidence has been
lacking especially for common infections. In general a positive association between
diabetes and infections is biological plausible given that certain microorganisms are
known to be more common in patients with diabetes, mainly Staphylococcus, Group
A&B Streptococcus (22-25). Moreover, hyperglycemia decreases function of neutrophils
and monocytes by way of impaired chemotaxis, adherence, phagocytosis and other
immune system impairment (5-7,26-28).
Moveover, there may be other mechanisms at play that increase the risk of certain types
of infections in those with diabetes. Specifcally, diabetes is known to affect healing
(29,30), and hyperglycaemia affects coagulation and fibrinolytic function(31), lipid

38
metabolism and endothelial function (32,33) thereby leading to increased skin and soft
tissue infections. Persons with diabetes are also susceptible to pulmonary infections due
to an increased risk of aspiration secondary to gastroparesis, diminished cough reflex, and
higher rates of obstructive sleep apnea (34-36). Impaired lung functions in these patients
contribute to acquiring this type of infection as well (37,38). This impairment is believed
to involve microangiopathic changes in the basement membrane of pulmonary blood
vessels and respiratory epithelium, as well as non-enzymatic glycosylation of tissue
protein (39-42). Several factors are thought to predispose diabetic subjects to
genitourinary infections (19,20,43,44). Reduced sensitivity and altered distensibility of
the urinary bladder due to autonomic neuropathy can result in stagnation of urine and
higher rates of catheterization (45). Moreover, glycosuria can create a favourable
environment that promotes the growth of bacteria and yeast (e.g. Candida albicans)
growth (46-48). Additionally, glycosuria impairs phagocytosis, reducing the ability to
fight infection (49). People with diabetes may have increased susceptibility to blood
stream infections for several reasons. Co-existing morbidities, such as microvascular and
macrovascular complications, neuropathy, and diabetic foot disease play a role as well in
acquiring blood stream infections. A correlation of head and neck infections was also
linked to diabetes, where contributing factors involve higher salivary glucose, low
salivary pH, microangiopathy, and abnormal collagen metabolism (19,20,26,28,50,51).
The pathogenic link involves diabetes-induced changes in immune cell function causing.
It was demonstrated in this review that viral infections are linked to diabetes. The
association between diabetes and viral infections is supported by various diabetes specific
in vitro defects in innate and adaptive immunity, and studies that showed that long-

39
standing diabetes is often accompanied by impaired cell-mediated immunity, which
increases the risk to more severe and widespread infections. This could also be the case
for gastrointestinal infections and other types that were shown in the review.
Although infection was associated with diabetes across all types of infections, there was a
difference in magnitude of this association between these types of infections. Although
the reasons for these differences are unclear, there are several potential explanatory
factors. Certain infections (e.g., Head and Neck, Viral infecitons) had a small number of
studies limited the power to detect differences in infections. Another factor that might
play a role in this discrepancy is lack of information on type of diabetes, type of diabetic
medications, and duration of diabetes which might have affected the outcome.
It is important to note that most of the studies included in this review were of moderate
quality according to the risk of bias tool used. Furthermore, in an attempt to test for
publication bias funnel plots were generated. Most of these plots were asymmetrical (skin
and soft tissue, respiratory, genitourinary and blood-stream infections). Causes for
asymmetry in these plots could be due to differences in individual studies included in this
review; selection bias, true heterogeneity (size of effect differes according to study size,
intensity of intervention and differences in underlying risk factors), methodological
differences (poor analysis in smaller studies, inadequate analysis) and chance.

40
2.4.1 Strengths and Limitations:
To our knowledge, this is the first systematic review and meta-analysis that examines the
association between diabetes and different types of infection. Strengths of this systematic
review include a comprehensive search strategy, inclusion of patient important outcomes,
inclusion of studies with an explicit temporal relationship whereby diabetes preceeded the
infection, and a rigorous quality assessment of included studies. This review included a
large number of observational studies with both general and specific populations resulting
in a broad representation of the population at-risk, and may better reflect better the nature
and frequency of unintended effects experienced in clinical practice.
Despite these positive aspects, some limitations must be noted here. Observational studies
are methodologically challenging, difficult to interpret and susceptible to several types of
bias and confounding, mainly selection bias (referral bias, volunteer bias, loss to follow
up bias) and information bias (exposure ascertainment bias, outcome ascertainment bias).
Some epidemiological studies of diabetes have used self-reported assessments of
prevalent diabetes. Self reported measures of diabetes status have been previously shown
to be over 99% specific and 66% sensitive compared with medical records (52). In
addition, misclassification of patients with diabetes who did not know that they had the
disease to the referent group of participants without diabetes is highly likely given that
46% of the estimated prevalence of diabetes is in people with undiagnosed disease (1).
Another important limitation to understand is that some studies did not have diabetes
and/or infection as the primary exposure/outcome. None the less, the required information

41
needed to conduct our analysis was present in these studies.
The limitation of having a single reviewer assessing the quality of each study should be
recognized. However, 2 reviewers besides the main reviewer verified data extraction.
The heterogeneity found in this review was somewhat high. Heterogeneity was explored
across our results by grouping infections in several subtypes, and further grouping those
into subcategories. This grouping managed to decrease heterogeneity of our results.
Finally, only studies in English in the review were included as translation of texts was not
feasibile. However, our review managed to obtain over 340 studies. Although non-
English studies were not included, others have shown excluding non-English studies
appeared not to influence the results substantially (53,54).
2.5 Conclusion
In conclusion, our systematic review and meta-analysis quantified the association
between diabetes and several types of common infections. The strength and significance
of the association varied according to the type of infection studied. The knowledge
generated from this review will help further inform physicians and researchers toward the
best summary of evidence. However, more research is needed to explore the effects
patient characteristics such as classificaiton of diabetes, BMI, and glycemic control may
have on the risk of these types of infections.

42
References:
1) International diabetes federation atlas sixth edition:
http://www.idf.org/diabetesatlas/update-2014
2) Morrish N, Wang S, Stevens L, et al. Mortality and causes of death in the WHO
Multinational Study of Vascular Disease in Diabetes. Diabetologia 2001;44:S14-21.
3) Shah BR, Hux JE. Quantifying the risk of infectious diseases for people with diabetes.
Diabetes Care 2003;26:510-513.
4) Calvet HM, Yoshikawa TT. Infections in diabetes. Infect Dis Clin North Am
2001;15:407-421.
5) Pozzilli P, Leslie RDG. Infections and diabetes: mechanisms and prospects for
prevention. Diabet Med 1994;11:935-941.
6) Valerius NH, Eff C, Hansen NE, et al. Neutrophil and lymphocyte function in patients
with diabetes mellitus. Acta Med Scand 1982;211:463-467.
7) Delamaire M, Maugendre D, Moreno M, et al. Impaired leucocyte functions in diabetic
patients. Diabet Med 1997;14:29-34.

43
8) Balasoiu D, van Kessel KC, van Kats-Renaud HJ, et al. Granulocyte function in
women with diabetes and asymptomatic bacteriuria. Diabetes Care 1997;20:392-395.
9) Knapp S. Diabetes and infection. Is there a link? A mini review. Gerontology
2013;59:99-104.
10) Seshasai S, Kaptoge S, Thomson A et al. Diabetes mellitus, fasting glucose, and risk
of cause-specific death. N Engl J Med 2011;364;829-841.
11) Bertoni A, Saydah S, Bancati F. Diabetes and the risk of infection-related mortality in
the U.S. Diabetes Care 2001;24:1044-1049.
12) Kaplan V, Angus D, Grifiin M, et al. Hospitalization community-acquired pneumonia
in the elderly. Am J Respir Crit Care Med 2002;165:766-772.
13) Stegenga M, Vinvent JL, Vail G et al. Diabetes does not alter mortality or hemostatic
and inflammatory responses in patients with severe sepsis. Crit Care Med 2010;38;539-
545.
14) Moher D, Lebarati A, Tetzlaf J et al. Preferred reporting items for systematic reviews
and meta-analyses: the PRISMA statement. J Clin Epidemiol 2009;62;1006-1012.

44
15) Stroup D, Berlin J, Morton S et al. Meta-analysis of observational studies in
epidemiology, a proposal for reporting. JAMA 2000;283:2008-2012.
16) Kovarik, J, Siegrist, CA. Immunity in early life. Immunol Today 1998;19:150-152.
17) Duramad P, Tager I, Holland N. Cytokines and other immunological biomarkers in
children's environmental health studies. Toxicol Lett 2007;172:48-59.
18) The Newcastle-Ottawa Quality Assessment Scale (NOS):
http://www.ohri.ca/programs/clinical_epidemiology/oxford.asp
19) Peleg A, Weerarathna T, McCarthy J et al. Common infections in diabetes:
pathogenesis, management and relationship to glycemic control. Diabetes Metab Res Rev
2007;23:3-13.
20) Gupta S, Koirala J, Khardori R et al. Infections in diabetes mellitus and
hyperglycemia. Infect Dis Clin North Am 2007;21:617-638.
21) Shilling A, Raphael J. Diabetes, hyperglycemia, and infections. Best Pract Res Clin
Anesthesiol 2008;22:519-535.

45
22) Factor S, Levine O, Schwartz B et al. Invasive group A Streptococcal disease: risk
factors for adults. Emerg Infect Dis 2003;9:970-977.
23) Davies H, McGeer A, Schwartz B et al. Invasive group A Streptococcal infections in
Ontario, Canada. N Engl J Med 1996;335:547-554.
24) Ahluwalia A, Sood A, Sood A et al. Nasal Colonization with Staphylococcus aureus
in patients with diabetes mellitus. Diabet Med 2000;17:487-491.
25) Boyko E, Lipsky B, Sandoval R et al. NIDDM and prevalence of nasal
Staphylococcus aureus colonization. San Luis Valley Diabetes Study. Diabetes care
1989;12;189-192.
26) Loe H. Periodontal disease. The sixth complication of diabetes mellitus. Diabetes
Care 1993;16:329-334.
27) Grossi SG, Skrepcinski FB, DeCaro T, et al. Treatment of periodontal disease in
diabetics reduced glycated hemoglobin. J Periodontol 1997;68:713-719.
28) Tervonen T, Karjalainen K. Periodontal disease related to diabetic status. A pilot
study of the response to periodontal therapy in type 1 diabetes. J Clin Periodontol
1997;24:505-510.

46
29) Porter J, Baur G, Taylor L. Lower-extremity imputations for ischemia. Arch Surg
1981;116:89-92.
30) Gibran N, Jang Y-C, Isik F et al. Diminished neuropeptide levels contribute to the
impaired cutaneous healing response associated with diabetes mellitus. J Surg Res
2002;108:122-128.
31) Carr M. Diabetes mellitus a hypercoagulable state. J Diabetes Complications
2001;15:44-54.
32) Williams S, Goldfine A, Timimi F et al. Acute hyperglycemia attenuates endothelium
dependent vasodilation in humans in vivo. Circulation 1998;97:1695-1701.
33) Ammar R, Gutterman D, Brooks L et al. Free radicals mediate endothelial
dysfunction of coronary arterioles in diabetes. Cardiovasc Res 2000;47:595-601.
34) Incalzi R, Fuso L, Giordano A et al. Neuroadrenergic Denervation of the lung in type
1 diabetes mellitus complicated by autonomic neuropathy. Chest 2002;121:443-451.
35) American Diabetes Association. Initial evaluation and diabetes management
planning. Sec. 3. In Standards of Medical
Care in Diabetes 2015. Diabetes Care 2015;38(Suppl.1):S17-S19.

47
36) Su V, Lui CJ, Wang HK et al. Sleep apnea and risk of pneumonia: a nationwide
population-based study. CMAJ 2014;186: 415-421.
37) Farina J, Furio V, Fernandez-Acenero et al. Nodular fibrosis of the lung in diabetes
mellitus. Virchows Arch 1995;427:61-63.
38) Watanabe K, Senju S, Toyoshima H et al. Thickness of the basement membrane of
bronchial epithelial cells in lung diseases as determined by transbronchial biopsy. Respir
Med 1997;91:406-410.
39) Sandler M, Bunn A, Stewart R. Cross-section study of pulmonary function in patients
with insulin-dependent diabetes mellitus. Am Rev Respir Dis 1987;135:223-229.
40) Hsia C, Raskin P. The diabetic lung: relevance of alveolar microangiopathy for the
use of inhaled insulin. Am J Med 2005;118:205-211.
41) Rosenstock J, Friberg T, Raskin P. Effect of glycemic control on microvascular
complications in patients with type 1 diabetes mellitus. Am J Med 1986;81:1012-1018.
42) Reichard P, Berglund B, Britz A et al. Intensified conventional insulin treatment
retards the microvascular complications of insulin-dependent diabetes mellitus (IDDM):
the Stockholm diabetes intervention study (SDIS) after 5 years. J Intern Med
1991;230:101-108.

48
43) Rayfield EJ, Ault MJ, Keusch GT et al. Infection and diabetes: the case for glucose
control. Am J Med 1982; 72:439–450.
44) Patterson JE, Andriole VT. Bacterial urinary tract infections in diabetes mellitus.
Infect Dis Clin North Am 1997;11:735-750.
45) Hosking DJ, Bennett T, Hampton JR. Diabetic autonomic neuropathy. Diabetes Care
1978;27:1043-1054.
46) Wilson RM, Tomlinson DR, Reeves WG. Neutrophil sorbitol production impairs
oxidative killing in diabetes. Diabet Med 1987;4:37-40.
47) Hostetter MK. Handicaps to host defense. Effects of hyperglycemia on C3 and
Candida albicans. Diabetes 1990;39:271-2755.
48) Segal E, Soroka A, Schechter A. Correlative relationship between adherence of
Candida albicans to human vaginal epithelial cells in vitro and candidal vaginitis.
Sabouraudia 1984;22:191-200.
49) Ellenberg M, Weber H. The incipient asymptomatic diabetic bladder. Diabetes 1967;
16:331-335.

49
50) Finney LS, Finney MO, Gonzalez-Campoy JM. What the mouth has to say about
diabetes. Careful examinations can avert serious complications. Postgrad Med
1997;102:117-126.
51) Seppala B, Sorsa T, Ainamo J. Morphometric analysis of cellular and vascular
changes in gingival connective tissue in long-term insulin-dependent diabetes. J
Periodontol 1997;68:1237-1245.
52) Okura Y, Urban LH, Mahoney DW et al. Agreement between self-report
questionnaires and medical record data was substantial for diabetes, hypertension,
myocardial infarction and stroke but not for heart failure. J Clin Epidemiol 2004;57:1096-
103.
53) Morrison A, Moulton K, Clark M et al. English language restriction when conducting
systematic reviews-based meta-analyses: systematic review of published studies.
Canadian Agency for Drugs and Technologies in Health (CADTH) 2009.
54) Moher D, Pham B, Klassen T et al. What contributions do languages other than
English make on results of meta-analyses. J Clin Epidemiol 2000;53:964-972.

50
TotalNumberofReferencesIdentifiedN=10,162
DuplicatesRemovedN=3,238
Titles&AbstractsScreenedAgainstInclusionCriteria
N=6,924
ArticlesExcludedIneligibleStudyDesign=1,027IneligiblePopulation=247InappropriateExposure/Outcome=4868
FullTextsscreened1stReviewer
N=782
ArticlesExcludedIneligibleStudyDesign=115IneligiblePopulation=15Comparison=202InappropriateExposure=14InappropriateOutcome=153NotEnglish=83Duplicate=5Retraction=1NotFound=1
FullTextArticlesIncludedN=193
ArticlesExcludedIneligibleStudyDesign=781IneligiblePopulation=422InappropriateExposure/Outcome=4850NotEnglish=491
FullTextsscreened1stReviewer
N=869
ArticlesExcludedIneligibleStudyDesign=44IneligiblePopulation=39Comparison=245InappropriateExposure=19InappropriateOutcome=161NotEnglish=6Duplicate=5NotFound=7
FullTextArticlesIncludedN=343
DuplicatesN=191
TotalFullTextArticlesIncluded
N=345
FirstReviewerSecondReviewer
Figure 1: Study Selection Process

51
Table 1: Study Characteristics of Observational Studies Evaluating the Association
Between Diabetes and Infection
CHARACTERISTICS COHORT
STUDIES
N=243
CASE-
CONTROL
STUDIES
N=102
Total N=345
Year of Study, n(%)
<1990
1990-1994
1995-1999
2000-2004
2005-2009
2010-2014
4 (1.6)
8 (3.3)
8 (3.3)
33 (13.6)
64 (26.3)
126 (51.8)
1 (0.98)
4 (3.9)
12 (11.8)
20 (19.6)
34 (33.3)
31 (30.4)
5(1.4)
12(3.5)
20(5.8)
53(15.4)
98(96.1)
157(45.5)
Mean Age (range),
no. of Studies
61.9 (28-80),
n=172
55.9 (26-76),
n=54
61 (26-80),
n=226
Sex N%, no. of Studies (n)
Male
16,615,301
(48.2)
763,173
(52)
17,378,474
(48.3)

52
Female
17,852,673
(51.8),
n=221
703,693
(48),
n=82
18,556,366
(51.7),
n=303
Mean Follow up (yrs),
no. of Studies
4.4,
n=70
N/A 4.4,
n=70
Setting, n(%)
Hospital
Clinic
Hospital & Clinic
Long term facilities
216 (88.9)
18 (7.4)
8 (3.3)
1 (0.4)
85 (83.3)
11 (10.8)
5 (4.9)
1(1)
301 (87.2)
29 (8.4)
13 (3.8)
2 (0.6)
Region, n(%)
Europe
Asia
North America
South America
Africa
62 (25.5)
61 (25.1)
111 (45.7)
7 (2.9)
2 (0.8)
38 (37.2)
18 (17.6)
44 (43)
2 (2)
0 (0)
100 (29)
79 (22.9)
155 (44.9)
9 (2.6)
2 (0.6)
Population, n(%)
General population
71 (29.2)
54 (53)
125 (36.2)

53
Cardiovascular Disease
Bone Disease
Kidney Disease
Malignancy
Gastrointestinal Disease
Spine Disease
Organ Transplant
Genitourinary Disease
Critically Ill
Pregnancy
Burn
Ophthalmologic
Respiratory Disease
Obesity
Breast Reconstruction
Autoimmune Disease
72 (29.6)
16 (6.6)
17 (7)
14 (5.8)
10 (4.1)
10 (4.1)
7 (2.9)
8 (3.3)
4 (1.6)
4 (1.6)
3 (1.2)
0 (0)
2 (0.8)
1 (0.4)
3 (1.2)
1(0.4)
18 (17.6)
7 (6.9)
4 (3.9)
2 (2)
3 (2.9)
2 (2)
4 (3.9)
1 (1)
5 (4.9)
0 (0)
0 (0)
2 (2)
0 (0)
0 (0)
0 (0)
0 (0)
90 (26.1)
23 (6.7)
21 (6.1)
16 (4.6)
13 (3.8)
12 (3.5)
11 (3.2)
9 (2.6)
9 (2.6)
4 (1.2)
3 (0.9)
2 (0.6)
2 (0.6)
1 (0.3)
3 (0.9)
1 (0.3)
Outcome, n(%)
Unspecified Infections
Skin and Soft Tissue Infections
Respiratory Tract Infections
Genitourinary Infections
36 (14.8)
114 (46.9)
17 (7)
18 (7.4)
12 (11.8)
36 (35.3)
14 (13.7)
11 (10.8)
48 (13.9)
150 (43.5)
31 (9)
29 (8.4)

54
Gastrointestinal Infections
Head & Neck Infections
Blood Infections
Viral Infections
Bone Infections
Other Infections
Multiple Infections
1 (0.4)
1 (0.4)
16 (6.6)
7 (2.9)
2 (0.8)
1 (0.4)
30 (12.3)
6 (5.9)
2 (2)
10 (9.8)
4 (3.9)
2 (2)
4 (3.9)
1 (1)
7 (2)
3 (0.9)
26 (7.5)
11 (3.2)
4 (1.2)
5 (1.4)
31 (9)
Newcastle-Ottawa Scale
(NOS), n(%)
Weak (score 0-3)
Moderate (score 4-6)
Strong (score 7-9)
0 (0)
197 (81)
46 (19)
0 (0)
82 (80.4)
20 (19.6)
0 (0)
279 (80.9)
66 (19.1)

55
Table 2: Reported Infections in Included Studies
Type of Infection Study Reported Infections
Skin and Soft
Tissue
Surgical site=148
Unspecified=15
Peritonitis=7
Burn=3
Cellulitis=2
Erysipelas=2
Scabies=1
Respiratory Pneumonia=29
Tuberculosis=19
Unspecified=5
Genitourinary Urinary=46:
Unspecified=34
Bacteruria=3
Cystitis=3
Pyelonephritis=3
Prostatitis=1
Urethritis=1

56
Renal Abscess=1
Genital=10:
Unspecified=4
Balanitis=1
Vaginitis=2
Chorioamenionitis=1
Endometritis=1
Vaginal Candidiasis=1
Gastrointestinal Clostridium Difficile Associated Diarrhea=3
Liver Abscess=2
Diarrhea=1
Gastroenteritis=1
Enteric=1
Salmonellosis=1
Biliary tree=1
Unspecified=1
Head and Neck Endophalmitis=3
Otitis Externa=2
Otitis Media=1

57
Mastoditis=1
Musculoskeletal Osteomyelitis=5
Joint=3
Viral Herpes Zoster=8
Herpes Simplex=2
Influenza=2
Hepatitis=2
Human Papilloma=1
Human Immunodeficiency Disease=1
Unspecified=1
Other Zygomycosis=3
Cardiovascular=2
Unspecified=2

58
Figure 2 (A): Cohort Studies Crude Results Odds Ratio (OR) by Infection Type:

59
Figure 2 (B): Cohort Studies Adjusted Odds Ratio (OR) Results by Infection Type:

60
Figure 2 (C): Case-Control Studies Crude Odds Ratio (OR) Results by Infection
Type:

61
Figure 2 (D): Case-Control Studies Adjusted Odds Ratio (OR) Results by Infection
Type:

62
Table 3: Skin and Soft Tissue Infections:
Subgroup Study
Design
No of
Studies
Crude OR
(95% CI)
I2 No of
Studies
Adjusted OR
(95% CI)
I2
Surgical site
Infections
Cohort 105 2.09 (1.90-2.31) 91.4% 56 2.02 (1.82-2.24) 86.4%
Case-
Control
30 3.12 (2.37-4.11) 0%
14 2.62 (2.15-3.20) 0%
General
Surgery
Cohort 17 1.66 (1.19-2.31) 94.7% 6 1.65 (1.20–2.28) 72.2%
Case-
Control
5 4.28 (1.14-
16.12)
94.9% 2 2.11 (1.37–3.26) 0%
Cardiovascular
Surgery
Cohort 44 2.20 (1.93-2.50) 59.9% 29 2.08 (1.85–2.35) 75.3%
Case-
Control
15 2.71 (2.20-3.33) 18.2% 7 2.76 (2.13–3.57) 0%
Orthopedic
Surgery
Cohort 16 2.50 (1.90-3.30) 73.0% 8 1.96 (1.16–3.34) 74.9%
Case-
Control
4 2.45 (1.66-3.62) 0% 2 2.32 (1.37–3.94) 0%
Spine Surgery Cohort 12 3.03 (1.80-5.12) 87.0% 6 2.14 (1.44–3.18) 25.9%
Case-
Control
5 4.24 (2.57-7.00) 0% 3 4.15 (1.99–8.66) I2=0%
Skin Surgery Cohort 3 1.65 (0.88-3.06) 51.3% 3 1.51 (1.07–2.13) 43.3%
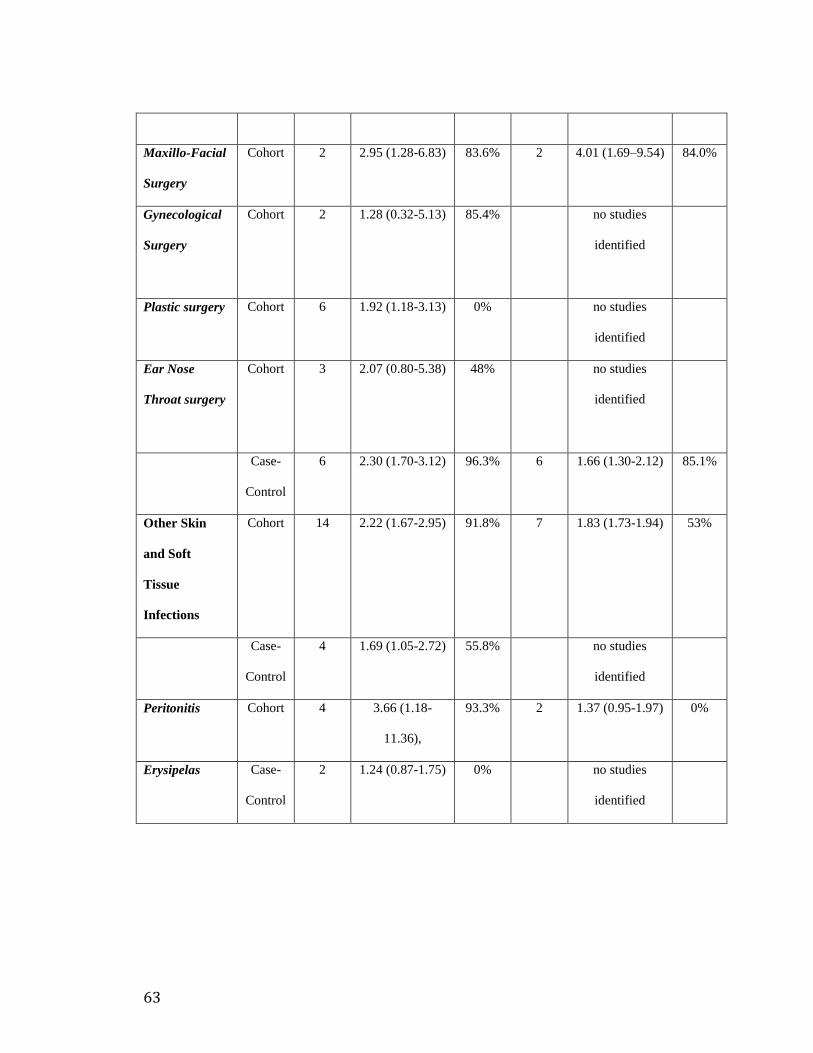
63
Maxillo-Facial
Surgery
Cohort 2 2.95 (1.28-6.83) 83.6% 2 4.01 (1.69–9.54) 84.0%
Gynecological
Surgery
Cohort 2 1.28 (0.32-5.13) 85.4% no studies
identified
Plastic surgery Cohort 6 1.92 (1.18-3.13) 0%
no studies
identified
Ear Nose
Throat surgery
Cohort 3 2.07 (0.80-5.38) 48% no studies
identified
Case-
Control
6 2.30 (1.70-3.12) 96.3%
6 1.66 (1.30-2.12) 85.1%
Other Skin
and Soft
Tissue
Infections
Cohort 14 2.22 (1.67-2.95) 91.8%
7 1.83 (1.73-1.94) 53%
Case-
Control
4 1.69 (1.05-2.72) 55.8% no studies
identified
Peritonitis Cohort 4 3.66 (1.18-
11.36),
93.3%
2 1.37 (0.95-1.97) 0%
Erysipelas Case-
Control
2 1.24 (0.87-1.75) 0%
no studies
identified

64
Table 4: Respiratory Tract Infections:
Subgroup Study
Design
No of
Studies
Crude OR
(95% CI)
I2 No of
Studies
Adjusted OR
(95% CI)
I2
Upper
Respiratory
Tract
Infections
Cohort no studies
identified
1 1.18 (1.17-1.19) 0%
Lower
Respiratory
Tract
Infections
Cohort 30 1.45 (1.32-1.61) 83.4% 14 1.35 (1.28-1.43) 78.7%
Case-
Control
12 2.06 (1.71-2.50) 95.3% 10 1.60 (1.35-1.89) 86.7%
Tuberculosis Cohort 10 1.35 (1.18-1.56) 84.3% 9 1.31 (1.20–1.42) 60%
Case-
Control
7 2.42 (1.86-3.15) 95.0% 6 1.86 (1.44-2.41) 87.1%
Pneumonia Cohort 19 1.53 (1.29-1.83) 82.8% 6 1.43 (1.36-1.51) 70.1%
Case-
Control
6 1.61 (1.27-2.04) 78.9% 4 1.26 (1.21-1.31) 0%
Unspecified
Respiratory
Tract
Infections
Cohort 2 1.50 (0.56-4.05) 85.7% no studies
identified

65
Table 5: Genitourinary Infections:
Subgroup Study
Design
No of
Studies
Crude OR
(95% CI)
I2 No of
Studies
Adjusted OR
(95% CI)
I2
Genital
Infections
Cohort 5 2.06 (1.20-3.52) 84.3% 4 1.41 (1.14-1.74) 98.6%
Male
Cohort 2 3.47 (2.93-4.11) 0% 2 1.28 (1.01-1.64) 98.8%
Female
Cohort 3 1.57 (0.60-4.14) 89.6% 3 1.49 (1.17-1.91) 92.6%
Urinary
Infections
Cohort 25 2.00 (1.79-2.23) 90.9% 11 1.75 (1.52-2.00) 99.0%
Case-
Control
9 3.06 (2.21-4.23) 81.2% 7 2.59 (1.60-4.17) 86.0%
Urinary Tract
Infections
Cohort 23 1.99 (1.77-2.24) 91.1% 9 1.49 (1.30-1.72) 98.8%
Case-
Control
8 2.98 (2.12-4.19) 82.7% 6 2.45 (1.48-4.05) 87.4%
Renal
Infections
Cohort no studies
identified
2 2.40 (1.55-3.71) 98.4%
Bacteriuria Cohort 3 1.94 (1.77-2.13)
0% 2 1.81 (1.66-1.97) 0%
Unspecified Cohort 2 1.55 (1.11-2.18) 0% no studies
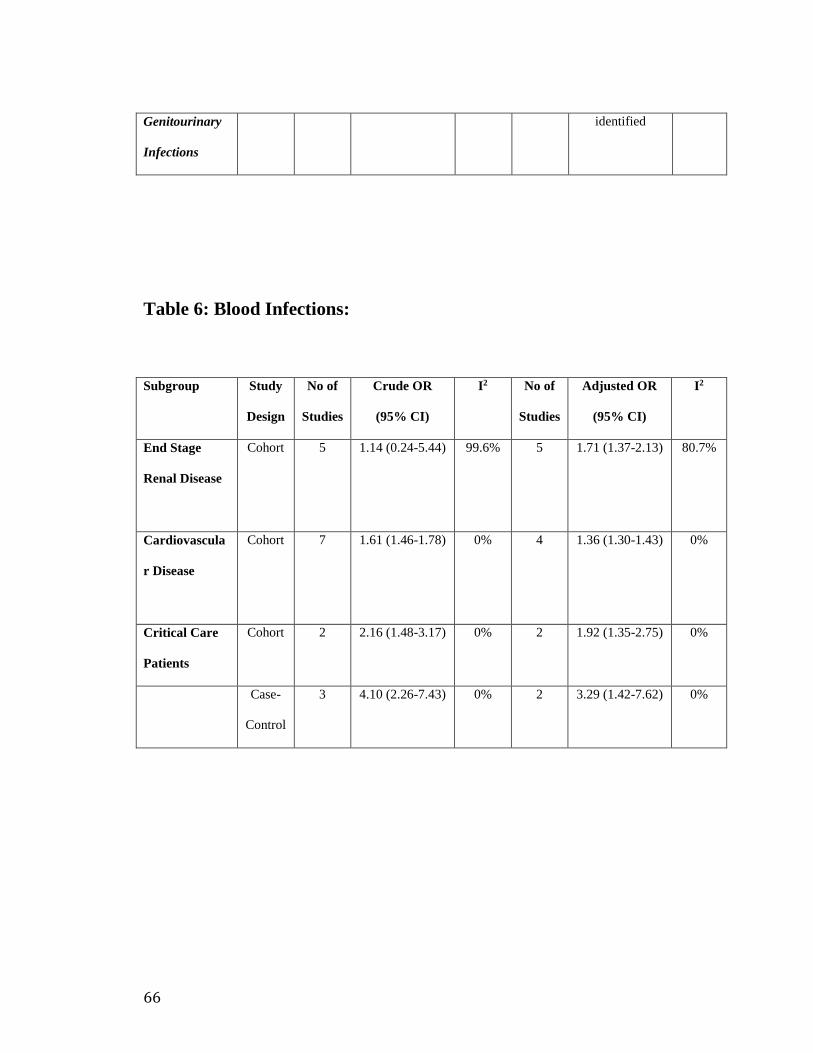
66
Genitourinary
Infections
identified
Table 6: Blood Infections:
Subgroup Study
Design
No of
Studies
Crude OR
(95% CI)
I2 No of
Studies
Adjusted OR
(95% CI)
I2
End Stage
Renal Disease
Cohort 5 1.14 (0.24-5.44) 99.6% 5 1.71 (1.37-2.13) 80.7%
Cardiovascula
r Disease
Cohort 7 1.61 (1.46-1.78) 0% 4 1.36 (1.30-1.43) 0%
Critical Care
Patients
Cohort 2 2.16 (1.48-3.17)
0% 2 1.92 (1.35-2.75) 0%
Case-
Control
3 4.10 (2.26-7.43) 0% 2 3.29 (1.42-7.62)
0%

67
Table 7: Viral Infections:
Subgroup Study
Design
No of
Studies
Crude OR
(95% CI)
I2 No of
Studies
Adjusted OR
(95% CI)
I2
Herpes Zoster
(shingles)
Cohort 2 1.39 (1.34-1.43) 0% 4 1.42 (1.20-1.69) 97.2%
Case-
Control
3 0.96 (0.32-2.90) 99.9% no studies
identified
Table 8: Head and Neck Infections:
Subgroup Study
Design
No of
Studies
Crude OR
(95% CI)
I2 No of
Studies
Adjusted OR
(95% CI)
I2
Endophalmitis
Case-
Control
2 1.55 (0.22-
11.10)
80.7% no studies
identified

68
Table 9: Gastrointestinal Infections:
Subgroup Study
Design
No of
Studies
Crude OR
(95% CI)
I2 No of
Studies
Adjusted OR
(95% CI)
I2
Clostridium
Difficile
Associated
Disease
(CDAD)
Case-
Control
3 1.66 (0.72-3.86) 86.6% no studies
identified
Table 10: Unspecified Infections:
Subgroup Study
Design
No of
Studies
Crude OR
(95% CI)
I2 No of
Studies
Adjusted OR
(95% CI)
I2
Cardiovascula
r Disease
Cohort 15 1.92 (1.50-2.46) 92.6% 7 1.83 (1.40-2.41) 82.5%
Bone Disease
Cohort 4 1.69 (0.82-3.48) 83.2% 3 1.37 (0.93-2.00) 46.7%
End Stage
Renal Disease
Cohort 2 1.91 (1.35-2.68) 0% 1 1.36 (1.21-1.52) 88.3%
Organ
Transplant
Cohort 2 5.42 (2.10-
14.02)
66.4% no studies
identified

69
Case-
Control
no studies
identified
2 6.90 (3.02-
15.78)
0%
Cancer Cohort 4 2.23 (1.23-4.04) 69.2% no studies
identified
Critical Care
Patients
Case-
Control
2 2.30 (0.37-
14.23)
79.2% no studies
identified

70
Chapter 3:
Diabetes and the Occurrence of Infection in Primary Care: A
Matched Cohort Study
3.1 Introduction
In 2014, the International Diabetes Federation estimated that over 385 million people
were diagnosed with diabetes globally, and this number is expected to increase to more
than 595 million people in the year 2035 (1). In Canada, the estimated prevelance of
people with diabetes was 6.7% of the total population in 2014 (2). By 2019, that number
is expected to grow to 3.7 million (2). Although diabetes is associated with chronic
complications of the microvasculature and microvasculature (3) other non-traditional
complications including connective tissues disorders and impaired immunity are
becoming increasingly recognized (4).
Infection is a relatively frequent reason for hospitalization or a physician office visit in
people with diabetes. In fact, 40% of all people with diabetes have at least one physician

71
claim, and nearly 6% have at least one hospitalization for an infectious disease each year
(5). Moreover, infectious disease contributes to substantial financial costs in people with
diabetes. A study that was done in North California estimated the proportion of costs
spent on treating the complications associated with all types of diabetes across different
age groups (<19->65 years). Costs were categorized into inpatient care, outpatient care
(primary care, speciality, emergency, non-physician care), pharmacy and out of plan
refferals and claims. They found that there was almost an excess cost of 5 million dollars
spent due to infections over one year for people with diabetes compared to people without
diabetes (6).
People with diabetes may be more susceptible to infectious disease than those without
diabetes. Immunologic research has demonstrated several defects in host immune defense
mechanisms in people with diabetes. Phagocytic capabilities of neutrophils are adversely
affected by hyperglycemia, including impaired migration, phagocytosis, intracellular
killing, and chemotaxis (7,8). Besides generalized impairments of immunity,
macrovascular disease and microvascular dysfunction may result in compromised local
circulation leading to delayed response to infection and impaired wound healing (9).
Unawareness of lower extremity trauma due to sensory neuropathy may result in
inadequate attention to minor wounds and subsequent increased infection risk. Incomplete
bladder emptying due to autonomic neuropathy permits urinary colonization by
microorganisms, where high glucose concentration in the urine promotes the growth of
some microorganisms (10).

72
Given the paucity of studies that have explored the relationship between diabetes and the
susceptibility to different types of infections in a primary care setting (5,11), it was sought
to conduct a matched cohort study to measure the relationship between diabetes and
susceptibility to common infections in primary care.
3.2 Methods
3.3.1 Study Design:
A matched cohort study using the Newfoundland and Labrador (NL) Canadian Primary
Care Sentinel Surveillance Network (CPCSSN) database was conducted.
3.2.2 Data Source:
CPCSSN is Canada’s first multi-disease electronic medical record (EMR)-based
surveillance system (12). Participating community-based primary care clinics across
Canada contribute information to CPCSSN on five chronic and mental health conditions
(i.e., diabetes, chronic obstructive pulmonary disease, depression, hypertension,
osteoarthritis) and three neurological conditions (i.e., alzheimers and related dementias,
epilepsy, and parkinsons) (13). In NL, the Atlantic Practice Based Research Network

73
(APBRN) is a group of primary care providers that contribute information to CPCSSN.
For this study, de-identified data was used from the NL-CPCSSN database. In NL there
are almost 500 family physicians. Approximately 10% of those physicians contribute data
to the CPCSSN dataset, representing around 45,000 patients by the end of 2013.
Information available includes patient demographics (age, sex, socioeconomic status),
health behaviors (smoking & alcohol intake), physiological data (e.g., blood pressure,
body mass index) and laboratory data (e.g., cholesterol, HbA1c, fasting glucose, renal
function), physician diagnoses, prescription medications, and vaccination. The sensitivity
and specificity of diagnostic algorithms for diabetes in the database was very high with a
100% and 99%, respectively (14). The CPCSSN database has been used for several
epidemiologic studies (15-18).
3.2.3 Inclusion Criteria:
All patients who had diabetes and were 18 years and older between January 1, 2008 and
March 31, 2013 were included. Diabetes was defined using the CPCSSN validated
algorithm based on International Classification of Disease (ICD-9) billing codes, problem
lists, medications, and laboratory values (13) (Appendix 3.A). January 1, 2008 or the date
a person was diagnosed with diabetes after January 1, 2008 was considered a persons
cohort entry or index date. Controls were randomly selected from patients without
diabetes that were alive on the date their matched patient with diabetes entered the cohort.
Up to 8 controls were selected for each patient with diabetes and matched on index year.
74
3.2.4 Exclusion Criteria:
Patients with a diagnosis of malignancy; HIV infection; organ transplantation; use of
immunosuppressive medications, ≥ 10 corticosteroids or antibiotics prescriptions in the
year prior to the study cohort entry date were excluded from the study (11) (See
Appendix 3.B for diagnostic codes).
3.2.5 Outcome Measures:
The primary outcome was the occurrence of one or more primary care physician visits for
any infectious disease during follow-up. The CPCSSN dataset use ICD-9 codes for all
diagnoses (encounter diagnosis, health condition, and family history). CPCSSN does not
have a limit on ICD9 codes. Infection-related visits to the primary care physician were
identified using ICD-9 codes, problem lists, and medications (Appendix 3.A).
Secondary outcomes included the number of head and neck infections, respiratory tract
infections, gastrointestinal infections, genitourinary tract infections, skin and soft tissue
infections, musculoskeletal infections and viral infections (See Appendix 3.A for
diagnostic codes).
Patients were followed from their index date until March 31, 2014. Given multiple
episodes of infection occurred throughout follow-up, a new episode was defined if a

75
patient was free of signs or symptoms for a 30-day period. A second episode occurring
>30 days after the initial episode was considered to be a recurrence (Appendix 3.D).
3.2.6 Statistical Analysis:
Baseline characteristics among patients with new or existing diabetes were compared to
those without diabetes using chi-square tests for categorical variables and t-tests for
continuous variables. Crude and adjusted OR’s were measured using univariate and
multivariable conditional logistic regression analyses to determine if diabetes was
independently associated with the occurrence of the primary and secondary outcomes.
Potential confounding variables included in our statistical model were defined based on
biological rationale, clinical experience, those available within the CPCSSN, and those
used in other studies evaluating diabetes and infection. Specifically, adjustement was
done for demographics (age, sex), the presence of comorbidities (microvascular disease
[nephropathy, neuropathy, retinopathy], macrovascular disease [coronary artery disease,
peripheral and cerebral vascular disease], heart failure, respiratory disease, dyslipidemia,
fatty liver disease, and obesity), medications (acid inhibitors, respiratory system
medications, anti-lipids and vaccines), lab tests, doctor visits, referral to specialists and
number of infections in the year prior to enrollment in our statistical models (Appendix
3.D). Testing for presence of a multiplicative interaction was done using the likelihood
ratio test between diabetes and age, sex, microvascular and macrovascular disease.
To test the robustness of our primary analysis sensitivity analyses was conducted. First,

76
restriction of follow-up period to 1 year was done and repeated the analyses for both the
primary and secondary outcomes. Second, the analysis was repeated for the primary
outcome evaluating 1 or more, 2 or more, and 3 or more infections. Third, given the high
number of infection recurrences throughout follow-up, fixed effects conditional poisson
regression model was used to quantify the association between diabetes and the number
of infections, whereby adjusted incidence rate ratios were calculated. All analyses was
conducted using Stata 12/MP with a p-value of < 0.05 considered statistically significant.
3.3 Results
A total of 1,779 patients who had diabetes and 11,066 patients without diabetes were
followed for an average of 4.2 years. The average age of the total population was 45.1(SD
16.4) years and the majority were females (59%). Patients with diabetes were on average
older, underwent more laboratory tests in the year prior to study entry, were more likely
to receive vaccines, acid-suppressing medications and lipid-lowering medications, and
were more likely to have existing macrovascular or microvascular disease at study entry
compared to controls. However, number of infections and recurrences before 1-year entry
to the study was higher in patients with no diabetes, but both groups were similar with
regards to number of doctor visits on average (Table 1). Most patients with diabetes were
treated with metformin constituting 60.5% of the group, while 22% were on insulin.

77
The proportion of patients with diabetes who had one or more primary care visits for an
infection was similar to patients without diabetes (57% vs. 58%). Proportions were also
comparable between groups within a 1-year follow-up period (33% vs. 32%) (Table 2).
The rate of infections per 100 person-years (PYs) was similar between patients with
diabetes and patients without (42.7 per 100PYs vs. 42.5 per 100PYs) (Table 3). Tables 2
and 3 display the proportions and rates for specific types of infections. Respiratory tract
infections were the most common infections reported.
After controlling for potential confounding, patients with diabetes had an increased odds
of any infection compared to patients without diabetes (adjusted OR=1.21, 95%CI 1.07-
1.37, P value=0.002) (Table 4). There was no significant association between diabetes
and head and neck infections (adjusted OR=1.10, 95%CI 0.87-1.39, P value=0.428).
While the risk in patients with diabetes was increased in respiratory infections (adjusted
OR=1.31, 95%CI 1.14-1.50, P value=<0.001), gastrointestinal infections (adjusted OR
=1.41, 95%CI 1.13-1.75, P value=<0.001), genitourinary infections (adjusted OR=1.42,
95%CI 1.17-1.73, P value=<0.001), and finally skin and soft tissue infections (adjusted
OR=1.65, 95%CI 1.36-2.01, P value=<0.001). There were no significant differences
when examining musculoskeletal (adjusted OR=1.05, 95%CI 0.87-1.28, P value=0.606)
or viral infections (adjusted OR=1.11, 95%CI 0.83-1.47, P value=0.485)
There was a significant interaction between diabetes and age for respiratory infections
(likelihood ratio test for interaction p=<0.001) and viral infections (likelihood ratio test

78
for interaction p=0.006). A stronger association was shown between diabetes and
respiratory infections (adjusted OR=1.24, 95%CI 1.08-1.42, P value=0.002) and viral
infections (adjusted OR=1.48, 95%CI 1.07-2.06, P value=0.018) in patients ≥65;
however, in patients <65 years there was a weak or no association (Respiratory infection:
adjusted OR=1.07, 95%CI 0.91-1.25, P value=0.397; adjusted OR=1.15, 95%CI 0.86-
1.53, P value=0.336).
Our findings were consistent when examining the odds of infections over a 1-year period
(Table 5). Recurrence of any infection was also calculated in the study population for ≥1,
≥2 and ≥3 infections (Table 6). There was a consistent increase in the odds with number
of recurrences. The odds of recurrences ≥2 infections was (adjusted OR=1.30, 95%CI
1.12-1.50, P value=<0.001), and recurrences ≥3 infections was (adjusted OR=1.51,
95%CI 1.27-1.79, P value=<0.001). In addition, through a fixed effects conditional
poisson regression model, an increased incidence rate ratio (IRR) of any infection was
found in patients with diabetes compared to those without diabetes (adjusted IRR=1.25,
95%CI 1.20-1.31, P value=<0.001).

79
3.4 Discussion
In the current study patients with diabetes have a 21% increased chance of developing a
new infection compared to patients without diabetes in primary care practices over 4
years. The positive association between diabetes and the development of a community-
acquired infection was observed within the first year of follow-up (37% relative odds
increase). The strongest magnitude of association was found for skin and soft tissue
infections (65% relative odds ), followed by genitourinary (42% relative odds increase),
gastrointestinal (41% relative odds increase), and respiratory infections (31% relative
odds). A consistent, slightly stronger, measure of and association was observed in the one
year follow up. However, no association was present for head and neck, musculoskeletal
and viral infections. A gradient response was also present with the number of any
infection and diabetes. Interestingly, we found that the number of infections and
recurrences before 1-year entry to the study was higher in patients with no diabetes.
Higher rates of infection in patients with no diabetes group here is likely due to the fact
that they are on average younger than patients with diabetes (19).
Very few studies have explored the relationship between diabetes and the occurrence of
general infections in a primary care setting (5,20-24). When comparing our results with
other studies that examined this relationship in a primary care setting, they were
consistent with most who have found increased rates of infections in patients with
diabetes compared to patients without (5,20-23). For example, Shah and Hux examined
the association between diabetes and different types of infections using administrative

80
databases from Ontario, Canada (5). They quantified the risk of infections in patients with
diabetes. Despite the reliance on an administrative dateset and a short study duration (1
year), the authors found an increased risk of infectious disease in patients with diabetes,
with an even higher risk ratio of infectious disease related hospitalization. Another cohort
study done in Japan that examined risk factors for infection concluded that diabetes was
one of the important risk factors. Using hospital records and community data the authors
reported more than double the risk of infection in patients with diabetes compared to
those without (21). The findings of this study may not be generalizable to primary care
patients as the study population had autoimmune diseases. In addition important
confounders that may affect the outcome, such as corticosteroid therapy, were not taken
into consideration. A case-control study that conceded with our findings found more than
double the risk of infection in patients with diabetes compared to patients without
diabetes (22). Shortcomings of this study that should be noted are the small number of the
study population included, and reliance on self-report of medical history and
socioeconomic status.
In contrast, Lipsky et al studied risk factors for acquiring pneumococcal infections in a
general medical clinic and found that diabetes was not a risk factors for developing
pneumococcal infections (24). However, some limitations of the study should be noted.
The authors do state that the study population was not ideal, presumably high risk,
because they were elderly, from lower socioeconomic strata, and had several chronic
medical problems. Moreover, because the study team relied on medical records, they may
have missed cases of pneumococcal infections, and undetectable pneumococcal
vaccinations may have occurred due to poor documentation .

81
Results of our secondary outcomes were consistent with other studies that looked at skin
and soft tissue infections (5,11,25-32) with a magnitude of association ranging from
[aOR=1.3-3.7], respiratory infections (5,11,29,33-43) [aOR=1.2-4.7], genitourinary
infections [aOR=1.2-2.8] (5,11,44-50), and gastrointestinal infections (5,25,51)
[aOR=1.3-1.5]. Despite shortcomings of these studies including non-generalizable
populations (26,27,33,41,44,46,49,50), self reported symptoms (25,29), presence of
misclassification bias (33,37,42,45,50) or selection bias (28) or reliance on hospital
records (5,28-32,39,43), their results were consistent with the findings from this study.
There was no difference in the risk of head and neck, musculoskeletal, and viral
infections in patients with diabetes and patients without, although few studies did find an
increased risk of these types of infections (5,11,52-56). This might be due to the fact that
there were a small number of infections in these categories compared to others above.
3.4.1 Strengths and Limitations:
This study has several limitations. First, patients with diabetes and control patients were
different at baseline with regards to other risk factor (e.g., disease severity, presence of
comorbidities, different medications and different dosages) that may have confounded the
observed association between diabetes and infection. However, to minimize confounding
adjustement was done for known differences between the comparison groups using
multivariable analysis. Furthermore any differences in disease severity in patients with

82
diabetes which could not be ascertained due to the missingness of hemoglobuin A1C.
Second, due to the fact that electronic medical records from routine clinical care were
used to define the diagnosis of diabetes, the potential for misclassification of the diabetes
(i.e., exposure) exists. Patients with a true diagnosis of diabetes may have been
misclassified as not having the disease. Moreover, since over one-third of diabetes is
undiagnosed in the community (57), the true number of patients with diabetes may have
been underestimated. Alternatively, misclassification for our outcome, infection, may
have also occurred. The ability to capture all patients with an infection and assessing
some types infections occurrence in the general population setting is difficult. Some
infections, such as viral, genital or other infections, are often treated by self-care, i.e.,
using products available over-the counter, symptomatic treatment, or no treatment at all.
In addition, medical records from general practice were used to identify the occurrence of
infections; it is possible that infections encountered in a hospital setting or treated at a
specialist clinic may not be captured. Thus ascertaining such cases via clinical records
may underestimate incidence. In addition, information was not available for vital status or
hospitalizations which could have lead to not capturing patients who had an infection but
were hospitalized without the knowledge of their primary care physician. Moreover,
vitals can give a more of a clear picture of occurrence, worsening or improvement of an
infection. Third, increased physician contact for patients with diabetes or differences in
misclassification may have resulted in diagnosis bias. Physicians may have focused on
and followed more closely, or treated patients with diabetes differently simply because of
the misconception of patients with diabetes are more liable to infections (58). Fourth,
comparison between different types of diabetes and the association of infection was not

83
investigated here. Type of diabetes is a possible effect modifier that could have affected
the magnitude of measure of association. However, glycemic impairment is expected to
be similar despite the different types of diabetes, and this does not seem to affect the
etiology behind the occurrence of infection. Moreover, several studies that examined
types of diabetes and infection found consistent results with regards to the presence of
association (11,59,60). Fifth, although age was adjusted for in the model, residual
confounding may still be present. Matching by age was impractical due to insufficient
numbers. Finally using the CPCSSN dataset, is a rich source of data for primary care
research, may have limited our generalizability. This dataset only includes physicians
using electronic medical record, and this may differ from other physicians who do not use
electronic medical records. Given these potential biases, the directionality depends on the
type of bias. For example, misclassificaiton bias would direct the association towards the
null; however, diagnostic bias may have shifted the association away from the null.
Moreover, the CPCSSN dataset is from electronic medical records for clinical practice
limiting the control of the researcher over the quality of the data.
Having said that, the study has distinctive strengths. First, a unique cohort of patients with
diabetes treated in a primary care setting was studied. There seems to be minimal research
done on the association between diabetes and infection in a primary care setting, Our
study adds to the sparce literature in primary care setting. Second, the study had sufficient
power to detect statistically significant associations for our primary outcome. Third, data
was obtained from the CPCSSN database, which is designed specifically for primary care
research, captures appropriate study variables and important prognostic markers (e.g.,

84
glycemic control, BMI, smoking and blood pressure) that are vital for the study design
(17). In addition, a validated case definition was used to define diabetes status before
outcome ascertainment (13), thus avoiding differential detection of undiagnosed diabetes
in adults. Finally, our study included community-based comparison groups yesinstead of
hospital-based and adjusted for comorbidities, vaccination status, which introduced
potential bias in some studies (61-63).
3.5 Conclusion
In conclusion, our study supports a significant but weak association between diabetes and
certain community-acquired infections including skin and soft tissues, gastrointestinal,
genitourinary and respiratory infections. The implications of glucose control via
antidiabetic medications on the risk of these infections remains to be determined.

85
References:
1) International diabetes federation atlas sixth edition:
http://www.idf.org/diabetesatlas/update-2014
2) Statistics Canada. CANSIM, table 105-0501 and Catalogue no. 82-221-X. Last
modified: 2015-06-17. http://www.statcan.gc.ca/tables-tableaux/sum-
som/l01/cst01/health53a-eng.htm
3) Morrish N, Wang S, Stevens L et al. Mortality and causes of death in the WHO
Multinational Study of Vascular Disease in Diabetes. Diabetologia 2001;44:S14-21.
4) Diapedia Collective, The. Other complications of diabetes mellitus [internet]. 2015 Jan
21; Diapedia 71040851441 rev. no. 18. Available from:
http://dx.doi.org/10.14496/dia.71040851441.18
5) Shah B, Hux J. Quantifying the risk of infectious diseases for people with diabetes.
Diabetes Care 2003;26:510-513.
6) Selby J, Ray G, Zhang D et al. Excess costs of medical care for patients with diabetes
in a managed care population. Diabetes Care 1997;20:1396-1402.

86
7) Valerius N, Eff C, Hansen N et al. Neutrophil and lymphocyte function in patients with
diabetes mellitus. Acta Med Scand 1982;211:463-467.
8) Delamaire M, Maugendre D, Moreno M et al. Impaired leucocyte functions in diabetic
patients. Diabet Med 1997;14:29-34.
9) Pecoraro R, Ahroni J, Boyko E et al. Chronology and determinants of tissue repair in
diabetic lower-extremity ulcers. Diabetes 1991;40:1305-1313.
10) Ellenberg M, Weber H. The incipient asymptomatic diabetic bladder. Diabetes
1967;16:331-335.
11) Muller L, Gorter K, Hak E et al. Increased risk of common infections in patients with
type 1 and type 2 diabetes mellitus. Clin Infect Dis 2005;41:281-288.
12)Birtwhistle R, Keshavjee K, Lambert-Lanning A, et al. Building a pan-Canadian
primary care sentinel surveillance network: initial development and moving forward. J
Am Board Fam Med 2009;22:412-422.
13) Greiver M, Keshavjee K, Martin K et al. Who are your patients with diabetes? EMR
case definitions in the Canadian Primary Care setting. Can Fam Physician 2012;58:421-

87
422.
14) Kadhim-Saleh A, Green M, Williamson T et al. Validation of the Diagnostic
Algorithms for 5 Chronic Conditions in the Canadian Primary Care Sentinel Surveillance
Network (CPCSSN): A Kingston Primary Care Practice-based Research Network
(PCPBRN). J Am Board Fam Medicine 2013;26:159-167.
15)Greiver M, Aliarzadeh B, Moineddin R et al. Diabetes Screening with Hemoglobin
A1c Prior to a Change in Guideline Recommendations: Prevalence and Patient
Characteristics. BMC Fam Pract 2011;12:1-7.
16)Greiver M, Barnsley J, Aliarzadeh B et al. Using a Data Entry Clerk to Improve Data
Quality in Primary Care Electronic Medical Records: a pilot study. Inform Prim Care
2011;19:241-250.
17) Kotecha JA, Manca D, Lambert-Lanning A et al. Ethics and Privacy Issues of a
Practice-based Surveillance System: Need for a National-level Institutional Research
Ethics Board and Consent Standards. Can Fam Physician 2011;57:1165-1173.
18) Asghari et al. Does the Prevalence of Dyslipidemias Differ between Newfoundland
and the Rest of Canada? Findings from the Electronic Medical Records of the Canadian

88
Primary Care Sentinel Surveillance Network. Front Cardiovasc Med. 2015; 2:1.
19) Touchie C. Report of the incidence and prevalence of diseases and other health
related issues in Canada. A study for the MCC blueprint project. Medical Council of
Canada 2013.
20) Crowson C, Hoganson D, Fitz-Gibbon P et al. Development and validation of a risk
score for serious infection in patients with rheumatoid arthritis. Arthritis Rheum
2012;64:2847-2855.
21) Migita K , Arai T, Ishizuka N et al. Rates of serious intracellular infections in
autoimmune disease patients receiving initial glucocorticoid therapy. PLoS One 2013
19;8:e78699.
22) Factor S, Levine O, Swhartz B et al. Invasive group A streptococcal disease: risk
factors for adults. Emerg Infect Dis 2003;9:970-977.
23) Davis T, Weerarathne T, Foong Y et al. Community-acquired infections in type 2
diabetic patients and their nondiabetic partners. The Fremantle Diabetes Study. J
Diabetes Complications 2005;19:259-263.

89
24) Lipsky B, Boyko E, Inui T et al. Risk factors for acquiring pneumococcal infections.
Arch Intern Med 1986;146:2179-2185.
25) Baaten G, Roukens A, Geskus R et al. Symptoms of infectious diseases in travelers
with diabetes mellitus: a prospective study with matched controls. J Travel Med
2010;17:256-263.
26) Heal C, Buettner P, Browning S. Risk factors for wound infection after minor surgery
in general practice. Med J Aust 2006;185:255-258.
27) Kato H, Nakagami G, Iwahira Y et al. Risk factors and risk scoring tool for infection
during tissue expansion in tissue expander and implant breast reconstruction. Breast J
2013;19:618-626.
28) Bykowski M, Sivak W, Cray J et al. Assessing the impact of antibiotic prophylaxis in
outpatient elective hand surgery: a single-center, retrospective review of 8,850 cases. J
Hand Surg Am 2011;36:1741-1747.
29) Nassel H, Ottosson C, Tornqvist H et al. The impact of smoking on complications
after operatively treated ankle fractures--a follow-up study of 906 patients. J Orthop
Trauma 2011;25:748-755.

90
30) Bartholomeeusen S, Vandenbroucke J, Truyers C. Epidemiology and comorbidity of
erysipelas in primary care. Dermatology 2007;215:118-122.
31) Edmonston D, Foulkes G. Infection rate and risk factor analysis in an orthopaedic
ambulatory surgical center. J Surg Orthop Adv 2010;19:174-176.
32) Bundy J, Gonzalez V, Barnard B et al. Gender risk differences for surgical site
infections among a primary coronary artery bypass graft surgery cohort: 1995-1998. Am
J Infect Control 2006;34:114-121.
33) Chen LK, Peng LN, Lin MH et al. Diabetes mellitus, glycemic control, and
pneumonia in long-term care facilities: a 2-year, prospective cohort study. J Am Med Dir
Assoc 2011;12:33-37.
34) Choudhry A, Al-Mudaimegh K, Turkistani A et al . Hajj-associated acute respiratory
infection among hajjis from Riyadh. East Mediterr Health J 2006;12:300-309.
35) Dobler C, Flack J, Marks G. Risk of tuberculosis among people with diabetes
mellitus: an Australian nationwide cohort study. BMJ Open 2012;13:2:e000666.
36) Picon P, Bassanesi S, Caramori M et al. Risk factors for recurrence of tuberculosis. J
Bras Pneumol 2007;33:572-578.

91
37) Baker M, Lin H-H, Chang HY et al. The risk of tuberculosis disease among persons
with diabetes mellitus: a prospective cohort study. Clin Infect Dis 2012;54:818-825.
38) Chen W, Shu W, Wang M et al. Pulmonary tuberculosis incidence and risk factors in
rural areas of china: a cohort study. PLoS One 2013;8:e58171.
39) Alisjahbana B, Crevel R, Sahiratmadja E et al. Diabetes mellitus is strongly
associated with tuberculosis in Indonesia. Int J Tuberc Lung Dis 2006;10:696-700.
40) Almiral J, Bolibar I, Balanzo X et al. Risk factors for community-acquired pneumonia
in adults: a population-based case-control study. Eur Respir J 1999;13:349-355.
41) Treppenning M, Taylor G, Lopatin D et al. Aspiration pneumonia: dental and oral
risk factors in an older veteran population. J Am Geriatr Soc 2001;49:557-563.
42) Wang Q, Ma A, Han X et al. Prevalence of type 2 diabetes among newly detected
pulmonary tuberculosis patients in China: a community based cohort study. PLoS One
2013;18;8:e82660.
43) Jick S, Lieberman E, Rahman M et al. Glucocorticoid use, other associated factors,
and the risk of tuberculosis. Arthritis Rheum 2006;55:19-26.

92
44) Boyko E, Fihn S, Scholes D et al. Risk of urinary tract infection and asymptomatic
bacteriuria among diabetic and nondiabetic postmenopausal women. Am J Epidemiol
2005;161:557-564.
45) Gorter K, Hak E, Zuithoff N et al. Risk of recurrent acute lower urinary tract
infections and prescription pattern of antibiotics in women with and without diabetes in
primary care. Fam Pract 2010;27:379-385.
46) Goswami R, Dadhwal V, Tejaswi S et al. Species-specific prevalence of vaginal
candidiasis among patients with diabetes mellitus and its relation to their glycaemic
status. J Infect 2000;41:162-166.
47) Hirji I, Andersson S, Guo Z et al. Incidence of genital infection among patients with
type 2 diabetes in the UK General Practice Research Database. J Diabetes Complications
2012;26:501-505.
48) Hirji I, Andersson S, Guo Z et al. Incidence of urinary tract infection among patients
with type 2 diabetes in the UK General Practice Research Database (GPRD). J Diabetes
Complications 2012;26:513-516.
49) Boyko E, Fihn S, Scholes D et al. Diabetes and the risk of acute urinary tract infection
among postmenopausal women. Diabetes Care 2002;25:1778-1783.

93
50) Orlander J, Jick S, Dean A et al. Urinary tract infections and estrogen use in older
women. J Am Geriatr Soc 1992;40:817-820.
51) Neal K, Slack R. Diabetes mellitus, anti-secretory drugs and other risk factors for
campylobacter gastro-enteritis in adults: a case-control study. Epidemiol Infect
1997;119:307-311.
52) Weitzaman D, Shavit O,Stein M et al. A population based study of the epidemiology
of Herpes Zoster and its complications. J Infect 2013;67:463-469.
53) Jih JS, Chen YJ, Lin MW et al. Epidemiological features and costs of herpes zoster in
Taiwan: a national study 2000 to 2006. Acta Derm Venereol 2009;89:612-616.
54) Joesoef R, Harpaz R, Leung J et al. Chronic medical conditions as risk factors for
herpes zoster. Mayo Clin Proc 2012;87:961-967.
55) Blumentals W, Nevitt A, Peng M et al. Body mass index and the incidence of
influenza-associated pneumonia in a UK primary care cohort. Influenza Other Respir
Viruses 2012;6:28-36.
56) Pezer M, Vidic V, Nikolic J et al. Risk factors in patients with herpes zoster
infections: case-control study. Cent Eur J Med 2013;8:493-498.

94
57) Cowie C, Rust K, Byrd-Holt D et al. Prevalence of diabetes and impaired fasting
glucose in adults in the U.S. population: National Health And Nutrition Examination
Survey 1999-2002. Diabetes Care 2006;29:1263-1268.
58) Schneeberger C, Stolk R, DeVaries J et al. Differences in the pattern of antibiotic
prescription profile and recurrence rate for possible urinary tract infections in women
with and without diabetes. Diabetes Care 2008; 31:1380-1385.
59) Gorter K, Hak E, Zuitthoff N et al. Risk of recurrent acute lower urinary tract
infections and prescription pattern of antibiotics in women with and without diabetes in
primary care. Fam Pract 2010;27:379-385.
60) Leth R, Uldbjerg N, Norgaard M et al. Obesity, diabetes, and the risk of infections
diagnosed in hospital and post discharge infections after cesarean section: a prospective
cohort study. Nordic Federation of Societies of Obstetrics and Gynecology 2011;90:501-
509.
61) BouterK, Diepersloot R, van Romunde L et al. Effect of epidemic influenza on
ketoacidosis, pneumonia and death in diabetes mellitus: a hospital register survey of
1976–1979 in the Netherlands. Diabetes Res Clin Pract 1991;12:61-68.
62) Neuzil K, Reed G, Mitchel E et al. Influenza associated morbidity and mortality in
young and middle-aged women. JAMA 1999;281:901-907.

95
63) Schanzer D, Langley J, Tam T. Co-morbidities associated with influenza-attributed
mortality, 1994–2000, Canada. Vaccine 2008;26:4697-4703.

96
Tables:
Table 1: Baseline Characteristics for 12,845 Patients With and Without Diabetes
Over 4-year Period:
Variable Diabetes
(n=1,779)
Non-Diabetes
(n=11,066)
P value
Age
Mean (SD)
Median (IQR)
57.5 (15.6)
59.0 (20)
43.1 (16.5)
41.0 (26)
<0.001
Gender n, (%)
Male
Female
889 (50.0)
890 (50.0)
4,435 (40.1)
6,631 (59.9)
<0.001
<0.001
Doctor Visits (Mean, SD)
3.7 (3.9) 3.3 (3.8) 0.015
Referral To a Specialist, n (%)
0
1
≥2
1,568 (88.1)
133 (7.5)
78 (4.4)
9,927 (89.7)
755 (6.8)
384 (3.5)
0.05
0.338
0.064

97
Infection before 1-year entry, n (%)
0
1
≥2
1,385 (77.8)
203 (11.4)
191 (10.7)
6,261 (56.6)
1,894 (17.1)
2,911 (26.3)
<0.001
<0.001
<0.001
Lab Tests before 1-year entry
(Mean, SD)
14.5 (46.3) 10.6 (33.2) <0.001
Vaccines, n (%)
251 (14.1) 1,202 (10.9) <0.001
Acid-suppressing Medications, n (%)
306 (17.2) 983 (8.9) <0.001
Respiratory Medications, n (%)
173 (9.72) 1,140 (10.3) 0.482
Lipid-lowering Medications, n (%)
716 (40.2) 653 (5.9) <0.001
Microvascular Disease, n (%)
29 (1.6) 23 (0.2) <0.001
Macrovascular Disease, n (%)
76 (4.3) 111 (1) <0.001
Heart Failure, n (%)
19 (1.1) 16 (0.1) <0.001
Fatty Liver, n (%) 10 (0.6) 12 (0.1) <0.001

98
Obesity, n (%)
61 (3.4) 129 (1.2) <0.001
Respiratory Disease, n (%)
236 (13.3) 2,273 (20.5) <0.001
Follow-up Time, years (Mean, SD)
4.2 (1.7) 4.2 (1.7) 0.788
Table 2: Proportion of New Infections in Patients with and without Diabetes Over 2
Follow-up Periods:
Infection
Type
4-year Follow-up Period 1-year Follow-up period
Diabetes
(n=1,779)
n (%)
Non Diabetes
(n=11,066)
n (%)
P value Diabetes
(n=1,779)
n (%)
Non
Diabetes
(n=11,066)
n (%)
P value
Any Infection
1012 (56.9) 6428 (58.1) 0.354 584 (32.8) 3500
(31.6)
0.327
Head & Neck 118 (6.6) 817 (7.4) 0.280 39 (2.2)
298 (2.7)
0.252

99
Respiratory
462 (26.0) 3266 (29.5) 0.002 210 (11.8)
1381
(12.5)
0.445
Gastrointesti
nal
151 (8.5) 694 (6.3) <0.001 69 (3.9)
245 (2.2)
<0.001
Genitourinar
y
203 (11.4) 1172 (10.6) 0.319 93 (5.2)
438 (4.0)
0.015
Skin & Soft
Tissue
199 (11.2) 896 (8.1) <0.001 78 (4.4)
269 (2.4)
<0.001
Musculoskele
tal
185 (10.4) 1189 (10.7) 0.692 62 (3.5)
388 (3.5)
1.000
Viral
84 (4.7) 428 (3.9) 0.100 30 (1.7)
130 (1.2)
0.091

100
Table 3: New Infections Per 100 Person-Years in Patients With and Without
Diabetes Over 2 Follow-up Periods:
Infection Type Full Study Period
(Mean, SD)
1 year study period
(Mean, SD)
Diabetes Non-
Diabetes
P
value
Diabetes Non-
Diabetes
P
value
Any Infection 42.7 (63.0) 42.5 (59.9) 0.895
54.7 (99.3) 50.2 (94.6) 0.077
Head & Neck 2.1 (11.5) 2.2 (9.7) 0.771
2.6 (18.2) 3.0 (19.5) 0.318
Respiratory 13.4 (36.3) 13.9 (30.0) 0.589
16.2 (52.2) 16.3 (49.7) 0.943
Gastrointestinal 3.4 (15.0) 2.2 (11.1)
0.001
4.9 (27.9) 2.7 (19.4) 0.001
Genitourinary 4.8 (18.0) 4.2 (16.5) 0.148
6.9 (33.1)
4.9 (26.7) 0.016
Skin & Soft
Tissue
4.1 (15.3) 2.4 (10.5) <0.001
5.2 (26.3)
2.6 (17.4) <0.001
Musculoskeletal 3.7 (14.4) 3.8 (14.5) 0.789 4.3 (25.1)
4.0 (22.3) 0.617
Viral 1.4 (7.1) 1.1 (6.6) 0.083 1.7 (13.5) 1.2 (11.4) 0.122

101
Table 4: Odds Ratio (OR) Between Diabetes and Infection: Crude and Covariate-
Adjusted Results:
Type of Infection Crude
OR
95%CI P value Adjusted
OR
95%CI P value
Any Infection
0.96 0.86-1.06 0.399 1.21 1.07-1.37 0.002
Head & Neck
0.90 0.74-1.11 0.328 1.10 0.87-1.39 0.428
Respiratory
0.84 0.75-0.94 0.003 1.31 1.14-1.50 <0.001
Gastrointestinal
1.38 1.15-1.67 <0.001 1.41 1.13-1.75 <0.001
Genitourinary
1.10 0.94-1.29 0.238 1.42 1.17-1.73 <0.001
Skin & Soft Tissue
1.43 1.21-1.69 <0.001 1.65 1.36-2.01 <0.001
Musculoskeletal
0.97 0.82-1.14 0.714 1.05 0.87-1.28 0.606
Viral
1.21 0.95-1.55 0.115 1.11 0.83-1.47 0.485
Adjusted for age, sex, comorbidities (microvascular disease [nephropathy, neuropathy, retinopathy],
macrovascular disease [coronary artery disease, peripheral and cerebral vascular disease], heart failure,
respiratory disease, dyslipidemia, fatty liver disease, and obesity), medications (acid inhibitors, respiratory

102
system medications, anti-lipids and vaccines), lab tests, doctor visits, referral to specialists and number of
infections in the year prior to enrollment
Table 5: Odds Ratio (OR) Between Diabetes and Infection Over 1-Year Period:
Crude and Covariate-Adjusted Results:
Type of Infection Crude
OR
95%CI P value Adjusted
OR
95%CI P value
Any Infection
1.06 0.95-1.18 0.290 1.37 1.21-1.55 <0.001
Head & Neck
0.83 0.59-1.17 0.285 1.12 0.75-1.67 0.573
Respiratory
0.94 0.81-1.10 0.470 1.45 1.21-1.74 <0.001
Gastrointestinal
1.78 1.36-2.34 <0.001 1.71 1.22-2.39 0.002
Genitourinary
1.34 1.06-1.69 0.248 1.86 1.39-2.50 <0.001
Skin & Soft Tissue
1.81 1.40-2.34 <0.001 1.96 1.43-2.69 <0.001
Musculoskeletal 1.01 0.77-1.33 0.915 1.06 0.77-1.47 0.714

103
Viral
1.42 0.95-2.13 0.086 1.33 0.80-2.21 0.268
Adjusted for age, sex, comorbidities (microvascular disease [nephropathy, neuropathy, retinopathy],
macrovascular disease [coronary artery disease, peripheral and cerebral vascular disease], heart failure,
respiratory disease, dyslipidemia, fatty liver disease, and obesity), medications (acid inhibitors, respiratory
system medications, anti-lipids and vaccines), lab tests, doctor visits, referral to specialists and number of
infections in the year prior to enrollment
Table 6: Odds Ratio (OR) Between Diabetes and Any Infection Recurrence: Crude
and Covariate-Adjusted Results:
Recurrences Crude
OR
95%CI P value Adjusted
OR
95%CI P value
≥1 Infection 0.96 0.86-1.06 0.399 1.21 1.07-1.37 0.002
≥2 Infection 0.92 0.82-1.04 0.196 1.30 1.12-1.50 <0.001
≥3 Infection 0.99 0.86-1.13 0.872 1.51 1.27-1.79 <0.001
Adjusted for age, sex, comorbidities (microvascular disease [nephropathy, neuropathy, retinopathy],
macrovascular disease [coronary artery disease, peripheral and cerebral vascular disease], heart failure,
respiratory disease, dyslipidemia, fatty liver disease, and obesity), medications (acid inhibitors, respiratory
system medications, anti-lipids and vaccines), lab tests, doctor visits, referral to specialists and number of
infections in the year prior to enrollment

104
Chapter 4
Summary
A popular notion among healthcare professionals is that patients with diabetes are more
liable to developing infections. This view however, lacked the support of necessary
substantive evidence. The magnitude and precession of the association between diabetes
and infection was not established in the current literature. To address this gap, especially
with certain types of infections, two complementary epidemiological studies were
designed and presented in this thesis. The first study was a quantitative systematic review
and meta-analyses, while the second study was a matched cohort study.
The first study (chapter 2) aimed to summarize and quantify the association between
diabetes and infection through a systematic review and meta-analysis. An increased risk
of numerous types of common infections in patients with diabetes was found; however,
there existed much variation in results between studies. The results were most compelling
for skin and soft tissue infections, genitourinary infections, and blood stream infections
which had the strongest associations following a meta-analysis of studies with a similar
design. The second study, the matched cohort study, aimed to estimate the association
between diabetes and infection in a primary care setting. This study resulted in a small

105
increased risk in any infection in patients with diabetes compared to patients without
diabetes. The highest increase in risk was seen in skin and soft tissue infections. An
smaller but significant increased risk was also apparent in genitourinary, gastrointestinal,
and respiratory infections.
These two studies complement each other: the systematic review summarized the current
knowledge on the association of diabetes and infections from the literature that
culminated in a meta-analysis, the second study, a matched cohort study examine this
relationship in a primary care setting where most patients with diabetes are most often
seen . Both of these studies add to the current evidence-based medicine literature.
4.1 Bradford Hill Considerations:
It is important in epidemiology to separate casual relationships between exposure and
outcome from non-causal relationships. If a set of necessary casual criteria could be used
to differentiate between causal and non-causal relationships, the presented research work
would be solidified. A commonly set of criteria proposed by Sir Austin Bradford Hill was
first described in 1965 to the Section of Occupational Medicine of the Royal Society of
Medicine (1). Hill’s lecture had a huge impact on epidemiologists and medical
researchers. The list of casual criteria was considered a roadmap for researchers (2-4).
Hill provided nine considerations to distinguish a casual relationship from a non-casual
one as follows; strength, consistency, specificity, temporality, biological gradient,
106
plausibility, coherence, experimental evidence and analogy. These considerations were
influenced by others before him (5,6). Hill’s criteria as it is specifically related to this
thesis will be reviewed here.
Strength of an association is shown through a quantitative measure of effect (e.g,
relative risk, odds ratio, hazard ratio, absolute risk difference). Hill’s argument is that
strong associations are more likely to be casual than weak associations. According to
Monson (7) a measure of association >1.5 is considered moderate to strong. In our cohort
study, a weak association between the primary outcome, any infection, and diabetes was
found(odds ratio (OR)= 1.21, 95%CI 1.07-1.37). When examining secondary outcomes of
the study, only skin and soft tissue infections had a strong association (OR=1.65, 95%CI
1.36-2.01), while weak associations were present for genitourinary (OR=1.42, 95%CI
1.17-1.73), gastrointestinal (OR=1.41, 95%CI 1.13-1.75), and respiratory (OR=1.31,
95%CI 1.14-1.50). Our systematic review and meta-analysis showed strong associations
with regards to secondary outcomes. Cohort studies revealed skin and soft tissue
infections (OR=1.95, 95%CI 1.78-2.13, I2=92.8%), blood stream (OR=1.73, 95%CI 1.49-
2.01, I2=94.2%), genitourinary (OR=1.61, 95%CI 1.42-1.83, I2=99.2%) and unspecified
infections (OR=1.81, 95%CI 1.64-2.00, I2=99.6%) had strong associations. Case-control
studies showed that skin (OR=2.61, 95%CI 2.17-3.13, I2=0%), respiratory (OR=1.62,
95%CI 1.37-1.92, I2=85.9%), blood (OR=2.40, 95%CI 1.68-3.42, I2=71.7%),
genitourinary (OR=2.42, 95%CI 1.61-3.65, I2=83.7%), gastrointestinal (OR=3.61, 95%CI
2.94-4.43, I2=0%), and non-specific (OR=3.81, 95%CI 2.88-5.04, I2=0%) had strong
associations.

107
With regards to consistency of results, our cohort study coincides with other studies
looking at the association of diabetes and infections. In addition to our cohort study,
other observational studies examining the association between infections in the
community and diabetes found the same conclusion with the measure of association
ranging from [1.21-2.5] (8-12). In contrast, not all studies showed positive associations.
Lipsky et al showed that diabetes was not considered a risk factor for pneumococcal
infections. As for secondary outcomes, there was also consistency with the literature (13).
The risk of skin and soft tissue was also increased in patients with diabetes with odds
ratio ranging from 1.7-6.2 (10,14-18) among several other studies (19-22). Genitourinary
infections was also shown to be increased in patients with diabetes in other studies
(10,20,19-22). Numerous studies concluded positive association with respiratory infection
and diabetes (10,19,20). Few studies coincided with our results in gastrointestinal
infections (10,19,38).
To our knowledge, there is no systematic review that examined the association of all
types of infections and diabetes. Jeon and Murray (39) conducted a systematic review and
meta-analysis that looked at tuberculosis and diabetes. They concluded a positive
association, as found in the systematic review and metat-analysis, in respiratory infection,
with diabetes with cohort studies having a relative risk (RR=3.1, 95%CI 2.27-4.26) and
case-control studies ranging from 1.16-7.83. Another systematic review done by Baker et
al (40) examined the impact of diabetes on tuberculosis treatment. They concluded that
diabetes increases the risk of relapse of tuberculosis. A narrative review done by Peleg et

108
al (41) studied common infections in diabetes. They concluded that diabetes is a risk
factor for skin, respiratory and urinary infections.
With temporality, another consideration of Hill, the necessity for a cause to precede an
effect in time is required for a casual relationship. Temporality can be applied in our case,
where the occurrence of diabetes precedes the incidence of infection. However, due to the
retrospective design of the studies included in the systematic review, temporality may not
be ascertained completely.
Biological plausibility can be applied to the explanation of the observed association
through known biological mechanisms. Defects in the immune system in patients with
diabetes; decreased neutrophil capabilities, phagocytosis, chemotaxis, impaired migration
(42,43), might have a role in the increased incidence of infection compared to patients
without. Moreover, anatomically specific impairment could be considered another
mechanism to add on the plausibility. Cardiovascular, neurological complications (44,45)
and impaired lung function (46,47) increases risk of infections. Bradford Hill considers
coherence if a cause and effect interpretation of association is clear when it does not
conflict with what is known about the disease. In other words, the association is coherent
with the current knowledge as is shown in the association studied here.
Biological gradient may also apply to association at hand. Although this thesis did not
examine the association between glycemic control and infections, but a dose-response
relationship is suggested by other literature. This suggests that the severity of diabetes,

109
reflected in poor glycemic control (hyperglycemia and increase in A1C), can be linked to
the occurrence of infection (48). Animal studies showed that hyperglycemia can worsen
immune function (49,50). In vitro studies in diabetic patients showed that diabetic cells,
in comparison with controlled ones, had a reduced cellular immune function(51,52).
Others have strengthened this theory through several observational studies (53-56).
In addition, experimental evidence (as interpreted by Bradford Hill) supports the
association between diabetes and infections. People with diabetes have shown some
evidence of histopathological changes that can give supplementary rationale to the
present association between diabetes and infection. Diabetes can affect healing (57,58),
and hyperglycaemia affects coagulation and fibrinolytic function (59), lipid metabolism
and endothelial function (60,61). Impaired lung functions in these patients contribute to
acquiring this type of infection as well (62,63). The pathophysiology of lung
abnormalities in patients who have diabetes is believed to involve microangiopathic
changes in the basement membrane of pulmonary blood vessels and respiratory
epithelium, as well as non-enzymatic glycosylation of tissue protein (64-67).
The remaining Bradford Hill criteria including specificity and analogy, do not apply to
the association studied here.
As discussed above, by reviewing Bradford Hill considerations, there is convincing
evidence of casual relationship between diabetes and infection. However, while there

110
remains some controversy in the literature, more research is needed to strengthen the
causal relationship between diabetes and infection.
4.2 Research and Clinical Implications:
Diabetes is a major public health issue and furthering our understanding of the risk of
infection among patients living with diabetes has the potential to improve population
health. The knowledge generated from this review will help further inform physicians and
researchers and aid in a better understanding of the relationship between diabetes and the
risk of infection. The implications of this research will impact health policy, clinical
practice and epidemiological research.
4.2.1 Health Services:
The international diabetes federation reported in 2015 almost 415 million people were
liing with diabetes. In 2040, number of patients living with diabetes is expected to
increase to over than 640 million people. The cost of management these patients will
affect the healthcare system expidenture. Health care expenses for people with diabetes is
estimated to be generally 2-3 fold higher than for patients with no diabetes (68). This
burden will be reflected in increase doctor visits, follow-up, management and hospital
admissions. The results of both studies may influence health services policies by
informing decision makers and those involved in developing clinical practice guidelines.
Our findings regarding the link between diabetes and infection may impact policies in

111
institutions such as hospitals and nursing homes. In short, the results of this work will
support evidence informed policy.
4.2.2 Clinical Practice:
Our findings can bridge to clinical practice as current clinical behavior, or current
assumptions by clinicians regarding diabetes and infection, are supported by little
evidence. As shown in the results the systematic review and cohort study in this thesis,
patients with diabetes are more liable to certain types of infections compared to patients
without diabetes. Hence, the study results may enhance evidence-based decision making
at the point of care by healthcare professionals when treating patients with diabetes,
especially with regard to decisions that may affect the immune system. This might be
taken into consideration when managing infections in patients with diabetes with reagrds
to choice of treatment, dosage, duration and follow-up.
4.2.3 Research:
As shown in the systematic review and meta-analysis and the cohort study done in this
thesis, there is a relationship between diabetes and infection. However, some research
needs to be done to focus on some points. Important questions to address in future
research:
Are patients with diabetes with uncontrolled blood sugar more liable to infection
than patients with diabetes with controlled blood sugar?

112
Is there any difference in the incidence of infection according to the type of
diabetes?
Do specific anti-diabeteic medications have a role in the occurrence of infections
in patients with diabetes?
What role do certain patient’s characteristics (e.g, body mass index, diabetes
complications, smoking, etc.) have in patients with diabetes in the occurrence of
infections?
4.3 Conclusion:
The current thesis presents the results of two observational studies that examined the
association between diabetes and the incidence of infection. The first study was a
systematic review and meta-analysis used to summarize and quantify the association
between diabetes and infection in the existing literature. This study concluded that
diabetes is associated with an increased risk of infection. The association was present
across all types of infections with skin soft tissue, genitourinary and blood infections
having the strongest associations. The second study was a matched cohort study using a
provincial dataset, to estimate the association between diabetes and infection in primary
care. The study found that patients with diabetes have a small increase in risk of any
infection compared to patients without diabetes. The highest risk was seen with skin and
soft tissue infections, followed by genitourinary, gastrointestinal and respiratory
infections.

113
References:
1) Hill AB. The environment and disease: association or causation? Proc R Soc Med
1965;58:295-300.
2) Hussain S, Harris C. Molecular epidemiology of human cancer. Toxicol Lett
1998;103:219-225.
3) Spitzer W. Bias versus causality: Interpreting recent evidence of oral contraceptive
studies. Am J Obstet Gynecol 1998;179:S43-S50.
4) Naschitz J, Kovaleva J, Shaviv N et al. Vascular disorders preceding diagnosis of
cancer: distinguishing the causal relationship based on the Bradford-Hill guidelines.
Angiology 2003;54:11-17.
5) Susser M. What is a cause and how do we know one? A grammar for pragmatic
epidemiology. Amer J Epidemiol 1991;7:635-648.
6) Morabia A. On the origin of Hill's causal criteria. Epidemiol 1991;5:367-369.
7) Monson R. Occupational Epidemiology, 2nd edition. Boca Raton, Florida: CRC Press
Inc.,1990.

114
8) Factor S, Levine O, Swhartz B et al. Invasive group A streptococcal disease: risk
factors for adults. Emerg Infect Dis 2003;9:970-977.
9) Davis T, Weerarathne T, Foong Y et al. Community-acquired infections in type 2
diabetic patients and their nondiabetic partners. The Fremantle Diabetes Study. J
Diabetes Complications 2005;19:259-263.
10) Shah B, Hux J. Quantifying the risk of infectious diseases for people with diabetes.
Diabetes Care 2003;26:510-513.
11) Crowson C, Hoganson D, Fitz-Gibbon P et al. Development and validation of a risk
score for serious infection in patients with rheumatoid arthritis. Arthritis Rheum
2012;64:2847-2855.
12) Migita K , Arai T, Ishizuka N et al. Rates of serious intracellular infections in
autoimmune disease patients receiving initial glucocorticoid therapy. PLoS One 2013
19;8:e78699.
13) Lipsky B, Boyko E, Inui T et al. Risk factors for acquiring pneumococcal infections.
Arch Intern Med 1986;146:2179-2185.

115
14) Bundy J, Gonzalez V, Barnard B et al. Gender risk differences for surgical site
infections among a primary coronary artery bypass graft surgery cohort: 1995-1998. Am
J Infect Control 2006;34:114-121.
15) Heal C, Buettner P, Browning S. Risk factors for wound infection after minor surgery
in general practice. Med J Aust 2006;185:255-258.
16) Kato H, Nakagami G, Iwahira Y et al. Risk factors and risk scoring tool for infection
during tissue expansion in tissue expander and implant breast reconstruction. Breast J
2013;19:618-626.
17) Bykowski M, Sivak W, Cray J et al. Assessing the impact of antibiotic prophylaxis in
outpatient elective hand surgery: a single-center, retrospective review of 8,850 cases. J
Hand Surg Am 2011;36:1741-1747.
18) Nassel H, Ottosson C, Tornqvist H et al. The impact of smoking on complications
after operatively treated ankle fractures--a follow-up study of 906 patients. J Orthop
Trauma 2011;25:748-755.
19) Baaten G, Roukens A, Geskus R et al. Symptoms of infectious diseases in travelers
with diabetes mellitus: a prospective study with matched controls. J Travel Med
2010;17:256-263.

116
20) Muller L, Gorter K, Hak E et al. Increased risk of common infections in patients with
type 1 and type 2 diabetes mellitus. Clin Infect Dis 2005;41:281-288.
21) Bartholomeeusen S, Vandenbroucke J, Truyers C. Epidemiology and comorbidity of
erysipelas in primary care. Dermatology 2007;215:118-122.
22) Edmonston D, Foulkes G. Infection rate and risk factor analysis in an orthopaedic
ambulatory surgical center. J Surg Orthop Adv 2010;19:174-176.
23) Boyko E, Fihn S, Scholes D et al. Risk of urinary tract infection and asymptomatic
bacteriuria among diabetic and nondiabetic postmenopausal women. Am J Epidemiol
2005;161:557-564.
24) Gorter K, Hak E, Zuithoff N et al. Risk of recurrent acute lower urinary tract
infections and prescription pattern of antibiotics in women with and without diabetes in
primary care. Fam Pract 2010;27:379-385.
25) Goswami R, Dadhwal V, Tejaswi S et al. Species-specific prevalence of vaginal
candidiasis among patients with diabetes mellitus and its relation to their glycaemic
status. J Infect 2000;41:162-166.

117
26) Hirji I, Andersson S, Guo Z et al. Incidence of genital infection among patients with
type 2 diabetes in the UK General Practice Research Database. J Diabetes Complications
2012;26:501-505.
27) Hirji I, Andersson S, Guo Z et al. Incidence of urinary tract infection among patients
with type 2 diabetes in the UK General Practice Research Database (GPRD). J Diabetes
Complications 2012;26:513-516.
28) Boyko E, Fihn S, Scholes D et al. Diabetes and the risk of acute urinary tract infection
among postmenopausal women. Diabetes Care 2002;25:1778-1783.
29) Orlander J, Jick S, Dean A et al. Urinary tract infections and estrogen use in older
women. J Am Geriatr Soc 1992;40:817-820.
30) Chen LK, Peng LN, Lin MH et al. Diabetes mellitus, glycemic control, and
pneumonia in long-term care facilities: a 2-year, prospective cohort study. J Am Med Dir
Assoc 2011;12:33-37.
31) Choudhry A, Al-Mudaimegh K, Turkistani A et al . Hajj-associated acute respiratory
infection among hajjis from Riyadh. East Mediterr Health J 2006;12:300-309.
32) Dobler C, Flack J, Marks G. Risk of tuberculosis among people with diabetes
mellitus: an Australian nationwide cohort study. BMJ Open 2012;13:2:e000666.

118
33) Picon P, Bassanesi S, Caramori M et al. Risk factors for recurrence of tuberculosis. J
Bras Pneumol 2007;33:572-578.
34) Baker M, Lin H-H, Chang HY et al. The risk of tuberculosis disease among persons
with diabetes mellitus: a prospective cohort study. Clin Infect Dis 2012;54:818-825.
35) Almiral J, Bolibar I, Balanzo X et al. Risk factors for community-acquired pneumonia
in adults: a population-based case-control study. Eur Respir J 1999;13:349-355.
36) Treppenning M, Taylor G, Lopatin D et al. Aspiration pneumonia: dental and oral
risk factors in an older veteran population. J Am Geriatr Soc 2001;49:557-563.
37) Wang Q, Ma A, Han X et al. Prevalence of type 2 diabetes among newly detected
pulmonary tuberculosis patients in China: a community based cohort study. PLoS One
2013;18;8:e82660.
38) Neal K, Slack R. Diabetes mellitus, anti-secretory drugs and other risk factors for
campylobacter gastro-enteritis in adults: a case-control study. Epidemiol Infect
1997;119:307-311.
39) Jeon C, Murray M. Diabetes mellitus increases the risk of active tuberculosis: a
systematic review of 13 observational studies. PLoS Med 2008;5:e152.

119
40) Baker M, Harries A, Jeon C et al. The impact of diabetes on tuberculosis treatment
outcomes: a systematic review. BMC Med 2011;9:81.
41) Peleg A, Weerarathna T, McCarthy J et al. Common infections in diabetes:
pathogenesis, management and relationship to glycaemic control. Diabetes Metab Res
Rev 2007;23:3-13.
42) Valerius N, Eff C, Hansen N et al. Neutrophil and lymphocyte function in patients
with diabetes mellitus. Acta Med Scand 1982;211:463-467.
43) Delamaire M, Maugendre D, Moreno M et al. Impaired leucocyte functions in
diabetic patients. Diabet Med 1997;14:29-34
44) Pecoraro R, Ahroni J, Boyko E et al. Chronology and determinants of tissue repair in
diabetic lower-extremity ulcers. Diabetes 1991;40:1305-1313.
45) Ellenberg M, Weber H. The incipient asymptomatic diabetic bladder. Diabetes
1967;16:331-335.
46) Sandler M, Bunn A, Stewart R. Cross-section study of pulmonary function in patients
with insulin-dependent diabetes mellitus. Am Rev Respir Dis 1987;135:223-229.

120
47) Reichard P, Berglund B, Britz A et al. Intensified conventional insulin treatment
retards the microvascular complications of insulin-dependent diabetes mellitus (IDDM):
the Stockholm diabetes intervention study (SDIS) after 5 years. J Intern Med
1991;230:101-108.
48) Butler S, Btaiche I, Alaniz C. Relationship between hyperglycemia and infection in
critically ill patients. Pharmacotherapy 2005;25:963-76.
49) Kwoun M, Ling P, Lydon E et al. Immunologic effects of acute hyperglycemia in
non-diabetic rats. J Parenter enteral Nutr 1997;21:91-95.
50) Black C, Hennessey P, Andrassy R et al. Short term hyperglycemia depresses
immunity through non-enzymatic glycosylation of circulating immunoglobulin. J Trauma
1998;30:830-832.
51) Bagdade J, Root R, Bulger R. Impaired leukocyte function in patients with poorly
controlled diabetes. Diabetes 1974;23:9-15.
52) MacRury S, Gemmell C, Patterson K et al. Changes in phagocytic function with
glycemic control in diabetic patients. J Clin Pathol 1989;42:1143-1147

121
53) Zerr K, Furnary A, Grunkemeier G et al. Glucose control lowers the risk of wound
infection in diabetics after open heart operations. Ann Thorac Surg 1997;63:356-61.
54) Pomposelli J, Baxter J, Babineau T et al. Early postoperative glucose control predicts
nosocomial infection rate in diabetic patients. J Parenter Enteral Nutr 1998;22:77-81.
55) Golden S, Peart-Vigilance C, Kao E et al. Perioperative glycemic control and the risk
of infectious complications in a cohort of adults with diabetes. Diabetes Care
1999;22:1408-1414.
56) Furnary A, Zerr K, Grunkemeier G et al. Continuous intravenous insulin infusion
reduces the incidence of deep sternal wound infection in diabetic patients after cardiac
surgical procedures. Ann Thorac Surg 1999;67:352-360.
57) Porter J, Baur G, Taylor L. Lower-extremity imputations for ischemia. Arch Surg
1981;116:89-92.
58) Gibran N, Jang Y-C, Isik F et al. Diminished neuropeptide levels contribute to the
impaired cutaneous healing response associated with diabetes mellitus. J Surg Res
2002;108:122-128.
59) Carr M. Diabetes mellitus a hypercoagulable state. J Diabetes Complications
2001;15:44-554.

122
60) Williams S, Goldfine A, Timimi F et al. Acute hyperglycemia attenuates endothelium
dependent vasodilation in humans in vivo. Circulation 1998;97:1695-1701.
61) Ammar R, Gutterman D, Brooks L et al. Free radicals mediate endothelial
dysfunction of coronary arterioles in diabetes. Cardiovasc Res 2000;47:595-601.
62) Farina J, Furio V, Fernandez-Acenero et al. Nodular fibrosis of the lung in diabetes
mellitus. Virchows Arch 1995;427:61-63.
63) Watanabe K, Senju S, Toyoshima H et al. Thickness of the basement membrane of
bronchial epithelial cells in lung diseases as determined by transbronchial biopsy. Respir
Med 1997;91:406-410.
64) Sandler M, Bunn A, Stewart R. Cross-section study of pulmonary function in patients
with insulin-dependent diabetes mellitus. Am Rev Respir Dis 1987;135:223-229.
65) Hsia C, Raskin P. The diabetic lung: relevance of alveolar microangiopathy for the
use of inhaled insulin. Am J Med 2005;118:205-211.
66) Rosenstock J, Friberg T, Raskin P. Effect of glycemic control on microvascular
complications in patients with type 1 diabetes mellitus. Am J Med 1986;81:1012-1018.

123
67) Reichard P, Berglund B, Britz A et al. Intensified conventional insulin treatment
retards the microvascular complications of insulin-dependent diabetes mellitus (IDDM):
the Stockholm diabetes intervention study (SDIS) after 5 years. J Intern Med
1991;230:101-108.
68) International diabetes federation atlas sixth edition:
http://www.idf.org/diabetesatlas/update-2014

124
Appendices:
Appendix 2.A: Search Strategy
Diabetes and The Occurrence of Infection: Search Strategy
Information source:
We searched the following biomedical databases: PubMed, EMBASE, The Cochrane
Library via Wiley, International Pharmaceutical Abstracts via EBSCO, and Web of
Science. There was no language restrictions.
Search:
MeSH and free-text terms were used to search PubMed. EMTREE and free-text terms
were used to search EMBASE. The remaining databases were searched using free-text
terms.
PubMed:
We conducted a MeSH term search (exploded) as well as a free-text search to allow
identification of articles that have not been indexed with MeSH terms.

125
MeSH:
1. Diabetes mellitus [MeSH terms]
2. Infections [MeSH terms]
3. Cohort studies [MeSH terms]
4. Case-control studies [MeSH terms]
5. Retrospective studies [MeSH terms]
6. Observational study [Publication Type] [MeSH terms]
7. #1 AND #2
8. #3 OR #4 OR #5 OR #6
9. #7 AND #8
Free-Term Search (title and abstract):
1. Diabetes[Title/Abstract]
2. “Diabetes mellitus”[Title/Abstract]
3. Infection*[Title/Abstract]
4. Cohort[Title/Abstract]
5. Case-control[Title/Abstract]
6. Retrospective[Title/Abstract]
7. Observational[Title/Abstract]
8. #1 OR #2
9. #3 AND #8

126
10. #4 OR #5 OR #6 OR #7
11. #9 AND #10
#9 OR #11
EMBASE:
We conducted an EMTREE term (exploded) search as well as a free-text search to allow
identification of articles that have not been indexed with EMTREE terms.
EMTREE:
1. ‘Diabetes mellitus’/exp
2. ‘Infection’/exp
3. ‘Cohort analysis’/exp
4. ‘Case control study’/exp
5. ‘Retrospective study’/exp
6. ‘Observational study’/exp
7. #1 AND #2
8. #3 OR #4 OR #5 OR #6
9. #7 AND #8
Free text search (title, abstract, keyword):

127
1. Diabetes:ti,ab,de
2. ‘Diabetes mellitus’:ti,ab,de
3. Infection:ti,ab,de
4. Cohort:ti,ab,de
5. ‘Case-control’:ti,ab,de
6. Retrospective$:ti,ab,de
7. Observational: ti,ab,de
8. #1 OR #2
9. #8 AND #3
10. #4 OR #5 OR #6 OR #7
11. #9 AND #10
#9 OR #11
The Cochrane Library:
Databases in the Cochrane Library include: Cochrane Central Register of Controlled
Trials (clinical trials), Cochrane Database of Systematic Reviews (Cochrane reviews),
Database of Abstracts of Reviews of Effects (systematic review quality assessments),
Cochrane Methodology Register (control trial methods), Health Technology Assessment
Database (technology assessments), NHS Economic Evaluation Database (economic
evaluations), About The Cochrane Collaboration (Cochrane groups).

128
We conducted free-text searches. Results are limited to Cochrane Reviews (ALL) and
Other Reviews.
Free term search (title, abstract, keyword):
1. Diabetes
2. “Diabetes mellitus”
3. Infection
4. Cohort
5. “Case-control”
6. Retrospective
7. Observational
8. #1 OR #2
9. #3 AND #8
10. #4 OR #5 OR #6 OR #7
11. #9 AND #10
International Pharmaceutical Science:
We searched using free-text with the “all text” scope.

129
1. Diabetes
2. “Diabetes mellitus”
3. Infection*
4. Cohort
5. “Case-control”
6. Retrospective
7. Observational
8. S1 OR S2
9. S3 AND S8
10. S4 OR S5 OR S6 OR S7
11. S9 AND S10
Web of Science:
We searched using free-terms in this database.
1. topic=Diabetes
2. topic= “Diabetes mellitus”
3. topic=Infection*
4. topic=Cohort
5. topic=“case-control”

130
6. topic=Retrospective
7. topic=Observational
8. #1 OR #2
9. #3 AND #8
10. #4 OR #5 OR #6 OR #7
11. #9 AND #10

131
Appendix 2.B: Individual Study Characteristics
Author Year Design Patients
(n) Male (%)
Age, Mean (SD)
Diabetes Type
Outcome NOS Score
Abbott 2001 Cohort 327993 52.2 63.2 (14.9) unclear Blood 6
Abdel-Fattah 2008 Case-Control 844 53.8 41.2 (29.4) unclear RTI 6
Acosta 2012 Case-Control 515 0 30.6 (4.7) 1 Blood 5
Acosta 2013 Cohort 1622474 0 − 1, 2, gestational
Blood 6
Adams 2013 Cohort 40491 37.2 − 1, 2 SSTI 6
Al-Asmary 2004 Case-Control 824 52.7 40.8 (29.6) unclear GU 6
Alisjahbana 2006 Case-Control 1010 52.5 − unclear RTI 7
Almirall 1999 Case-Control 680 − − unclear RTI 7
Álvarez-Lerma 2003 Cohort 1765 66.7 61.2 (15.7) insulin-treated
GU 6
Antonelli 2005 Case-Control 866 31.8 60.8 (12.6) 2 Viral 7
Apisarnthanarak
2003 Case-Control 60 46.7 − unclear SSTI 6
Apisarnthanarak
2007 Case-Control 230 30.9 − unclear Unspecified
6
Aragón-Sánchez
2010 Cohort 283 63.6 − unclear SSTI 6
Ariyaratnam 2010 Cohort 7420 79.2 − unclear SSTI 6
Ata 2010 Cohort 1060 − − unclear SSTI 6
Baaten 2010 Cohort 304 45.4 − unclear Multiple 6
Bachoura 2011 Case-Control 1783 49.5 − unclear SSTI 5
Baillot 2010 Cohort 23499 70.7 63.8 (11.4) unclear SSTI 6
SA 2011 Cohort 500 59 62.1 (9.9) unclear SSTI 5
Bartholomeeusen
2007 Nested Case-Control
160000 − − unclear SSTI 5
Bassetti 2012 Case-Control 495 58.2 61.8 (17.1) unclear Blood 5
Bedanova 2009 Cohort 150 82.7 54.1 (7) unclear Multiple 6
Bical 2004 Cohort 712 91 59.6 (9.3) 1, 2 SSTI 6
Bitkover 1998 Case-Control 111 − 64.2 (11.6) unclear SSTI 6
Borer 2012 Case-Control 464 70 − unclear Unspecified
6
Borger 1998 Cohort 12267 72.2 − unclear SSTI 6
Bower 2008 Case-Control 63 60.3 61 (10.6) unclear SSTI 5
Boyko 2005 Cohort 1017 0 − 1, 2 GU 6
Boyko 2002 Case-Control 1814 0 66.1 (6.2) 1, 2 GU 7
Bundy 2006 Cohort 3878 75.3 − 1, 2 SSTI 6
Caire 2011 Cohort 23 100 − unclear SSTI 5
Carson 2002 Cohort 146786 70.8 65 (3.7) unclear Multiple 6
Carton 1992 Cohort 101392 − 64.5 (14.4)) 1, 2 Blood 7
Chen 2012 Cohort 109038 50.4 − 1, 2 GU 7
Chen L. 2011 Cohort 233 54.9 76.9 (10.5) unclear RTI 6
Chen S 2009 Cohort 195 − − unclear SSTI 6
Choudry 2006 Cohort 1027 73 33.5 (11.7) unclear RTI 5
Chouw 2005 Cohort 246 54.1 51 (13) unclear SSTI 5
Dalrymple 2010 Cohort 119858 90.5 75.2 (6.5) unclear Unspecified
7
Daneman 2010 Cohort 587327 37.8 − unclear SSTI 6
Davis 2005 Cohort 120 50 64.3 (9.9) 2 Unspecified
8
de Souza 2007 Cohort 55 60 45.6 (10.4) unclear Unspecifie 6

132
d
Boer 2006 Case-Control 521 73.3 56 unclear RTI 7
Deng 2004 Cohort 751 84.3 56 2 SSTI 6
Di Palo 1988 Cohort 3796 − − unclear SSTI 5
Dixon 2009 Cohort 7224 − 65 (16.5) unclear SSTI 5
Dobler 2012 Cohort 19855283 49.3 − 1,2, gestational
RTI 7
Dupuy 1999 Case-Control 423 52.3 56.6 (1.3) unclear SSTI 5
Edmonston 2010 Case-Control 409 50.6 46.3 unclear SSTI 6
Ennker 2009 Case-Control 3675 − − unclear SSTI 5
Everhart 2013 Cohort 1875 − − unclear SSTI 6
Factor 2003 Case-Control 450 − − unclear Unspecified
6
Fakih 2007 Cohort 3578 32.5 67.2 (11) unclear SSTI 6
Farrow 2008 Cohort 105 98 55.2 unclear SSTI 6
Fernandez-Sabe
2009 Case-Control 90 65.5 − unclear Other 6
Filsoufi 2009 Cohort 5798 37.6 64 (14) unclear SSTI 6
Floros 2011 Cohort 5649 − 64.5 unclear SSTI 7
Flynn 2000 Cohort 98 67.3 − 2 SSTI 5
Friedman 2007 Case-Control 123 65 51.7 (14.5) unclear SSTI 6
George 2011 Cohort 556 58.1 57.7 unclear SSTI 6
Gorter 2010 Cohort 6958 0 51 (17) 1, 2 GU 6
Goswami 2000 Cohort 166 0 31.5 (10.9) 1, 2 GU 6
Graf 2009 Case-Control 240 68.7 68 unclear SSTI 5
Gude 2006 Case-Control 489 68 67 (11) unclear SSTI 6
Guvener 2002 Cohort 1090 70.8 59.6 (10.3) unclear Multiple 6
Hamilton 2013 Cohort 1139 − 64.1 (11.3) 2 Multiple 7
Heal 2006 Cohort 857 52.4 56.3 (16.5) unclear SSTI 6
Heal 2012 Cohort 953 54.3 59.3 (33) unclear SSTI 6
Herce 2013 Case-Control 105 60 73.3 (11) unclear SSTI 6
Iorio 2012 Cohort 4241 − − unclear SSTI 6
Kadija 2011 Cohort 538 0 50 (14) unclear SSTI 6
Kanafani 2006 Nested Case-Control
81 54.3 51 unclear SSTI 5
Kato 2013 Cohort 981 0 46.4 unclear SSTI 6
Lai 2007 Case-Control − − − unclear SSTI 6
Latham 2001 Case-Control 1044 68.6 63.7 (10.3) unclear SSTI 6
Ledur 2011 Cohort 717 67.4 61.9 (11) unclear Unspecified
5
Lee F. 2013 Nested Case-Control
66 40.9 − unclear SSTI 6
Li GQ 2013 Cohort 2061 50.5 51 (16.7) unclear SSTI 6
Marschall 2007 Case-Control 76 63.1 62.2 (16.3) unclear SSTI 5
Matsuda 2009 Cohort 11 68.7 61.8 (11.5) unclear SSTI 6
Mossad 1997 Case-Control 46 71.7 − unclear SSTI 5
Munoz 2008 Cohort 357 60.2 64.3 (12.7) unclear SSTI 6
Nakano 2008 Cohort 1500 72.7 67.8 (9.3) unclear SSTI 6
Schimmel 2010 Nested Case-Control
171 42.7 48.6 (15.1) 1, 2 SSTI 6
Simsek Yavuz 2008 Cohort 991 71.9 56.9 (13.1) unclear SSTI 5
Singh 1993 Cohort 701 87.9 58.5 unclear SSTI 5
Siracuse 2013 Cohort 478 57.9 69 unclear SSTI 5
Spelman 2000 Cohort 690 73.7 − unclear Multiple 5
Takoudes 2004 Cohort 728 0 29.7 1, 2 Multiple 6
Talbot 2004 Case-Control 152 − − unclear SSTI 6
Trinh 2009 Case-Control 202 39.1 58.4 (16.4) unclear SSTI 6
Veeravagu 2009 Cohort 24774 94.8 − unclear SSTI 5

133
Vilar-Compte 2000 Case-Control 3372 − 50 (17.1) unclear SSTI 6
Wasson 2013 Case-Control 388 89.7 61.5 unclear SSTI 7
Wukich 2011 Cohort 1462 39.5 48.2 (15.8) unclear SSTI 5
Zacharias 1996 Cohort 2317 69.1 62 (10.9) unclear SSTI 6
John 2001 Cohort 171 64.9 53.5 (6.8) 1, 2 Unspecified
6
Hata 2011 Cohort 55492 46.8 60.1 (16.5) unclear Viral 7
Heymann 2008 Nested Case-Control
111189 44.4 − unclear Viral 6
Muller 2005 Cohort 26328 41.1 63.5 (13.4) 1, 2 Multiple 7
Hirji 2012 Cohort 271840 53.9 62.6 (13.5) 2 GU 8
Hirji 2012 Cohort 271840 53.9 62.6 (13.6) 2 GU 8
Holley 1991 Cohort 60 66.7 48.5 (15) unclear SSTI 6
Hoy 1985 Cohort 268 59.7 − unclear GU 5
Hu 2014 Cohort 20655 52.2 − unclear RTI 6
Hu 2004 Case-Control 1810 0 66.2 (6.3) unclear GU 6
Ikegami 2012 Cohort 346 48 51.5 (11.8) unclear RTI 6
Jackson 1995 Case-Control 864 50.5 − unclear Unspecified
6
Jackson 2004 Cohort 1017 0 − 1, 2 GU 6
Kaandorp 1995 Case-Control 4907 30.6 − unclear Other 6
Kaiserman 2005 Cohort 159634 46.2 65.7 (0.05) unclear Viral 6
Kang 2012 Cohort 93931 − − unclear GU 5
Karamanos 2013 Cohort 81165 42 52.5 (13.8) unclear Multiple 6
Ko 2011 Cohort 1000887 46.9 61 (12.6) unclear GU 8
Kontoyiannis 2005 Case-Control 81 51.9 51.3 unclear Other 6
Kornum 2008 Case-Control 376629 52.9 − 1, 2 RTI 6
Kuo 2013 Cohort 253349 51.1 55.4 (8.8) 2 RTI 8
Lau 2014 Cohort 166715 52.6 − unclear Viral 8
Lee CH 2013 Cohort 70782 83 54.5 (22.9) unclear RTI 7
Lee JH 2013 Case-Control 162 69.7 − unclear GU 5
Lee MC 2013 Cohort 99806 52.5 61.9 (14.2) 1, 2 TB 7
Leegaard 2011 Case-Control 17224 53.3 − 1, 2 RTI 6
Lehmann 2000 Case-Control 92 57.6 − unclear H&N 5
Leth 2011 Cohort 2492 0 32.1 (4.7) 1,2, gestational
Unspecified
6
Leung 2008 Cohort 42116 34.7 72.6 unclear RTI 6
Lipsky 1986 Case-Control 193 − − unclear Unspecified
7
Lui S.A 2007 Cohort 994 93.1 51.5 (11.7) unclear SSTI 5
Lola 2011 Cohort 172 77.3 66 (10) unclear Unspecified
6
Ma 2012 Cohort 376 48.7 73.1 (3.4) unclear SSTI 6
McKane 2014 Cohort 2551 57.1 65.4 (16) unclear Blood 7
Michalia 2009 Cohort 343 71.7 52 (17.4) 1, 2 Blood 6
Monaghan 2011 Case-Control 5736 62.1 51.8 (22.2) unclear GU 4
Montague 2001 Cohort 491 100 − unclear SSTI 5
Montan 1998 Case-Control 277 30.7 74.7 unclear H&N 6
Myers 2012 Cohort 148 41.9 57.3 (10) 1, 2 Unspecified
6
Nassaji-Zavareh
2007 Cohort 300 48.3 51.8 (22.5) unclear Other 6
Neal 1997 Case-Control 825 39.5 44.2 (17.3) unclear GI 5
Halleberg Neyman
2011 Cohort 86 29.1 80 (11.1) unclear GU 6
Platt 1986 Cohort 1478 51.1 − unclear GU 5
Partikaki 2008 Cohort 561 67.4 55.5 (18.7) unclear Blood 6
Ryan 1997 Case-Control 111 − − unclear Blood 5
Scholes 2005 Case-Control 788 0 32.9 (9.8) unclear GU 6

134
Sheiner 2009 Cohort 199093 0 28.5 (6) gestational, other
GU 6
Singh 2009 Case-Control 100 − − unclear Other 5
Strom 2000 Case-Control 546 61.9 − unclear Other 6
Suputtamongkol
1999 Case-Control 580 59.1 51.5 (15.5) unclear Blood 6
Terpenning 2001 Case-Control 358 − − unclear RTI 6
Thomsen 2005 Case-Control 14487 − − 1, 2 Blood 7
Thomse 2007 Case-Control 73780 54.2 − 1, 2 GI 7
Thomsen 2011 Case-Control 4357 49.1 − 1, 2 Blood 7
Toure 2013 Cohort 390 60.5 − 1, 2 Blood 5
Vidal 2012 Cohort 4388 66.1 50.1 (14.5) unclear GU 6
Viglino 1994 Cohort 1990 55.9 58 (14.5) unclear Multiple 6
Wang H.E 2012 Cohort 30183 44.8 − unclear Blood 6
Wilson 1998 Cohort 389 100 − unclear SSTI 5
Yang C.H 2012 Cohort 886 74.5 45.2 unclear Unspecified
5
Simsir 2010 Cohort 2027 100 64.3 (10.1) unclear Blood 5
Antonio 2010 Cohort 114 65.8 53.1 (11.7) unclear Unspecified
5
Antoniou 2014 Cohort 989302 64.4 − unclear Viral 7
Blumentals 2012 Cohort 1074315 47.8 − 2 Viral 7
Clech 2007 Nested Case-Control
3281 60.7 − unclear GU 5
Gajewska 2005 Cohort 45 0 − unclear Viral 6
Heilmann 2013 Cohort 1297 69.6 67 (12.7) unclear SSTI 5
Higgins 2009 Cohort 136 81.6 50.6 (11.3) unclear Unspecified
6
Hu C.C 2012 Cohort 76362 61.5 62.2 (15.2) unclear H&N 7
Jaar 2000 Cohort 4005 52.3 59.4 (15.4) 1, 2 Blood 6
Lee CH 2012 Cohort 140 72.1 47.5 (15) unclear Bone 6
Lee P.Y 2010 Cohort 260 76.1 58.3 (14.2) unclear SSTI 5
Liao 2006 Cohort 337 17.5 − unclear SSTI 7
Matros 2010 Cohort 21191 34.3 65 unclear SSTI 6
Memmel 2004 Cohort 1256 60.8 39.4 (10.5) unclear Multiple 5
Michalopoulos 2011 Case-Control 84 73.8 64.3 (11.5) unclear Blood 5
Pablos-Mendez 1997 Case-Control 42656 58.2 − 1, 2 RTI 5
Perez 2006 Case-Control 75723 50.4 − unclear RTI 5
Pull ter Gunne 2009 Cohort 3174 40.1 55.6 (15.5) unclear SSTI 5
Wang I.K 2012 Cohort 898 41 56 (14.6) unclear Blood 6
Wilson 1995 Cohort 823 100 − unclear SSTI 4
Yamashita 2000 Cohort 367 70 63.5 (10.4 1, 2 Unspecified
6
Thomsen 2004 Case-Control 6578 47.3 − 1, 2 Blood 7
Coskun 2000 Cohort 117 71 55 unclear SSTI 5
Khurram 2004 Case-Control 57 57.9 46.5 (17.2) unclear Unspecified
5
Wang Q 2013 Case-Control 13057 63.9 50.6 (17.5) 2 RTI 7
Thanni 2004 Cohort 90 58.9 40 (17) unclear SSTI 5
Bailey 1970 Cohort 1797 0 − unclear GU 5
Baynes 1993 Case-Control 773 61.2 − unclear SSTI 7
Picon 2007 Cohort 610 61.6 36 (14) unclear RTI 4
Pezer 2013 Case-Control 109 − − unclear Viral 6
Yoon 2013 Case-Control 344 0 54 (15.6) unclear GU 7
Jackson 2013 Nested Case-Control
4730 − − unclear RTI 6
Shah 2003 Cohort 1830820 51.7 60.9 (11.6) unclear Multiple 8
Weitzman 2013 Cohort 2020709 − − unclear Viral 7
Limmathurotsa 2010 Cohort − − − unclear Unspecifie 7

135
kul d
Seminog 2013 Cohort − − − unclear Unspecified
7
Abdul-Jabbar 2012 Cohort 6628 48.1 56.5 unclear SSTI 5
Acott 2009 Cohort 38989 − 61.3 unclear Multiple 6
Adrenito 2008 Cohort (Macthed cohort?)
54 74.1 52.8 1, 2 SSTI 6
Adetayo 2012 Cohort 297 − 51.7 (9.5) unclear Multiple 5
Alserius 2008 Cohort 605 79 66 (9) 2 SSTI 7
Altiparmak 2002 Case-Control 35 65.7 32.8 (10.3) unclear Unspecified
6
Alvarsson 2012 Cohort 194 54.5 78.4 unclear Unspecified
6
Al-Zaru 2010 Cohort 216 78.1 60.4 (9.1) unclear SSTI 6
Appaduray 2013 Cohort 519 − 55 (17.7) 1, 2 Unspecified
6
Aseeri 2008 Case-Control 188 43.6 − 1, 2 GI 6
Atilgan 2014 Case-Control 305 65.9 25.7 (20.5) unclear Unspecified
5
Backes 2014 Cohort 191 68.6 − unclear SSTI 6
Baker 2012 Cohort 17715 49.6 − unclear RTI 6
Behnke 2014 Cohort 396 53.3 57 (17) unclear SSTI 5
Benin 2003 Case-Control 438 42 − 1, 2 Unspecified
6
Bevilacqua 2011 Cohort 65 35.4 59.2 (14.6) unclear Blood 5
Birgand 2013 Cohort 552 82.5 − unclear SSTI 6
Bolognesi 2008 Cohort 751340 38.8 67.9 (11.5) unclear Multiple 6
Bonds 2013 Cohort 254 53.9 56 (14) unclear SSTI 5
Bowen 2005 Cohort 164 65.7 47 (18) unclear Unspecified
7
Bozic 2014 Case-Control 587 55 − unclear Bone 6
Bykowski 2011 Cohort 2755 37 52.9 (15) unclear SSTI 6
Calderwood 2013 Cohort 524892 31.8 − unclear SSTI 6
Carignan 2012 Case-Control 240 100 − unclear Multiple 7
Chelemer 2002 Cohort 533 74.8 − unclear Unspecified
6
Chen C-H 2006 Cohort 756 58.6 40.7 (12.2) unclear 6
Chung S.D 2014 Cohort (Macthed cohort)
30426 53.1 − unclear SSTI 7
Chung C.P 2012 Cohort 169 0 63.8 (12.1) unclear GU 6
Colombier 2013 Case-Control 222 73.4 64 (12) unclear SSTI 6
Copeland 1994 Case-Control 73 0 67.6 unclear SSTI 5
Crowson 2012 Cohort 584 27.7 57.5 (15.1) unclear Unspecified
7
Daniels 2010 Cohort 243 21.4 55.1 unclear Infection 4
Menezes 2008 Case-Control 240 56.7 44.63 unclear SSTI 5
Demura 2009 Cohort 110 59.1 − unclear SSTI 4
Donati 2014 Cohort 2782 67.8 − unclear Unspecified
6
Dowesy 2008 Cohort 2206 44.2 − unclear Bone 7
Dublin 2009 Case-Control 3360 50.8 − unclear RTI 7
Dunkel 2012 Cohort 289 68.8 − unclear Unspecified
5
Dziedzic 2009 Cohort 659 48.5 69.6 (12.4) unclear RTI 6
Einsiedel 2013 Cohort 613 43.3 45.8 (15.7) uncelar Multiple 7
Estrada 2003 Cohort 1574 66.8 63.5 (10.4) unclear Unspecified
6
Fernandez-Fresnedo
2001 Cohort 107 71 51.4 (8.6) 1, 2 Unspecified
4
Filsoufi 2007 Cohort 2725 76.4 65.4 (10.6) unclear Multiple 7

136
Flores-Maldonado
2001 Cohort 261 15.3 40 (12) unclear SSTI 6
Friedman 2007 Cohort 4633 97 66.3 unclear SSTI 6
Frisch 2010 Cohort 3112 46.2 56.5 (16) unclear Multiple 6
Fusconi 2006 Cohort 115 − − unclear SSTI 5
Gali 2012 Cohort 574 − 60.6 (13) unclear Unspecified
6
Gansera 2006 Cohort 8666 78.6 65.1 (9.3) unclear SSTI 4
Garber 1998 Cohort 360 100 59 unclear GU 6
Garcia 2013 Cohort 92 73.9 54 (12.2) 2 Unspecified
5
Haraway 2013 Cohort 135 21.5 57 unclear SSTI 6
Harness 2010 Cohort 3003 31.2 − unclear SSTI 6
Hayes 2014 Cohort 187 61.5 − 1, 2 Blood 6
Hermsen 2011 Case-Control 352 59.1 60.3 unclear Unspecified
6
Hirotani 1999 Cohort 420 75.7 64 unclear SSTI 7
Hong 2014 Cohort 53249 48.4 − unclear GI 6
Hughes 2013 Cohort 2110 65.5 71 (8.7) unclear Multiple 4
Itagaki 2013 Cohort 1526360 73.3 64.8 (10.7) unclear SSTI 6
Jeon 2012 Cohort 13800 47.4 − unclear SSTI 6
Ji 2010 Cohort 393 70 74.2(3.1) unclear Multiple 6
Ji 2009 Cohort 441 66.9 71.8 (3) unclear Multiple 6
Jick 2006 Case-Control 2463 52.2 − unclear RTI 8
Jih 2009 Cohort 1000000 49.6 − unclear Viral 7
Joesoef 2012 Case-Control 675350 54.2 − unclear Viral 8
Jovanovic 2006 Cohort 69 91.3 − unclear SSTI 4
Kline 2009 Cohort 81 64.2 47.1 unclear SSTI 6
Kluytmans 1995 Case-Control 160 75.6 62.7 (9.6) unclear SSTI 5
Lee S-E 2010 Cohort 355 0 72.1 unclear SSTI 5
Lee S-C 2004 Case-Control 101 55.4 63.7 (14.1) unclear Blood 5
Lehtinen 2010 Nested Case-Control
469 39.9 51.6 (15.3) unclear SSTI 6
Lemaire 2009 Cohort 1749 60.1 − unclear Blood 5
Linney 2010 Case-Control 284 47.2 75.6 (12.5) unclear GI 5
Malone 2002 Cohort 5031 95 61 (13) unclear SSTI 6
Mangrulkar 2009 Cohort 489 58.7 − unclear Unspecified
5
Masgala 2012 Case-Control 200 24 71.5 (16.8) unclear Unspecified
5
Matsa 2001 Cohort 765 78.2 − unclear SSTI 5
McCampbell 2002 Cohort 191 − − unclear Multiple 5
Mekhail 2011 Cohort 707 42.3 46 (15) unclear SSTI 4
Memon 2013 Cohort 60 38.3 43.8 (11.8) unclear SSTI 6
Michalopoulos 2003 Case-Control 140 73.3 64.1 (9.9) unclear Blood 7
Migita 2013 Cohort 604 40.7 59.6 (16.8) unclear Unspecified
7
Miller 2007 Cohort 763 0 − 1, 2 SSTI 5
Minakata 2012 Cohort 1421 77.4 68.3 (9.1) unclear Multiple 7
Mittal 2014 Cohort 1651 62.7 76 (12) unclear Unspecified
6
Mohamed 2009 Cohort 7733 76.5 64.9 (10.9) unclear Unspecified
7
Mulaudzi 2009 Cohort 217 65 63.9 unclear SSTI 6
Murphy 1992 Cohort 238 76.5 62.3 (10.8) unclear Unspecified
5
Nasell 2011 Cohort 1782 46 − unclear SSTI 7
Nelson 2014 Cohort 851 49.9 50 (13.7) unclear SSTI 5
Olsen 2002 Cohort 1695 64.9 − unclear SSTI 6

137
Olsen 2008 Case-Control 273 − 52.4 unclear SSTI 6
Osterhoff 2014 Cohort 261 73.2 46 (18.6) unclear SSTI 6
Ovaska 2013 Case-Control 262 44 56 unclear SSTI 6
Powe 1999 Cohort 4918 52.3 59.1 (15.8) unclear Blood 6
Puskas 2012 Cohort 3527 70.9 62.6 (10.6) unclear SSTI 6
Ramos 2008 Cohort 995 35 56.5 (15.9) unclear Unspecified
4
Ridderstolpe 2001 Cohort 2992 72.4 65.4 (10.5) unclear SSTI 6
Risnes 2010 Nested Case-Control
551 79.3 62.9 (9.5) unclear SSTI 5
Rocco 2013 Cohort 1016 53.4 70.3 (13.1) unclear Unspecified
6
Russo 2002 Cohort 2345 75.9 65.7 unclear SSTI 6
Safdar 2005 Nested Case-Control
376 43.2 − unclear GU 5
Sajja 2012 Cohort 3072 86.8 58.2 (8.6) unclear SSTI 7
Sanderson 1990 Cohort 260 54.6 50.6 unclear Multiple 5
sato 2010 Cohort 273 73.2 65.9 (11.9) unclear Multiple 6
Schwartz 2004 Cohort 2063 99.6 − unclear SSTI 6
Sepher 2009 Cohort 316 − 62 unclear Unspecified
6
Shields 2013 Cohort 586 54.9 − unclear SSTI 7
Simon 2005 Cohort 76 89.5 50.4 (2) unclear Unspecified
6
Singh 2012 Cohort 903 15.8 48.1 (11.4) unclear SSTI 6
Song 2012 Cohort 6848 26 66.9 (12.6) unclear SSTI 5
Spinier 1998 Cohort 138 80.4 61.3 (12.2) unclear Unspecified
5
Swenne 2005 Cohort 374 77.2 65.6 (8.4) unclear SSTI 7
Tamayo 2012 Cohort 1610 39.1 67.8 (10.5) unclear RTI 7
Tang 2004 Cohort 30102 72.6 − unclear SSTI 4
Telzak 1991 Case-Control 155 51.6 67 unclear GI 5
ter Gunne 2009 Cohort 3174 40.1 55.6 (15.5) unclear SSTI 6
Togo 2007 Cohort 535 67.7 62.1 (10.5) unclear Multiple 5
Torres 2006 Cohort 863 − 68.1(10.7) unclear SSTI 5
Trieman 1994 Cohort 1023 67.3 66 unclear SSTI 5
Trick 2000 Case-Control 127 − − unclear SSTI 5
Troidle 2003 Cohort 162 53.7 55.4 (11.3) 1, 2 SSTI 6
Vergidis 2012 Case-Control 50 − 58.5 unclear Bone 5
Walcott 2014 Cohort 399 41.6 52.9 (0.8) unclear SSTI 7
Wallaert 2012 Cohort 1977 67.2 − unclear SSTI 8
Wang H. 2013 Cohort 707 32.7 72.5 (10.2) unclear Multiple 6
Weichman 2013 Cohort 546 − 49.5 (11.1) unclear Unspecified
5
Whang 2000 Cohort 900 84.3 − unclear Multiple 6
Wilson 2003 Case-Control 258 − − unclear SSTI 6
Wlazlo 2013 Cohort 226 64.6 59.2 (11.5) unclear SSTI 7
Wong-McClure 2012 Case-Control 636 48.1 56.2 unclear GI 6
Wu-H 2007 Case-Control 1180 63 60.5 (17.9) unclear RTI 5
Wukich 2010 Cohort 1000 44.3 46.7 unclear SSTI 6
Yamamoto 1992 Cohort 566 60.8 48 unclear SSTI 5
Yamauchi 2013 Cohort 1438 58.8 67 (10) unclear Multiple 6
Yavuz 2006 Cohort 991 71.9 57 (13.1) unclear SSTI 6
Horne 2008 Case-Control 247 − − unclear SSTI 4
Howard 2009 Cohort 136 44.1 54.6 (15.5) unclear SSTI 5
Kuy 2013 Cohort 106 58.5 62 (14) unclear SSTI 5
Orlander 1992 Case-Control 22778 0 60 unclear GU 6
Raja 2013 Cohort 909 66.1 62.3 (13.5) unclear Multiple 6

138
Chen W. 2013 Cohort 177527 51 − unclear RTI 6
Menderes 2010 Cohort 1000 0 29.8 (5.9) gestational SSTI 6
Topal 2012 Cohort 162 51.2 65.6 (10.5) unclear RTI 4
Guler 2006 Case-Control 204 43.1 47.7 (16.7) unclear GU 5
Ricci 2014 Cohort 335 44.8 57 unclear SSTI 6
Steele 2012 Cohort 22288 19.3 44.2 (9.8) 1, 2, gestational
Multiple 6
Chaichana 2014 Cohort 817 45.6 56 (14) unclear SSTI 7
Hashimoto 2008 Cohort 242 54.5 − unclear Blood 6
Park 2012 Cohort 770 74.8 37.9 unclear SSTI 6
Troutman 2001 Nested Case-Control
56 69.6 − unclear SSTI 4
Trussell 2008 Cohort 1482 71.9 67.1 (10.4) unclear SSTI 6

139
Appendix 2.C: Publication Bias Funnel Plots:
(1) SSTI Infections/Cohort Studies:

140
(2) SSTI Infections/Case-Control Studies:

141
(3) RTI Infections/Cohort Studies:

142
(4) RTI Infections/Case-Control Studies:

143
(5) Genitourinary Infections/Cohort Studies:

144
(6) Blood Infections/Cohort Studies:

145
(7) Viral Infections/Cohort Studies:

146
(8) Unspecified Infections/Cohort Studies:

147
Appendix 3.A: Exposure and Outcome Case Definitions:
Exposure/Outcome
Classification of Variables
Diabetes CPCSSN Validated Case Definition using problem list (Diabetes,
NIDDM, DM), Diagnostic codes (ICD-9: 250.0-250.9),
medication list (insulin, oral antidiabetic agents, ATC code A10),
and
lab test results (HbA1c>7%, fasting BS>7)
Infection Any infection-
Related Visit
Any record in EMR for any infection plus ICD-9 codes: 001-139,
320-326, 391.1, 391.2, 421, 451, 685, 461.0-461.3, 461.8, 461.9,
473.0-473.3, 473.8, 473.9, 460, 472.2, 462, 472.1, 463, 474.00,
464.3, 464.5, 464.0, 476.0, 464.2, 476.1, 464.1, 491.8, 466, 490,
491, 480-486, 510 + (041.0-041.9), 010-018, 590.0-590.3, 590.8,
590.9, 595, 597, 601.0, 601.1, 601.9, 604, 607.1, 112.2, 611.0,
614.0-614.5, 614.7, 615.9, 616.0, 616.1, 616.81, 090-099, V02.7,
647.1, 110-118, 680, 681-682, 683, 684, 686, 728, 727.00, 727.02,
727.05. 727.06, 729.4, 730.0-730.2, 730.3, 382.2, 711.0-711.9,
003, 005, 004, 006, 009.0, 009.1, 531-535, 540-543, 567, 370.3,
370.4, 372.0-372.3, 373.0, 373.1, 373.4-373.6, 373.8, 373.9, 076,
380.0, 380.1, 381.0-381.5, 382.0-382.9, 384.0, 384.1, 383.0, 383.1,
383.9, 052, 053, 054, 055, 056, 072, 487, 488, 070, J01, J02, J04,
J05, D01, D06, G01, P01, P02, P03, A07A
Infection Respiratory
Tract
Infections
Upper
respiratory
tract
infection
Sinusitis Any record in EMR plus ICD-9: 461.0-461.3, 461.8, 461.9, 473.0-
473.3, 473.8, 473.9
Naso-
pharyngitis
Any record in EMR plus ICD-9: 460, 472.2
Pharyngitis Any record in EMR plus ICD-9: 462, 472.1
Tonsillitis Any record in EMR plus ICD-9: 463, 474.00
Epiglottitis Any record in EMR plus ICD-9: 464.3, 464.5
Laryngitis Any record in EMR plus ICD-9: 464.0, 476.0
Laryngo- Any record in EMR plus ICD-9: 464.2, 476.1

148
tracheitis
Tracheitis Any record in EMR plus ICD-9: 464.1, 491.8
Lower
respiratory
tract
infection
Bronchitis Any record in EMR plus ICD-9: 466, 490, 491
Pneumonia Any record in EMR plus ICD-9: 480-486
Empyema Any record in EMR plus ICD-9: 510 + (041.0-041.9)
Tuberculosis Any record in EMR plus ICD-9: 010-018
Genitourinary
Tract Infection
Urinary
tract
infection
Pyelonephritis Any record in EMR plus ICD-9: 590.0-590.3, 590.8, 590.9
Cystitis Any record in EMR plus ICD-9: 595
Urethritis Any record in EMR plus ICD-9: 597
Prostatitis Any record in EMR plus ICD-9: 601.0, 601.1, 601.9
Genital
infection
Epididymitis Any record in EMR plus ICD-9: 604
Balanitis Any record in EMR plus ICD-9: 607.1, 112.2
Pelvic
Inflammatory
Disease
Any record in EMR plus ICD-9: 611.0, 614.0-614.5, 614.7, 615.9,
616.0, 616.1, 616.81
Syphilis Any record in EMR plus ICD-9: 090-099
Gonorrhea Any record in EMR plus ICD-9: V02.7, 647.1
Skin and Soft Tissue
Infection
Mycoses Any record in EMR plus ICD-9: 110-118
Carbuncle and
Furuncle
Any record in EMR plus ICD-9: 680
Cellulitis Any record in EMR plus ICD-9: 681-682
Lymphadenitis Any record in EMR plus ICD-9: 683
Impetigo Any record in EMR plus ICD-9: 684
Other Any record in EMR plus ICD-9: 686
Musculoskeletal Infection Myositis Any record in EMR plus ICD-9: 728
Synovitis Any record in EMR plus ICD-9: 727.00, 727.02, 727.05. 727.06
Fasciitis Any record in EMR plus ICD-9: 729.4
Osteomyelitis Any record in EMR plus ICD-9: 730.0-730.2

149
Periostitis Any record in EMR plus ICD-9: 730.3
Petrositis Any record in EMR plus ICD-9: 382.2
Arthropathy
Associated
Infection
Any record in EMR plus ICD-9: 711.0-711.9
Gastrointestinal Infection Salmonela
(food
poisoning)
Any record in EMR plus ICD-9: 003, 005
Shigellosis Any record in EMR plus ICD-9: 004
Amebiasis Any record in EMR plus ICD-9: 006
Gastroenteritis Any record in EMR plus ICD-9: 009.0, 009.1
Ulcer Any record in EMR plus ICD-9: 531-535
Appendicitis Any record in EMR plus ICD-9: 540-543
Peritonitis Any record in EMR plus ICD-9: 567
Head & Neck Infections Conjunctivitis Any record in EMR plus ICD-9: 370.3, 370.4, 372.0-372.3
Blepharitis Any record in EMR plus ICD-9: 373.0, 373.1, 373.4-373.6, 373.8,
373.9
Trachoma Any record in EMR plus ICD-9: 076
Otitis Externa Any record in EMR plus ICD-9: 380.0, 380.1
Otitis Media Any record in EMR plus ICD-9: 381.0-381.5, 382.0-382.9
Myringitis Any record in EMR plus ICD-9: 384.0, 384.1
Mastoditis Any record in EMR plus ICD-9: 383.0, 383.1, 383.9
Viral Infections Chickenpox Any record in EMR plus ICD-9: 052
Herpes Zoster Any record in EMR plus ICD-9: 053
Herpes Simplex Any record in EMR plus ICD-9: 054
Measles Any record in EMR plus ICD-9: 055
Rubella Any record in EMR plus ICD-9: 056
Mumps Any record in EMR plus ICD-9: 072
Influenza Any record in EMR plus ICD-9: 487, 488
Hepatitis Any record in EMR plus ICD-9: 070

150
Medications Anti-infectives Any record in EMR plus ATC code: J01, J02, J04, J05, D01, D06,
G01, P01, P02, P03, A07A
Appendix 3.B: Diagnostic Codes for Exclusion:
Category Classification of Variables
Neoplasms Any record in EMR plus ICD-
9: 140-239
AIDS/HIV Any record in EMR plus ICD-
9: 042-044
Organ Transplant Kidney Any record in EMR plus ICD-
9: 55.6
Liver Any record in EMR plus ICD-
9: 50.51
Heart Any record in EMR plus ICD-
9: 37.52, 37.60, 37.65-37.67
Medication use Immunosuppressant Any record in EMR plus ATC
code: L04
Corticosteroids Any record in EMR plus ATC
code: H02

151
Appendix 3.C: Timeline of Subject Recruitment and Follow-up:
2007 2008 2009 2010 2011 2012 2013 2014
Covariate
measurement
Cohort
Entry
Starts
Cohort
Entry
Ends
End of
study:
Minimum
one year
follow up
Covariate Measurement Period: Starts January 1, 2007 to March 31, 2013.
Cohort Entry Period: Starts January 1, 2008 to March 31, 2013.
End of Study: Study will end March 31, 2014, which ensure at least one-year follow up.

152
Appendix 3.D: Case Definitions for Potential Confounders and Effect Modifiers:
Category Variable Name Classification of
Variable
Demographic ID De-identified ID
Age Birth year
Sex Sex
Lab Values HbA1c HbA1c
Temperature >37.5 C Temperature
WBC > 10,000 mcL WBC count
Fasting Glucose Fasting Glucose
BMI BMI
Lipids Lipids
Urine albumin creatinine ratio Urine albumin creatinine
ratio
Health Services
Utilization
Number of primary care
physicians visits
Number of visits
Referrals to specialist Number of referrals
Number of lab tests ordered Number of lab tests
Medications Anti-diabetic Medications Any record in EMR plus
ATC code: A10A, A10B
Immunosuppressant Any record in EMR plus

153
ATC code: L04
Corticosteroids Any record in EMR plus
ATC code: H02
Immunoglobulins Any record in EMR plus
ATC code: J06
Vaccines Any record in EMR plus
ATC code: J07
Drugs for Acid-related Disorders Any record in EMR plus
ATC code: A02A,
A02B, A02X
Respiratory System Agents Any record in EMR plus
ATC code: R01-R07
Lipid Modifying Agents Any record in EMR plus
ATC code: C10
Diabetes Comorbidities Microvascular Nephropathy
Any record in EMR plus
ICD-9: 250.40-250.43,
583.81, 581.81
Neuropathy Any record in EMR plus
ICD-9: 250.60-250.63,
337.1, 357.2, 536.3,
353.5
Retinopathy Any record in EMR plus

154
ICD-9: 250.50-250.53,
362.00-362.07, 369.00-
369.90, 366.41, 265.41
Macrovascular
Peripheral
vascular disease
Any record in EMR plus
ICD-9: 443.9, 441,
785.4, V43.4, 38.48
Cerebrovascular
disease
Any record in EMR plus
ICD-9: 430-438
Myocardial
infarction
Any record in EMR plus
ICD-9: 410, 412
Congestive
heart failure
Any record in EMR plus
ICD-9: 428
Non-Alcoholic Fatty Liver
Disease
Any record in EMR plus
ICD-9: 571.8
Obesity Any record in EMR plus
ICD-9: 278, 783.1,
V77.8
Respiratory disease Any record in EMR plus
ICD-9: 460-519

155
Appendix 3.E: Odds Ratio (OR) of All Covariates for All Types of Infection:
Any Infection:
Variable Crude
OR
95%CI P value Adjusted
OR
95%CI P value
Diabetes 0.96 0.86-1.06 0.399 1.21 1.07-1.37 0.002
Age:
18-29 Years
30-39 Years
40-49 Years
50-59 Years
60-69 Years
≥70 Years
1.01
1.20
1.12
0.94
0.86
0.89-1.14
1.05-1.36
0.99-1.27
0.82-1.09
0.73-1.00
0.890
0.006
0.080
0.443
0.058
0.97
1.14
1.10
0.95
0.77
0.85-1.10
1.00-1.31
0.96-1.25
0.82-1.11
0.65-0.91
0.636
0.048
0.174
0.535
0.002
Sex (Female) 0.70 0.65-0.76 <0.001 0.73 0.68-0.80 <0.001
Microvascular 1.70 0.85-3.39 0.130 1.53 0.75-3.12 0.244
Macrovascular 0.77 0.56-1.05 0.104 0.75 0.54-1.05 0.091
Respiratory
Disease
2.32 2.09-2.58 <0.001 1.45 1.28-1.64 <0.001
Doctor Visits:
≤12 Visits
>12 Visits
2.18
1.94-2.18
<0.001
1.33
1.02-1.73
0.033
Referral:
0-1

156
≥2 1.45 1.17-1.80 0.001 1.06 0.84-1.32 0.621
Lab Number:
0-29
30-59
60-89
90-119
120-149
≥150
1.21
1.17
1.05
1.40
1.76
1.03-1.41
0.93-1.47
0.77-1.43
0.88-2.18
1.21-2.56
0.017
0.167
0.757
0.148
0.003
0.99
0.96
0.84
1.02
1.16
0.84-1.17
0.75-1.22
0.61-1.16
0.64-1.62
0.79-1.71
0.947
0.734
0.301
0.935
0.449
Infection Before 1
Year Of Entry:
0
1
≥2
1.76
3.12
1.58-1.97
2.82-2.46
<0.001
<0.001
1.60
2.54
1.42-1.79
1.26-2.85
<0.001
<0.001
Vaccines 1.35 1.19-1.53 <0.001 1.09 0.95-1.25 0.193
Drugs For Acid
Related Disorders
1.56 1.37-1.78 <0.001 1.24 1.08-1.44 0.003
Respiratory Med 2.02 1.76-2.31 <0.001 1.22 1.04-1.43 0.012
Lipid Medications 1.00 0.89-1.13 0.966 1.07 0.92-1.24 0.356
Chf 1.42 0.64-3.14 0.384 1.20 0.52-2.74 0.671
Fatty Liver
Disease
1.12 0.43-2.96 0.810 0.81 0.29-2.20 0.675
Obesity 1.39 1.00-1.92 0.048 1.15 0.82-1.62 0.418

157
Head&Neck Infections:
Variable Crude
IRR
95%CI P value Adjusted
IRR
95%CI P value
Diabetes 0.90 0.74-1.11 0.328 1.10 0.87-1.39 0.428
Age:
18-29 Years
30-39 Years
40-49 Years
50-59 Years
60-69 Years
≥70 Years
0.94
1.07
1.08
0.96
0.92
0.74-1.18
0.85-1.35
0.86-1.36
0.73-1.27
0.68-1.24
0.579
0.565
0.494
0.788
0.576
0.84
1.00
1.01
0.96
0.78
0.66-1.08
0.78-1.27
0.79-1.28
0.72-1.38
0.56-1.08
0.170
0.990
0.934
0.785
0.139
Sex (Female) 0.80 0.69-0.92 0.002 0.83 0.71-0.97 0.017
Microvascular 1.11 0.41-3.00 0.834 0.77 0.27-2.19 0.628
Macrovascular 1.13 0.64-2.01 0.700 1.04 0.57-1.91 0.885
Respiratory
Disease
2.11 1.80-2.48 <0.001 1.42 1.17-1.74 <0.001
Doctor Visits:
≤12 Visitis
>12 Visits
1.91
1.34-2.74
<0.001
1.30
0.89-1.89
0.176
Referral:
0-1
≥2
1.64
1.15-2.34
0.006
1.28
0.89-1.86
0.185

158
Lab Number:
0-29
30-59
60-89
90-119
120-149
≥150
1.39
0.54
0.67
1.01
1.25
1.01-1.92
0.29-1.00
0.30-1.50
0.34-2.97
0.59-2.63
0.046
0.050
0.332
0.991
0.562
1.09
0.37
0.54
0.91
0.71
0.78-1.53
0.20-0.70
0.24-1.22
0.30-2.72
0.33-1.55
0.615
0.002
0.867
0.867
0.395
Infection Before 1
Year Of Entry:
0
1
≥2
1.68
2.72
1.35-2.08
2.28-3.26
<0.001
<0.001
1.48
2.14
1.18-1.85
1.74-2.63
0.001
<0.001
Vaccines 1.73 1.41-2.13 <0.001 1.44 1.15-1.80 <0.001
Drugs For Acid
Related Disorders
1.60 1.29-1.98 <0.001 1.51 1.25-1.81 <0.001
Respiratory Med 1.78 1.44-2.19 <0.001 1.29 1.02-1.63 0.030
Lipid Medications 1.01 0.80-1.27 0.925 1.00 0.76-1.32 0.983
Heart Failure 1.37 0.38-4.98 0.631 1.50 0.39-5.71 0.552
Fatty Liver
Disease
3.69 0.79-17.21 0.096 2.10 0.42-10.58 0.368
Obesity 1.52 0.94-2.47 0.090 1.07 0.64-1.79 0.794

159
Respiratory Infections:
Variable Crude
OR
95%CI P value Adjusted
OR
95%CI P value
Diabetes 0.84 0.75-0.94 0.003 1.31 1.14-1.50 <0.001
Age:
18-29 Years
30-39 Years
40-49 Years
50-59 Years
60-69 Years
≥70 Years
1.45
1.73
1.40
0.93
0.79
1.27-1.66
1.51-1.98
1.22-1.61
0.79-1.09
0.65-0.95
<0.001
<0.001
<0.001
0.369
0.011
1.38
1.65
1.37
0.97
0.73
1.19-1.59
1.43-1.91
1.18-1.59
0.82-1.15
0.60-0.89
<0.001
<0.001
<0.001
0.733
0.002
Sex (Female) 0.64 0.59-0.70 <0.001 0.68 0.62-0.75 <0.001
Microvascular 0.95 0.49-1.84 0.883 0.84 0.41-1.69 0.620
Macrovascular 0.63 0.44-0.91 0.014 0.84 0.57-1.23 0.370
Respiratory
Disease
2.55 2.30-2.82 <0.001 1.86 1.65-2.11 <0.001
Doctor Visits:
≤12 Visits
>12 Visits
1.81
1.45-2.26
<0.001
1.17
0.92-1.48
0.198
Referral:
0-1

160
≥2 1.87 1.51-2.31 <0.001 1.48 1.18-1.85 0.001
Lab Number:
0-29
30-59
60-89
90-119
120-149
≥150
1.23
1.08
1.35
1.54
1.24
1.03-1.47
0.83-1.39
0.95-1.92
0.95-2.49
0.83-1.85
0.023
0.561
0.090
0.076
0.290
1.16
0.95
1.29
1.28
0.92
0.96-1.39
0.73-1.25
0.89-1.86
0.77-2.10
0.61-1.41
0.131
0.743
0.177
0.337
0.719
Infection Before 1
Year Of Entry:
0
1
≥2
1.55
2.73
1.37-1.74
2.46-3.03
<0.001
<0.001
1.30
1.96
1.14-1.46
1.74-2.22
<0.001
<0.001
Vaccines 1.01 0.89-1.16 0.854 0.88 0.76-1.01 0.080
Drugs For Acid
Related Disorders
1.34 1.17-1.54 <0.001 1.18 1.02-1.37 0.027
Respiratory Med 1.87 1.64-2.13 <0.001 1.06 0.91-1.23 0.467
Lipid Medications 0.71 0.62-0.82 <0.001 0.88 0.74-1.04 0.139
Heart Failure 0.92 0.40-2.14 0.852 1.13 0.47-2.74 0.779
Fatty Liver
Disease
0.73 0.24-2.21 0.581 0.56 0.18-1.75 0.318
Obesity 1.37 0.99-1.89 0.056 1.13 0.81-1.60 0.468

161
Gastrointestinal Infections:
Variable Crude
OR
95%CI P value Adjusted
OR
95%CI P value
Diabetes 1.38 1.15-1.67 <0.001 1.41 1.13-1.75 <0.001
Age:
18-29 Years
30-39 Years
40-49 Years
50-59 Years
60-69 Years
≥70 Years
0.75
0.73
0.95
0.94
1.04
0.58-0.95
0.57-0.94
0.75-1.22
0.71-1.23
0.78-1.38
0.019
0.014
0.703
0.638
0.801
0.79
0.76
0.92
0.89
0.94
0.64-0.95
0.61-0.92
0.90-1.31
0.87-1.33
0.89-1.39
0.080
0.043
0.504
0.443
0.706
Sex (Female) 1.15 0.99-1.34 0.074 1.16 0.99-1.35 0.070
Microvascular 2.93 1.10-7.78 0.031 2.21 0.77-6.31 0.138
Macrovascular 1.05 0.59-1.86 0.872 0.79 0.43-1.46 0.461
Respiratory
Disease
1.22 1.02-1.46 0.032 0.98 0.79-1.23 0.891
Doctor Visits:
≤12 Visits
>12 Visits
2.46
1.78-3.41
<0.001
2.05
1.46-2.90
<0.001
Referral:
0-1
≥2
1.11
0.72-1.72
0.619
0.87
0.55-1.37
0.549
Lab Number:

162
0-29
30-59
60-89
90-119
120-149
≥150
0.69
0.75
0.92
1.17
1.60
0.47-1.01
0.42-1.34
0.44-1.94
0.48-2.87
0.80-3.19
0.060
0.334
0.837
0.731
0.182
0.60
0.62
0.79
0.91
1.19
0.40-0.89
0.34-1.14
0.37-1.69
0.36-2.31
0.58-2.45
0.012
0.125
0.548
0.850
0.631
Infection Before 1
Year Of Entry:
0
1
≥2
1.44
1.67
1.16-1.79
1.38-2.02
0.001
<0.001
1.47
1.71
1.17-1.84
1.36-2.13
0.120
<0.001
Vaccines 1.23 0.97-1.54 0.082 1.04 0.81-1.34 0.745
Drugs For Acid
Related Disorders
2.22 1.79-2.76 <0.001 1.89 1.49-2.38 <0.001
Respiratory Med 1.02 0.80-1.31 0.840 0.78 0.58-1.03 0.083
Lipid Medications 1.31 1.04-1.64 0.021 0.93 0.71-1.22 0.618
Heart Failure 0.71 0.15-3.29 0.666 0.45 0.09-2.15 0.319
Fatty Liver
Disease
0.39 0.05-3.17 0.379 0.24 0.03-2.05 0.191
Obesity 1.34 0.75-2.38 0.471 1.22 0.67-2.24 0.510

163
Genitourinary Infections:
Variable Crude
OR
95%CI P value Adjusted
OR
95%CI P value
Diabetes 1.10 0.94-1.29 0.238 1.42 1.17-1.73 <0.001
Age:
18-29 Years
30-39 Years
40-49 Years
50-59 Years
60-69 Years
≥70 Years
1.06
0.97
1.04
1.04
1.19
0.77-1.29
0.79-1.19
0.85-1.28
0.83-1.31
0.94-1.52
0.552
0.791
0.691
0.727
0.150
0.94
0.82
0.98
1.00
0.93
0.76-1.16
0.66-1.02
0.79-1.22
0.78-1.27
0.71-1.21
0.580
0.080
0.889
0.975
0.585
Sex (Female) 0.31 0.27-0.36 <0.001 0.32 0.27-0.37 <0.001
Microvascular 0.89 0.36-2.23 0.809 0.59 0.22-1.54 0.281
Macrovascular 1.15 0.72-1.84 0.549 1.21 0.73-2.02 0.460
Respiratory
Disease
1.77 1.54-2.03 <0.001 1.09 0.92-1.30 0.315
Doctor Visits:
≤12 Visits
>12 Visits
2.52
1.93-3.28
<0.001
1.63
1.22-2.18
0.001
Referral:
0-1
≥2
1.16
0.84-1.59
0.920
0.84
0.60-1.17
0.308
Lab Number:

164
0-29
30-59
60-89
90-119
120-149
≥150
1.37
0.98
1.05
0.67
1.48
1.05-1.81
0.65-1.49
0.60-1.85
0.23-1.91
0.82-2.67
0.022
0.944
0.866
0.450
0.192
1.09
0.72
0.71
0.37
0.86
0.81-1.46
0.46-1.12
0.39-1.27
0.12-1.12
0.46-1.61
0.572
0.146
0.248
0.079
0.648
Infection Before 1
Year Of Entry:
0
1
≥2
1.65
2.81
1.38-1.98
2.41-3.27
<0.001
<0.001
1.55
2.43
1.28-1.88
2.04-2.90
<0.001
<0.001
Vaccines 1.36 1.14-1.63 <0.001 0.99 0.81-1.21 0.948
Drugs For Acid
Related Disorders
1.79 1.49-2.14 <0.001 1.36 1.11-1.67 0.003
Respiratory Med 1.81 1.52-2.17 <0.001 1.25 1.01-1.54 0.038
Lipid Medications 1.03 0.85-1.25 0.770 0.98 0.77-1.25 0.882
Heart Failure 1.91 0.76-4.78 0.167 1.41 0.53-3.72 0.490
Fatty Liver
Disease
4.42 1.30-15.07 0.017 4.66 1.20-18.17 0.027
Obesity 1.61 1.04-2.51 0.033 1.32 0.81-2.14 0.261

165
Skin&Soft Infections:
Variable Crude
OR
95%CI P value Adjusted
OR
95%CI P value
Diabetes 1.43 1.21-1.69 <0.001 1.65 1.36-2.01 <0.001
Age:
18-29 Years
30-39 Years
40-49 Years
50-59 Years
60-69 Years
≥70 Years
0.89
1.04
1.05
0.88
1.17
0.71-1.10
0.84-1.30
0.84-1.32
0.68-1.14
0.90-1.51
0.286
0.696
0.636
0.334
0.240
0.95
1.07
1.08
0.86
1.04
0.76-1.20
0.86-1.35
0.86-1.35
0.66-1.11
0.79-1.37
0.678
0.533
0.527
0.249
0.778
Sex (Female) 1.05 0.91-1.20 0.497 1.07 0.93-1.23 0.323
Microvascular 2.84 1.27-6.34 0.011 1.86 0.80-4.28 0.146
Macrovascular 1.24 0.77-1.99 0.378 1.04 0.63-1.72 0.880
Respiratory
Disease
1.65 1.41-1.93 <0.001 1.33 1.10-1.61 0.004
Doctor Visits:
≤12 Visits
>12 Visits
2.42
1.79-3.26
<0.001
1.89
1.37-2.60
<0.001
Referral:
0-1
≥2
1.02
0.70-1.49
0.901
0.80
0.54-1.18
0.263
Lab Number:

166
0-29
30-59
60-89
90-119
120-149
≥150
1.48
0.62
1.96
0.51
1.25
1.11-1.99
0.36-1.06
1.13-3.41
0.15-1.70
0.61-2.56
0.009
0.081
0.017
0.276
0.549
1.32
0.51
1.65
0.43
0.98
0.98-1.79
0.29-0.88
0.93-2.93
0.13-1.45
0.46-2.09
0.070
0.015
0.088
0.174
0.965
Infection Before 1
Year Of Entry:
0
1
≥2
1.29
1.73
1.06-1.56
1.47-2.05
0.011
<0.001
1.25
1.53
1.02-1.53
1.26-1.87
0.033
<0.001
Vaccines 1.20 0.98-1.48 0.075 1.01 0.82-1.26 0.907
Drugs For Acid
Related Disorders
1.44 1.17-1.78 0.001 1.19 0.95-1.49 0.125
Respiratory Med 1.47 1.19-1.82 <0.001 1.03 0.81-1.31 0.809
Lipid Medications 1.10 0.88-1.36 0.019 0.87 0.67-1.12 0.276
Heart Failure 1.12 0.31-3.96 0.863 0.71 0.19-2.66 0.613
Fatty Liver
Disease
0.84 0.18-3.90 0.824 0.60 0.12-2.91 0.524
Obesity 1.90 1.18-3.06 0.002 1.44 0.87-2.36 0.152

167
Musculoskeletal Infections:
Variable Crude
OR
95%CI P value Adjusted
OR
95%CI P value
Diabetes 0.97 0.82-1.14 0.714 1.05 0.87-1.28 0.606
Age:
18-29 Years
30-39 Years
40-49 Years
50-59 Years
60-69 Years
≥70 Years
0.59
0.80
1.40
0.87
0.43
0.48-0.72
0.65-0.97
1.16-1.68
0.70-1.09
0.32-0.58
<0.001
0.024
<0.001
0.227
<0.001
0.57
0.76
1.40
0.88
0.38
0.47-0.70
0.62-0.93
1.15-1.69
0.70-1.11
0.27-0.51
<0.001
0.008
0.001
0.273
<0.001
Sex (Female) 0.65 0.57-0.73 <0.001 0.62 0.54-0.71 <0.001
Microvascular 2.21 1.04-4.69 0.039 2.12 0.97-4.67 0.061
Macrovascular 0.71 0.40-1.26 0.240 0.83 0.45-1.51 0.539
Respiratory
Disease
1.23 1.07-1.43 0.005 0.97 0.81-1.16 0.734
Doctor Visits:
≤12 Visits
>12 Visits
1.51
1.11-2.04
0.008
1.15
0.83-1.59
0.400
Referral:
0-1
≥2
2.02
1.52-2.68
<0.001
1.75
1.30-2.35
<0.001
Lab Number:

168
0-29
30-59
60-89
90-119
120-149
≥150
1.03
1.58
0.96
0.99
1.11
0.78-1.36
1.10-2.27
0.57-1.63
0.45-2.17
0.61-2.03
0.815
0.013
0.895
0.983
0.724
0.92
1.41
0.85
0.72
0.82
0.69-1.23
0.97-2.05
0.50-1.46
0.32-1.60
0.44-1.53
0.579
0.074
0.565
0.417
0.536
Infection Before 1
Year Of Entry:
0
1
≥2
1.21
1.57
1.01-1.44
1.35-1.82
0.033
<0.001
1.16
1.46
0.96-1.40
1.23-1.74
0.113
<0.001
Vaccines 1.06 0.88-1.29 0.514 1.03 0.84-1.27 0.757
Drugs For Acid
Related Disorders
1.56 1.29-1.87 <0.001 1.38 1.13-1.69 0.002
Respiratory Med 1.24 1.02-1.50 0.028 0.96 0.77-1.20 0.755
Lipid Medications 0.97 0.79-1.18 0.758 0.97 0.77-1.23 0.802
Heart Failure 1.60 0.59-4.31 0.354 2.52 0.89-7.13 0.081
Fatty Liver
Disease
2.12 0.63-7.10 0.223 1.70 0.49-5.93 0.403
Obesity 1.25 0.80-1.95 0.320 1.01 0.63-1.62 0.963

169
Viral Infections:
Variable Crude
OR
95%CI P value Adjusted
OR
95%CI P value
Diabetes 1.21 0.95-1.55 0.115 1.11 0.83-1.47 0.485
Age:
18-29 Years
30-39 Years
40-49 Years
50-59 Years
60-69 Years
≥70 Years
0.73
0.73
0.99
1.13
1.06
0.53-1.00
0.53-1.01
0.73-1.35
0.80-1.58
0.73-1.54
0.048
0.059
0.958
0.490
0.742
0.72
0.69
1.02
1.03
0.84
0.52-1.00
0.49-0.97
0.74-1.40
0.73-1.46
0.57-1.26
0.055
0.035
0.907
0.860
0.404
Sex (Female) 0.86 0.71-1.05 0.140 0.84 0.68-1.03 0.090
Microvascular 3.32 0.96-11.44 0.058 2.15 0.58-8.00 0.254
Macrovascular 1.14 0.53-2.47 0.740 0.82 0.36-1.85 0.635
Respiratory
Disease
1.70 1.36-2.11 <0.001 1.31 1.00-1.72 0.051
Doctor Visits:
≤12 Visits
>12 Visits
1.48
0.95-2.32
0.085
1.10
0.68-1.78
0.698
Referral:
0-1
≥2
0.82
0.46-1.46
0.507
0.63
0.35-1.15
0.133
Lab Number:

170
0-29
30-59
60-89
90-119
120-149
≥150
1.43
0.99
1.07
2.13
0.60
0.96-2.11
0.55-1.79
0.46-2.48
0.83-5.45
0.18-2.00
0.074
0.976
0.869
0.114
0.407
1.16
0.76
0.81
1.90
0.43
0.77-1.75
0.41-1.41
0.34-1.94
0.72-4.99
0.13-1.46
0.462
0.382
0.645
0.191
0.176
Infection Before 1
Year Of Entry:
0
1
≥2
1.18
1.68
0.89-1.57
1.33-2.13
0.240
<0.001
1.11
1.40
0.82-1.49
1.06-1.86
0.503
0.017
Vaccines 2.27 1.76-2.92 <0.001 1.99 1.52-2.61 <0.001
Drugs For Acid
Related Disorders
1.48 1.11-1.96 0.007 1.13 0.83-1.54 0.425
Respiratory Med 1.65 1.25-2.19 <0.001 1.17 0.84-1.63 0.354
Lipid Medications 1.32 0.98-1.76 0.063 1.08 0.77-1.52 0.660
Heart Failure 0.58 0.07-4.74 0.612 0.42 0.05-3.54 0.428
Fatty Liver
Disease
10.24 2.43-43.19 0.002 12.28 2.79-54.14 <0.001
Obesity 1.93 1.05-3.54 0.033 1.67 0.89-3.13 0.107

171
Appendix 3.F: Odds Ratio (OR) Of All Covariates For All Types Of Infection 1-Year
Period:
Any Infection:
Variable Crude
OR
95%CI P value Adjusted
OR
95%CI P value
Diabetes 1.06 0.95-1.18 0.290 1.37 1.21-1.55 <0.001
Age:
18-29 Years
30-39 Years
40-49 Years
50-59 Years
60-69 Years
≥70 Years
1.27
1.18
1.26
1.05
1.17
1.12-1.45
1.04-1.35
1.10-1.44
0.91-1.23
0.99-1.38
<0.000
0.012
0.001
0.482
0.063
1.24
1.13
1.24
1.07
1.05
1.09-1.43
0.98-1.30
1.07-1.42
0.92-1.26
0.88-1.25
0.002
0.086
0.003
0.369
0.610
Sex (Female) 0.69 0.63-0.75 <0.001 0.72 0.66-0.78 <0.001
Microvascular 2.60 1.36-4.97 0.004 2.12 1.06-4.25 0.033
Macrovascular 1.00 0.72-1.40 0.989 0.93 0.65-1.33 0.695
Respiratory
Disease
2.19 1.99-2.41 <0.001 1.48 1.31-1.66 <0.001
Doctor Visits:
≤12 Visits
>12 Visits
2.48
2.00-3.07
<0.001
1.61
1.28-2.03
<0.001
Referral:

172
0-1
≥2
1.47
1.20-1.80
<0.001
1.09
0.88-1.35
0.435
Lab Number:
0-29
30-59
60-89
90-119
120-149
≥150
1.04
1.11
0.98
1.20
1.54
0.89-1.23
0.87-1.41
0.70-1.37
0.75-1.92
1.07-2.22
0.602
0.400
0.909
0.443
0.019
0.87
0.89
0.78
0.86
1.01
0.73-1.03
0.69-1.15
0.55-1.11
0.53-1.40
0.69-1.48
0.104
0.386
0.165
0.550
0.945
Infection Before 1
Year Of Entry:
0
1
≥2
1.64
2.65
1.46-1.84
2.40-2.93
<0.001
<0.001
1.48
2.14
1.25-1.47
1.91-2.40
<0.001
<0.001
Vaccines 1.32 1.17-1.50 0.026 1.04 0.91-1.19 0.561
Drugs For Acid
Related Disorders
1.61 1.41-1.83 <0.001 1.28 1.12-1.48 <0.001
Respiratory Med 1.88 1.66-2.14 <0.001 1.16 1.00-1.34 0.047
Lipid Medications 0.98 0.86-1.11 0.333 0.96 0.82-1.12 0.605
Heart Failure 1.54 1.03-2.30 0.034 1.63 0.75-3.56 0.217
Fatty Liver
Disease
1.48 0.60-3.67 0.391 1.19 0.48-2.97 0.708
Obesity 1.29 0.94-1.78 0.115 1.04 0.74-1.45 0.823

173
Head&Neck Infections:
Variable Crude
OR
95%CI P value Adjusted
OR
95%CI P value
Diabetes 0.83 0.59-1.17 0.285 1.12 0.75-1.67 0.573
Age:
18-29 Years
30-39 Years
40-49 Years
50-59 Years
60-69 Years
≥70 Years
1.40
1.26
1.64
0.97
1.24
0.96-2.04
0.85-1.87
1.13-2.40
0.60-1.58
0.76-2.04
0.082
0.253
0.010
0.911
0.392
1.23
1.13
1.53
1.05
1.21
0.82-1.85
0.74-1.73
1.03-2.27
0.63-1.74
0.71-2.06
0.312
0.564
0.033
0.849
0.484
Sex (Female) 0.76 0.60-0.97 0.030 0.85 0.65-1.09 0.201
Microvascular 1.46 0.30-6.98 0.638 0.96 0.19-4.88 0.959
Macrovascular 1.08 0.37-3.15 0.895 0.93 0.29-2.97 0.903
Respiratory
Disease
2.06 1.59-2.68 <0.001 1.24 0.90-1.71 0.192
Doctor Visits:
≤12 Visits
>12 Visits
1.86
1.04-3.32
0.036
1.10
0.59-2.06
0.762
Referral:
0-1
≥2
2.49
1.53-4.03
<0.001
1.85
1.10-3.13
0.021
Lab Number:
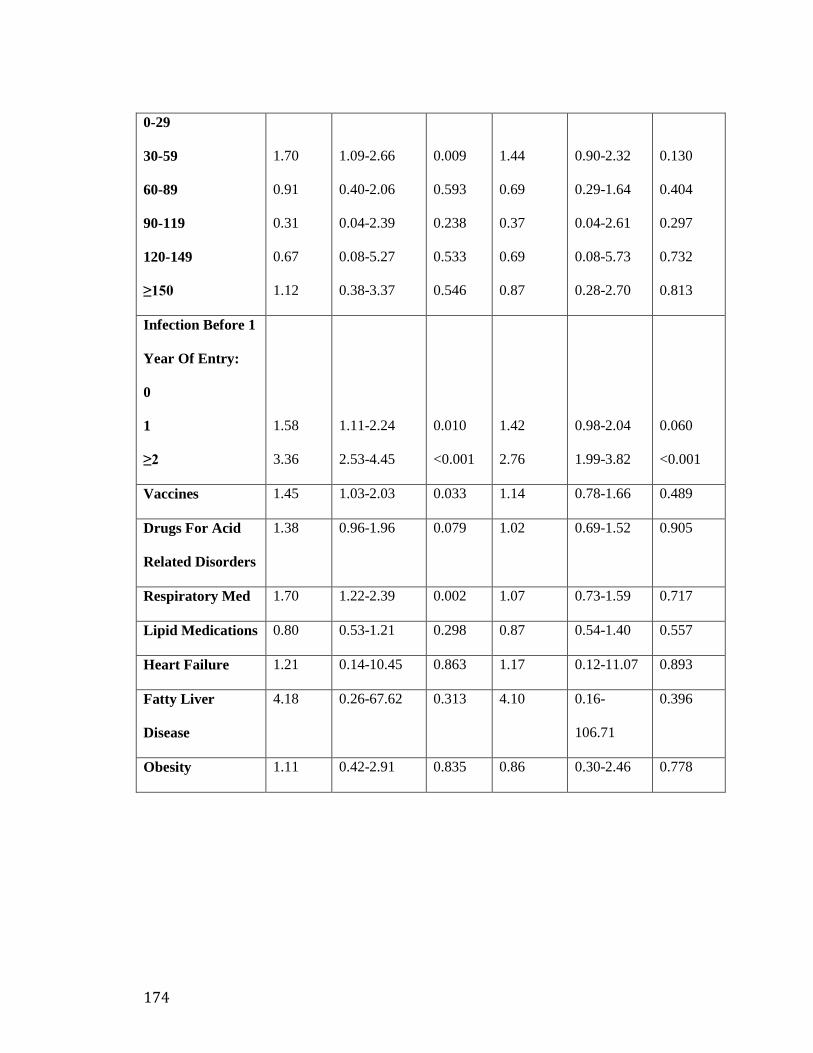
174
0-29
30-59
60-89
90-119
120-149
≥150
1.70
0.91
0.31
0.67
1.12
1.09-2.66
0.40-2.06
0.04-2.39
0.08-5.27
0.38-3.37
0.009
0.593
0.238
0.533
0.546
1.44
0.69
0.37
0.69
0.87
0.90-2.32
0.29-1.64
0.04-2.61
0.08-5.73
0.28-2.70
0.130
0.404
0.297
0.732
0.813
Infection Before 1
Year Of Entry:
0
1
≥2
1.58
3.36
1.11-2.24
2.53-4.45
0.010
<0.001
1.42
2.76
0.98-2.04
1.99-3.82
0.060
<0.001
Vaccines 1.45 1.03-2.03 0.033 1.14 0.78-1.66 0.489
Drugs For Acid
Related Disorders
1.38 0.96-1.96 0.079 1.02 0.69-1.52 0.905
Respiratory Med 1.70 1.22-2.39 0.002 1.07 0.73-1.59 0.717
Lipid Medications 0.80 0.53-1.21 0.298 0.87 0.54-1.40 0.557
Heart Failure 1.21 0.14-10.45 0.863 1.17 0.12-11.07 0.893
Fatty Liver
Disease
4.18 0.26-67.62 0.313 4.10 0.16-
106.71
0.396
Obesity 1.11 0.42-2.91 0.835 0.86 0.30-2.46 0.778

175
Respiratory Infections:
Variable Crude
OR
95%CI P value Adjusted
OR
95%CI P value
Diabetes 0.94 0.81-1.10 0.470 1.45 1.21-1.74 <0.001
Age:
18-29 Years
30-39 Years
40-49 Years
50-59 Years
60-69 Years
≥70 Years
1.41
1.45
1.35
0.86
0.96
1.17-1.70
1.20-1.75
1.11-1.63
0.68-1.09
0.75-1.23
<0.001
<0.001
0.002
0.218
0.735
1.38
1.37
1.30
0.92
0.93
1.14-1.69
1.12-1.67
1.06-1.59
0.72-1.17
0.71-1.21
0.001
0.002
0.010
0.501
0.595
Sex (Female) 0.69 0.62-0.78 <0.001 0.77 0.68-0.87 <0.001
Microvascular 1.48 0.66-3.33 0.342 1.13 0.47-2.70 0.697
Macrovascular 0.59 0.34-1.01 0.056 0.67 0.38-1.19 0.267
Respiratory
Disease
2.86 2.52-3.24 <0.001 1.97 1.69-2.30 <0.001
Doctor Visits:
≤12 Visits
>12 Visits
2.51
1.95-3.24
<0.001
1.56
1.18-2.06
0.002
Referral:
0-1
≥2
1.35
1.03-1.77
0.030
0.95
0.71-1.27
0.735
Lab Number:

176
0-29
30-59
60-89
90-119
120-149
≥150
1.31
1.17
1.03
1.12
1.67
1.04-1.63
0.83-1.63
0.64-1.67
0.57-2.19
1.01-2.74
0.019
0.364
0.902
0.741
0.044
1.15
0.95
0.89
0.79
1.20
0.91-1.46
0.66-1.35
0.54-1.47
0.39-1.60
0.70-2.04
0.248
0.767
0.652
0.523
0.503
Infection Before 1
Year Of Entry:
0
1
≥2
1.63
2.87
1.39-1.93
2.51-3.29
<0.001
<0.001
1.30
1.90
1.10-1.55
1.62-2.22
0.003
<0.001
Vaccines 1.19 1.00-1.41 0.053 0.93 0.77-1.13 0.475
Drugs For Acid
Related Disorders
1.76 1.49-2.08 <0.001 1.48 1.23-1.78 <0.001
Respiratory Med 2.13 1.81-2.51 <0.001 1.12 0.93-1.35 0.243
Lipid Medications 0.70 0.58-0.86 0.001 0.71 0.55-0.90 0.005
Heart Failure 0.97 0.35-2.69 0.948 0.82 0.27-2.48 0.720
Fatty Liver
Disease
0.82 0.17-3.90 0.804 0.55 0.11-2.81 0.473
Obesity 1.61 1.07-2.44 0.023 1.25 0.80-1.96 0.318

177
Gastrointestinal Infections:
Variable Crude
OR
95%CI P value Adjusted
OR
95%CI P value
Diabetes 1.78 1.36-2.34 <0.001 1.71 1.22-2.39 0.002
Age:
18-29 Years
30-39 Years
40-49 Years
50-59 Years
60-69 Years
≥70 Years
0.85
0.72
1.03
1.22
1.64
0.57-1.27
0.47-1.10
0.69-1.53
0.80-1.87
1.08-2.49
0.440
0.127
0.876
0.359
0.020
0.94
0.77
0.97
1.15
1.38
0.61-1.44
0.50-1.20
0.64-1.46
0.73-1.80
0.88-2.18
0.774
0.255
0.884
0.549
0.161
Sex (Female) 1.17 0.91-1.49 0.211 1.16 0.89-1.50 0.263
Microvascular 5.25 1.60-17.24 0.006 3.41 0.95-12.21 0.059
Macrovascular 1.61 0.68-3.80 0.279 1.01 0.40-2.55 0.977
Respiratory
Disease
1.17 0.88-1.55 0.284 0.84 0.59-1.20 0.344
Doctor Visits:
≤12 Visits
>12 Visits
2.50
1.51-4.15
<0.001
1.80
1.03-3.13
0.038
Referral:
0-1
≥2
1.19
0.65-2.19
0.574
0.95
0.49-1.83
0.877
Lab Number:

178
0-29
30-59
60-89
90-119
120-149
≥150
0.56
0.57
0.83
0.71
1.45
0.31-0.99
0.22-1.47
0.28-2.48
0.16-3.17
0.52-4.01
0.048
0.249
0.746
0.650
0.474
0.46
0.38
0.61
0.61
1.06
0.26-0.84
0.14-1.05
0.20-1.89
0.13-2.88
0.35-3.18
0.011
0.062
0.396
0.530
0.912
Infection Before 1
Year Of Entry:
0
1
≥2
1.28
1.95
0.90-1.82
1.45-2.61
0.164
<0.001
1.41
2.27
0.98-2.05
1.59-3.22
0.067
<0.001
Vaccines 1.27 0.88-1.82 0.195 0.93 0.62-1.38 0.722
Drugs For Acid
Related Disorders
2.66 1.92-3.67 <0.001 1.93 1.35-2.75 <0.001
Respiratory Med 1.16 0.80-1.68 0.425 0.93 0.60-1.44 0.737
Lipid Medications 1.71 1.22-2.39 0.002 1.03 0.68-1.55 0.897
Heart Failure 1.04 0.12-9.20 0.970 0.52 0.06-4.83 0.569
Fatty Liver
Disease
- - - - - -
Obesity 0.92 0.32-2.65 0.872 1.00 0.33-3.05 0.993

179
Genitourinary Infections:
Variable Crude
OR
95%CI P value Adjusted
OR
95%CI P value
Diabetes 1.34 1.06-1.69 0.248 1.86 1.39-2.50 <0.001
Age:
18-29 Years
30-39 Years
40-49 Years
50-59 Years
60-69 Years
≥70 Years
1.04
0.82
1.16
1.05
1.62
0.77-1.42
0.58-1.15
0.84-1.61
0.73-1.51
1.14-2.31
0.786
0.244
0.353
0.774
0.007
0.98
0.73
1.14
0.97
1.28
0.70-1.38
0.51-1.05
0.81-1.61
0.66-1.43
0.87-1.90
0.929
0.093
0.449
0.877
0.206
Sex (Female) 0.34 0.27-0.43 <0.001 0.35 0.28-0.45 <0.001
Microvascular 1.78 0.56-5.61 0.324 1.11 0.32-3.85 0.871
Macrovascular 2.00 1.04-3.85 0.037 2.20 1.06-4.56 <0.034
Respiratory
Disease
1.87 1.52-2.30 <0.001 1.14 0.88-1.47 0.330
Doctor Visits:
≤12 Visits
>12 Visits
2.65
1.83-3.85
<0.001
1.55
1.03-2.35
0.037
Referral:
0-1
≥2
1.01
0.63-1.61
0.955
0.77
0.47-1.27
0.317
Lab Number:

180
0-29
30-59
60-89
90-119
120-149
≥150
1.32
1.11
1.22
0.94
1.69
0.91-1.92
0.61-2.01
0.59-2.51
0.27-3.25
0.72-3.97
0.137
0.739
0.585
0.929
0.230
1.03
0.80
0.67
0.41
0.92
0.69-1.55
0.42-1.51
0.32-1.43
0.11-1.57
0.36-2.30
0.865
0.489
0.303
0.194
0.854
Infection Before 1
Year Of Entry:
0
1
≥2
2.17
3.30
1.64-2.85
2.61-4.16
<0.001
<0.001
2.13
3.02
1.58-2.86
2.30-3.96
<0.001
<0.001
Vaccines 1.59 1.22-2.07 <0.001 1.11 0.83-1.48 0.483
Drugs For Acid
Related Disorders
2.10 1.61-2.72 <0.001 1.50 1.11-2.02 0.008
Respiratory Med 1.72 1.31-2.26 <0.001 1.09 0.80-1.51 0.574
Lipid Medications 1.07 0.79-1.44 0.658 0.77 0.53-1.13 0.187
Heart Failure 2.95 0.88-9.86 0.080 1.91 0.53-6.91 0.323
Fatty Liver
Disease
5.14 1.01-26.09 0.048 4.32 0.77-24.03 0.095
Obesity 1.28 0.63-2.57 0.495 1.04 0.49-2.21 0.908

181
Skin&Soft Infections:
Variable Crude
OR
95%CI P value Adjusted
OR
95%CI P value
Diabetes 1.81 1.40-2.34 <0.001 1.96 1.43-2.69 <0.001
Age:
18-29 Years
30-39 Years
40-49 Years
50-59 Years
60-69 Years
≥70 Years
1.08
1.15
1.16
1.43
1.27
0.74-1.58
0.78-1.69
0.78-1.71
0.94-2.17
0.80-2.01
0.682
0.476
0.465
0.097
0.312
1.24
1.23
1.21
1.31
1.07
0.83-1.86
0.82-1.85
0.81-1.82
0.84-2.03
0.65-1.75
0.290
0.321
0.352
0.227
0.787
Sex (Female) 1.05 0.83-1.33 0.676 1.06 0.83-1.35 0.656
Microvascular 5.92 1.88-18.63 0.002 3.74 1.05-13.26 0.041
Macrovascular 1.63 0.68-3.92 0.270 1.05 0.40-2.70 0.925
Respiratory
Disease
1.81 1.40-2.36 <0.001 1.50 1.08-2.10 0.016
Doctor Visits:
≤12 Visits
>12 Visits
3.14
1.93-5.11
<0.001
2.36
1.40-4.00
0.001
Referral:
0-1
≥2
1.50
0.89-2.55
0.129
1.06
0.60-1.86
0.838
Lab Number:

182
0-29
30-59
60-89
90-119
120-149
≥150
1.47
0.43
1.37
0.76
0.95
0.94-2.30
0.15-1.21
0.57-3.26
0.17-3.35
0.27-3.34
0.088
0.110
0.477
0.716
0.934
1.31
0.32
1.07
0.65
0.86
0.82-2.08
0.11-0.95
0.43-2.65
0.14-2.93
0.23-3.19
0.340
0.081
0.996
0.495
0.619
Infection Before 1
Year Of Entry:
0
1
≥2
1.23
1.73
0.87-1.73
1.31-2.28
0.232
<0.001
1.27
1.61
0.89-1.82
1.15-2.25
0.182
0.05
Vaccines 0.91 0.62-1.33 0.628 0.69 0.46-1.05 0.084
Drugs For Acid
Related Disorders
1.41 0.99-2.01 0.057 1.06 0.72-1.56 0.755
Respiratory Med 1.48 1.04-2.11 0.029 0.98 0.66-1.47 0.931
Lipid Medications 1.46 1.03-2.07 0.033 1.16 0.76-1.75 0.492
Heart Failure 3.04 0.55-16.81 0.202 1.42 0.20-10.18 0.727
Fatty Liver
Disease
- - - - - -
Obesity 1.84 0.78-4.33 0.161 1.30 0.53-3.18 0.570

183
Musculoskeletal Infections:
Variable Crude
OR
95%CI P value Adjusted
OR
95%CI P value
Diabetes 1.01 0.77-1.33 0.915 1.06 0.77-1.47 0.714
Age:
18-29 Years
30-39 Years
40-49 Years
50-59 Years
60-69 Years
≥70 Years
0.65
0.80
1.45
0.90
0.30
0.46-0.90
0.57-1.11
1.07-1.97
0.63-1.28
0.16-0.56
0.010
0.175
0.017
0.560
<0.001
0.68
0.82
1.47
0.97
0.29
0.48-0.97
0.58-1.16
1.07-2.02
0.67-1.40
0.16-0.55
0.013
0.246
0.022
0.524
<0.001
Sex (Female) 0.62 0.50-0.77 <0.001 0.61 0.49-0.76 <0.001
Microvascular 2.10 0.74-5.94 0.163 1.81 0.59-5.49 0.296
Macrovascular 0.67 0.23-1.92 0.459 0.87 0.29-2.60 0.800
Respiratory
Disease
1.60 1.27-2.03 <0.001 1.23 0.91-1.65 0.175
Doctor Visits:
≤12 Visits
>12 Visits
1.83
1.17-2.85
0.007
1.31
0.81-2.12
0.271
Referral:
0-1
≥2
1.67
1.08-2.58
0.021
1.31
0.83-2.09
0.247
Lab Number:

184
0-29
30-59
60-89
90-119
120-149
≥150
0.73
1.21
0.90
0.86
0.73
0.46-1.15
0.70-2.09
0.41-1.97
0.25-2.95
0.28-1.89
0.174
0.496
0.803
0.810
0.516
0.65
1.03
0.79
0.52
0.46
0.40-1.05
0.58-1.84
0.35-1.75
0.14-1.93
0.17-1.24
0.078
0.921
0.558
0.329
0.125
Infection Before 1
Year Of Entry:
0
1
≥2
1.06
1.62
0.78-1.43
1.28-2.05
0.726
<0.001
0.96
1.35
0.70-1.33
1.02-1.79
0.830
0.036
Vaccines 0.86 0.62-1.20 0.370 0.82 0.57-1.16 0.267
Drugs For Acid
Related Disorders
1.92 1.45-2.56 <0.001 1.68 1.22-2.30 0.001
Respiratory Med 1.63 1.21-2.18 0.001 1.11 0.79-1.56 0.553
Lipid Medications 1.25 0.92-1.71 0.152 1.31 0.90-1.92 0.160
Heart Failure - - - - - -
Fatty Liver
Disease
1.78 0.37-8.61 0.475 1.69 0.33-8.54 0.528
Obesity 1.57 0.83-2.99 0.167 1.26 0.64-2.50 0.503

185
Viral Infections:
Variable Crude
OR
95%CI P value Adjusted
OR
95%CI P value
Diabetes 1.42 0.95-2.13 0.086 1.33 0.80-2.21 0.268
Age:
18-29 Years
30-39 Years
40-49 Years
50-59 Years
60-69 Years
≥70 Years
0.52
0.49
0.83
0.60
0.58
0.31-0.87
0.28-0.85
0.50-1.37
0.33-1.08
0.30-1.14
0.013
0.012
0.466
0.091
0.114
0.52
0.48
0.85
0.55
0.60
0.29-0.91
0.26-0.89
0.50-1.46
0.29-1.04
0.29-1.26
0.023
0.019
0.557
0.067
0.177
Sex (Female) 0.91 0.64-1.29 0.602 0.83 0.57-1.20 0.324
Microvascular 11.92 1.07-132.18 0.043 5.39 0.41-70.53 0.199
Macrovascular - - - - - -
Respiratory
Disease
1.90 1.30-2.78 0.001 1.88 1.14-3.11 0.014
Doctor Visits:
≤12 Visits
>12 Visits
1.27
0.53-3.07
0.593
1.10
0.41-2.97
.852
Referral:
0-1
≥2
0.76
0.27-2.16
0.609
0.55
0.17-1.74
0.308
Lab Number:

186
0-29
30-59
60-89
90-119
120-149
≥150
0.83
0.83
0.40
1.67
-
0.43-1.60
0.31-2.17
0.05-3.12
0.34-8.18
-
0.578
0.701
0.383
0.524
-
0.77
0.54
0.30
1.74
-
0.38-1.56
0.18-1.55
0.04-2.50
0.33-9.20
-
0.469
0.251
0.268
0.511
-
Infection Before 1
Year Of Entry:
0
1
≥2
1.29
1.40
0.81-2.06
0.94-2.09
0.274
0.093
1.27
1.23
0.76-2.13
0.74-2.04
0.364
0.419
Vaccines 1.83 1.17-2.87 0.008 2.05 1.24-3.39 0.005
Drugs For Acid
Related Disorders
1.30 0.78-2.15 0.315 0.98 0.55-1.74 0.957
Respiratory Med 1.19 0.70-2.02 0.528 0.60 0.31-1.15 0.125
Lipid Medications 1.22 0.72-2.04 0.457 0.97 0.51-1.83 0.922
Heart Failure - - - - - -
Fatty Liver
Disease
17.09 1.76-165.65 0.014 19.24 1.81-
204.58
0.005
Obesity 3.77 1.59-8.95 0.003 2.22 1.26-8.25 0.015