master water study for the florin vineyard community plan 40/zone 40 wsip 20061019 appendix b.pdfthe...
TRANSCRIPT

SACRAMENTO COUNTY WATER AGENCY
Master Water Study for the Florin Vineyard
Community Plan
Sacramento County Water Agency
DRAFT
October 2006
Reviewed and Edited by: Robert Gardner, P.E.
Prepared by MWH: Ping Chen, P.E.

APPENDIX B Sacramento County Water Agency Zone 40
Zone 40 Water System Infrastructure Plan
MWH Page i October 19, 2006
TABLE OF CONTENTS
SACRAMENTO COUNTY WATER AGENCY....................................................................... 1
SECTION 1. INTRODUCTION..............................................................................................1-1 1.1 STUDY AREA...................................................................................................................1-1 1.2 PURPOSE AND OBJECTIVES .............................................................................................1-2
SECTION 2. BACKGROUND ................................................................................................2-1 2.1 EXISTING GEOGRAPHICAL CONDITIONS .........................................................................2-1 2.2 WATER PURVEYORS FOR THE FLORIN VINEYARD COMMUNITY PLAN ..........................2-1 2.3 EXISTING WATER FACILITIES .........................................................................................2-2 2.4 PREVIOUS STUDIES .........................................................................................................2-2
SECTION 3. LAND USE AND WATER DEMAND PROJECTIONS ...............................3-1 3.1 PROPOSED LAND USES....................................................................................................3-1 3.2 WATER DEMAND ESTIMATES .........................................................................................3-1
SECTION 4. WATER SYSTEM OPERATING GOALS.....................................................4-1
SECTION 5. WATER INFRASTRUCTURE REQUIREMENTS AND PHASING .........5-1 5.1 FACILITY REQUIREMENTS AND PHASING IN THE ZONE 40 WSIP...................................5-1 5.2 DESCRIPTION OF WATER SUPPLY SOURCES AND PHASING ............................................5-1 5.3 WATER INFRASTRUCTURE REQUIREMENTS AND PHASING FOR THE STUDY AREA........5-7
SECTION 6. WATER DISTRIBUTION MODELING RESULTS .....................................6-1 6.1 MODELING SCENARIOS...................................................................................................6-1 6.2 MODELING ASSUMPTIONS ..............................................................................................6-1 6.3 MODELING RESULTS.......................................................................................................6-2
SECTION 7. WATER FACILITY FINANCE SECTION....................................................7-1
SECTION 8. NEXT STEPS .....................................................................................................8-1

APPENDIX B Sacramento County Water Agency Zone 40
Zone 40 Water System Infrastructure Plan
MWH Page ii October 19, 2006
LIST OF FIGURES
FIGURE 1. LOCATION OF FLORIN-VINEYARD COMMUNITY PLAN AREA ................................................1-3 FIGURE 2. PROPOSED LAND USE DIAGRAM FOR THE STUDY AREA (PLANNING DEPARTMENT
ALTERNATIVE) .......................................................................................................................3-4 FIGURE 3. THE RELATIONSHIPS BETWEEN VARIOUS FORMS OF WATER DEMANDS OF ZONE 40 ..........3-5 FIGURE 4. GRAPHIC ILLUSTRATION OF WATER SUPPLY SOURCES AND PHASING FOR THE
STUDY AREA ..........................................................................................................................5-3 FIGURE 5. FVCP FACILITY REQUIREMENTS AND PHASING IN ZONE 40 WSIP.......................................5-5 FIGURE 6. WATER INFRASTRUCTURE REQUIREMENTS AND PHASING FOR THE STUDY AREA [1]............5-9 FIGURE 7. ASSUMED MAX DAY DEMAND DIURNAL CURVE ..................................................................6-2
LIST OF TABLES
TABLE 1. PROPOSED LAND USES IN THE STUDY AREA AND CORRESPONDING LAND USE
CLASSIFICATIONS IN ZONE 40 WSMP....................................................................................3-2 TABLE 2. LAND USE ACREAGE AND ANNUAL AVERAGE WATER DEMAND ESTIMATE FOR THE STUDY
AREA ......................................................................................................................................3-3 TABLE 3. WATER DEMAND ESTIMATES FOR THE STUDY AREA WITHIN ZONE 40 [1] ...........................3-5 TABLE 4. ZONE 40 TRANSMISSION MAIN OPERATING GOALS ..............................................................4-1 TABLE 5. FIRE FLOW REQUIREMENTS FOR THE STUDY AREA...............................................................4-1 TABLE 6. WATER SUPPLY SOURCES AND PHASING FOR THE STUDY AREA...........................................5-2 TABLE 7. WATER SUPPLY FACILITY AND PHASING REQUIREMENTS ....................................................5-8 TABLE 8. MODELING RESULTS FOR MAX DAY DEMAND CONDITIONS FOR ALL WATER SUPPLY PHASES
– 72 HOUR EPS RUN...............................................................................................................6-3 TABLE 9. MODELING RESULTS FOR FIRE FLOW CONDITIONS FOR ALL WATER SUPPLY PHASES.........6-3 TABLE 10. WATER SUPPLY FACILITY CAPITAL COSTS............................................................................7-1
LIST OF APPENDICES
APPENDIX A DEMAND NODES AND PIPES IDS IN THE MODEL APPENDIX B MODELING RESULTS SCENARIO 1 – WATER SUPPLY PHASE 1 APPENDIX C MODELING RESULTS SCENARIO 2 – WATER SUPPLY PHASE 2 APPENDIX D MODELING RESULTS SCENARIO 3 – WATER SUPPLY PHASE 3 APPENDIX E MODELING RESULTS SCENARIO 4 – WATER SUPPLY PHASE 4 APPENDIX F MODELING RESULTS SCENARIO 5 – FIRE FLOWS

APPENDIX B Sacramento County Water Agency Zone 40
Zone 40 Water System Infrastructure Plan
MWH Page iii October 19, 2006
List of Acronyms AAD – Annual Average Demand
ADD – Average Day Demand
Agency Act – Sacramento County Water Agency Act
Ag/res – agricultural/residential
AF – Acre Feet
Cal-Am – California-American Water Company
CEQA – California Environmental Quality Act
Central Basin – Central Sacramento County Groundwater Basin
CSA – Central Service Area
CVP – Central Valley Project
CVPIA – Central Valley Project Improvement Act
DEIR – Draft Environmental Impact Report
D-main – Smaller Water Distribution Main
DHS – Department of Health Services
EIR – Environmental Impact Report
FVCP – Florin Vineyard Community Plan
ISO – International Organization of Standardization
GMP – Groundwater Management Plan
MGD – Million Gallon per Day

APPENDIX B Sacramento County Water Agency Zone 40
Zone 40 Water System Infrastructure Plan
MWH Page iv October 19, 2006
MDD – Max Day Demand
NVSSP – North Vineyard Station Specific Plan
psi – pounds per square inch
PHD – Peak Hour Demand
SACOG – Sacramento Area Council of Governments
SCWA – Sacramento County Water Agency
VSCP – Vineyard Springs Comprehensive Plan
WFA – Water Forum Agreement
WSIP – Water System Infrastructure Plan
WSMP – Water Supply Master Plan

APPENDIX B Sacramento County Water Agency Zone 40
Zone 40 Water System Infrastructure Plan
MWH Page 1-1 October 19, 2006
SECTION 1. INTRODUCTION
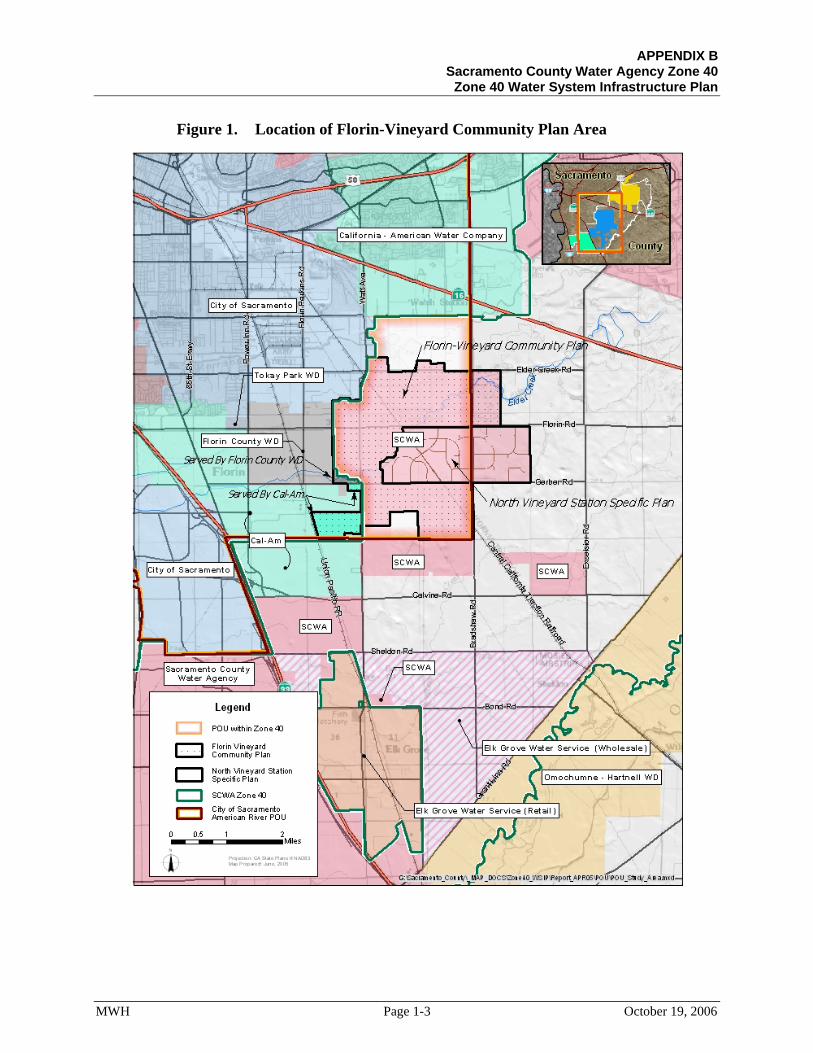
1.1 Study Area The Florin Vineyard Community Plan (FVCP) is a 3,768-acre development area located within
the communities of Florin, Vineyard and South Sacramento. The term “Florin Gap” has been
referred to this area because it is located between the existing urban area west of Elk Grove-
Florin Road and a comprehensively planned urban area to the east (i.e., North Vineyard Station
Specific Plan or “NVSSP” and Vineyard Springs Comprehensive Plan or “VSCP”.) The area is
bounded by Elder Creek Road and the Sacramento City limits to the north, Bradshaw Road
excluding the NVSP area to the east, developed Churchill Downs and Vintage Park area to the
south, and Elk Grove Florin Road and Union Pacific Railroad tracks to the west. The majority of
the FVCP falls within the City of Sacramento’s (City) American River Place of Use (POU)
boundary and within the SCWA Zone 40 boundary. Refer to Figure 1 for the location of FVCP
area and boundaries of the Study Area for this report. This is depicted in Figure 1 as the shaded
pink area with dot hatching and the small portion of the Florin County Water District (Florin
County WD) that is shaded brown.
Zone 40 was created by Sacramento County Water Agency (SCWA) Resolution No. 663 in May
1985, which describes the exact boundaries of the zone, and defines the projects to be
undertaken as “... the acquisition, construction, maintenance and operation of facilities for the
production, conservation, transmittal, distribution and sale of ground or surface water or both for
the present and future beneficial use of the lands or inhabitants within the zone.”
Through Zone 41, defined as the maintenance and operations branch of SCWA’s water supply
service areas, SCWA will be the retail water purveyor for providing water supply for the portion
of FVCP and NVSSP areas that fall within the SCWA Zone 40 boundary. The ultimate water
supply source for the POU area will be the City’s American River POU water that is wholesaled
to SCWA Zone 41 much like Zone 40 wholesales water to areas outside the American River
POU. The source of the American River POU water is primarily through the City’s Fairbairn
water treatment plant (WTP).

APPENDIX B Sacramento County Water Agency Zone 40
Zone 40 Water System Infrastructure Plan
MWH Page 1-2 October 19, 2006
Before the POU water supply is introduced, interim water supplies for the FVCP (and NVSSP)
area will come from offsite sources that either currently exist or are planned in accordance with
the adopted 2005 Zone 40 Water Supply Master Plan (WSMP), All Zone 40 facilities are
transferred to Zone 41 for operations and maintenance and for retail water service to Zone 41
customers. No new groundwater wells are proposed in the FVCP and NVSSP areas. The
interim water supply sources include existing and future groundwater and surface water
treatment plants in Zone 40. As these water supplies will be available in different phases at
different locations, it is important to plan and phase the water distribution system for FVCP
accordingly to deliver drinking water to the Study Area and the adjacent NVSSP areas
throughout their development phasing while meeting SCWA’s operating goals.
1.2 Purpose and Objectives The primary objective of this study is to evaluate water supply demands, any large water
distribution system requirements and phasing of large water facilities to accommodate
development within the FVCP. This report, in part, satisfies the need to provide sufficient
information on the water demands, water supplies, and water transmission system to assist the
policy makers and SCWA in the review and approval of the FVCP Draft Environmental Impact
Report (DEIR).
This report is not intended to satisfy SB 610 where the water retail provider is required to make a
determination of water supply sufficiency. However, SCWA can use the information in this
report for reference in the water supply sufficiency determination and in the identification of the
needed water supply facilities.
APPENDIX B Sacramento County Water Agency Zone 40
Zone 40 Water System Infrastructure Plan
MWH Page 1-3 October 19, 2006
Figure 1. Location of Florin-Vineyard Community Plan Area

APPENDIX B Sacramento County Water Agency Zone 40
Zone 40 Water System Infrastructure Plan
MWH Page 2-1 October 19, 2006
SECTION 2. BACKGROUND
This section describes the existing geographical conditions, existing water facilities, and
previous studies completed for the Study Area.
2.1 Existing Geographical Conditions The Study Area is fairly flat ranging in elevation from 40 feet to 60 feet above mean sea level.
The overall area is largely undeveloped and has historically been used for agriculture, light
industrial, and agricultural residential housing (small ranchettes). Elder Creek runs through the
Study Area from northeast to southwest.
2.2 Water Purveyors for the Florin Vineyard Community Plan Three water purveyors are identified to provide service to the FVCP: Zone 41 of SCWA,
California American (Cal-Am) Water Company, and Florin County WD, see Figure 1.
(1) Zone 41
The operations and maintenance responsibilities for water supply facilities constructed by Zone
40 is by SCWA Zone 41, the retail water purveyor of the SCWA. All water supply infrastructure
constructed by Zone 40 will be operated and maintained by Zone 41 to provide adequate
quantities of water to its retail customers and to its wholesale customers (e.g., Elk Grove Water
Service Company and to Cal-Am in the future development of the Security Park service area).
Zone 41 also has service areas locate outside of Zone 40 where retail water service is provided.
It is the goal of SCWA’s Zone 40 to develop long-term water supplies including surface water
and recycled water supplies to be used conjunctively with groundwater supplies. Sustainability
of the groundwater resources underlying Zone 40 is a primary goal of Zone 41’s utilization and
operation of the various supply sources and related water facilities.
(2) California American Water Company
A portion of the FVCP (approximately 250 out of 3,768 acres) is located outside of the Zone 40
service boundary west of Elk Grove Florin Road and south of Gerber Road and within the Cal-

APPENDIX B Sacramento County Water Agency Zone 40
Zone 40 Water System Infrastructure Plan
MWH Page 2-2 October 19, 2006
Am service area boundary. This study will mainly investigate the water supply and facility
requirements to meet the water demand for the portion of the FVCP that lies within Zone 40.
The demand for the portion of the FVCP within the Cal-Am service area is assumed to be met by
Cal-Am.
(3) Florin County Water District
Another small fraction of the FVCP area outside of the Zone 40 service boundary near Gerber
and Elk Grove-Florin Road is identified to be served by the Florin County WD. Given the size
of the area within the Florin County WD, its water demand and supply analysis is also included
in this study. This implies that the Zone 40 water system will be designed to serve this small
area, but the decision of the which agency will be the retail water provider is not certain at this
time. For example, one scenario may be that Zone 40 wholesales water to Florin County WD.
2.3 Existing Water Facilities Currently, there are no municipal water supply and water distribution facilities located within the
Study Area. Proposed water transmission and distribution facilities will be developed in
accordance with SCWA’s standards for water system improvements.
2.4 Previous Studies Several previous reports and studies were reviewed in the preparation of this Study. These
studies provide the framework and guidance for the water system design and planning in the
Study Area. These studies include:
(1) The January 2000 Water Forum Agreement
Begun in 1993, the Sacramento Area Water Forum (Water Forum) is comprised of
representatives from the business, environmental, public interest, and water purveyor
communities. The co-equal objectives of the Water Forum are: 1) to provide reliable and safe
water supply for the region’s economic health and planned development through the year 2030,
and 2) to preserve the fishery, wildlife, recreational, and aesthetic values of the lower American
River. The Water Forum Agreement (WFA) prescribed a conjunctive use plan for Folsom Lake,

APPENDIX B Sacramento County Water Agency Zone 40
Zone 40 Water System Infrastructure Plan
MWH Page 2-3 October 19, 2006
the lower American River, and the adjacent groundwater basins to achieve those goals. The
Water Forum continues its role through the Water Forum Successor Effort and continuously
monitors the progress in achieving the goals stated in the WFA.
(2) Zone 40 Water Supply Master Plan (SCWA, 2005)
In April 2005, SCWA approved the Zone 40 Water Supply Master Plan (WSMP) which updates
the original 1987 Zone 40 Water Supply Master Plan and addresses changes made since the
development of 1987 Master Plan. The most significant changes resulted from a major
modification of the Central Valley Project’s (CVP) contracting policy that occurred as a result of
the Central Valley Project Improvement Act (CVPIA), the signing of the WFA, and the adoption
of 1993 Sacramento County General Plan (General Plan) update that substantially increased the
area designated for urban growth in the County.
The Zone 40 WSMP further defines SCWA’s conjunctive use program of groundwater, surface
water and recycled water supplies, as well as a financing program for the construction of surface
water diversion and treatment facilities; water conveyance pipelines; groundwater extraction,
treatment, storage, and distribution facilities; and recycled water storage and distribution
facilities within Zone 40.
The Zone 40 WSMP also documents the unit water demand factors for various land use
categories. These unit water demand factors along with the land use information will be used to
estimate the water demand in the Study Area.
(3) Central Sacramento County Groundwater Management Plan (MWH, 2006)
The Central Sacramento County Groundwater Management Plan (GMP) sets forth objectives for
managing the groundwater basin underlying the Central Sacramento County Basin of which
Zone 40 overlies and establishes parameters for monitoring and reporting on the performance of
the management strategies.
(4) Draft Zone 40 Water Systems Infrastructure Plan (MWH, 2006)

APPENDIX B Sacramento County Water Agency Zone 40
Zone 40 Water System Infrastructure Plan
MWH Page 2-4 October 19, 2006
The purpose of the Zone 40 Water Systems Infrastructure Plan (WSIP) is to describe and
quantify the facilities necessary to extract, treat, convey, and retail groundwater; store and pump
City of Sacramento (City) American River Place of Use (POU) water; and treat and convey
surface water at the future Vineyard Surface Water Treatment Plant (Vineyard SWTP). The
WSIP is intended to be a planning document for SCWA staff and design engineers for Zone 40
facilities. For instance, significant design issues related to the interaction of facilities and events
such as the construction of the Vineyard SWTP or development within the wholesale area of the
City’s POU will be investigated and detailed to show sizing and timing of facilities throughout
Zone 40.
Unlike other planning documents where build-out facilities are typically viewed as the “project”,
the WSIP describes four phases of demand growth that represent significant milestones in water
supply development within Zone 40 and reflect the anticipated pattern of development through
build-out of the 2030 WSMP study area. These four phases represent existing conditions, first
phase of the Vineyard SWTP (50 MGD), second phase of the Vineyard SWTP (expanding from
50 MGD to 100 MGD, the ultimate Vineyard SWTP’s capacity), and build-out conditions. The
WSIP also considers the range in operation of the various water supply facilities (i.e.,
groundwater and surface water) to account for wet and dry hydrologic conditions.

APPENDIX B Sacramento County Water Agency Zone 40
Zone 40 Water System Infrastructure Plan
MWH Page 3-1 October 19, 2006
SECTION 3. LAND USE AND WATER DEMAND PROJECTIONS
Water demand evaluations based on land use information is considered to be the preferred
method of determining water demands for a proposed project. Water demand forecasting using
population and per capita demand factors is used only when land use information is not
available. The benefit of land use-based water demand factors is that it allows for geographic
location of the water demands in terms of computer modeling and setting up demand areas for
the model. A land use water demand factor is determined by using actual meter data for each
land use category, normalizing the data to what is considered to be a design condition (e.g.,
hydrologic year, level of water conservation and enforcement, etc.) and then associate each
factor with the land use categories of the Study Area. This section describes the land uses and the
associated water demand estimates for the Study Area.
3.1 Proposed Land Uses Proposed land uses for the Study Area consist of a mix of residential, commercial, (light)
industrial and open space designations. The land use diagram (the Planning Department
Alternative) for the Study Area is shown in Figure 2. In order to use the unit demand factors
adopted in the Zone 40 WSMP to calculate the water demands, the land use classifications for
the Study Area are consolidated into the land use classifications identified in the Zone 40
WSMP, as shown in Table 1.
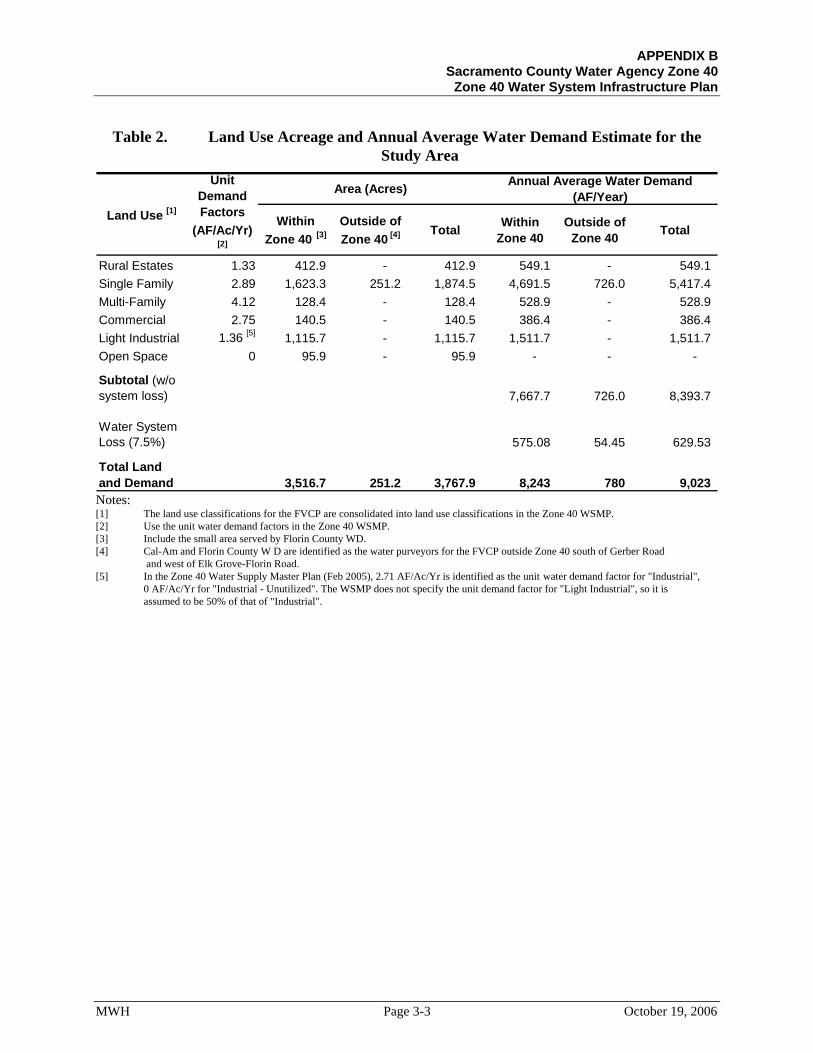
3.2 Water Demand Estimates A water demand estimate determines the total quantity of water needed to serve the proposed
development. Table 2 summarizes the acreages for the consolidated land use classifications and
the water demand estimates for the Study Area. The water demands are calculated separately for
the areas within and outside of Zone 40.
The quantity of water demand is usually expressed in four forms: Average Annual Demand
(AAD), Average Day Demand (ADD), Max Day Demand (MMD), and Peak Hour Demand
(PHD). Each one of these forms of water demands serves a special purpose.

APPENDIX B Sacramento County Water Agency Zone 40
Zone 40 Water System Infrastructure Plan
MWH Page 3-2 October 19, 2006
Average annual demand (AAD), often expressed as acre-feet per year (AF/year) provides very
useful information for SCWA staff in developing their overall water supply for the Study Area.
ADD, represented in million gallons per day (MGD), represents the average daily water demand
for a water system. ADD is often evaluated in order to obtain MDD and PHD by applying a
peaking factor. MDD is useful in determining the capacity of the conveyance pipeline to deliver
groundwater/surface water (POU water) to the Study Area. PHD, often expressed in terms of
gallons per minute (GPM) is used to size the water transmission and distribution pipelines,
booster pumps, and on-site storage requirements to handle the PHD and ensure that service
pressures are satisfied. Storage is a volume that is expressed in millions of gallons (MG).
The AAD is calculated first by applying unit water demand factors developed in the Zone 40
WSMP to the proposed land uses for the portion of the FVCP that lies within the Study Area.
From there, the ADD, MDD, and PHD are obtained subsequently as shown in the Figure 3.
Table 3 shows the AAD, MMD, and PHD for the portion of Study Area located within Zone 40
including the small area served by the Florin County WD.
Table 1. Proposed Land Uses in the Study Area and Corresponding Land Use Classifications in Zone 40 WSMP
Area (Acres)Within Zone 40 [1] Outside of Zone 40
AR1 Rural Estates 32.9 AR1-2 Rural Estates 247.1 AR2-5 Rural Estates 132.8
Subtotal 412.9 RD2-3 Single Family 143.7 4.6 RD3-5 Single Family 910.8 189.4 RD5-7 Single Family 490.0 57.2 RD10 Single Family 13.6
RD7-12 Single Family 65.2 Subtotal 1,623.3 251.2
RD20 Multi Family - High Density 128.4 Subtotal 128.4
BP Commercial 4.7 GC Commercial 10.2 SC Commercial 107.2 LC Commercial 18.5
Subtotal 140.5 IR Light Industrial 233.7 M1 Light Industrial 882.0
Subtotal 1,115.7 OS Open Space 95.9
Subtotal 95.9 TOTAL 3,516.7 251.2
Land Use Classifications in the Land Use Diagram
Corresponding Land Use Classification in Zone WSMP
APPENDIX B Sacramento County Water Agency Zone 40
Zone 40 Water System Infrastructure Plan
MWH Page 3-3 October 19, 2006
Table 2. Land Use Acreage and Annual Average Water Demand Estimate for the Study Area
Area (Acres) Annual Average Water Demand (AF/Year)
Within Zone 40 [3]
Outside of Zone 40 [4] Total Within
Zone 40Outside of
Zone 40 Total
Rural Estates 1.33 412.9 - 412.9 549.1 - 549.1 Single Family 2.89 1,623.3 251.2 1,874.5 4,691.5 726.0 5,417.4 Multi-Family 4.12 128.4 - 128.4 528.9 - 528.9 Commercial 2.75 140.5 - 140.5 386.4 - 386.4 Light Industrial 1.36 [5] 1,115.7 - 1,115.7 1,511.7 - 1,511.7 Open Space 0 95.9 - 95.9 - - -
Subtotal (w/o system loss) 7,667.7 726.0 8,393.7
Water System Loss (7.5%) 575.08 54.45 629.53
Total Land and Demand 3,516.7 251.2 3,767.9 8,243 780 9,023
Land Use [1]
Unit Demand Factors
(AF/Ac/Yr) [2]
Notes: [1] The land use classifications for the FVCP are consolidated into land use classifications in the Zone 40 WSMP. [2] Use the unit water demand factors in the Zone 40 WSMP. [3] Include the small area served by Florin County WD. [4] Cal-Am and Florin County W D are identified as the water purveyors for the FVCP outside Zone 40 south of Gerber Road
and west of Elk Grove-Florin Road. [5] In the Zone 40 Water Supply Master Plan (Feb 2005), 2.71 AF/Ac/Yr is identified as the unit water demand factor for "Industrial",
0 AF/Ac/Yr for "Industrial - Unutilized". The WSMP does not specify the unit demand factor for "Light Industrial", so it is assumed to be 50% of that of "Industrial".

APPENDIX B Sacramento County Water Agency Zone 40
Zone 40 Water System Infrastructure Plan
MWH Page 3-4 October 19, 2006
Figure 2. Proposed Land Use Diagram for the Study Area (Planning Department Alternative)

APPENDIX B Sacramento County Water Agency Zone 40
Zone 40 Water System Infrastructure Plan
MWH Page 3-5 October 19, 2006
Figure 3. The Relationships Between Various Forms of Water Demands of Zone 40
Table 3. Water Demand Estimates for the Study Area within Zone 40 [1]
Average Annual Demand (AF/year)
Average Day Demand (MGD)
Max Day Demand (MGD)
Peak Hour Demand (gpm)
8,243 7.36 14.72 20,436
Note: [1] Demands include 7.5% system loss.
Average Annual Demand (AAD)
in AF/year Average Day
Demand (ADD)In MGD
Max Day Demand (MDD)
In MGD
Peak Hour Demand (PHD)
In GPM
Zone 40 WSMP Unit Water
Demand Factors In AF/acre/year
FVCP Tentative Land Use
Information In Acres
Divided by 365 days and converted to MGD
Multiplied by a peaking factor 2.0
Multiplied by a peaking factor 2.0 and converted to GPM

APPENDIX B Sacramento County Water Agency Zone 40
Zone 40 Water System Infrastructure Plan
MWH Page 4-1 October 19, 2006
SECTION 4. WATER SYSTEM OPERATING GOALS
This section describes SCWA’s operating goals in the design of transmission main (T-main)
pipelines within Zone 40. These T-main operating goals were established to ensure that
adequate pressures are maintained under normal and fire flow operating conditions, and to
maintain T-main flow velocities within an acceptable operating range. These T-main operating
goals are included in Table 4.
Table 4. Zone 40 Transmission Main Operating Goals
CONDITION OPERATING GOALS Normal System Operation Condition
Minimum pressure 40 psi Maximum pressure 75 psi Maximum Velocity 5 fps
Maximum head loss per 1,000 lf 5 ft [1] Fire Flow Condition
Minimum residual pressure at fire hydrant 20 psi Note:
[1] This goal should be used as a general guideline for the system. Maintaining the minimum residual system pressure should be the controlling design criteria.
The water distribution system must be sized to provide adequate fire flows at minimum residual
pressures specified by the International Organization of Standardization (ISO) and local fire
departments. The Study Area is located in the service area of the Sacramento Metropolitan Fire
District. The fire flow requirements used for the Study Area are shown in Table 5.
Table 5. Fire Flow Requirements for the Study Area
LAND USE Fire Flow Requirement
(gpm)
Minimum Residual
Pressure (psi)
Duration (Hours)
Residential Homes up to 3,600 sq. ft. 1,500 20 2 Homes up to 4,800 sq. ft. 1,750 20 2 Homes up to 6,200 sq. ft. 2,000 20 2
Commercial 3,000 20 3 Industrial 4,000 20 4

APPENDIX B Sacramento County Water Agency Zone 40
Zone 40 Water System Infrastructure Plan
MWH Page 5-1 October 19, 2006
SECTION 5. WATER INFRASTRUCTURE REQUIREMENTS AND PHASING
As any new development project proceeds in the land use entitlement and construction process,
the water supply availability and method of providing water service to the project may change
over time. This section best describes the water infrastructure requirements and phasing to meet
the water demands in the build-out and interim conditions based on the most current information
and understandings of how, when and where potable water will come from to serve the Study
Area.
5.1 Facility Requirements and Phasing in the Zone 40 WSIP The Zone 40 WSIP provides the framework for water facility requirements for the entire Zone 40
wholesale service area including the Study Area. The facility phasing in the Zone 40 WSIP is
defined corresponding to the two proposed phases of the Vineyard SWTP. The first phase of the
Vineyard SWTP (50 MGD) is currently under design and anticipated to come online in year
2011. The second phase of the Vineyard SWTP (add another 50 MGD to reach the full 100
MGD build-out treatment capacity) is estimated to be constructed near 2022. Figure 4 shows
the facility requirements for the build-out condition and the phasing according to the
construction phases of the Vineyard SWTP in the Zone 40 WSIP for the Study Area. Given the
fast projected growth in the FVCP area in the near future, additional interim phase conditions
need to be considered within the Zone 40 WSIP framework to provide the sequence of facility
construction to provide SCWA staff with proper sequencing of water facilities that will lead
them to ultimate build-out conditions while ensuring reliable water supplies for the Study Area.
5.2 Description of Water Supply Sources and Phasing The water supply sources and phasing for the Study Area are summarized in Table 6 and
graphically shown in Figure 4. The water supply phasing described in this document does not
specify which year each water supply phasing could actually start because that the water supply
phasing is essentially water demand driven rather than time-driven depending on the growth rate.
The SACOG’s population growth projection is used to estimate the projected increase in water

APPENDIX B Sacramento County Water Agency Zone 40
Zone 40 Water System Infrastructure Plan
MWH Page 5-2 October 19, 2006
demand in the Study Area, as it was used to estimate the water demand for the region in the Zone
40 WSIP.
Table 6. Water Supply Sources and Phasing for the Study Area
FVCP Water Supply Phases Water Supply Sources
Phase 1 Phase 2 Phase 3 Phase 4 (Build Out)
Capable of providing up to 4,040 AF/Year to the Study Area
Capable of providing up to 7,670 AF/Year to the Study Area
Capable of providing up to build-out demand to the Study Area (8,240 AF/Year) until the growth in Zone 40 necessitates the ultimate POU Water supply
Capable of providing up to build-out demand to the Study Area (8,240 AF/Year)
Waterman GWTP X X O O
Wildhawk GWTP X X O O
Initial Connection to the City’s Water System X O O
First phase of Vineyard WTP X O
American River POU Water X
Notes: X – Primary Water Supply Source(s) O – Secondary/Backup Water Supply Source(s) (1) Water Supply Sources – Phase 1
The first phase of water supplies will come from groundwater. Currently, there are two off-site
groundwater treatment plants (GWTPs) in the vicinity of the Study Area: The Waterman GWTP
and the Wildhawk GWTP, see Figure 5.

APPENDIX B Sacramento County Water Agency Zone 40
Zone 40 Water System Infrastructure Plan
MWH Page 5-3 October 19, 2006
Figure 4. Graphic Illustration of Water Supply Sources and Phasing for the Study Area
The Waterman GWTP has a treatment capacity of 8.6 MGD located south of the Study Area at
Waterman Road north of Calvine Road currently serving the Vineyard and Vintage Park service
areas. The Waterman GWTP can provide a limited amount of water for the initial development
in the Study Area and the NVSSP via the existing 24-inch diameter T-main in Elk Grove-Florin
Road that runs north and is currently terminated at the intersection of Gerber Road.
The Wildhawk GWTP has an ultimate treatment capacity of 10 MGD and is located east of
Vineyard Road and south of Gerber Road and is anticipated to be operational in the fall of 2006.
The Wildhawk GWTP will be the major near-term water supply source for new development in
the Study Area and the NVSSP area. A T-main will be constructed in Gerber Road from the
intersection with Vineyard Road to NVSSP that will also connect to the existing 24-inch
diameter T-main in Elk Grove-Florin Road mentioned above creating a looped system.
(2) Water Supply Sources – Phase 2
The Phase 2 water supplies involves the development of an initial POU connection to the City’s
water system at Elder Creek Road and South Watt Avenue to supplement the Waterman and
Wildhawk GWTPs’ water supply before Phase 1 of the Vineyard SWTP becomes operational.
Waterman GWTP
Wildhawk GWTP
Initial Connection to the City’s Water System
First Phase of Vineyard SWTP
Dedicated POU Water
Second Phase of Vineyard SWTP
Build Out
Phase 1 Phase
2 Phase 3 Phase 4
WSIP Phase 1 WSIP Phase 2 WSIP Build Out
Water Supply

APPENDIX B Sacramento County Water Agency Zone 40
Zone 40 Water System Infrastructure Plan
MWH Page 5-4 October 19, 2006
This City connection can serve as a back up supply after Phase 1 of the Vineyard SWTP and
once the dedicated POU water facilities are constructed and become operational. The capacity
of the initial POU connection is determined by a number of factors including the demand growth
in the Study Area and NVSSP area, the wheeling ability of the City’s water distribution system,
and the timing of the Vineyard SWTP. It is preliminarily estimated that up to 4,500 gpm of flow
capacity will be needed at this interim connection.

APPENDIX B Sacramento County Water Agency Zone 40
Zone 40 Water System Infrastructure Plan
MWH Page 5-5 October 19, 2006
Figure 5. FVCP Facility Requirements and Phasing in Zone 40 WSIP
Vineyard

APPENDIX B Sacramento County Water Agency Zone 40
Zone 40 Water System Infrastructure Plan
MWH Page 5-6 October 19, 2006
(3) Water Supply Sources – Phase 3
Completion of Phase 1 of the Vineyard SWTP (50 MGD) is identified as the primary water
supply source in Development Phase 3 for the Study Area. The treated water from the Vineyard
SWTP will be used in Zone 40 in conjunction with groundwater. The Vineyard SWTP is
identified as a critical water supply element in the Zone 40 WSMP and WSIP to implement Zone
40’s conjunctive use objectives. The objective is to maximize the use of surface water in wet
and normal years and allow the groundwater basin to recharge naturally to allow for sufficient
groundwater availability in dry years when surface water cutbacks will occur.
The Vineyard SWTP is proposed as the primary water supply source for the Study Area under
Phase 3 conditions, while Waterman and Wildhawk GWTPs will serve as supplemental water
sources (i.e. dry years and under emergency conditions). As development continues in Zone 40,
the capacity of the Vineyard SWTP will reach its maximum and will necessitate the next phase
in the SWTP and in the construction of additional groundwater supply sources.
(4) Water Supply Source(s) – Phase 4 (Build Out)
The ultimate water supply for the portion of the Study Area within both Zone 40 and the City of
Sacramento’s American River POU is the City’s treated surface water diverted from the
American River at the Fairbairn SWTP, or referred herein as the “POU water”. The majority of
the Study Area, along with the portion of the NVSSP area west of Bradshaw Road, is located
within the City’s American River Water POU area. The POU water will be wholesaled to
SCWA based on a wholesale water agreement(s) between SCWA and the City that is currently
being negotiated1.
The reliability of the POU water is rated “high” in the Zone 40 WSMP and the POU water will
be the single water supply source once the POU water delivery is considered to be dedicated
capacity from City water facilities that will be met through City water rights and system
operations. The maximum amount of POU water delivery is determined by the build-out water
1 An existing wholesale wheeling agreement currently exists for Zone 50 of the SCWA that is being amended to include all wholesale connections with the City.
APPENDIX B Sacramento County Water Agency Zone 40
Zone 40 Water System Infrastructure Plan
MWH Page 5-7 October 19, 2006
demand in the POU area within Zone 40 estimated to be 10,644 AF/Year including 7.5% system
losses.
For the small portion of the Study Area outside of the POU area, the Vineyard SWTP in
combination with the Waterman and Wildhawk GWTPs will be the water supply sources.
5.3 Water Infrastructure Requirements and Phasing for the Study Area
This section describes the facility requirements based on the proposed development phases for
the Study Area and the water supply phases described in the previous section. This section,
especially Figure 6 and Table 7, will be used by SCWA staff to identify the necessary
infrastructure and when certain facilities must be constructed to provide a reliable water supply
to the Study Area.

APPENDIX B Sacramento County Water Agency Zone 40
Zone 40 Water System Infrastructure Plan
MWH Page 5-8 October 19, 2006
Table 7. Water Supply Facility and Phasing Requirements
PHASE Water
Supply Sources
SUB-PHASE FACILITY REQUIREMETNS DESCRIPTION
(i) 24” T-main in Gerber Road from Elk Grove-Florin Road to Vineyard Road
Introduce treated water from Waterman and Wildhawk GWTPs to the initial development in NVSSP, and later to the Study Area.
(ii) 24” and 30” T-mains from Wildhawk GWTP to Gerber Road
Connect Wildhawk GWTP with the Gerber Road T-main.
1-A
(iii) 18” T-main in the NVSSP area Deliver water to the initial development area in the NVSSP.
1-B 24” and 36” T-mains between Gerber and Florin Roads, and 24” in Florin Road in west NVSSP area
Introduce treated water from Waterman and Wildhawk GWTPs to the Study Area through the NVSSP area.
(i) 16” T-main in Elk Grove-Florin Road and 24” T-main in Florin Roads
Deliver water to the initial development area in FVCP.
PHASE 1
Waterman and
Wildhawk GWTP’s
1-C (ii) 48” T-main in Bradshaw Road between Florin and Gerber Roads
Serve the NVSSP area along Bradshaw Road. The T-main is also part of the “backbone” transmission line to deliver the treated water from the Vineyard WTP to the Zone 40 CSA[1] in the future.
(i) 24” T-main in Elder Creek Road from S. Watt Ave. to Florin Perkins Road.
Connect to the City’s water distribution system to provide interim POU water supply to the Study area
(ii) Inline booster pump station in Elder Creek Road west of S. Watt Ave.
Maintain sufficient system head when connected to the City’s water distribution system.
(iii) 16” and 24” T-mains in Tokay Ln Connect the City’s intertie to the FVCP water distribution system.
PHASE 2
Waterman and
Wildhawk GWTP’s and
Interim Connection to the City
-
(iv) 16” T-main in Waterman south of Gerber Road
Deliver treated water to the development area south of Gerber Road
(i) First phase of the Vineyard WTP (50 MGD)
Treat surface water diverted from the Sacramento River through Freeport Diversion facility and FRWA transmission pipeline
(ii) 60” T-main in Florin Road from the Vineyard WTP to Bradshaw Road
Connect the Vineyard WTP to the FVCP and NVSSP water distribution system. The T-main is also part of the “backbone” transmission line to deliver the treated water from the Vineyard WTP to the Zone 40 CSA[1] in the future.
PHASE 3 First Phase of Vineyard
WTP -
(iii) 48” T-main in Bradshaw Road south of Gerber Road
Serve the FVCP area south of Gerber Road and along Bradshaw Road. The T-main is also part of the “backbone” transmission line to deliver the treated water from the Vineyard WTP to the Zone 40 CSA[1] in the future.
(i) 36” POU water transmission pipeline from Florin reservoir near Power Inn Road to the NVS storage tanks in the NVSSP area
Dedicated low-head transmission line conveying the full amount of the POU water from the City’s system to the POU area within Zone 40.
(ii) Two 2-MG NVS storage tanks and pump station
Store and distribute POU water to the POU area
(iii) 16” and 24” T-mains in Florin, Bradshaw, and Vineyard Roads
Serve the last phase of the development areas in the FVCP and NVSSP areas.
PHASE 4 POU Water -
(iv) Check valves on the POU area boundaries
Isolate POU area from the rest of the Zone 40 area to ensure that the POU water is used in the POU area.
Note: [1] CSA means the Central Service Area of Zone 40. The Zone 40 service area is geographically divided into three sub-service areas in the Zone 40 WSIP: North Service Area (NSA), Central Service Area (CSA), and South Service Area (SSA). NSA refers to the portion of Zone 40 service area north of HWY 16 (Jackson Highway) including the Sunrise Douglas Community Plan and Rio del Oro development areas. CSA refers to the portion of Zone 40 service area between HWY 99 and HWY 16. SSA refers to the portion of Zone 40 service area west of HWY 99 and north of Kammerer Road.

APPENDIX B Sacramento County Water Agency Zone 40
Zone 40 Water System Infrastructure Plan
MWH Page 5-9 October 19, 2006
N
ote:
[1] T
he fa
cilit
y ph
asin
g is
cor
resp
ondi
ng to
the
wat
er su
pply
pha
sing
for t
he S
tudy
Are
a de
scrib
ed in
the
prev
ious
sect
ion.
Figu
re 6
. W
ater
Infr
astr
uctu
re R
equi
rem
ents
and
Pha
sing
for
the
Stud
y A
rea
[1]

APPENDIX B Sacramento County Water Agency Zone 40
Zone 40 Water System Infrastructure Plan
MWH Page 6-1 October 19, 2006
SECTION 6. WATER DISTRIBUTION MODELING RESULTS
The water distribution modeling was conducted for a number of scenarios to verify that the
SCWA operating goals are met in the proposed water distribution system in the Study Area. The
water distribution modeling in this study uses the regional water distribution model developed
for the Zone 40 WSIP.
6.1 Modeling Scenarios The modeling scenarios evaluated in this study include:
Scenario 1 – Evaluate the proposed water distribution system for water supply Phase 1.
Scenario 2 – Evaluate the proposed water distribution system for water supply Phase 2.
Scenario 3 – Evaluate the proposed water distribution system for water supply Phase 3.
Scenario 4 (Build-out) – Evaluate the proposed water distribution system for water supply
Phase 4.
Fire Flows – Evaluate the fire flow capacities of the proposed water distribution system at all
water supply phases.
6.2 Modeling Assumptions The following are assumptions used in the water distribution model:
• A Hazen William’s “C” factor of 130 was used for new pipes and 125 used for existing pipes.
• A 72-hour Extend Period Simulation (EPS) was used to represent the system operations under various demands. The assumed Max Day Demand diurnal curve is shown in Figure 7, which is also used in the Zone 40 WSIP study.
• A Max Day Demand condition was assumed for each modeling scenario.
• The sizes of T-main and other major facilities were determined from the Zone 40 WSIP regional model.

APPENDIX B Sacramento County Water Agency Zone 40
Zone 40 Water System Infrastructure Plan
MWH Page 6-2 October 19, 2006
• Assume the maximum capacity at the interim connection to the City at South Watt Ave. and Elder Creek Road is 4,500 gpm.
Figure 7. Assumed Max Day Demand Diurnal Curve
0.8
0.5 0.6 0.5
0.8
1.3
2.0
1.5
1.3
1.00.9 0.9 0.9 0.9 0.9 0.8 0.8
1.0
1.21.3
1.2
1.00.9
0.8
0 .00 .10 .20 .30 .40 .50 .60 .70 .80 .91.01.11.21.31.41.51.61.71.81.92 .02 .1
Time (hours)
Max
imum
Day
Dem
and
Fact
or fo
r H
ourly
Dem
and
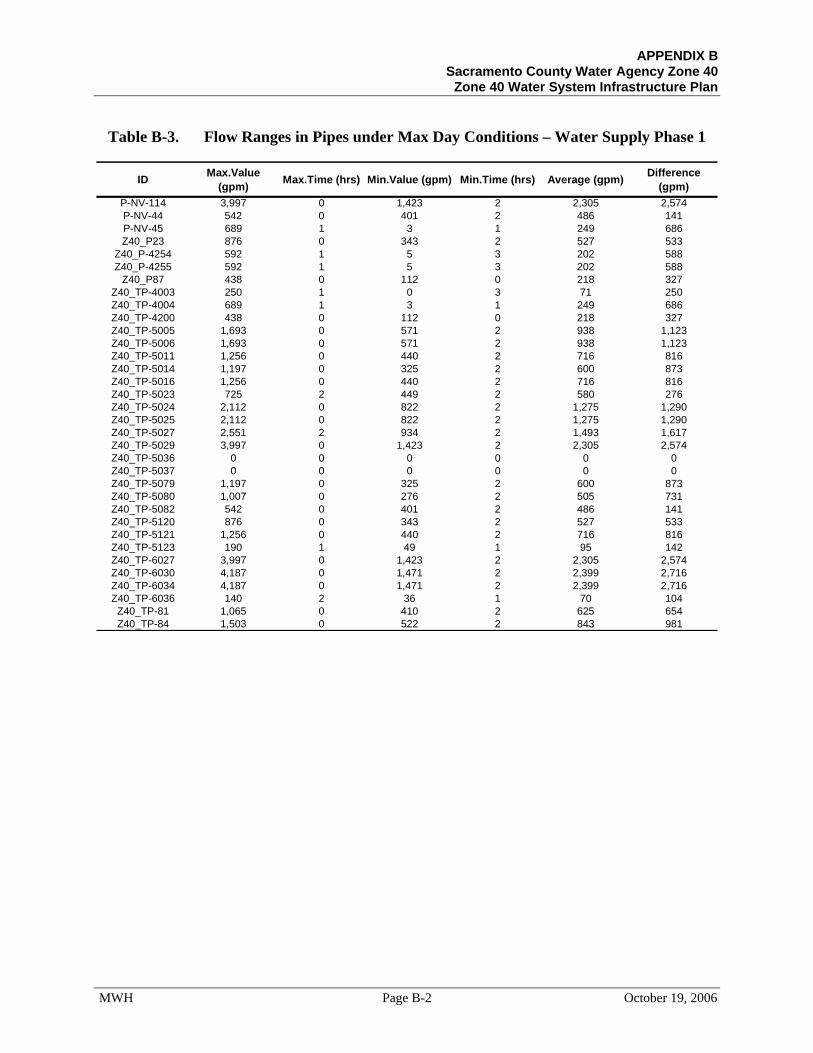
6.3 Modeling Results This section presents the modeling results for all the modeling scenarios described previously. The modeling results for operating conditions in Maximum Day conditions for scenarios 1 thru 4 are shown in Table 8, and Fire Flows in Table 9. More detailed modeling results are included in Appendices B through F with reference to the demand nodes and pipes identifications shown in Appendix A. The modeling results indicate that the proposed water supplies and the proposed T-main network are able to meet the demand growth in the Study Area and also satisfy the SCWA’s operating goals.

APPENDIX B Sacramento County Water Agency Zone 40
Zone 40 Water System Infrastructure Plan
MWH Page 6-3 October 19, 2006
Table 8. Modeling Results for Max Day Demand Conditions for All Water Supply Phases – 72 Hour EPS Run
Minimum Average Maximum [1] Scenario 1 - Water Supply Phase 1
Demand (gpm) 894 1,752 3,504 Pressure (psi) 69.3 73.9 78.5 Velocity (ft/s) 0 - 3.0
Scenario 2 - Water Supply Phase 2
Demand (gpm) 3,703 7,260 14,520 Pressure (psi) 51.1 64.4 77.6 Velocity (ft/s) 0 - 4.3
Scenario 3 - Water Supply Phase 3
Demand (gpm) 3,703 7,260 14,520 Pressure (psi) 47.7 62.8 78.2 Velocity (ft/s) 0 - 5.1
Scenario 4 - Water Supply Phase 4
Demand (gpm) 5,109 10,218 20,436 Pressure (psi) 48.1 65.5 82.9 Velocity (ft/s) 0 - 5.8
Note: [1] Refers to the maximum values for demand, pressure, and velocity over 72 hours. Those maximum values do not necessarily occur at the same time. Some maximum pressure values are shown slightly greater than the maximum operating goal and can be considered acceptable as they usually occur in midnight when the demand is lowest.
Table 9. Modeling Results for Fire Flow Conditions for All Water Supply Phases Fire Flow Duration
(Hours) Minimum Residual
Pressure (psi) Fire Flow for Water Supply Phase 1
2,000 gpm Fire Flows for Residential 2 70 3,000 gpm Fire Flows for Commercial 3 73
Fire Flow for Water Supply Phase 2 2,000 gpm Fire Flows for Residential 2 66 3,000 gpm Fire Flows for Commercial 3 65
Fire Flow for Water Supply Phase 3 2,000 gpm Fire Flows for Residential 2 61 3,000 gpm Fire Flows for Commercial 3 67
Fire Flow Water Supply Phase 4 2,000 gpm Fire Flows for Residential 2 56 3,000 gpm Fire Flows for Commercial 3 65

APPENDIX B Sacramento County Water Agency Zone 40
Zone 40 Water System Infrastructure Plan
MWH Page 7-1 October 19, 2006
SECTION 7. WATER FACILITY FINANCE SECTION
The purpose of this section is to provide, at a planning level, the estimated cost for construction
of the necessary water supply facilities by Zone 40. The Zone 40 Development Fee and User
Fee programs (Zone 40 Fee Program) will be used to finance the facilities identified in this study
including the capital buy-in to obtain service from the City of Sacramento. Zone 41 user rates
will be used to purchase treated surface water from the City of Sacramento within the POU area.
Table 10. Water Supply Facility Capital Costs Water Supply Facilities Total Units Unit Cost Cost
Water Supply Phase 1 (FT) ($/LF) ($) 16” Pipeline 8,902 $140 $1,246,340 18” Pipeline 3,869 $158 $611,282 24” Pipeline 31,004 $210 $6,510,860 30” Pipeline 2,370 $263 $623,423 36” Pipeline 3,647 $315 $1,148,800 48” Pipeline 5,260 $420 $2,209,209
Subtotal 55,053 - $12,349,914Water Supply Phase 2 (FT) ($/LF) ($)
16” Pipeline 11,902 $140 $1,666,22524” Pipeline 28,529 $210 $5,991,086
(HP) ($/HP) Inline Booster Pump 170.6 $1500 $255,900
Subtotal - - $7,913,210Water Supply Phase 3 (FT) ($/LF) ($)
24” Pipeline 3,324 $210 $697,95248” Pipeline 5,380 $420 $2,259,39560” Pipeline 6,166 $525 $3,237,212
Subtotal - - $6,194,559Water Supply Phase 4 Capital Buy-in for City of Sacramento POU Water (FT) ($/LF) ($)
36” POU Pipeline 22,630 $315 $7,128,450 (MG) ($/MG) ($)
Hanfield (North Vineyard Station) Storage Tanks 4 $300,000 $1,200,000 (HP) ($/HP) ($)
1,026 $1,500 $1,539,000Subtotal - - $9,867,450
TOTAL - - $36,325,134 The Zone 40 Fee Program accounts for all aspects of providing water service to the entire Zone
40 area including the Study Area. Upon completion of this study, the Zone 40 WSIP will be
updated to reflect any changes as a result of this study, and the Zone 40 Fee Program will be
adjusted, if needed, to accommodate the necessary water supply facilities identified in Table 10.

APPENDIX B Sacramento County Water Agency Zone 40
Zone 40 Water System Infrastructure Plan
MWH Page 7-2 October 19, 2006
For a more comprehensive discussion on the Zone 40 Fee Program, the reader is advised to
review the Zone 40 WSMP and WSIP where the overall Capital Improvement Program and the
necessary fees are identified. In addition, the WSIP provides a detailed description of the type of
facilities constructed by SCWA and the type that are constructed by the developer and
reimbursed through credits and reimbursement agreements. The developer is solely responsible
for the distribution mains that are said to benefit the individual projects.

APPENDIX B Sacramento County Water Agency Zone 40
Zone 40 Water System Infrastructure Plan
MWH Page 8-1 October 19, 2006
SECTION 8. NEXT STEPS
The primary objective of this study was to evaluate the water supply and large water distribution
system requirements and facilities phasing for the portion of the Study Area located within Zone
40 (including a small portion located with Florin County WD). Upon approval of the FVCP by
the Sacramento County Board of Supervisors, individual development applications will be
requested (or conditioned) to prepare a supplemental water supply study that complements this
report in terms of identifying the needed lands and rights-of-way for the facilities identified in
this report, and to size the local distribution mains, not included in this report, that will serve
individual homes.

APPENDIX B Sacramento County Water Agency Zone 40
Zone 40 Water System Infrastructure Plan
MWH Page A October 19, 2006
APPENDIX A
Demand Nodes and Pipes IDs in the Model

APPENDIX B Sacramento County Water Agency Zone 40
Zone 40 Water System Infrastructure Plan
MWH Page A-1 October 19, 2006
Figure A-1. Nodes and Pipes ID’s in the Model

APPENDIX B Sacramento County Water Agency Zone 40
Zone 40 Water System Infrastructure Plan
MWH Page B October 19, 2006
APPENDIX B
Modeling Results Scenario 1 – Water Supply
Phase 1

APPENDIX B Sacramento County Water Agency Zone 40
Zone 40 Water System Infrastructure Plan
MWH Page B-1 October 19, 2006
Table B-1. Node Demand Ranges for Max Day Conditions – Water Supply Phase 1
ID Max.Value (gpm)
Max.Time (hrs)
Min.Value (gpm)
Min.Time (hrs)
Average (gpm)
Difference (gpm)
FLGP-04-1 438.4 6:00 111.8 1:00 218.4 326.6FLGP-03-1 438.4 6:00 111.8 1:00 218.4 326.6FLGP-06-3 438.4 6:00 111.8 1:00 218.4 326.6FLGP-04-2 438.4 6:00 111.8 1:00 218.4 326.6FLGP-03-2 438.4 6:00 111.8 1:00 218.4 326.6FLGP-02-3 438.4 6:00 111.8 1:00 218.4 326.6FLGP-01-2 438.4 6:00 111.8 1:00 218.4 326.6FLGP-05-1 438.4 6:00 111.8 1:00 218.4 326.6NVSN-01-3 190.1 6:00 48.5 1:00 94.7 141.6NVSN-01-2 190.1 6:00 48.5 1:00 94.7 141.6NVSN-01-4 190.1 6:00 48.5 1:00 94.7 141.6NVSN-02-1 190.1 6:00 48.5 1:00 94.7 141.6NVSN-02-2 190.1 6:00 48.5 1:00 94.7 141.6NVSN-02-3 190.1 6:00 48.5 1:00 94.7 141.6NVSN-03-1 190.1 6:00 48.5 1:00 94.7 141.6NVSN-04-2 190.1 6:00 48.5 1:00 94.7 141.6NVSN-01-1 190.1 6:00 48.5 1:00 94.7 141.6VSCP-05-1 139.5 6:00 35.6 1:00 69.5 104
Table B-2. Node Pressure Ranges under Max Day Conditions – Water Supply Phase 1
ID Max.Value (psi) Max.Time (hrs) Min.Value (psi) Min.Time (hrs) Average (psi) Difference (psi)
FLGP-04-1 76.3 1:00 70.6 6:00 74.8 5.7FLGP-03-1 78.5 1:00 72.7 6:00 76.9 5.8FLGP-06-3 78.5 1:00 72.7 6:00 76.9 5.8FLGP-04-2 78.5 1:00 72.8 6:00 76.9 5.7FLGP-03-2 78.5 1:00 73.1 6:00 77 5.4FLGP-02-3 74.3 1:00 69.3 6:00 72.9 5FLGP-01-2 78.5 1:00 73.1 6:00 77 5.3FLGP-05-1 78 1:00 72.1 6:00 76.4 6NVSN-01-3 72 1:00 66.6 6:00 70.6 5.4NVSN-01-2 74.2 1:00 68.8 6:00 72.7 5.4NVSN-01-4 74.3 1:00 69.5 6:00 73 4.8NVSN-02-1 76.4 1:00 71 6:00 74.9 5.4NVSN-02-2 76.4 49:00:00 71 6:00 74.9 5.3NVSN-02-3 76.4 49:00:00 70.9 6:00 74.8 5.5NVSN-03-1 74.2 1:00 68.6 6:00 72.6 5.6NVSN-04-2 68.1 1:00 64.7 6:00 67.1 3.3NVSN-01-1 76.4 1:00 70.8 6:00 74.8 5.5VSCP-05-1 57.6 1:00 56.1 6:00 57.1 1.5
APPENDIX B Sacramento County Water Agency Zone 40
Zone 40 Water System Infrastructure Plan
MWH Page B-2 October 19, 2006
Table B-3. Flow Ranges in Pipes under Max Day Conditions – Water Supply Phase 1
ID Max.Value (gpm) Max.Time (hrs) Min.Value (gpm) Min.Time (hrs) Average (gpm) Difference
(gpm)P-NV-114 3,997 0 1,423 2 2,305 2,574P-NV-44 542 0 401 2 486 141P-NV-45 689 1 3 1 249 686Z40_P23 876 0 343 2 527 533
Z40_P-4254 592 1 5 3 202 588Z40_P-4255 592 1 5 3 202 588
Z40_P87 438 0 112 0 218 327Z40_TP-4003 250 1 0 3 71 250Z40_TP-4004 689 1 3 1 249 686Z40_TP-4200 438 0 112 0 218 327Z40_TP-5005 1,693 0 571 2 938 1,123Z40_TP-5006 1,693 0 571 2 938 1,123Z40_TP-5011 1,256 0 440 2 716 816Z40_TP-5014 1,197 0 325 2 600 873Z40_TP-5016 1,256 0 440 2 716 816Z40_TP-5023 725 2 449 2 580 276Z40_TP-5024 2,112 0 822 2 1,275 1,290Z40_TP-5025 2,112 0 822 2 1,275 1,290Z40_TP-5027 2,551 2 934 2 1,493 1,617Z40_TP-5029 3,997 0 1,423 2 2,305 2,574Z40_TP-5036 0 0 0 0 0 0Z40_TP-5037 0 0 0 0 0 0Z40_TP-5079 1,197 0 325 2 600 873Z40_TP-5080 1,007 0 276 2 505 731Z40_TP-5082 542 0 401 2 486 141Z40_TP-5120 876 0 343 2 527 533Z40_TP-5121 1,256 0 440 2 716 816Z40_TP-5123 190 1 49 1 95 142Z40_TP-6027 3,997 0 1,423 2 2,305 2,574Z40_TP-6030 4,187 0 1,471 2 2,399 2,716Z40_TP-6034 4,187 0 1,471 2 2,399 2,716Z40_TP-6036 140 2 36 1 70 104
Z40_TP-81 1,065 0 410 2 625 654Z40_TP-84 1,503 0 522 2 843 981

APPENDIX B Sacramento County Water Agency Zone 40
Zone 40 Water System Infrastructure Plan
MWH Page B-3 October 19, 2006
Table B-4. Velocity Ranges in Pipes under Max Day Conditions – Water Supply Phase 1
ID Max.Value (ft/s) Max.Time (hrs) Min.Value (ft/s) Min.Time (hrs) Average (ft/s) Difference (ft/s)
P-NV-114 2.8 0.3 1.0 2.0 1.6 1.8P-NV-44 0.9 0.5 0.6 2.0 0.8 0.2P-NV-45 1.1 1.3 0.0 1.1 0.4 1.1Z40_P23 1.1 0.3 0.4 2.0 0.7 0.7
Z40_P-4254 0.4 1.3 0.0 2.7 0.1 0.4Z40_P-4255 0.4 1.3 0.0 2.7 0.1 0.4
Z40_P87 0.0 0.3 0.0 0.1 0.0 0.0Z40_TP-4003 0.4 1.3 0.0 2.5 0.1 0.4Z40_TP-4004 1.1 1.3 0.0 1.1 0.4 1.1Z40_TP-4200 0.7 0.3 0.2 0.0 0.3 0.5Z40_TP-5005 0.5 0.3 0.2 2.0 0.3 0.4Z40_TP-5006 0.5 0.3 0.2 2.0 0.3 0.4Z40_TP-5011 1.6 0.3 0.6 2.0 0.9 1.0Z40_TP-5014 0.8 0.3 0.2 2.0 0.4 0.6Z40_TP-5016 1.6 0.3 0.6 2.0 0.9 1.0Z40_TP-5023 0.5 2.3 0.3 2.0 0.4 0.2Z40_TP-5024 1.5 0.3 0.6 2.0 0.9 0.9Z40_TP-5025 1.5 0.3 0.6 2.0 0.9 0.9Z40_TP-5027 1.8 2.3 0.7 2.0 1.1 1.1Z40_TP-5029 2.8 0.3 1.0 2.0 1.6 1.8Z40_TP-5036 0.0 3.0 0.0 2.9 0.0 0.0Z40_TP-5037 0.0 1.4 0.0 2.9 0.0 0.0Z40_TP-5079 0.8 0.3 0.2 2.0 0.4 0.6Z40_TP-5080 0.7 0.3 0.2 2.0 0.4 0.5Z40_TP-5082 0.4 0.5 0.3 2.0 0.3 0.1Z40_TP-5120 1.1 0.3 0.4 2.0 0.7 0.7Z40_TP-5121 1.6 0.3 0.6 2.0 0.9 1.0Z40_TP-5123 0.0 1.3 0.0 1.1 0.0 0.0Z40_TP-6027 2.8 0.3 1.0 2.0 1.6 1.8Z40_TP-6030 3.0 0.3 1.0 2.0 1.7 1.9Z40_TP-6034 3.0 0.3 1.0 2.0 1.7 1.9Z40_TP-6036 0.0 2.3 0.0 1.1 0.0 0.0
Z40_TP-81 0.8 0.3 0.3 2.0 0.4 0.5Z40_TP-84 1.1 0.3 0.4 2.0 0.6 0.7

APPENDIX B Sacramento County Water Agency Zone 40
Zone 40 Water System Infrastructure Plan
MWH Page C October 19, 2006
APPENDIX C
Modeling Results Scenario 2 – Water Supply
Phase 2

APPENDIX B Sacramento County Water Agency Zone 40
Zone 40 Water System Infrastructure Plan
MWH Page C-1 October 19, 2006
Table C-1. Node Demand Ranges for Max Day Conditions – Water Supply Phase 2
ID Max.Value (gpm) Max.Time (hrs) Min.Value
(gpm) Min.Time (hrs) Average (gpm) Difference (gpm)
FLGP-06-3 2,676.40 6:00 682.5 1:00 1,333.30 1,993.90FLGP-06-1 2,676.40 6:00 682.5 1:00 1,333.30 1,993.90FLGP-01-2 1,055.20 6:00 269.1 1:00 525.7 786.1FLGP-01-1 1,055.20 6:00 269.1 1:00 525.6 786.1FLGP-03-1 965.1 6:00 246.1 1:00 480.8 719FLGP-03-2 965.1 6:00 246.1 1:00 480.8 719FLGP-05-1 936.8 6:00 238.9 1:00 466.7 697.9FLGP-02-1 871.6 6:00 222.3 1:00 434.2 649.3FLGP-02-2 871.6 6:00 222.3 1:00 434.2 649.3FLGP-02-3 871.6 6:00 222.3 1:00 434.2 649.3FLGP-04-1 787.8 6:00 200.9 1:00 392.4 586.9FLGP-04-2 787.8 6:00 200.9 1:00 392.4 586.9NVSN-03-2 624 6:00 159.1 1:00 310.8 464.9NVSN-03-1 624 6:00 159.1 1:00 310.8 464.9NVSN-04-1 596.6 6:00 152.1 1:00 297.2 444.5NVSN-04-3 596.6 6:00 152.1 1:00 297.2 444.5NVSN-04-2 596.6 6:00 152.1 1:00 297.2 444.5NVSN-02-3 369 6:00 94.1 1:00 183.8 274.9NVSN-02-1 368.9 6:00 94.1 1:00 183.8 274.9NVSN-02-2 368.9 6:00 94.1 1:00 183.8 274.9NVSN-01-3 239.8 6:00 61.1 1:00 119.5 178.7NVSN-01-4 239.8 6:00 61.1 1:00 119.5 178.7NVSN-01-1 239.8 6:00 61.1 1:00 119.5 178.7NVSN-01-2 239.7 6:00 61.1 1:00 119.4 178.6VSCP-05-1 140.2 6:00 35.8 1:00 69.8 104.4
Table C-2. Node Pressure Ranges for Max Day Conditions – Water Supply Phase 2
ID Max.Value (psi) Max.Time (hrs) Min.Value (psi) Min.Time (hrs) Average (psi) Difference (psi)
FLGP-06-3 77.3 9:00 65.2 6:00 71.9 12FLGP-06-1 73.7 9:00 62 6:00 67.8 11.6FLGP-01-2 77.6 9:00 65.4 6:00 72 12.2FLGP-01-1 76 9:00 62.9 6:00 70.3 13.1FLGP-03-1 77.3 9:00 65.2 6:00 71.9 12FLGP-03-2 77.6 9:00 65.4 6:00 71.9 12.2FLGP-05-1 76.8 9:00 67.5 6:00 72.5 9.3FLGP-02-1 75.1 9:00 61.9 6:00 69.3 13.2FLGP-02-2 64.3 9:00 51.1 6:00 58.5 13.2FLGP-02-3 73.7 9:00 62.1 6:00 67.9 11.6FLGP-04-1 75.3 9:00 63.3 6:00 69.8 11.9FLGP-04-2 77.3 9:00 65.2 6:00 71.9 12.1NVSN-03-2 71.5 9:00:00 59.8 6:00 65.7 11.6NVSN-03-1 73.4 9:00:00 61.7 6:00 67.8 11.7NVSN-04-1 73.1 9:00 61.7 20:00 66.4 11.4NVSN-04-3 68.1 9:00 57.3 20:00 61.8 10.8NVSN-04-2 68.8 9:00 57.4 20:00 62 11.4NVSN-02-3 75.6 9:00 63.8 6:00 69.9 11.8NVSN-02-1 75.5 9:00 63.6 54:00:00 69.8 11.9NVSN-02-2 75.6 9:00 63.7 6:00 69.9 11.8NVSN-01-3 71.3 9:00 59.7 6:00 65.6 11.7NVSN-01-4 73.9 9:00:00 62.4 6:00 68 11.4NVSN-01-1 75.6 9:00 63.9 6:00 69.9 11.7NVSN-01-2 73.5 9:00 61.8 6:00 67.8 11.7VSCP-05-1 60.5 9:00 46.7 20:00 51.9 13.9

APPENDIX B Sacramento County Water Agency Zone 40
Zone 40 Water System Infrastructure Plan
MWH Page C-2 October 19, 2006
Table C-3. Flow Ranges in Pipes under Max Day Conditions – Water Supply Phase 2
ID Max.Value (gpm) Max.Time (hrs) Min.Value (gpm) Min.Time (hrs) Average (gpm) Difference
(gpm)P-NV-101 1,927 20:00 11 32:00:00 980 1,916P-NV-113 5,742 54:00:00 1,178 1:00 2,675 4,564P-NV-114 4,941 54:00:00 956 1:00 2,305 3,985P-NV-44 1,197 54:00:00 86 0:00 439 1,111P-NV-45 750 8:00 28 41:00:00 333 722P-NV-49 4,500 6:00 0 2:00 2,328 4,500P-NV-84 0 0:00 0 0:00 0 0P-Z40-29 597 6:00 152 1:00 297 445P-Z40-67 624 6:00 159 1:00 311 465Z40_P23 769 8:00 5 52:00:00 298 763
Z40_P-4254 1,142 4:00 10 65:00:00 408 1,132Z40_P-4255 1,142 4:00 10 65:00:00 408 1,132
Z40_P79 1,526 54:00:00 109 2:00 748 1,417Z40_P81 2,676 6:00 683 1:00 1,333 1,994Z40_P85 597 6:00 152 27:00:00 297 445Z40_P87 2,676 6:00 683 1:00 1,333 1,994
Z40_TP-253 2,682 54:00:00 199 25:00:00 1,398 2,483Z40_TP-4003 407 20:00 10 49:00:00 160 397Z40_TP-4004 750 8:00 28 41:00:00 333 722Z40_TP-4200 1,902 20:00 40 25:00:00 940 1,862Z40_TP-4201 2,682 54:00:00 199 25:00:00 1,398 2,483Z40_TP-4202 1,927 20:00 11 32:00:00 980 1,916Z40_TP-5005 1,033 20:00 5 15:00 444 1,028Z40_TP-5006 1,033 20:00 5 15:00 444 1,028Z40_TP-5011 1,181 54:00:00 190 52:00:00 537 991Z40_TP-5014 822 20:00 0 26:00:00 365 822Z40_TP-5016 1,181 54:00:00 190 52:00:00 537 991Z40_TP-5023 1,566 54:00:00 106 3:00 610 1,460Z40_TP-5024 1,346 8:00 42 52:00:00 466 1,304Z40_TP-5025 2,649 54:00:00 385 4:00 1,214 2,264Z40_TP-5027 3,521 54:00:00 646 1:00 1,648 2,874Z40_TP-5029 4,941 54:00:00 956 1:00 2,305 3,985Z40_TP-5036 6,338 54:00:00 1,330 1:00 2,972 5,008Z40_TP-5037 6,338 54:00:00 1,330 1:00 2,972 5,008Z40_TP-5040 471 54:00:00 30 1:00 233 442Z40_TP-5079 822 20:00 0 26:00:00 365 822Z40_TP-5080 1,181 54:00:00 31 57:00:00 517 1,151Z40_TP-5082 1,197 54:00:00 86 0:00 439 1,111Z40_TP-5088 872 6:00 222 3:00 434 649Z40_TP-5120 769 8:00 5 52:00:00 298 763Z40_TP-5121 1,181 54:00:00 190 52:00:00 537 991Z40_TP-5123 240 6:00 61 1:00 120 179Z40_TP-5200 1,927 20:00 11 32:00:00 980 1,916Z40_TP-6027 4,394 54:00:00 1 4:00 961 4,393Z40_TP-6030 5,588 54:00:00 347 60:00:00 1,476 5,240Z40_TP-6034 5,588 54:00:00 347 60:00:00 1,476 5,240Z40_TP-6036 140 30:00:00 36 27:00:00 70 104
Z40_TP-62 597 6:00 152 1:00 297 445Z40_TP-81 2,128 54:00:00 256 52:00:00 942 1,873Z40_TP-84 2,916 54:00:00 539 50:00:00 1,335 2,377Z40_TP-87 2,625 8:00 40 4:00 1,031 2,585Z40_TP-89 5,742 54:00:00 1,178 1:00 2,675 4,564

APPENDIX B Sacramento County Water Agency Zone 40
Zone 40 Water System Infrastructure Plan
MWH Page C-3 October 19, 2006
Table C-4. Velocity Ranges in Pipes under Max Day Conditions – Water Supply Phase 2
ID Max.Value (ft/s) Max.Time (hrs) Min.Value (ft/s) Min.Time (hrs) Average (ft/s) Difference (ft/s)
P-NV-101 1.4 20:00 0.0 32:00:00 0.7 1.4P-NV-113 4.1 54:00:00 0.8 1:00 1.9 3.2P-NV-114 3.5 54:00:00 0.7 1:00 1.6 2.8P-NV-44 1.9 54:00:00 0.1 0:00 0.7 1.8P-NV-45 1.2 8:00 0.0 41:00:00 0.5 1.2P-NV-49 3.2 6:00 0.0 2:00 1.7 3.2P-NV-84 0.0 0:00 0.0 0:00 0.0 0.0P-Z40-29 0.1 6:00 0.0 1:00 0.0 0.1P-Z40-67 0.0 6:00 0.0 1:00 0.0 0.0Z40_P23 1.0 8:00 0.0 52:00:00 0.4 1.0
Z40_P-4254 0.8 4:00 0.0 65:00:00 0.3 0.8Z40_P-4255 0.8 4:00 0.0 65:00:00 0.3 0.8
Z40_P79 2.4 54:00:00 0.2 2:00 1.2 2.3Z40_P81 0.1 6:00 0.0 1:00 0.1 0.1Z40_P85 0.0 6:00 0.0 27:00:00 0.0 0.0Z40_P87 0.1 6:00 0.0 1:00 0.1 0.1
Z40_TP-253 4.3 54:00:00 0.3 25:00:00 2.2 4.0Z40_TP-4003 0.6 20:00 0.0 49:00:00 0.3 0.6Z40_TP-4004 1.2 8:00 0.0 41:00:00 0.5 1.2Z40_TP-4200 3.0 20:00 0.1 25:00:00 1.5 3.0Z40_TP-4201 4.3 54:00:00 0.3 25:00:00 2.2 4.0Z40_TP-4202 3.1 20:00 0.0 32:00:00 1.6 3.1Z40_TP-5005 0.3 20:00 0.0 15:00 0.1 0.3Z40_TP-5006 0.3 20:00 0.0 15:00 0.1 0.3Z40_TP-5011 1.5 54:00:00 0.2 52:00:00 0.7 1.2Z40_TP-5014 0.6 20:00 0.0 26:00:00 0.3 0.6Z40_TP-5016 1.5 54:00:00 0.2 52:00:00 0.7 1.2Z40_TP-5023 1.1 54:00:00 0.1 3:00 0.4 1.0Z40_TP-5024 1.0 8:00 0.0 52:00:00 0.3 0.9Z40_TP-5025 1.9 54:00:00 0.3 4:00 0.9 1.6Z40_TP-5027 2.5 54:00:00 0.5 1:00 1.2 2.0Z40_TP-5029 3.5 54:00:00 0.7 1:00 1.6 2.8Z40_TP-5036 1.1 54:00:00 0.2 1:00 0.5 0.9Z40_TP-5037 1.1 54:00:00 0.2 1:00 0.5 0.9Z40_TP-5040 0.8 54:00:00 0 1:00 0.4 0.7Z40_TP-5079 0.6 20:00 0 26:00:00 0.3 0.6Z40_TP-5080 0.8 54:00:00 0 57:00:00 0.4 0.8Z40_TP-5082 0.8 54:00:00 0.1 0:00 0.3 0.8Z40_TP-5088 0 6:00 0 3:00 0 0Z40_TP-5120 1 8:00 0 52:00:00 0.4 1Z40_TP-5121 1.5 54:00:00 0.2 52:00:00 0.7 1.2Z40_TP-5123 0 6:00 0 1:00 0 0Z40_TP-5200 3.1 20:00 0 32:00:00 1.6 3.1Z40_TP-6027 3.1 54:00:00 0 4:00 0.7 3.1Z40_TP-6030 4 54:00:00 0.2 60:00:00 1 3.7Z40_TP-6034 4 54:00:00 0.2 60:00:00 1 3.7Z40_TP-6036 0 30:00:00 0 27:00:00 0 0Z40_TP-62 0 6:00 0 1:00 0 0Z40_TP-81 1.5 54:00:00 0.2 52:00:00 0.7 1.3Z40_TP-84 2.1 54:00:00 0.4 50:00:00 0.9 1.7Z40_TP-87 1.9 8:00 0 4:00 0.7 1.8Z40_TP-89 4.1 54:00:00 0.8 1:00 1.9 3.2

APPENDIX B Sacramento County Water Agency Zone 40
Zone 40 Water System Infrastructure Plan
MWH Page D October 19, 2006
APPENDIX D
Modeling Results Scenario 3 – Water Supply
Phase 3

APPENDIX B Sacramento County Water Agency Zone 40
Zone 40 Water System Infrastructure Plan
MWH Page D-1 October 19, 2006
Table D-1. Node Demand Ranges under Max Day Conditions – Water Supply Phase 3
ID Max.Value (gpm) Max.Time (hrs) Min.Value
(gpm) Min.Time (hrs) Average (gpm) Difference (gpm)
FLGP-06-1 2,676.40 6:00 682.5 1:00 1,333.30 1,993.90FLGP-06-3 2,676.30 6:00 682.5 1:00 1,333.20 1,993.90FLGP-01-2 1,055.20 6:00 269.1 1:00 525.7 786.1FLGP-01-1 1,055.20 6:00 269.1 1:00 525.6 786.1FLGP-03-1 965.1 6:00 246.1 1:00 480.8 719FLGP-03-2 965.1 6:00 246.1 1:00 480.8 719FLGP-05-1 936.8 6:00 238.9 1:00 466.7 697.9FLGP-02-1 871.6 6:00 222.3 1:00 434.2 649.3FLGP-02-2 871.6 6:00 222.3 1:00 434.2 649.3FLGP-02-3 871.6 6:00 222.3 1:00 434.2 649.3FLGP-04-1 787.8 6:00 200.9 1:00 392.4 586.9FLGP-04-2 787.8 6:00 200.9 1:00 392.4 586.9NVSN-03-2 624 6:00 159.1 1:00 310.8 464.9NVSN-03-1 624 6:00 159.1 1:00 310.8 464.9NVSN-04-1 596.6 6:00 152.1 1:00 297.2 444.5NVSN-04-3 596.6 6:00 152.1 1:00 297.2 444.5NVSN-04-2 596.6 6:00 152.1 1:00 297.2 444.5NVSN-02-3 369 6:00 94.1 1:00 183.8 274.9NVSN-02-1 368.9 6:00 94.1 1:00 183.8 274.9NVSN-02-2 368.9 6:00 94.1 1:00 183.8 274.9NVSN-01-3 239.8 6:00 61.1 1:00 119.5 178.7NVSN-01-4 239.8 6:00 61.1 1:00 119.5 178.7NVSN-01-1 239.8 6:00 61.1 1:00 119.5 178.7NVSN-01-2 239.7 6:00 61.1 1:00 119.4 178.6VSCP-05-1 140.2 6:00 35.8 1:00 69.8 104.4
Table D-2. Node Pressure Ranges for Max Day Conditions – Water Supply Phase 3
ID Max.Value (psi) Max.Time (hrs) Min.Value (psi) Min.Time (hrs) Average (psi) Difference (psi)
FLGP-06-1 73.3 1:00 65.7 6:00 71.8 7.7FLGP-06-3 77.6 1:00 66.4 6:00 75.2 11.2FLGP-01-2 78.2 1:00 66.9 6:00 75.4 11.4FLGP-01-1 76 1:00 61.6 6:00 72.8 14.4FLGP-03-1 77.6 1:00 66.4 6:00 75.2 11.2FLGP-03-2 77.9 1:00 66.9 6:00 75.4 11.1FLGP-05-1 77.1 1:00 66 6:00 74.7 11.1FLGP-02-1 74.9 1:00 58.5 6:00 71.3 16.4FLGP-02-2 64.1 1:00 47.7 6:00 60.4 16.4FLGP-02-3 73.4 1:00 65 6:00 71.7 8.3FLGP-04-1 75.4 1:00 64.9 6:00 73.2 10.5FLGP-04-2 77.7 1:00 66.4 6:00 75.2 11.3NVSN-03-2 71.2 1:00:00 63.5 6:00 69.6 7.7NVSN-03-1 73.3 1:00:00 64 6:00 71.4 9.3NVSN-04-1 71.4 1:00 66.6 6:00 70.6 4.9NVSN-04-3 67 1:00 65.2 6:00 66.9 1.8NVSN-04-2 67.1 1:00 62.2 6:00 66.2 4.9NVSN-02-3 75.5 1:00 66 6:00 73.5 9.5NVSN-02-1 75.6 1:00 65.6 54:00:00 73.4 10NVSN-02-2 75.5 1:00 65.9 6:00 73.5 9.6NVSN-01-3 71.2 1:00 62.1 6:00 69.3 9NVSN-01-4 73.4 1:00:00 65.6 6:00 71.8 7.8NVSN-01-1 75.5 1:00 66.1 6:00 73.5 9.3NVSN-01-2 73.3 1:00 64.3 6:00 71.4 9VSCP-05-1 56.7 1:00 51.4 6:00 55.6 5.3

APPENDIX B Sacramento County Water Agency Zone 40
Zone 40 Water System Infrastructure Plan
MWH Page D-2 October 19, 2006
Table D-3. Flow Ranges in Pipes under Max Day Condition – Water Supply Phase 3
ID Max.Value (gpm) Max.Time (hrs) Min.Value (gpm) Min.Time (hrs) Average (gpm) Difference
(gpm)P-NV-101 872 2 168 0 414 705P-NV-113 9,701 2 1,484 0 4,537 8,217P-NV-114 7,163 2 1,161 0 3,409 6,003P-NV-44 1,901 2 128 2 739 1,774P-NV-45 1,060 0 346 0 551 714P-NV-49 0 0 0 0 0 0P-NV-84 0 0 0 0 0 0P-Z40-29 29,187 2 49 0 12,476 29,138P-Z40-67 624 0 159 0 311 465Z40_P23 1,320 0 225 0 626 1,095
Z40_P-4254 1,634 0 7 3 471 1,626Z40_P-4255 1,634 0 7 3 471 1,626
Z40_P79 2,798 0 714 1 1,394 2,085Z40_P81 2,676 0 683 0 1,333 1,994Z40_P85 597 0 152 0 297 445Z40_P87 2,676 0 683 0 1,333 1,994
Z40_TP-253 872 2 168 0 414 705Z40_TP-4003 365 0 9 3 170 356Z40_TP-4004 1,060 0 346 0 551 714Z40_TP-4200 100 0 7 3 53 93Z40_TP-4201 872 2 168 0 414 705Z40_TP-4202 872 2 168 0 414 705Z40_TP-5005 520 0 0 2 186 519Z40_TP-5006 520 0 0 2 186 519Z40_TP-5011 1,799 0 347 0 865 1,452Z40_TP-5014 1,179 2 95 2 465 1,084Z40_TP-5016 1,799 0 347 0 865 1,452Z40_TP-5023 2,270 2 25 2 890 2,246Z40_TP-5024 1,461 2 93 1 609 1,368Z40_TP-5025 4,259 2 530 0 1,990 3,729Z40_TP-5027 5,131 2 753 0 2,425 4,378Z40_TP-5029 7,163 2 1,161 0 3,409 6,003Z40_TP-5036 19,486 2 757 0 8,045 18,729Z40_TP-5037 19,486 2 757 0 8,045 18,729Z40_TP-5040 1,743 0 445 1 868 1,299Z40_TP-5079 1,179 2 95 2 465 1,084Z40_TP-5080 1,548 2 9 2 617 1,539Z40_TP-5082 1,901 2 128 2 739 1,774Z40_TP-5088 872 0 222 0 434 649Z40_TP-5120 1,320 0 225 0 626 1,095Z40_TP-5121 1,799 0 347 0 865 1,452Z40_TP-5123 240 0 61 0 120 179Z40_TP-5200 872 2 168 0 414 705Z40_TP-6027 1,370 0 2 2 611 1,367Z40_TP-6030 1,674 0 46 2 1,093 1,628Z40_TP-6034 1,674 0 46 2 1,093 1,628Z40_TP-6036 140 0 36 1 70 104
Z40_TP-62 597 0 152 0 297 445Z40_TP-81 3,643 2 635 0 1,709 3,008Z40_TP-84 4,431 2 836 0 2,101 3,595Z40_TP-87 6,401 2 643 0 2,892 5,758Z40_TP-89 9,701 2 1,484 0 4,537 8,217

APPENDIX B Sacramento County Water Agency Zone 40
Zone 40 Water System Infrastructure Plan
MWH Page D-3 October 19, 2006
Table D-4. Velocity Ranges s in Pipes under Max Day Condition – Water Supply Phase 3
ID Max.Value (ft/s) Max.Time (hrs) Min.Value (ft/s) Min.Time (hrs) Average (ft/s) Difference (ft/s)
P-NV-101 0.6 2.3 0.1 0.0 0.3 0.5P-NV-113 6.9 2.3 1.1 0.0 3.2 5.8P-NV-114 5.1 2.3 0.8 0.0 2.4 4.3P-NV-44 3.0 2.3 0.2 2.1 1.2 2.8P-NV-45 1.7 0.3 0.6 0.4 0.9 1.1P-NV-49 0.0 0.8 0.0 1.8 0.0 0.0P-NV-84 0.0 0.0 0.0 0.0 0.0 0.0P-Z40-29 3.3 2.3 0.0 0.1 1.4 3.3P-Z40-67 0.0 0.3 0.0 0.0 0.0 0.0Z40_P23 1.7 0.3 0.3 0.0 0.8 1.4
Z40_P-4254 1.2 0.0 0.0 3.0 0.3 1.2Z40_P-4255 1.2 0.0 0.0 3.0 0.3 1.2
Z40_P79 4.5 0.3 1.1 1.1 2.2 3.3Z40_P81 0.1 0.3 0.0 0.0 0.1 0.1Z40_P85 0.0 0.3 0.0 0.0 0.0 0.0Z40_P87 0.1 0.3 0.0 0.0 0.1 0.1
Z40_TP-253 1.4 2.3 0.3 0.0 0.7 1.1Z40_TP-4003 0.6 0.0 0.0 2.9 0.3 0.6Z40_TP-4004 1.7 0.3 0.6 0.4 0.9 1.1Z40_TP-4200 0.2 0.3 0.0 2.8 0.1 0.1Z40_TP-4201 1.4 2.3 0.3 0.0 0.7 1.1Z40_TP-4202 1.4 2.3 0.3 0.0 0.7 1.1Z40_TP-5005 0.2 0.0 0.0 2.0 0.1 0.2Z40_TP-5006 0.2 0.0 0.0 2.0 0.1 0.2Z40_TP-5011 2.3 0.3 0.4 0.0 1.1 1.8Z40_TP-5014 0.8 2.3 0.1 2.1 0.3 0.8Z40_TP-5016 2.3 0.3 0.4 0.0 1.1 1.8Z40_TP-5023 1.6 2.3 0.0 2.1 0.6 1.6Z40_TP-5024 1.0 2.3 0.1 1.0 0.4 1.0Z40_TP-5025 3.0 2.3 0.4 0.0 1.4 2.6Z40_TP-5027 3.6 2.3 0.5 0.0 1.7 3.1Z40_TP-5029 5.1 2.3 0.8 0.0 2.4 4.3Z40_TP-5036 3.5 2.3 0.1 0.0 1.4 3.3Z40_TP-5037 3.5 2.3 0.1 0.0 1.4 3.3Z40_TP-5040 2.8 6:00 0.7 27:00:00 1.4 2.1Z40_TP-5079 0.8 54:00:00 0.1 50:00:00 0.3 0.8Z40_TP-5080 1.1 54:00:00 0 50:00:00 0.4 1.1Z40_TP-5082 1.3 54:00:00 0.1 50:00:00 0.5 1.3Z40_TP-5088 0 6:00 0 0 0 0Z40_TP-5120 1.7 6:00 0.3 1:00 0.8 1.4Z40_TP-5121 2.3 6:00 0.4 1:00 1.1 1.8Z40_TP-5123 0 6:00 0 1:00 0 0Z40_TP-5200 1.4 54:00:00 0.3 1:00 0.7 1.1Z40_TP-6027 1 1:00 0 56:00:00 0.4 1Z40_TP-6030 1.2 1:00 0 54:00:00 0.8 1.2Z40_TP-6034 1.2 1:00 0 54:00:00 0.8 1.2Z40_TP-6036 0 6:00 0 27:00:00 0 0Z40_TP-62 0 6:00 0 1:00 0 0Z40_TP-81 2.6 54:00:00 0.5 1:00 1.2 2.1Z40_TP-84 3.1 54:00:00 0.6 1:00 1.5 2.5Z40_TP-87 4.5 54:00:00 0.5 1:00 2.1 4.1Z40_TP-89 6.9 54:00:00 1.1 1:00 3.2 5.8

APPENDIX B Sacramento County Water Agency Zone 40
Zone 40 Water System Infrastructure Plan
MWH Page E October 19, 2006
APPENDIX E
Modeling Results Scenario 4 – Water Supply
Phase 4

APPENDIX B Sacramento County Water Agency Zone 40
Zone 40 Water System Infrastructure Plan
MWH Page E-1 October 19, 2006
Table E-1. Node Demand Ranges under Max Day Conditions – Water Supply Phase 4
ID Max.Value (gpm) Max.Time (hrs) Min.Value
(gpm) Min.Time (hrs) Average (gpm) Difference (gpm)
FLGP-06-2 2,257.60 6:00 575.7 1:00 1,124.60 1,681.90FLGP-06-1 2,257.60 6:00 575.7 1:00 1,124.60 1,681.90FLGP-06-3 2,257.00 6:00 575.5 1:00 1,124.30 1,681.50FLGP-06-4 2,257.00 6:00 575.5 1:00 1,124.30 1,681.50NVSN-04-2 1,485.60 6:00 378.8 1:00 740.1 1,106.80NVSN-04-1 1,484.80 6:00 378.6 1:00 739.7 1,106.20NVSN-04-3 1,484.80 6:00 378.6 1:00 739.7 1,106.20FLGP-04-2 1,282.20 6:00 327 1:00 638.7 955.2FLGP-01-2 1,282.20 6:00 327 1:00 638.7 955.2FLGP-01-1 1,282.20 6:00 327 1:00 638.7 955.2FLGP-04-1 1,281.40 6:00 326.8 1:00 638.3 954.6FLGP-05-1 1,251.20 6:00 319.1 1:00 623.3 932.1FLGP-02-3 1,170.00 6:00 298.4 1:00 582.8 871.7FLGP-02-1 1,170.00 6:00 298.4 1:00 582.8 871.7FLGP-02-2 1,170.00 6:00 298.4 1:00 582.8 871.7NTDA-08-2 1,075.40 6:00 274.2 1:00 535.7 801.2NTDA-08-1 1,075.00 6:00 274.1 1:00 535.5 800.9FLGP-03-1 1,041.00 6:00 265.5 1:00 518.6 775.5FLGP-03-2 1,041.00 6:00 265.5 1:00 518.6 775.5NVSN-03-2 1,014.80 6:00 258.8 1:00 505.5 756NVSN-03-1 1,014.80 6:00 258.8 1:00 505.5 756NTDA-09-01 882.8 6:00 225.1 1:00 439.8 657.7VSCP-05-1 820.8 6:00 209.3 1:00 408.9 611.5NTDA-10-1 653.6 6:00 166.7 1:00 325.6 486.9NTDA-10-7 653.6 6:00 166.7 1:00 325.6 486.9NTDA-10-5 653.6 6:00 166.7 1:00 325.6 486.9NTDA-10-3 653.6 6:00 166.7 1:00 325.6 486.9NVSN-02-3 600.8 6:00 153.2 1:00 299.3 447.6NVSN-02-2 600.8 6:00 153.2 1:00 299.3 447.6NVSN-02-1 600.8 6:00 153.2 1:00 299.3 447.6NVSN-01-4 390 6:00 99.4 1:00 194.3 290.6NVSN-01-3 390 6:00 99.4 1:00 194.3 290.6NVSN-01-2 390 6:00 99.4 1:00 194.3 290.6NVSN-01-1 390 6:00 99.4 1:00 194.3 290.6

APPENDIX B Sacramento County Water Agency Zone 40
Zone 40 Water System Infrastructure Plan
MWH Page E-2 October 19, 2006
Table E-2. Node Pressure Ranges under Max Day Conditions – Water Supply Phase 4
ID Max.Value (psi) Max.Time (hrs) Min.Value (psi) Min.Time (hrs) Average (psi) Difference (psi)
FLGP-06-2 71.3 3:00 58.5 30:00:00 67.4 12.8FLGP-06-1 73.7 3:00 61.2 30:00:00 69.9 12.5FLGP-06-3 77.7 3:00 63.6 30:00:00 73.5 14.1FLGP-06-4 75.4 3:00 62.9 30:00:00 71.5 12.5NVSN-04-2 78.6 27:00:00 63.5 54:00:00 67.1 15.1NVSN-04-1 82.9 27:00:00 67.8 54:00:00 71.5 15.1NVSN-04-3 78.7 27:00:00 64.2 54:00:00 67.5 14.5FLGP-04-2 77.6 3:00 61.3 30:00:00 72.9 16.3FLGP-01-2 77.6 3:00 61.1 30:00:00 72.9 16.5FLGP-01-1 75.8 3:00 52.7 30:00:00 69.5 23.1FLGP-04-1 75.7 3:00 62.2 30:00:00 71.6 13.5FLGP-05-1 77.1 3:00 64.3 30:00:00 73.2 12.8FLGP-02-3 73.5 3:00 58.2 30:00:00 69 15.3FLGP-02-1 74.7 3:00 48.1 30:00:00 67.5 26.5FLGP-02-2 63.8 3:00 37.3 30:00:00 56.7 26.5NTDA-08-2 82.9 27:00:00 67.5 54:00:00 71.5 15.4NTDA-08-1 82.9 27:00:00 67.9 54:00:00 71.6 15.1FLGP-03-1 77.7 3:00 63.6 30:00:00 73.5 14.1FLGP-03-2 77.6 3:00 61.3 30:00:00 72.9 16.4NVSN-03-2 71.5 3:00 59 30:00:00 67.7 12.5NVSN-03-1 73.7 3:00 61.6 30:00:00 70 12.1NTDA-09-01 75.1 27:00:00 59.9 54:00:00 63.8 15.2VSCP-05-1 68.3 27:00:00 53.5 41:00:00 56.8 14.8NTDA-10-1 71.6 27:00:00 56 54:00:00 60.2 15.6NTDA-10-7 78.6 27:00:00 63.2 54:00:00 67.2 15.3NTDA-10-5 76.5 27:00:00 62 54:00:00 65.4 14.5NTDA-10-3 77.8 27:00:00 63.1 54:00:00 66.4 14.7NVSN-02-3 75.9 3:00 63.5 30:00:00 72.1 12.5NVSN-02-2 75.6 3:00 60.5 30:00:00 71.2 15.2NVSN-02-1 75.6 3:00 60.1 30:00:00 71.1 15.5NVSN-01-4 73.5 3:00 58.3 30:00:00 69.1 15.1NVSN-01-3 71.5 3:00 58.8 30:00:00 67.7 12.8NVSN-01-2 73.7 3:00 60.9 30:00:00 69.9 12.8NVSN-01-1 76 3:00 65 30:00:00 72.6 11
APPENDIX B Sacramento County Water Agency Zone 40
Zone 40 Water System Infrastructure Plan
MWH Page E-3 October 19, 2006
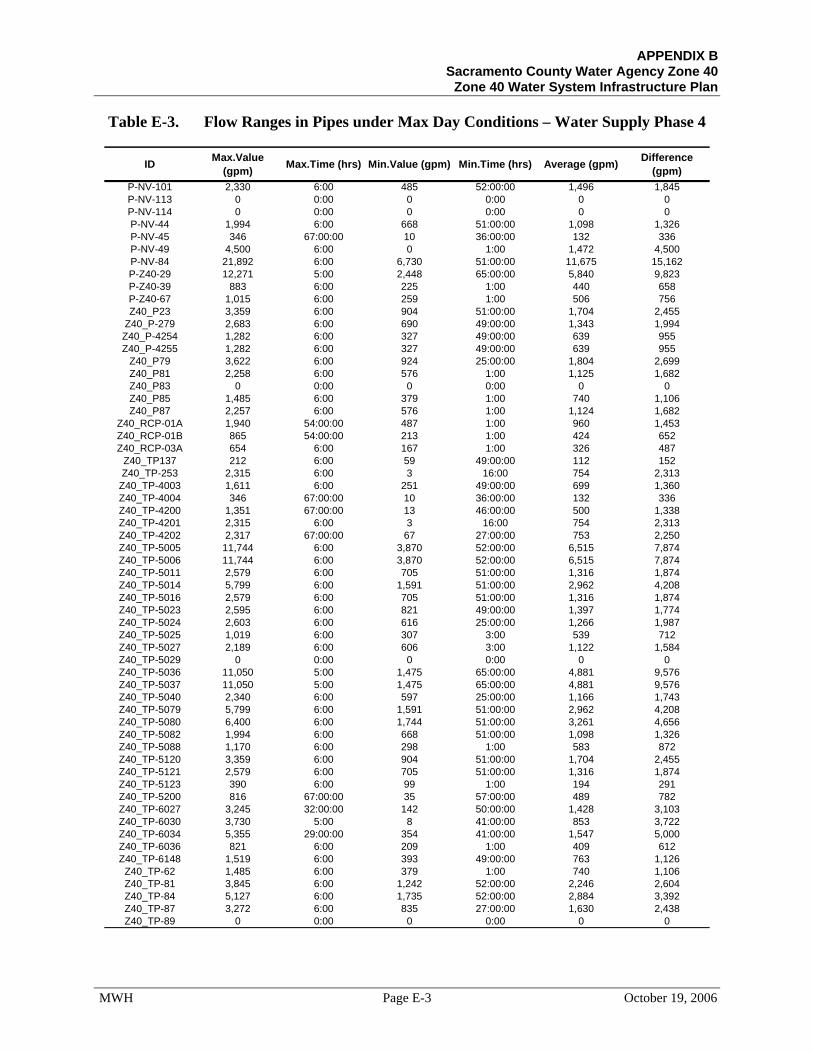
Table E-3. Flow Ranges in Pipes under Max Day Conditions – Water Supply Phase 4
ID Max.Value (gpm) Max.Time (hrs) Min.Value (gpm) Min.Time (hrs) Average (gpm) Difference
(gpm)P-NV-101 2,330 6:00 485 52:00:00 1,496 1,845P-NV-113 0 0:00 0 0:00 0 0P-NV-114 0 0:00 0 0:00 0 0P-NV-44 1,994 6:00 668 51:00:00 1,098 1,326P-NV-45 346 67:00:00 10 36:00:00 132 336P-NV-49 4,500 6:00 0 1:00 1,472 4,500P-NV-84 21,892 6:00 6,730 51:00:00 11,675 15,162P-Z40-29 12,271 5:00 2,448 65:00:00 5,840 9,823P-Z40-39 883 6:00 225 1:00 440 658P-Z40-67 1,015 6:00 259 1:00 506 756Z40_P23 3,359 6:00 904 51:00:00 1,704 2,455
Z40_P-279 2,683 6:00 690 49:00:00 1,343 1,994Z40_P-4254 1,282 6:00 327 49:00:00 639 955Z40_P-4255 1,282 6:00 327 49:00:00 639 955
Z40_P79 3,622 6:00 924 25:00:00 1,804 2,699Z40_P81 2,258 6:00 576 1:00 1,125 1,682Z40_P83 0 0:00 0 0:00 0 0Z40_P85 1,485 6:00 379 1:00 740 1,106Z40_P87 2,257 6:00 576 1:00 1,124 1,682
Z40_RCP-01A 1,940 54:00:00 487 1:00 960 1,453Z40_RCP-01B 865 54:00:00 213 1:00 424 652Z40_RCP-03A 654 6:00 167 1:00 326 487
Z40_TP137 212 6:00 59 49:00:00 112 152Z40_TP-253 2,315 6:00 3 16:00 754 2,313
Z40_TP-4003 1,611 6:00 251 49:00:00 699 1,360Z40_TP-4004 346 67:00:00 10 36:00:00 132 336Z40_TP-4200 1,351 67:00:00 13 46:00:00 500 1,338Z40_TP-4201 2,315 6:00 3 16:00 754 2,313Z40_TP-4202 2,317 67:00:00 67 27:00:00 753 2,250Z40_TP-5005 11,744 6:00 3,870 52:00:00 6,515 7,874Z40_TP-5006 11,744 6:00 3,870 52:00:00 6,515 7,874Z40_TP-5011 2,579 6:00 705 51:00:00 1,316 1,874Z40_TP-5014 5,799 6:00 1,591 51:00:00 2,962 4,208Z40_TP-5016 2,579 6:00 705 51:00:00 1,316 1,874Z40_TP-5023 2,595 6:00 821 49:00:00 1,397 1,774Z40_TP-5024 2,603 6:00 616 25:00:00 1,266 1,987Z40_TP-5025 1,019 6:00 307 3:00 539 712Z40_TP-5027 2,189 6:00 606 3:00 1,122 1,584Z40_TP-5029 0 0:00 0 0:00 0 0Z40_TP-5036 11,050 5:00 1,475 65:00:00 4,881 9,576Z40_TP-5037 11,050 5:00 1,475 65:00:00 4,881 9,576Z40_TP-5040 2,340 6:00 597 25:00:00 1,166 1,743Z40_TP-5079 5,799 6:00 1,591 51:00:00 2,962 4,208Z40_TP-5080 6,400 6:00 1,744 51:00:00 3,261 4,656Z40_TP-5082 1,994 6:00 668 51:00:00 1,098 1,326Z40_TP-5088 1,170 6:00 298 1:00 583 872Z40_TP-5120 3,359 6:00 904 51:00:00 1,704 2,455Z40_TP-5121 2,579 6:00 705 51:00:00 1,316 1,874Z40_TP-5123 390 6:00 99 1:00 194 291Z40_TP-5200 816 67:00:00 35 57:00:00 489 782Z40_TP-6027 3,245 32:00:00 142 50:00:00 1,428 3,103Z40_TP-6030 3,730 5:00 8 41:00:00 853 3,722Z40_TP-6034 5,355 29:00:00 354 41:00:00 1,547 5,000Z40_TP-6036 821 6:00 209 1:00 409 612Z40_TP-6148 1,519 6:00 393 49:00:00 763 1,126
Z40_TP-62 1,485 6:00 379 1:00 740 1,106Z40_TP-81 3,845 6:00 1,242 52:00:00 2,246 2,604Z40_TP-84 5,127 6:00 1,735 52:00:00 2,884 3,392Z40_TP-87 3,272 6:00 835 27:00:00 1,630 2,438Z40_TP-89 0 0:00 0 0:00 0 0

APPENDIX B Sacramento County Water Agency Zone 40
Zone 40 Water System Infrastructure Plan
MWH Page E-4 October 19, 2006
Table E-4 Velocity Ranges in Pipes under Max Day Conditions – Water Supply Phase 4
ID Max.Value (ft/s) Max.Time (hrs) Min.Value (ft/s) Min.Time (hrs) Average (ft/s) Difference (ft/s)
P-NV-101 1.7 6:00 0.3 52:00:00 1.1 1.3P-NV-113 0.0 36:00:00 0.0 63:00:00 0.0 0.0P-NV-114 0.0 44:00:00 0.0 62:00:00 0.0 0.0P-NV-44 3.2 6:00 1.1 51:00:00 1.8 2.1P-NV-45 0.6 67:00:00 0.0 36:00:00 0.2 0.5P-NV-49 3.2 6:00 0.0 1:00 1.0 3.2P-NV-84 3.9 6:00 1.2 51:00:00 2.1 2.7P-Z40-29 1.4 5:00 0.3 65:00:00 0.7 1.1P-Z40-39 0.0 6:00 0.0 1:00 0.0 0.0P-Z40-67 0.0 6:00 0.0 1:00 0.0 0.0Z40_P23 4.2 6:00 1.1 51:00:00 2.1 3.1
Z40_P-279 1.9 6:00 0.5 49:00:00 1.0 1.4Z40_P-4254 0.9 6:00 0.2 49:00:00 0.5 0.7Z40_P-4255 0.9 6:00 0.2 49:00:00 0.5 0.7
Z40_P79 5.8 6:00 1.5 25:00:00 2.9 4.3Z40_P81 0.1 6:00 0.0 1:00 0.0 0.1Z40_P83 0.0 6:00 0.0 38:00:00 0.0 0.0Z40_P85 0.1 6:00 0.0 1:00 0.0 0.0Z40_P87 0.1 6:00 0.0 1:00 0.0 0.1
Z40_RCP-01A 1.4 54:00:00 0.3 1:00 0.7 1.0Z40_RCP-01B 1.4 54:00:00 0.3 1:00 0.7 1.0Z40_RCP-03A 1.0 6:00 0.3 1:00 0.5 0.8
Z40_TP137 0.3 6:00 0.1 49:00:00 0.2 0.2Z40_TP-253 3.7 6:00 0.0 16:00 1.2 3.7Z40_TP-4003 2.6 6:00 0.4 49:00:00 1.1 2.2Z40_TP-4004 0.6 67:00:00 0.0 36:00:00 0.2 0.5Z40_TP-4200 2.2 67:00:00 0.0 46:00:00 0.8 2.1Z40_TP-4201 3.7 6:00 0.0 16:00 1.2 3.7Z40_TP-4202 3.7 67:00:00 0.1 27:00:00 1.2 3.6Z40_TP-5005 3.7 6:00 1.2 52:00:00 2.1 2.5Z40_TP-5006 3.7 6:00 1.2 52:00:00 2.1 2.5Z40_TP-5011 3.3 6:00 0.9 51:00:00 1.7 2.4Z40_TP-5014 4.1 6:00 1.1 51:00:00 2.1 3.0Z40_TP-5016 3.3 6:00 0.9 51:00:00 1.7 2.4Z40_TP-5023 1.8 6:00 0.6 49:00:00 1 1.3Z40_TP-5024 1.8 6:00 0.4 25:00:00 0.9 1.4Z40_TP-5025 0.7 6:00 0.2 3:00 0.4 0.5Z40_TP-5027 1.6 6:00 0.4 3:00 0.8 1.1Z40_TP-5029 0 53:00:00 0 22:00 0 0Z40_TP-5036 2 5:00 0.3 65:00:00 0.9 1.7Z40_TP-5037 2 5:00 0.3 65:00:00 0.9 1.7Z40_TP-5040 3.7 6:00 1 25:00:00 1.9 2.8Z40_TP-5079 4.1 6:00 1.1 51:00:00 2.1 3Z40_TP-5080 4.5 6:00 1.2 51:00:00 2.3 3.3Z40_TP-5082 1.4 6:00 0.5 51:00:00 0.8 0.9Z40_TP-5088 0 6:00 0 1:00 0 0Z40_TP-5120 4.2 6:00 1.1 51:00:00 2.1 3.1Z40_TP-5121 3.3 6:00 0.9 51:00:00 1.7 2.4Z40_TP-5123 0 6:00 0 1:00 0 0Z40_TP-5200 1.3 67:00:00 0.1 57:00:00 0.8 1.2Z40_TP-6027 2.3 32:00:00 0.1 50:00:00 1 2.2Z40_TP-6030 2.6 5:00 0 41:00:00 0.6 2.6Z40_TP-6034 3.8 29:00:00 0.3 41:00:00 1.1 3.5Z40_TP-6036 0 6:00 0 1:00 0 0Z40_TP-6148 1.1 6:00 0.3 49:00:00 0.5 0.8
Z40_TP-62 0.1 6:00 0 1:00 0 0Z40_TP-81 2.7 6:00 0.9 52:00:00 1.6 1.8Z40_TP-84 3.6 6:00 1.2 52:00:00 2 2.4Z40_TP-87 2.3 6:00 0.6 27:00:00 1.2 1.7Z40_TP-89 0 36:00:00 0 31:00:00 0 0

APPENDIX B Sacramento County Water Agency Zone 40
Zone 40 Water System Infrastructure Plan
MWH Page F October 19, 2006
APPENDIX F
Modeling Results Scenario 5 – Fire Flows

APPENDIX B Sacramento County Water Agency Zone 40
Zone 40 Water System Infrastructure Plan
MWH Page F-1 October 19, 2006
Table F-1. Fire Flow Analysis Results – Phase 1 and Phase 2
PHASE 1 - FIRE FLOW
IDStatic
Demand (gpm)
Static Pressure
(psi)
Static Head (ft)
Fire-Flow Demand
(gpm)
Residual Pressure
(psi)
Residual Head (ft)
Available Flow @Hydrant (gpm)
FLGP-01-2 189 77 224 2,000 76 220 16,779FLGP-02-3 189 73 224 2,000 72 220 17,271FLGP-03-2 189 77 224 3,000 74 215 16,915FLGP-04-1 189 75 224 2,000 73 218 14,899FLGP-04-2 189 77 224 2,000 75 217 13,136FLGP-05-1 189 77 224 2,000 70 208 7,410FLGP-06-3 189 77 224 3,000 73 213 14,544NTDA-10-3 0 67 226 2,000 65 223 15,278NVSN-01-1 82 75 224 3,000 71 215 15,980NVSN-01-2 82 73 224 3,000 69 214 14,771NVSN-01-4 82 73 224 2,000 72 220 17,580NVSN-02-1 82 75 224 2,000 74 220 16,525NVSN-02-2 82 75 224 2,000 74 220 17,132NVSN-02-3 82 75 224 2,000 73 219 16,131NVSN-03-1 82 73 224 2,000 71 219 15,450NVSN-04-2 82 67 226 2,000 66 222 14,356
Z40_TD-5915 0 72 225 3,000 68 218 13,954
PHASE 2 - FIRE FLOW
IDStatic
Demand (gpm)
Static Pressure
(psi)
Static Head (ft)
Fire-Flow Demand
(gpm)
Residual Pressure
(psi)
Residual Head (ft)
Available Flow @Hydrant (gpm)
FLGP-01-1 454 72 214 2,000 68 204 11,847FLGP-01-2 454 73 214 2,000 71 210 19,901FLGP-02-1 375 71 214 2,000 66 201 9,431FLGP-02-3 375 69 215 2,000 68 211 27,933FLGP-03-2 415 73 214 3,000 71 208 21,469FLGP-04-1 339 71 214 2,000 70 210 24,318FLGP-04-2 339 73 214 2,000 71 208 15,825FLGP-05-1 403 73 215 2,000 71 211 14,693FLGP-06-1 1,151 69 215 3,000 67 210 29,538FLGP-06-2 0 67 215 3,000 65 209 18,274FLGP-06-3 1,151 73 214 3,000 71 208 24,159FLGP-06-4 0 72 216 3,000 69 210 13,923NTDA-10-3 0 62 215 2,000 61 212 24,758NTDA-10-5 0 61 215 2,000 60 212 29,304NVSN-01-1 103 71 214 3,000 69 210 28,640NVSN-01-2 103 69 214 3,000 67 209 22,142NVSN-01-4 103 69 215 2,000 68 211 28,783NVSN-02-1 159 71 214 2,000 70 211 24,663NVSN-02-2 159 71 214 2,000 70 211 27,709NVSN-02-3 159 71 214 2,000 70 211 27,050NVSN-03-1 268 69 214 2,000 68 211 28,416VSCP-03-2 409 61 216 2,000 60 213 31,916
Z40_TD-5915 0 67 215 3,000 66 212 33,044

APPENDIX B Sacramento County Water Agency Zone 40
Zone 40 Water System Infrastructure Plan
MWH Page F-2 October 19, 2006
Table F-2. Fire Flow Analysis Results – Phase 3 and Phase 4
PHASE 3 - FIRE FLOW
IDStatic
Demand (gpm)
Static Pressure
(psi)
Static Head (ft)
Fire-Flow Demand
(gpm)
Residual Pressure
(psi)
Residual Head (ft)
Available Flow @Hydrant (gpm)
FLGP-01-1 454 74 218 2,000 67 203 8,194FLGP-01-2 454 76 220 2,000 74 216 18,019FLGP-02-1 375 72 217 2,000 61 191 5,807FLGP-02-3 375 72 221 2,000 71 219 24,426FLGP-03-2 415 76 220 3,000 74 215 19,567FLGP-04-1 339 74 220 2,000 72 217 20,875FLGP-04-2 339 76 220 2,000 74 215 14,707FLGP-05-1 403 75 220 2,000 72 213 11,561FLGP-06-1 1,151 72 221 3,000 71 219 26,443FLGP-06-2 0 70 221 3,000 67 215 15,934FLGP-06-3 1,151 76 220 3,000 73 214 20,680FLGP-06-4 0 74 220 3,000 68 208 10,843NTDA-10-3 0 65 223 2,000 65 222 22,378NTDA-10-5 0 65 225 2,000 65 225 28,374NVSN-01-1 103 74 221 3,000 73 218 24,769NVSN-01-2 103 72 221 3,000 70 217 19,410NVSN-01-4 103 72 221 2,000 71 220 25,395NVSN-02-1 159 74 220 2,000 73 218 21,369NVSN-02-2 159 74 220 2,000 73 218 23,680NVSN-02-3 159 74 221 2,000 73 218 23,550NVSN-03-1 268 72 221 2,000 71 219 24,477NVSN-04-2 257 66 223 2,000 66 222 24,867VSCP-03-2 409 64 222 2,000 63 221 28,237
Z40_TD-5915 0 71 223 3,000 70 222 30,268
PHASE 4 - FIRE FLOW
IDStatic
Demand (gpm)
Static Pressure
(psi)
Static Head (ft)
Fire-Flow Demand
(gpm)
Residual Pressure
(psi)
Residual Head (ft)
Available Flow @Hydrant (gpm)
FLGP-01-1 551 72 213 2,000 63 193 7,238FLGP-01-2 551 74 216 2,000 70 207 13,950FLGP-02-1 503 70 211 2,000 56 179 5,333FLGP-02-3 503 70 217 2,000 68 211 21,621FLGP-03-2 448 74 216 3,000 69 204 17,598FLGP-04-1 551 73 217 2,000 71 214 26,009FLGP-04-2 551 74 216 2,000 71 209 14,926FLGP-05-1 538 74 216 2,000 72 213 14,746FLGP-06-1 971 71 218 3,000 68 211 25,247FLGP-06-2 971 68 218 3,000 65 210 20,472FLGP-06-3 971 74 217 3,000 72 210 25,021FLGP-06-4 971 72 216 3,000 69 209 14,476NTDA-08-1 462 70 222 3,000 68 217 24,683NTDA-08-2 462 70 222 3,000 66 213 14,808NTDA-10-3 281 65 222 2,000 64 220 36,504NTDA-10-5 281 64 223 2,000 63 221 38,644NVSN-01-1 168 73 220 3,000 71 214 33,615NVSN-01-2 168 71 219 3,000 67 210 22,413NVSN-01-4 168 70 217 2,000 68 211 20,997NVSN-02-1 258 72 217 2,000 70 211 21,601NVSN-02-2 258 72 217 2,000 70 212 24,276NVSN-02-3 258 73 219 2,000 71 214 28,363NVSN-03-1 436 71 219 2,000 69 215 31,158NVSN-04-2 639 66 222 2,000 65 220 36,259VSCP-03-2 509 64 223 2,000 63 221 40,690
Z40_TD-5915 0 70 223 3,000 69 220 41,849