master of science (msc) in energy...
TRANSCRIPT
UNIVERSITY OF NAIROBI
Department of Mechanical & Manufacturing Engineering
MASTER OF SCIENCE (MSc) IN ENERGY MANAGEMENT
ENERGY STATUS IN SOUTH SUDAN
Presented By:
Deng’ Jacob Manyuon
F56/77263/2009
A project submitted in partial fulfillment of the degree of Master of Science in
Energy Management of the University of Nairobi.

ii
DECLARATION
This MSc. research project is my original work and has not been presented for a degree
award in this or any other university
Signature ………………………… Date………………………….
Deng’ Jacob Manyuon
Reg. No.F56/77263/2009
This project has been submitted to examination with our approval as supervisors
Dr. Nicodemus Abungu Odero
Signature ……………………………Date:……………………………
Dr. Cyrus Wekesa
Signature ……………………………Date:……………………………

iii
DEDICATION
This mighty research work is dedicated to Almighty God and to all my family members, most
significantly, to my dear wife, Dr Lilian Mechack who stood and encouraged me during this task. God
bless you dearly.

iv
ACKNOWLEDGMENT
God bless those who endeavor to achieve the best of their ability. I give great thanks to God for making
me go through this tedious exercise in good health. This work would have not been completed was it
not because He lives in us.
Secondly, I must in a strong term recognize the support and patience portrayed by my dear family
members, Dr Lilian Mechack and My dear Son Aguer Jacob. My family practiced much endurance
during difficult times of balancing work and studies amid economic crisis in our country.
Thirdly, I appreciate my parents, Mr & Mrs Deng Mayen Athian, Achan Bul Ajak & Adhieu Akuien
Akoi respectively for their great moral support during this research work.
I also acknowledge the encouragement from my siblings & cousins, Mayen, Athian Amuorpapat and
Yar John Manyuon
Special thanks also goes to Mr Samuel Gachuhi, the lab technologists in the department of Mechanical
& Manufacturing Engineering for keeping me updated on academic progress in the department during
the research work.
My deepest gratitude goes to my supervisors Dr. Nicodemus Abungu Odero & Dr Cyrus Wekesa for
their wise guidance during this research work. Finally, it goes without saying that all Staff members of
Mechanical & Manufacturing Engineering Department, University of Nairobi are worth appreciated
greatly for their tireless efforts in bringing the best out of students under their patronage.
v
ABSTRACT
South Sudan has a problem for lack of equitable and reliable energy source for power supply. The
major source of electricity in South Sudan is thermal using diesel-fired generators. 83% of South
Sudan is rural and uses, Kerosene, charcoal and fire wood. Another source of energy that is widely use
in South Sudan cities are battery and solar arrays units for lighting and entertainment yet the country
has enough water resources to generate long term electricity. Utilization of sustainable low-carbon
energy scenarios for the new century emphasize the need to tap the yet to be utilized potential of
hydro-energy resources in South Sudan. In 2012, the government initiated construction of Fula rapids
hydro dam of 42MW in response to energy crisis in the country but the capacity is not enough to match
the demand of 44MW in Juba.
The installed capacity in Juba is 17MW among which some of the units currently require major
overhaul. In this research project, energy status in South Sudan has been determined to help the
government in selecting priorities in development of energy sector as well as a datum for a venture in
renewable energy fields. The objective of this study is to determine the energy status of South Sudan,
determine potential from hydro, compare hydro power energy with other sources of energy and
propose ways forward for the country. South Sudan is an agricultural region with fertile land, plenty of
water resources, livestock, forestry resources, and agricultural resources. Application of new and
renewable sources of energy available shall be the viable weapon to accelerate exploitation of these
resources.

vi
Energy status in South Sudan was determined by quantifying the amount of energy sources that are in
use and those to be utilized later in the country. The data of energy mix was obtained through site
survey and by dividing juba city into three sections based on payams. This data covered a period of
two weeks from 1st October to 15
th October 2013 with sampling time of eight hours a day. The data
was transferred manually from hard copies to excel sheet and was plotted on pie charts in terms of
percentages as shown on figure 4.1, 4.2, 4.3 and 4.4 respectively. The results showed that thermal
energy dominates the consumption in Juba up to 36% of energy sources followed by solar 27% on
figure 4.4 while other major sources like hydro, wind, geothermal and nuclear are zero. In addition to
energy mix analysis, potential was determined from Hydro and this was done by measuring the river
monthly discharge from four hydro potential sites by using current meter. This meter clearly records
the velocity of the water and measures the area by using depth and width of a cross-section of a river.
This data was retrieved from meter data storage unit (DSU) to excel software using export wizard
where the calculations of discharge were done and the results were tabulated on table 4.10. These
results were plotted as rating curves against the water elevation. Elevation above sea level (FSL) data
was sourced from Dam Implementing Unit (DIU) of Sudan. This data was measured by using digital
elevation model (Topographical mapping) through aerial photography and transferred from ArcGIS
map to excel as presented on table 4.11 for calculation of hydro potential in these rivers. The results
found showed that, South Sudan has a large hydro potential to be exploited. Lastly, comparison
between hydro electric power and other sources of energy was summarized and the ways forwards
were suggested.
vii
TABLE OF CONTENTS
Page
DECLARATION ................................................................................................................................. ii
DEDICATION .................................................................................................................................... iii ACKNOWLEDGMENT ..................................................................................................................... iv
ABSTRACT ........................................................................................................................................ v TABLE OF CONTENTS ................................................................................................................... vii
LIST OF ABBREVIATIONS.............................................................................................................. ix LISTS OF FIGURES AND TABLES.................................................................................................. xi
1 INTRODUCTION ........................................................................................................................ 1 1.1 Background .......................................................................................................................... 1
1.2 Hydro Electrical Energy in South Sudan ............................................................................... 2 1.2.1 Energy and South Sudan economy .................................................................................... 3
1.2.2 Energy and Population in South Sudan.............................................................................. 4 1.3 Thermal Energy in South Sudan............................................................................................ 5
1.4 Solar Energy in South Sudan ................................................................................................ 7 1.5 Wind energy ......................................................................................................................... 7
1.6 Biomass energy .................................................................................................................... 8 1.7 Geothermal energy................................................................................................................ 8
1.8 Problem Statement ................................................................................................................ 8 1.9 Main objective ...................................................................................................................... 9
1.9.1 Specific objective.............................................................................................................. 9 1.10 Organization of the project.................................................................................................. 10
2 LITERATURE REVIEW ........................................................................................................... 11 2.1 Energy mix studies ............................................................................................................. 11
2.2 Hydropower Potential ......................................................................................................... 12 2.3 Additional methods of evaluating hydro potentials .............................................................. 18
2.3.1 The area potential ........................................................................................................... 18 2.3.2 Utilizable potential .......................................................................................................... 19
2.4 Current status in South Sudan ............................................................................................. 19 2.5 Summary of Literature Review ........................................................................................... 21
3 METHODOLOGY ..................................................................................................................... 22 3.1 Determination of Energy mix for South Sudan .................................................................... 22
3.2 Data .................................................................................................................................... 23 4 RESULTS AND DISCUSSIONS ............................................................................................... 25
4.1 Energy Consumption mix in South Sudan ........................................................................... 25 4.2 Energy mix in Juba ............................................................................................................. 25
4.3 Determination of potential from Hydro ............................................................................... 31 4.3.1 Discharge ........................................................................................................................ 32
4.3.2 Water Elevation (FSL) .................................................................................................... 35 4.4 Hydro potential calculations................................................................................................ 39
4.5 Comparison of hydro power and other sources of energy .................................................... 41 4.5.1 Catchments areas ............................................................................................................ 44

viii
5 CONCLUSION AND RECOMMENDATIONS ......................................................................... 45 5.1 Conclusion.......................................................................................................................... 45
5.2 Recommendations .............................................................................................................. 46 REFERENCES .................................................................................................................................. 48
Appendix 1..................................................................................................................................... 52 Appendix 2..................................................................................................................................... 53
Appendix 3..................................................................................................................................... 54 Appendix 4..................................................................................................................................... 54
Appendix 5..................................................................................................................................... 55

ix
LIST OF ABBREVIATIONS
NBA Nile Basin Areas
RPS Reliable Power Supply
EDSS Economic Development of South Sudan
BNP Buma National Park
TEC Twic East County
CPA Comprehensive Peace Agreement
SSEC South Sudan Electricity Corporation
MED Ministry of Electricity and Dams
MEDWRI Ministry of Electricity and Dams, Water Resources and Irrigation
EES Eastern Equatoria States
FPHCS Fifth Population and Housing Census of Sudan
SSCSE South Sudan Centre for Statistic and Evaluation
SSIR South Sudan Independence Referendum
JEPP Juba Emergency Power Project
CJPS Cummins Juba Power Station
WJPS Watsila Juba Power Station
IDP Internally Displaced Persons
RR Returning Refugees
HEP Hydro Electric Power
DHM Distributed Hydrological Model
FDC Flow Duration Curve

x
GIS Geographical Information System
RS Remote Sensing
SHN Synthetic Hydro Network
GH Gross Head
NH Net Head
DEM Digital Elevation Model
PRPP Power Resource Power Potential
∆hi Representative difference in Head
ADF Average Daily Flow
RAM Random Access Memory
NVE Norwegian Water Resources and Energy Directorate
MWRI Ministry of Water Resources and Irrigation
DIU Dam Implementing Unit
DSU Data Storage Unit

xi
LISTS OF FIGURES AND TABLES
FIGURES
Page
Figure 1.1 South Sudan Water Resources along the Nile………………………………………….2
Figure 2.1 Example for measurements of power (kW) in terms of flow rate and water head…….16
Figure 2.2 Basic method of determining Line Potential ………………………………………….18
Figure 2.3 Basic method of determining Utilizable Potential……………………………………...19
Figure 3.1 Sketch of Juba Town, sectioned into three payams…………………………………….22
Figure 4.1 Graphical presentations of energy sources in Munuki payam, Juba city……………....27
Figure 4.2 Graphical presentations of energy sources in Juba payam, Juba city……………..........28
Figure 4.3 Graphical presentations of energy sources in Kator payam, Juba city……………........29
Figure 4.4 Percentage (%) use of energy in Juba City……………………………………………..30
Figure 4.5 Area calculated by directly measuring width and depth of a river……………………..32
Figure 4.6 Fula Rating Curve Characteristics……………………………………………………...38
Figure 4.7 Laki Rating Curve Characteristics……………………………………………………...38
Figure 4.8 Bedden Rating Curve Characteristics……………………………………………..........39

xii
TABLES
Page
Table 2.1 Power Calculated using eq (1) for minimum, mean and maximum values of Discharge
and Head according to the Norwegian Threshold……………………………………...17
Table 2.2 Hydro sites in South Sudan………………………………………………………..........20
Table 4.1 Data for Assessed Energy sources in Juba from 1st October to 15th October 2013…...25
Table 4.2 Data for Munuki energy sources in percentages………………………………………..26
Table 4.3 Data for Juba energy sources in percentages…………………………………………...28
Table 4.4 Data for Kator energy sources in percentages………………………………………….29
Table 4.5 Percentage (%) use of energy in Juba City………………………………………..........30
Table 4.6 Calculated Discharge for Fula Hydro Site using current meter, Data taken for one month
from 1st Oct 2013 to 29th Oct 2013……………………………………………………33
Table 4.7 Calculated Discharge for Laki Hydro Site using current meter, Data taken for one month
from 1st Oct 2013 to 29th Oct 2013……………………………………………………33
Table 4.8. Calculated Discharge for Shukoli Hydro Site using current meter, Data taken for one
month from 1st Oct 2013 to 29th Oct 2013…………………………………………….34
Table 4.9 Calculated Discharge for Bedden Hydro Site using current meter, Data taken for one
month from 1st Oct 2013 to 29th Oct 2013…………………………………….............34
Table 4.10 Monthly River Discharge data for the month of December 2012, taken again in October
2013 by using current meter……………………………………………………............35
Table 4.11 Elevation data from July 2009 to September 2009…………………………….............36
Table 4.12 Discharge and head of three hydro potential sites for rating curves graphical
presentation……………………………………………………………………………..37

xiii
Table 4.13 Potential from hydro from four hydro potential sites…………………………………..40
Table 4.14 Comparison of Hydro power and other sources of energy……………………………..41
Table 4.15 Sub-catchment Areas of Torrents between Nimule and Mongalla……………………..44
1
1 INTRODUCTION
1.1 Background
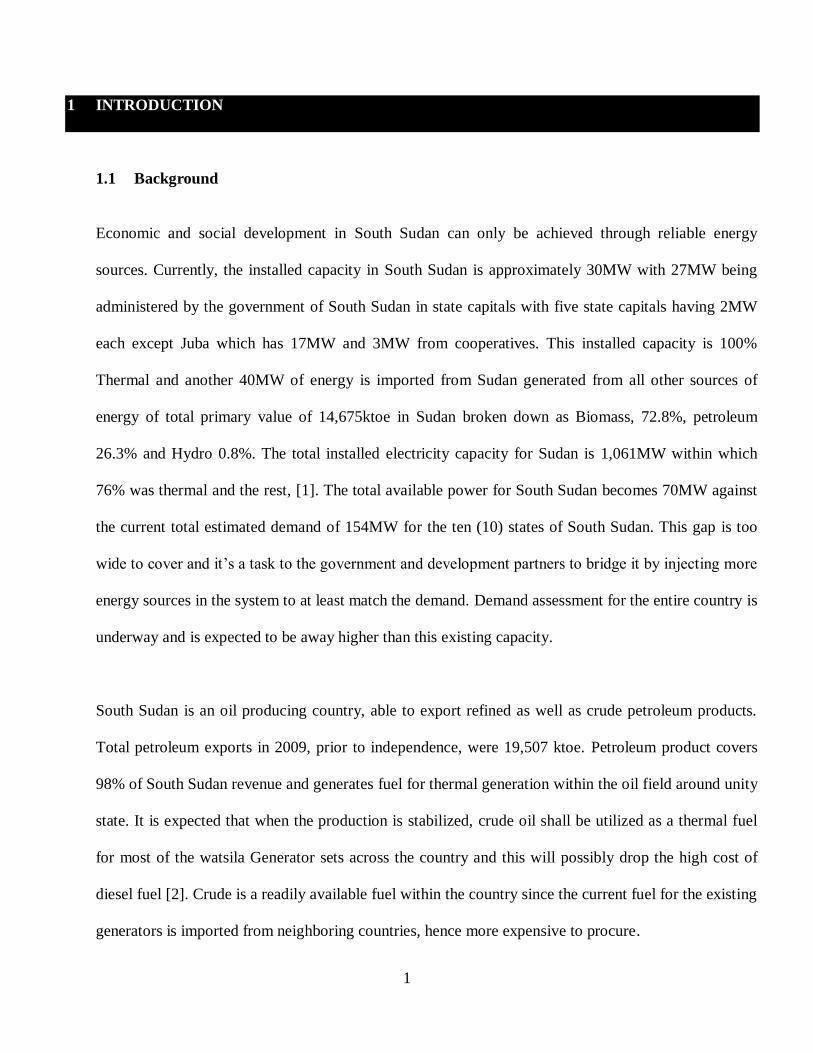
Economic and social development in South Sudan can only be achieved through reliable energy
sources. Currently, the installed capacity in South Sudan is approximately 30MW with 27MW being
administered by the government of South Sudan in state capitals with five state capitals having 2MW
each except Juba which has 17MW and 3MW from cooperatives. This installed capacity is 100%
Thermal and another 40MW of energy is imported from Sudan generated from all other sources of
energy of total primary value of 14,675ktoe in Sudan broken down as Biomass, 72.8%, petroleum
26.3% and Hydro 0.8%. The total installed electricity capacity for Sudan is 1,061MW within which
76% was thermal and the rest, [1]. The total available power for South Sudan becomes 70MW against
the current total estimated demand of 154MW for the ten (10) states of South Sudan. This gap is too
wide to cover and it’s a task to the government and development partners to bridge it by injecting more
energy sources in the system to at least match the demand. Demand assessment for the entire country is
underway and is expected to be away higher than this existing capacity.
South Sudan is an oil producing country, able to export refined as well as crude petroleum products.
Total petroleum exports in 2009, prior to independence, were 19,507 ktoe. Petroleum product covers
98% of South Sudan revenue and generates fuel for thermal generation within the oil field around unity
state. It is expected that when the production is stabilized, crude oil shall be utilized as a thermal fuel
for most of the watsila Generator sets across the country and this will possibly drop the high cost of
diesel fuel [2]. Crude is a readily available fuel within the country since the current fuel for the existing
generators is imported from neighboring countries, hence more expensive to procure.

2
1.2 Hydro Electrical Energy in South Sudan
97% of South Sudan water resources are concentrated within the Nile Basin Areas (NBA) with highest
renewable supply of fresh water in the region, as shown in figure 1.1. Hydro potentials are great but yet
to be exploited. An assessment done before the war in South Sudan was putting the potentials of hydro
over 1,500MW. Currently, the government is also trying to establish hydroelectric power stations in
areas such as Fula, Laki, Shukoli and Bedden as long term remedy to power shortages in South Sudan,
[4].
Figure 1.1: South Sudan Water Resources (MWRI, 2010)
The foreseen backbone of South Sudan’s economy is and shall always be its water potential from
which agricultural sector shall determine to a great extent the economic performance of its economy.
The expected high load in such a great sector needs a reliable power supply (RPS). Hydro electrical

3
energy is being considered by the government of South Sudan as one of the most reliable sources of
power supply. Currently, there is a negligible contribution of hydro into the consumption loop but with
the greatest potential.
1.2.1 Energy and South Sudan economy
South Sudan is and shall always be a market for the neighboring countries such as Uganda, Kenya,
Congo, Ethiopia, Eritrea, Rwanda, Tanzania, Burundi and Sudan because of its riches. The country will
need Technical and professional expertise. Economic Development of South Sudan will provide an
overview of the South Sudanese economy. The prominent sectors that could be given attention include
but not limited to agriculture, industry, transport, education, health, energy, power, and trade, [11]-
[14]. For this economic growth to take place, the country requires reliable source of Energy.
Investment in South Sudan is currently at its lowest levels. The investment performance of all three
investor groups namely, the private sector, government and parastatals were geared towards the outcome of
the referendum in South Sudan. There was a lot of uncertainty about the referendum, since the country has
just come out of war, many investors were thinking there might be chaos and so a peaceful environment
could be necessary for investments, [22]. No doubt to believe that there shall be a serious inrush for
investors to South Sudan, since such independent shall be taken as the guarantee for peace and stability in
spite of some little turbulence within and without the country. Government investment was kept in check by
the tight fiscal policy while parastatal investment was constrained by lack of streamlined system. There are
no government bilateral investments except individual foreign investments, [24]. Investment can always
grow when there is stable power supply in the country. This report will help the government to venture in
4
new and reliable energy sources and be able to change the thermal power supply which cannot be able to
attract major investments.
1.2.2 Energy and Population in South Sudan
The "Fifth Population and Housing Census of Sudan (FPHCS)" published in 2009, was conducted in
April 2008. However the census results of South Sudan were rejected by South Sudanese officials as
reportedly "the central bureau of statistics in Khartoum refused to share the national Sudan census raw
data with South Sudan centre for census, statistic and evaluation. The census showed the South Sudan
population to be 8.26 million; many southerners claimed that the South Sudanese population should be
one-third of Sudan, while the census showed it to be only 22%. Many South Sudanese were also said to
have not been counted "due to bad weather, poor communication and transportation networks, and
some areas were unreachable, while many South Sudanese remained in exile in neighboring countries.
South Sudan Centre for Statistic and Evaluation (SSCSE) projected the population to be over 10
million, a number that was missed by a small margin during the voter registration for April 2010
election. This can therefore make us approximate the real number of South Sudanese wherever they are
to be between 10 million to 15 million. In 2009 Northern Sudan started a new South Sudanese census
ahead of the South Sudanese independence referendum, 2011, which is said to also include the South
Sudanese in Diaspora. However this initiative was criticized as it was to leave out countries with a high
share of the South Sudanese in Diaspora, and rather count countries where the Diaspora share was low.
Over 8.26 million South Sudanese are in dire need of electrical energy for social and commercial
activities. 83% of South Sudanese lives in rural areas, this number of people are using charcoal or fire

5
woods for cooking. As mentioned before the current little installed capacity of 30MW is concentrated
in state capitals.
South Sudan is composed of more than 60 ethnic groups speaking languages found primarily within
South Sudan with other languages from neighboring Kenya, Ethiopia, Uganda, Congo, Northern Sudan
(Khartoum) and more. The official language is both English and National language is Juba Arabic,
along with various local languages in states or cities. These ethnic communities are sparsely situated
and shall be in need of power. This can only be achieved if power grids are constructed to reach all
corners of our country or make use of solar arrays in these areas until a reliable energy source is
established [9].
1.3 Thermal Energy in South Sudan
South Sudan has ten states whose capital cities are growing at a high rate. The estimated population growth
in the 10 state capitals is 2% and is expected to double in the next five years. Catering to this extraordinary
influx will require substantial investment in basic infrastructure including reliable energy sources – not only
to upgrade the current towns but to provide developed land equivalent to double the existing built up area.
It is estimated that only 10% of the population is urbanized. Even if the overall population doubles with the
return of internally displaced persons (IDP) and returning refugees (RR), and if a significant part settles in
the state capitals, the population should continue to be overwhelmingly rural within the foreseeable future.
Rural Development is a national priority, yet it needs an operational urban system to provide essential
supporting services in the cities especially the power [7].
6
Juba appeared to be more populated compared to other state cities of South Sudan. Juba being the
commercial and government centre, it is growing in unimaginable speed. Foreign and local investors are
doing their best to compete for the market. This population growth is an indication that the power demand
will automatically be high in the next 5 years. Hydroelectric power will be reliable for this much growth in
South Sudan. Electrical generation is currently done through Thermal energy source predominantly by
using the diesel generators and the capacity of this source of supply is limited and notoriously expensive to
operate and maintain. These generators are now down for major overhaul. This poses a big threat on the
country’s economy and on the entire progress in the power and investment sector.
A need to establish power supply will be the remedy for this region [15]. The expansion of electricity
provision is a crucial factor in the ongoing development of South Sudan. Approximately 15,000
consumers currently have access to an electricity network. The Government of South Sudan after the
signing of peace in 2005, a power project was initiated in juba with the intention of extending the same
to other states. Juba emergency power Project (JEPP) was initiated by the government in order to meet
the load in juba. 5MW diesel generators were installed by Electrowatts at the Juba power station.
Cummins station was the first to be established in juba as part of juba emergency power project
(JEPP) which was supervised by Gibb Africa.This capacity was stretched by the fast growing load in
Juba and therefore the government decided to add 12MW more which were installed by Watsilla from
Finland.
Depending on the increase of the load in Juba, the watsila station was installed next to Cummins to
meet the demand. But still, the reality is, power needs/demands in juba and other states are too high
and this demand cannot be met by using diesel generators which are very expensive to maintain.
Egyptians saw the gap in power supply as well and tried to invest in installing diesel generators in
7
some states of South Sudan, namely; Bor, Rumbek & Yambio. Generally, power demand is now
uncontrollable and there is a shortage of supply, [5]. The current estimated demand for Juba is 44MW
and is expected to rise with time.
1.4 Solar Energy in South Sudan
Many investors have been trying to invest as independent power producers (IPP) in hybrid system, a
combination of Biomas and Solar but the government has not been keen to give it attention since the
initial capital is too high and it is not economical for instance, 1MW of solar unit covers an acre of land
and as experienced in most cases, land in Africa is a primary resource and so this could be taken as
misuse of land. It is too early to introduce this technology in a large scale in South Sudan. However,
this technology is being utilized by international, National NGOs and individuals. Solar is good for
rural electrification and in future, the government may consider it as a source of electricity for rural
schools, health centers and administrative units. Solar potentials in the South are approximately 6.9
GJ/m2/year, or 436 W/m
2/year. The region receives on average, 8 hours of sunshine daily, making it
ideally placed to utilize solar energy resources. The potential has been recognized for use in street
lighting, through LEDs. Solar energy currently powers some radio stations in the country, and
approximately 45,000 households have some form of energy service derived from solar resources in
South Sudan [25]-[31].
1.5 Wind energy
A research in the old sudan showed wind power density in the Southern region to be ranging from 285
– 380 W/ m2. Wind power generation is seen as a key investment opportunity by the government of
8
South Sudan. This potential is not exploited. Wind has a disadvantage of being uneconomical and
unreliable especially when there is no wind. It could also be used for rural electrifications [34].
1.6 Biomass energy
78% of households in South Sudan depend on crop farming or animal husbandry as their primary
source of livelihood. Traditional biomass fuels provide for the vast majority of the South Sudanese
population’s energy needs. An estimated 71.1 million hectares of biomass resource exists in the
country, of which 29.3 million cubic metres are deemed to be the allowable cut. Agricultural residues,
as well as animal wastes, could also hold significant potential [36]. .
1.7 Geothermal energy
The country is currently seeking assistance from the Kenyan Geothermal Development Company
(GDC) to undertake a thorough assessment of its geothermal resource. Due to its geographical location,
geothermal resources are expected to be developed, and the GDC has expressed a keen interest in
lending South Sudan technical assistance and co-operation in the development of this resource. This is
not yet started but the government of South Sudan feels that there is a great potential [35]-[37].
1.8 Problem Statement
Lack of new and renewable energy sources for power supply in South Sudan are major problems. The
country is 100% dependent on thermal generation which suffers from limited unit capacity. The
estimated demand in capital cities of ten states is 154MW. This demand is a way high and can’t be met
if there is no reliable energy source. In Juba for example, the installed capacity is 17MW and the
9
demand is estimated to be 44MW, Demand in Bor 15MW and installed capacity is 2MW and the same
case applies to other capital cities. The gap between the demand and installed capacity is quite high and
requires efforts to be doubled by exploiting the existing energy potential in South Sudan. In addition
the government is incurring hefty losses in terms of money and man-hours. Grid system is not
constructed and it is also vital to prepare for efficient transmission of high voltages that will be
produced by Fula rapids of 40MW being constructed by Norwegian government. This power shall be
transmitted to the national grid, to Juba and other cities.
1.9 Main objective
The main objective of this study is to determine energy status in South Sudan. To achieve this, five
main and other minor energy sources were considered. These sources are Thermal Energy, Electrical
energy, solar energy, Wind Energy, Geothermal, Biomass energy, Kerosene and Battery.
1.9.1 Specific objective
1. Determine the energy mix of South Sudan (A case study of Juba city)
2. Analyze the potential from hydro
3. Compare Hydroelectric power with other sources of electricity
4. Propose ways forwards/Recommendations for South Sudan.
10
1.10 Organization of the project
This project has five chapters as follows;
Chapter 1 is an introduction giving a survey of earlier work, statement of the problem, objectives and
organization of the project.
Chapter 2, a presentation of literature survey, looked at the work done by different people in other part
of the world on renewable energy and hydro power potential studies, energy current status in South
Sudan and summary of literature review.
Chapter 3, the method used to carry out the data collection was presented.
Chapter 4 shows the discussions of the results found out of the study, both in graphical presentation
and in narratives format.
Chapter 5, Conclusion and recommendations/ways forward were presented. Areas of further research
also identified for future work.

11
2 LITERATURE REVIEW
This chapter gives a short review about the literature of energy status in South Sudan, review on
hydropower potential calculations, where recent studies and projects around the world concerning
energy mix and estimation of hydropower potential are discussed. Finally an overview of the status and
history of hydropower potential estimations in South Sudan and the ways forwards.
2.1 Energy mix studies
Mahmud Z. & Zied T., 2004 [29] carried out energy mix studies in Sudan. The studies showed that,
oil is a major source of Energy in both Sudan and South Sudan. It plays a major role in their
economies. This is due to the large numbers of oil reserves available in the country. Currently, about
95% of these oil reserves fall within the South Sudan territory, areas of Muglad and Melut basins.
According to studies by IMF in 2008, South Sudan, oil represents 98% of total revenues. South Sudan
energy consumption mix has not yet been determined and it is assumed to have been dominated by oil
(98%) and the rest comes from 100% thermal. Most of Renewable energy sources are currently not
part of the country’s energy consumption mix. In South Sudan, only 1% of the population has access to
electricity. 83% of South Sudan population is rural and depends on charcoal, firewood paraffin etc.
There is no national grid in South Sudan but only 11kV distribution network in the capital city. Hydro
electrical energy is not enough to help in economic development as of now.
Joel G., 2001[31] did an analysis on South Sudan power sector, in his short studies he found out that
this sector suffers from poor infrastructure. Biomass in South Sudan rural households has a great
potential but not exploited. Most of individuals in towns and some businesses in rural towns use either
12
solar or small diesel fired-generators 100% thermal. This way of generating electricity is inefficient
and expensive, and causes environmental problems. In many developing nations with a large rural
population, the residential sector contributes most to final energy demand, due to the large amounts of
fuel-wood used for basic energy needs. The government utility company, South Sudan Electricity
Corporation (SSEC) established in 2007, is tasked with Generation, transmission, Distribution and
Sales of Electricity. Attempts to invest in solar by independent power producers (IPP) is underway, if
the government gives them chance, solar could be another source to be produced in large scale to the
grid unlike now.
Bure Y, 2008 [14] elaborated the administration of the then South Sudan regional governments which
paid lip service to development while starving the region of its resources. South Sudan as mentioned
earlier has resources, the potential for development and the prospects for the future. One of the major
natural features of South Sudan is the River Nile whose many tributaries have sources in the country.
The region also contains many natural resources such as petroleum, iron ore, copper, chromium ore,
zinc, tungsten, mica, silver and gold. South Sudan should take keen interest on available energy
resources to unlock its potential.
2.2 Hydropower Potential
Chen J., 2005 [54] evaluated the capability of flowing water to produce power as a function of the
discharge of the flow where the specific weight of the water and the head were presented.
Castellarin A. & Omar M.A., 2004 [16, 56] applied a distributed hydrological model (DHM) to
capture the data through aerial view. This method determined the height of a river above sea level at a
13
full scale level. These two also performed discharge observation methods at a few sites in each
catchment along the whole river network. The analysis showed that the main Influences in discharge
measurement are runoff from rainfall, snowmelt and glacial melt, groundwater, evaporation and
transpiration.
Chastain E., 2007 [15] applied a simulation in gauged catchments to acquire discharge information
along the whole river network. This was necessary as the discharge is constantly changing with every
tributary. This was not enough to give the correct discharge values since observation may not give
exact values. In this study the current meter was used to measure the velocity of flowing water. The
principle of operation is based on the proportionality between the velocity of the water and the
resulting angular velocity of the meter rotor.
Jasper K., 2007 [32] used conceptual rainfall runoff models like HBV and WaSiM-ETH to estimate
discharge. A flow duration curve (FDC) provides an estimate of the percentage of time a given runoff
was equaled or exceeded over a defined period. In this FDC the word quartiles was used in connection
to the FDC, where for example the 75% quantile represents the discharge that is equaled or exceeded
75% of the simulation period. However, this models are not common and very expensive, hence may
not be applicable in South Sudan evaluation of hydro potential.
Viessman W. J & Lewis G. L., 2003 [34] further described how different quartiles of a FDC could
be used to give vital discharge information and are often analyzed in order to summarize the
hydrological frequency characteristics of river flow. FDCs can predict the availability and variability of
discharge but do not represent the actual sequences of flows. FDCs can be useful when defining

14
available discharge for hydropower and proper size and type of turbine and to see if regulations are
needed. It can be assumed that the entire upper part of the FDC (50-100%) is the low flow section, as it
represents an index of groundwater contribution to stream flow.
Gupta J.B., 2010 [6] used unique approach of integrating gradient data with discharge information and
the data set of potential hydropower barrier locations was developed at the start of the project and was
based on in-river features. Different method and technique was used to study hydrological
development. This technique uses computer based integrated system of Geographical Information
System (GIS) and Remote Sensing (RS).This development further affect the methods of evaluating and
mapping of potential hydropower with increase imaginary information from satellite and easiness of
data in GIS environments.
Maidment D.R., Ritchie & Schmugge T., 2002 [26, 30] both applied Remote Sensing (RS) for
hydrology, as it provides the possibility of observing hydrological state variables over large areas.
Input data based on RS was used for modeling of evapotranspiration. However, this method is limited.
Carroll (2004) described how GIS-based tools and RS data applied to hydropower survey studies
around the world in order to locate and select hydropower opportunities of different types, such as run-
of-the-river projects in US pumped hydroelectric energy storages in Ireland, storage capacity dams in
India and South Africa.
Gagnon Y., 2011 [35] Utilized synthetic hydro network (SHN) created from digital elevation models
coupled with annual base flow to map hydropower resource in New Brunswick. Bansal N.K (1985)
described Gross Head (GH) and the Net head (NH) as the maximum available vertical fall in the water,
15
from the upstream level to the downstream level and actual/reduced head respectively. The reduction
happens as a result of transfer of water into and away from the machine, this reduced head is the one
that is seen by the turbine and head is the same parameter to be used in determining hydropower
potential.
Kristofferson L.A et al, 1991[38] Calculated the heads by using the Digital Elevation Model (DEM)
for the “river cells”, he found the head as a difference of elevation between the current and the
immediately downstream cell.
Cherry S. J & Hall D.G., 2004 [41] did a study that provided estimates of the amount of low
head/low power potential, in United States with Emphasis on Low Head/ Low Power Resources Power
Potential (PRPP) in several power classes defined by power level and hydraulic head.

16
Figure 2.1: Example for Measurements of power (kW) in terms of flow rate and water head.
Source, (DIU, 2010)
Einar O. A., 2006 [44] Carried out studies for calculating hydro potential for small power plants in
Norway. The potential for power plants under 1MW had been estimated to be 3 TWh and the
assessment for plants between 1 and 10 MW was 7 TWh with estimations done in the 1980’s and
1990’s. Since there was no project evaluation behind these estimations, a new method was developed
through a joint cooperation between NVE and GIS consultants. All rivers with a slope down to 1/25
were included in the estimation and the head was limited to range from 10 m to 600 m and mean flow
in the range from 0.05 to 25 m3/s. For better understanding of these numbers, Table 1 shows the
calculated power for minimum, Mean and maximum values of both discharge and head according to
the Norwegian thresholds, using eq. (1). For minimum discharge (0.05 m3/s), necessary head to
produce 50 kW power is 102 m and for minimum head (10 m), necessary discharge is 0.51 m3/s.
Head
(m)
Head
(m)
Flow (m3/s)
Power in kW 7 x Head x Flow
17
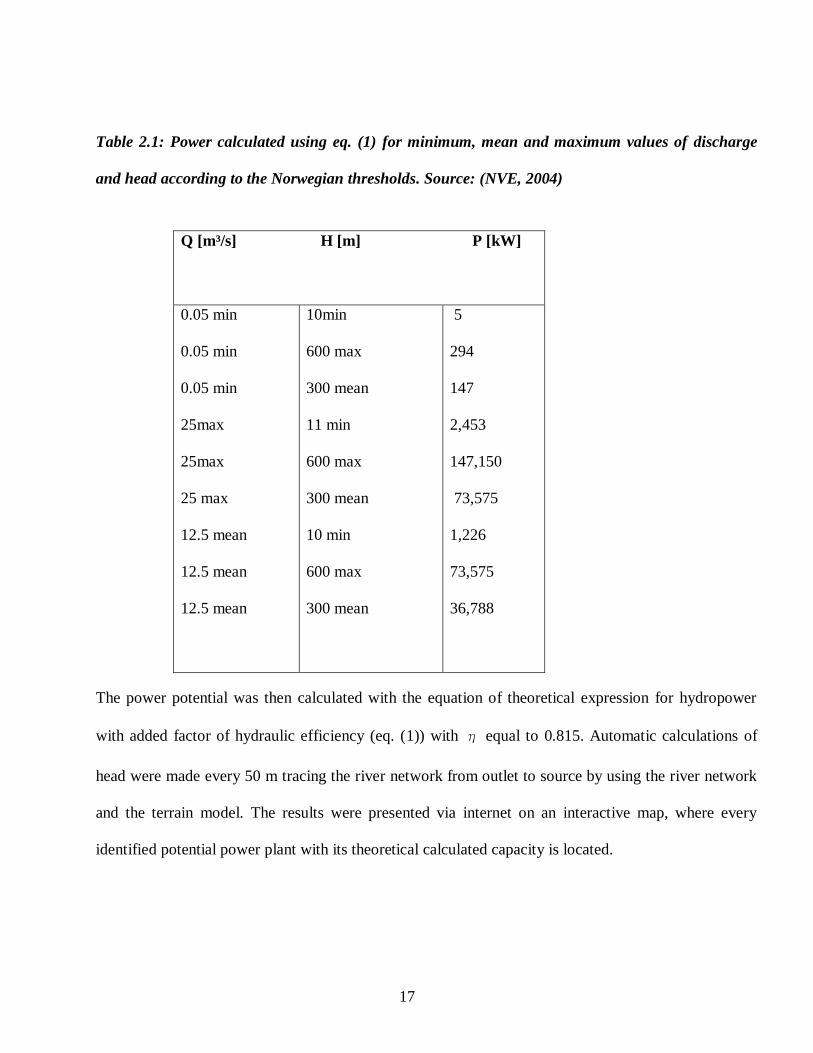
Table 2.1: Power calculated using eq. (1) for minimum, mean and maximum values of discharge
and head according to the Norwegian thresholds. Source: (NVE, 2004)
The power potential was then calculated with the equation of theoretical expression for hydropower
with added factor of hydraulic efficiency (eq. (1)) with η equal to 0.815. Automatic calculations of
head were made every 50 m tracing the river network from outlet to source by using the river network
and the terrain model. The results were presented via internet on an interactive map, where every
identified potential power plant with its theoretical calculated capacity is located.
Q [m³/s] H [m] P [kW]
0.05 min
0.05 min
0.05 min
25max
25max
25 max
12.5 mean
12.5 mean
12.5 mean
10min
600 max
300 mean
11 min
600 max
300 mean
10 min
600 max
300 mean
5
294
147
2,453
147,150
73,575
1,226
73,575
36,788

18
2.3 Additional methods of evaluating hydro potentials
Weiss H. W & Faeh A. 0., 1990 [48] both discussed various methods of determining hydro potential,
though emphasize was given to keen interpretation of hydrologic background. Hydro potential
constitutes one type of surface water resource on which renewed interest has been focused. Of the
various methods in use for determining hydro potential, two are described in short as written below;
2.3.1 The area potential
Area potential was determined on the basis of conditions of topographic and hydrologic structure
which formed the upper limit of the hydro potential. Mean annual precipitation was used to estimate
hydro potential. For evaluation, a catchments area was subdivided into squares of equal area using a
grid. The potential of each square was a function of the precipitation, the surface area of the square and
its head difference to some predefined point of reference as shown in the figure 2.2
Figure 2.2: Basic method of determining hydro potential (Area potential)

19
2.3.2 Utilizable potential
Watt et al, [50] conducted a study on the hydro potential of Peru and Guatemala. In the case of Peru,
80 000 km of rivers in 111 separate basins were analyzed. The utilizable potential turned out to be
approximately 30% of the theoretical (line) potential. This was also done by using available hydro
power plant designs once construction and production costs have been estimated. The expression
below clearly defines utilizable potential as illustrated in the figure 2.3 below;
Figure 2.3: Basic method of determining hydro potential (Utilizable potential)
2.4 Current status in South Sudan
South Sudan is characterized by consistent rainfall that last for nearly three quarters a year. The mean
annual rainfall ranges from 1mm in the desert to 1600mm in equatorial region. Geologically, South
Sudan has mountains that are characterized by steeply dissected hilly and rolling terrain. For instant,
Fula station has a reasonable head which is capable of supplying the whole country (South Sudan) with
power. This geo-climatic combination causes a large number of streams to radiate from the upper
20
reaches of mountains. Small streams in the Upper catchments as well as major rivers shall be able to
offer South Sudan a remarkable power supply.
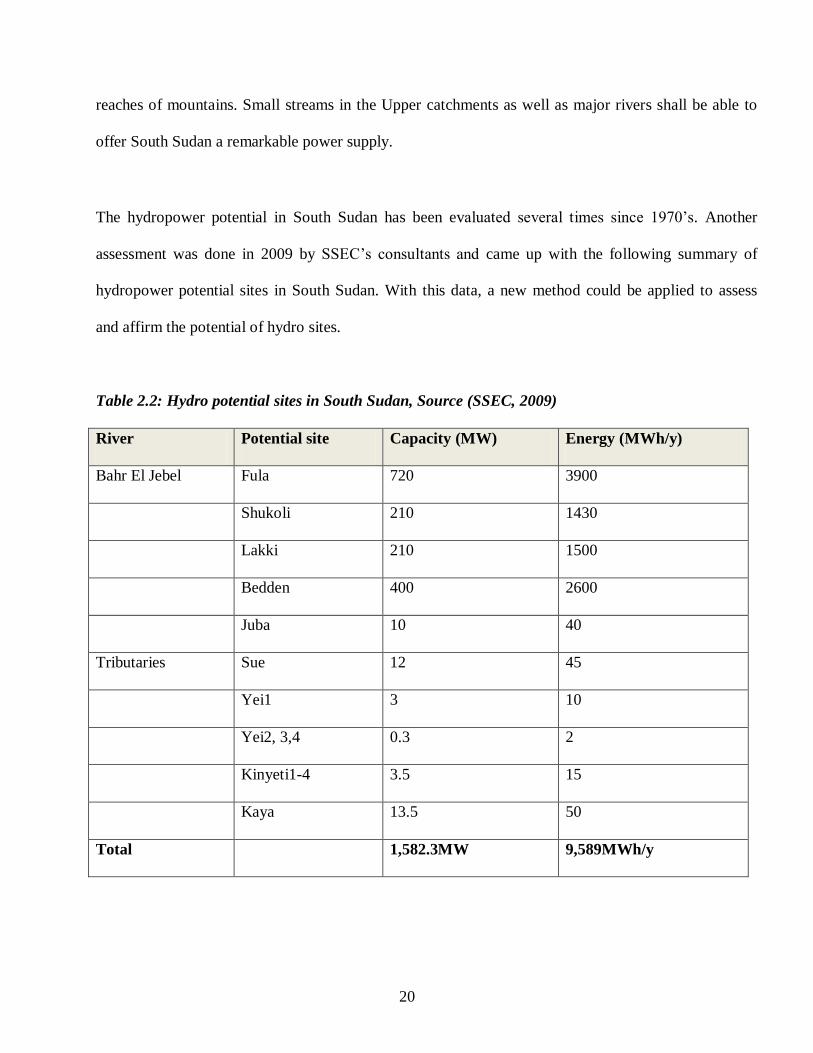
The hydropower potential in South Sudan has been evaluated several times since 1970’s. Another
assessment was done in 2009 by SSEC’s consultants and came up with the following summary of
hydropower potential sites in South Sudan. With this data, a new method could be applied to assess
and affirm the potential of hydro sites.
Table 2.2: Hydro potential sites in South Sudan, Source (SSEC, 2009)
River Potential site Capacity (MW) Energy (MWh/y)
Bahr El Jebel Fula 720 3900
Shukoli 210 1430
Lakki 210 1500
Bedden 400 2600
Juba 10 40
Tributaries Sue 12 45
Yei1 3 10
Yei2, 3,4 0.3 2
Kinyeti1-4 3.5 15
Kaya 13.5 50
Total 1,582.3MW 9,589MWh/y

21
Currently, South Sudan is experiencing difficulty in meeting its demand due to limited generation
capacity. In juba, only 1% of the population has an access to electricity. If the above potential is
utilized, the country shall be in a better position to pick up in term of development.
2.5 Summary of Literature Review
Determination of energy status for South Sudan is necessary because the country is in dire need of a
sustainable and reliable energy sources. There is a need to determine energy source that could be used
for short term and long demands. The potential of hydro has been assessed in the past in the then Sudan
and was not well completed. There is a need to apply a different method to get the potential values.
From the above literature review, there shows good results in assessment of hydro power potentials
done by individuals and that of other countries around the world. From this literature, Energy mix
analysis that was used in Sudan and in the USA could be utilized in this study. The concept of area
potentials and discharge analysis using energy meter will be applied in this research work.
22
3 METHODOLOGY
3.1 Determination of Energy mix for South Sudan
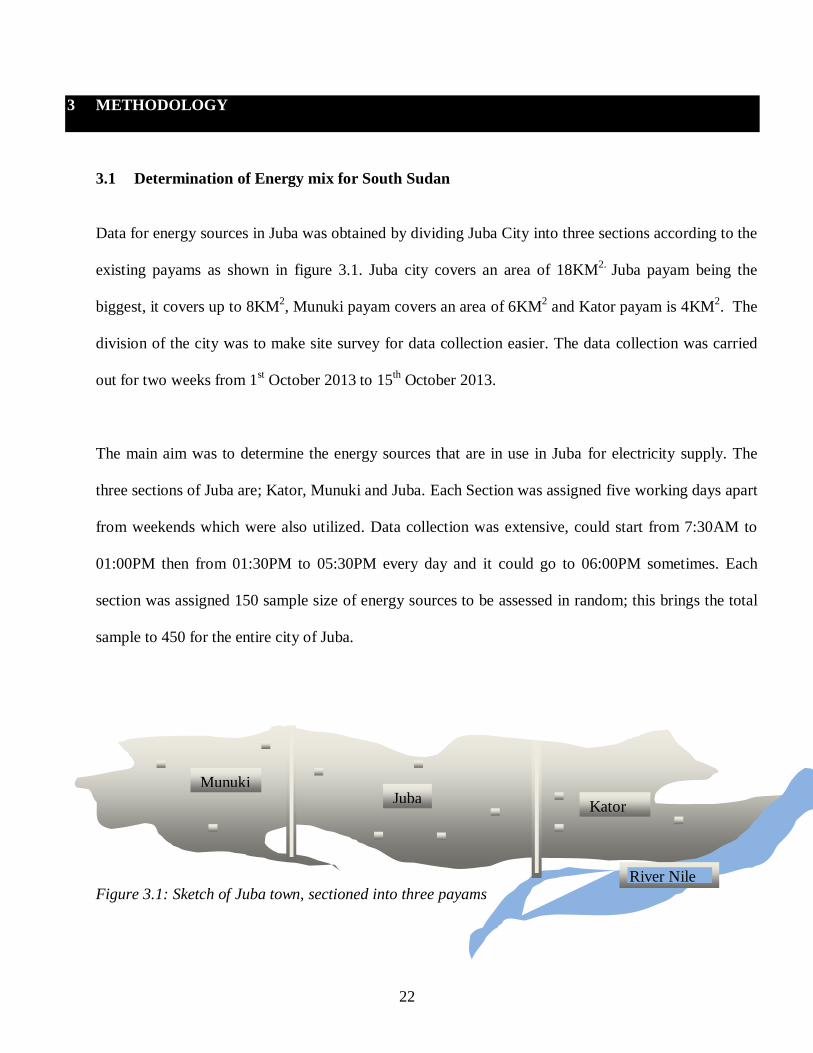
Data for energy sources in Juba was obtained by dividing Juba City into three sections according to the
existing payams as shown in figure 3.1. Juba city covers an area of 18KM2.
Juba payam being the
biggest, it covers up to 8KM2, Munuki payam covers an area of 6KM
2 and Kator payam is 4KM
2. The
division of the city was to make site survey for data collection easier. The data collection was carried
out for two weeks from 1st October 2013 to 15
th October 2013.
The main aim was to determine the energy sources that are in use in Juba for electricity supply. The
three sections of Juba are; Kator, Munuki and Juba. Each Section was assigned five working days apart
from weekends which were also utilized. Data collection was extensive, could start from 7:30AM to
01:00PM then from 01:30PM to 05:30PM every day and it could go to 06:00PM sometimes. Each
section was assigned 150 sample size of energy sources to be assessed in random; this brings the total
sample to 450 for the entire city of Juba.
Figure 3.1: Sketch of Juba town, sectioned into three payams
Munuki Juba
Kator
River Nile

23
From figure 3.1 above, the dotted spots represent households that are using at least one energy source
in a payam.
3.2 Data
The data required to achieve the study objective was found as follows;
1. The data for energy sources was obtained by carrying out site survey. The site was divided into
three sections (payams), namely munuki, kator and juba to make it easier to collect energy
sources in use. This data covered a period of two weeks from 1st Oct 2013 to 15
th Oct 2013 with
a sample time of eight hours a day.
2. The data to determine Potential from hydro was obtained from data discharge taken from two
hydro sites, Fula and Shukoli sites. The data was found by using current meter to measure the
discharge in the river. The data was obtained for one month of river flow.
3. Water Elevation data was sourced from Sudan dam implementing unit and from ministry of
water resources. This data was taken for two months from July 2009 to September 2009 using
the aerial view.
4. Data for comparing Hydro power with other sources of energy was obtained from historical
data in the ministry of Electricity and Dams and by using some books from different authors.
The potential from Hydro was estimated from the following expression;
= …………………………………………………………………………………………………………………..(1)
24
Where
P = Power (W)
γ = Specific weight (N/m3); γ = gρ, Where g = Acceleration due to gravity (m/s2), ρ = Mass density
(kg/m3)
= Hydraulic efficiency
Q = Discharge (m3/s)
H = Head (m) The mass density is generally assumed constant at 1000 kg/m3 and gravitational
acceleration 9.81 m/s2. Only two remaining parameters (Head and Discharge) are needed to determine
the hydropower potential for any site.
The head can be measured manually or with different automated methods measuring along the river
system within a digital elevation model. The head can be classified in three groups; small head which
is less than 50 m, average head which is 50-250 m and large head which exceeds 250 m.
25
4 RESULTS AND DISCUSSIONS
4.1 Energy Consumption mix in South Sudan
South Sudan energy consumption mix is dominated by oil which is 98% of South Sudan revenue and
the rest of 2% comes from thermal. The total available Electrical energy in South Sudan is 70MW with
40MW being imported from Sudan and approximately 30MW installed in the state capital. Over 95%
of this available energy is thermal. 100% of installed capacity mostly in state capital in South Sudan is
thermal. Analysis of energy status in this research work shall concentrate on Juba city.
4.2 Energy mix in Juba
The energy mix data was obtained by dividing Juba city into three sections as explained in chapter 3.
Table 4.1 gives the results of energy sources that were assessed in munuki, Juba and Kator.
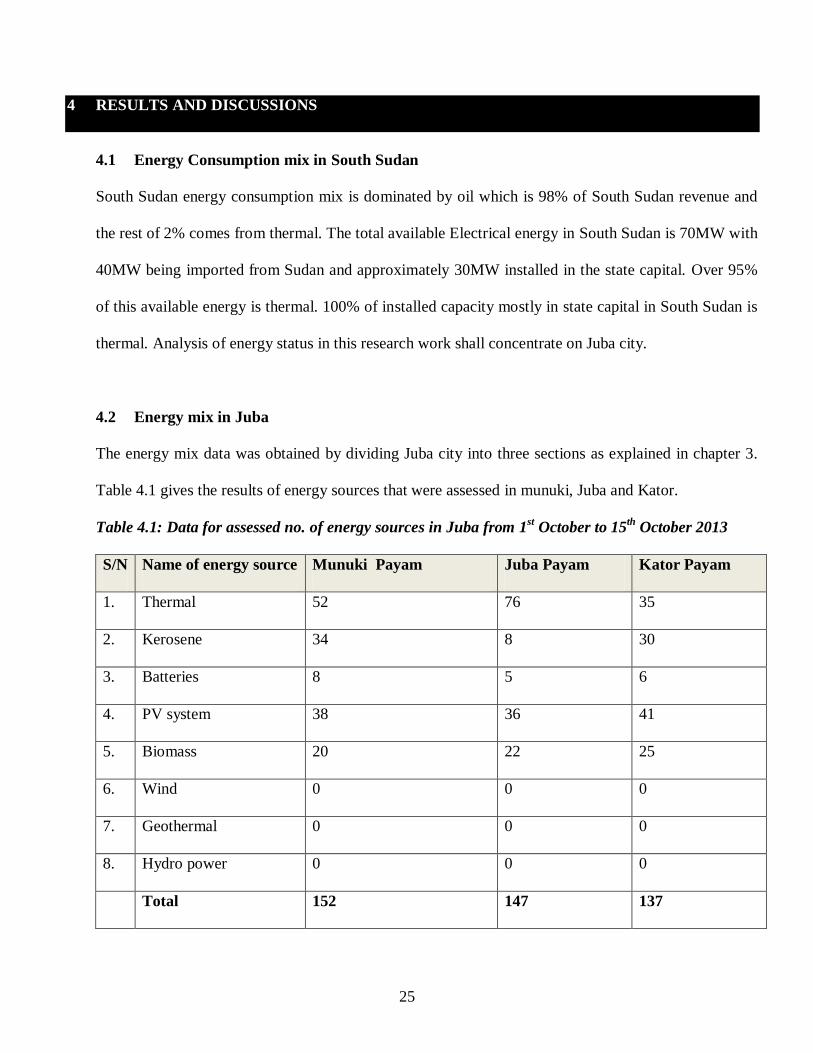
Table 4.1: Data for assessed no. of energy sources in Juba from 1st October to 15
th October 2013
S/N Name of energy source Munuki Payam Juba Payam Kator Payam
1. Thermal 52 76 35
2. Kerosene 34 8 30
3. Batteries 8 5 6
4. PV system 38 36 41
5. Biomass 20 22 25
6. Wind 0 0 0
7. Geothermal 0 0 0
8. Hydro power 0 0 0
Total 152 147 137

26
From table 4.1, Munuki has the highest number of energy sources up to 152, followed by Juba with
147 then Kator with 137. The implication of this variation in the number of energy sources has
something to do with standard of living. Majority of high class people stay in Juba payam according to
national bureau of statistics assessment, 2011 and most of them are able to afford personal generators.
Thermal energy constitutes of 52% of the total energy sources installed in Juba Payam and kerosene is
6% of the total.
Kator on the other hand has most of water bottling plants. The senior employees of these water bottling
plants are situated around these areas and can manage to purchase generators. We can see that solar PV
is about 30% of the energy sources in Kator. Munuki is mixed and it’s composed of both classes. In
the entire Juba, we have no trace of wind farm, Hydro station and Geothermal. Some of these energy
sources have high potential.
Table 4.2: Data for Munuki energy sources in percentages
Thermal Kerosene Battery PV
system
Biomass Wind Geothermal Hydro
Power
34% 22% 6% 25% 13% 0% 0% 0%

27
Figure 4.1: Graphical presentation of energy sources in Munuki Payam, Juba City
From figure 4.1, Thermal energy generation appear to dominate the consumption upto 34% in Munuki
payam. Most of the residents in this area have personal generators and many of them are also using city
power from diesel-fired Generators at Juba power station. Battery 6% are being used for entertainment
and lighting but at the minimum rate. A reasonable number of residents are using solar arrays up to
25% of diffident sizes, ranging from 75W to 200W the common solar capacity in Juba but could go
higher than 200W.
Most of returnees from Khartoum and many other neighboring countries for instance Kenya, Uganda,
Ethiopia and DRC have settled here and are still using kerosene up to 22% of the total surveyed energy
sources in this payam, Biomass gives 13%. Other sources of energy have no trace as yet. Wind,
Geothermal and Hydro power are all zero as seen from the chart though; sources like wind and Hydro
have high potential that is not yet exploited.
0%5%
10%15%20%25%30%35%
Energy Sources in Munuki Payam
% of Energy Source

28
Table 4.3: Data for Juba energy sources in percentages
Thermal Kerosene Battery PV system Biomass Wind Geothermal Hydro
power
51% 5% 4% 25% 15% 0% 0% 0%
Figure 4.2: Graphical presentation of energy sources in Juba Payam, Juba City
Figure 4.2 presents a status of energy sources in Juba payam. Still thermal is at the higher level utpo
51% compare to Kerosene 5%, Battery 4% , PV system 25%, Biomass 15%, Wind 0%, Geothermal
0% and Hydro 0%. Majority of residents in Juba payam are able to purchase city power as well own a
generator and solar. Kerosene is at minimum since most of the people here don’t need it. It is only used
in some few areas within Juba payam.
0%
10%
20%
30%
40%
50%
60%
Energy Sources in Juba Payam
% of Energy Source
29
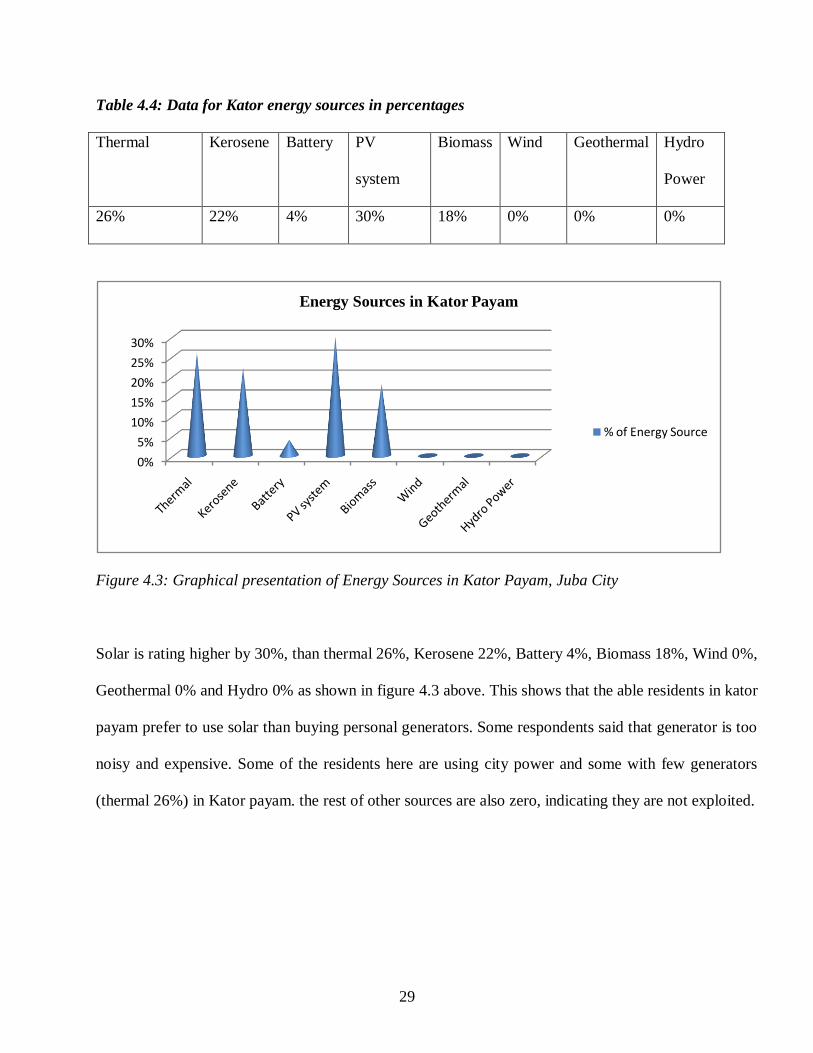
Table 4.4: Data for Kator energy sources in percentages
Thermal
Kerosene Battery PV
system
Biomass Wind Geothermal Hydro
Power
26% 22% 4% 30% 18% 0% 0% 0%
Figure 4.3: Graphical presentation of Energy Sources in Kator Payam, Juba City
Solar is rating higher by 30%, than thermal 26%, Kerosene 22%, Battery 4%, Biomass 18%, Wind 0%,
Geothermal 0% and Hydro 0% as shown in figure 4.3 above. This shows that the able residents in kator
payam prefer to use solar than buying personal generators. Some respondents said that generator is too
noisy and expensive. Some of the residents here are using city power and some with few generators
(thermal 26%) in Kator payam. the rest of other sources are also zero, indicating they are not exploited.
0%
5%
10%
15%
20%
25%
30%
Energy Sources in Kator Payam
% of Energy Source

30
Table 4.5: Percentage (%) use of energy in Juba City
S/N Thermal Kerosene Battery PV
System
Biomass Wind Geothermal Hydro
Power
Percenta
ge (%)
36% 17% 5% 27% 15% 0% 0% 0%
Figure 4.4: Percentage (%) of energy sources in Juba
In figure 4.4 above, the energy consumption in the entire city of juba is presented considering the 450
sample size. Thermal 36% takes the lead as the only source of energy being utilized in Juba widely. As
we can see, the country is suffering for lack of reliable source of energy. Major sources of energy like,
Hydro 0%, Wind 0% and Geothermal 0% are not yet exploited and social and economic development
can never go ahead without such sources.
Solar energy 27% on the plot is clean and efficient but it is not economical in term of space. 1MW of
solar covers an acre of land which if you install Hydro or any other source of power, can be enough for
over 100MW. This justifies that solar is not economical, initial capital for solar is also too huge. Use of
36%
17%
5%
27%
15%
0%
0%
0%
Energy Sources in Juba City
Thermal
Kerosene
Battery
PV System
Biomass
Wind
Geothermal
31
Kerosene 17% indicates low class of living. Juba still has a large number of internal displace persons
(IDP) from Khartoum mainly and they have not yet settled well to be self-reliance therefore, a great
number of them are still using kerosene and candles for lighting.
4.3 Determination of potential from Hydro
Potential from Hydro was determined through discharge and river elevation. River discharge was
determined by multiplying velocity by summation of the area of cross-sections. Depth and width were
obtained by sectioning the river as shown in figure 4.5. Area was calculated from depth by the width.
The data was taken in the month of December 2012 and revised in October 2013. River elevation data
was sourced from the ministry of dam implementing unit of Sudan and from ministry of irrigation and
water resources of South Sudan. This data was taken for two months from July 2009 to September
2009 using aerial view.

32
Figure 4.5: Area calculated by directly measuring width and depth of a river sectioned in cubes in
series
4.3.1 Discharge
Discharge was determined through current meter measurements. The current meter was used to
measure the velocity of flow, depth and width of water. The following formula was used to calculate
the discharge based on figure 4.5.
Total Discharge = ((Area1 x Velocity 1) + (Area2 x Velocity2) + ….. (Arean x Velocityn)…………. (2)
33
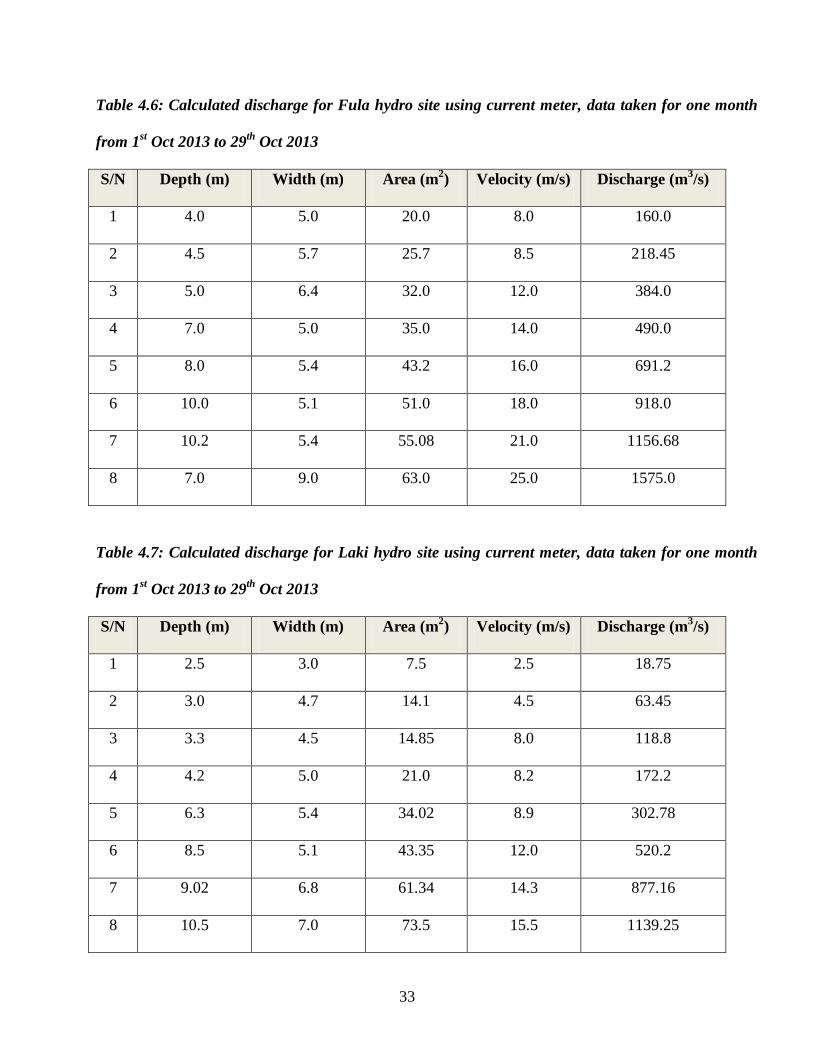
Table 4.6: Calculated discharge for Fula hydro site using current meter, data taken for one month
from 1st Oct 2013 to 29
th Oct 2013
S/N Depth (m) Width (m) Area (m2) Velocity (m/s) Discharge (m
3/s)
1 4.0 5.0 20.0 8.0 160.0
2 4.5 5.7 25.7 8.5 218.45
3 5.0 6.4 32.0 12.0 384.0
4 7.0 5.0 35.0 14.0 490.0
5 8.0 5.4 43.2 16.0 691.2
6 10.0 5.1 51.0 18.0 918.0
7 10.2 5.4 55.08 21.0 1156.68
8 7.0 9.0 63.0 25.0 1575.0
Table 4.7: Calculated discharge for Laki hydro site using current meter, data taken for one month
from 1st Oct 2013 to 29
th Oct 2013
S/N Depth (m) Width (m) Area (m2) Velocity (m/s) Discharge (m
3/s)
1 2.5 3.0 7.5 2.5 18.75
2 3.0 4.7 14.1 4.5 63.45
3 3.3 4.5 14.85 8.0 118.8
4 4.2 5.0 21.0 8.2 172.2
5 6.3 5.4 34.02 8.9 302.78
6 8.5 5.1 43.35 12.0 520.2
7 9.02 6.8 61.34 14.3 877.16
8 10.5 7.0 73.5 15.5 1139.25
34
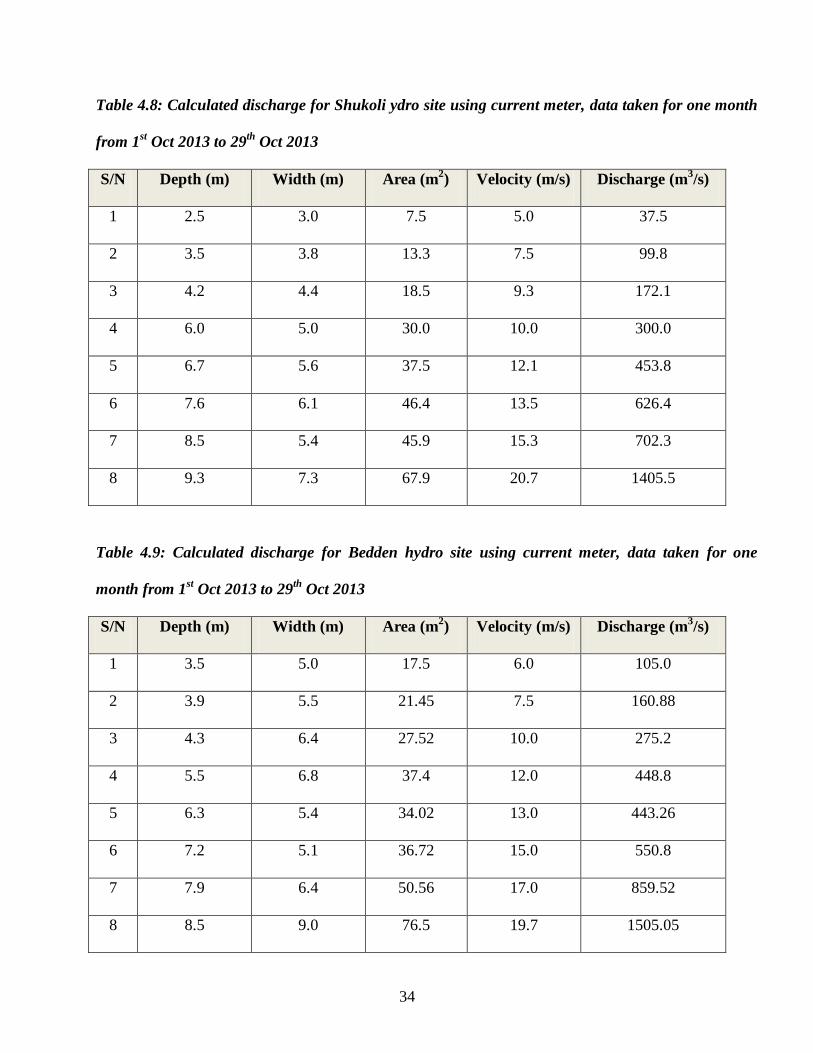
Table 4.8: Calculated discharge for Shukoli ydro site using current meter, data taken for one month
from 1st Oct 2013 to 29
th Oct 2013
S/N Depth (m) Width (m) Area (m2) Velocity (m/s) Discharge (m
3/s)
1 2.5 3.0 7.5 5.0 37.5
2 3.5 3.8 13.3 7.5 99.8
3 4.2 4.4 18.5 9.3 172.1
4 6.0 5.0 30.0 10.0 300.0
5 6.7 5.6 37.5 12.1 453.8
6 7.6 6.1 46.4 13.5 626.4
7 8.5 5.4 45.9 15.3 702.3
8 9.3 7.3 67.9 20.7 1405.5
Table 4.9: Calculated discharge for Bedden hydro site using current meter, data taken for one
month from 1st Oct 2013 to 29
th Oct 2013
S/N Depth (m) Width (m) Area (m2) Velocity (m/s) Discharge (m
3/s)
1 3.5 5.0 17.5 6.0 105.0
2 3.9 5.5 21.45 7.5 160.88
3 4.3 6.4 27.52 10.0 275.2
4 5.5 6.8 37.4 12.0 448.8
5 6.3 5.4 34.02 13.0 443.26
6 7.2 5.1 36.72 15.0 550.8
7 7.9 6.4 50.56 17.0 859.52
8 8.5 9.0 76.5 19.7 1505.05

35
Table 4.10: Monthly river discharge data for the month of December 2012, taken again in October
2013 by using current meter
Fula (m3/s) Laki (m3
/s) Shukoli (m3/s) Bedden (m3
/s)
160.0 18.75 37.5 105.0
218.5 63.45 99.8 160.88
384.0 118.8 172.1 275.2
490.0 172.2 300.0 448.8
691.2 302.78 453.8 443.26
918.0 520.2 626.4 550.8
1156.7 877.16 702.3 859.52
1575.0 1139.25 1405.5 1505.05
4.3.2 Water Elevation (FSL)
Water elevation data was sourced from the ministry of irrigation and water resources of South Sudan
and from dam implementing unit of Sudan. This data was obtained by using elevation model and
transferred from Arc geographical information system (ArcGIS) to excel sheet for computation. Table
13 shows the data of elevation from four hydro potential sites.

36
Table 4.11: Elevation data from July 2009 to September 2009
Fula Elevation (m) Laki Elevation (m) Shukoli Elevation (m) Bedden Elevation (m)
543.0 488.532 463.0 526.7
545.0 492.186 463.8 527.5
545.6 493.158 464.2 528.8
546.3 494.628 464.7 528.0
547.0 496.467 465.3 528.3
547.5 497.943 465.8 528.6
548.2 499.105 466.5 529.0
549.9 501.392 467.9 530.1
550.3 502.766 468.6 530.8
551.3 505.970 460.9 531.9
37
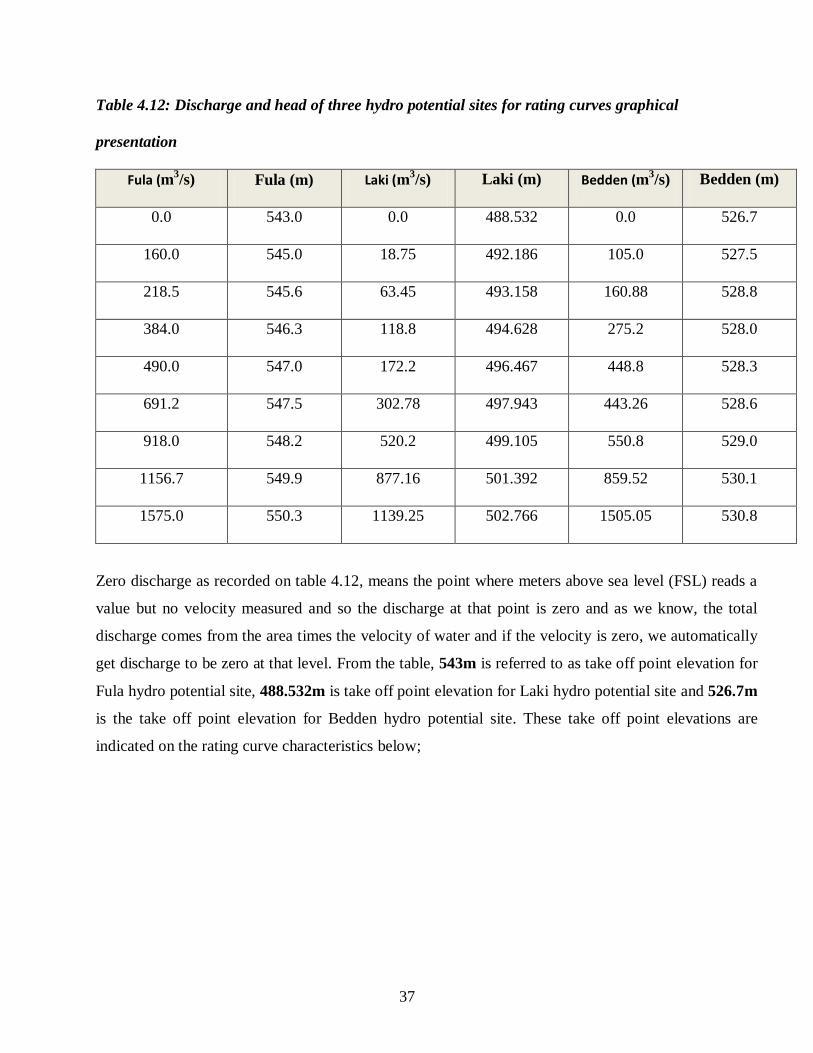
Table 4.12: Discharge and head of three hydro potential sites for rating curves graphical
presentation
Fula (m3/s) Fula (m) Laki (m
3/s) Laki (m) Bedden (m
3/s) Bedden (m)
0.0 543.0 0.0 488.532 0.0 526.7
160.0 545.0 18.75 492.186 105.0 527.5
218.5 545.6 63.45 493.158 160.88 528.8
384.0 546.3 118.8 494.628 275.2 528.0
490.0 547.0 172.2 496.467 448.8 528.3
691.2 547.5 302.78 497.943 443.26 528.6
918.0 548.2 520.2 499.105 550.8 529.0
1156.7 549.9 877.16 501.392 859.52 530.1
1575.0 550.3 1139.25 502.766 1505.05 530.8
Zero discharge as recorded on table 4.12, means the point where meters above sea level (FSL) reads a
value but no velocity measured and so the discharge at that point is zero and as we know, the total
discharge comes from the area times the velocity of water and if the velocity is zero, we automatically
get discharge to be zero at that level. From the table, 543m is referred to as take off point elevation for
Fula hydro potential site, 488.532m is take off point elevation for Laki hydro potential site and 526.7m
is the take off point elevation for Bedden hydro potential site. These take off point elevations are
indicated on the rating curve characteristics below;
38
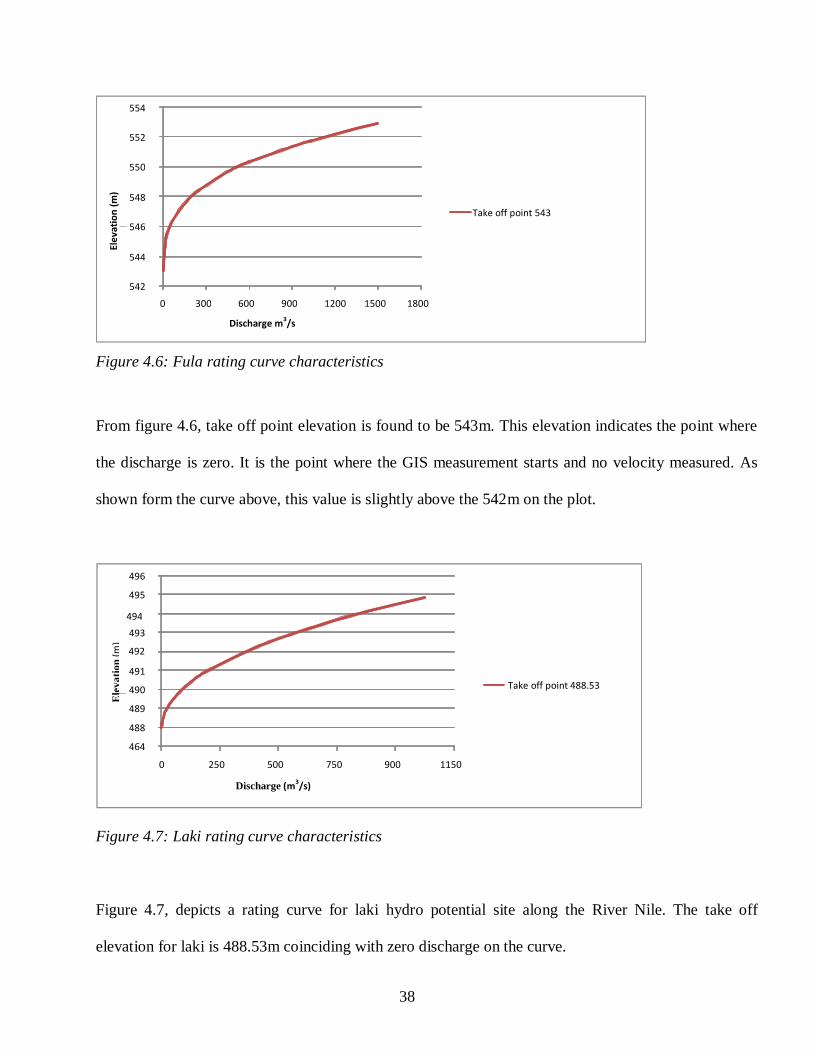
Figure 4.6: Fula rating curve characteristics
From figure 4.6, take off point elevation is found to be 543m. This elevation indicates the point where
the discharge is zero. It is the point where the GIS measurement starts and no velocity measured. As
shown form the curve above, this value is slightly above the 542m on the plot.
Figure 4.7: Laki rating curve characteristics
Figure 4.7, depicts a rating curve for laki hydro potential site along the River Nile. The take off
elevation for laki is 488.53m coinciding with zero discharge on the curve.
464
488
489
490
491
493
495
496
0 250 500 750 900 1150
Elevation ( m)
Discharge (m3/s)
Take off point 488.53
492
Ele
va
tio
n (
m)
494
542
544
546
548
550
552
554
0 300 600 900 1200 1500 1800
Elevation ( m)
Discharge m3/s
Take off point 543
Ele
vati
on
(m
)

39
Figure 4.8: Bedden rating curve characteristics
The Take off point elevation for Bedden is 526.8m as shown on figure 4.8 above. This indicates the
point where the discharge is zero.
4.4 Hydro potential calculations
The results were obtained as shown on table 4.13 using equation one (1), = . Hydraulic
efficiency and Discharge coefficient of 0.8 and 0.2 were used respectively. Acceleration due to gravity
9.81m/s2, Mass Density of water 1000kg/m
3 were also used in the calculation to get the capacity in
MW as mentioned in chapter 3.
526.0 527.0 528.0 529.0 530.0 531.0 532.0 533.0 534.0 535.0
0 300 600 900 1200 1500 1800
Discharge (m3/s)
Take off point 526.8
Ele
va
tio
n (
m) (m
)
40
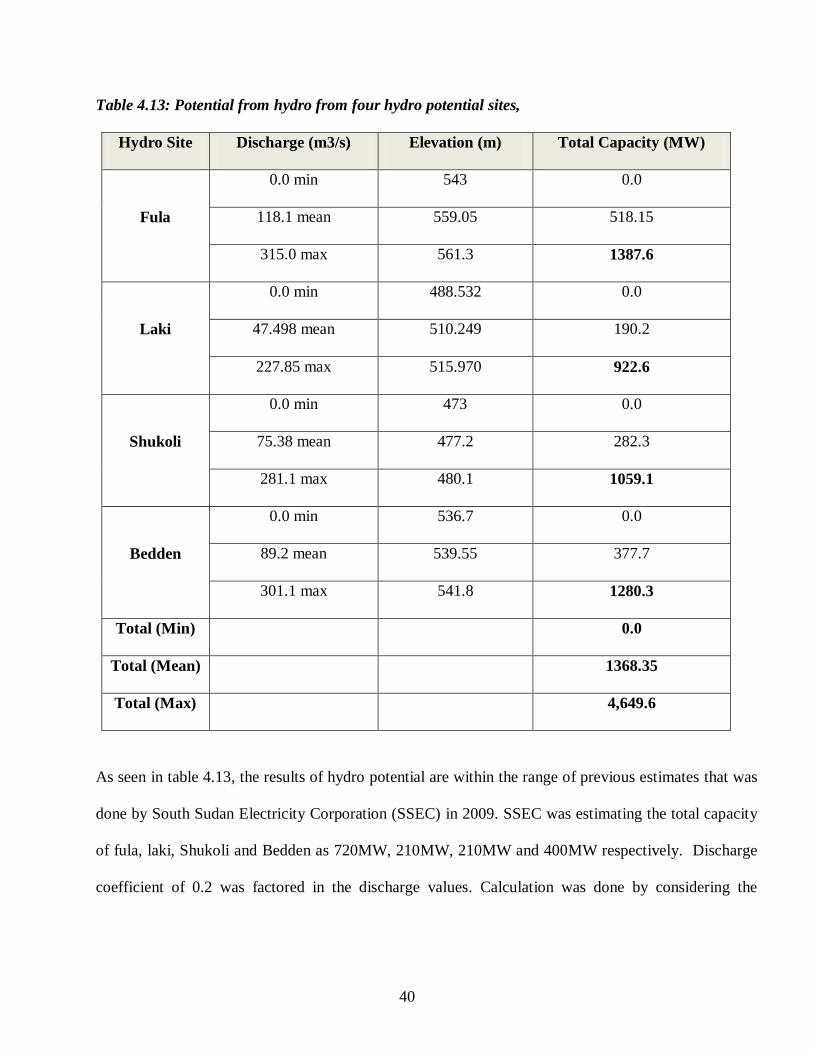
Table 4.13: Potential from hydro from four hydro potential sites,
Hydro Site Discharge (m3/s) Elevation (m) Total Capacity (MW)
0.0 min 543 0.0
Fula 118.1 mean 559.05 518.15
315.0 max 561.3 1387.6
0.0 min 488.532 0.0
Laki 47.498 mean 510.249 190.2
227.85 max 515.970 922.6
0.0 min 473 0.0
Shukoli 75.38 mean 477.2 282.3
281.1 max 480.1 1059.1
0.0 min 536.7 0.0
Bedden 89.2 mean 539.55 377.7
301.1 max 541.8 1280.3
Total (Min)
0.0
Total (Mean)
1368.35
Total (Max)
4,649.6
As seen in table 4.13, the results of hydro potential are within the range of previous estimates that was
done by South Sudan Electricity Corporation (SSEC) in 2009. SSEC was estimating the total capacity
of fula, laki, Shukoli and Bedden as 720MW, 210MW, 210MW and 400MW respectively. Discharge
coefficient of 0.2 was factored in the discharge values. Calculation was done by considering the
41
minimum, mean and maximum values of discharge and head. This was done to find the range of values
of hydro potential in Fula, Laki, Shukoli and Bedden hydro sites.
As tabulated in table 4.13, the maximum capacity that Fula can produce is 1387.6MW; Laki can
produce a maximum of 922.6MW; Shukoli on the other hand can produce a capacity of 1059.1MW
and Bedden can also produce up to a maximum 1280.3MW. This could amount to a total expected
capacity of 4649.6MW from these four hydro sites only. South Sudan is rich in terms of water
resources and this translates to a high potential of Hydro. Most of the rivers were not accessed during
this research work due to lack of roads and insecurity. This potential shall be exploited when South
Sudan becomes stable.
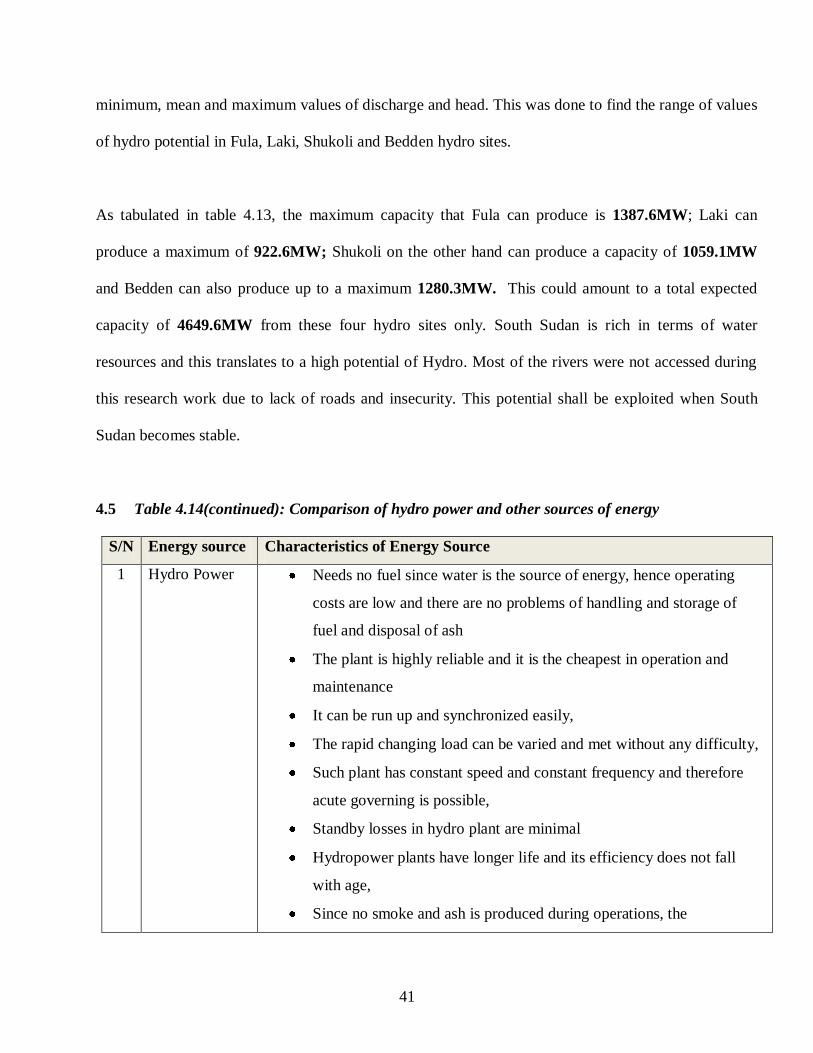
4.5 Table 4.14(continued): Comparison of hydro power and other sources of energy
S/N Energy source Characteristics of Energy Source
1 Hydro Power Needs no fuel since water is the source of energy, hence operating
costs are low and there are no problems of handling and storage of
fuel and disposal of ash
The plant is highly reliable and it is the cheapest in operation and
maintenance
It can be run up and synchronized easily,
The rapid changing load can be varied and met without any difficulty,
Such plant has constant speed and constant frequency and therefore
acute governing is possible,
Standby losses in hydro plant are minimal
Hydropower plants have longer life and its efficiency does not fall
with age,
Since no smoke and ash is produced during operations, the

42
hydropower plant is clean and neat
Highly skilled engineers are required only at the time of construction
but at last, few experienced personal are required,
This plant can serve other purposes apart from generation of
electricity; it can be used for irrigation, flood control and navigation
among others.
2 Thermal Power Operating cost is high due to high cost of fuel
Maintenance and lubrication cost is also high as compared In the case
of other plants,
Diesel plants cannot supply overloads continuously
Diesel unit’s capacity is limited. These cannot be constructed in large
size,
Noise from the exhaust is a serious problem
Diesel useful life is very short, it’s about 10 years.
3 Solar Power The initial cost of purchasing and installing solar panel is high
Location of solar panels is important, areas that are cloudy cannot
produce solar power unless you install more panels
PV panels are made up of silicon and other toxic metals like mercury,
hence imminent environmental pollution which renders inequality in
PV cells. Very high technology can avert the worst of this effects
60% of the sunlight gets wasted and not harnessed since most of solar
panels have 40% efficiency. This renders it inefficient
Solar is not reliable since it can be operated at night
Takes large space for big companies to install solar arrays
4 Wind Power Doesn't produce the same amount of power every day since the
strength of wind is not constant
Difficult some times to get wind farm site since most of the people
think country site should be left untouched for wind farm
Wind turbines are noisy
Some people see wind turbines to be generally ugly and therefore it
43
disfigure the country site
Pollutants are produced during manufacturing of wind turbines
Limited in unit capacity hence required many unit to supply a high
population
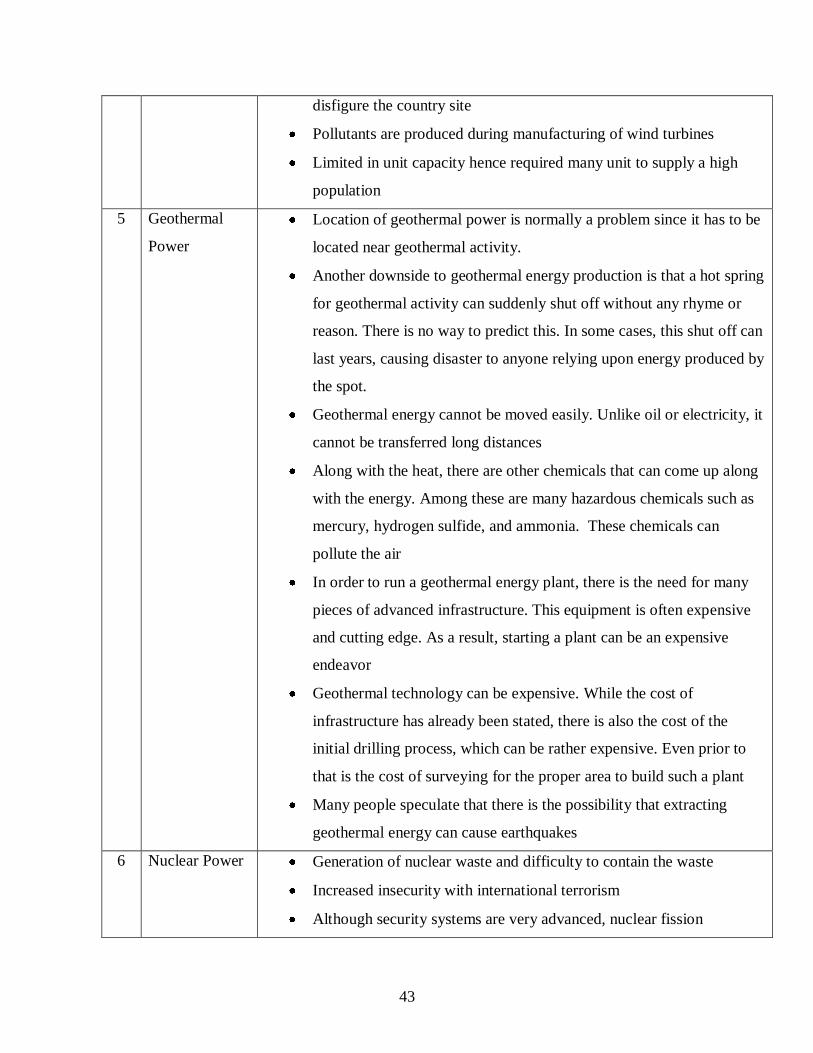
5 Geothermal
Power
Location of geothermal power is normally a problem since it has to be
located near geothermal activity.
Another downside to geothermal energy production is that a hot spring
for geothermal activity can suddenly shut off without any rhyme or
reason. There is no way to predict this. In some cases, this shut off can
last years, causing disaster to anyone relying upon energy produced by
the spot.
Geothermal energy cannot be moved easily. Unlike oil or electricity, it
cannot be transferred long distances
Along with the heat, there are other chemicals that can come up along
with the energy. Among these are many hazardous chemicals such as
mercury, hydrogen sulfide, and ammonia. These chemicals can
pollute the air
In order to run a geothermal energy plant, there is the need for many
pieces of advanced infrastructure. This equipment is often expensive
and cutting edge. As a result, starting a plant can be an expensive
endeavor
Geothermal technology can be expensive. While the cost of
infrastructure has already been stated, there is also the cost of the
initial drilling process, which can be rather expensive. Even prior to
that is the cost of surveying for the proper area to build such a plant
Many people speculate that there is the possibility that extracting
geothermal energy can cause earthquakes
6 Nuclear Power Generation of nuclear waste and difficulty to contain the waste
Increased insecurity with international terrorism
Although security systems are very advanced, nuclear fission
44
reactions generate some chain reactions that are toxic to human life
Nuclear fusions are unfeasible because of the difficulty of heating the
gas to such high temperatures and to maintain a sufficient number of
nuclei for a time sufficient to obtain energy to liberate than necessary
to retain heat and is highly expensive
The high cost of building nuclear facility and possibility of accidents
Nuclear power is very expensive and the time it takes to build is long,
needs program for short term
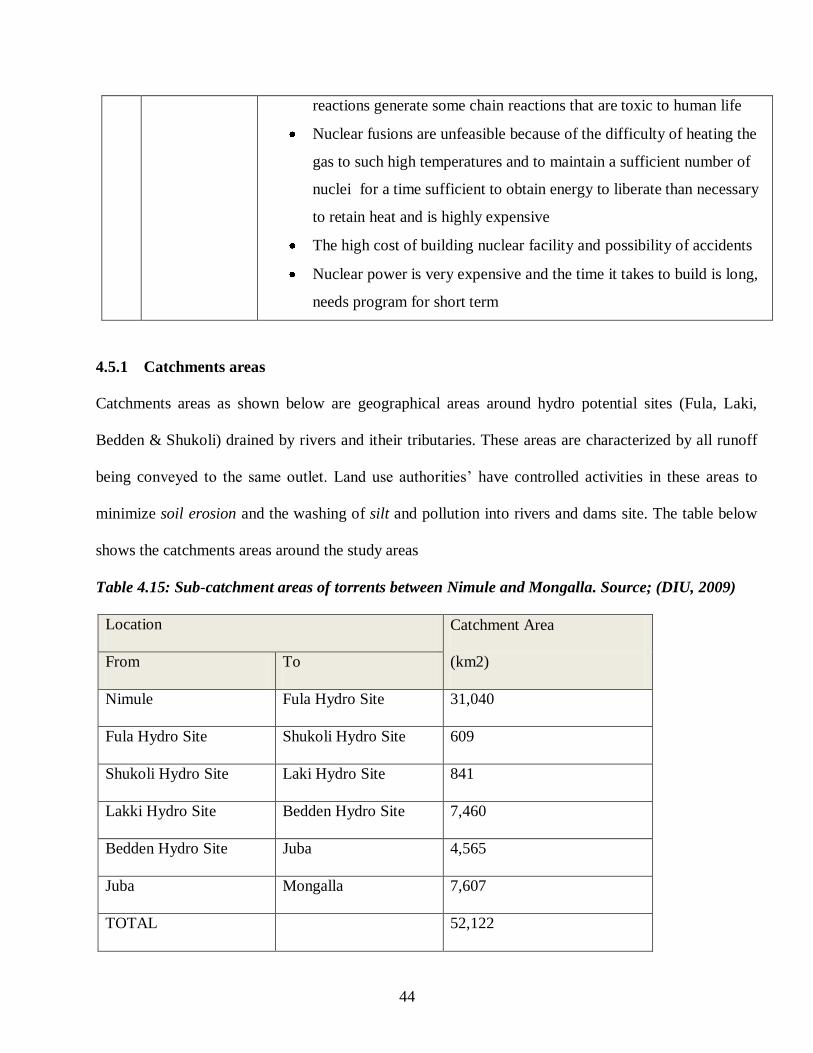
4.5.1 Catchments areas
Catchments areas as shown below are geographical areas around hydro potential sites (Fula, Laki,
Bedden & Shukoli) drained by rivers and itheir tributaries. These areas are characterized by all runoff
being conveyed to the same outlet. Land use authorities’ have controlled activities in these areas to
minimize soil erosion and the washing of silt and pollution into rivers and dams site. The table below
shows the catchments areas around the study areas
Table 4.15: Sub-catchment areas of torrents between Nimule and Mongalla. Source; (DIU, 2009)
Location Catchment Area
(km2) From To
Nimule Fula Hydro Site 31,040
Fula Hydro Site Shukoli Hydro Site 609
Shukoli Hydro Site Laki Hydro Site 841
Lakki Hydro Site Bedden Hydro Site 7,460
Bedden Hydro Site Juba 4,565
Juba Mongalla 7,607
TOTAL 52,122
45
5 CONCLUSION AND RECOMMENDATIONS
5.1 Conclusion
The following conclusion can be drawn from this research work;-
1. The method used to carry out the research work was through side survey and random
sampling of energy sources in the three payams of Juba City. It was found out that the
main energy source that is currently in use in South Sudan in slightly large scale is
Thermal which possesses great limitations. We can see from figure 4.4, Thermal energy
gives the highest (36%) which is also negligible compare to the required demand of
44MW in Juba. The other main sources of energy such as Hydro power (0.0%),
Geothermal (0.0%), winds (0.0%) among others are yet to be exploited. Solar is being
used widely by individual who can afford it and it accounts for 27% of the total sources
of energy that were assessed. There is no reliable power supply in Juba except the little
thermal power that is not consistent.
2. Potential from Hydro was analyzed and the results found indicate a high potential to be
exploited in those four sites. Fula Hydro potential site gives a maximum of 1387.6MW,
Laki with 922.6MW, Shukoli 1059MW and Bedden 1280MW. If this potential is
exploited, South Sudan could be able to export a bulk power to the neighboring
countries. The calculation was done using the mean and maximum discharge and
average water head. By using equation (2). The results cumulate to total technical hydro
potential at different sites and sum up to get 4649.6 as the total maximum potentials that
46
can be exploited from all the four sites. Other small hydro potential sites in South Sudan
were not included in this research work due to the condition of roads and insecurity. If
the potential from all these other sides is exploited, there could be no doubt that South
Sudan will be taken to be in possession of a huge potential of hydro. Solar energy on the
other hand is being exploited but in a small scale mostly by individual. There is no plans
for the government to establish solar in a large scale any soon due to hefty initial cost
and also it is uneconomical in term of space, this is the same case to wind energy
although it has a high potential to be exploited. Geothermal and nuclear require high
technology and it could be taken to be too early for South Sudan to venture into.
3. On Comparison of Hydro power and other sources of energy, Hydro is merited more
than the rest of energy sources. As stated in table 4.14, Hydro is clean and neat, can be
easily synchronized compare to wind, Nuclear and Geothermal, standby losses are
minimal, It is easy to run compare to nuclear that is dangerous to human life and
aquatic, Hydro has longer life span compare to solar energy, It is more reliable in terms
of operation since it uses water to energize the turbine compare to thermal which uses
fuel that is expensive. These results will be useful for energy resources planning.
5.2 Recommendations
The following recommendations are made in reference to this study;
1. Data for six months would be more appropriate for the assessment of energy sources in Juba for
the analysis of energy mix
2. Over five (500) sampling size from the city of juba would be appropriate instead of 450
households to analyze the sources in a wide range.

47
3. It shall be vital to use rainfall-runoff-modeling assuming that there shall be accurate and
efficient rainfall data.
4. The Country should have hydrological database centre where gridded results could be
transported to after it’s captured with GIS.
5. Utilization of Hydrological model like WaSim used in Iceland, HBV used in Norway and
Hydra HP used in India for hydro simulation could improve the quality of hydrological data.
6. Further researches are required in areas of simulation software for hydrological modeling.
7. Thermal energy is expensive and could remain as a short term solution to power need in South
Sudan.
8. There is a need to exploited the huge potential of Hydro (4649.6MW) in South Sudan to match
the fast growing demand
9. The only way for South Sudan to response to energy crises is by establishing hydro power
supply for long term energy needs.
10. There is a need for South Sudan to import power from Ethiopia, DR Congo and Uganda

48
REFERENCES
[1] NEC (2009). Classification of hydroelectric power plant. Retrieved from
http://www.brighthub.com/environment/renewable-energy/articles/7827.aspx
[2] Grisgsby L.L (2007). Electric power Generation, Transmission and Distribution, publisher, Crc
press
[3] Gupta J.B (2010). Transmission and Distribution of Electrical power, published by S.K.Kataria &
Sons
[4] South Sudan Water Draft Bill (2012). South Sudan Development Plan, SSDP 2011-2013, Published
by South Sudan National Development Committee, (SSNDC), funded by Joint Donor Team (JDT)
[5] Gupta B.R (2008). Generation of Electrical Energy, published by S.Chand and Company Ltd
[6] Gupta J.B (2010). Generation and Economic Considerations, published by S.K.Kataria & Sons
[7] Muhamoud El Zain (2008). Peace & Conflict Review
[8] Nile Basin Capacity Building (2008).Retrieved from
http://www.nbcbn.com/Project_Documents/Progress_Reports/RS-G1.pdf
[9] Pareto.VE. (2008). South Sudan urban development strategy. Retrieved from http://mpra.ub.uni-
muenchen.de/13988/1/VEP-Southern_Sudan_Urban_Strategy_SSRN-id1285243.pdf
[10] Akech. J.A (2006). Help for small firms in South Sudan: Borrowing the European Model.
Retrieved from http://johnakecsouthsudan.blogspot.com/
[11] Canadian Economic Development Assistance for South Sudan (2010). Retrieved from
http://www.cedass.org/pdfs/5880-9_Jebellado_Apr2010-LR-FINAL.pdf
[12] South Africa info (2009). Gateway to the Nation. Retrieved from
http://www.southafrica.info/business/economy/policies/tenyeareconomy.htm
[13] Okiech, P.A. (2009). Current political situation in the Sudan. Retrieved from
http://www.splmtoday.com/docs/SGsSpeech_SPLM%20Dialogue.pdf

49
[14] BureY.(2008). Economic development of South Sudan. Retrieved from
http://www.amazon.com/Economic-Development-Southern-Benaiah-Yongo-Bure/dp/076183589X
[15] Chastain E., et al. (2003). A study of hydroelectric power from a global perspective to a local
application. Retrieved from
http://www.ems.psu.edu/~elsworth/courses/cause2003/finalprojects/vikingpaper.pdf
[16] Omer M.A. (2009). Hydropower potential and priority for dams development in Sudan. Retrieved
from
http://www.scitopics.com/Hydropower_potential_and_priority_for_dams_development_in_Sudan.
html [17] Hydro power development (n.d). retrieved from
http://smallhydro.com/index.cfm?Fuseaction=countries.country&Country_ID=49&ok=TokenPass
[18] Sunith Fernando (2006). Assessment of hydro potential in Sri Lanka. Retrieved from
http://www.gnesd.org/Downloadables/Energy_Access_III/Final%20Regional%20Report_AIT.doc
[19] Gigs & George, (2000). Assessment of hydro potential in Tasmania, Australia. Retrieved from
http://innovexpo.itee.uq.edu.au/2000/348574975/project.pdf
[20] [21] Community micro hydro project (energy)-Kenya (n.d). Retrieved from
http://www.unep.org/GC/GCSS-IX/Documents/Kenya-Theme-1B.pdf
[22] Sodha M.S et al (1984). Review of renewable energy resources
[23] Mannvit. (2010). National Energy Authority and Iceland Geosurvey (n.d.). Retrieved November
9, 2011, from Gagnavefsjá: www.gagnavefsja.is
[24] John T. et al (1986). Renewable energy resources
[25] Tazan (2012). Solar resources and technology, Solar Energy center, published in 2013
[26] Maidment, D. R. (2002). Arc Hydro - GIS for Water Resources. Redlands, California, ESRI Press.
[27] Sayigh A.AM (1991). Renewable energy, technology and the environment
[28] Sandholt, I., & Stisen, S. (2008). A remote sensing driven distributed hydrological model of the
Senegal River basin. Journal of Hydrology,
[29] Muhamud Z & Zeid (2004). Sudan Energy Mix analysis.
[30] Ritchie, J., & Schmugge, T. (2002). Remote sensing in hydrology.
[31] Joel G. (2001). Analysis on South Sudan Energy need.
50
[32] Jasper, K. (2007). Model Description WaSiM-ETH. Retrieved from
http://www.wasim.ch/downloads/doku/wasim/wasim_2007_en.pdf
[33] Thomas B. et al (1993). Renewable energy sources for fuels and electricity
[34] Viessman, W. J., & Lewis, G. L. (2003). Introduction to hydrology. Pearson Education,
[35] Gagnon Y. (2011). Methodology for the large-scale assessment of small hydroelectric potential:
Application to the Province of New Brunswick (Canada). Renewable Energy, 2940-2950.
[36] Bansal N.K et al (1985). Renewable energy sources and conversion technology
[37] Gupta J.B (2010). Generation and Economic Considerations, published by S.K.Kataria & Sons
[38] Kristofferson L.A et al (1991). Renewable energy technologies and their applications in
developing countries
[39] Jesse D. (1979). Energy Science and Engineering management and international series
[40] Kishore V.V (1993). Renewable energy utilization, Scope, economic and perspective
[41] Cherry S. J, & Hall D.G (2004). Water energy Resources of the United States with Emphasis on
Low Head/Low Power Resources. Idaho National Engineering and Environmental Laboratory,
Prepared for the US Department of Energy
[42] National Energy Authority, Iceland (2012). Development of a methodology for estimation of
Technical Hydropower potential in Iceland using high resolution Hydrological Modeling, retrieved
from; http://www.vedur.is/annad/villa404.html
[43] Bureau of India Standards (1989). Code of Practice for Design loads and solid gravity Dams
[44] Einar Ove Andersen (2006) Norwegian Hydropower and focus on small hydro power. Retrieved
from http://webby.nve.no/publikasjoner/veileder/2012/veileder2012_02.pdf%E2%80%8E
[45] Paulo C. F. Erbisti (2004). Design of hydraulic gates
[46] Bradley J. N (1952). Discharge coefficients for irregular overall spillways
[47] Richard O.S & Willi H. (1953). Construction hydraulics
[48] Weiss H. W. & Faeh A. 0. (1990). Methods of evaluating hydro potentials
[49] Warnick C. C; Haward A. M, Jr., P.E, James L. C and Lee H. S (1978). Hydropower Engineering
and control technology
51
[50] Watt et al. (1979). Utilizable Hydro power potential
[51] Hildebrand S.K, (1989), Evaluation of the line potential
[52] Terry W. S (2001). Opened Channel Hydraulics, international edition
[53] John T. et al (1986). Renewable energy resources,
[54] Chen J. (2005). Distributed hydrological model for mapping evapotranspiration using remote
sensing inputs. Journal of Hydrology, 305(1-4), 15-39.
[55] Castellarin A. (2004). Regional flow-duration curves, reliability for ungauged basins. Advances in
Water Resources, 953-965.
[56] Castellarin A. (2004). Regional flow-duration curves, reliability for ungauged basins. Advances in
Water Resources, 953-965.
[57] Hydroelectricity (n.d). Retrieved from http://www.hydro.com.au/handson/students/hydrelec.htm
[58] Arun K, G.Rees & Raguvanshi T. K (n.d) Small hydropower assessment – A solution through
hydra – HP software. Retrieved from
http://www.gisdevelopment.net/application/utility/power/utilityp0009.htm

52
Appendix 1

53
Appendix 2
Map of Hydro Potential Sites along the Nile
[Map Source: Central Equatoria State, Southern Sudan State Map Series, Federal Department of Foreign Affairs,
Switzerland.]
Bedden
Lakki
Shukoli
Fula

54
Appendix 3
Bhar-el jebel/ River Nile
Photo taken on 12 July 2012
Appendix 4
Fula Rapids – a huge energy potential in the White Nile
Photo taken on the 12 July 2012
55
Appendix 5
Bedden Hydro Potential Sites