master evk4-ct-2002-00093 1 the master ewo dosimeters – how they work prague 1 st june 2006 terje...
TRANSCRIPT

MA
ST
ER
MA
ST
ER
EV
K4-
CT
-200
2-00
093
1
The MASTER EWO dosimeters– how they work
Prague 1st June 2006
Terje Grøntoft, NILU

MA
ST
ER
MA
ST
ER
EV
K4-
CT
-200
2-00
093
2
The EU project MASTER :Research partners:
1) Norwegian Institute for Air Research (NILU) Norway.2). Centre for Sustainable Heritage (CSH-UCL) University College of London. UK.3) Albert Ludwigs Universitet - Freiburg
Materialforshungs - sentrum (ALU-FMF) Germany4) Technical University of Crete (TUC) Dept. of Environmental Engineering, Polytechneioupolis. Greece.
Museum partners - Test sites:5) National Museum in Krakow. Poland.6) Trøndelag Folk Museum, Trondheim, Norway7) Historic Royal Palaces, London. UK8) The National Trust, Bury St. Edmunds. UK9) Württembergisches Landesmuseum, Landesstelle für Museumsbetreuung Baden Württemberg. Germany10) Institute for Masonry and Construction Research, University of Malta.
MA
ST
ER
MA
ST
ER
EV
K4-
CT
-200
2-00
093
3
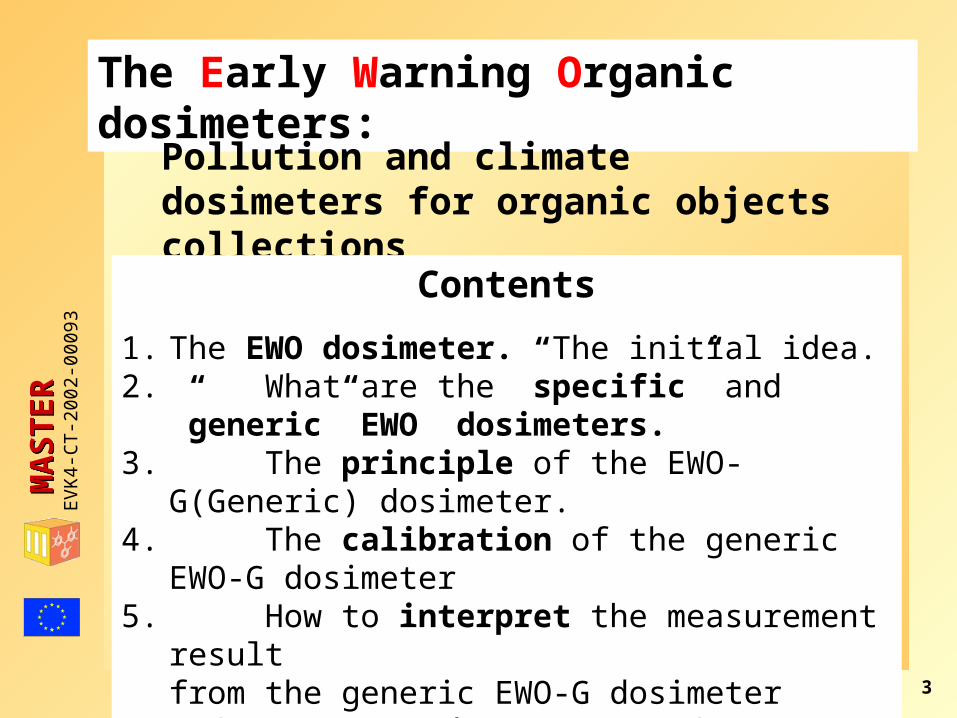
The Early Warning Organic dosimeters:
Pollution and climate dosimeters for organic objects collections
Contents
1. The EWO dosimeter. The initial idea.2. What are the ”specific” and ”generic” EWO
dosimeters.3. The principle of the EWO-G(Generic) dosimeter. 4. The calibration of the generic EWO-G dosimeter5. How to interpret the measurement result
from the generic EWO-G dosimeter 6. The user requirements to the EWO dosimeter.

MA
ST
ER
MA
ST
ER
EV
K4-
CT
-200
2-00
093
4
1. An EWO dosimeter - The initial idea.
- To develop an early warning system for organic objects.
- Should be an effect dosimeter
- Should be based on end-user identified needs
- To assess degradation of organic objects indoors.

MA
ST
ER
MA
ST
ER
EV
K4-
CT
-200
2-00
093
5
A transparent organic polymer (EWO-G) with a dye indicator (EWO-S).
2. Mounting
Memorycircuit
EWO-G Sensor film
Grip
1. Production
Spin coating
Glass substrate
EWO polymer film(ALU-FMF)
1 cm
4. Analysis
Light absorption
3. Exposure
Environment- 3 months
2. The EWO dosimeters

MA
ST
ER
MA
ST
ER
EV
K4-
CT
-200
2-00
093
6
The spesific EWO-S dosimeter
Sample holder:
Portable measurement instrument
ALU - FMF
MA
ST
ER
MA
ST
ER
EV
K4-
CT
-200
2-00
093
7
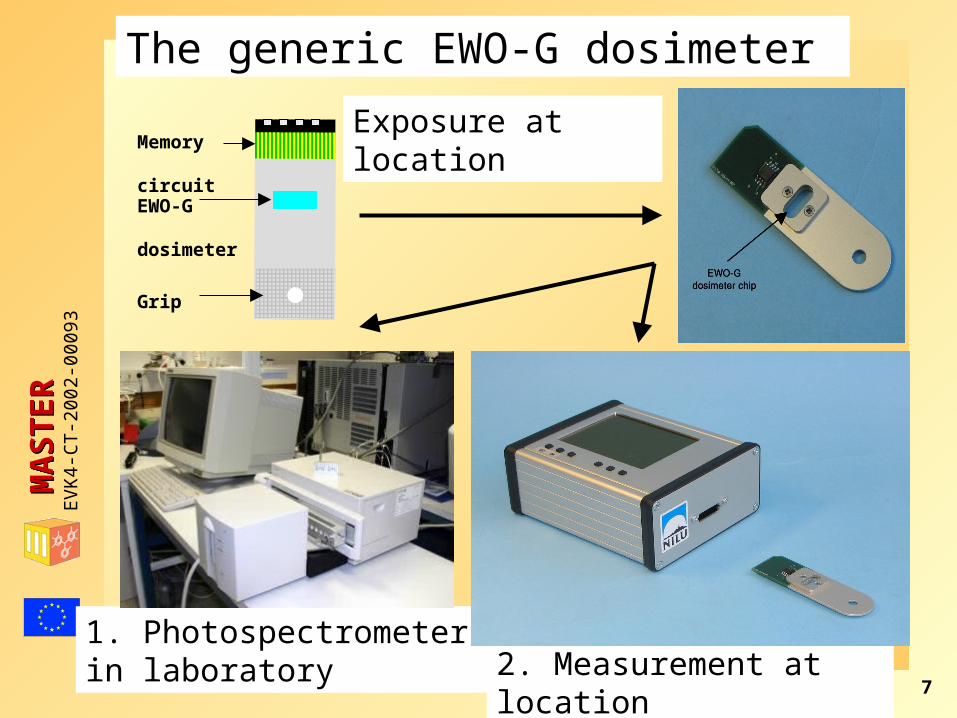
The generic EWO-G dosimeter
Exposure at location
1. Photospectrometer in laboratory 2. Measurement at location
Memory
circuitEWO-G
dosimeter
Grip
MA
ST
ER
MA
ST
ER
EV
K4-
CT
-200
2-00
093
8
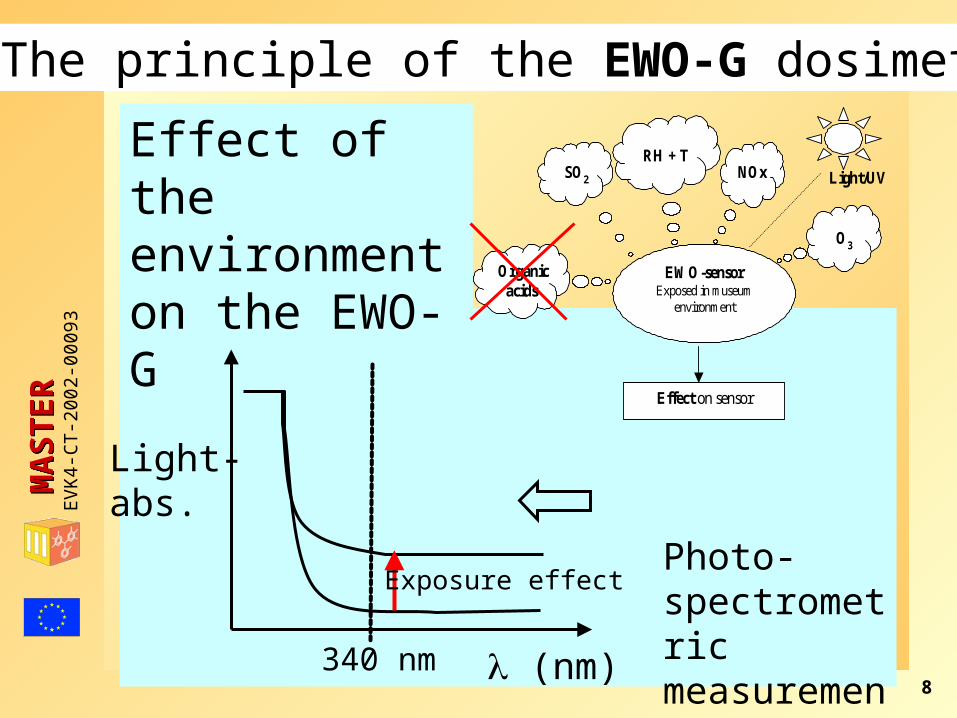
EWO-sensorExposed in museum
environment
Effect on sensor
Organicacids
SO2
RH + TNOx
O3
Light/UV
Effect of the environmenton the EWO-G
(nm)
Light-abs.
340 nm
Photo-spectrometricmeasurement
Exposure effect
3. The principle of the EWO-G dosimeter
MA
ST
ER
MA
ST
ER
EV
K4-
CT
-200
2-00
093
9
10.00 15.00 20.00 25.00 30.00 35.00 40.00
Regression Adjusted (Press) Predicted Value
0.00
10.00
20.00
30.00
40.00
PP
O 3
U B
(C
)
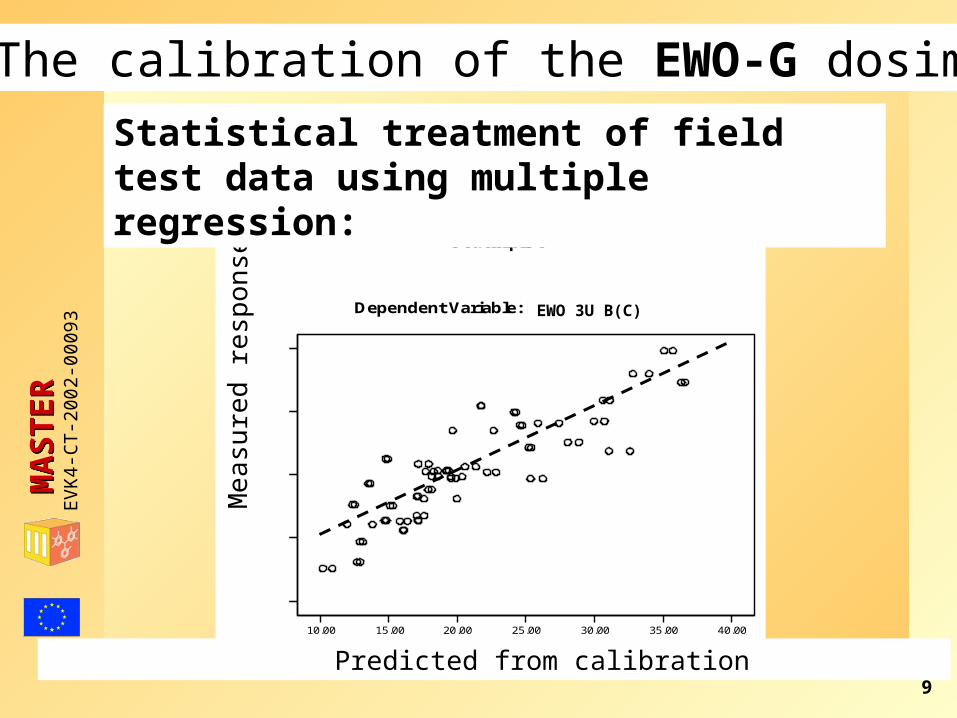
Dependent Variable: PPO 3U B (C)
Scatterplot
EWO 3U B(C)
EW
O 3
U B
(C)
Predicted from calibration
M
ea
s ure
d r
es p
on
se
4. The calibration of the EWO-G dosimeter
Statistical treatment of field test data using multiple regression:

MA
ST
ER
MA
ST
ER
EV
K4-
CT
-200
2-00
093
10
Calibration equation:
Centre for Sustainable Heritage. University College of London
Trigger values for environmental parameters and for the EWO-G.
(ppb) (ppb) (oC) (mWm-2)
EWO-G effect = 0.75 NO2 + 1.34 O3 + 0.51 T + 0.35 UV
Trigger values T (oC)
Calibration point - location NO2
(ppb) O3
(ppb) UV
(mW/m2)
RH = 45 %
RH = 55 %
RH = 65 %
1 - Archive store 1 1.15 1 20.8 19.3 18.2 2 – Purpose built museum 2.5 3 3.75 22.9 21.4 20.2 3 – House museum 5 6.5 15 24.5 23 21.8 4 - Open structure 10 12.5 37.5 26.8 25.3 24.1 5 - External store with no
control 15 25 37.5 29.0 27.6 26.2
Increasing deterioration
1 1.15 1 19.3

MA
ST
ER
MA
ST
ER
EV
K4-
CT
-200
2-00
093
11
EWO-G Trigger response
Trigger response (ads-units). Sign = 97.5 % (One sided) Calibration point - location RH = 45 % RH = 55 % RH = 65 %
1 - Archive store 0.0114 0.0107 0.0103 2 - Purpose built museum
0.0165 0.0159 0.0153
3 - House museum 0.0258 0.0251 0.0246 4 - Open structure 0.0418 0.0411 0.0405 5 - External store
with no control 0.0612 0.0605 0.0598
Increasing deterioration
0.0107

MA
ST
ER
MA
ST
ER
EV
K4-
CT
-200
2-00
093
12
Example: Musems from MASTER field test
5. Interpretation of the EWO-G dosimeter
Station EWO response
Response level
(MASTER field test) Indoor. Yearly mean. (4*3 months)
1. Blickling Hall 0.0089 1 2. National Museum of Krakow. The Jan Matejko House. 0.0143 2 3. The Karol Szymanowski Museum, “Atma”, Zakopane 0.0177 3 4. Schwarzwälder Trachtenmuseum, Haslach 0.0186 3 5. The Museum of Decorative Arts & Design, Oslo. 0.0196 3 6. Trøndelag Folk Museum, Trondheim. 0.0212 3 7. Wignacourt Collegiate Museum, Malta. 0.0214 3 8. The Historical Museum of Crete. Iraklion 0.0217 3 9. Haus der Geschichte Baden-Württemberg, Stuttgart 0.0284 4
10. Tower of London, Bloody Tower. 0.0312 4

MA
ST
ER
MA
ST
ER
EV
K4-
CT
-200
2-00
093
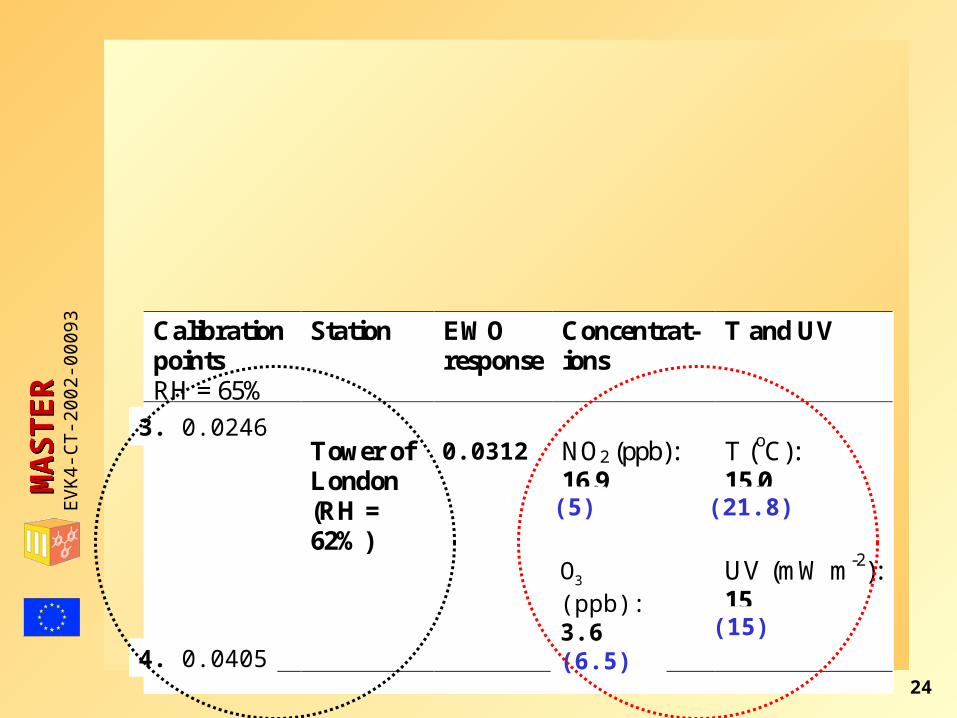
13(#) = calibration values – level 3
The measurement result
Calibration points RH = 65%
Station EWO response
Concentrat-ions
T and UV
2. 0.0157 Tower of
London (RH = 62%)
0.0223 NO2 (ppb): 16.9 (5) O3 (ppb): 0.4 (6.5)
T (oC): 15.0 (20.2) UV (mW m-2): 15 (15)
3. 0.0246
0.0312
(5)
O3 (ppb):3.6(6.5) (15)
(21.8)
3. 0.0246
4. 0.0405
Calibration points RH = 65%
Station EWO response
Concentrat-ions
T and UV
2. 0.0157 Tower of
London (RH = 62%)
0.0223 NO2 (ppb): 16.9 (5) O3 (ppb): 0.4 (6.5)
T (oC): 15.0 (20.2) UV (mW m-2): 15 (15)
3. 0.0246
0.0312
(5)
O3 (ppb):3.6(6.5) (15)
(21.8)
3. 0.0246
4. 0.0405
Calibration points RH = 65%
Station EWO response
Concentrat-ions
T and UV
2. 0.0157 Tower of
London (RH = 62%)
0.0223 NO2 (ppb): 16.9 (5) O3 (ppb): 0.4 (6.5)
T (oC): 15.0 (20.2) UV (mW m-2): 15 (15)
3. 0.0246
0.0312
(5)
O3 (ppb):3.6(6.5) (15)
(21.8)
3. 0.0246
4. 0.0405
Calibration points RH = 65%
Station EWO response
Concentrat-ions
T and UV
2. 0.0157 Tower of
London (RH = 62%)
0.0223 NO2 (ppb): 16.9 (5) O3 (ppb): 0.4 (6.5)
T (oC): 15.0 (20.2) UV (mW m-2): 15 (15)
3. 0.0246
0.0312
(5)
O3 (ppb):3.6(6.5) (15)
(21.8)
3. 0.0246
4. 0.0405
Calibration points RH = 65%
Station EWO response
Concentrat-ions
T and UV
2. 0.0157 Tower of
London (RH = 62%)
0.0223 NO2 (ppb): 16.9 (5) O3 (ppb): 0.4 (6.5)
T (oC): 15.0 (20.2) UV (mW m-2): 15 (15)
3. 0.0246
0.0312
(5)
O3 (ppb):3.6(6.5) (15)
(21.8)
3. 0.0246
4. 0.0405
Calibration points RH = 65%
Station EWO response
Concentrat-ions
T and UV
2. 0.0157 Tower of
London (RH = 62%)
0.0223 NO2 (ppb): 16.9 (5) O3 (ppb): 0.4 (6.5)
T (oC): 15.0 (20.2) UV (mW m-2): 15 (15)
3. 0.0246
0.0312
(5)
O3 (ppb):3.6(6.5) (15)
(21.8)
3. 0.0246
4. 0.0405
Calibration points RH = 65%
Station EWO response
Concentrat-ions
T and UV
2. 0.0157 Tower of
London (RH = 62%)
0.0223 NO2 (ppb): 16.9 (5) O3 (ppb): 0.4 (6.5)
T (oC): 15.0 (20.2) UV (mW m-2): 15 (15)
3. 0.0246
0.0312
(5)
O3 (ppb):3.6(6.5) (15)
(21.8)
3. 0.0246
4. 0.0405
Calibration points RH = 65%
Station EWO response
Concentrat-ions
T and UV
2. 0.0157 Tower of
London (RH = 62%)
0.0223 NO2 (ppb): 16.9 (5) O3 (ppb): 0.4 (6.5)
T (oC): 15.0 (20.2) UV (mW m-2): 15 (15)
3. 0.0246
0.0312
(5)
O3 (ppb):3.6(6.5) (15)
(21.8)
3. 0.0246
4. 0.0405

MA
ST
ER
MA
ST
ER
EV
K4-
CT
-200
2-00
093
14
Calibrated levels of EWO affected after exposure (lit LEDs on unit) Kind of building 1 2 3 4 5 Archive store
Expected environment (acceptable)
Environment could be better
Environment is poor
Something is wrong with
control
Serious problem with building or
control Purpose built museum gallery
Environment is very good
Expected environment (acceptable)
Environment could be better
Environment is poor
Something is wrong with
control
Historic building
Excellent environment
Environment is very good
Expected environment (acceptable)
Environment could be better
Environment is poor
Open display in open structure
Dosimeter is not responding
Excellent environment
Environment is very good
Expected environment (acceptable)
Environment could be better
Outside store with no control
Dosimeter is not responding
Dosimeter isn’t responding
Excellent environment
Environment is very good
Expected environment (acceptable)
Interpretation by the Acceptability – location table
Centre for Sustainable Heritage. University College of London
Showcases: One calibration point lower than location
MA
ST
ER
MA
ST
ER
EV
K4-
CT
-200
2-00
093
15
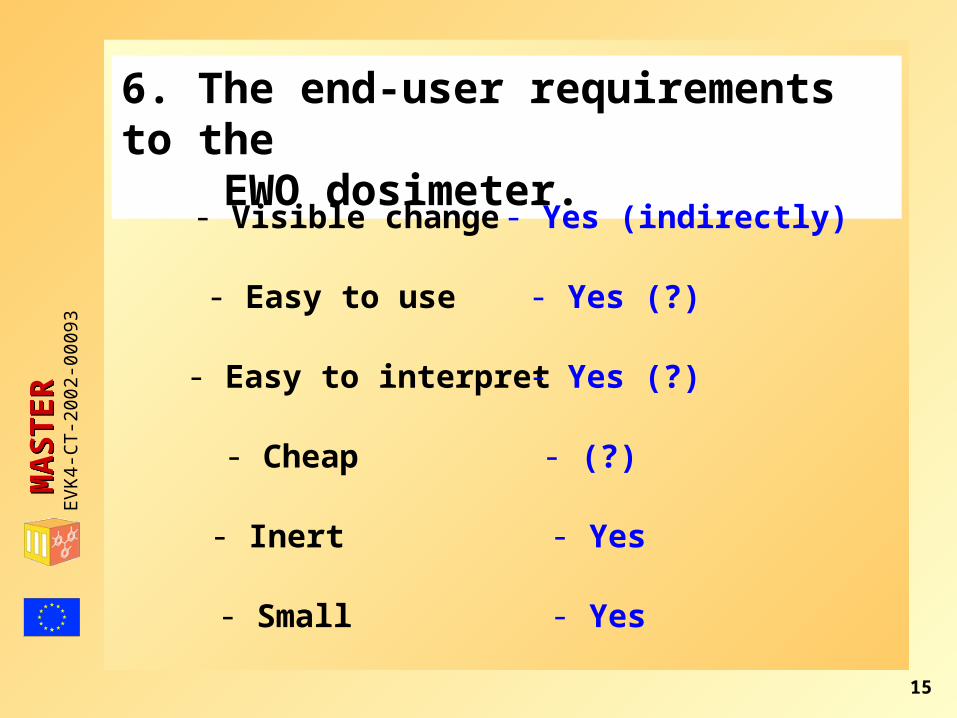
6. The end-user requirements to the EWO dosimeter.
- Easy to use
- Easy to interpret
- Visible change
- Cheap
- Inert
- Small
- Yes (?)
- Yes (?)
- Yes (indirectly)
- (?)
- Yes
- Yes

MA
ST
ER
MA
ST
ER
EV
K4-
CT
-200
2-00
093
16
- Short-term and long term options
- Range of sensor sensitivities
- Able to relate to other kinds of monitoring
- A diagnostic element to the sensor.
- All environmental risks to be monitored
- Yes
- Yes (partly)
- Yes (High to medium)
-Generic: Depends on data available-Specific: Yes
- Generic dosimeter: Yes - dependent on knowledge about environment Specific dosimeter: Yes
- No ( visible light(LUX) and organic acids)
- Durable

MA
ST
ER
MA
ST
ER
EV
K4-
CT
-200
2-00
093
17
Preventive Conservation
Strategy
based on the:
EWO-G
dosimeter measurement

MA
ST
ER
MA
ST
ER
EV
K4-
CT
-200
2-00
093
18
MASTER-logo

MA
ST
ER
MA
ST
ER
EV
K4-
CT
-200
2-00
093
19
EWO-G effect =
0.75(0.17)NO2 + 1.34(0.30)O3 + 0.51(0.088)T + 0.35(0.21)UV
Calibration intervals for environmental parameters
Symbol Calibration interval NO2 1 – 20 ppb O3 0.5 – 30 ppb T 10 - 30 oC UV 0 - 15 mW m-3 Additional variables SO2 0 – 3.5 ppb RH 10 –80 %
-2
(#) = Uncertainty, 95 % significance level.
MA
ST
ER
MA
ST
ER
EV
K4-
CT
-200
2-00
093
20
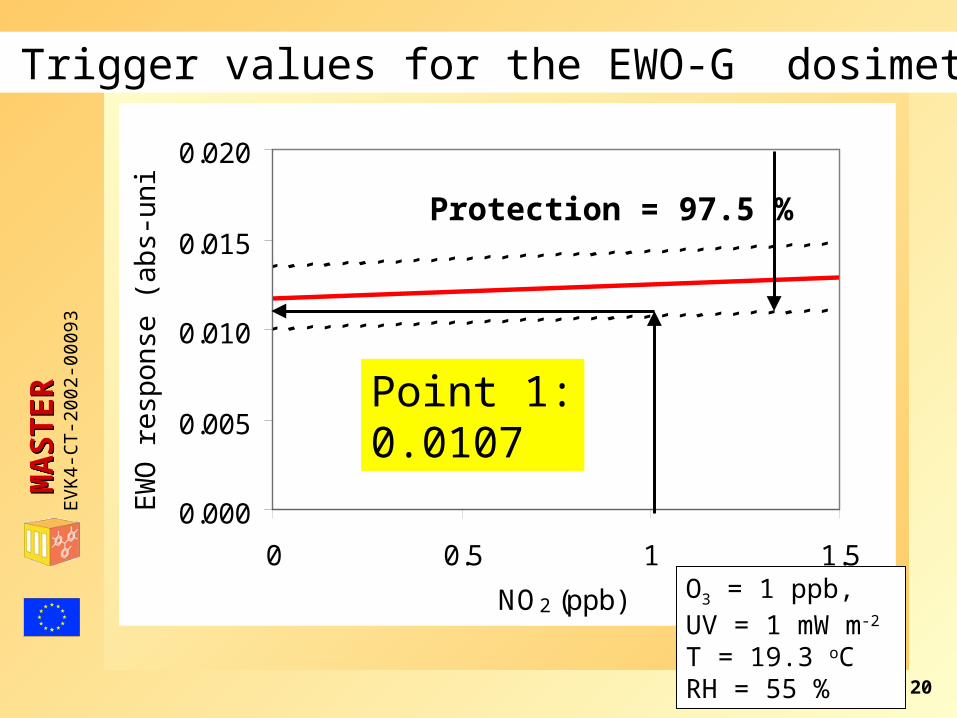
Trigger values for the EWO-G dosimeter
0.000
0.005
0.010
0.015
0.020
0 0.5 1 1.5
NO2 (ppb)
EW
O r
esp
on
se (
ab
s-u
nits
)
Protection = 97.5 %
Point 1:0.0107
O3 = 1 ppb, UV = 1 mW m-2 T = 19.3 oC RH = 55 %

MA
ST
ER
MA
ST
ER
EV
K4-
CT
-200
2-00
093
21
EWO-G Trigger response
Showcases: One calibration point lower than location
Trigger response (ads-units). Sign = 97.5 % (One sided) Calibration point - location RH = 45 % RH = 55 % RH = 65 %
1 - Archive store 0.0114 0.0107 0.0103 2 – Purpose built
museum gallery 0.0165 0.0159 0.0153
3 - Historic building
0.0258 0.0251 0.0246
4 - Open display in open structure
0.0418 0.0411 0.0405
5 - Outside store with no control
0.0612 0.0605 0.0598

MA
ST
ER
MA
ST
ER
EV
K4-
CT
-200
2-00
093
22
RH - monthly avarage (%)RH-A RH-B RH-C
1-Oslo 69.1 34.1 37.52-Trondheim 76.1 47.2 50.63-Blickling Hall 76.4 62.5 62.54-Tower of London74.0 62.3 62.35-Stuttgart 71.6 48.5 47.56-Haslach 72.8 52.4 53.27-Krakow 71.9 38.8 37.98-Zakopane 72.1 32.3 40.09-Wignacourt 76.9 66.1 67.010-Crete 58.8 59.7 59.8

MA
ST
ER
MA
ST
ER
EV
K4-
CT
-200
2-00
093
23
EWO-G Trigger response
Showcases: One calibration point lower than location
Trigger response (ads-units). Sign = 97.5 % (One sided) Calibration point - location RH = 45 % RH = 55 % RH = 65 %
1 - Archive store 0.0114 0.0107 0.0103 2 - Purpose built museum
0.0165 0.0159 0.0153
3 - House museum 0.0258 0.0251 0.0246 4 - Open structure 0.0418 0.0411 0.0405 5 - External store
with no control 0.0612 0.0605 0.0598
Increasing deterioration
0.0107
MA
ST
ER
MA
ST
ER
EV
K4-
CT
-200
2-00
093
24
Calibration points RH = 65%
Station EWO response
Concentrat-ions
T and UV
2. 0.0157 Tower of
London (RH = 62%)
0.0223 NO2 (ppb): 16.9 (5) O3 (ppb): 0.4 (6.5)
T (oC): 15.0 (20.2) UV (mW m-2): 15 (15)
3. 0.0246
0.0312
(5)
O3 (ppb):3.6(6.5) (15)
(21.8)
3. 0.0246
4. 0.0405

MA
ST
ER
MA
ST
ER
EV
K4-
CT
-200
2-00
093
25
Calibration points RH = 65%
Station EWO response
Concentrat-ions
T and UV
2. 0.0157 Tower of
London (RH = 62%)
0.0223 NO2 (ppb): 16.9 (5) O3 (ppb): 0.4 (6.5)
T (oC): 15.0 (20.2) UV (mW m-2): 15 (15)
3. 0.0246
0.0312
(5)
O3 (ppb):3.6(6.5) (15)
(21.8)
3. 0.0246
4. 0.0405